Article

Decoupling Water Consumption and Environmental Impact on Textile Industry by Using Water Footprint Method: A Case Study in China

1
School of Economics and Management, Zhejiang Sci-Tech University, Hangzhou 310018, China
2
Ecological Civilization Research Center of Zhejiang Province, Zhejiang Sci-Tech University, Hangzhou 310018, China
3
Fashion Institute, Zhejiang Sic-Tech University, Hangzhou 310018, China
4
Engineering Research Center of Clothing of Zhejiang Province, Zhejiang Sci-Tech University, Hangzhou 310018, China
5
School of Business, Ningbo University, Ningbo 315211, China
*
Authors to whom correspondence should be addressed.
Water 2017, 9(2), 124; https://doi.org/10.3390/w9020124
Submission received: 23 November 2016 / Revised: 9 February 2017 / Accepted: 9 February 2017 / Published: 15 February 2017
(This article belongs to the Special Issue Water Economics and Policy)

Abstract

:
The rapid development of China’s textile industry has led to consumption and pollution of large volumes of water. Therefore, the textile industry has been the focus of water conservation and waste reduction in China’s 13th Five-Year Plan (2016–2020). The premise of sustainable development is to achieve decoupling of economic growth from water consumption and wastewater discharge. In this work, changes in the blue water footprint, grey water footprint, and the total water footprint of the textile industry from 2001 to 2014 were calculated. The relationship between water footprint and economic growth was then examined using the Tapio decoupling model. Furthermore, factors influencing water footprint were determined through logarithmic mean Divisia index (LMDI) method. Results show that the water footprint of China’s textile industry has strongly decoupled for five years (2003, 2006, 2008, 2011, and 2013) and weakly decoupled for four years (2005, 2007, 2009, and 2010). A decoupling trend occurred during 2001–2014, but a steady stage of decoupling had not been achieved yet. Based on the decomposition analysis, the total water footprint mainly increased along with the production scale. On the contrary, technical level is the most important factor in inhibiting the water footprint. In addition, the effect of industrial structure adjustment is relatively weak.

1. Introduction

The concept of decoupling, which originated from physics, indicates the reduction or elimination of the mutual relationship between two or more physical quantities. Decoupling analysis is widely applied and has received great attention in studies of economic growth in relation to environmental pressure [1]. Decoupling refers to breaking the link between economic wealth growth and environmental hazards. Achieving decoupling between economy and environment is the key step for implementing green economic development, which is the basic goal of human development as proposed by the Organization for Economic Cooperation and Development [2]. Decoupling can be achieved by forcing people to rethink the nexus among resource utilization, environmental quality, and economic growth [3].
Decoupling has been increasingly used to measure the relationship between resource consumption (environmental damage) and economic development [4,5,6,7,8,9,10]. Previous studies focused on the decoupling relationship between industrial water consumption and economic growth [11,12,13] or between wastewater discharge and economic growth [14,15,16,17]. However, improvement of integrated water management in the industrial sector requires simultaneous reduction in water consumption and wastewater discharge. Over-stringent resource control policies and unduly lenient environmental constraints do not efficiently promote the sustainable and healthy development of the industry. Hence, the overall industrial growth in the “resources and environment” system should be considered. Water resource management cannot be comprehensively evaluated nor effectively promoted without introducing the environment as an important factor in resource-economic dual system research or the resource in the environmental-economic binary system research. Scholars have attempted to establish a comprehensive decoupling system by combining resources and environment with empirical or expert consultation methods. Li et al. [18] evaluated the decoupling status among resources, environmental pressure, and economic development in Chongqing metropolitan area in China. Ge et al. [19] applied the aforementioned method in the study of China’s Yangtze River delta region. The expert consultation method, which has strong subjectivity, and the empirical method, which causes deviation in calculation results, cannot appropriately reflect the real condition. By contrast, the water footprint (WF) method provides an objective way to scientifically integrate water resource and water environmental science as one factor; this technique can be used to accurately perform decoupling analysis.
Wang [20] defined and calculated the WFs of China’s textile industry. Zhang et al. [21] performed a case study in Heilongjiang Province of China by integrating the WF method into the decoupling relationship analysis of agricultural output with water consumption and environmental impact of crop production. Strong decoupling frequently occurred in the analysis of agricultural water consumption of crop production. Gilmont [22] calculated the food industry WFs of the Middle East and North African countries in 1961–2009 and analyzed the decoupling of the WF of the food industry from social development. Pan et al. [23] used WF to represent water resource utilization in Hubei Province of China and investigated the decoupling relationship between the footprint and economic growth. They found the decoupling between WF and GDP growth in a weakening trend. These studies show that the WF method is feasible in decoupling studies. However, this technique does not consider water resources and water environment as an integrated system. As such, the present study aims to integrate water resources and water environment into the WF method and analyze the decoupling relationship between WF and economic growth. The textile industry is selected as an example because it consumes a great amount of water and represents a major source of water pollution in China. We also determine factors influencing decoupling and propose corresponding countermeasures and suggestions.

2. Study Object

Textile is related to people’s daily lives. China’s textile industry has a long history, and Chinese silk in particular has had a major effect on world civilization since 2000 years ago. The textile industry is China’s traditional pillar industry and belongs to the first batch of the China’s industrial sector. The textile industry has a core position because the products are related to the livelihood of the people and the industry greatly contributes to China’s national economy. In 2014, the total output value of China’s textile industry reached 274.17 billion US dollars (constant price in 2014), with an average annual increase of 34.37% compared with that in 2001. The textile industry employs more than 10 million people, which reached 8.74% of China’s industrial employment in 2014 [24]. The textile industry utilizes raw materials derived from agriculture and is related to the livelihood of 100 million Chinese farmers [25]. China has become the largest textile exporter worldwide and possesses the largest production scale, thereby providing affordable and superior-quality textile products. In 2014, the total of amount of textiles imported from China reached 111.662 billion US dollars, accounting for 35.56% of the total global textile export market; that amount has increased by 24.15% since 2001 [26]. In terms of earning foreign exchange through exports, the accumulated trade volume of China’s textile and apparel industry in 2014 was 334.333 billion US dollars, with a cumulative surplus of 279.583 billion US dollars; hence, this industry plays an important role in ensuring China’s foreign exchange reserves and maintaining balance in international payments [27].
Economic growth of the textile industry is costly in terms of water resources and the environment. China’s textile industry consumes a total of 864.7 Mt water and ranked No. 7 in 41 chief industrial sectors, accounting for 6.3% of the total water consumption. In addition, the water replenishment rate and water productivity are 63.66% and 315.37 Mt/104 US dollars, respectively, which are lower than the average values (89.46% and 5.78 Mt/104 US dollars). As such, the textile industry should take adequate responsibility for water pollution in China. The wastewater emissions of this industry reached 1960 Mt in 2014, which ranks third in 41 industrial sectors and constitutes 10.5% of the China’s total industrial wastewater discharge. In the coastal areas of China where the textile industry is concentrated, water pollution has already caused harm to local public health [28]. Hence, water efficiency and sewage discharge reduction must be improved.
In 2016, the Chinese government aimed to reduce the water consumption of unit industries by 23% and the total discharge of major pollutants by 10% by 2020 [29]. However, whether the textile industry can successfully reduce its water consumption and discharge remains unclear. Moreover, strategies for developing the economy while reducing the pressure on water resources and the environment remain to be established. This study addresses these concerns through conducting a decoupling analysis of the WF and economy in the textile industry water.

3. Methodology and Data

3.1. Water Footprint

The WF is defined as a spatiotemporally accurate indicator which refers to the appropriation of freshwater in a specific accounting phase [30]. It indicates the total amount of water resources required by a region, a country, or a person for all products and services consumed during a given period of time [31]. WF can be divided into three categories: blue WF, green WF, and grey WF [32]. The blue WF consists of blue water evaporation, blue water incorporation, and lost return flow; the green WF refers to consumption of green water resources (rainwater insofar as it does not become run-off); the grey WF is defined as the volume of freshwater that is required to assimilate the load of pollutants given natural background concentrations and existing ambient water quality standards [33]. WF is a comprehensive indicator, on the one hand, it accounts for the total amount of water consumption that reflects the production process; on the other hand, it accommodates for the total amount of pollutants in the water, which reflects the environmental impact [34].
There are mainly two approaches in WF research [35]. One is the WF Network (WFN) approach, which is primarily put forward to improve water use and allocation management [36]. The other is the life cycle assessment (LCA) approach, which is mainly applied in assessing environmental impacts related to water [37]. The significant difference between them is that the WFN approach mainly focuses on water management while the LCA approach mainly focuses on the sustainability of products [30]. LCA-based WFs can be utilized to evaluate the aquatic environmental effects of products or businesses during the whole life cycle, including raw material acquisition, supply chain, manufacturing, carriage, usage, and waste treatment [38,39,40]. WFN emphasizes the effective and sustainable allocation and use of fresh water from a product, consumption, industry, and geographical perspective [41,42,43,44,45,46]. The WFN method is adopted in this paper to calculate the WF of China’s textile industry.
It is worth mentioning that the agricultural production stage, such as cotton cultivation, is not included in China’s textile industry sectors. Additionally, rainwater collection and use technologies are very limited at present in China’s textile production factories. Therefore, the green WF is effectively zero and not considered in this manuscript.
The calculation of WF can be further expressed as follows:
W F = W F b + W F g y
W F b = W B W E + W B W I + W L R f
W F g y = m a x [ L [ k ] C s [ k ] C n [ k ] ]
where W F is the water footprint (Mt/a); W F b is the blue water footprint (Mt/a); W B W E is blue water evaporation (Mt/a), W B W I is blue water incorporation (Mt/a), W L R f is lost return flow (Mt/a); W F g y is the grey water footprint (Mt/a); L [ k ] is the amount of pollutant k in the textile industry (Mt/a); C s [ k ] is the concentration limit of contaminant k (Mt/a), as specified in the pollutant discharge standard; and C n [ k ] is the concentration of pollutant k in natural water (Mt/a). The ‘max’ outside standard brackets means that W F g y are determined by the most critical pollutant that is associated with the largest pollutant-specific W F g y .

3.2. Decoupling Method

The decoupling elasticity method, proposed by Tapio [47], is commonly used to characterize the direction and degree of decoupling. In the decoupling study of resource consumption (environmental damage) and industrial economic growth, the decoupling elasticity coefficient is defined as the ratio of the change rate of the base and current resource consumption or environmental pressure to the rate of change in economic conditions over a certain period of time. The calculation method is as follows:
D = % Δ V O L % Δ G = ( V O L t V O L t 1 ) / V O L t 1 ( G t G t 1 ) / G t 1
In the Formula (4), D is the elastic coefficient; V O L t , V O L t 1 represent the environmental stress in year t and year t − 1, respectively; and the corresponding G t , G t 1 represent the gross industrial output value in year t and year t − 1, respectively. % Δ V O L (growth rate of resource consumption or environmental pressure) and % Δ G (growth rate of economy) are obtained by calculating the corresponding data at two time points. The decoupled state is defined by the range of elastic values, and the eight levels of decoupling and range of elastic values are shown in Table 1.
According to the magnitude of elasticity class, the decoupling state is categorized into negative decoupling, decoupling, and coupling, which are further classified as expansive negative decoupling, strong negative decoupling, weak negative decoupling, weak decoupling, strong decoupling, recessive decoupling, expansive coupling, and recessive coupling. Strong decoupling is the ideal decoupling state because of the decline in resource consumption or environmental pressure with economic growth. Strong negative decoupling is the worst case because of the simultaneous recession and increased consumption of resources or environmental pressure.

3.3. Water Footprint Decoupling Model

According to Formulas (2)–(4), we establish models for decoupling of economic growth with water consumption and water pollution:
D G W F b = % Δ W F b % Δ G = % ( W F b t W F b t 1 ) G t 1 % ( G t G t 1 ) W F b t 1
D G W F g y = % Δ W F g y % Δ G = % ( W F g y t W F g y t 1 ) G t 1 % ( G t G t 1 ) W F g y t 1
where D G W F b is the decoupling index of the blue WF, and % Δ W F b is the annual change rate of the blue water footprint. In Formula (6), D G W F g y represents the decoupling index of the grey water footprint, and % Δ W F g y refers to the annual change rate of the water environmental impact. Substituting WF into Formula (4), we obtain the decoupling model of WF and economic growth:
D G W F = % Δ ( W F b + W F g y ) % Δ G = % Δ W F % Δ G = % ( W F t W F t 1 ) G t 1 % ( G t G t 1 ) W F t 1
where D G W F is the decoupling elasticity index between the WF and the gross output value of the textile industry. We can judge the decoupling states by calculating the elasticity index. W F t , W F t 1 represent the textile industry water collection in year t and year t − 1, respectively. G t , G t 1 indicate the output value of the textile industry in year t and year t − 1, respectively. % Δ W F (change rate of WF of textile industry) and % Δ G (rate of change of total output value of textile industry) can be obtained by calculating the corresponding data at two time points.

3.4. LMDI Method

The decomposition method mainly aims to decompose changes in a target variable into several influencing factors in order to discern the influence degree of each factor (contribution rate); this method can be used to objectively determine actors with high contribution. The logarithmic mean Divisia index LMDI method is a commonly used decomposition method [48,49,50] and can be divided into multiplication [51] and addition modes [52]. The LMDI decomposition method in both multiplication and addition modes can obtain reasonable decomposition results with specific relationships; hence, the results are converted through the corresponding mathematical formula [50]. The decomposition margin in the addition mode of LMDI decomposition is zero; the decomposition result is not affected by the zero value present in the data [52]. In this regard, the current study employs the LMDI addition mode to decompose WF. The factors affecting WF in the textile industry are divided into three aspects. The first one is industry scale, which is in accordance with the industrial output value. The second one is industry structure, and it is determined by the proportion of each sub-sector of the textile industry. The last one is the technical level, including water-saving technology, wastewater treatment technology, production process improvement technology, research and development investment, and so on. WF can be calculated as:
W F = W F i = G × G i G × W F i G i = G × S i × W F I i
where W F i is the industrial WF of the textile sub-industry i; G i is the total industrial output value of i (in millions); G i / G is the proportion of the total industrial output value of i to the total industrial output value of the textile industry, representing the structural factor of the industry ( S i ); and W F i / G i is the WF consumed per unit of production value and also called the WF intensity, which represents the technical level factor ( W F I ). W F ( t ) is defined as the WF of the textile industry in year t, and W F ( t 1 ) is defined as the water product of the textile industry in year t − 1. The decomposition of annual WF change Δ W F can be expressed by the following formula:
Δ W F = W F ( t ) W F ( t 1 ) = G i ( t ) × S i ( t ) × W F I ( t 1 ) G i ( t 1 ) × S i ( t 1 ) × W F I i ( t 1 ) = Δ W F G + Δ W F S i + Δ W F W F I i
where Δ W F G is the contribution of industrial scale to the annual change in the WF of the textile industry (Mt/a); Δ W F S i is the contribution of industrial structure to the annual change in the WF of the textile industry (Mt/a); and Δ W F W F I i is the contribution of the technical level to annual changes in the WF of the textile industry (Mt/a). The contribution of each factor can be calculated by the following formulas:
Δ W F G = W F ( t ) W F ( t 1 ) l n W F ( t ) l n W F ( t 1 ) × l n G ( t ) G ( t 1 )
Δ W F S i = W F ( t ) W F ( t 1 ) l n W F ( t ) l n W F ( t 1 ) × l n S i ( t ) S i ( t 1 )
Δ W F W F I i = W F ( t ) W F ( t 1 ) l n W F ( t ) l n W F ( t 1 ) × l n E F I i ( t ) W F I i ( t 1 )

3.5. Data

In the industrial sector, WF refers to the total amount of fresh water directly or indirectly consumed by the product and includes the consumption and pollution of all water processed in the production chain [53]. Sub-sectors of China’s textile industry can be classified based on the characteristics of the industry in the Statistical Yearbook (Table 2) based on the China’s National Economic Industry Classification Standard (GB/T 4754) [54].
This study is based on annual data covering the period of 2001 to 2014. The gross industrial output value (converted to 2014 constant prices), water consumption, and wastewater contaminants of China’s textile industry are collected from the China Environment Yearbook (2002–2006) and China Environmental Statistics Annual Report (2006–2014). The recorded total industrial water from chemical fiber manufacturing industry was 2055 Mt in 2012, which significantly deviated from the values with year temporally adjoining. Therefore, the calculated result could be considered as invalid. In this regard, we adopt the value of 4055 Mt according to the trend in the recent years.
In Formula (3), CS[k] adopts the relevant provisions of the concentration limit standard in the water pollutant discharge standard (GB13458-2013) issued by the Ministry of Environmental Protection of China on 25 February 2013 [55] (Table 3).
The natural concentrations of a specific water pollutant (CODCr: Chemical Oxygen Demand, BOD5: Biochemical Oxygen Demand, Chroma, etc.) in receiving water bodies of different catchments are different. They are generally very low and are difficult to collect precise data on. We assumed C n [ k ] = 0 for simplicity though W F g y was underestimated [32].

4. Results and Discussion

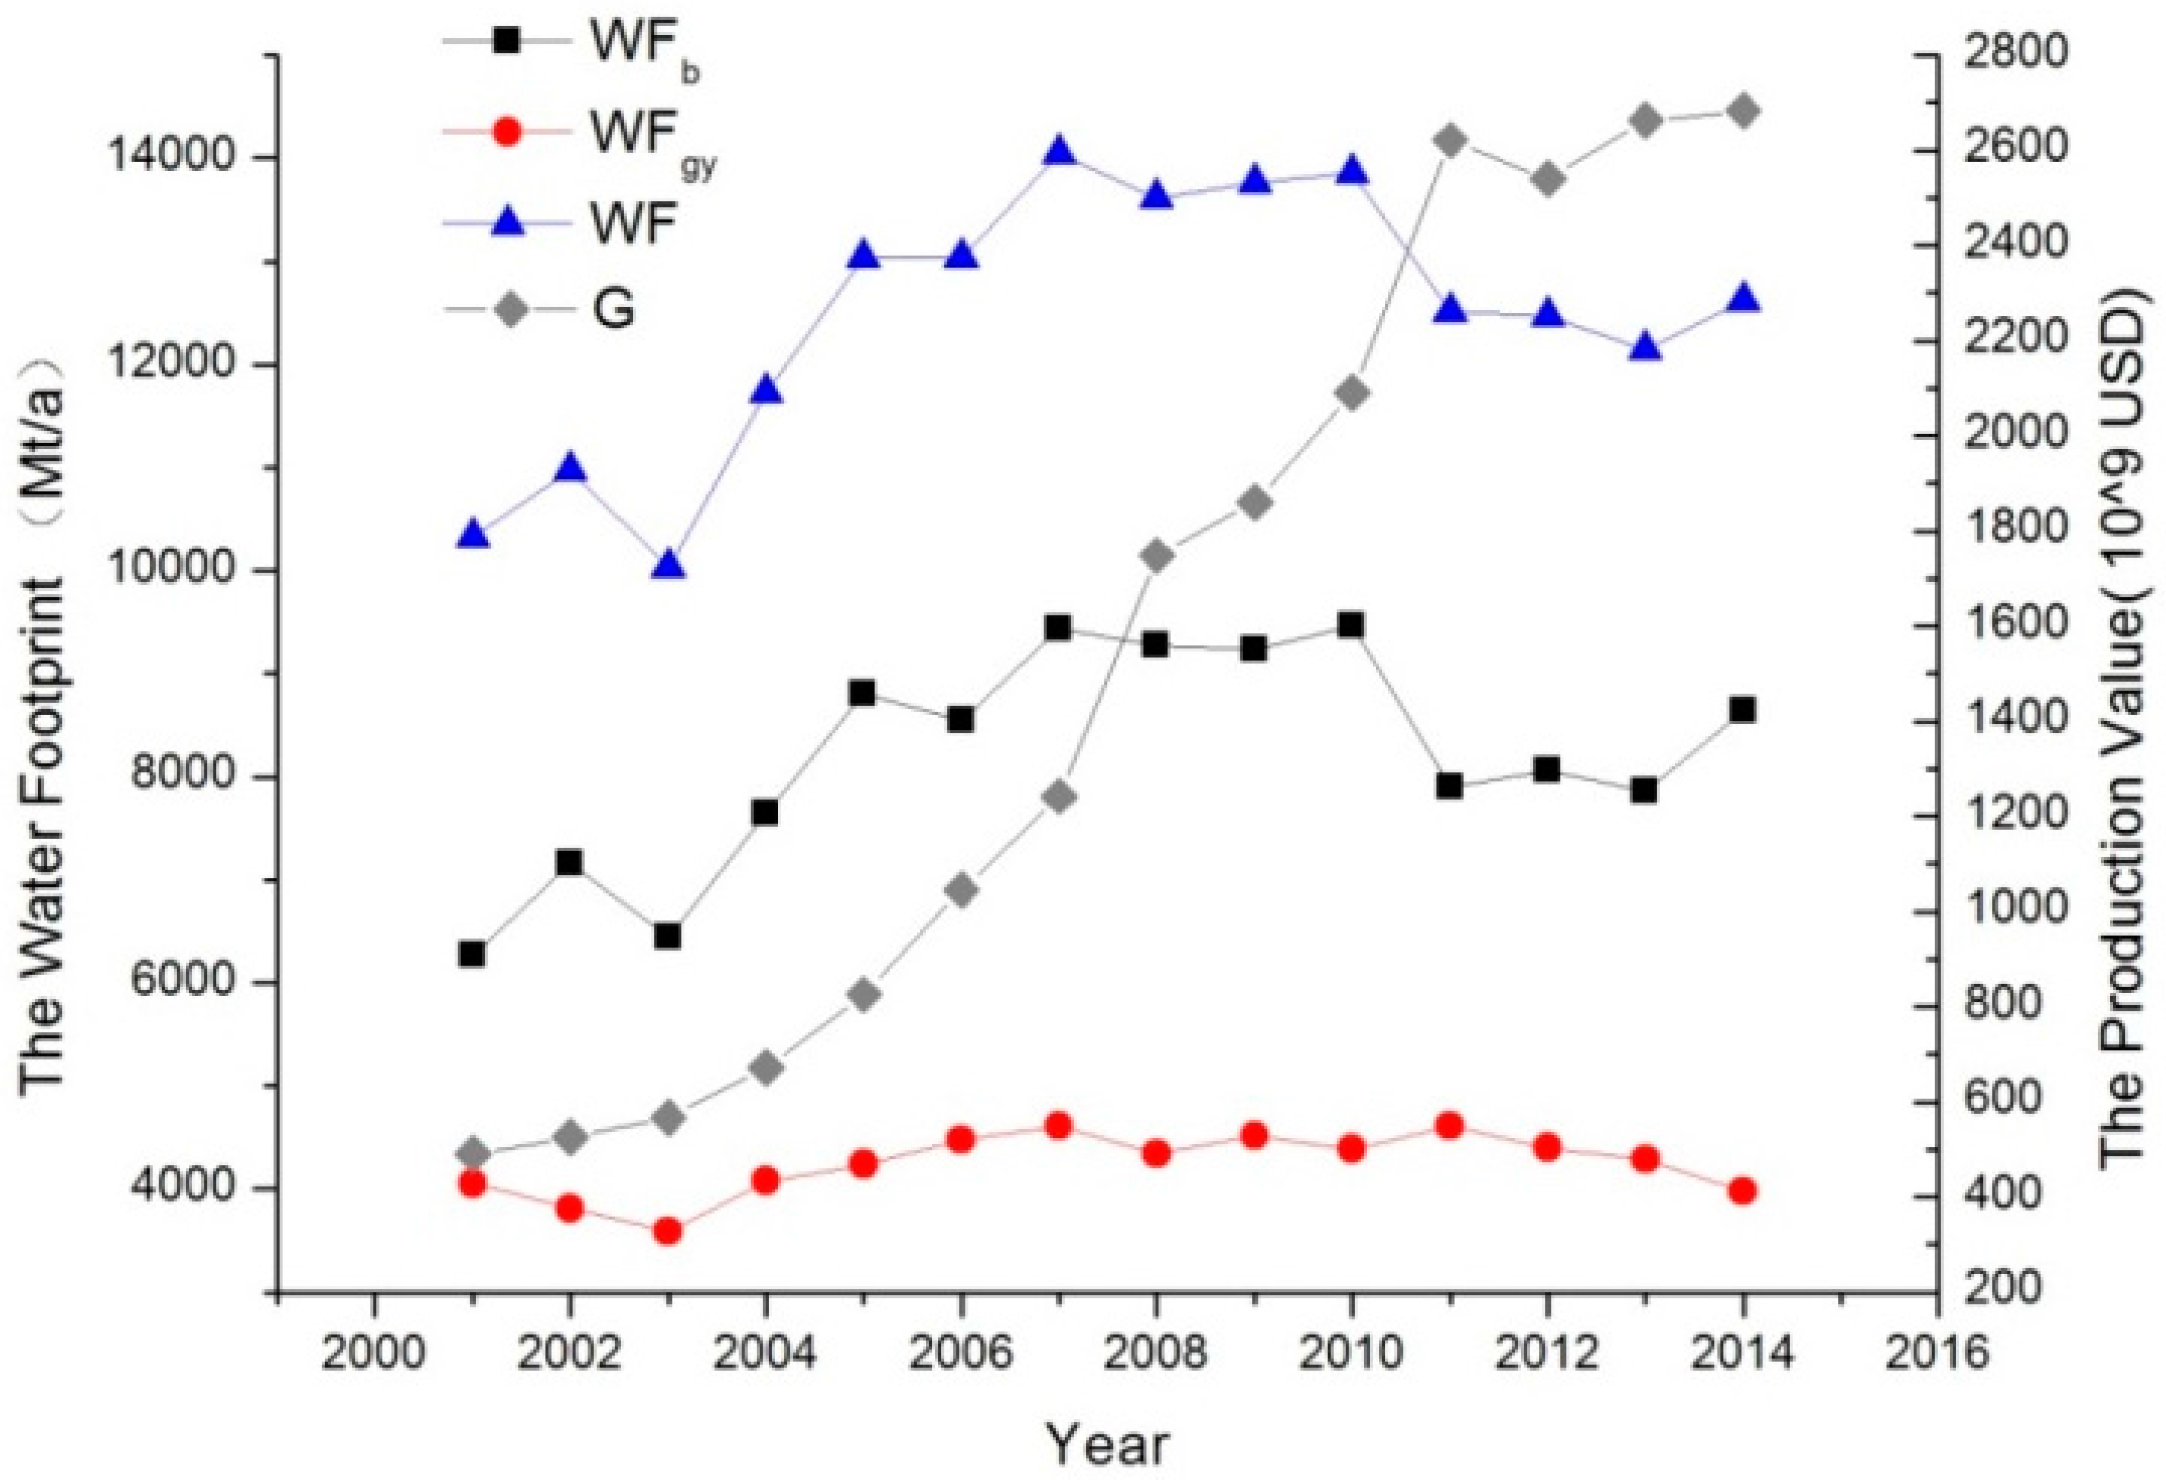
4.1. Water Footprint of the Textile Industry

Figure 1 shows the output value and WF of China’s textile industry in 2001–2014. The overall output values of the industry exhibited a rapid upward trend, from 37.22 billion US dollars in 2001 to 274.17 billion US dollars in 2014. During the same period industrial output presented a substantially increasing trend, except for a slight decline in 2012. The overall tendency is divided into two phases. The first phase (2001–2011) is the rising stage, where the gross industrial output value rapidly increases and the development momentum is satisfactory. The second stage (2012–2014) is the fluctuation phase, where the growth rate of the industrial output value evidently declines.
During the sampling period, the WF of China’s textile industry increased with the growth of the total output value of the textile industry in seven years (2002, 2004, 2005, 2007, 2009, 2010, and 2014). The WF decreased with the decline in textile industry output value in one year (2012) and with the increase in the textile industry output in five years (2003, 2006, 2008, 2011, and 2013). The overall trend of the WF is an inverted “U” type, which can be divided into two stages. A fluctuating upward trend was detected in 2001–2007, and the WF increased from 10,325.78 Mt/a in 2001 to 14,044.83 Mt/a in 2007 at this stage. The WF of the second stage (2008–2014) decreased. The WF from 2007 to 2010 maintained a high value of 13,816.18 Mt/a. In 2011, the WF sharply dropped to 12,507.11 Mt/a. In 2014, the WF slightly increased to 12,623.19 Mt/a, which was mainly related to the regain in the blue WF. In general, during the sampling period, China’s textile industry controlled the amount of wastewater discharge and achieved significant effects on wastewater management. However, water consumption is not stable, and several issues on water-saving aspects of management remain unresolved.

4.2. Analysis of Decoupling Models

Table 4 shows the results of decoupling elastic calculation between WF and economic growth from 2002 to 2014. The WF exhibited the following statutes: strong decoupling with the industrial output value for five years (2003, 2006, 2008, 2011, and 2013), weak decoupling for four years (2005, 2007, 2009, and 2010), expansive coupling in 2004, weak negative decoupling in 2012, and expansive negative decoupling in 2014.
The decoupling between WF and economic growth is generally considered satisfactory. Factors affecting the tendencies observed were analyzed by splitting the study period into three intervals.
From 2002 to 2004, the decoupling situation of the WF from economic growth was unstable, alternating between expansive coupling and strong decoupling. This phenomenon could be due to China’s accession to the World Trade Organization (WTO) in 2001, thereby stimulating the investment and demand of the textile industry. Thus, the industry was regarded to be in a rapid flourishing growth period. In this context, the textile enterprises are significant to the pace of economic development. These enterprises exploited the environment in exchange for economic growth. The differences between the economy and environment of the textile industry have intensified because of the lack of total water control coupled with backward production technology and equipment. The Chinese government began to implement the new Water Law of the People’s Republic of China in 2002 to encourage companies to use advanced technology, processes, and equipment; this law aims to increase the number of cycles of water and the water recycling rate. The law clearly declares that the main actors of illegal water pollution shall bear legal responsibility [56]. The textile industry firms actively adjusted their structure, reduced their water consumption, and strengthened their pollution control to initially improve the state of decoupling in 2003.
From 2005 to 2011, the decoupling of WF and economic growth was positive. Although the development of China’s textile industry remained independent of the WF, compared with the previous stage, the negative effect of economic development on the water environment was attenuated. First, the technology of China’s textile industry was developed in the “Eleventh Five-Year” period (2006–2010). Technology and equipment were rapidly updated, and backward production capacity was gradually removed from the market. The entire industry technology, equipment level, and production efficiency steadily increased, resulting in effective reduction of the water consumption and sewage discharge. Second, the Chinese government has promulgated a series of policy documents related to its industry access, technical innovation, and improvement; these policies include the Law of the People’s Republic of China on Prevention and Control of Water Pollution initiated from 2008 [57]; and the issued opinions on Further Strengthening Industrial Water Saving Work of the Ministry of Industry and Information Technology (MIIT) (China’s MIIT [2010] No. 218) [58]. The law forces enterprises to increase their investment in controlling water pollution, upgrading the production equipment, and improving the water environment. However, from the views of decoupling elastic values, the WF of the textile industry and economic growth was not a stable decoupling. In the year of strong decoupling, the absolute value of the elasticity coefficient was less than 0.1 for two years. Specifically, the elastic coefficient in 2006 was −0.003, which was close to the critical value of strong decoupling and weak decoupling. In the year of weak decoupling, only the decoupling index (0.05) of 2010 is close to the critical value of the decoupling strength. Thus, the water saving and emission reduction work of the textile industry must be further improved.
In 2012–2014, strong decoupling and negative decoupling alternately occurred between WF and economy because China’s textile industry underwent structural adjustment and transformation. The backward production was repeatedly constructed in central and western regions. In 2014, the number of textile enterprises in the central region was 36,301, an increase of 1364 compared with that in 2012. In the process of industrial relocation, reduced environmental protection requirements is one of the favorable conditions for industrial transfer and investment promotion in some central and western regions. This condition affects and destroys the relatively fragile water environment in central and western regions, leading to terrible decoupling results. Particularly in 2012, the cost of the textile industry continuously increased, thereby weakening the international comparative advantage. Since then, the economy has exhibited negative growth, leading to the current state of weak negative decoupling. By contrast, state environmental standards continue to improve. For example, the State Council issued the State Council on the Implementation of the Most Stringent Water Management System View (China’s State Council [2012] No. 3) [59]. In the same year, China’s Ministry of Environmental Protection introduced a new Standard for Discharge of Water Pollutants for Textile Dyeing and Finishing Industry (GB 4287-2012) [60]. The law further constricts the standards for wastewater discharge, forcing companies to increase their investment in environmental protection funds, improving the production processes, reducing the waste water discharge, and increasing the wastewater treatment capacity to improve the decoupling status. The increase in the WF of the textile industry exceeded the industrial output value in 2014, and the elastic coefficient was 5.27, showing a negative expansion in passive decoupling state. This phenomenon, combined with changes in WF, could be due to rapid increases in water consumption of the textile industry in 2014. Economic development and water consumption re-combined. The relationship between the enterprise and the government will prevail for a long time.

4.3. Decomposition Analysis

Table 5 and Figure 2 show the results of the decomposition of the WF of China’s textile industry from 2002 to 2014. Industrial scale factor showed the major positive contribution to the textile WF, except for 2012. From 2002 to 2014, the average contribution of industrial scale factors to WF growth was 1674.55 Mt/a, which is higher than the industrial structure factor (−3.06 Mt/a) and the technical level factor (−1494.78 Mt/a). The industrial scale significantly influenced the WF during 2002–2011, with a contribution of 4724.20 Mt/a in 2008, reaching the maximum value in the sample period. As a labor-intensive industry, the textile industry expands the industrial scale through China’s labor-rich and low-cost advantages.
The effect of internal structure on WF is not evident. From 2002 to 2014, the contribution of industry structural factor to the WF remained positive for six years and negative for seven years. Industry structural factor contributed a lower absolute value compared with the other two factors; particularly, the maximum value of the contribution in 2007 was 1158.26 Mt/a, and only within 100 Mt/a in four years (2004, 2005, 2011, and 2013). The structure of the industry has a limited effect on the WF. Hence, the structure of China’s textile industry has not significantly changed and China is still at the low-end of the international division of labor. The industrial structure of the WF of the inhibitory effect is more apparent with the adjustment and upgrading of the structure.
Technical factors are important for reducing the WF of China’s textile industry. In addition to 2013 and 2014, the contribution of technical factors to the WF was negative, reaching a maximum of −4323.21 Mt/a in 2011. Although the inhibition of the WF growth fluctuated, technology remained the largest contributor. The Textile Industry Development Plan (2016–2020) [29] shows that the valid invention patents of large and medium textile enterprises reached 5381 Mt/a in 2014, which was 2.3 times higher than that in 2010. During the “Twelfth Five-Year Plan”, a large number of new energy-saving and emission reduction technologies were widely used; the printing and dyeing of cloth using 100 Mt/a of fresh water was performed to reduce water consumption from 2.5 ton down to 1.8 tons, and increase water reuse rate of 15% to over 30%. The textile industry has completed a comprehensive increase in value-added energy consumption reduction, water abatement, pollutant emission reduction, and other binding targets. Reuse of fiber accounting for the proportion of total fiber processing increased from 9.6% in 2010 to 11.3% in 2015. In the future, the technical level will remain the most important factor to inhibit the growth of WF; as the technology becomes advanced and mature, the inhibition of WF will increase and become stable.

5. Conclusions

The WF of the textile industry in China was calculated based on the panel data of water consumption, wastewater discharge, and gross industrial output value from 2001 to 2014. The decoupling relationship between WF and economic growth of China’s textile industry was analyzed by using the improved decoupling model. The main conclusions are as follows:
(1)
From 2001 to 2014, the WF of China’s textile industry generally followed an inverted “U” trend and rebounded in 2014. The trend can be divided into two stages: the rising (2001–2007) and decline phases (2008–2014).
(2)
In 2002–2014, China’s textile industry’s overall WF showed good decoupling between economic growth, with five years strong decoupling (2003, 2006, 2008, 2011, and 2013) and four years of weak decoupling (2005, 2007, 2009, and 2010). The decoupling trend as a whole is good, but the development of the textile industry is not completely independent of the WF. The government and textile enterprises should pay great attention to water-saving and waste water reduction in order to prevent reversal of the trend of decoupling.
(3)
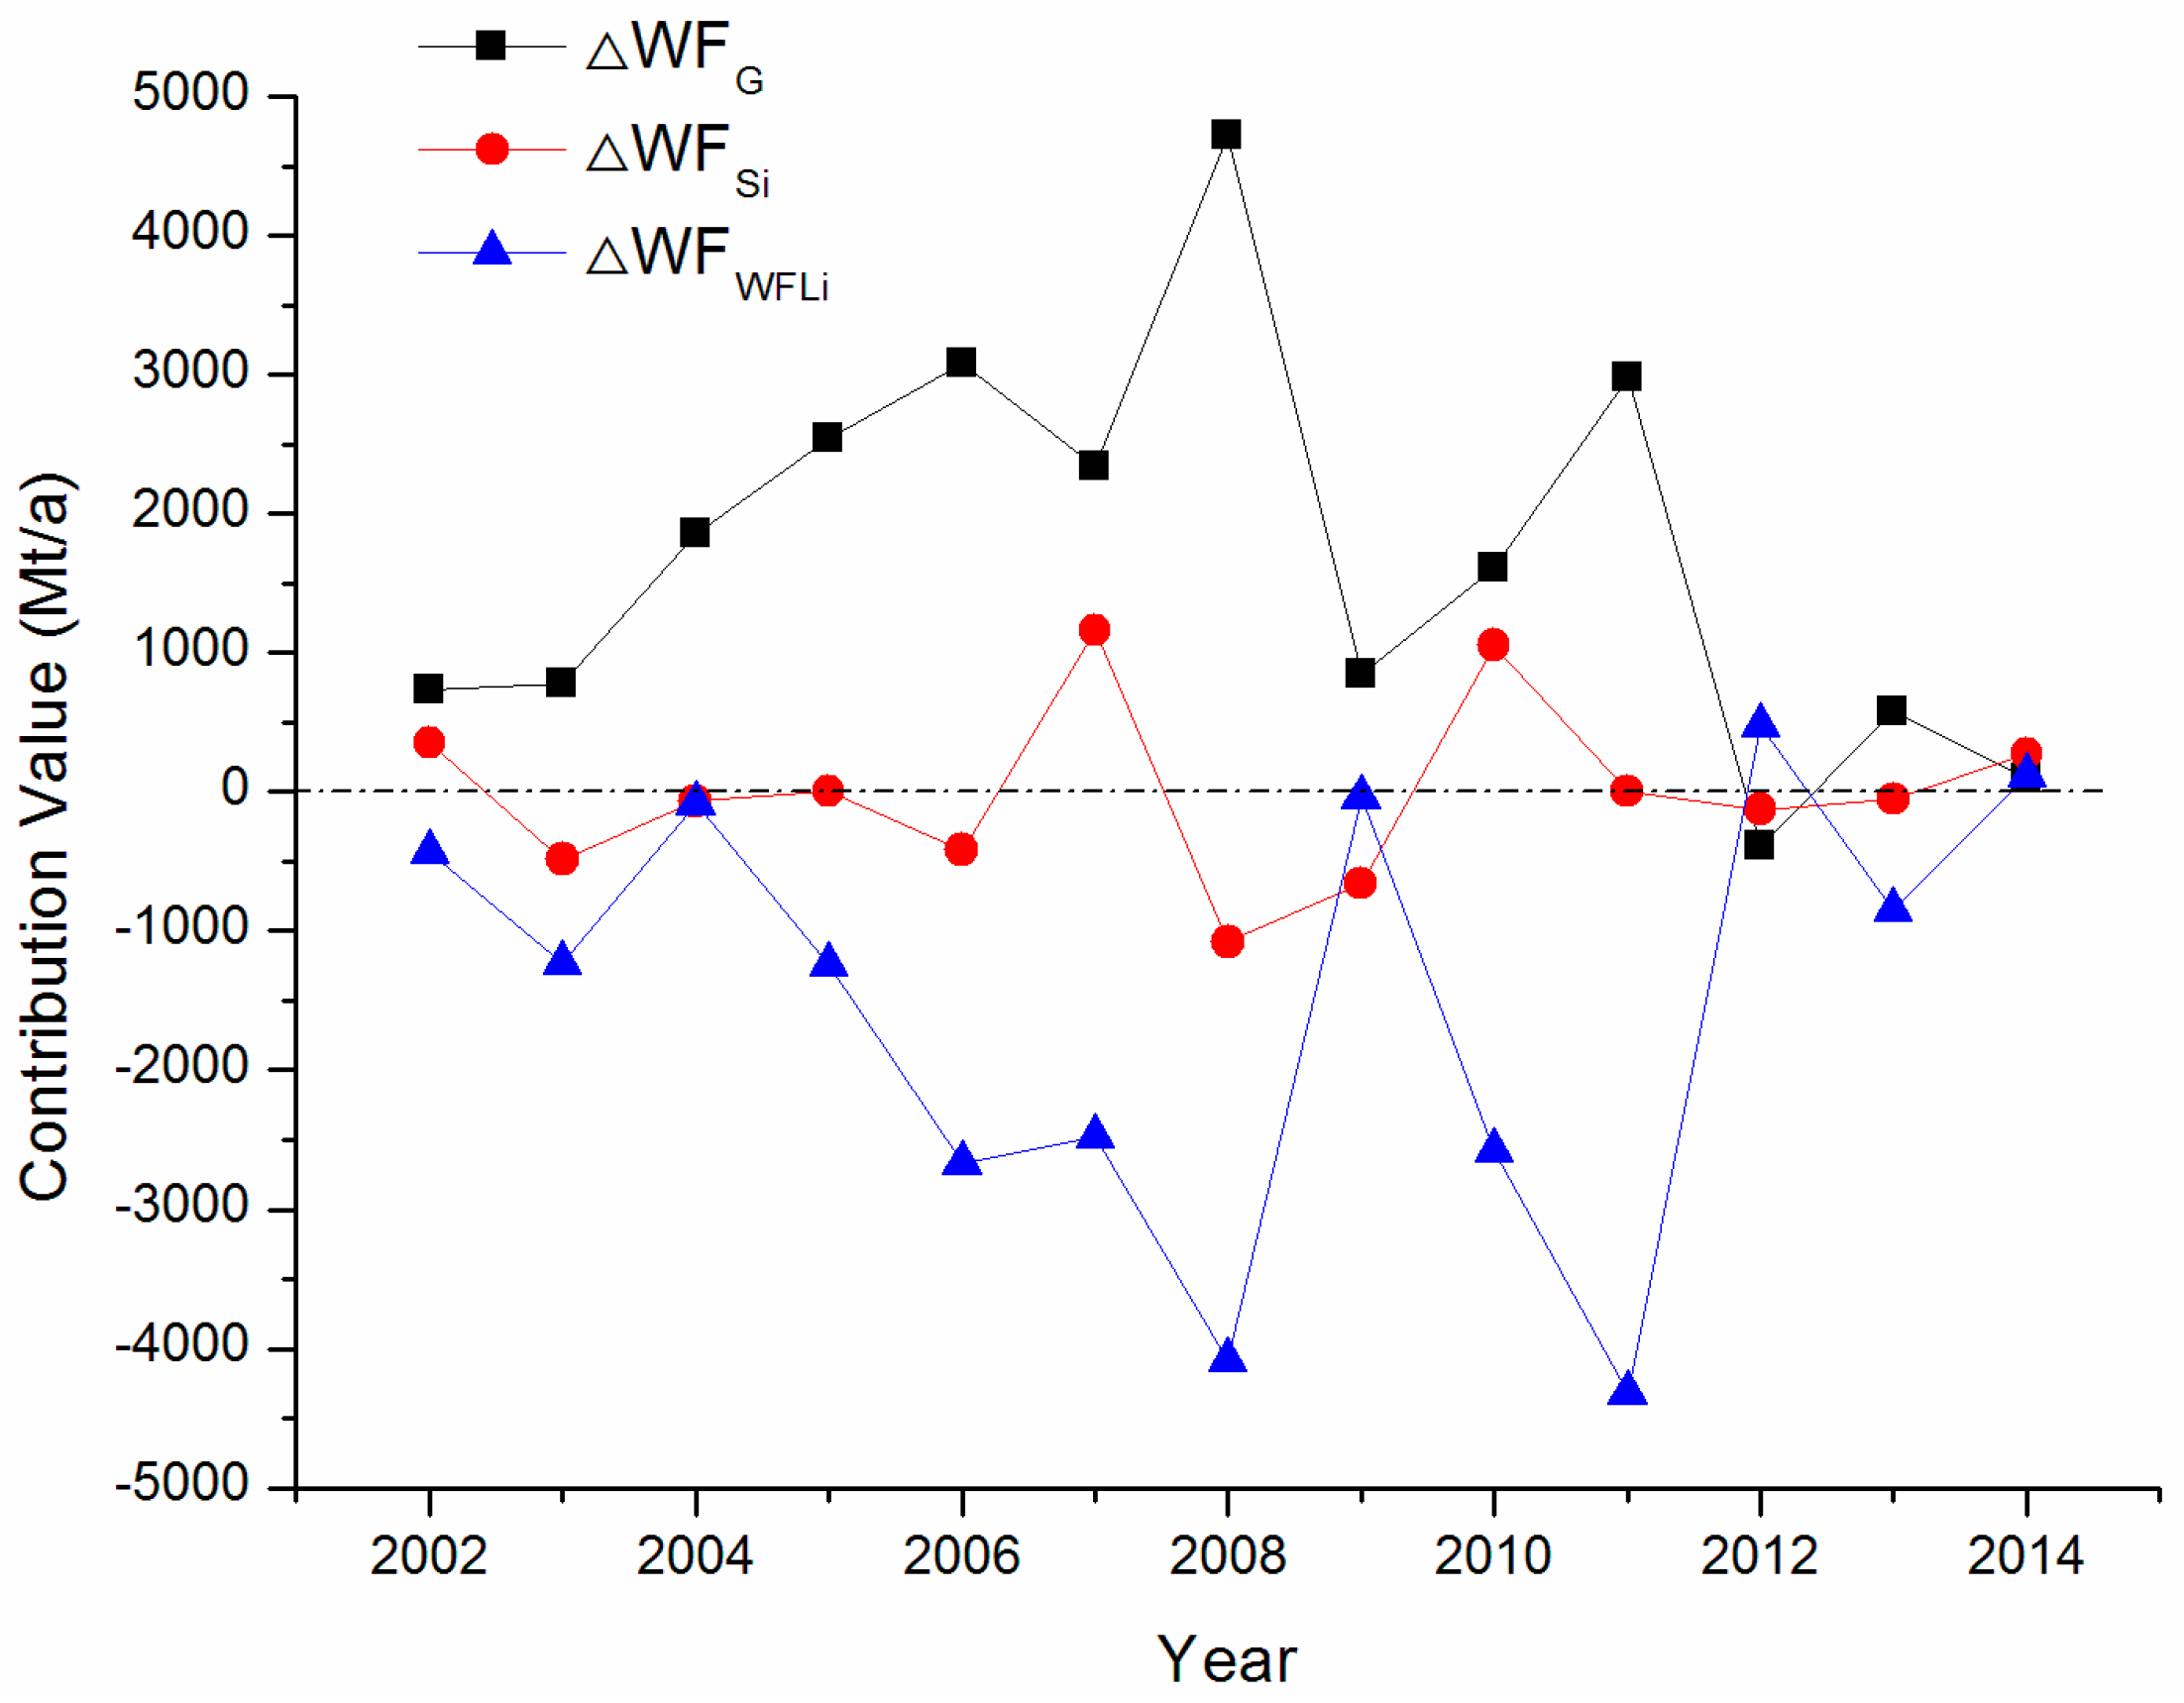
The main factors affecting the decoupling of WF and economic growth in China’s textile industry are industry scale and technical level. The influence of industry structure is not evident. Industry scale factor is the primary factor that causes WF growth; technical level is the biggest contributor in the suppression of WF growth.
Establishing a resource-saving and environment-friendly textile production system is an essential goal for the development of China’s textile industry, and also a prerequisite for China to achieve green modernization. These findings will help China’s textile enterprises and government decision-makers to adopt appropriate decisions to improve the water management and ultimately achieve sustainable development of the textile industry.

Acknowledgments

The paper was supported by the National Natural Science Foundation of China (NSFC) (71503233), Zhejiang Provincial Natural Science Foundation of China (LQ16G030012, LY17G030035), Key Research Institute of Philosophy and Social Sciences for Ecological Civilization Research Center Project of Zhejiang Province, China (16JDGH090), and The National College Students’ Innovative Entrepreneurial Training Program of China (201610338021).

Author Contributions

Yi Li, Manhong Shen and Laili Wang conceived and designed the experiments; Yi Li, Linyi Lu and Yinxi Tan analyzed the data; Yi Li, Linyi Lu and Laili Wang wrote the paper.

Conflicts of Interest

The authors declare no conflict of interest.

References

  1. Organization for Economic Co-operation and Development (OECD). Indicators to Measure Decoupling of Environmental Pressure from Economic Growth; OECD Publishing: Paris, France, 2002. [Google Scholar]
  2. Organization for Economic Co-operation and Development. Decoupling: A Conceptual Overview; OECD Publishing: Paris, France, 2001. [Google Scholar]
  3. Fischer-Kowalski, M.; Swilling, M.; von Weizsäcker, E.U.; Ren, Y.; Moriguchi, Y.; Crane, W.; Krausmann, F.; Eisenmenger, N.; Giljum, S.; Hennicke, P.; et al. Decoupling Natural Resource Use and Environmental Impacts from Economic Growth. A Report of the Working Group on Decoupling to the International Resource Panel. Available online: http://www.unep.org/resourcepanel/decoupling/files/pdf/decoupling_report_english.pdf (accessed on 15 November 2016).
  4. Larson, E.D.; Ross, M.H.; Williams, R.H. Beyond the era of materials. Sci. Am. 1986, 254, 34–41. [Google Scholar] [CrossRef]
  5. Selden, T.M.; Song, D. Environmental quality and development: Is there a Kuznets Curve for air pollution emissions. J. Environ. Econ. Manag. 1994, 2, 147–162. [Google Scholar] [CrossRef]
  6. Vehmas, J.; Kaivo-Oja, J.; Luukkanen, J.; Malaska, P. Environmental taxes on fuels and electricity—Some experiences from the Nordic countries. Energy Policy 1999, 27, 343–355. [Google Scholar] [CrossRef]
  7. Ayres, R.U.; Ayres, L.W.; Warr, B. Exergy, power and work in the US economy, 1900–1998. Energy 2003, 28, 219–273. [Google Scholar] [CrossRef]
  8. Arouri, M.E.H.; Youssef, A.B.; M’Henni, H.; Rault, C. Energy consumption, economic growth and CO2 emissions in Middle East and North African countries. Energy Policy 2012, 45, 342–349. [Google Scholar] [CrossRef] [Green Version]
  9. Tapio, P.; Banister, D.; Luukkanen, J.; Vehmas, J.; Willamo, R. Energy and transport in comparison: Immaterialisation, dematerialisation and decarbonisation in the EU15 between 1970 and 2000. Energy Policy 2007, 35, 433–451. [Google Scholar] [CrossRef]
  10. Wu, H.; Gu, S.; Zhou, H.; Wang, X.; Dong, D.; Hu, Y. Relationship between energy consumption-carbon emissions and economic growth in Hebei province. Resour. Sci. 2011, 33, 1897–1905. [Google Scholar]
  11. Zhu, H.; Li, W.; Yu, J.; Sun, W.; Yao, X. An Analysis of Decoupling Relationships of Water Uses and Economic Development in the Two Provinces of Yunnan and Guizhou during the First Ten Years of Implementing the Great Western Development Strategy. Procedia Environ. Sci. 2013, 18, 864–870. [Google Scholar] [CrossRef]
  12. Lei, Y.T.; Su, L. Decoupling Relationship between Industrial Water Use and Economic Development in Guangdong Province. Water Conserv. Sci. Technol. Econ. 2015, 21, 1–4. (In Chinese) [Google Scholar]
  13. Gilmont, M. Decoupling Dependence on Natural Water: Reflexivity in the Regulation and Allocation of Water in Israel. Water Policy 2014, 16, 79–101. [Google Scholar] [CrossRef]
  14. Wu, D.; Wang, Y.H. Evaluation and prospect on the decoupling trend of economic development and water environment pressure in China. Resour. Environ. Yangtze Basin 2013, 22, 1103–1109. (In Chinese) [Google Scholar]
  15. Caneghem, J.V. Eco-efficiency trends of the Flemish industry: Decoupling of environmental impact from economic growth. J. Clean. Prod. 2010, 18, 1349–1357. [Google Scholar] [CrossRef]
  16. Conrad, E.; Cassar, L.F. Decoupling Economic Growth and Environmental Degradation: Reviewing Progress to Date in the Small Island State of Malta. Sustainability 2014, 6, 6729–6750. [Google Scholar] [CrossRef]
  17. Chen, Q.; Li, J.M.; Management, S.O. Analysis on the decoupling relationship between marine environmental stress and marine economic growth in China. Mar. Environ. Sci. 2015, 34, 827–833. (In Chinese) [Google Scholar]
  18. Li, X.K.; Wei, J. Decoupling between Environmental Pressure and Economic Growth in Chongqing Metropolitan Area. J. Nat. Resour. 2010, 25, 139–147. (In Chinese) [Google Scholar]
  19. Gai, M.; Hu, H.A.; Ke, L.N. Decoupling Analysis between Economic Development and Resources and Environmental of the Yangtze River Delta. J. Nat. Resour. 2013, 28, 185–198. (In Chinese) [Google Scholar]
  20. Wang, L.L.; Ding, X.M.; Wu, X.Y. Blue and grey water footprint of textile industry in China. Water Sci. Technol. 2013, 11, 2485–2490. [Google Scholar] [CrossRef] [PubMed]
  21. Zhang, Y.; Yang, Q.S. Decoupling agricultural water consumption and environmental impact from crop production based on the water footprint method: A case study of the Heilongjiang land reclamation area, China. Ecol. Indic. 2014, 43, 29–35. [Google Scholar]
  22. Gilmont, M. Water resource decoupling in the MENA through food trade as a mechanism for circumventing national water scarcity. Food Secur. 2015, 7, 1–19. [Google Scholar] [CrossRef]
  23. Pan, A.; Chen, L. Decoupling and Water Footprint Analysis of the Coordinate Development between Water Utilization and the Economy in Hubei. Resour. Sci. 2014, 36, 328–333. (In Chinese) [Google Scholar]
  24. National Bureau of Statistics of the People’s Republic of China. China Industry Economy Statistical Yearbook; China Statistics Press: Beijing, China, 2015. (In Chinese)
  25. Peng, Y. Study on the Upgrading of China’s Textile Industry Competitiveness. Dissertation, Shanghai Academy of Social Sciences, Shanghai, China, 2010. [Google Scholar]
  26. World Trade Organization. International Trade and Market Access Data. 2001–2014. Available online: https://www.wto.org/english/res_e/statis_e/statis_bis_e.htm?solution=WTO&path=/Dashboards/MAPS&file=Map.wcdf&bookmarkState={%22impl%22:%22client%22,%22params%22:{%22langParam%22:%22en%22}} (accessed on 17 September 2016).
  27. The State Development Research Center. Total Value of Import and Export of Textiles and Garments. 2002–2015. Available online: http://d.drcnet.com.cn/eDRCnet.common.web/docview.aspx?version=data&docId=4441142&leafId=17357&chnId=4522 (accessed on 17 September 2016). (In Chinese)
  28. Global Textile Network. Available online: http://www.tnc.com.cn/info/c-013003-d-228148.html (accessed on 15 November 2016). (In Chinese)
  29. Ministry of Industry and Information Technology Regulations of China. The 13th Five-Year Planning of Textile Industry. 2016. Available online: http://www.miit.gov.cn/n1146295/n1652930/n3757019/c5267251/content.html (accessed on 14 November 2016). (In Chinese) [Google Scholar]
  30. Boulay, A.M.; Hoekstra, A.Y.; Vionnet, S. Complementarities of water-focused life cycle assessment and water footprint assessment. Environ. Sci. Technol. 2013, 47, 1926–11927. [Google Scholar] [CrossRef] [PubMed]
  31. Hoekstra, A.Y. Virtual Water Trade: Proceedings of the International Expert Meeting on Virtual Water Trade; Value of Water Research Report Series; IHE Delft: Delft, The Netherlands, 2003; Volume 2, pp. 13–23. [Google Scholar]
  32. Gu, Y.F.; Xu, J.; Wang, H.T.; Li, F.T. Industrial Water Footprint Assessment: Methodologies in Need of Improvement. Environ. Sci. Technol. 2014, 5, 6531–6532. [Google Scholar] [CrossRef] [PubMed]
  33. Egan, M. The Water Footprint Assessment Manual. Setting the Global Standard. Soc. Environ. Account. J. 2011, 31, 181–182. [Google Scholar] [CrossRef]
  34. Ma, J.; Peng, J. Research Process on Water Footprint. Acta Econ. Sin. 2013, 33, 5458–5466. [Google Scholar]
  35. Manzardo, A.; Mazzi, A.; Loss, A.; Butler, M.; Williamson, A.; Scipioni, A. Lessons learned from the application of different water footprint approaches to compare different food packaging alternatives. J. Clean. Prod. 2015, 112, 4657–4666. [Google Scholar] [CrossRef]
  36. Hoekstra, A.Y.; Chapagain, A.K.; Aldaya, M.M.; Mekonnen, M.M. The Water Footprint Assessment Manual: Setting the Global Standard; Earthscan: London, UK, 2011. [Google Scholar]
  37. Kounina, A.; Margni, M.; Bayart, J.-B.; Boulay, A.-M.; Berger, M.; Bulle, C.; Frischknecht, R.; Koehler, A.; Milà i Canals, L.; Motoshita, M.; et al. Review of methods addressing freshwater use in life cycle inventory and impact assessment. Int. J. Life Cycle Assess. 2013, 18, 707–721. [Google Scholar] [CrossRef]
  38. Ene, S.A.; Teodosiu, C.; Robu, B.; Volf, I. Water footprint assessment in the winemaking industry: A case study for a Romanian medium size production plant. J. Clean. Prod. 2013, 43, 122–135. [Google Scholar] [CrossRef]
  39. Herath, I.; Green, S.; Singh, R.; Horne, D.; Zijpp, S.V.D.; Clothier, B. Water foot printing of agricultural products: A hydrological assessment for the water footprint of New Zealand’s wines. J. Clean. Prod. 2013, 41, 232–243. [Google Scholar] [CrossRef]
  40. Gu, Y.F.; Xu, J.; Keller, A.A.; Yuan, D.Z.; Li, Y.; Zhang, B.; Weng, Q.T.; Zhang, N.L.; Ping, D.; Wang, H.T.; et al. Calculation of water footprint of the iron and steel industry: A case study in Eastern China. J. Clean. Prod. 2015, 92, 274–281. [Google Scholar] [CrossRef]
  41. Hoekstra, A.Y.; Mekonnen, M.M. The water footprint of humanity. Proc. Natl. Acad. Sci. USA 2012, 109, 3232–3237. [Google Scholar] [CrossRef] [PubMed]
  42. Chapagain, A.K.; Hoekstra, A.Y. The blue, green and grey water footprint of rice from production and consumption perspectives. Ecol. Econ. 2011, 70, 749–758. [Google Scholar] [CrossRef]
  43. Mekonnen, M.M.; Hoekstra, A.Y. A Global Assessment of the Water Footprint of Farm Animal Products. Ecosystems 2012, 15, 401–415. [Google Scholar] [CrossRef]
  44. Mekonnen, M.M.; Hoekstra, A.Y.; Becht, R. Mitigating the Water Footprint of Export Cut Flowers from the Lake Naivasha Basin, Kenya. Water Resour. Manag. 2012, 26, 3725–3742. [Google Scholar] [CrossRef]
  45. Wang, X.M.; Huang, K.; Yang, S.S. Temporal Variability and Influencing Factors of Sectorial Water Footprint in China. J. Nat. Resour. 2014, 29, 2114–2126. [Google Scholar]
  46. Mekonnen, M.M.; Hoekstra, A.Y. A global and high-resolution assessment of the green, blue and grey water footprint of wheat. Hydrol. Earth Syst. Sci. 2010, 14, 1259–1276. [Google Scholar] [CrossRef] [Green Version]
  47. Tapio, P. Towards a theory of decoupling: Degrees of decoupling in the EU and case of road traffic in Finland between 1970 and 2001. Trans. Policy 2005, 12, 137–151. [Google Scholar] [CrossRef]
  48. Ang, B.W. Decomposition analysis for policy making in energy: Which is the preferred method. Energy Policy 2004, 32, 1131–1139. [Google Scholar] [CrossRef]
  49. Sheinbaum-Pardo, C.; Ozawa, L.; Castillo, D. Using logarithmic mean Divisia index to analyze changes in energy use and carbon dioxide emissions in Mexico’s iron and steel industry. Energy Econ. 2010, 32, 1337–1344. [Google Scholar] [CrossRef]
  50. Sheinbaum-Pardo, C.; Mora-Pérez, S.; Robles-Morales, G. Decomposition of energy consumption and CO2 emissions in Mexican manufacturing industries: Trends between 1990 and 2008. Energy Sustain. Dev. 2012, 16, 57–67. [Google Scholar] [CrossRef]
  51. Ang, B.W.; Liu, F.L. A new energy decomposition method: Perfect in decomposition and consistent in aggregation. Energy 2001, 26, 537–548. [Google Scholar] [CrossRef]
  52. Ang, B.W.; Zhang, F.Q.; Choi, K.H. Factorizing changes in energy and environmental indicators through decomposition. Energy 1998, 23, 489–495. [Google Scholar] [CrossRef]
  53. Pfister, S.; Ridoutt, B.G. Water Footprint: Pitfalls on common ground. Environ. Sci. Technol. 2014, 48, 4. [Google Scholar] [CrossRef] [PubMed]
  54. National Bureau of Statistics of the People’s Republic of China. China’s National Economic Industry Classification Standard (GB/T4754-2011). 2011. Available online: http://www.mca.gov.cn/article/sj/tjbz/b/201507/20150700854769.shtml (accessed on 29 October 2016). (In Chinese) [Google Scholar]
  55. Ministry of Environmental Protection of China. Water Pollutant Discharge Standard (GB13458-2013). 2013. Available online: http://kjs.mep.gov.cn/hjbhbz/bzwb/shjbh/swrwpfbz/201303/t20130325_249814.htm (accessed on 29 October 2016). (In Chinese) [Google Scholar]
  56. Standing Committee of the National People’s Congress of the People’s Republic of China. Water Law of the People’s Republic of China. 2002. Available online: http://www.gov.cn/ziliao/flfg/2005-08/31/content_27875.htm (accessed on 29 October 2016). (In Chinese) [Google Scholar]
  57. Standing Committee of the National People’s Congress of the People’s Republic of China. Water Pollution Prevention and Control Law of the People’s Republic of China. 2008. Available online: http://www.gov.cn/flfg/2008-02/28/content_905050.htm (accessed on 8 September 2016). (In Chinese) [Google Scholar]
  58. Ministry of Industry and Information Technology of China. Ministry of Industry and Information Technology (MIIT)’s Opinions on Further Strengthening Industrial Water Saving Work. 2010. Available online: http://www.miit.gov.cn/n1146295/n1652858/n1652930/n3757016/c3760234/content.html (accessed on 16 November 2016). (In Chinese) [Google Scholar]
  59. The State Council of the People’s Republic of China. State Council on the Implementation of the Most Stringent Water Management System. 2012. Available online: http://www.gov.cn/zwgk/2012-02/16/content_2067664.htm (accessed on 8 September 2016). (In Chinese) [Google Scholar]
  60. Ministry of Environmental Protection of China. Discharge Standard of Water Pollutant for Dyeing and Finishing of Textile Industry (GB 4287-2012). 2012. Available online: http://kjs.mep.gov.cn/hjbhbz/bzwb/shjbh/swrwpfbz/201211/t20121109_241788.htm (accessed on 8 September 2016). (In Chinese) [Google Scholar]
Figure 1. Changes in total output and water footprint (WF) of China’s textile industry (2001–2014). Note: WFb, blue water footprint; WFgy, grey water footprint; G, gross annual industrial output.
Water 09 00124 g001
Figure 2. Decomposition analysis of WF factors for China’s textile industry, 2002–2014. Note: WFb, blue water footprint; WFgy, grey water footprint; G, gross annual industrial output.
Water 09 00124 g002
Table 1. Criteria of decoupling status.
StatusElastic Values
Negative decouplingExpansive negative decouplingVOL > 0, ∆G > 0, D ∈ (1.2, +∞)
Strong negative decouplingVOL > 0, ∆G < 0, D ∈ (−∞, 0)
Weak negative decouplingVOL < 0, ∆G < 0, D ∈ [0, 0.8)
DecouplingWeak decouplingVOL > 0, ∆G > 0, D ∈ [0, 0.8)
Strong decouplingVOL < 0, ∆G > 0, D ∈ (−∞, 0)
Recessive decouplingVOL < 0, ∆G < 0, D ∈ (1.2, +∞)
CouplingExpansive couplingVOL > 0, ∆G > 0, D ∈ [0.8, 1.2]
Recessive couplingVOL < 0, ∆G < 0, D ∈ [0.8, 1.2]
Table 2. China’s textile industry names and classifications.
Sub-SectorsThe Name in China’s Statistical Yearbook
Textile IndustryTextile industryTextile industry
Garment IndustryClothing and other fiber products manufacturing; textile and garment, shoes, hats manufacturing; textile and garment, apparel industry
Chemical fiber industryChemical fiber industry
Table 3. Emission limits for waste water pollutants in the textile industry. Unit: mg/L.
Limits of Pollutant SpeciesLimits
pH6–9
CODCr100
BOD525
Suspended matter60
Chroma70
Aniline1.0
Total nitrogen20
Total phosphorus1.0
ClO20.5
Organic halogen15
Sulfide1.0
Ammonia nitrogen12
Hexavalent chromium0.5
Note: CODCr, Chemical Oxygen Demand; BOD5, Biochemical Oxygen Demand; ClO2: Adsorbable chlorine dioxide.
Table 4. Decoupling of WF and economic growth in China’s textile industry (2002–2014).
Year%G%WFDG-WFDegrees of Decoupling/Coupling
20027.15%6.29%0.88Expansive coupling
20037.66%−8.61%−1.12Strong decoupling
200418.67%16.93%0.91Expansive coupling
200522.86%11.18%0.49Weak decoupling
200626.64%−0.08%−0.003Strong decoupling
200718.85%7.79%0.41Weak decoupling
200840.73%−3.09%−0.08Strong decoupling
20096.38%1.09%0.17Weak decoupling
201012.40%0.68%0.05Weak decoupling
201125.39%−9.71%−0.38Strong decoupling
2012−3.09%−0.35%0.11Weak negative decoupling
20134.84%−2.58%−0.53Strong decoupling
20140.75%3.96%5.27Expansive negative decoupling
Note: %∆G, rate of change of total output value; %∆WF, change rate of WF; DG-WF, decoupling elasticity index.
Table 5. Decomposition analysis of WF factors for China’s textile industry, 2002–2014.
YearWFG (Mt/a)WFSi (Mt/a)WFIi (Mt/a)
2002734.88351.72−437.15
2003773.93−485.78−1233.45
20041856.60−67.75−90.99
20052546.435.16−1239.96
20063077.94−419.49−2668.28
20072336.591158.26−2479.61
20084724.20−1076.68−4081.96
2009845.91−657.46−40.77
20101613.061053.40−2573.08
20112976.762.10−4323.21
2012−391.61−126.59475.01
2013581.83−50.48−852.59
201492.63273.81113.95
Note: ∆WFG, the contribution of industrial scale to the annual change in the WF (Mt/a); ∆WFSi, the contribution of industrial structure; ∆WFIi, the contribution of the technical level.

