
Valuing Multiple Benefits, and the Public Perception of SUDS Ponds

School of Energy, Geoscience, Infrastructure and Society, Heriot Watt University, Edinburgh EH14 4AS, UK
*
Author to whom correspondence should be addressed.
Water 2017, 9(2), 128; https://doi.org/10.3390/w9020128
Submission received: 2 December 2016
/
Revised: 7 February 2017
/
Accepted: 9 February 2017
/
Published: 16 February 2017
Abstract
:Understanding how the public perceive and value ponds is fundamental to appreciate the synergy between Sustainable urban Drainage (SUDS) ponds and the multiple benefits they provide. This paper investigates this, through the application of a structured postal and online survey, for a case study area of Edinburgh, in the UK. It compares man-made ponds (including SUDS), and ponds with natural origins. The results from Whole Life Cost show that the benefits (based on Contingent Valuation) exceed the CAPEX and OPEX costs for three of five artificial ponds studied. Benefits from natural (reference) ponds exceed the replacement costs for a pond with the same surface area/catchment. This paper highlights the importance of monetising the multiple benefits from ponds.
1. Introduction
Ponds are temporary or permanent water features that have a surface area between 1 m2 and 2 ha (20,000 m2), and may be artificial or natural in origin [1,2]. Existing literature on urban ponds refers to poor habitat and water quality due to nutrient enrichment [2]. However, there is an increasing awareness of the benefits associated with ponds and the need to preserve these small water bodies and create new ponds [2]. This may be hindered by a lack of a clear management framework [3] and only limited freshwater legislation for small water bodies in the United Kingdom and within Europe [2]. Ponds can be both naturally occurring and artificial in nature, which influences their characteristics.
1.1. Artificial Ponds (Including SUDS)
Artificial ponds are those which are man-made, and include recreation ponds, mill ponds, distillery (waste water), conservation, and Sustainable Urban Drainage (SUDS) ponds. Sustainable Urban Drainage (SUDS) ponds are designed to treat stormwater pollutants, attenuate runoff, and promote biodiversity and amenity wherever possible [4]. SUDS features mimic ecological systems as well as creating space for biodiversity to flourish.
1.2. Natural (Natural Origin) Ponds
Natural ponds are ecological features which may exist naturally in depressions or glacial features such as kettle holes [5], or adjacent to flood plains [6]. Natural ponds may be filled by an underground spring or with rainfall, and in this paper they are regarded as ‘reference’ conditions because they ideally have minimal human disturbance. However, it is recognised that natural ponds in or near urban areas are influenced by enhanced runoff as a consequence of urbanisation.
1.3. Multiple Benefits Approach
Blue Green infrastructure (including SUDS [7]), is designed with water quality (treatment) and water quantity (flood risk management) principles; as well as incorporating biodiversity and amenity to a lesser extent. Construction Industry Research and Information Association (CIRIA) [4] describe the multiple benefits from SUDS as having opportunities, in addition to the main design functions, which enhance local health and wellbeing through optimising green spaces. Designing for multiple benefits incorporates functions which provide sustainable conditions within the urban environment [8]. The role of SUDS facilitates this process through ingenious design and engineering while making efficient use of parks and urban areas for health and well-being in addition to the main functions of SUDS.
Incorporating multiple benefits within planning will support best practice in designing new developments. Well-designed SUDS ponds provide the basic water quality and quantity demands, as well as a suitable habitat for wildlife, while offering education opportunities and a place for meditation and relaxation. Within the context of multiple benefits, it is therefore important to look at opportunities provided by SUDS ponds, and compare these with natural ponds to see how the public view and value these benefits.
The multiple benefits of SUDS are routinely assessed with economic and spatial analysis. The Benefit of SUDS Tool (BeST) highlights the costs and benefits. Monetary valuation is a well-known and accepted method for evaluating the costs and benefits of a project, but using Whole Life Cost approaches has limitations too. For example, the cost benefit analysis is dependent on having accurate maintenance cost data (which is variable from site to site, e.g., [9,10]). Other approaches include Public Participatory Geographic Information Systems (PPGIS), which has been used to define the multiple benefits from SUDS by involving the local community in the assessment process [11]. The participatory approach is positive as it is important to involve local communities in the development and post-development phases; as the early interaction allows future residents to engage with the planning process, and then comment on the effectiveness of the SUDS once they have been constructed. However, spatial analysis using non-monetary valuation may introduce subjective bias when characterising the multiple benefits by use of qualitative design [12].
In this paper, Contingent Valuation was adopted to assess the multiple benefits associated with ponds in relation to habitat provision. Contingent valuation is usually used in local planning policy and provides respondents with a hypothetical scenario where they are asked to state their willingness to pay for an improvement to an environmental issue or programme [13] with an appropriate payment vehicle (e.g., taxation, annual or monthly payments). Contingent valuation is inexpensive, requires no market data, and is thus useful for decision making at a local scale [14] but there could be bias involved with some participants providing unrealistic (‘pleasing’) responses to valuation questions [15]. Furthermore, there may be issues with response and non-response bias which may produce unreliable surveys [13,15]. This is why it is important to compare the habitat benefits with costs in a Whole Life Cost (WLC) analysis as this validates the use of Contingent Valuation for planning policy and minimises some of the uncertainty associated with unrealistic responses [13]. Applying a multiple benefit approach is a useful way to quantify the benefits from ponds (as it captures the multiple benefits associated with habitat) in relation to the perceived value from habitat potential, and to investigate whether or not the benefits exceed the Capital (CAPEX) and Operation/maintenance (OPEX) costs for SUDS ponds. It is also important to assess the value of replacing a natural pond, and to see whether these current benefits (Net Present Value (NPV)) exceed future costs for a pond of a similar catchment size. Existing work quantifies and values the amenity [9,10,16] and biodiversity of ponds [16]. Other studies have monitored the biodiversity of SUDS ponds [17] and urban ponds [18,19]. However, the previous work has not placed a monetary value on the benefits from natural and artificial ponds in relation to habitat provision (as a multiple benefit), and hence this paper sets out to do this.
1.4. Current Research
The Contingent Valuation analysis is based on a survey which was undertaken to understand how the public perceive multiple benefits so that these principles may be incorporated into the future design of SUDS ponds. Studying urban ponds in a UK context is not new [17,18,19]. Urban pond research has historically played a fundamental role in developing planning policy and, with this in mind; the following questions guided the development of the research:
- What is the public perception of the potential benefits and disadvantages of living near a pond?
- How much value is placed on supporting habitat at their local pond (their Willingness to Pay for benefits), and are these values capable of offsetting costs?
2. Materials and Methods
Data collection, the design, and dissemination of surveys via the postal system and online to the survey areas are presented. Ponds within Edinburgh and the Lothians (UK) were chosen as these also formed the case studies for the doctoral field work between 2014 and 2016 (Table 1). Artificial ponds (including SUDS) and reference ponds (natural origins) were considered and the analysis section discusses the method of calculating the values from each individual in the survey, and the population values extracted from the statistical bulletin of the Census [20].
2.1. Postal Survey Format
Surveys focused on the multiple benefits of ponds within an ecosystem context. The reason for this was to highlight the existing gap in knowledge with respect to the management and delivery of the multiple benefits within the public domain, in relation to habitat provision.
The main focus was on the ecosystem benefits and underlying issues associated with living near a pond. Participants selected the benefits that they valued most and how much they were willing to pay to receive similar benefits elsewhere. The valuation was carried out using a matrix with multiple values for each assigned benefit [16,21,22]. This proved to be invaluable as it provided more detail with respect to the individual perceived benefits and provided some context for the respondents [21].
2.2. Postal Survey Pilot
The survey was tested on individuals living close to a pond. Furthermore, the survey was tested on a local resident and NHS development officer within Edinburgh. Comments were taken into consideration and minor revisions were made prior to the surveys being issued to the public. Some of the language was altered to make these surveys more accessible.
2.3. Survey Administration
Each survey area was assigned a code so that the returned surveys could be tracked and included a business reply envelope to encourage a higher response rate. Whilst attempts were made to retrieve surveys in areas with lower response rates, it is unethical to pester participants to return surveys [24]. Reminder slips with instructions to leave completed surveys in their local library were the chosen solution for this. A potential problem with this approach is that a participant may provide more than one response, which results in multiple responses from the participant and yields unrealistic data in the results. In addition, all of the libraries in the survey areas were contacted and library staff arranged sessions where the research could be explained, and surveys were handed out where appropriate. Views and comments from the public at these sessions were welcomed and provided some invaluable feedback. Engagement at morning library classes was useful as some parents with young children completed the survey online during the morning session.
2.4. Development of an Online Survey
The online survey encouraged more participation from areas with a lower response rate by targeting local libraries and community centres (where access was permitted). Participants were asked to select their nearest pond (within walking distance). This approach was facilitated through social media and contacting local council representatives. Social media included local nature and conservation groups; as well as university and schools near the chosen ponds. Over 100 people were contacted by email or telephone to encourage wider participation in the survey. A map was included in social media adverts to allow participants to identify their closest pond more easily.
2.5. Post-Processing
Postal survey responses were integrated into the online survey sites (E-Survey) for comparability reasons, and to ensure that all survey responses were processed in the same way. Critically, the main section of benefit valuation remained the same. Comments from respondents were added, and these related to questions where an additional benefit was possible; for example are there other habitat benefits available at your local pond?
Within this paper, the survey responses are compiled for each individual assessing their willingness to pay for the multiple benefits pertaining to habitat provision, and these include sustaining suitable habitat conditions for: birds, fish, macroinvertebrates, macrophytes (plants), and mammals. The individual ponds are considered, too, to see if there are clear differences in the way that the public perceive artificial (including SUDS) ponds when compared with reference ponds (ponds with natural origins). As suggested in the literature, the valuation of the ponds was based on annual or monthly payments [25].
2.6. Analytical Techniques
Economic values were calculated by summing the values associated with each benefit type. Values ranged from £0 to >£25 (with a selection of £0, £1, £2, £5, £10, £15, £25 and >£25) as a monthly payment, as supported by [16]. The values were sorted into tables with the habitat provision benefits. To prevent the risk of double counting, whole life cost [26] was implemented to add more certainty to the contingent valuation estimates. It should be noted that only the multiple benefits are calculated but there is associated uncertainty as willingness to pay may be influenced by protest zeros [13] which may be in relation to maintenance issues [16,26].
Capital and maintenance costs were calculated according to surface area and pond volume, as suggested by the United Kingdom Water Industry Research, cited in [27]. Whole life maintenance costs were calculated using a discount rate of 3.5% for the first 30 years, and 3% for the remaining 20 years, as recommended by the HM Treasury Green book for projects of 30–50 years [28], and supported by other studies [16]. This was to investigate whether current benefits outweigh the replacement and maintenance costs for ponds.
Address-based information was acquired from the 2011 Census relating to the number of residents within close proximity to the pond (assumed by a 500 m radius from each pond). This process was facilitated by e-spatial [29], which produces maps for user defined places or postcodes. The street names were then noted and the corresponding postcodes were found. The address source data were then analysed using the Census bulletin [20] to investigate the total population living within a 500 m radius for each pond. This is consistent with a previous study which used a walking distance of 5 min, which is approximated by field evaluation [16]. Furthermore, the Scottish Index of Multiple Deprivation (SIMD) [30] was consulted to place values into a meaningful social context: where a decile score of 1 is most deprived and 10 is least deprived.
3. Results
Of the 810 door-to-door (postal) surveys issued, 144 were returned with completed responses (an additional two were returned uncompleted). The response rate of 17.5% was calculated using guidelines from the American Association for Public Opinion Research (AAPOR) [31], and this was lower than [16] (27%) but exceeded other surveys, such as [11] (8%). It is in line (17%) with an urban flooding Contingent Valuation study [32]. Furthermore, the online survey added a further 140 responses with a completion rate of 84% (n = 238).
The data were all collated to include responses from both modes of the survey (see Supplementary Materials). Some questions have lower responses than others, but from 282 responses, 83% (n = 233) were assigned a value, including zero, for willingness to pay for habitat provision, which was the main focus of this paper. The data presented include location of each respondent (in terms of their closest pond), factors influencing their choice of home, and the perceived benefits and disadvantages associated with living next to a pond.
3.1. Perceptions of Ponds and Characteristics Influencing Choice of Home
Blackford pond has the highest number of survey responses (n = 94, Figure 1), and more than double the responses of Goreglen (n = 37), which may be due to the attraction of the local nature reserve as the pond has an abundance of water birds and insects in spring and summer. Juniper Green and the Royal Botanic gardens have the same number of responses. Juniper Green has the greatest number of responses from the SUDS ponds chosen, with the least recorded at the Livingston ponds. The responses for some areas are relatively modest in number and, as such, may not produce results which are statistically significant. However, the total number of responses may be sufficient to draw conclusions and support comparisons with other studies.
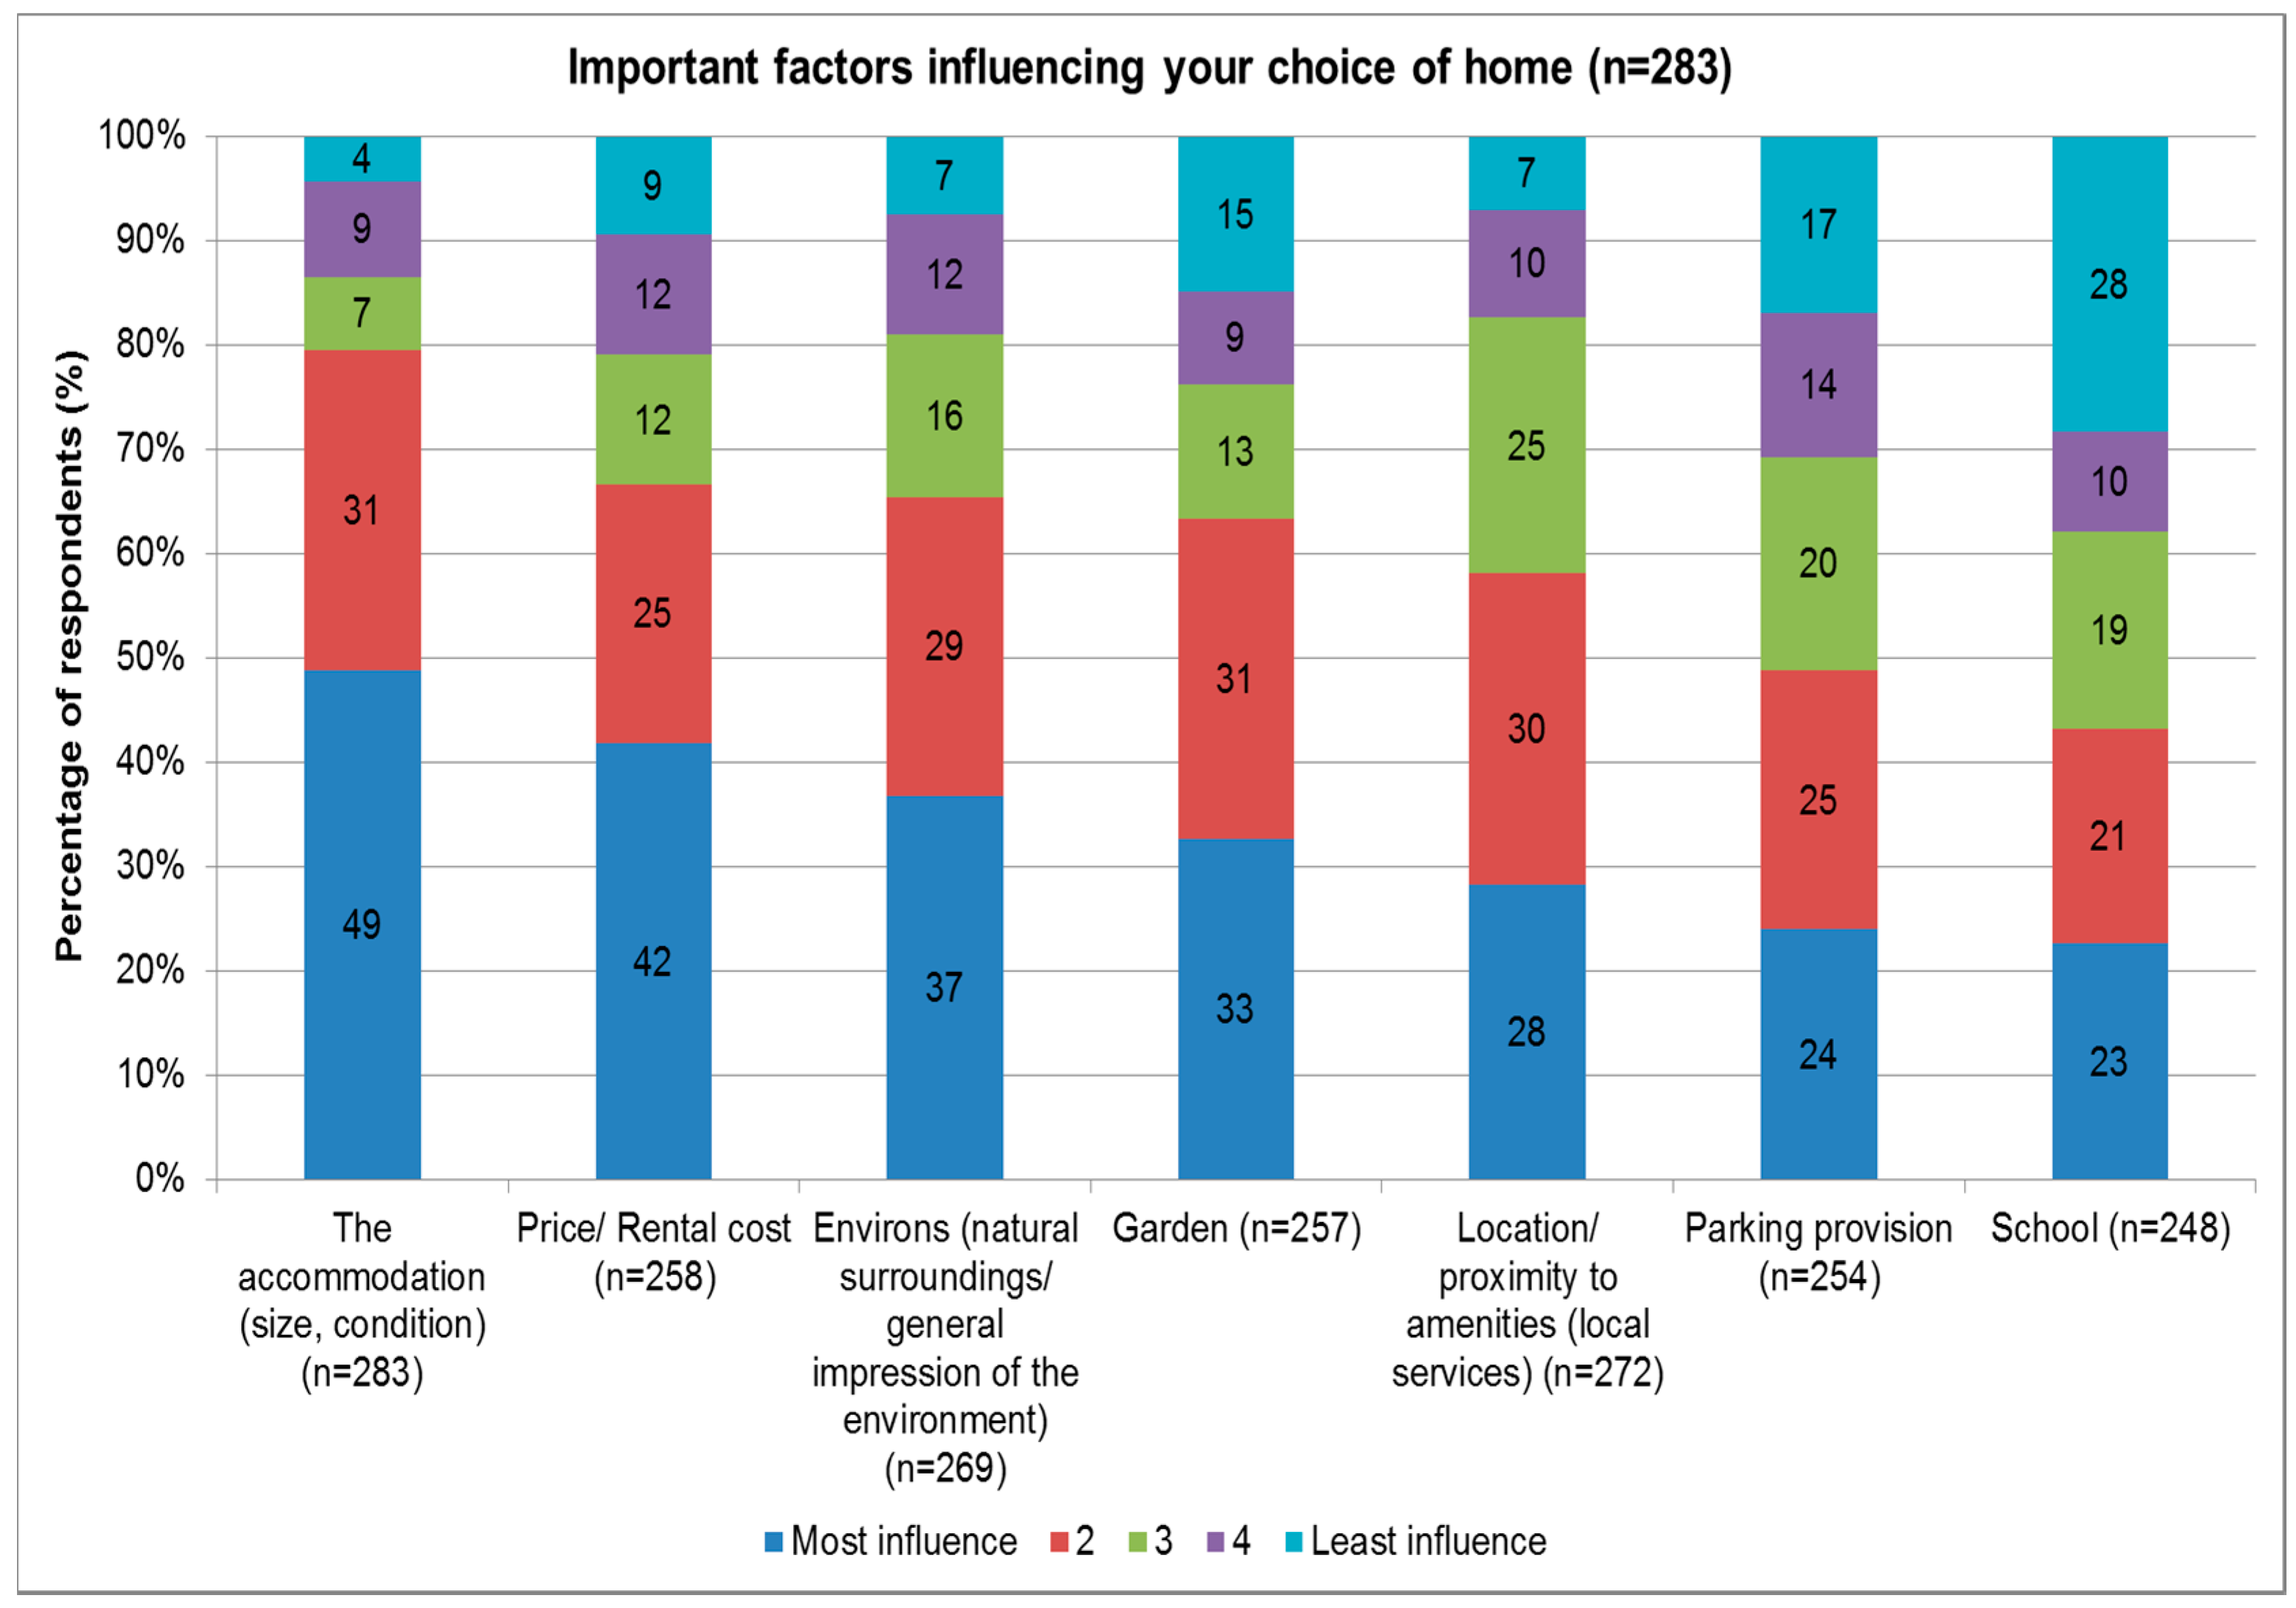
Respondents rated factors which influenced their decision to move (1 = most important and 5 = least important) to their current home. A total of 80% stated that the accommodation size and condition influenced their decision to move to their home by giving it a score of 1 or 2 (Figure 2). A total of 66% viewed their natural environment and surroundings as an important factor—which may be related to choosing to live near open spaces and ponds. Price and rental cost was also important, with 67% citing this as the main reason they chose their current home. The least popular decision for choosing their current home was the nearby schools. Participants were able to choose more than 1 factor—as some did regard two or three factors of similar importance. The survey highlighted that over 90% of residents stated the pond was in place prior to moving to the area.
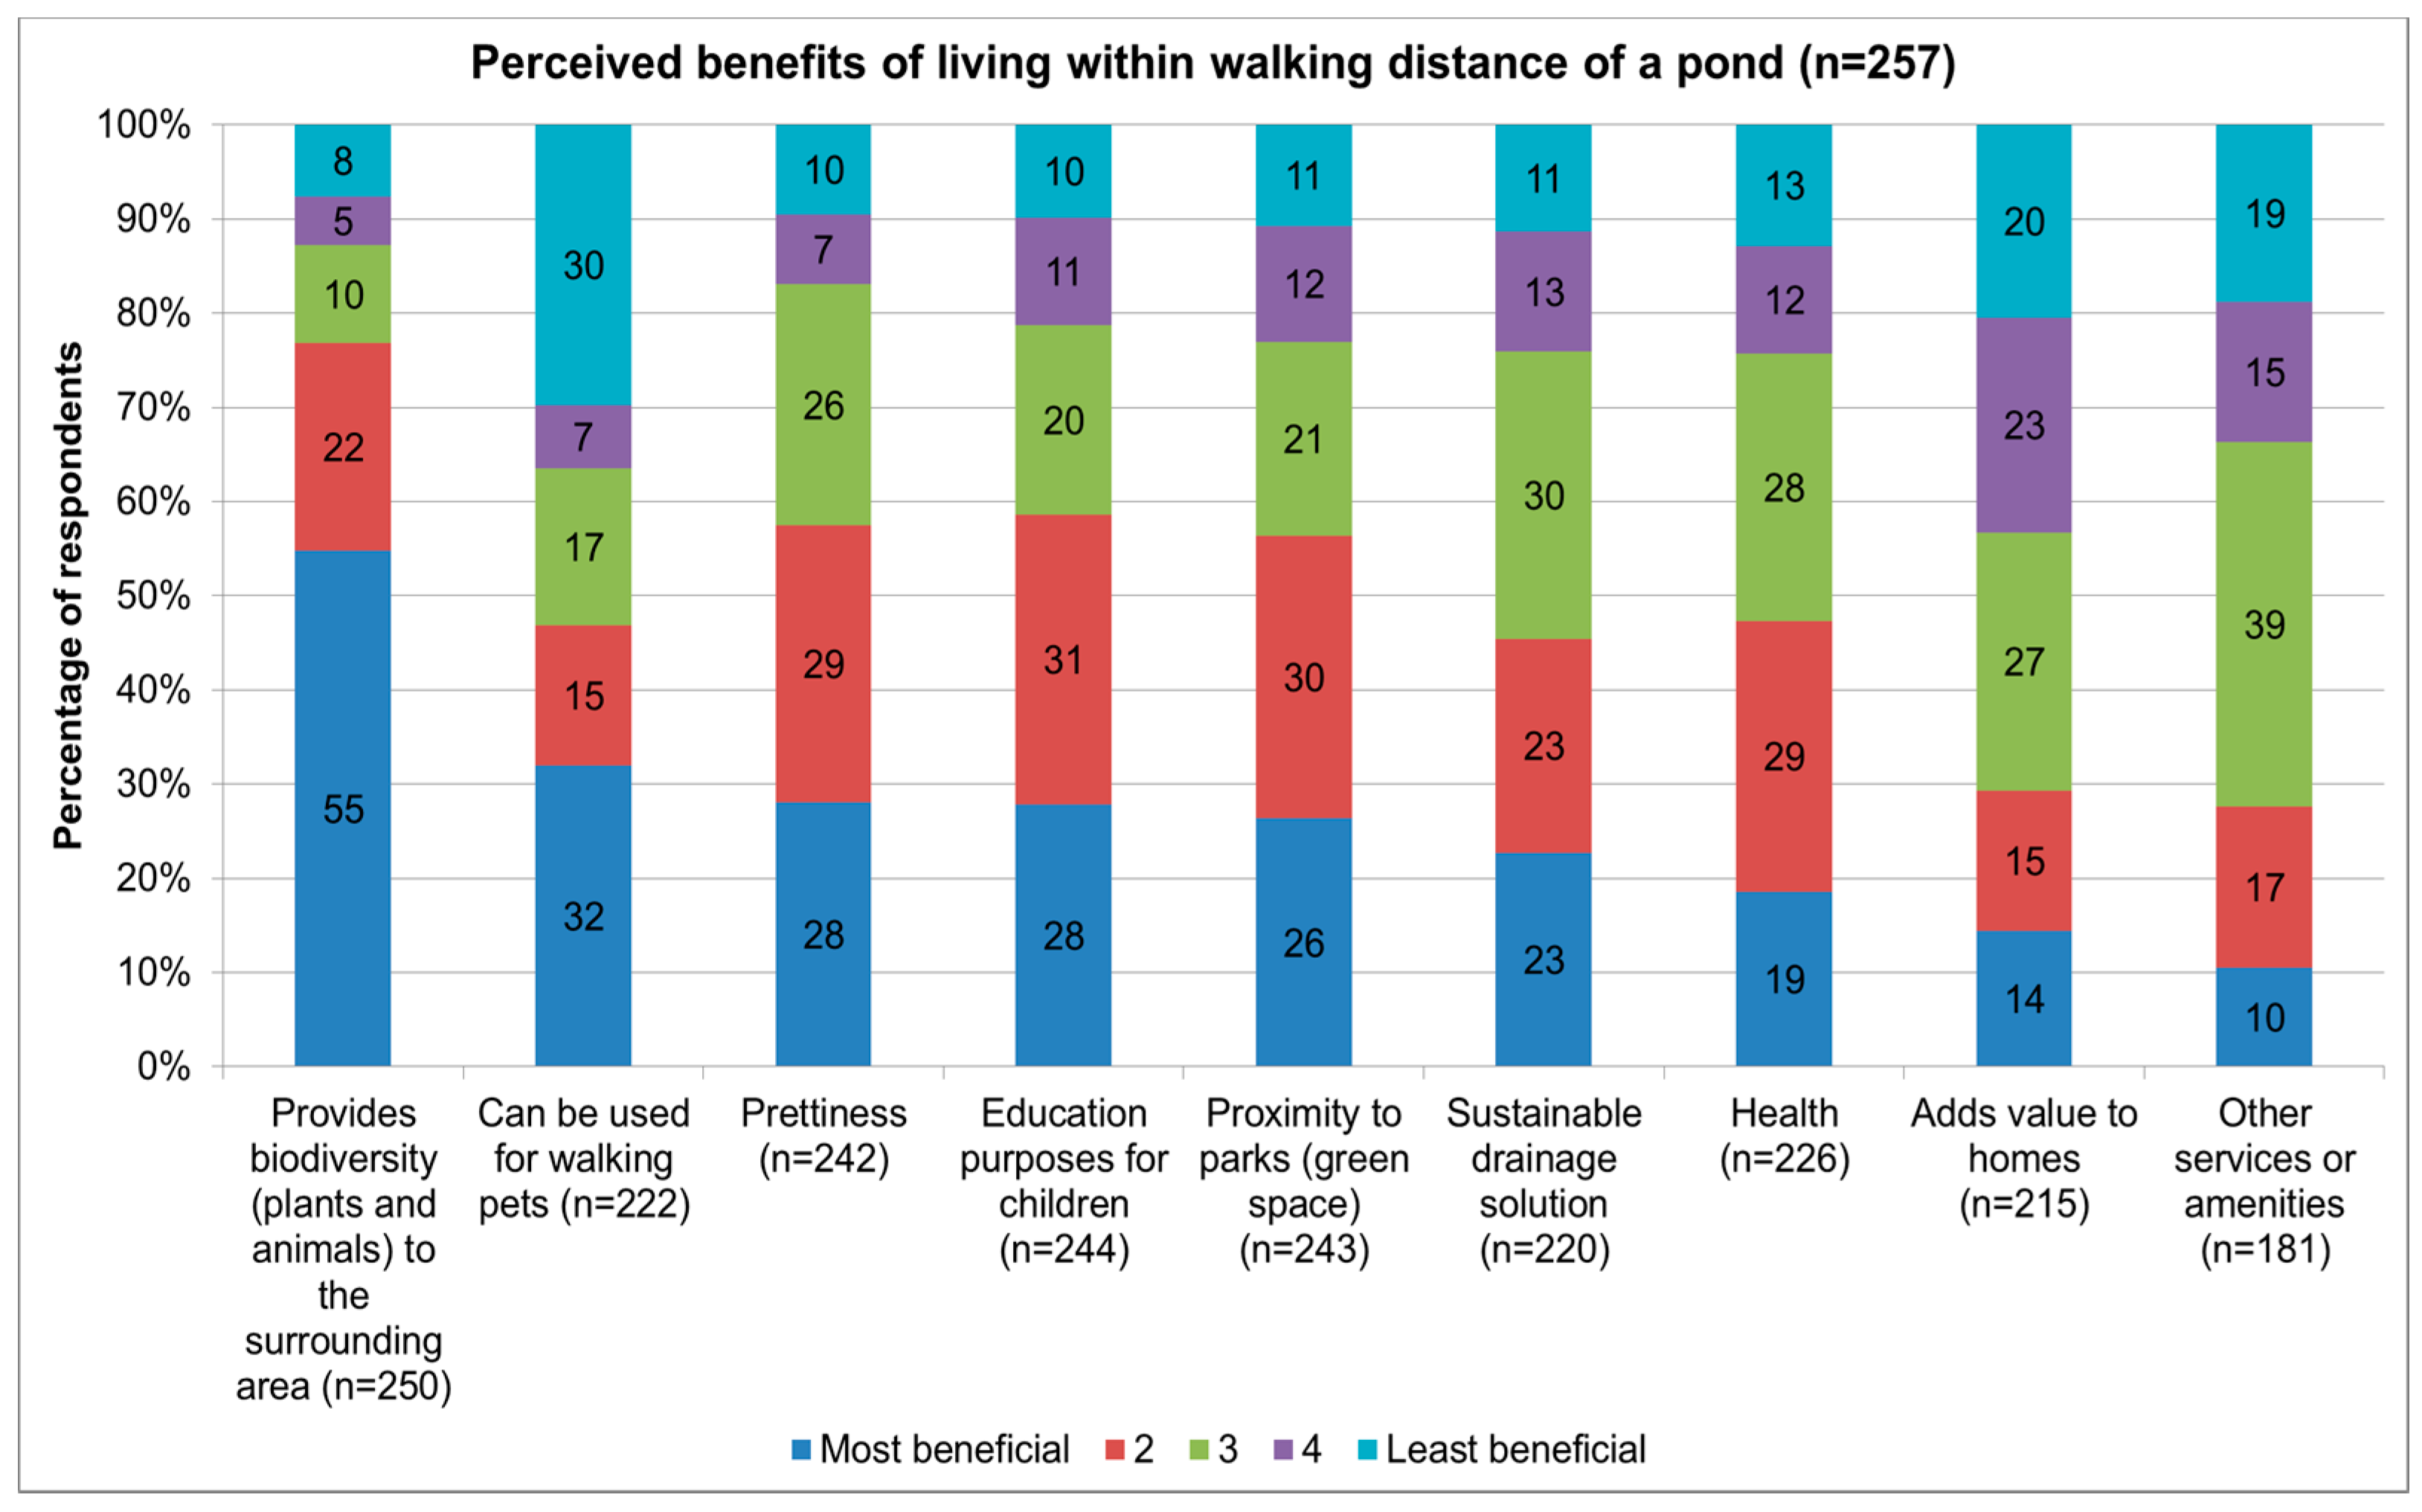
The perceived benefits of living within a short walking distance (500 m) include the provision of biodiversity, with 77% rating it as highly beneficial (Figure 3, n = 257). Pet walking was viewed by 32% as most beneficial, with an additional 32% of respondents viewing it of benefit with a score of two or three. Aesthetics is viewed as most beneficial by 28%, with a further 31% viewing it as of secondary importance. Education purposes for children are viewed as most beneficial by 28% of respondents, with 30% viewing this benefit as the second most important.
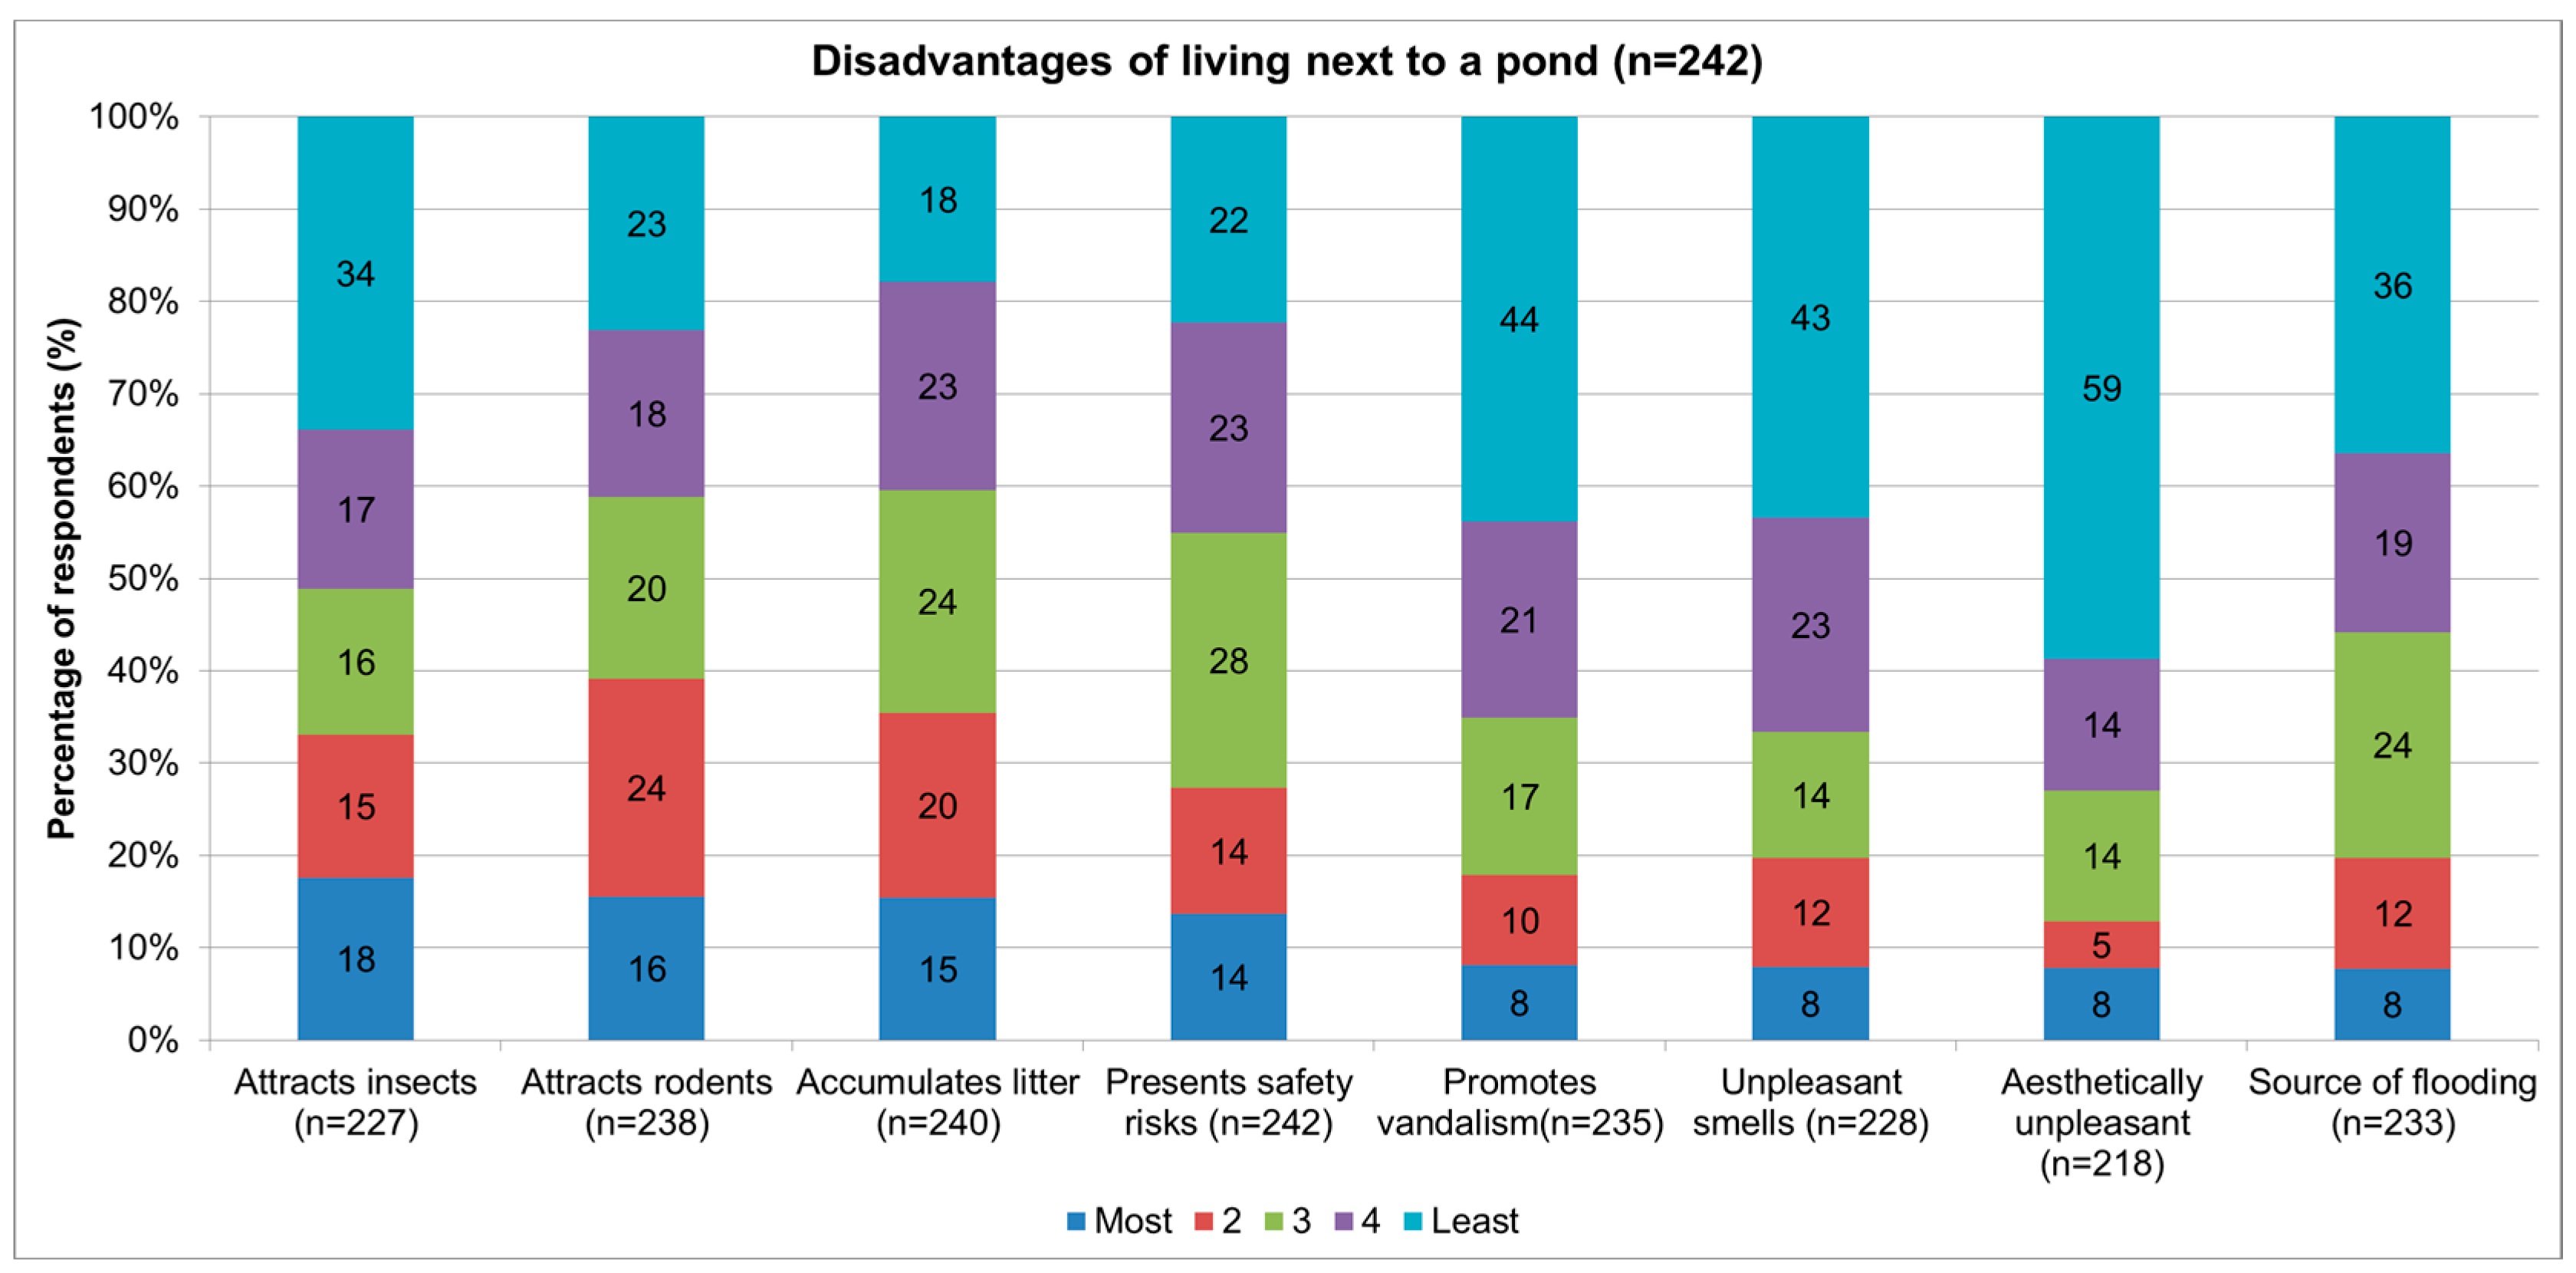
The perceived disadvantages (Figure 4) of living within a short walking distance from a pond include, attracts insects, with 18% of respondents viewing this as more of a disadvantage than rodents (16%). Safety risks were viewed as a similar disadvantage (14%) as that associated with litter (15%).
3.2. Safety Concerns
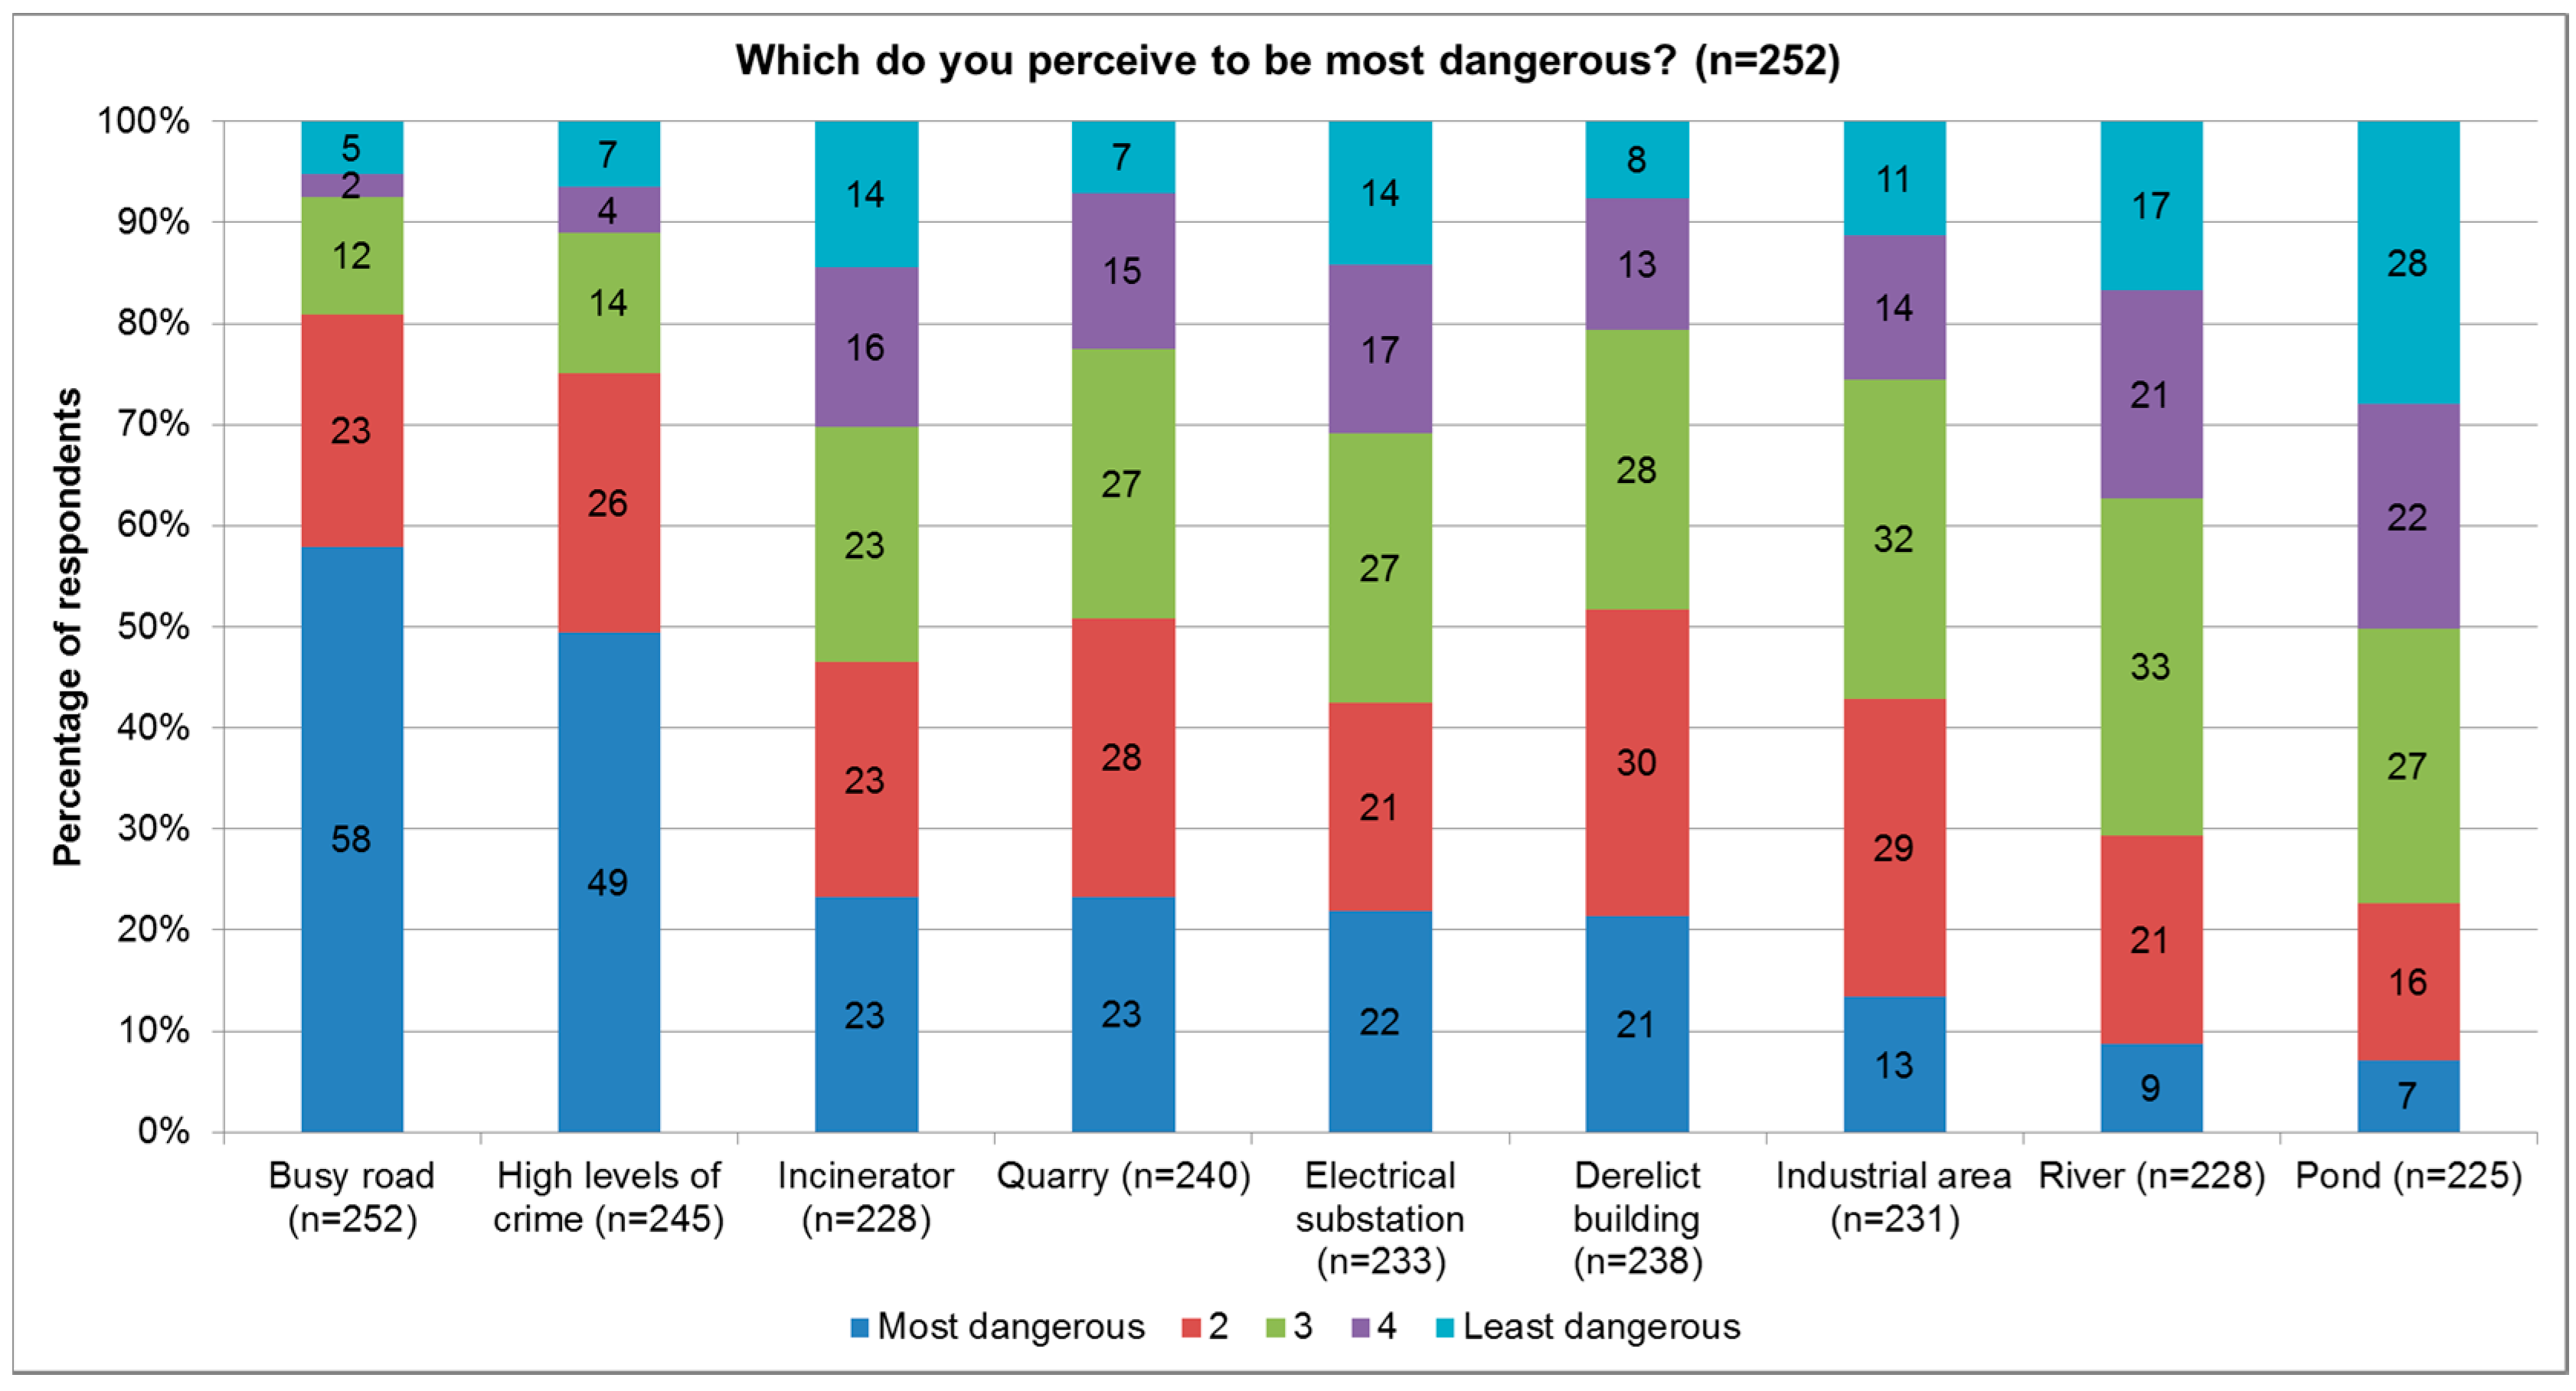
Safety of the area is the most important factor when choosing a neighbourhood to live, especially for those with families (Figure 5, n = 67). Open space is another factor with high importance, which relates to the importance of SUDS greenery and, providing safe, open, spaces for children to play in. Low crime rates are another important factor which is re-emphasised by high levels of crime being the second highest perceived danger (Figure 6).
The lowest perceived dangers in both modes of survey were ponds and rivers, with each having less than 10% of first preferences. Busy roads were the highest perceived danger, with 58% of the sample population having significant concerns about busy roads, which also relates to the importance of safety in a neighbourhood and having park environments with open spaces nearby [16].
3.3. Biodiversity and Observations of Fauna and Flora at Their Local Pond
In total, 63% of the respondents from the survey answered the question on biodiversity (n = 177) and observed that their local pond provided a habitat. However, there were more responses for the questions about fauna (n = 228, 81%) and flora (n = 203, 72%), with only one survey response stating that they were not clear what “biodiversity” meant.
In terms of SUDS ponds, the water birds (ducks, n = 35, swans, n = 24) and frogs (n = 23) were observed more frequently than water bugs (n = 15), small fish (n = 9) and newts (n = 4). Inverleith also observed frogs (n = 6), water birds (ducks, n = 15, swans, n = 11) with water bugs (n = 7). However, the participants near ponds with natural origins observed water birds (ducks, n = 81, swans, n = 72), frogs (n = 70) and water bugs (n = 62) more often. Both groups identified small fish, with Granton (n = 4) and Blackford (n = 15) having the highest number of observations. Additional observations for fauna included heron, geese, water hens and coots, rats, grebes, tern, damsel flies, dragonflies and eels. Some participants also commented on issues at their local pond such as “rats were eating bird eggs” and birds being fed bread encouraged more pests. One participant said that they had never seen any wildlife at their local pond in reference to Goreglen.
Bulrushes and sedge were observed by residents near SUDS (bulrush n = 19, sedge, n = 8) and reference ponds (natural origins, bulrush n = 28, sedge n = 8) and by those near Inverleith (bulrush n = 6, sedge n = 3). Bog bean was observed in the fewest ponds. Other flora that was observed included mint, iris, pond and duck weed. In addition to this, herbs and an array of wild flowers (thistles, forget me not, and daisies) were identified. A few respondents were not sure of the plants in their local pond, and stated: “(I am) aware, but not sure of plant type and unsure of their names”, “not noticed” and “sorry I am not good at plants”. Conversely, two responses stated that their pond was rich in flora with “A HUGE number of species, wildflowers, trees, ferns” and “loads of others (park setting)”.
3.4. Value for Supporting Habitat
Before evaluating whether habitat benefits will offset CAPEX and OPEX costs for SUDS ponds, it is important to consider each benefit individually. An additional part of the analysis was to present the findings of the Contingent Valuation analysis in relation to the number of residents within a 500 m radius of the pond, which is approximately a 5 min walk from their home and aligns with a previous amenity study for ponds [16].
The values for Willingness to Pay (per person) for habitat benefits are highlighted in Table 2. For SUDS ponds, Granton has the lowest value with £2.58 (n = 19) on a monthly basis per person, and Eliburn has the highest value of £25 per person (but is disproportionate due to a small sample size, n = 2). Oxgangs has the second highest valuation of £14.48 per person (n = 23). The Royal Botanic gardens pond has a value of £15 (n = 21), and Blackford has a value of £12.21 (n = 78). Blackford has a rich biodiversity of plants (sedges, purple loosestrife, reeds and rushes, and a variety of small flowering plants) and fauna (water birds, water bugs and larvae, small fish and amphibians). Goreglen had the lowest valuation for the ponds with natural origins with a value of £9.23 (n = 22) per person.
Pond characteristics may influence the perceived value from the residents living within a close proximity. For example, Granton pond is located in a park which is further from housing than Blackford pond. Goreglen pond is located in woodland which is further from housing than other survey sites chosen for this analysis. In addition to this, the woodland pond has a covering of duckweed and poor diversity—no water birds and very few species of invertebrates.
In relation to SIMD, Oxgangs has the highest level of housing deprivation (1) compared with Blackford and Inverleith with a decile score of 8 or 9 [30] (Table 1).
Table 3 outlines the number of households, and the total population, within a 500 m radius from each pond. Some surveys had lower populations, for example the postcodes near the ponds in Livingston and Goreglen. Granton pond and Oxgangs ponds are located near high density residential areas, with flats and semi-detached houses. Oxgangs has the highest contingent valuation, in relation to the total population, for SUDS and pond with natural origins with a monthly total of £54,966 (annual £659,593), and Granton has the lowest valuation for SUDS ponds with £5973 (annual £71,672). Goreglen has the lowest valuation for all ponds with a monthly total of £360 (£4320).
3.5. Offsetting Replacement Costs
The capital costs (CAPEX) are calculated according to surface area and pond volume [27,28]. In addition to capital costs, maintenance costs (OPEX) were calculated for each pond using the recommended 3.5%, followed by 20 years at 3%, discount when calculating Net Present Value (NPV) for projects with a life of 30–50 years. Table 4 highlights that benefits outweigh the costs for Juniper Green, Oxgangs, and Eliburn. The calculated costs at Granton pond outweigh the benefits due to the size of the pond catchment and the same may be true for Inverleith—as both of the ponds have larger surface areas, and the value placed on habitat is lower in relation to the population. This may also be because the ponds are artificial and perhaps the presence of litter and pollution detracts from the value. Blackford and Royal Botanic Gardens ponds exceed the replacement cost for a new pond with a similar surface area, but this is not the case for Goreglen. This may be because Goreglen is isolated and covered in duckweed—which makes it less attractive to value—with a poor habitat.
4. Discussion
Detailed environmental assessments should be carried out within a multiple benefits context prior to planning and developing homes [8], as this would encourage developers and local authorities to work closer with ecologists and engineers to optimise the multiple benefits from ponds. This is important because of the increasing need to co-design housing developments.
4.1. Public Perception
Biodiversity is of high importance when considering the benefits of living within walking distance to a pond. This result is in line with previous studies where biodiversity benefits were of high regard from the public [10,16]. The habitat potential is enhanced where a well-maintained pond is found; for example Juniper Green and Blackford ponds.
Safety is less of a concern now than in previous studies [16,23] but as expected this remains a concern for those respondents with families (Figure 5). Insects, rodents and litter are the greatest perceived disadvantages, which is to be expected if poor maintenance takes place. Crime is another factor of concern to residents (especially vandalism). This issue may be magnified in sparsely populated [33] or less affluent areas with the increased chance of anti-social behaviour due to boredom or inadequate facilities. [34] The area near Goreglen pond has a decile score of 4 for multiple deprivation (Table 1) which could be attributed to the remote location making it difficult to access education and employment opportunities (with respective scores of 2 and 4). Crime for this area is less deprived, with a score of 9, which contrasts with other areas such as Granton and Oxgangs with a decile score of 1 for crime.
4.2. Valuation Discussion
Goreglen has the lowest monthly valuation per person for the reference ponds (£9.23), and Royal Botanic Gardens has the highest (£15). However, the SUDS ponds have values of up to £24.50 per person, which is similar to the results from a previous amenity study [16]—with the exception that Granton has a lower perceived value than suggested previously. This is, however, a true reflection of the high density areas in Granton and Oxgangs with council and privately owned flats; as accessibility to green spaces is limited in high density areas [8]. It may also be in relation to the SIMD, as Granton has a decile score of 2 for housing—which indicates deprivation from overcrowding or poor quality housing [30]. In addition to this, the latest SIMD revealed that the surrounding areas (within a 500 m radius) had low scores for crime and employment deprivation—which may suggest that this area has a high level of crime and many are unable to work or are unemployed.
Previous Contingent Valuation studies have lower reported estimates for Willingness to Pay (WTP) [16,21]. One study [16] suggested that those with higher incomes are more likely to pay more for benefits relating to SUDS. However, they also acknowledge that lower income groups may be likely to pay more due to socio-economic factors; such as less deprived students living near the SUDS of concern, or retired residents with life time investments and savings. In this paper, the highest willingness to pay is from a more deprived area in terms of housing, income, and employment; which may be subjected to some criticism from associated bias, for example valuing the habitat benefits at a higher value than they can reasonably afford [13,15]. Table 1 revealed that Oxgangs and Granton have the lowest decile score in terms of deprivation; as the deprivation is ranked 1 to 10 (where 1 is the lowest possible score) which suggests there may be some respondent bias [13] at Oxgangs pond. The respondent bias could be in relation to perception of wealth or forecasted estimates of affordability [21]. However, in the case of [21], this was discussed in relation to the demography of the community within Hong Kong, with a densely-populated city, whereas Edinburgh is smaller and is surrounded by blue green infrastructure. Furthermore, the willingness to pay for habitat benefits could be in relation to the perception that living within walking distance to a pond, and nearby green areas, provides better social conditions (for example health benefits, [8]). This supports previous work (e.g., [11,16]) where biodiversity was favoured at well-maintained ponds, and provision of suitable open space is part of this argument.
From whole life cost (NPV) calculations of benefits and costs (Table 4), it is apparent that the communities of Juniper Green and Oxgangs appreciate living close to a pond. The benefits outweigh the costs for these ponds, and it should be noted that Oxgangs has the highest perceived benefits during the project life (50 years) with a total of £15,836,096. For the Royal Botanic Gardens pond, the total benefits (£9,991,540) acquired over a 50 year time-scale would exceed the initial outlay for a pond of a similar size. Values are calculated assuming that these ponds may need to be replaced in the future or adapted to suit current legislative requirements (WFD, [2]), without compromising on the ecology and natural functionality of the ponds. However, as stated previously, there are uncertainties with the data, as a true value from contingent valuation is difficult to estimate [13,15]. Furthermore, using whole life cost is difficult if (up to date) maintenance data are not available [9,10,26], and if ponds are not perceived as well-maintained by the public. Future studies may implement BeST which has the potential to override some of the issues relating to uncertainty—as over stated values [15], and protest zeros [13] reduce the reliability of assessing multiple benefits in an economic context. Despite, the limitations of the approach, the data could be beneficial for the future design of SUDS ponds, and if new ponds are formed to replace or restore former natural ponds.
5. Conclusions
Ponds offer multiple benefits and from the results of this paper, it is possible to draw the following conclusions with reference to the key questions: (1) What is the public perception of the potential benefits, and disadvantages of living near a pond?; (2) How much value is placed on supporting habitat at their local pond (Willingness to Pay for habitat provision benefits), and are these values capable of offsetting costs?
Public perceived biodiversity, an area for walking pets and being close to parks (green spaces) are three benefits of living within a close (walking) distance to a pond. This is similar to other studies where biodiversity was an important component of SUDS ponds [10,16], and of natural ponds [16], and was regarded as being of high importance to the public. The disadvantages of living next to a pond include insects, rodents, and litter. Whilst biodiversity is cited as the greatest advantage to living within walking distance to a pond, some of the public perceive insects as being a disadvantage too—for example, midges and wasps in summer months may be nuisances. Safety is still regarded as important but is less of a concern than previously considered [16,23].
Pond benefits for three of the five artificial ponds (Oxgangs, Eliburn, and Juniper Green) exceed the construction and maintenance costs. However, the Eliburn sample (n = 2) is too small to determine how accurate this result is. For Oxgangs and Juniper Green, it is evident that the communities appreciate their local pond (typically for those living within a short walking distance). Oxgangs has more deprivation in terms of employment than at Juniper Green. Although the community is deprived, they seem to value nature and the multiple benefits of the pond. However, there is recognition that the values may be skewed. The pond at Juniper Green is valued highly by the population living there, as the pond provides amenity for home owners overlooking the pond.
In terms of natural ponds, with the exception of Goreglen, the benefits outweighed the replacement costs for a pond of a similar size. The pond at Goreglen is isolated in a forest and covered in duckweed which reduces the value placed of this pond. Blackford and the Royal Botanic Gardens have higher perceived monetary value which is due to the aesthetics and setting of these ponds, as both are set in managed environments with an abundance of wildlife and wildflowers in the surrounding gardens. Furthermore, both of these areas have high decile scores for employment and education, which could influence their willingness to pay for habitat benefits. Moving forward, the recommendation of this paper is that maintenance data for SUDS ponds should be made available for planning purposes (prior to development) and for monitoring the multiple benefits provided by ponds, thereby enabling a better assessment of whole life costs.
Supplementary Materials
The following are available online at www.mdpi.com/2073-4441/9/2/128/s1. Attached in an excel spreadsheet. Further details may be provided through email communication.
Acknowledgments
This research was funded by an EPSRC doctoral training award (EP/K502844/1). Special acknowledgements are made to OLTRA (residents association at Oxgangs) and the Royal Botanic Gardens, Edinburgh, for support and guidance with the survey. Additional assistance was sought from David Watkins (EGIS) in sourcing the address point data from the Census, and was received gratefully.
Author Contributions
Joy Jarvie carried out the survey research as part of her doctoral project, and designed and processed the survey. Scott Arthur and Lindsay Beevers were very supportive in editing and designing the survey; as well as editing the manuscript prior to submission. Scott Arthur also helped with the analysis of the data by providing guidance on Net Present Value and Whole Life Cost analysis.
Conflicts of Interest
The authors declare no conflict of interest.
Appendix A

Table A1.
Outlining costs for Whole Life Cost (WLC) analysis (based on UK Water Industry Research (UKWIR) 2005 & cited in [16,27]). Costs are grouped together for barrier vegetation, aquatic vegetation and Desilting (which includes silt mobilisation and removal) OPEX outlines the total cost for operation and maintenance during the project life (50 years).
| Pond | Inspection | Litter/Debris | Grass | Barrier Vegetation | Aquatic Vegetation | Desilting | OPEX |
|---|---|---|---|---|---|---|---|
| Juniper | £7203 | £219 | £0 | £3284 | £14,871 | £27,421 | £52,998 |
| Granton | £7203 | £10,948 | £21,320 | £164,221 | £743,556 | £672,464 | £1,619,712 |
| Eliburn | £7203 | £1528 | £2976 | £22,912 | £103,773 | £94,749 | £233,140 |
| Oxgangs | £7203 | £7389 | £14,389 | £110,835 | £501,839 | £459,938 | £1,101,592 |
| Inverleith | £7203 | £39,736 | £77,381 | £596,039 | £2,698,337 | £2,391,526 | £5,810,221 |
| Blackford | £7203 | £12,316 | £23,985 | £184,748 | £836,501 | £901,280 | £1,966,033 |
| Goreglen | £7203 | £456 | £888 | £6843 | £282,551 | £267,133 | £565,074 |
| Royal Botanics | £7203 | £4160 | £8102 | £62,404 | £30,982 | £45,944 | £158,794 |
References
- Biggs, J.; Williams, P.; Whitfield, M.; Nicolet, P.; Weatherby, A. 15 years of pond assessment in Britain: Results and lessons learned from the work of Pond Conservation. Aquat. Conserv. 2005, 15, 693–714. [Google Scholar] [CrossRef]
- Hill, M.J.; Ryves, D.B.; Wood, P.J. Macroinvertebrate diversity in urban and rural ponds: Implications for freshwater biodiversity conservation. Biol. Conserv. 2016, 201, 50–59. [Google Scholar] [CrossRef]
- Hassall, C.; Hill, M.; Gledhill, D.; Biggs, J. The ecology and management of urban pondscapes. In Urban Landscape Ecology: Science, Policy and Practice; Francis, R., Millington, J.D.A., Chadwick, M.A., Eds.; Routledge: Abingdon, UK, 2016. [Google Scholar]
- Construction Industry Research and Information Association (CIRIA). Construction Industry Research and Information Association (CIRIA). The philosophy of SuDS. In The SUDS Manual; Woods Ballard, B., Wilson, S., Udale-Clarke, H., Ilman, S., Scott, T., Ashley, R., Kellagher, R., Eds.; CIRIA: London, UK, 2015; Chapter 1. [Google Scholar]
- Lehsten, D.; von Asmuth, J.R.; Kleyer, M. Simulation of Water Level Fluctuations in Kettle Holes Using a Time Series Model. Wetlands 2011, 31, 511–520. [Google Scholar] [CrossRef]
- Williams, P.; Whitfield, M.; Biggs, J. How can we make new ponds biodiverse? A case study monitored over 7 years. Hydrobiologia 2008, 597, 137–148. [Google Scholar] [CrossRef]
- Lawson, E.; Thorne, C.; Wright, N.; Fenner, R.; Arthur, S.; Lamond, J.; Kilsby, C.; Mant, J.; Smith, L.; Ahilan, S.; et al. Evaluating the multiple benefits of a Blue-Green Vision for urban surface water management. In Proceedings of the UDG Autumn Conference and Exhibition, Chester, UK, 4–6 November 2015.
- Wade, R.; McClean, N. Multiple Benefits of Green Infrastructure. In Water Resources in the Built Environment: Management Issues and Solutions, 1st ed.; Booth, C.A., Charlesworth, S.M., Eds.; John Wiley and Sons: Chichester, UK, 2014; Chapter 24. [Google Scholar]
- Wolf, D.F.; Duffy, A.M.; Heal, K.V. Whole Life Costs of Sustainable Urban Drainage Systems in Dunfermline, Scotland. In Proceedings of the ASCE International Low Impact Development Conference, Houston, TX, USA, 19–21 January 2015.
- Wolf, D.F.; Duffy, A.M.; Heal, K.V. Whole Life Costs and Benefits of Sustainable Urban Drainage Systems in Dunfermline, Scotland. 2014; in draft. [Google Scholar]
- Jose, R.; Wade, R.; Jefferies, C. Smart SUDS: Recognising the multiple-benefit potential of sustainable surface water management systems. Water Sci. Technol. 2015, 71, 245–251. [Google Scholar] [CrossRef] [PubMed]
- Kelemen, E.; García-Llorente, M.; Pataki, G.; Martín-López, B.; Gómez-Baggethun, E. Non-monetary techniques for the valuation of ecosystem service. In OpenNESS Ecosystem Services Reference Book; Potschin, M., Jax, K., Eds.; EC FP7 Grant Agreement No. 308428; 2014; Available online: www.opennessproject.eu/library/reference-book (accessed on 15 November 2016).
- Arrow, K.; Solow, R.; Portney, P.R.; Leamer, E.E.; Radner, R.; Schuman, H. Report of the NOAA Panel on Contingent Valuation. 1993. Available online: http://www.economia.unimib.it/DATA/moduli/7_6067/materiale/noaa%20report.pdf (accessed on 25 November 2016).
- Whitehead, J.C. Plausible responsiveness to scope in contingent valuation. Ecol. Econ. 2016, 128, 17–22. [Google Scholar] [CrossRef]
- Hausman, J. Contingent Valuation: From Dubious to Hopeless. J. Econ. Perspect. 2012, 26, 43–56. [Google Scholar] [CrossRef]
- Bastien, N.R.P.; Arthur, S.; McLoughlin, M.J. Valuing amenity: Public perceptions of sustainable drainage systems ponds. Water Environ. J. 2012, 26, 19–29. [Google Scholar] [CrossRef]
- Briers, R.A. Invertebrate Communities and Environmental Conditions in a Series of Urban Drainage Ponds in Eastern Scotland: Implications for Biodiversity and Conservation Value of SUDS. Clean Soil Air Water 2014, 42, 193–200. [Google Scholar] [CrossRef]
- Hassall, C. The ecology and biodiversity of urban ponds. WIREs Water 2014, 1, 187–206. [Google Scholar] [CrossRef]
- Hill, M.J.; Mathers, K.L.; Wood, P.J. The aquatic macroinvertebrate biodiversity of urban ponds in a medium-sized European town (Loughborough, UK). Hydrobiologia 2015, 760, 225–238. [Google Scholar] [CrossRef] [Green Version]
- Scottish Government, Statistics Bulletin. Available online: http://www.scotlandscensus.gov.uk/statistical-bulletins (accessed on 22 September 2016).
- Chui, T.F.M.; Ngai, W.Y. Willingness to pay for sustainable drainage systems in a highly urbanised city: A contingent valuation study in Hong Kong. Water Environ. J. 2016, 30, 62–69. [Google Scholar] [CrossRef]
- Leggett, C.G.; Kleckner, N.S.; Boyle, K.J.; Duffield, J.W.; Mitchell, R.C. Social Desirability Bias in Contingent Valuation Surveys Administered Through In-Person Interviews. Land Econ. 2003, 79, 561–575. [Google Scholar] [CrossRef]
- Apostolaki, S. The Social Dimension of Stormwater Management Practices including Sustainable Urban Drainage Systems and River Management Options. Ph.D. Thesis, University of Abertay, Dundee, UK, 2006. [Google Scholar]
- Murdoch, M.; Baines Simon, A.; Anderson Polusny, M.; Bangerter, A.K.; Grill, J.P.; Noorbaloochi, S.; Partin, M.R. Impact of different privacy conditions and incentives on survey response rate, participant representativeness, and disclosure of sensitive information: A randomized controlled trial. BMC Med. Res. Methodol. 2014, 14, 90–100. [Google Scholar] [CrossRef] [PubMed]
- Verbic, M.; Slabe-Erker, R.; Klun, M. Contingent valuation of urban public space: A case study of Ljubljanica riverbanks. Land Use Policy 2016, 56, 58–67. [Google Scholar] [CrossRef]
- Duffy, A.; Jefferies, C.; Waddell, G.; Shanks, G.; Blackwood, D.J.; Watkins, A. A Cost Comparison of Traditional Drainage and SUDS. Water Sci. Technol. 2008, 57, 1451–1459. [Google Scholar] [CrossRef] [PubMed]
- Royal Haskoning: Costs and Benefits of Sustainable Drainage Systems (2012). Available online: https://www.theccc.org.uk/archive/aws/ASC/2012%20report/Royal%20Haskoning%20Costs%20and%20Benefit%20of%20SuDS%20Final%20Report.pdf (accessed on 15 October 2016).
- HM Treasury. The Green Book: Appraisal and Evaluation in Central Government. 2013. Available online: https://www.gov.uk/government/uploads/system/uploads/attachment_data/file/220541/green_book_complete.pdf (accessed on 19 October 2016). [Google Scholar]
- E-Spatial. Available online: https://www.espatial.com/ (accessed on 21 October 2016).
- Scottish Index of Multiple Deprivation (SIMD): 2016 Report. Available online: http://www.gov.scot/simd (accessed on 15 November 2016).
- American Association of Public Opinion Research: Response Rate Calculator. Available online: http://www.aapor.org/Education-Resources/For-Researchers/Poll-Survey-FAQ/Response-Rates-An-Overview.aspx (accessed on 10 September 2016).
- Owusu, S.; Wright, G.; Arthur, S. Public attitudes towards flooding and property-level flood protection measures. Nat. Hazards 2015, 77, 1963–1978. [Google Scholar] [CrossRef]
- Finlay, J.; Franke, T.; McKay, H.; Sims-Gould, J. Therapeutic landscapes and wellbeing in later life: Impacts of blue and green spaces for older adults. Health Place 2015, 34, 97–106. [Google Scholar] [CrossRef] [PubMed]
- Teedon, P.; Gillespie, M.; Lindsay, K.; Baker, K. Parental Perceptions of the Impacts the Built Environment Has on Young Children’s Health: A Qualitative Examination and Lay Assessment Amongst Residents in Four Scottish Communities. Health Place 2014, 28, 50–57. [Google Scholar] [CrossRef] [PubMed]
Figure 1.
Which pond is nearest to their home, numbers at the top of the column indicate the number of responses for that sample group, SUDS = Juniper Green, Oxgangs, Granton and 2 × Livingston ponds.
Figure 1.
Which pond is nearest to their home, numbers at the top of the column indicate the number of responses for that sample group, SUDS = Juniper Green, Oxgangs, Granton and 2 × Livingston ponds.
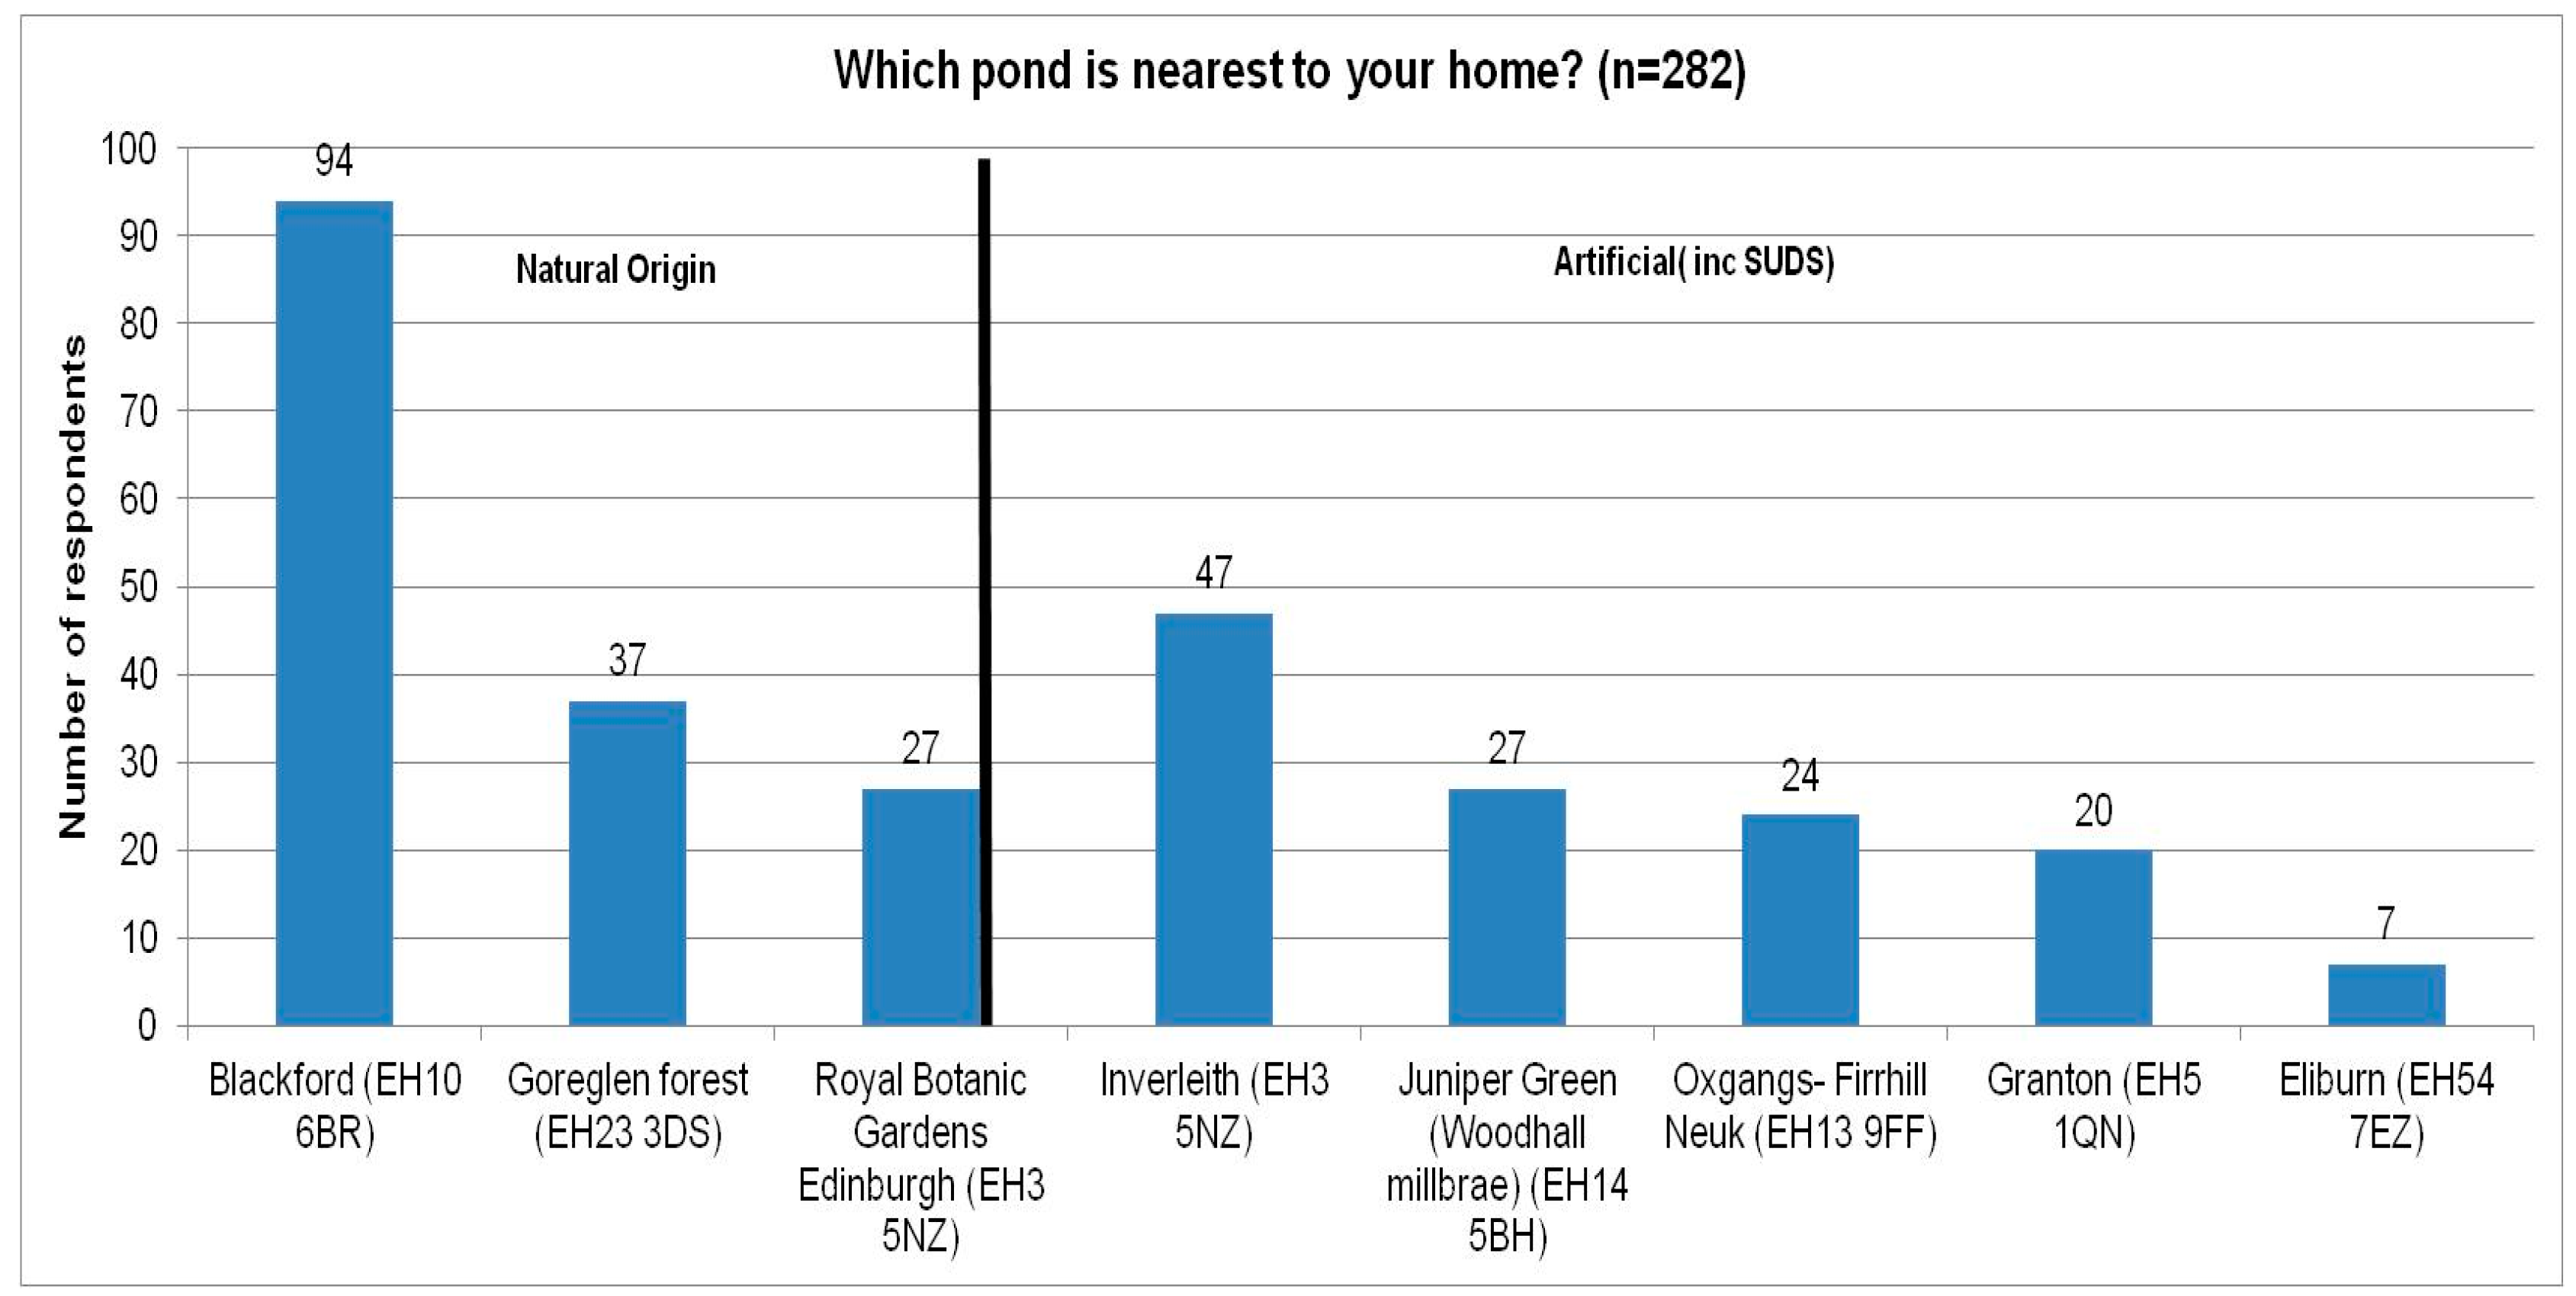
Figure 2.
Important factors influencing a resident’s choice of home, rated 1: greatest influential factor to 5: least influential factor.
Figure 2.
Important factors influencing a resident’s choice of home, rated 1: greatest influential factor to 5: least influential factor.

Figure 3.
Perceived benefits of living next to a pond (within walking distance), rated 1: Greatest benefit to 5: Least benefit.
Figure 3.
Perceived benefits of living next to a pond (within walking distance), rated 1: Greatest benefit to 5: Least benefit.

Figure 4.
Disadvantages of living next to a pond (within walking distance), rated 1: Greatest disadvantage to 5: Lowest disadvantage.
Figure 4.
Disadvantages of living next to a pond (within walking distance), rated 1: Greatest disadvantage to 5: Lowest disadvantage.

Figure 5.
Which factors are important when choosing a neighbourhood (families—single parents and co-habiting).
Figure 5.
Which factors are important when choosing a neighbourhood (families—single parents and co-habiting).
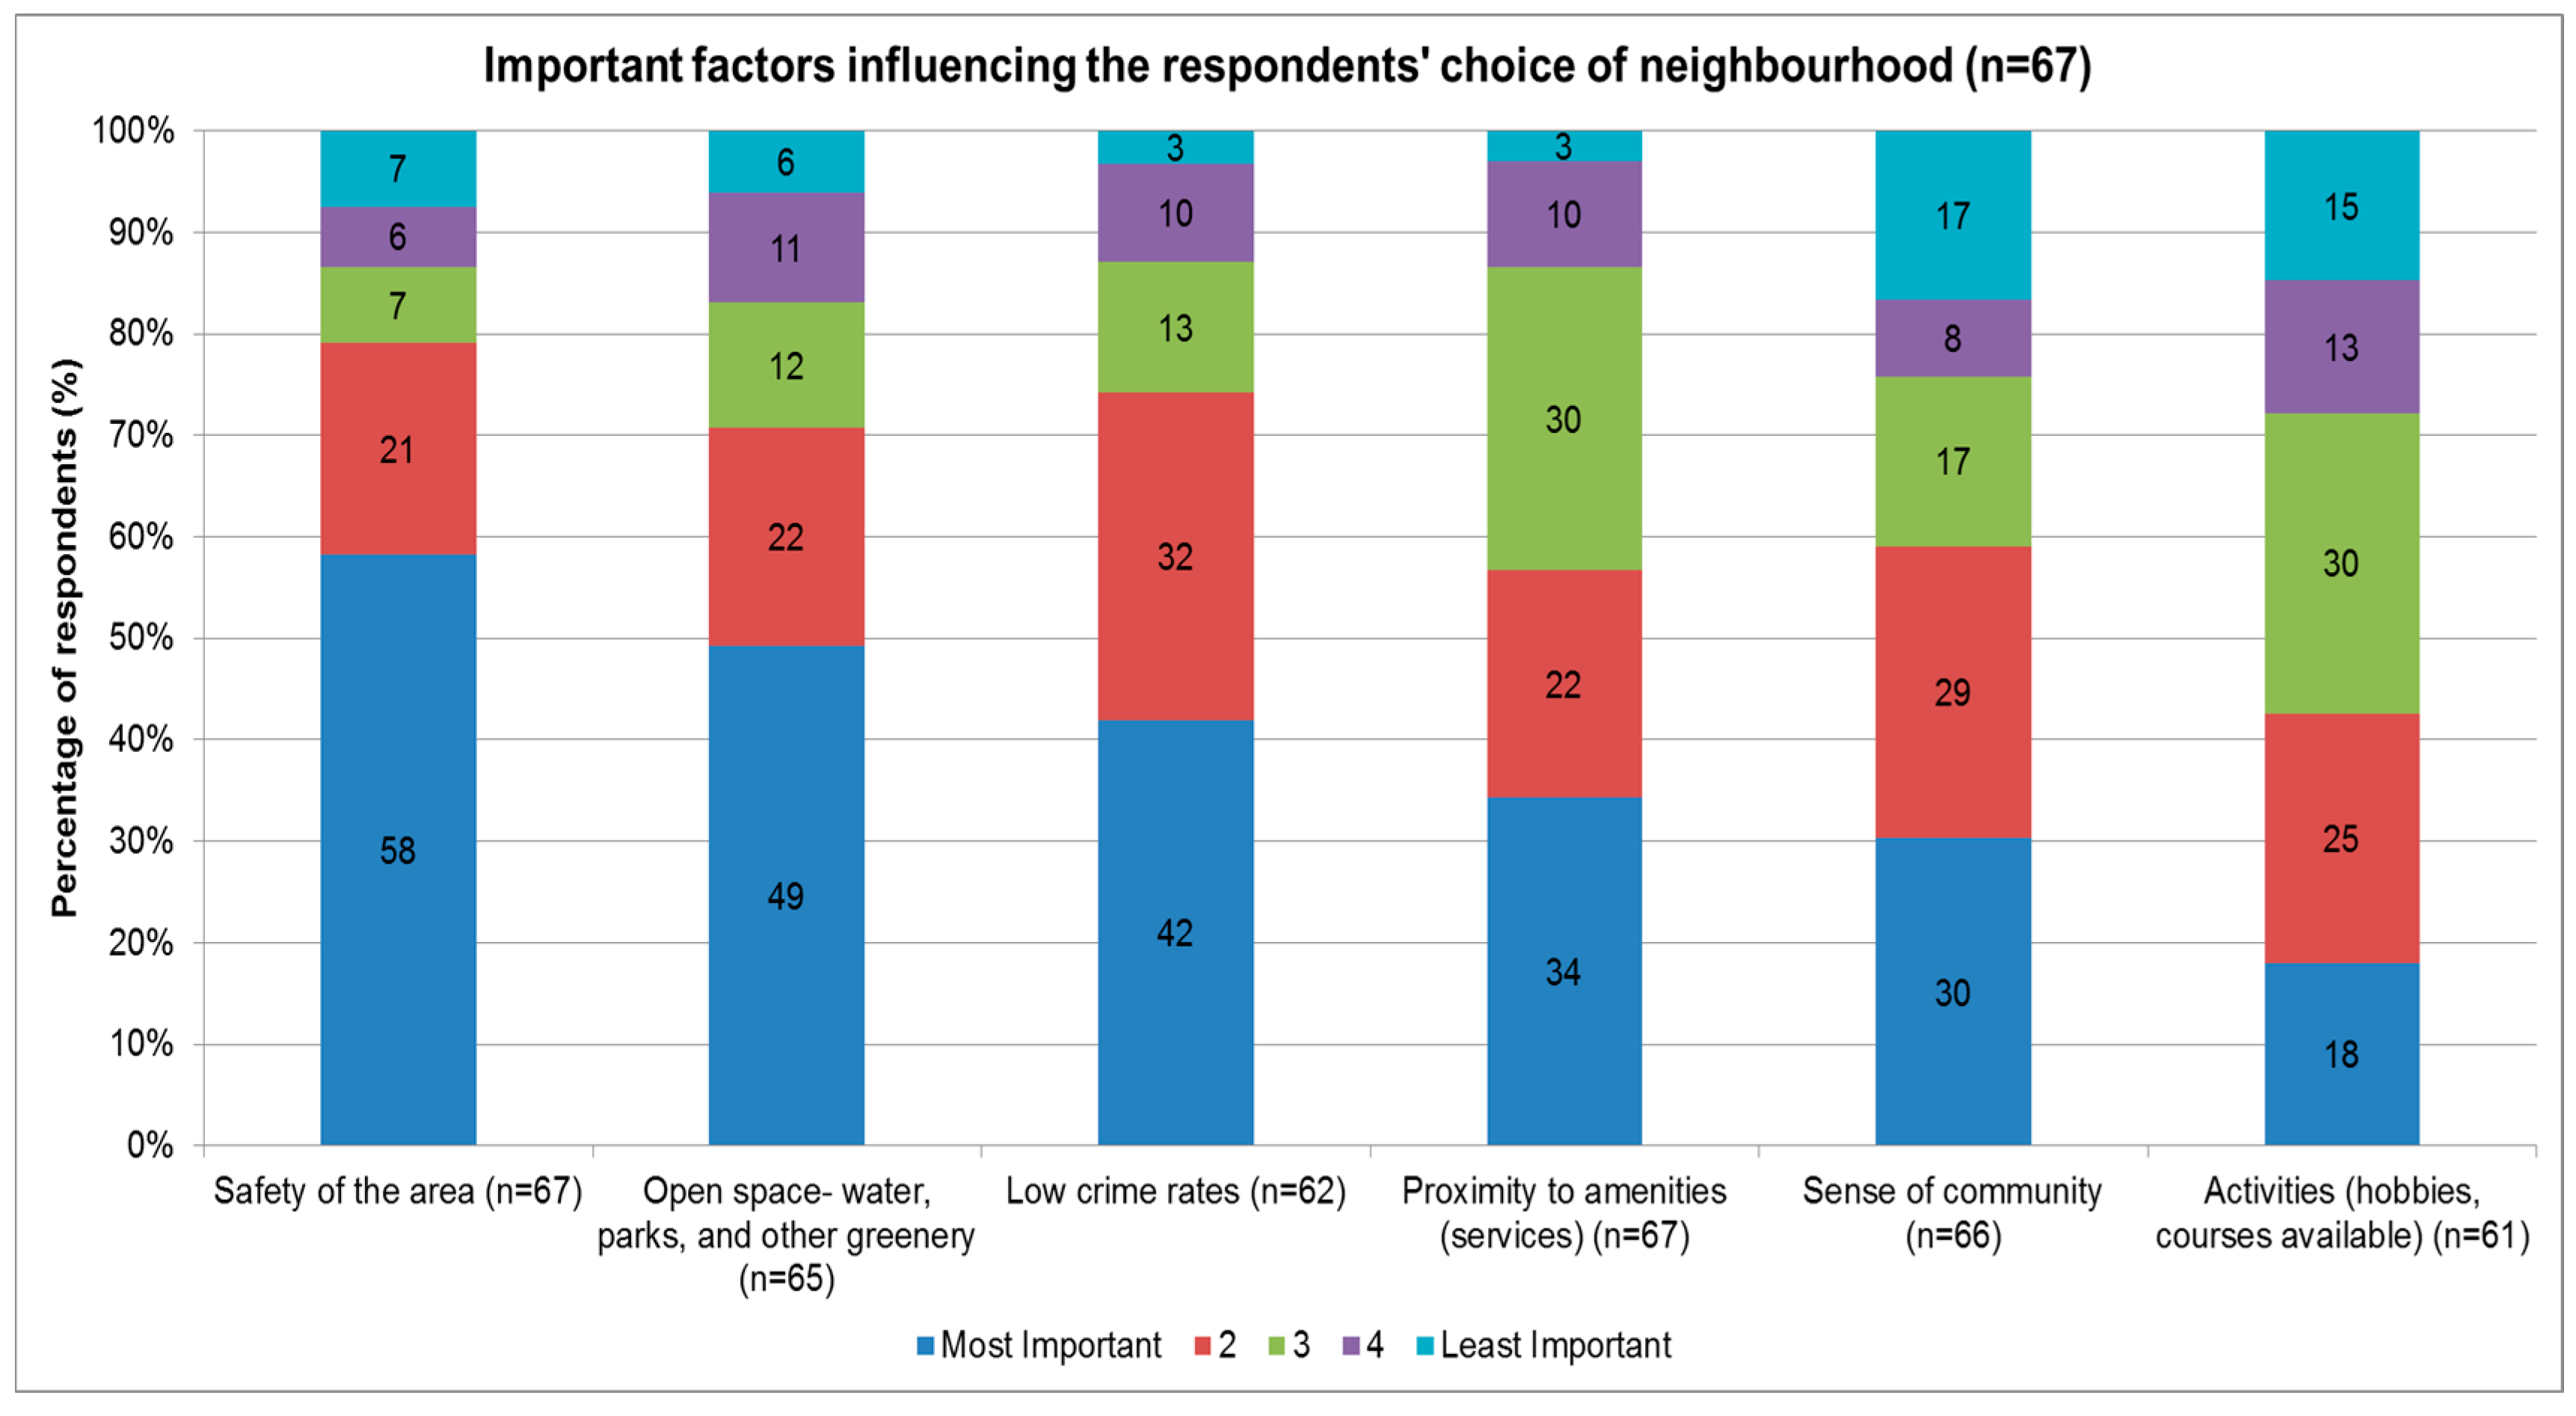
Figure 6.
Which do you perceive to be the most dangerous, rated 1: Most dangerous to 5: Least dangerous.
Figure 6.
Which do you perceive to be the most dangerous, rated 1: Most dangerous to 5: Least dangerous.

Table 1.
Describes the setting of each pond, ownership, and the known uses. The main purpose of each pond is described, and some additional notes about amenity and biodiversity. This also highlights why the ponds were chosen (with SUDS ponds being compared to those with natural origins). Scottish Index of Multiple Deprivation (SIMD, hereafter) scores for each case study are presented.
| Case Study | Setting of Pond | Use of Pond | Surface Area (m2) | Date Established | Ownership | Population within 500 m Radius | SIMD Decile Score |
|---|---|---|---|---|---|---|---|
| Granton Pond, Edinburgh | In a park. Near a supermarket and college. | Drainage (SUDS) pond. Provides amenity and biodiversity. | 12,000 | 2005 | Private—Capita Symonds/National Grid | 2315 | 3 |
| Juniper Green Pond, Edinburgh | Residential area. Near the Water of Leith footpath. | Drainage (SUDS) pond, focal point from flats. | 240 | 2005 | Private—James Gibb | 1459 | 10 |
| Oxgangs, Edinburgh | Residential area. | Drainage (SUDS) pond and amenity | 8099 | 2007–2010 | Private—Dunedin Canmore | 3796 | 2 |
| Eliburn, Livingston | Residential area. Near light industrial units | Drainage pond (SUDS)—not accessible to public | 1675 | 2007–2011 | Private—Gladmans | 364 | 9 |
| Blackford, Edinburgh | Local Nature Reserve | Biodiversity and amenity | 13,500 | 1800–1900 | Public—Edinburgh Local authority | 847 | 9 |
| Goreglen, Mid Lothian | Woodland setting. Near main road. | No use currently. Flood plain | 500 | 1794–1861 | Public—Midlothian Ranger Service | 39 | 4 |
| Royal Botanic Gardens, Edinburgh | Former estate. Near residential area. | Amenity and education. Outflow pipe to Water of Leith. Feeding wildfowl. | 4560 | 1880 | Private | 2312 | 10 |
| Inverleith Pond, Edinburgh | Park setting. Near residential area. | Model boat activities, recreation, and feeding wild fowl | 43,554 | 1870 | Public—Edinburgh Local authority | 804 | 10 |
Table 2.
Habitat benefits according to the residents in the survey: where the monthly total value is divided by the number living near each pond (SUDS = Granton, Juniper Green, Oxgangs and Eliburn). Total n = 233.
| Pond Name | Supports Plants (£) | Supports Mammals (£) | Supports Fish (£) | Creates Habitat for Birds (£) | Supports Invertebrates (£) | Total (£) |
|---|---|---|---|---|---|---|
| Granton (n = 19) | 0.53 | 0.53 | 0.53 | 0.58 | 0.42 | 2.58 |
| Juniper Green (n = 22) | 1.09 | 1.09 | 1.32 | 1.09 | 1.09 | 5.68 |
| Oxgangs (n = 23) | 2.87 | 2.78 | 2.96 | 2.96 | 2.91 | 14.48 |
| Eliburn (n = 2) | 5.50 | 3.00 | 3.00 | 5.50 | 7.50 | 24.50 |
| Blackford (n = 78) | 2.40 | 2.47 | 2.53 | 3.03 | 2.09 | 12.51 |
| Goreglen (n = 22) | 1.73 | 1.86 | 1.91 | 2.00 | 1.73 | 9.23 |
| Royal Botanic (n = 21) | 3.71 | 2.76 | 2.71 | 3.48 | 2.33 | 15.00 |
| Inverleith (n = 45) | 2.40 | 2.33 | 2.42 | 2.64 | 2.47 | 12.27 |
| Totals (£): | 20.23 | 16.82 | 17.38 | 21.28 | 20.54 | 96.25 |
Table 3.
Monthly and annual values (Willingness to Pay) for habitat benefits according to the number of residents in a household [20]. Where: Number of residents in households (total n = 13,077). Total value is calculated using the total benefits per person multiplied by the total population living within a 500 m radius of their local pond (Table 1).
| Pond Name | Number of Households | Total Population | Monthly Value (£) | Annual Value (£) |
|---|---|---|---|---|
| Granton | 1016 | 2315 | £5973 | £71,672 |
| Juniper Green | 606 | 1459 | £8290 | £99,475 |
| Oxgangs | 1840 | 3796 | £54,966 | £659,593 |
| Eliburn | 108 | 364 | £8918 | £107,016 |
| Blackford | 847 | 1988 | £24,870 | £298,439 |
| Goreglen | 14 | 39 | £360 | £4320 |
| Royal Botanic | 1161 | 2312 | £34,680 | £416,160 |
| Inverleith | 399 | 804 | £9865 | £118,380 |
| Total | 5991 | 13,077 | £148,921 | £1,775,055 |
Table 4.
Capital and maintenance costs for ponds, calculated following the guidance (surface area and pond volume for treatment) from [27]. The Net Present Value (NPV) benefits refer to the total benefits over 50 years with a discount of 3.5% (30 years) then 3% (20 years) [28]. Maintenance costs (see Table A1) are calculated with a discount of 3.5%. The balance is calculated by subtracting the NPV maintenance and initial capital for the pond from the perceived NPV benefits.
| Pond Name | NPV Benefits | NPV OPEX Costs | CAPEX Costs | Balance |
|---|---|---|---|---|
| Granton | £1,720,765 | £1,619,712 | £990,000 | −£888,946 |
| Juniper Green | £2,388,284 | £52,988 | £13,200 | £2,322,086 |
| Oxgangs | £15,836,096 | £1,101,592 | £668,167 | £14,066,337 |
| Eliburn | £2,569,335 | £233,140 | £115,156 | £2,221,039 |
| Blackford | £7,165,189 | £1,966,033 | £1,336,500 | £3,862,656 |
| Goreglen | £103,718 | £92,315 | £41,250 | −£29,847 |
| Royal Botanic Gardens | £9,991,540 | £631,553 | £376,200 | £8,983,787 |
| Inverleith | £2,842,172 | £5,810,221 | £3,593,205 | −£6,561,254 |
| Total | £42,617,101 | £11,507,564 | £7,133,678 | £23,975,859 |
| Per Population | £3258.94 | £879.99 | £545.51 | £1833.44 |
© 2017 by the authors. Licensee MDPI, Basel, Switzerland. This article is an open access article distributed under the terms and conditions of the Creative Commons Attribution (CC BY) license ( http://creativecommons.org/licenses/by/4.0/).
Share and Cite
MDPI and ACS Style
Jarvie, J.; Arthur, S.; Beevers, L. Valuing Multiple Benefits, and the Public Perception of SUDS Ponds. Water 2017, 9, 128. https://doi.org/10.3390/w9020128
AMA Style
Jarvie J, Arthur S, Beevers L. Valuing Multiple Benefits, and the Public Perception of SUDS Ponds. Water. 2017; 9(2):128. https://doi.org/10.3390/w9020128
Chicago/Turabian StyleJarvie, Joy, Scott Arthur, and Lindsay Beevers. 2017. "Valuing Multiple Benefits, and the Public Perception of SUDS Ponds" Water 9, no. 2: 128. https://doi.org/10.3390/w9020128
Note that from the first issue of 2016, this journal uses article numbers instead of page numbers. See further details here.