
Recent Advances in the Use of Chemical Markers for Tracing Wastewater Contamination in Aquatic Environment: A Review


Abstract
:1. Introduction
2. Use of Chemicals Markers
2.1. Pharmaceuticals and Personal Care Products (PPCPs)
2.2. Artificial Sweeteners (ASs)
2.3. Fluorescent Whitening Agents (FWAs)
2.4. Sterols/Stanols (SSs)
2.5. Nitrate and Nitrogen Isotopic Signatures
2.6. Alternative Potential Chemicals
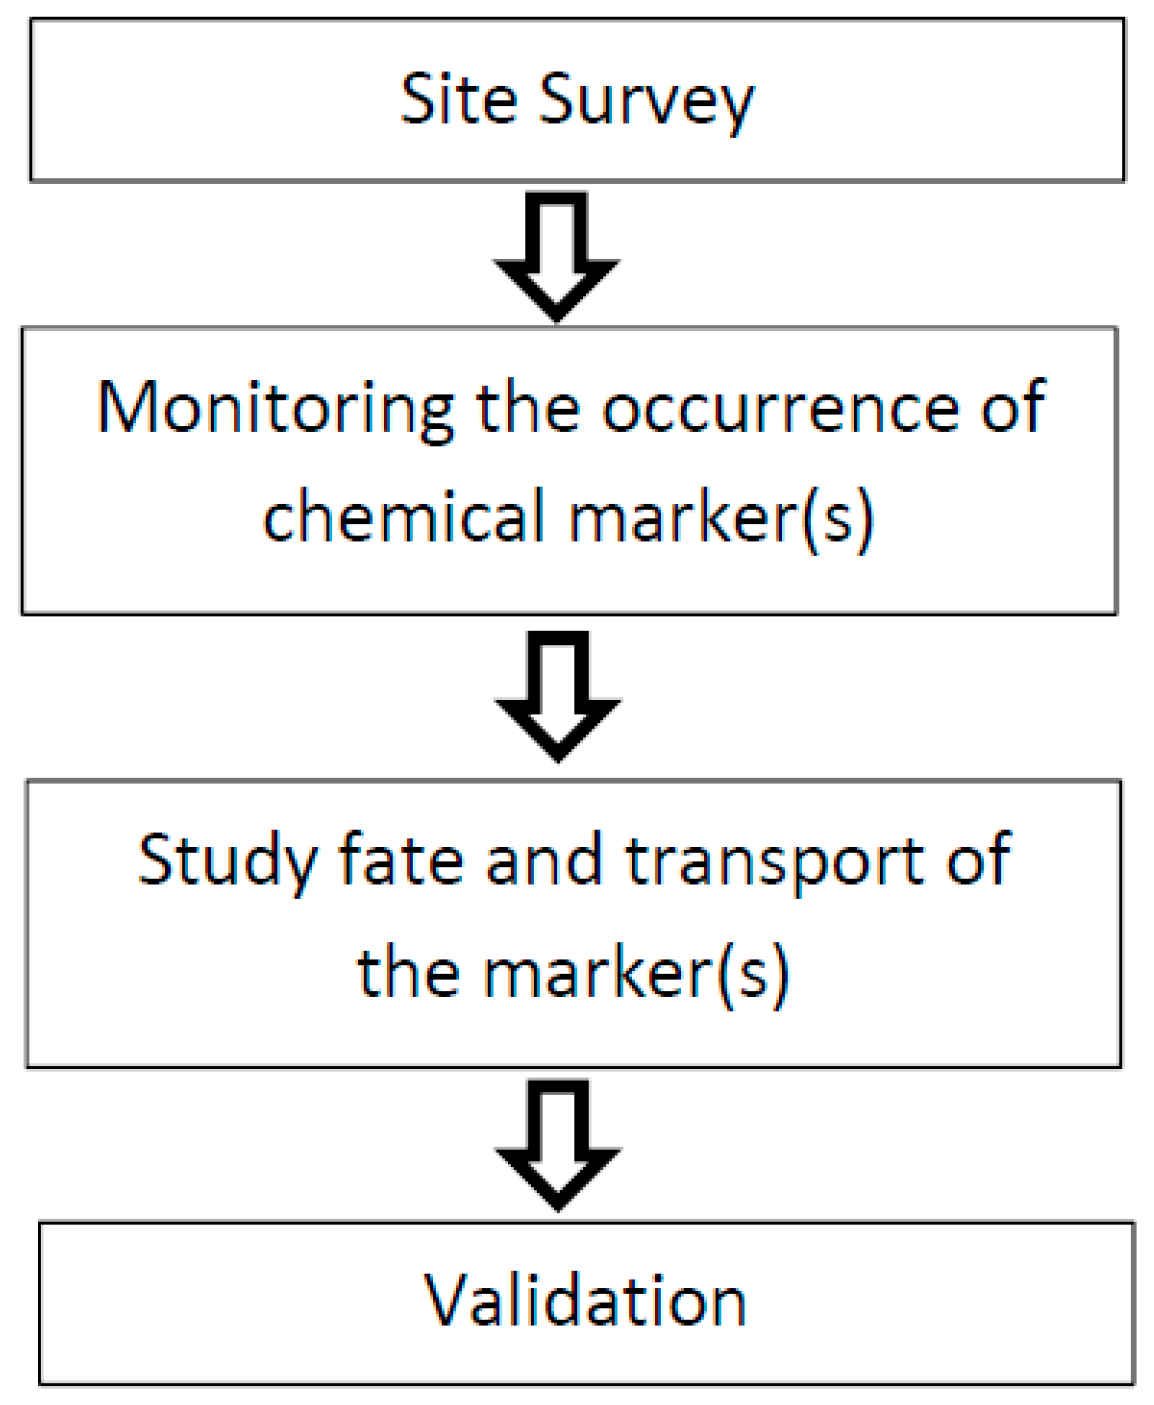
3. Considerations of the Use of Chemical Markers to Detect Wastewater Contamination
3.1. Site Survey
3.2. Occurrence and Detection of Chemical Markers
3.3. Fate and Transport of Chemical Markers
3.4. Validation
3.5. Ability to Distinguish Sources
4. Conclusions and Future Trend
Acknowledgments
Author Contributions
Conflicts of Interest
References
- Silva, C.M.; Sousa, V.; Carvalho, N.V. Evaluation of rainwater harvesting in Portugal: Application to single-family residences. Resour. Conserv. Recycl. 2015, 94, 21–34. [Google Scholar] [CrossRef]
- Converse, R.R.; Piehler, M.F.; Noble, R.T. Contrasts in concentrations and loads of conventional and alternative indicators of fecal contamination in coastal stormwater. Water Res. 2011, 45, 5229–5240. [Google Scholar] [CrossRef] [PubMed]
- Davis, B.; Birch, G.F. Comparison of heavy metal loads in stormwater runoff from major and minor urban roads using pollutant yield rating curves. Environ. Pollut. 2009, 158, 2541–2545. [Google Scholar] [CrossRef] [PubMed]
- Sauer, E.P.; VandeWalle, J.L.; Bootsma, M.J.; McLellan, S.L. Detection of the human specific Bacteroides genetic marker provides evidence of widespread sewage contamination of stormwater in the urban environment. Water Res. 2011, 45, 4081–4091. [Google Scholar] [CrossRef] [PubMed]
- Post, G.B.; Cohn, P.D.; Cooper, K.R. Perfluorooctanoic acid (PFOA), an emerging drinking water contaminant: A critical review of recent literature. Environ. Res. 2012, 116, 93–117. [Google Scholar] [CrossRef] [PubMed]
- Trussell, R.R. Endocrine disruptors and the water industry. J. AWWA 2001, 93, 58–65. [Google Scholar]
- Buerge, I.J.; Poiger, T.; Muller, M.D.; Buser, H.R. Combined sewer overflows to surface waters detected by the anthropogenic marker caffeine. Environ. Sci. Technol. 2006, 40, 4096–4102. [Google Scholar] [CrossRef] [PubMed]
- Passerat, J.; Ouattara, N.K.; Mouchel, J.M.; Rocher, V.; Servais, P. Impact of an intense combined sewer overflow event on the microbiological water quality of the Seine River. Water Res. 2011, 45, 893–903. [Google Scholar] [CrossRef] [PubMed]
- Leschik, S.; Musolff, A.; Martienssen, M.; Krieg, R.; Bayer-Raich, M.; Reinstorf, F.; Strauch, G.; Schirmer, M. Investigation of sewer exfiltration using integral pumping tests and wastewater indicators. J. Contam. Hydrol. 2009, 110, 118–129. [Google Scholar] [CrossRef] [PubMed]
- Noble, R.T.; Griffith, J.F.; Blackwood, A.D.; Fuhrman, J.A.; Gregoty, J.B.; Hernandez, X.; Liang, X.; Bera, A.A.; Schiff, K. Multitiered approach using quantitative PCR to track sources of fecal pollution affecting Santa Monica Bay, California. Appl. Environ. Microbiol. 2006, 72, 1604–1612. [Google Scholar] [CrossRef] [PubMed]
- Rajal, V.B.; McSwain, B.S.; Thompson, D.E.; Leuteneggerm, C.M.; Wuertz, S. Molecular quantitative analysis of human viruses in California stormwater. Water Res. 2007, 41, 4287–4298. [Google Scholar] [CrossRef] [PubMed]
- Pitt, R. Illicit Discharge Detection and Elimination: A Guidance Manual for Program Development and Technical Assessments; Center for Watershed Protection: Ellicott City, MD, USA, 2004. [Google Scholar]
- Roberts, J.; Kumar, A.; Du, J.; Hepplewhite, C.; Ellis, D.E.; Christry, A.G.; Beavis, S.G. Pharmaceuticals and personal care products (PPCPs) in Australia’s largest inland sewage treatment plant, and its contribution to a major Australian river during high and low flow. Sci. Total Environ. 2016, 541, 1625–1637. [Google Scholar] [CrossRef] [PubMed]
- Glassmeyer, S.T.; Furlong, E.T.; Kolpin, D.W.; Cahill, J.D.; Zaugg, S.D.; Werner, S.L.; Meyer, M.T.; Kryak, D.D. Transport of chemical and microbial compounds from known wastewater discharges: Potential for use as indicators of human fecal contamination. Environ. Sci. Technol. 2005, 39, 5157–5169. [Google Scholar] [CrossRef] [PubMed]
- Peeler, K.A.; Opsahl, S.P.; Chanton, J.P. Tracking anthropogenic inputs using caffeine, indicator bacteria and nutrients in rural freshwater and urban marine systems. Environ. Sci. Technol. 2006, 40, 7616–7622. [Google Scholar] [CrossRef] [PubMed]
- Scott, T.M.; Jenkins, T.M.; Lukasik, J.; Rose, J.B. Potential use of a host associated molecular marker in Enterococcus faecium as an index of human fecal pollution. Environ. Sci. Technol. 2005, 39, 283–287. [Google Scholar] [CrossRef] [PubMed]
- Young, T.A.; Heidler, J.; Matos-Perez, C.R.; Sapkota, A.; Toler, T.; Gibson, K.E.; Schwab, K.J.; Halden, R.U. Ab initio and in situ comparison of caffeine, triclosan and triclocarbon as indicators of sewage-derived microbes in surface waters. Envinron. Sci. Technol. 2008, 42, 3335–3340. [Google Scholar] [CrossRef]
- Kabiri, L.; Alum, A.; Rock, C.; McLain, J.E.; Abbaszadegan, M. A tool box strategy using Bacteroides genetic markers to differentiate human from non-human sources of fecal contamination in natural water. Sci. Total Environ. 2016, 572, 897–905. [Google Scholar] [CrossRef] [PubMed]
- Rusinol, M.; Fernandez-Cassi, X.; Hundesa, A.; Vieira, C.; Kern, A.; Eriksson, I.; Ziros, P.; Kay, D.; Miagostovich, M.; Vargha, M.; et al. Application of human and animal viral microbial source tracking tools in fresh and marine waters from five different geographical areas. Water Res. 2014, 59, 119–129. [Google Scholar] [CrossRef] [PubMed]
- Martellini, A.; Payment, P.; Villemur, R. Use of eukaryotic mitochondrial DNA to differentiate human, bovine, porcine and ovine sources in fecally contaminated surface water. Water Res. 2005, 39, 541–548. [Google Scholar] [CrossRef] [PubMed]
- Kildare, B.J.; Leuteneggar, C.M.; McSwain, B.S.; Bambic, D.G.; Rajal, V.B.; Wuertz, S. 16 rRNA-based assays for quantitative detection of universal, human-, cow-, and dog-specific fecal Bacteroidales: A Bayesian approach. Water Res. 2007, 41, 3701–3715. [Google Scholar] [CrossRef] [PubMed]
- Layton, A.; McKay, L.; Williams, D.; Garrett, V.; Gentry, R.; Sayler, G. Development of Bacteroides 16S rRNA gene TaqMan-based real-time PCR assays for estimation of total, human, and bovine fecal pollution in water. Appl. Environ. Microbiol. 2006, 72, 4214–4224. [Google Scholar] [CrossRef] [PubMed]
- Gilbride, K.A.; Lee, D.-Y.; Beaudette, L.A. Molecular techniques in wastewater: Understanding microbial communities, detecting pathogens, and real-time process control. J. Microbiol. Methods 2006, 66, 1–20. [Google Scholar] [CrossRef] [PubMed]
- Sanz, J.L.; Kochling, T. Molecular biology techniques used in wastewater treatment: An overview. Process Biochem. 2007, 42, 119–133. [Google Scholar] [CrossRef]
- Marzorati, M.; Wittebolle, L.; Boon, N.; Daffonchio, D.; Verstraete, W. How to get more out of molecular fingerprints: Practical tools for microbial ecology. Environ. Microbiol. 2008, 10, 1571–1581. [Google Scholar] [CrossRef] [PubMed]
- Van Stempvoort, D.R.; Roy, J.W.; Brown, S.J.; Bickerton, G. Articifical sweeteners as potential tracers in groundwater in urban environments. J. Hydrol. 2011, 401, 126–133. [Google Scholar] [CrossRef]
- Vogel, J.R.; Stoeckel, D.M.; Lamendella, R.; Zelt, R.B.; Domingo, J.W.S.; Walker, S.R.; Oerther, D.B. Identifying fecal sources in a selected catchment reach using multiple source-tracking tools. J. Environ. Qual. 2007, 36, 718–729. [Google Scholar] [CrossRef] [PubMed]
- Tran, N.H.; Hu, J.; Li, J.; Ong, S.L. Suitability of artificial sweeteners as indicators of raw wastewater contamination in surface water and groundwater. Water Res. 2014, 48, 443–456. [Google Scholar] [CrossRef] [PubMed]
- Tran, N.H.; Li, J.; Hu, J.; Ong, S.L. Occurrence and suitability of pharmaceuticals and personal care products as molecular markers for raw wastewater contamination in surface water and groundwater. Environ. Sci. Pollut. Res. 2014, 21, 4727–4740. [Google Scholar] [CrossRef] [PubMed] [Green Version]
- Caliman, F.A.; Gavrilescu, M. Pharmaceuticals, personal care products and endocrine disrupting agents in the environment—A review. CLEAN—Soil Air Water 2009, 37, 277–303. [Google Scholar] [CrossRef]
- Cronin, A.; Rueedi, J.; Morris, B. The effectiveness of selected microbial and chemical indicators to detect sewer leakage impacts on urban groundwater quality. Water Sci. Technol. 2006, 54, 145–152. [Google Scholar] [CrossRef] [PubMed]
- Eaton, A. The list of lists—Are we measuring the best PPCPs for detecting wastewater impact on a receiving water? Water Pract. Technol. 2012, 7, 1–13. [Google Scholar] [CrossRef]
- Fenech, C.; Rock, L.; Nolan, K.; Tobin, J.; Morrissey, A. The potential for a suite of isotope and chemical markers to differentiate sources of nitrate contamination: A review. Water Res. 2012, 46, 2023–2041. [Google Scholar] [CrossRef] [PubMed]
- Kasprzyk-Hordern, B.; Dinsdale, R.M.; Guwy, A.J. Illicit drugs and pharmaceuticals in the environment—Forensic applications of environmental data, Part 2: Pharmaceuticals as chemical markers of faecal water contamination. Environ. Pollut. 2009, 157, 1778–1786. [Google Scholar] [CrossRef] [PubMed]
- Sun, Q.; Li, M.; Ashfaq, M.; Lv, M.; Wang, H.; Hu, A.; Yu, C.-P. PPCPs in Jiulong River estuary (China): Spatiotemporal distributions, fate and their use as chemical markers of wastewater. Chemosphere 2016, 150, 596–604. [Google Scholar] [CrossRef] [PubMed]
- Fenech, C.; Nolan, K.; Rock, L.; Morrissey, A. An SPE LC-MS/MS method for the analysis of human and veterinary chemical markers within surface waters: An environmental forensics application. Environ. Pollut. 2013, 181, 250–256. [Google Scholar] [CrossRef] [PubMed]
- Ekklesia, E.; Shananhan, P.; Chua, L.H.C.; Eikaas, H.S. Association of chemical tracers and faecal indicator bacteria in a tropical urban catchment. Water Res. 2015, 75, 270–281. [Google Scholar] [CrossRef] [PubMed]
- De Sousa, D.N.R.; Mozeto, A.A.; Carneiro, R.L.; Fadini, P.S. Electrical conductivity and emerging contaminant as marker of surface freshwater contamination by wastewater. Sci. Total Environ. 2014, 484, 19–26. [Google Scholar] [CrossRef] [PubMed]
- Dansehvar, A.; Aboulfadl, K.; Viglono, L.; Broseus, R.; Sauve, S.; Madoux-Humery, A.-S.; Weyhenmeyer, G.A.; Prevost, M. Evaluating pharmaceuticals and caffeine as indicators of fecal contamination in drinking water sources of the Greater Montreal region. Chemosphere 2012, 88, 131–139. [Google Scholar] [CrossRef] [PubMed]
- Buerge, I.J.; Poiger, T.; Muller, M.D.; Buser, H.R. Caffeine, an anthropogenic marker for wastewater contamination of surface waters. Environ. Sci. Technol. 2003, 37, 691–700. [Google Scholar] [CrossRef] [PubMed]
- Kurissery, S.; Kanavillil, N.; Verenitch, S.; Mazumder, A. Caffeine as an anthropogenic marker of domestic waste: A study from Lake Simcoe watershed. Ecol. Indic. 2012, 23, 501–508. [Google Scholar] [CrossRef]
- Chen, Z.; Pavelic, P.; Dillon, P.; Naidu, R. Determination of caffeine as a tracer of sewage effluent in natural waters by on-line solid-phase extraction and liquid chromatography with diode-array detection. Water Res. 2002, 36, 4830–4838. [Google Scholar] [CrossRef]
- Sauve, S.; Aboulfadl, K.; Dorner, S.; Payment, P.; Deschamps, G.; Prevost, M. Fecal coliforms, caffeine and carbamazepine in stormwater collection systems in a large urban area. Chemosphere 2012, 86, 118–123. [Google Scholar] [CrossRef] [PubMed]
- Cantwell, M.G.; Katz, D.R.; Sullivan, J.C.; Borci, T.; Chen, R.F. Caffeine in Boston Harbor past and present, assessing its utility as a tracer of wastewater contamination in an urban estuary. Mar. Pollut. Bull. 2016, 108, 321–324. [Google Scholar] [CrossRef] [PubMed]
- Nodler, K.; Tsakiri, M.; Aloupi, M.; Gatidou, G.; Stasinakis, A.S.; Licha, T. Evaluation of polar organic micropollutants as indicators for wastewater-related coastal water quality impairment. Environ. Pollut. 2016, 211, 282–290. [Google Scholar] [CrossRef] [PubMed]
- Lv, M.; Sun, Q.; Hu, A.; Hou, L.; Li, J.; Cai, X.; Yu, C.-P. Pharmaceuticals and personal care products in a mesoscale subtropical watershed and their application as sewage markers. J. Hazard. Mater. 2014, 280, 696–705. [Google Scholar] [CrossRef] [PubMed]
- Pongmala, K.; Autixier, L.; Madoux-humery, A.-S.; Fuamba, M.; Galarneau, M.; Sauve, S.; Prevost, M.; Dorner, S. Modelling total suspended solids, E. coli and carbamazepine, a tracer of wastewater contamination from combined sewer overflows. J. Hydrol. 2015, 531, 830–839. [Google Scholar] [CrossRef]
- Gasser, G.; Rona, M.; Voloshenko, A.; Shelkov, R.; Lev, O.; Elhanany, S.; Lange, F.T.; Scheurer, M.; Pankratov, I. Evaluation of micropollutant tracers. II. Carbamazepine tracer for wastewater contamination from a nearby water recharge system and from non-specific sources. Desalination 2011, 273, 398–404. [Google Scholar] [CrossRef]
- Madoux-Humery, A.-S.; Dorner, S.; Sauve, S.; Aboulfadl, K.; Galarneau, M.; Servais, P.; Prevost, M. Temporal variability of combined sewer overflow contaminants: Evaluation of wastewater micropollutants as tracers of fecal contamination. Water Res. 2013, 47, 4370–4382. [Google Scholar] [CrossRef] [PubMed]
- Williams, M.; Kumar, A.; Ort, C.; Lawrence, N.G.; Hambly, A.; Khan, S.J.; Kookana, R. The use of multiple tracers for tracking wastewater discharges in freshwater systems. Environ. Monit. Assess. 2013, 185, 9321–9332. [Google Scholar] [CrossRef] [PubMed]
- Funke, J.; Prasse, C.; Eversloh, C.L.; Ternes, T.A. Oxypurinol—A novel marker for wastewater contamination of the aquatic environment. Water Res. 2015, 74, 257–265. [Google Scholar] [CrossRef] [PubMed]
- Oppenheirmer, J.; Eaton, A.; Badruzzaman, M.; Haghani, A.W.; Jacangelo, J.G. Occurrence and suitability of sucralose as an indicator compound of wastewater loading to surface waters in urbanized regions. Water Res. 2011, 45, 4019–4027. [Google Scholar] [CrossRef] [PubMed]
- Wu, M.; Qian, Y.; Boyd, J.M.; Hrudey, S.E.; Le, X.C.; Li, X.-F. Direct large volume injection ultra-high performance liquid chromatography-tandem mass spectrometry determination of artificial sweeteners sucralose and acesulfame in well water. J. Chromatogr. A 2014, 1359, 156–161. [Google Scholar] [CrossRef] [PubMed]
- Oppenheimer, J.A.; Badruzzaman, M.; Jacangelo, J.G. Differentiating sources of anthropogenic loading to impaired water bodies utilizing ratios of sucralose and other microconstituents. Water Res. 2012, 46, 5904–5916. [Google Scholar] [CrossRef] [PubMed]
- Ferrer, I.; Thurman, E.M. Analysis of sucralose and other sweeteners in water and beverage samples by liquid chromatography/time-of-flight mass spectrometry. J. Chromatogr. A 2010, 1217, 4127–4134. [Google Scholar] [CrossRef] [PubMed]
- Scheurer, M.; Brauch, H.J.; Lange, F.T. Analysis and occurrence of seven artificial sweeteners in German wastewater and surface water and in soil aquifer treatment (SAT). Anal. Bioanal. Chem. 2009, 394, 1585–1594. [Google Scholar] [CrossRef] [PubMed]
- Scheurer, M.; Storck, F.R.; Brauch, J.J.; Lange, F.T. Performance of conventional multi-barrier drinking water treatment plants for the removal of four artificial sweeteners. Water Res. 2010, 44, 3573–3584. [Google Scholar] [CrossRef] [PubMed]
- Mawhinney, D.B.; Young, R.B.; Vanderford, B.J.; Borch, T.; Snyder, S.A. Artificial sweetener sucralose in U.S. drinking water systems. Environ. Sci. Technol. 2011, 45, 8716–8722. [Google Scholar] [CrossRef] [PubMed]
- Zirlewagen, J.; Licha, T.; Schiperski, F.; Nodler, K.; Scheytt, T. Use of two artificial sweeteners, cyclamate and asesulfame, to identify and quantify wastewater contributions in a karst spring. Sci. Total Environ. 2016, 547, 356–365. [Google Scholar] [CrossRef] [PubMed]
- Hayashi, Y.; Managaki, S.; Takada, H. Fluorescent whitening agents in Tokyo Bay and adjacent rivers: Their application as anthropogenic molecular markers in coastal environments. Environ. Sci. Technol. 2002, 36, 3556–3563. [Google Scholar] [CrossRef] [PubMed]
- Stoll, J.M.A.; Giger, W. Mass balance for detergent-derived fluorescent whitening agents in surface waters of Switzerland. Water Res. 1998, 3297, 2041–2050. [Google Scholar] [CrossRef]
- Takahashi, M.; Kawamura, K. Simple measurement of 4,4-bis(2-sulfostyryl)-biphenyl in river water by fluorescence analysis and its application as an indicator of domestic wastewater contamination. Water Air Soil Pollut. 2007, 180, 39–49. [Google Scholar] [CrossRef]
- Managaki, S.; Takada, H.; Kim, D.M.; Horiguchi, T.; Shiraishi, H. Three-dimentional distributions of sewage markers in Tokyo Bay water-fluorescent whitening agents (FWAs). Mar. Pollut. Bull. 2006, 52, 281–292. [Google Scholar] [CrossRef] [PubMed]
- Derrien, M.; Jarde, E.; Gruau, G.; Pourcher, A.M.; Gourmelon, M.; Jadas-Hecart, A.; Wickmann, A.C.P. Origin of fecal contamination in waters from contrasted areas: Stanols as microbial source tracking markers. Water Res. 2012, 46, 4009–4016. [Google Scholar] [CrossRef] [PubMed] [Green Version]
- Adnan, N.H.; Zakaria, M.P.; Juahir, H.; Ali, M.M. Faecal sterols as sewage markers in the Langat River, Malaysia: Integration of biomarker and multivariate statistical approaches. J. Environ. Sci. 2012, 24, 1600–1608. [Google Scholar] [CrossRef]
- Saim, N.; Osman, R.; Spian, D.R.S.A.; Jaafar, M.Z.; Juahir, H.; Abdullah, M.P.; Ghani, F.A. Chemometric approach to validating faecal sterols as source tracer for faecal contamination in water. Water Res. 2009, 43, 5023–5030. [Google Scholar] [CrossRef] [PubMed]
- Furtula, V.; Osachoff, H.; Derksen, G.; Juahir, H.; Colodey, A.; Chambers, P. Inorganic nitrogen, sterols and bacterial source tracking as tools to characterize water quality and possible contamination sources in surface water. Water Res. 2012, 46, 1079–1092. [Google Scholar] [CrossRef] [PubMed]
- Isobe, K.O.; Tarao, M.; Zakaria, M.P.; Chiem, N.H.; Minh, L.Y.; Takada, H. Quantitative application of fecal sterols using gas chromatography-mass spectrometry to investigate fecal pollution in tropical waters: Western Malaysia and Mekong Delta, Vietnam. Environ. Sci. Technol. 2002, 36, 4497–4507. [Google Scholar] [CrossRef] [PubMed]
- Jeanneau, L.; Jarde, E.; Gruau, G. Influence of salinity and natural organic mater on the solid phase extraction of sterols and stanols: Application to the determination of the human sterol fingerprint in aqueous matrices. J. Chromatogr. A 2011, 1218, 2513–2520. [Google Scholar] [CrossRef] [PubMed]
- Nishimura, M.; Koyama, T. The occurrence of stanols in various living organisms and the behavior of sterols in contemporary sediments. Geochim. Cosmochim. Acta 1977, 41, 379–385. [Google Scholar] [CrossRef]
- Barrett, M.H.; Hiscock, K.M.; Pedley, S.; Lerner, D.N.; Tellam, J.H.; French, M.J. Marker species for identifying urban groundwater recharge sources: A review and case study in Nottingham, UK. Water Res. 1999, 33, 3083–3097. [Google Scholar] [CrossRef]
- Singh, S.P.; Gardinali, P.R. Trace determination of 1-aminopropanone, a potential marker for wastewater contamination by liquid chromatography and atmospheric pressure chemical ionization-mass spectrometry. Water Res. 2006, 40, 588–594. [Google Scholar] [CrossRef] [PubMed]
- Fitzsimons, M.; Abdul-Rashid, M.; Riley, J.; Wolff, G. Aminopropanone as a marker for raw sewage in natural waters. Mar. Pollut. Bull. 1995, 30, 306–312. [Google Scholar] [CrossRef]
- Dawit, M.; Williams, I.; Fitzsimons, M. Determination of 1-Aminopropan-2-one, a dissolved sewage component, in water samples. Water Res. 2001, 35, 1135–1140. [Google Scholar] [CrossRef]
- Takada, H.; Satoh, F.; Bother, M.H.; Tripp, B.W.; Johnson, C.G.; Farrington, J.W. Anthropogenic molecular markers: Tools to identify the sources and transport pathways of pollutants. In Molecular Markers in Environmental Geochemistry; American Chemical Society: Washington, DC, USA, 1997; pp. 178–195. [Google Scholar]
- Gäbler, H.-E.; Bahr, A. Boron isotope ratio measurements with a double-focusing magnetic sector ICP mass spectrometer for tracing anthropogenic input into surface and ground water. Chem. Geol. 1999, 156, 323–330. [Google Scholar] [CrossRef]
- Schreiber, I.M.; Mitch, W.A. Occurrence and fate of nitrosamines and nitrosamine precursors in waster-impacted surface waters using boron as a conservative tracer. Environ. Sci. Technol. 2006, 40, 3203–3210. [Google Scholar] [CrossRef] [PubMed]
- Heberer, T. Tracking persistent pharmaceutical residues from municipal sewage to drinking water. J. Hydrol. 2002, 266, 175–189. [Google Scholar] [CrossRef]
- Maeng, S.K.; Sharma, S.K.; Lekkerkerker-Teunissen, K.; Amy, G.L. Occurrence and fate of bulk organic matter and pharmaceutically active compounds in managed aquifer recharge: A review. Water Res. 2011, 45, 3015–3033. [Google Scholar] [CrossRef] [PubMed]
- Nakada, N.; Tanishima, T.; Shinohara, H.; Kiri, K.; Takada, H. Pharmaceutical chemicals and endocrine disrupters in municipal wastewater in Tokyo and their removal during activated sludge treatment. Water Res. 2006, 40, 3297–3303. [Google Scholar] [CrossRef] [PubMed]
- Harwood, J.J. Molecular markers for identifying municipal, domestic and agricultural sources of organic matter in natural waters. Chemosphere 2014, 95, 3–8. [Google Scholar] [CrossRef] [PubMed]
- Yang, X.; Chen, F.; Meng, F.; Xie, Y.; Chen, H.; Young, K.; Luo, W.; Ye, T.; Fu, W. Occurrence and fate of PPCPs and correlations with water quality parameters in urban riverine waters of the Pearl River Delta, South China. Environ. Sci. Pollut. Res. 2013, 20, 2564–5875. [Google Scholar] [CrossRef] [PubMed]
- Kolpin, D.W.; Furlong, E.T.; Meyer, M.T.; Thurman, E.M.; Zaugg, S.D.; Barber, L.B.; Buxton, H.T. Pharmaceuticals, hormones, and other organic wastewater contaminants in US streams, 1999–2000: A national reconnaissance. Environ. Sci. Technol. 2002, 36, 1202–1211. [Google Scholar] [CrossRef] [PubMed]
- Tixier, C.; Singer, H.P.; Oellers, S.; Müller, S.R. Occurrence and fate of carbamazepine, clofibric acid, diclofenac, ibuprofen, ketoprofen, and naproxen in surface waters. Environ. Sci. Technol. 2003, 37, 1061–1068. [Google Scholar] [CrossRef] [PubMed]
- Vystvna, Y.; Huneau, F.; Grynenko, V.; Vergeles, Y.; Celle-Jeanton, H.; Tapie, N.; Budzinski, H.; Coustumer, P.L. Pharmaceuticals in rivers of two regions with contrasted socio-economic conditions: Occurrence, accumulation, and comparison for Ukraine and France. Water Air Soil Pollut. 2012, 223, 2111–2124. [Google Scholar] [CrossRef]
- Foolad, M.; Ong, S.L.; Hu, J. Transport of sewage molecular markers through saturated soil column and effect of easily biodegradable primary substrate on their removal. Chemosphere 2015, 138, 553–559. [Google Scholar] [CrossRef] [PubMed]
- Gasser, G.; Rona, M.; Voloshenko, A.; Shelkov, R.; Tal, N.; Pankratov, I.; Elhanany, S.; Lev, O. Quantitative evaluation of tracers for quantification of wastewater contamination of potable water sources. Environ. Sci. Technol. 2010, 44, 3919–3925. [Google Scholar] [CrossRef] [PubMed]
- Kuroda, K.; Nakada, N.; Hanamoto, S.; Inaba, M.; Katayama, H.; Do, A.T.; Nga, T.T.V.; Oguma, K.; Hayashi, T.; Takizawa, S. Pepper mild mottle virus as an indicator and a tracer of fecal pollution in water environments: Comparative evaluation with wastewater-tracer pharmaceuticals in Hanoi, Vietnam. Sci. Total Environ. 2015, 506–507, 287–298. [Google Scholar] [CrossRef] [PubMed]
- Buerge, I.J.; Buser, H.-R.; Kahle, M.; Muller, M.D.; Poiger, T. Ubiquitous occurrence of the artificial sweetener acesulfame in the aquatic environment: An ideal chemical marker of domestic wastewater in groundwater. Environ. Sci. Technol. 2009, 43, 4381–4385. [Google Scholar] [CrossRef] [PubMed]
- Lange, F.; Scheurer, M.; Brauch, H.J. Artificial sweeteners—A recently recognized class of emerging environmental contaminants: A review. Anal. Bioanal. Chem. 2012, 403, 2503–2518. [Google Scholar] [CrossRef] [PubMed]
- Rodero, A.B.; Rodero, L.S.; Azoubel, R. Toxicity of sucralose in humans: A review. Int. J. Morphol. 2009, 27, 239–244. [Google Scholar] [CrossRef]
- Subedi, B.; Kannan, K. Fate of artificial sweeteners in wastewater treatment plants in New York State, USA. Environ. Sci. Technol. 2014, 48, 13668–13674. [Google Scholar] [CrossRef] [PubMed]
- Berset, J.; Ochsenbein, N. Stability considerations of aspartame in the direct analysis of artificial sweeteners in water samples using high-performance liquid chromatography-tandem mass spectrometry (HPLC-MS/MS). Chemosphere 2012, 88, 563–569. [Google Scholar] [CrossRef] [PubMed]
- Morlock, G.E.; Schuele, L.; Grashorn, S. Development of a quantitative high-performance thin-layer chromatographic method for sucralose in sewage effluent, surface water, and drinking water. J. Chromatogr. A 2011, 1218, 2745–2753. [Google Scholar] [CrossRef] [PubMed]
- Muller, C.E.; Gerecke, A.C.; Alder, A.C.; Scheringer, M.; Hungerbuhler, K. Identification of perfluoroalkyl acid sources in Swiss surface waters with the help of the artificial sweetener acesulfame. Environ. Pollut. 2011, 159, 1419–1426. [Google Scholar] [CrossRef] [PubMed]
- Perkola, N.; Sainio, P. Quantification of four artificial sweeteners in Finnish surface waters with isotope-dilution mass spectrometry. Environ. Pollut. 2014, 184, 391–396. [Google Scholar] [CrossRef] [PubMed]
- Scheurer, M.; Storck, F.R.; Graf, C.; Brauch, H.J.; Ruck, W.; Lev, O.; Lange, F.T. Correlation of six anthropogenic markers in wastewater, surface water, bank filtrate and soil aquifer treatment. J. Environ. Monit. 2011, 13, 966–973. [Google Scholar] [CrossRef] [PubMed]
- Batchu, S.R.; Ramirez, C.E.; Gardinali, P.R. Rapid ultra-trace analysis of sucralose in multiple-origin aqueous samples by online solid-phase extraction coupled to high-resolution mass spectrometry. Anal. Bioanal. Chem. 2015, 407, 3717–3725. [Google Scholar] [CrossRef] [PubMed]
- Tollefsen, K.E.; Nizzetto, L.; Huggett, D.B. Review Presence, fate and effects of the intense sweetener sucralose in the aquatic environment. Sci. Total Environ. 2012, 438, 510–516. [Google Scholar] [CrossRef] [PubMed]
- Soh, L.; Connors, K.A.; Brooks, B.W.; Zimmerman, J. Fate of sucralose through environmental and water treatment processes and impact on plant indicator species. Environ. Sci. Technol. 2011, 45, 1363–1369. [Google Scholar] [CrossRef] [PubMed]
- Roy, J.W.; Stempvoort, D.R.V.; Bickerton, G. Artificial sweeteners as potential tracers of municipal landfill leachate. Environ. Pollut. 2014, 184, 89–93. [Google Scholar] [CrossRef] [PubMed]
- Wolf, L.; Zwiener, C.; Zemann, M. Tracking artificial sweeteners and pharmaceuticals introduced into urban groundwater by leaking sewer networks. Sci. Total Environ. 2012, 430, 8–19. [Google Scholar] [CrossRef] [PubMed]
- James, C.A.; Miller-Schulze, J.P.; Ultican, S.; Gipe, A.D.; Baker, J.E. Evaluating contaminants of emerging concern as tracers of wastewater from septic systems. Water Res. 2016, 101, 241–251. [Google Scholar] [CrossRef] [PubMed]
- Poiger, T.; Field, J.A.; Field, T.M.; Siegrist, H.; Giger, W. Behavior of fluorescent whitening agents during sewage treatment. Water Res. 1998, 32, 1939–1947. [Google Scholar] [CrossRef]
- Hartel, P.G.; Hagedorn, C.; McDonald, J.L.; Fisher, J.A.; Saluta, M.A.; Dickerson, J.W.; Gentit, L.C.; Smith, S.L.; Mantripragada, N.S.; Ritter, K.J.; et al. Exposing water samples to ultraviolet light improves fluorometry for detecting human fecal contamination. Water Res. 2007, 41, 3629–3642. [Google Scholar] [CrossRef] [PubMed]
- Assaad, A.; Pontvianne, S.; Pon, M.N. Photodegradation-based detection of fluorescent whitening agents in a mountain river. Chemosphere 2014, 100, 27–33. [Google Scholar] [CrossRef] [PubMed]
- Dickerson, J.W.; Hagedorn, C.; Hassall, A. Detection and remediation of human-origin pollution at two public beaches in Virginia using multiple source tracking methods. Water Res. 2007, 41, 3758–3770. [Google Scholar] [CrossRef] [PubMed]
- Wen-Yen, H.; Meinschein, W.G. Sterols as source indicators of organic materials in sediments. Geochim. Cosmochim. Acta 1976, 3, 323–330. [Google Scholar] [CrossRef]
- Leeming, R.; Ball, A.; Ashbolt, N.; Nichols, P. Using faecal sterols from humans and animals to distinguish faecal pollution in receiving waters. Water Res. 1996, 30, 2893–2900. [Google Scholar] [CrossRef]
- Martins, C.C.; Fillmann, G.; Montne, R.C. Natural and anthropogenic sterols inputs in surface sediments of Patos Lagoon, Brazil. J. Braz. Chem. Soc. 2007, 18, 106–115. [Google Scholar] [CrossRef]
- Wang, J.Z.; Guan, Y.F.; Ni, H.G.; Liu, G.I.; Zeng, E.Y. Fecal steroids in riverine runoff of the Pearl River Delta, South China: Levels, potential sources and inputs to the coastal ocean. J. Environ. Monit. 2010, 12, 280–286. [Google Scholar] [CrossRef] [PubMed]
- Writer, J.H.; Leenheer, J.A.; Barber, L.B.; Amy, G.L.; Chapra, S.C. Sewage contamination in the upper Mississippi River as measured by the fecal sterol, coprostanol. Water Res. 1995, 29, 1427–1436. [Google Scholar] [CrossRef]
- Machado, K.S.; Froehner, S.; Sanez, J.; Figueira, R.C.L.; Ferrerira, P.A.L. Assessment of historical fecal contamination in Curitiba, Brazil, in the last 400 years using fecal sterols. Sci. Total Environ. 2014, 493, 1065–1072. [Google Scholar] [CrossRef] [PubMed] [Green Version]
- Serwin, M.R.; van Vleet, E.S.; Fossata, V.U.; Dolci, F. Coprostanol (5β-cholestan-3β-ol) in lagoonal sediments and mussels of Venice, Italy. Mar. Pollut. Bull. 1993, 26, 501–507. [Google Scholar] [CrossRef]
- Fattore, E.; Benfenati, E.; Marelli, R.; Cools, E.; Ranelli, R. Sterols in sediment samples from Venice Lagoon, Italy. Chemosphere 1996, 33, 2383–2393. [Google Scholar] [CrossRef]
- Grimalt, J.O.; Fernandez, P.; Bayona, J.M.; Albaiges, J. Assessment of fecal sterols and ketones as indicators of urban sewage inputs to coastal waters. Environ. Sci. Technol. 1990, 24, 357–363. [Google Scholar] [CrossRef]
- Chan, K.H.; Lam, M.H.W.; Poon, K.F.; Yeung, H.Y.; Chiu, T.K.T. Application of sedimentary fecal stanols and sterols in tracing sewage pollution in coastal waters. Water Res. 1998, 32, 225–235. [Google Scholar] [CrossRef]
- Patton, D.; Reeves, A.D. Sterol concentrations and temporal variations on the north shore mudflats of Firth of Tay, Scotland. Mar. Pollut. Bull. 1999, 38, 613–618. [Google Scholar] [CrossRef]
- Marvin, C.; Coakley, J.; Mayer, T.; Brown, M.; Thiessen, L. Application of faecal sterol ratios in sediments and effluents as source tracers. Water Qual. Res. J. Can. 2001, 36, 781–792. [Google Scholar]
- Bull, I.D.; Lockheart, M.J.; Elhmmali, M.M.; Roberts, D.J.; Evershed, R.P. The origin of faeces by means of biomarker detection. Environ. Int. 2002, 27, 647–654. [Google Scholar] [CrossRef]
- Reeves, A.D.; Patton, D. Faecal sterols as indicators of sewage contamination in estuarine sediments of the Tay Estuary, Scotland: An extended baseline survey. Hydrol. Earth Syst. Sci. 2005, 9, 81–94. [Google Scholar] [CrossRef]
- Devane, M.; Saunders, D.; Gilpin, B. Faecal sterols and fluorescent whiteners as indicators of the source of faecal contamination. Chem. N. Z. 2006, 70, 74–77. [Google Scholar]
- Bujagic, I.M.; Grujic, S.; Jaukovic, Z.; Lausevic, M. Sterol ratios as a tool for sewage pollution assessment of river sediments in Serbia. Environ. Pollut. 2016, 213, 76–83. [Google Scholar] [CrossRef] [PubMed]
- Froehner, S.; Martins, R.F.; Errera, M.R. Assessment of fecal sterols in Barigui River sediments in Curitiba, Brazil. Environ. Monit. Assess. 2009, 157, 591–600. [Google Scholar] [CrossRef] [PubMed]
- Wu, J.; Hu, R.; Yue, J.; Yang, Z.; Zhang, L. Determination of fecal sterols by gas chromatography-mass spectrometry with solid-phase extraction and injection-port derivatization. J. Chromatogr. A 2009, 1216, 1053–1058. [Google Scholar] [CrossRef] [PubMed]
- Quemeneur, M.; Marty, Y. Fatty acids and sterols in domestic wastewaters. Water Res. 1994, 28, 1217–1226. [Google Scholar] [CrossRef]
- Carreira, R.S.; Wagener, A.L.R.; Readman, J.W. Sterols as markers of sewage contamination in a tropical urban estuary (Guanabara Bay, Brazil): Space-time variations. Estuar. Coast. Shelf Sci. 2004, 60, 587–598. [Google Scholar] [CrossRef]
- Zhang, C.; Wang, Y.; Qi, S. Identification and significance of sterols in MSW landfill leachate. J. Chromatogr. B 2008, 874, 1–6. [Google Scholar] [CrossRef] [PubMed]
- Alsalahi, M.A.; Latif, M.T.; Ali, M.M.; Dominick, D.; Khan, M.F.; Mustaffa, N.I.H.; Nadzir, M.S.M.; Nasher, E.; Zakaria, M.P. Sterols as biomarkers in the surface microlayer of the estuarine areas. Mar. Pollut. Bull. 2015, 93, 278–283. [Google Scholar] [CrossRef] [PubMed]
- Gottschall, N.; Topp, E.; Edwards, M.; Payne, M.; Kleywegt, S.; Russell, P.; Lapen, D.R. Hormones, sterols, and fecal indicator bacteria in groundwater, soil, and subsurface drainage following a high single application of municipal biosolids to a field. Chemosphere 2013, 91, 275–286. [Google Scholar] [CrossRef] [PubMed]
- Jarde, E.; Gruau, G.; Mansuy-Huault, L. Detection of manure-derived organic compounds in rivers draining agricultural areas of intensive manure spreading. Appl. Geochem. 2007, 22, 1814–1824. [Google Scholar] [CrossRef]
- Furtula, V.; Liu, J.; Chambers, P.; Osachoff, H.; Kennedy, C.; Harkness, J. Sewage treatment plants efficiencies in removal of sterols and sterol ratios as indicators of fecal contamination sources. Water Air Soil Pollut. 2012, 223, 1017–1031. [Google Scholar] [CrossRef]
- Standley, L.J.; Kaplan, L.A.; Smith, D. Molecular tracers of organic mattersourcesto surface water resources. Environ. Sci. Technol. 2000, 34, 3124–3130. [Google Scholar] [CrossRef]
- Gourmelon, M.; Caprais, M.; Mieszkin, S.; Marti, R.; Wery, N.; Jarde, E.; Derrien, M.; Jadas-Hecart, A.; Cmmunal, P.Y.; Jaffrezic, A.; et al. Development of microbial and chemical MST tools to identify the origin of the faecal pollution in bathing and shellfish harvesting waters in France. Water Res. 2010, 44, 4812–4824. [Google Scholar] [CrossRef] [PubMed] [Green Version]
- Leeming, R.; Latham, V.; Rayner, M.; Nichols, P. Detecting and distinguishing sources of sewage pollution in Australian Island and coastal waters and sediments. ACS Symp. Ser. 1997, 671, 306–319. [Google Scholar]
- Ahmed, W.; Kirs, M.; Gilpin, B. Source tracking in Australia and New Zealand: Case studies. In Microbial Source Tracking: Methods, Applications, and Case Studies; Hagedorn, C., Blanch, A., Harwood, V., Eds.; Springer: New York, NY, USA, 2011; pp. 485–513. [Google Scholar]
- Nash, D.; Leeming, R.; Clemow, L.; Hannah, M.; Hallliwell, D.; Allen, D. Quantitative determination of sterols and other alcohols in overland flow from grazing land and possible source materials. Water Res. 2005, 39, 2964–2978. [Google Scholar] [CrossRef] [PubMed]
- Roser, D.; Leeming, R.; Ashbolt, N.; Gardner, T.; Stewart, J. Estimating non-point source contamination loadsusing faecal sterols, bacterial indicators and hydrology. In Proceedings of the 9th International Riversymposium ‘Managing Rivers with Climate Change and Expanding Populations’, Brisbane, Australia, 4–7 September 2006.
- Cockburn, A.; Brambilla, G.; Fernandez, M.L.; Arcella, D.; Bordajandi, L.R.; Cottrill, B.; van Peteghem, C.; Dorne, J.L. Nitrite in feed: From animal health to human health. Toxicol. Appl. Pharmacol. 2013, 270, 209–217. [Google Scholar] [CrossRef] [PubMed]
- Terblanche, A. Health hazards of nitrite in drinking water. Water. SA 1991, 17, 77–82. [Google Scholar]
- Islam, M.S.; Ahmed, M.K.; Raknuszzaman, M.; Habibullah-Al-Mamun, M.; Islam, M.K. Heavy metal pollution in surface water and sediment: A preliminary assessment of an urban river in a developing country. Ecol. Indic. 2015, 48, 282–291. [Google Scholar] [CrossRef]
- Seiler, R.L.; Zaugg, S.D.; Thomas, J.M.; Howcroft, D.L. Caffeine and pharmaceuticals as indicators of waste water contamination in wells. Groundwater 1999, 37, 405–410. [Google Scholar] [CrossRef]
- Kreitler, C.W. Nitrogen-isotope ratio studies of soils and groundwater nitrate from alluvial fan aquifers in Texas. J. Hydrol. 1979, 42, 147–170. [Google Scholar] [CrossRef]
- Katz, B.G.; Griffin, D.W. Using chemical and microbiological indicators to track the impacts from the land application of treat municipal wastewater and other sources on groundwater quality in a karstic spring basin. Environ. Geol. 2008, 55, 801–821. [Google Scholar] [CrossRef]
- Nigro, A.; Sappa, G.; Barbieri, M. Application of boron and tritium isotopes for tracing landfill contamination in groundwater. J. Geochem. Explor. 2017, 172, 101–108. [Google Scholar] [CrossRef]
- Xu, Z.; Wang, L.; Yin, H.; Li, H.; Schwegler, B.R. Source apportionment of non-storm water entries into storm drains using marker species: Modeling approach and verification. Ecol. Indic. 2016, 61, 546–557. [Google Scholar] [CrossRef]
- Vane, C.H.; Kim, A.W.; McGowan, S.; Leng, M.J.; Heaton, T.H.E.; Kendrick, C.P.; Coombs, P.; Yang, H.; Swann, G.E.A. Sedimentary records of sewage pollution using faecal markers in contrasting pen-urban shallow lakes. Sci. Total Environ. 2010, 409, 345–356. [Google Scholar] [CrossRef] [PubMed] [Green Version]
- Buser, H.R.; Poiger, T.; Muller, M.D. Occurrence and environmental behavior of the chiral pharmaceutical drug ibuprofen in surface waters and wastewater. Environ. Sci. Technol. 1999, 33, 2529–2535. [Google Scholar] [CrossRef]
- Kagle, J.; Porter, A.W.; Murdoch, R.W.; Rivera-Cancel, G.; Hay, A.G. Chapter 3 Biodegradation of Pharmaceutical and personal care products. In Advances in Applied Microbiology; Allen, I., Laskin, S.S., Geoffrey, M.G., Eds.; Academic Press: Cambridge, MA, USA, 2009; pp. 65–108. [Google Scholar]
- Mrozik, W.; Stefanska, J. Adsorption and biodegration of antidiabetic pharmaceuticals in soils. Chemosphere 2014, 95, 281–288. [Google Scholar] [CrossRef] [PubMed]
- Yamaji, N.; Hayakawa, K.; Takada, H. Role of photodegradation in the fate of fluorescent whitening agents (FWAs) in lacustrine environments. Environ. Sci. Technol. 2010, 44, 7796–7801. [Google Scholar] [CrossRef] [PubMed]
- Yu, L.; Fink, G.; Wintgens, T.; Melin, T.; Terner, T.A. Sorption behavior of potential organic wastewater indicators with soils. Water Res. 2009, 43, 951–960. [Google Scholar] [CrossRef] [PubMed]
- Badruzzaman, M.; Oppenheimer, J.A.; Jacangelo, J.G. Impact of environmental conditions on the suitability of microconstituents as markers for determining nutrient loading from reclaimed water. Water Res. 2013, 47, 6198–6210. [Google Scholar] [CrossRef] [PubMed]
- Tran, N.H.; Hu, J.; Ong, S.L. Simultaneous determination of PPCPs, EDCs and artificial sweeteners in environmental water samples using a single-step SPE coupled with HPLC-MS/MS and isotope dilution. Talanta 2013, 113, 82–92. [Google Scholar] [CrossRef] [PubMed]
- Kosma, C.I.; Lambropoulou, D.A.; Albanis, T.A. Investigation of PPCPs in wastewater treatment plants in Greece: Occurrence, removal and environmental risk assessment. Sci. Total Environ. 2014, 466–467, 421–438. [Google Scholar] [CrossRef] [PubMed]
- Gros, M.; Petrovic, M.; Barcelo, D. Development of a multi-residue analytical methodology based on liquid chromatography-tandem mass spectrometry (LC-MS/MS) for screening and trace level determination of pharmaceuticals in surface and wastewaters. Talanta 2006, 70, 678–690. [Google Scholar] [CrossRef] [PubMed]
- Rio, H.D.; Suarez, J.; Puertas, J.; Ures, P. PPCPs wet weather mobilization in a combined sewer in NW Spain. Sci. Total Environ. 2013, 449, 189–198. [Google Scholar] [PubMed]
- Terzic, S.; Senta, I.; Ahel, M.; Gros, M.; Petrovic, M.; Barcelo, D.; Muller, J.; Knepper, T.; Marti, I.; Ventura, F.; et al. Occurrence and fate of emerging wastewater contaminants in Western Balkan Region. Sci. Total Environ. 2008, 399, 66–77. [Google Scholar] [CrossRef] [PubMed]
- Moldovan, Z. Occurrences of pharmaceutical and personal care products as miropollutants in rivers from Romania. Chemosphere 2006, 64, 1808–1817. [Google Scholar] [CrossRef] [PubMed]
- Gómez, M.J.; Martínez Bueno, M.J.; Lacorte, S.; Fernández-Alba, A.R.; Agüera, A. Pilot survey monitoring pharmaceuticals and related compounds in a sewage treatment plant located on the Mediterranean coast. Chemosphere 2007, 66, 993–1002. [Google Scholar]
- Kim, S.D.; Cho, J.; Kim, I.S.; Vanderford, B.J.; Snyder, S.A. Occurrence and removal of pharmaceuticals and endocrine disruptors in South Korean surface, drinking, and wastewaters. Water Res. 2007, 41, 1013–1021. [Google Scholar] [CrossRef] [PubMed]
- Lin, A.Y.-C.; Yu, T.-H.; Lateef, S.K. Removal of pharmaceuticals in secondary wastewater treatment processes in Taiwan. J. Hazard. Mater. 2009, 167, 1163–1169. [Google Scholar] [CrossRef] [PubMed]
- Writer, J.H.; Ferrer, I.; Barber, L.B.; Thurman, E.M. Widespread occurrence of neuro-active pharmaceuticals and metabolites in 24 Minnesota rivers and wastewaters. Sci. Total Environ. 2013, 461–462, 519–527. [Google Scholar] [CrossRef] [PubMed]
- Almeida, C.; Nogueira, J.M.F. Determination of trace levels of parabens in real matrices by bar adsorptive microextraction using selective sorbent phases. J. Chromatogr. A 2014, 1348, 17–26. [Google Scholar] [CrossRef] [PubMed]
- Gabet-Giraud, V.; Miege, C.; Jacquet, R.; Coquery, M. Impact of wastewater treatment plants on receiving surface waters and a tentative risk evaluation: The case of estrogens and beta blockers. Environ. Sci. Pollut. Res. 2014, 21, 1708–1722. [Google Scholar] [CrossRef] [PubMed]
- Vieno, N.M.; Harkki, H.; Tuhkanen, T.; Kronberg, L. Occurrence of pharmaceuticals in river water and their elimination in a pilot-scale drinking water treatment plant. Environ. Sci. Technol. 2007, 41, 5077–5084. [Google Scholar] [CrossRef] [PubMed]
- Roberts, P.H.; Thomas, K.V. The occurrence of selected pharmaceuticals in wastewater effluent and surface waters of the lower Tyne catchment. Sci. Total Environ. 2006, 356, 143–153. [Google Scholar] [CrossRef] [PubMed]
- Lindstrom, A.; Buerge, I.; Poiger, T.; Bergzvist, P.-A.; Muller, M.; Buser, H.-R. Occurrence and environmental behaviour of the bactericide triclosan and its methyl derivative in surface waters and in wastewater. Environ. Sci. Technol. 2002, 36, 2322–2329. [Google Scholar] [CrossRef] [PubMed]
- Singer, H.; Muller, S.; Tixier, C.; Pillonel, L. Triclosan: Occurrence and fate of a widely used biocide in the aquatic environment: Field measurements in wastewater treatment plants, surface waters and lake sediments. Environ. Sci. Technol. 2002, 36, 4998–5004. [Google Scholar] [CrossRef] [PubMed]
- You, L.; Nguyen, V.T.; Pal, A.; Chen, H.; He, Y.; Reinhard, M.; Gin, K.Y.-H. Investigation of pharmaceuticals, personal care products and endocrine disrupting chemicals in a tropical urban catchment and the influence of environmental factors. Sci. Total Environ. 2015, 536, 955–963. [Google Scholar] [CrossRef] [PubMed]
- Behera, S.K.; Kim, H.W.; Oh, J.E.; Park, H.S. Occurrence and removal of antibiotics, hormones and several other pharmaceuticals in wastewater treatment plants of the largest industrial city of Korea. Sci. Total Environ. 2011, 409, 4351–4360. [Google Scholar] [CrossRef] [PubMed]
- Ying, G.G.; Kookana, R.S. Triclosan in wastewaters and biosolids from Australian wastewater treatment plants. Environ. Int. 2007, 33, 199–205. [Google Scholar] [CrossRef] [PubMed]
- Santos, L.H.M.L.M.; Gros, M.; Rodriguez-Mozaz, S.; Delerue-Matos, C.; Pena, A.; Barceló, D.; Montenegro, M.C.B.S.M. Contribution of hospital effluents to the load of pharmaceuticals in urban wastewaters: Identification of ecologically relevant pharmaceuticals. Sci. Total Environ. 2013, 461–462, 302–316. [Google Scholar] [CrossRef] [PubMed]
- Kasprzyk-Hordern, B.; Dinsdale, R.M.; Guwy, A.J. The occurrence of pharmaceuticals, personal care products, endocrine disruptors and illicit drugs in surface water in South Wales, UK. Water Res. 2008, 42, 3498–3518. [Google Scholar] [CrossRef] [PubMed]
- Lopez-Serna, R.; Perez, S.; Ginebreda, A.; Petrovic, M.; Barcelo, D. Fully automated determination of 74 pharmaceuticals in environmental and waste waters by online solid phase extraction-liquid chromatography-electrospray-tandem mass spectrometry. Talanta 2010, 83, 410–424. [Google Scholar] [CrossRef] [PubMed]
- Ordonez, E.Y.; Quintana, J.B.; Rodil, R.; Cela, R. Determination of artificial sweeteners in water samples by solid-phase extraction and liquid chromatography-tandem mass spectrometry. J. Chromatogr. A 2012, 1256, 197–205. [Google Scholar] [CrossRef] [PubMed]
- Gan, Z.; Sun, H.; Wang, R.; Feng, B. A novel solid-phase extraction for the concentration of sweeteners in water and analysis by ion-pair liquid chromatography-triple quadrupole mass spectrometry. J. Chromatogr. A 2013, 1274, 87–96. [Google Scholar] [CrossRef] [PubMed]
- Gilli, G.; Rovere, R.; Traversi, D.; Schiliro, T.; Pignata, C. Faecal sterols determination in wastewater and surface water. J. Chromatogr. B 2006, 843, 120–124. [Google Scholar] [CrossRef] [PubMed]
- Guitart, C.; Readman, J.W. Critical evaluation of the determination of pharmaceuticals, personal care products, phenolica endocrine disrupters and faecal steroids by GC/MS and PTV-GC/MS in environmental waters. Anal. Chim. Acta 2010, 658, 32–40. [Google Scholar] [CrossRef] [PubMed]
- Cathum, S.; Sabik, H. Determination of steroids and coprostanol in surface water, effluent and mussel using gas chromatography-mass spectrometry. Chromatographia 2001, 53, 394–399. [Google Scholar] [CrossRef]
- Andrasi, N.; Molnar, B.; Dobos, B.; Vasanits-Zsigrai, A.; Zaray, G.; Molnar-Perl, I. Determination of steroids in the dissolved and in the suspended phases of wastewater and Danube River samples by gas chromatography, tandem mass spectrometry. Talanta 2013, 115, 367–373. [Google Scholar] [CrossRef] [PubMed]
- Chen, H.-C.; Wang, S.-P.; Ding, W.-H. Determination of fluorescent whitening agents in environmental waters by soild-phase extraction and ion pair liquid chromatography-tandem mass spectrometry. J. Chromatogr. A 2006, 1102, 135–142. [Google Scholar] [CrossRef] [PubMed]
- Richard, P.E.; Philip, H.B. Application of multimolecular biomarker techniques to the identification of fecal material in archaeological soils and sediments. ACS Symp. Ser. 1996, 625, 157–172. [Google Scholar]
- Mudge, S.M.; Seguel, C.G. Organic contamination of San Vicente bay, Chile. Mar. Pollut. Bull. 1999, 38, 1011–1021. [Google Scholar] [CrossRef]
- McCalley, D.V.; Cooke, M.; Nickless, G. Effect of sewage treatment on faecal sterols. Water Res. 1981, 15, 1019–1025. [Google Scholar] [CrossRef]
- Kuroda, K.; Murakami, M.; Oguma, K.; Takada, H.; Takizawa, S. Investigating sources and pathways of perfluoroalkyl acids (PFAAs) in aquifers in Tokyo using multiple tracers. Sci. Total Environ. 2014, 488–489, 51–60. [Google Scholar] [CrossRef] [PubMed]
- Gregor, J.; Garrett, N.; Gilpin, B.; Randall, C.; Saunders, D. Use of classification and regression tree (CART) analysis with chemical faecal indicators to determine source of contamination. N. Z. J. Mar. Freshw. Res. 2002, 36, 387–398. [Google Scholar] [CrossRef]
- Nodler, K.; Hillebrand, O.; Idzik, K.; Strathmann, M.; Schiperski, F.; Zirlewagen, J.; Licha, T. Occurrence and fate of the angiotensin II receptor antagonist transformation product valsartan acid in the water cycle—A comparative study with selected b-blockers and the persistent anthropogenic wastewater indicators carbamazepine and acesulfame. Water Res. 2013, 47, 6650–6659. [Google Scholar] [CrossRef] [PubMed]
- Nodler, K.; Tsakiri, M.; Licha, T. The impact of different proportions of a treated effluent on the biotransformation of selected micro-contaminants in river water microcosms. Int. J. Environ. Res. Public Health 2014, 11, 10390–10405. [Google Scholar] [CrossRef] [PubMed]
- Schaffer, M.; Kroger, K.F.; Nodler, K.; Ayora, C.; Carrera, J.; Hernandez, M.; Licha, T. Influence of a reactive layer on the attenuation of 28 selected organic micropollutants under realistic soil aquifer treatment conditions: Insights from a large scale column experiment. Water Res. 2015, 74, 110–121. [Google Scholar] [CrossRef] [PubMed]
- Sidhu, J.P.S.; Ahmed, W.; Gernjak, W.; Aryal, R.; McCarthy, D.; Palmer, A.; Kolotelo, P.; Toze, S. Sewage pollution in urban stormwater runoff as evident from the widespread presence of multiple microbial and chemical source tracking markers. Sci. Total Environ. 2013, 463–464, 488–496. [Google Scholar] [CrossRef] [PubMed]


| Group | Compounds | CAS No. | Reference |
|---|---|---|---|
| Pharmaceuticals and personal care products (PPCPs) | Acetaminophen | 103-90-2 | [34,35,36,37] |
| Diclofenac | 15307-86-5 | [35,38] | |
| Caffeine | 58-08-2 | [7,15,17,34,35,36,37,39,40,41,42,43,44,45] | |
| Bisphenol A | 80-05-7 | [9,35] | |
| Propyl paraben | 94-13-3 | [35] | |
| Triclocarbon | 101-20-2 | [17,35] | |
| Metoprolol | 37350-58-6 | [35,46] | |
| Propanolol | 525-66-6 | [38] | |
| Ibupofren | 15687-27-1 | [34,38,47] | |
| Atenolol | 29122-68-7 | [38] | |
| Carbamazepine | 298-46-4 | [36,38,43,48,49,50] | |
| Oxypurinol | 2465-59-0 | [51] | |
| Artificial sweeteners (ASs) | Sucralose | 56038-13-2 | [52,53,54,55,56,57,58] |
| Acesulfame | 55589-62-3 | [45,53,59] | |
| Cyclamate | 139-05-9 | [59] | |
| Fluorescent whitening agents (FWAs) | 4,4′-bis(2-sulfostyryl)biphenyl | 27344-41-8 | [60,61,62] |
| 4,4′-bis[(4-anilino-6-morpholino-1,3,5-triazin-2-yl)amino]stilbene-2,2′-disulfonate | 16090-02-1 | [60,61,63] | |
| Sterols/Stanols (SSs) | Coprostanol | 360-68-9 | [37,64,65,66,67] |
| Epicoprostanol | 516-95-0 | [64,65,67,68,69] | |
| Campestanol | 474-60-2 | [64,67,68] | |
| Sitostanol | 83-45-4 | [64,67,69] | |
| 24-ethylcoprostanol | 4736-91-8 | [64,67,68,69,70] | |
| 24-ethylepicoprostanol | 5060-24-2 | [64,67] | |
| Cholesterol | 57-88-5 | [65,66,67,68,69] | |
| Cholestanol | 80-97-7 | [65,67,68] | |
| Isotopic compositions | δ15N | 29817-79-6 | [71] |
| δ18O | 14797-71-8 | [71] | |
| Alternative potential markers | 1-aminopropanone | 107-10-8 | [72,73,74,75] |
| Boron | 7440-42-8 | [76,77] | |
| Total trihalomethanes | - | [71] |
| SS Ratio | Level of Wastewater Contamination | Reference | ||
|---|---|---|---|---|
| Certain | Unsure | No Contamination | ||
| >0.7 | 0.3–0.7 | <0.3 | [65,67,69,112,115,116,117,118,119,120,121,122,123] | |
| >0.7 | 0.3–0.7 | <0.3 | [67,120,121] | |
| <0.2 | 0.2–0.8 | >0.8 | [65,124] | |
| >1.0 | - | <1.0 | [108,115,118,121,123,125,126,127,128,129] | |
| >0.06 | - | - | [69,112,123,130] | |
| >1.5 | - | <1.5 | [115,118,121,128] | |
| SS Ratio | Value | Origin | Reference |
|---|---|---|---|
| >3.7 | Pig | [131,132] | |
| <0.7 | Chicken, cow | ||
| 30–75 | Human and herbivore | [122] [131,132] | |
| >1.5 | Pig, chicken, cow | ||
| <1 | Human | ||
| >0.1 | Cattle, horse, deer | [132,133] | |
| <0.01 | Human | ||
| >1.0 | Bovine manures | [69,134] | |
| <1.0 | Human or porcine feces | ||
| >0.73 | Human | [69,135] | |
| <0.38 | Herbivores | ||
| >4 | Plant decay | [136,137] | |
| <1 | Fecal source | ||
| >1 | Human | [122,136] | |
| >0.8 | Human | [138] | |
| <1 | Herbivore | [136] |
| Chemical Marker | Wastewater | Location | Reference | Surface Water | Location | Reference | ||||
| Concentration (ng/L) | Concentration (ng/L) | |||||||||
| Reporting Limit | Mean | Range | Reported Limit | Mean | Range | |||||
| Acetaminophen | 5.0 | 1530–337,035 | Singapore | [154] | 0.1 | nd–12.5 | Jiulong River, China | [35] | ||
| 119.1 | 2872.5 | 120.5–6421.6 | Ioannina City, Greece | [155] | 5.0 | 25–1163 | Singapore | [154] | ||
| 58 | 10,194 | 130–26,090 | Croatia | [156] | 5.0 | 44.3 | na–203.2 | Ireland | [36] | |
| Diclofenac | 3.0 | nd–950 | Singapore | [154] | 0.1 | 0.819–11.0 | Jiulong River, China | [35] | ||
| 77.8 | 100.8 | 81.1–143 | Ioannina City, Greece | [155] | 6.0 | 55 | 3–180 | Ensanche, Spain | [157] | |
| 30 | 250 | 50–540 | Croatia | [156] | 5.0 | 5 | nd–60 | Spain | [156] | |
| 10 | 859 | 50–4200 | Bosnia and Herzegovina, Crotia and Serbia | [158] | ||||||
| Caffeine | 10.0 | 4219–359,400 | Singapore | [154] | 0.1 | 8.07–3060 | Jiulong River, China | [35] | ||
| 9.0 | 32,894 | na–47,030 | Greater Montreal, Sweden | [39] | 30.0 | 428.2–9699.8 | Somes River, Romania | [159] | ||
| 10.0 | 127 | US | [52] | 5.0 | 265–14,418 | Singapore | [154] | |||
| 37.2 | 26,107.5 | 17,047.1–36,238.0 | Ioannina City, Greece | [155] | 10.0 | 13–300 | US | [52] | ||
| Chemical Marker | Wastewater | Location | Reference | Surface Water | Location | Reference | ||||
| Concentration (ng/L) | Concentration (ng/L) | |||||||||
| Reporting Limit | Mean | Range | Reported Limit | Mean | Range | |||||
| 1.0 | 1180 | 52,000–192,000 | Almeria, Spain | [160] | 9.0 | 112 | na–781 | Greater Montreal, Sweden | [39] | |
| 10.0 | 228 | 23–776 | South Korea | [161] | 0.25 | 65.9 | na–216.7 | Ireland | [36] | |
| 0.5 | 5173–17,500 | Taipei, Taiwan | [162] | 4.3 | na–522 | Greece | [45] | |||
| 10.0 | 105 | 2.9–194 | South Korea | [161] | ||||||
| Carbamazepine | 0.5 | 6.1–939 | Singapore | [154] | 30.0 | nd–75.1 | Somes River, Romania | [159] | ||
| 2.0 | 246 | na–618 | Greater Montreal, Sweden | [39] | 0.3 | 0.5–53.5 | Singapore | [154] | ||
| 5.0 | 416 | US | [52] | 2.0 | 5 | na–22 | Greater Montreal, Sweden | [39] | ||
| 0.1 | 460–1700 | Israel | [48] | 5.0 | 31–190 | US | [52] | |||
| 15.8 | 98.8 | 29.8–221.6 | Ioannina City, Greece | [155] | 0.5 | 5.8 | na–30.1 | Ireland | [36] | |
| na | 71–1300 | US | [163] | |||||||
| Bisphenol A | 10.0 | nd–839 | Singapore | [154] | 1.0 | nd–925 | Jiulong River, China | [35] | ||
| 7.0 | 1400 | 720–3400 | Almeria, Spain | [160] | 5.0 | nd–324 | Singapore | [154] | ||
| 13 | 510 | nd–2060 | Bosnia and Herzegovina, Crotia and Serbia | [158] | ||||||
| Chemical Marker | Wastewater | Location | Reference | Surface Water | Location | Reference | ||||
| Concentration (ng/L) | Concentration (ng/L) | |||||||||
| Reporting Limit | Mean | Range | Reported Limit | Mean | Range | |||||
| Propyl paraben | 300 | nd-500 | Portugal | [164] | 0.1 | 0.440–69.9 | Jiulong River, China | [35] | ||
| Metoprolol | 12 | nd–15.2 | Coimbra, Portugal | [39] | 0.1 | 0.788–36.0 | Jiulong River, China | [35] | ||
| na | 77 | 22–223 | Lyon, Fran | [165] | 3.8 | 39–107 | River Vantaa, Finland | [166] | ||
| Ibuprofen | 350 | 2633.4 | 418.2–8890.1 | Ioannina City, Greece | [155] | 30.0 | nd–115.2 | Somes River, Romania | [159] | |
| na | 1979–33,764 | Tyne, UK | [167] | 6.0 | 1277 | 1100–5297 | Ensanche, Spain | [157] | ||
| Oxypurinol | 25 | 2800–26,600 | Germany | [51] | 25 | 90–22,600 | Germany | [51] | ||
| Triclosan | 1.0 | 500–1300 | Switzerland | [168] | 0.4 | nd–74 | Switzerland | [168] | ||
| 5.0 | 42–213 | Switzerland | [169] | 0.1 | 0.11–4.77 | Singapore | [170] | |||
| 147.6 | 202.7 | nd–527.9 | Ioannina City, Greece | [155] | ||||||
| 1.399 | 547 | 247–785 | Ulsan, Korea | [171] | ||||||
| 3.0 | 23–434 | Australia | [172] | |||||||
| Atenelol | 11 | 361–751 | Coimbra, Portugal | [173] | 30.0 | 72 | nd–250 | Spain | [156] | |
| na | 1043 | 388–2450 | Lyon, France | [165] | 1.0 | nd–560 | South Wales, UK | [174] | ||
| 66.35 | 117.82 | Llobregat, Spain | [175] | 11.8 | 17–55 | River Vantaa, Finland | [166] | |||
| Salicylic acid | 272.0 | 42,348.1 | 4138.4–89,133.5 | Ioannina City, Greece | [155] | 0.3 | nd–302 | South Wales, UK | [174] | |
| Chemical Marker | Wastewater | Location | Reference | Surface Water | Location | Reference | ||||
| Concentration (ng/L) | Concentration (ng/L) | |||||||||
| Reporting Limit | Mean | Range | Reported Limit | Mean | Range | |||||
| 76.69 | 674.33 | Llobregat, Spain | [175] | 13.05 | 208.17 | Llobregat, Spain | [175] | |||
| 3.0 | 7.94–112 | Singapore | [170] | |||||||
| Acesulfame | 5.0 | 187–75,093 | Singapore | [154] | 3.5 | 5–350 | Singapore | [154] | ||
| 25 | 28–9600 | Finland | [96] | |||||||
| 3.0 | 1070–51,200 | Shanghai, China | [146] | 1.0 | na–178 | Greece | [45] | |||
| 20 | 24,800–26,700 | Spain | [176] | 10 | 400–53,700 | Spain | [176] | |||
| 0.6 | 11,600 | Tianjin, China | [177] | 0.6 | 2730–4650 | Tianjin, China | [177] | |||
| Aspartame | 15.0 | nd–2262 | Singapore | [154] | 1.0 | nd–76.8 | Tianjin, China | [177] | ||
| 1.0 | 64.7 | Tianjin, China | [177] | |||||||
| cyclamate | 5.0 | 300–250,348 | Singapore | [154] | 1.04.0 | 28–1406 | Singapore | [154] | ||
| 200 | 25,900–36,400 | Spain | [176] | 13.0 | nd–210 | Finland | [96] | |||
| 0.9 | 27,600 | Tianjin, China | [177] | 0.9 | 205–313 | Tianjin, China | [177] | |||
| saccharin | 5.0 | 500–135,759 | Singapore | [154] | 3.0 | 40–810 | Singapore | [154] | ||
| 500 | 18,400–22,300 | Spain | [176] | 25 | nd–490 | Finland | [96] | |||
| 1.1 | 10,300 | Tianjin, China | [177] | 1.1 | 193–746 | Tianjin, China | [177] | |||
| Sucralose | 50.0 | 100–4719 | Singapore | [154] | 100.0 | 120–10,000 | US | [52] | ||
| 100.0 | 27,000 | US | [52] | 200.0 | nd–1000 | Finland | [96] | |||
| 5.7 | 8418 | US | [98] | |||||||
| Chemical Marker | Wastewater | Location | Reference | Surface Water | Location | Reference | ||||
| Concentration (ng/L) | Concentration (ng/L) | |||||||||
| Reporting Limit | Mean | Range | Reported Limit | Mean | Range | |||||
| 500 | 3000–5300 | Spain | [176] | 250 | 400–5300 | Spain | [176] | |||
| 6.3 | 20,600 | Tianjin, China | [177] | 6.3 | 287–311 | Tianjin, China | [177] | |||
| Coprostanol | 6000 | 34,300 | 32,500–36,800 | Northern Italy | [178] | 6000 | 8700 | 8300–9200 | Po River, Italy | [178] |
| na | 26,700 | Malaysia | [66] | 10.0 | 15.5–277.6 | Singapore | [125] | |||
| 5.8 | 202,000 | Plymouth, UK | [179] | 2.0 | 2–67 | Canada | [180] | |||
| 24-ethylcoprostanol | 6000 | 67,100 | 63,900–70,200 | Northern Italy | [178] | |||||
| Cholesterol | na | 58,000 | Malaysia | [66] | 1.3 | 37–189.6 | Singapore | [125] | ||
| 5.2 | 32,000 | Plymouth, UK | [179] | 3.38 | 13.9–534 | Danubi, Hungary | [181] | |||
| Stigmasterol | na | 1800 | Malaysia | [66] | 4.50 | nd–188 | Danubi, Hungary | [181] | ||
| 4.50 | 170–48,500 | Hungary | [181] | |||||||
| Sitosterol | na | 1500 | Malaysia | [66] | 1.32 | 21.5–1796 | Danubi, Hungary | [181] | ||
| 2000 | na–2900 | US | [14] | |||||||
| Stigmastanol | na | 5600 | Malaysia | [66] | ||||||
| 2000 | nd–1200 | US | [14] | |||||||
| Chemical Marker | Wastewater | Location | Reference | Surface Water | Location | Reference | ||||
| Concentration (ng/L) | Concentration (ng/L) | |||||||||
| Reporting Limit | Mean | Range | Reported Limit | Mean | Range | |||||
| 4,4′-bis[(4-anilino-6-morpholino-1,3,5-triazin-2-yl)amino]stilbene-2,2′-disulfonate | 5.0 | 2900–8200 | Tokyo, Japan | [60] | 3.0 | 6–120 | Switzerland | [61] | ||
| 18.0 | 42 | Taiwan | [182] | 5.0 | 1000 | Tokyo, Japan | [60] | |||
| 45 | nd–485 | Japan | [151] | |||||||
| 4,4′-bis(2-sulfostyryl)biphenyl | 0.4 | 11,100–21,900 | Tokyo, Japan | [60] | 3.0 | 10–70 | Switzerland | [61] | ||
| 4.0 | 185 | Taiwan | [182] | 0.4 | 100–6400 | Tokyo, Japan | [60] | |||
| 4.0 | Nd-425 | Lao-Jie river, Taiwan | [182] | |||||||
© 2017 by the authors. Licensee MDPI, Basel, Switzerland. This article is an open access article distributed under the terms and conditions of the Creative Commons Attribution (CC BY) license ( http://creativecommons.org/licenses/by/4.0/).
Share and Cite
Lim, F.Y.; Ong, S.L.; Hu, J. Recent Advances in the Use of Chemical Markers for Tracing Wastewater Contamination in Aquatic Environment: A Review. Water 2017, 9, 143. https://doi.org/10.3390/w9020143
Lim FY, Ong SL, Hu J. Recent Advances in the Use of Chemical Markers for Tracing Wastewater Contamination in Aquatic Environment: A Review. Water. 2017; 9(2):143. https://doi.org/10.3390/w9020143
Chicago/Turabian StyleLim, Fang Yee, Say Leong Ong, and Jiangyong Hu. 2017. "Recent Advances in the Use of Chemical Markers for Tracing Wastewater Contamination in Aquatic Environment: A Review" Water 9, no. 2: 143. https://doi.org/10.3390/w9020143