Article

Controlling the Formation of the Reaction Zone around an Injection Well during Subsurface Iron Removal

Faculty of Civil Engineering & Architecture, University of Applied Sciences Dresden, Germany
*
Author to whom correspondence should be addressed.
Water 2017, 9(2), 87; https://doi.org/10.3390/w9020087
Submission received: 30 November 2016 / Accepted: 26 January 2017 / Published: 31 January 2017
(This article belongs to the Special Issue Water Quality Considerations for Managed Aquifer Recharge Systems)

Abstract

:
Tracer and pump tests including depth dependent water sampling were performed to investigate the flow conditions inside and in the vicinity of an injection well with two screen segments used for subsurface iron removal (SIR). A high resolution groundwater flow model of the well and the adjacent aquifer with vertically varying dissolved iron concentration was calibrated and used to plan measures to manipulate the vertical outflow distribution of injected oxygen enriched water. The optimized injection regime was adopted in a pilot SIR test with the aim of increasing the treatment efficacy through a depth specific injection of water using an inflatable packer. When water was injected conventionally above the pump, the outward migration of the oxygen enriched water was non-uniform and disproportional to the iron concentration and resulted in an early iron breakthrough in the lower screen. The proportion of water injected into the lower iron-rich part of the aquifer increased as a packer was placed inside the well to seal 4/5 of the upper well screen length. Thereby, the efficiency coefficient increased by 50% and iron removal by 25%. The treatment efficiency at the site suffered from low alkalinity and pH-values below 5. Higher efficiency coefficients may have been achieved by the addition of alkalis prior to injection.

1. Introduction

In subsurface iron removal (SIR), oxygen-enriched water is periodically injected into the aquifer for the creation of a reaction zone [1]. The shape of the reaction zone depends mainly on the location and length of the well screen and the hydrogeological structure of the aquifer [2]. Olthoff [3] showed through the analysis of sediment core drillings next to a multi-year operated SIR-well that the shape of the reaction zone was similar to a convex lens and that the center of the reaction zone was displaced upwards. However, the complex hydraulic system of well screen, gravel pack and adjacent aquifer can still not be very well described with analytical nor numerical tools [4], and the reaction zone is therefore geometrically abstracted as a cylinder [5,6,7] or graphically illustrated as a spherical reaction zone [8,9,10].
In order to account for aquifer heterogeneity, a short "appropriate" filter length is recommended for SIR-wells [5,11]. This measure shall provide a clearly defined, nearly cylindrical and controllable reaction zone. It will allow the establishment of a buffer zone around the well to prevent well clogging and sustain sufficient retention time for the oxidation of adsorbed iron as velocity decreases with increasing distance from the well. DVGW (German Association for Gas and Water) [11] recommends a maximum well screen entrance velocity of 5–10 m/h. In practice, it is assumed that up to 50% of the open intake area may be blocked by the gravel pack surface or grains from well development. Hence, vertical wells are often designed for economic and safety reasons with long well screens to reduce screen intake velocities and achieve a high yield. During the injection phase, oxygen enriched water is normally injected in the blank casing above the screen and the submersible pump resulting in a non-uniform outflow distribution along the well screen pipe of an abstraction well [12]. Assuming a homogenous aquifer, the lateral extent of the reaction zone will therefore decrease with depth because injection and abstraction wells can be treated physically and constructively in a similar manner [13]. In addition to the aquifer soil heterogeneity, groundwater quality often varies with the depth. In the latter case, the injected dissolved oxygen concentration will be distributed disproportional to the dissolved iron concentration in water and result in a low efficiency coefficient. This coefficient is the ratio of volume abstracted (Vout) to volume injected (Vin) and characterizes the system efficiency [9]. Measures that were tested to increase the efficiency coefficient include the use of technical oxygen [5,14,15,16], the use of drinking water as infiltrate [17] and the addition of alkalis to stabilize the pH value [16,18]. Well designed optimization approaches have been investigated for abstraction wells in order to reduce mixing of aerobic and anaerobic groundwater (which can cause iron incrustations) [19,20], reduce screen entry losses (which are negligible and only a few centimeters) by placing well pump intakes in the screen [21,22] and to manipulate the inflow distribution through a suction flow control device [23]. The possibilities to adjust the injected dissolved oxygen concentration to the vertical dissolved iron concentration have not yet been investigated in detail.
This paper presents a novel approach to increase the treatment efficiency of vertical SIR injection wells with multiple or long well screens penetrating an aquifer with varying dissolved iron concentrations. Pumping and tracer tests were performed to characterize the flow conditions in and around an injection well in order to calibrate a numerical groundwater flow model. The model was used to simulate the formation of the reaction zone and to identify the possibilities to hydraulically optimize the outflow distribution during injection. Later, a pilot SIR test was performed based on preliminary investigations with the goal of increasing the efficiency coefficient through a manipulated injection regime in comparison to a conventional free injection, where the outflow distribution matches the inflow distribution.

2. Materials and Methods

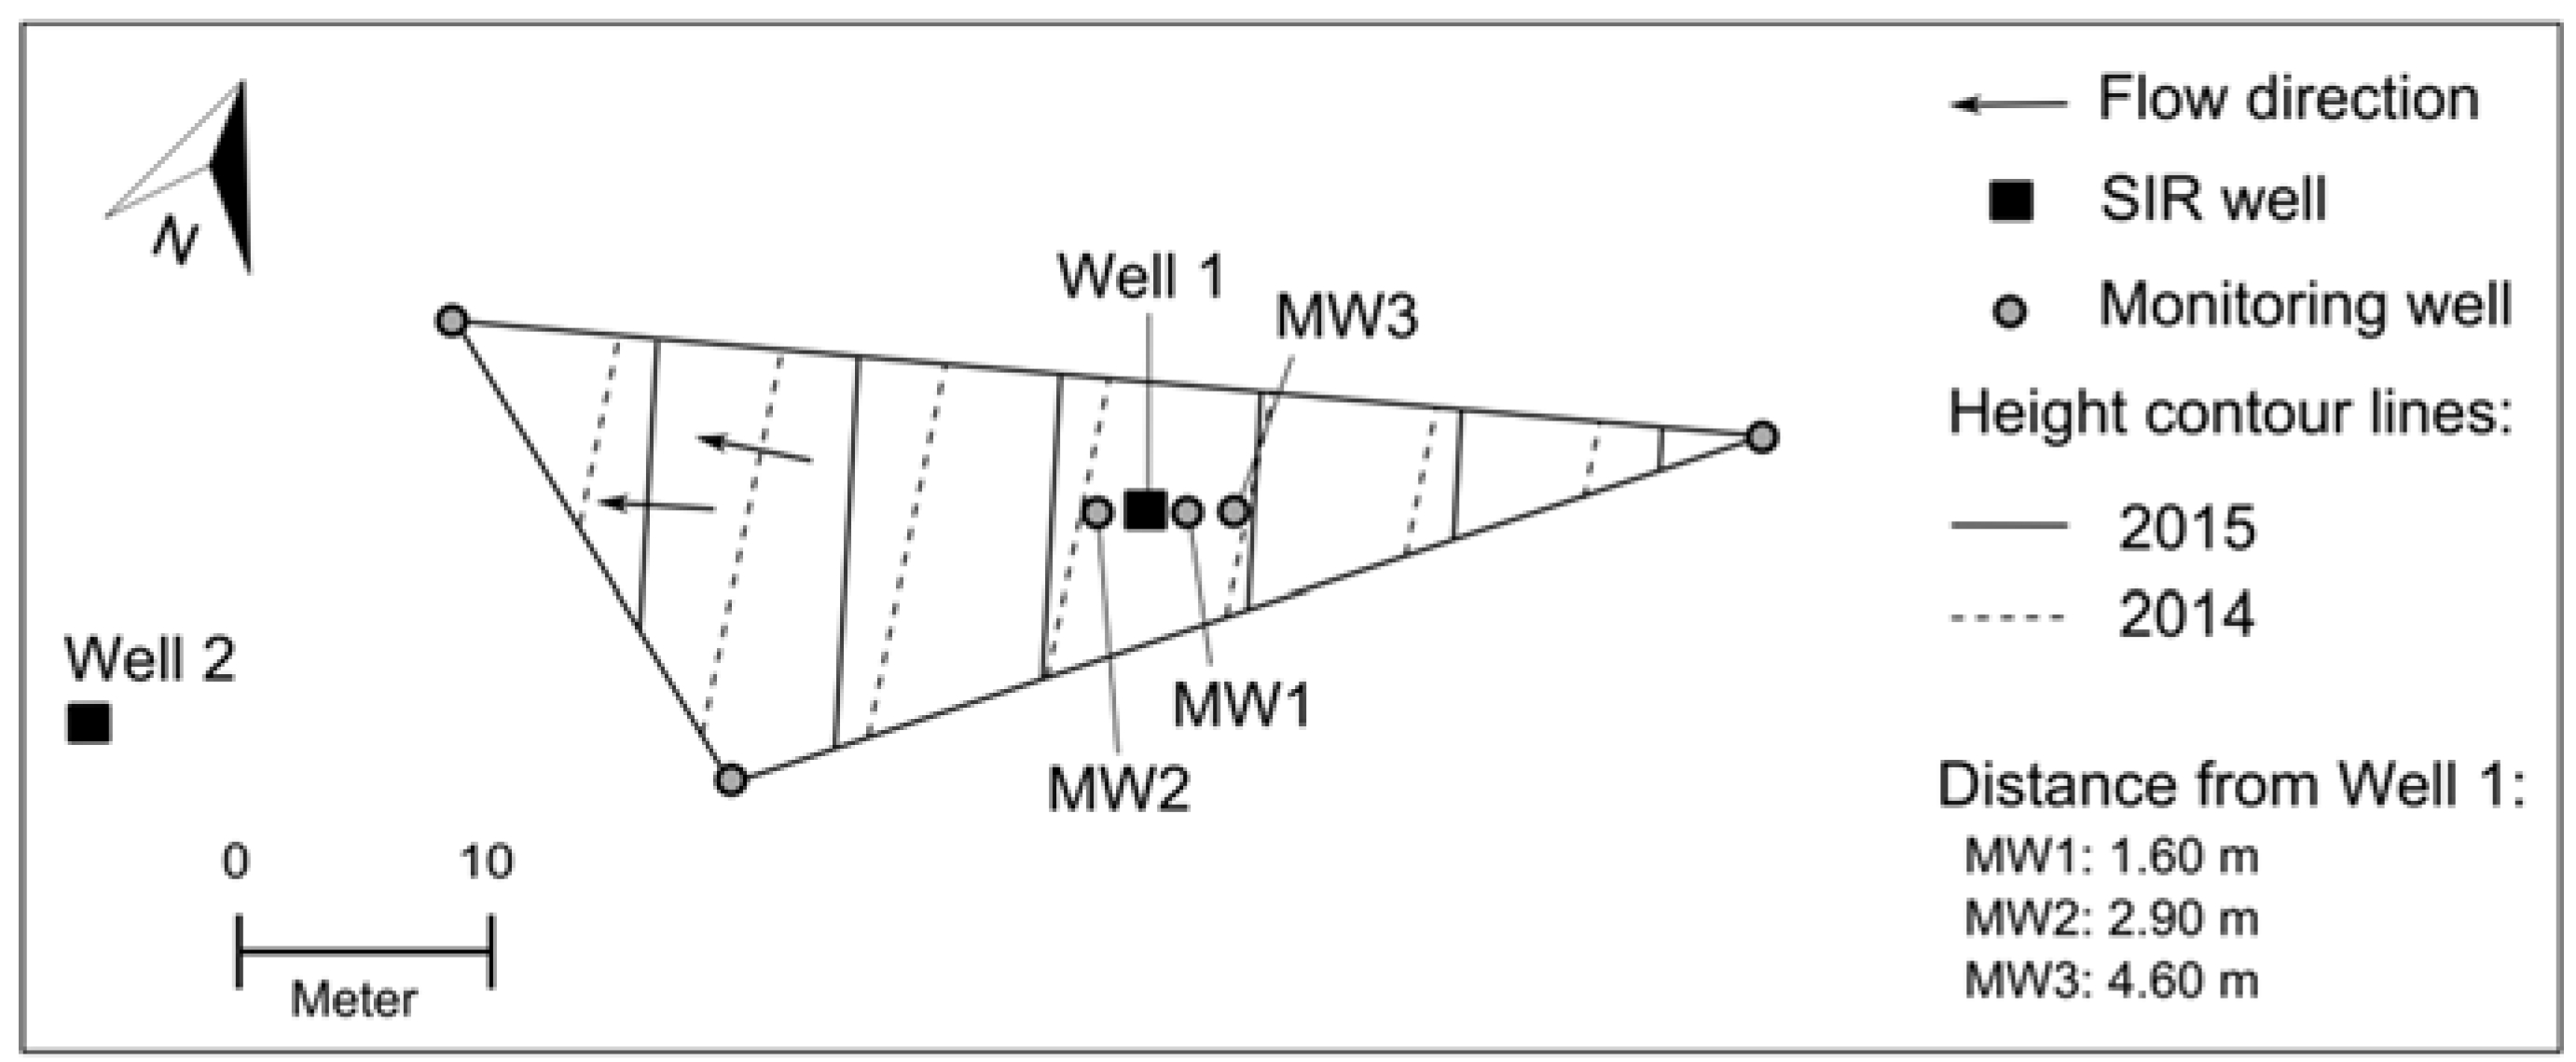
2.1. Field Site Description
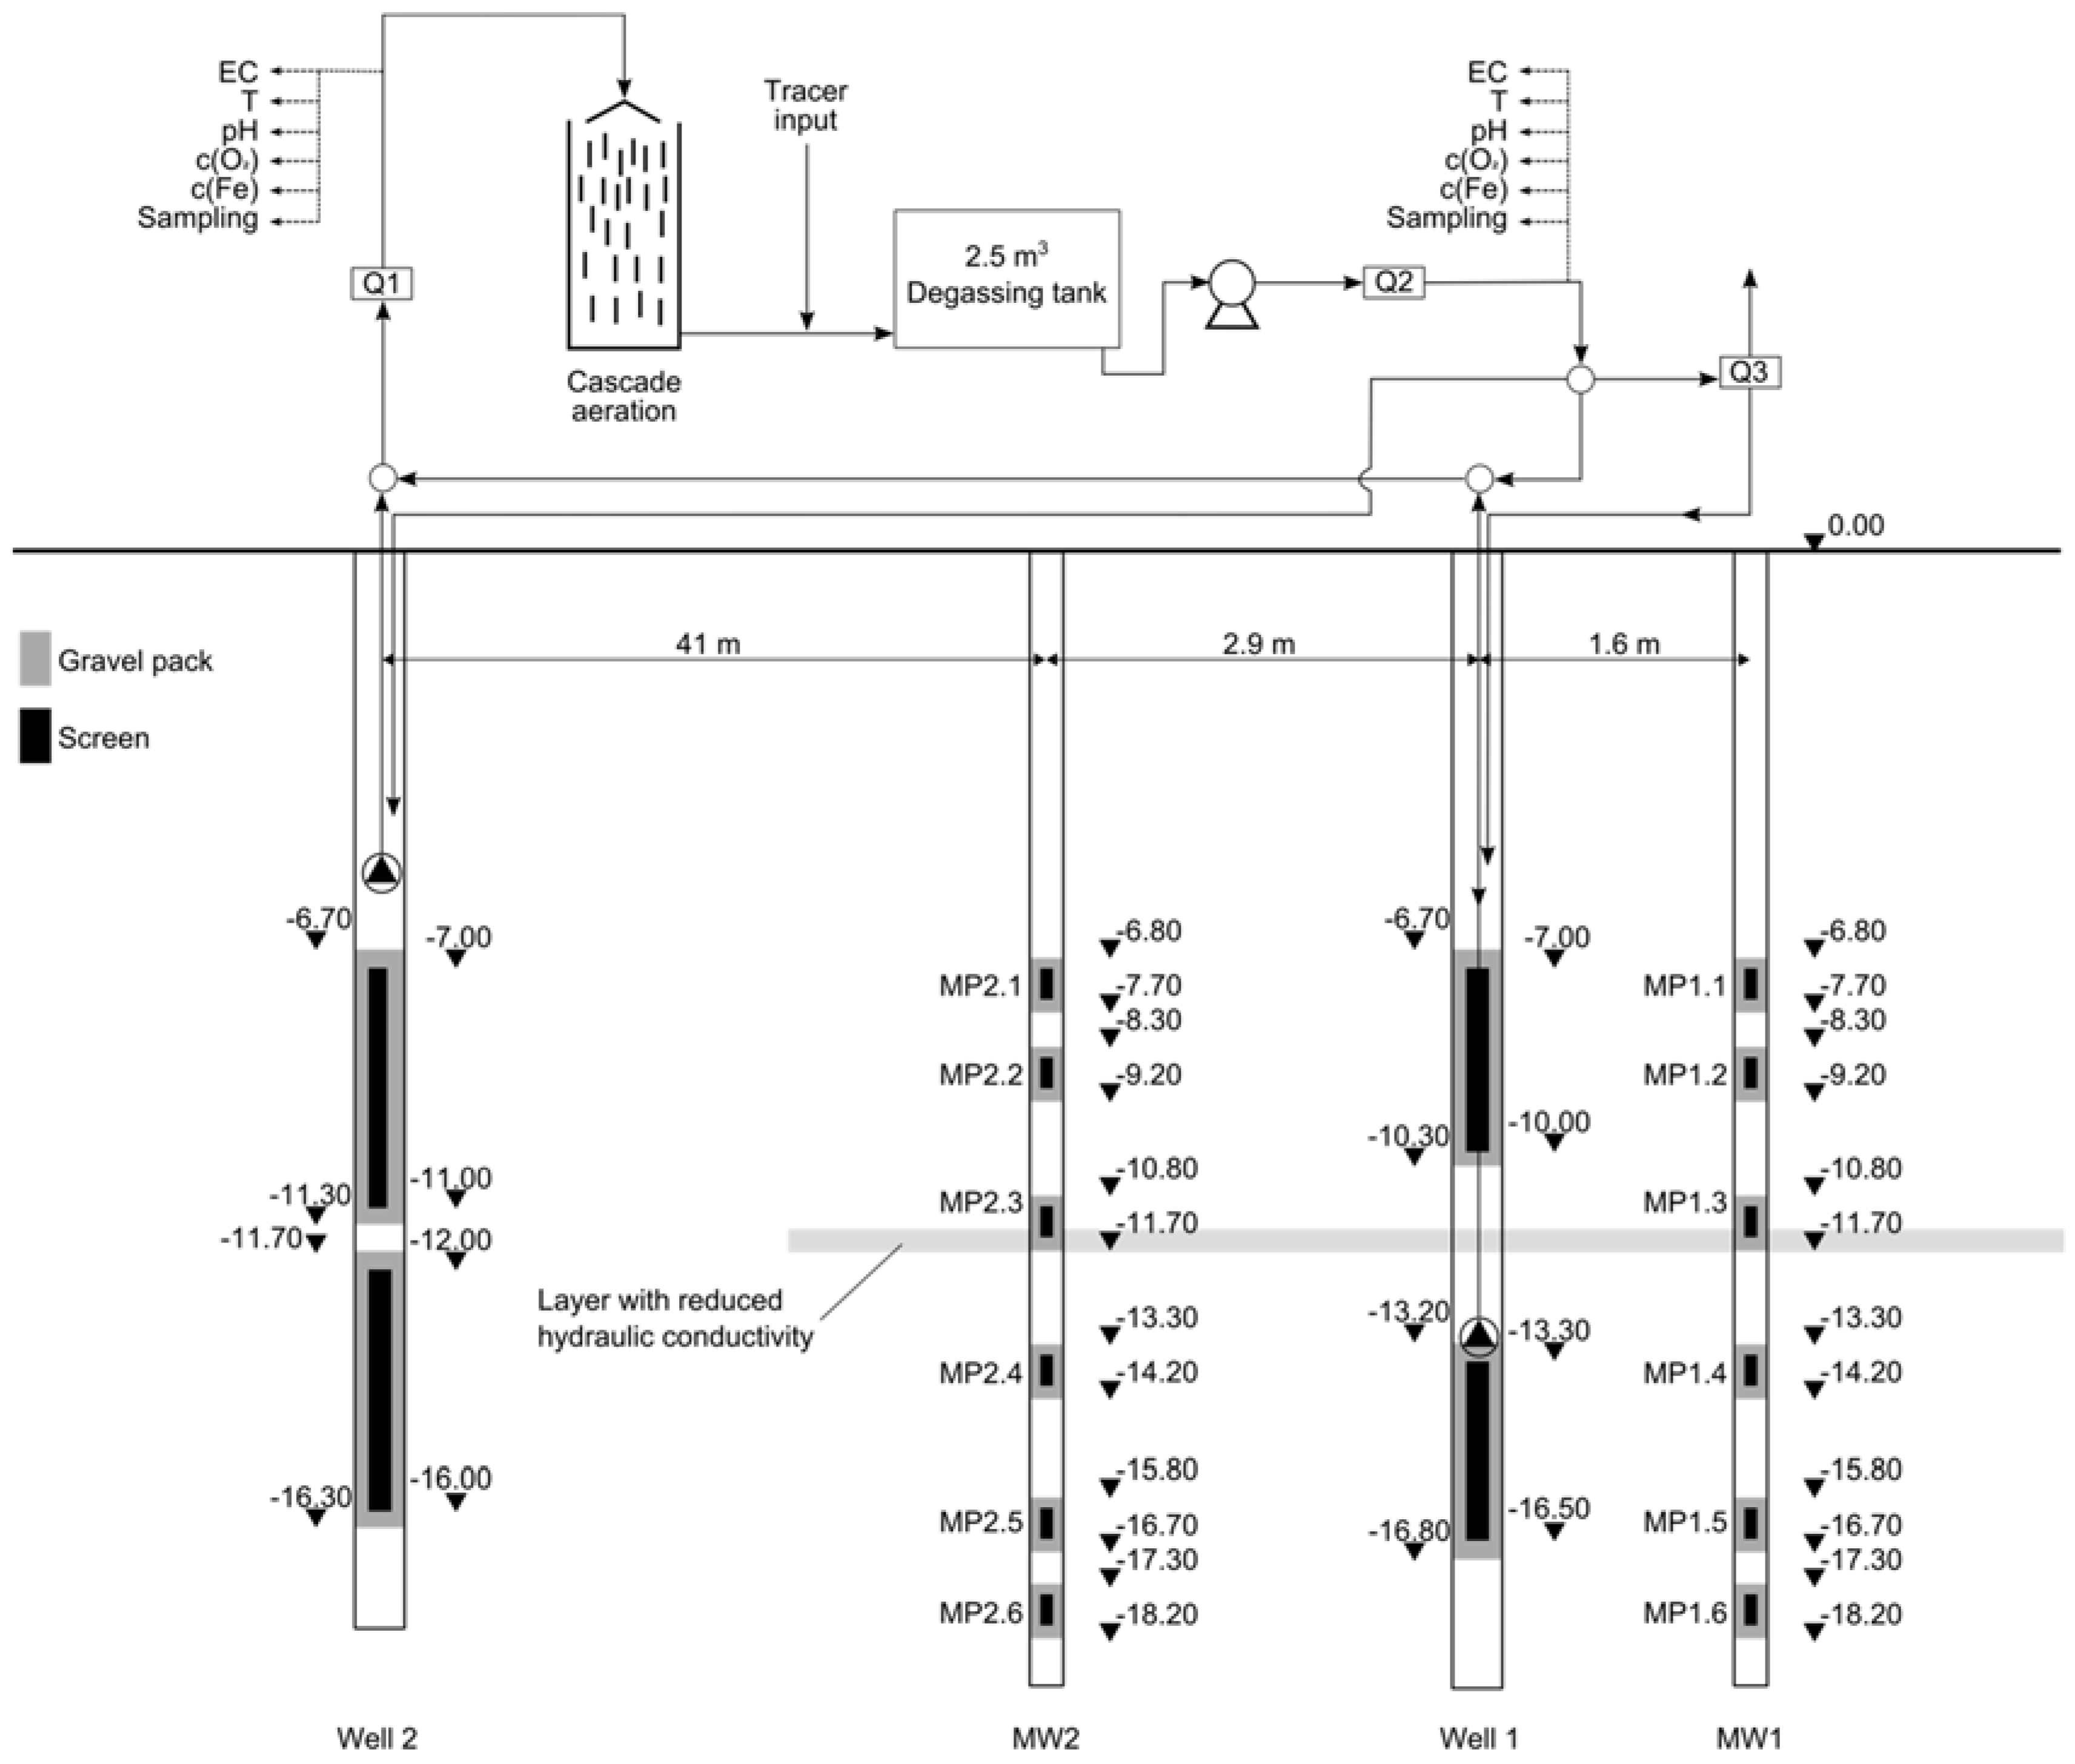
SIR tests were performed in a quaternary sand and gravel aquifer that is stratified into two (sub)aquifers separated by a layer with a reduced hydraulic conductivity (K-value). The groundwater level was 2.4 m below surface and total water saturated thickness of the aquifer was 15.7 m. Pumping test analysis yielded an average K-value of 18.1 m/d. The top of the 0.5 m thick layer with a reduced K-value is located 11.3 m below surface. For this layer, grain size analysis (dry sieving) revealed a higher fine sand and silt content, which resulted in a calculated K-value of 8.64 m/d using Beyer’s formula [24]. Wet sieving would have provided a more accurate and probably lower value. The natural groundwater flow velocity was calculated to 0.14–0.18 m/d based on water level data from adjacent observation wells and assuming a porosity of 0.3.

2.2. Well Design

Two fully penetrating 320 mm diameter vertical wells equipped with two 125 mm diameter well screens and located 41 m apart from each other were used alternately for injection and abstraction (Figure 1). Well 1 had two 3.0 m long wire-screens (slot size 0.75 mm) separated by a 3.5 m blank casing with an outer clay sealing. Only Well 1 was equipped with an inflatable packer (L = 3 m) to control the outflow movement of the infiltrate. Well 2 had two 4.0 m long slotted well screens separated by 1.0 m blank casing (Figure 2). The grain size diameter of the gravel pack was 2–3.15 mm. For depth specific monitoring of changes in groundwater quality around Well 1, multilevel packer sampling systems [25] were installed inside two identical 80 mm diameter monitoring wells (MW) with multiple monitoring points (MP) placed from 6.8 to 18.2 m depth below surface and at a distance of 1.6 and 2.9 m from Well 1. The MWs consisted of 0.5 m long, 0.75 mm slotted well screens with 0.5–1.6 m thick outer clay sealing between the filters (2–3.15 mm). Water samples were pumped from the MPs above surface using pneumatic micro-double-valve pumps (type 409i, Solinst Ltd., Georgetown, Canada), which operated fully automatically and were attached to a tube packer.

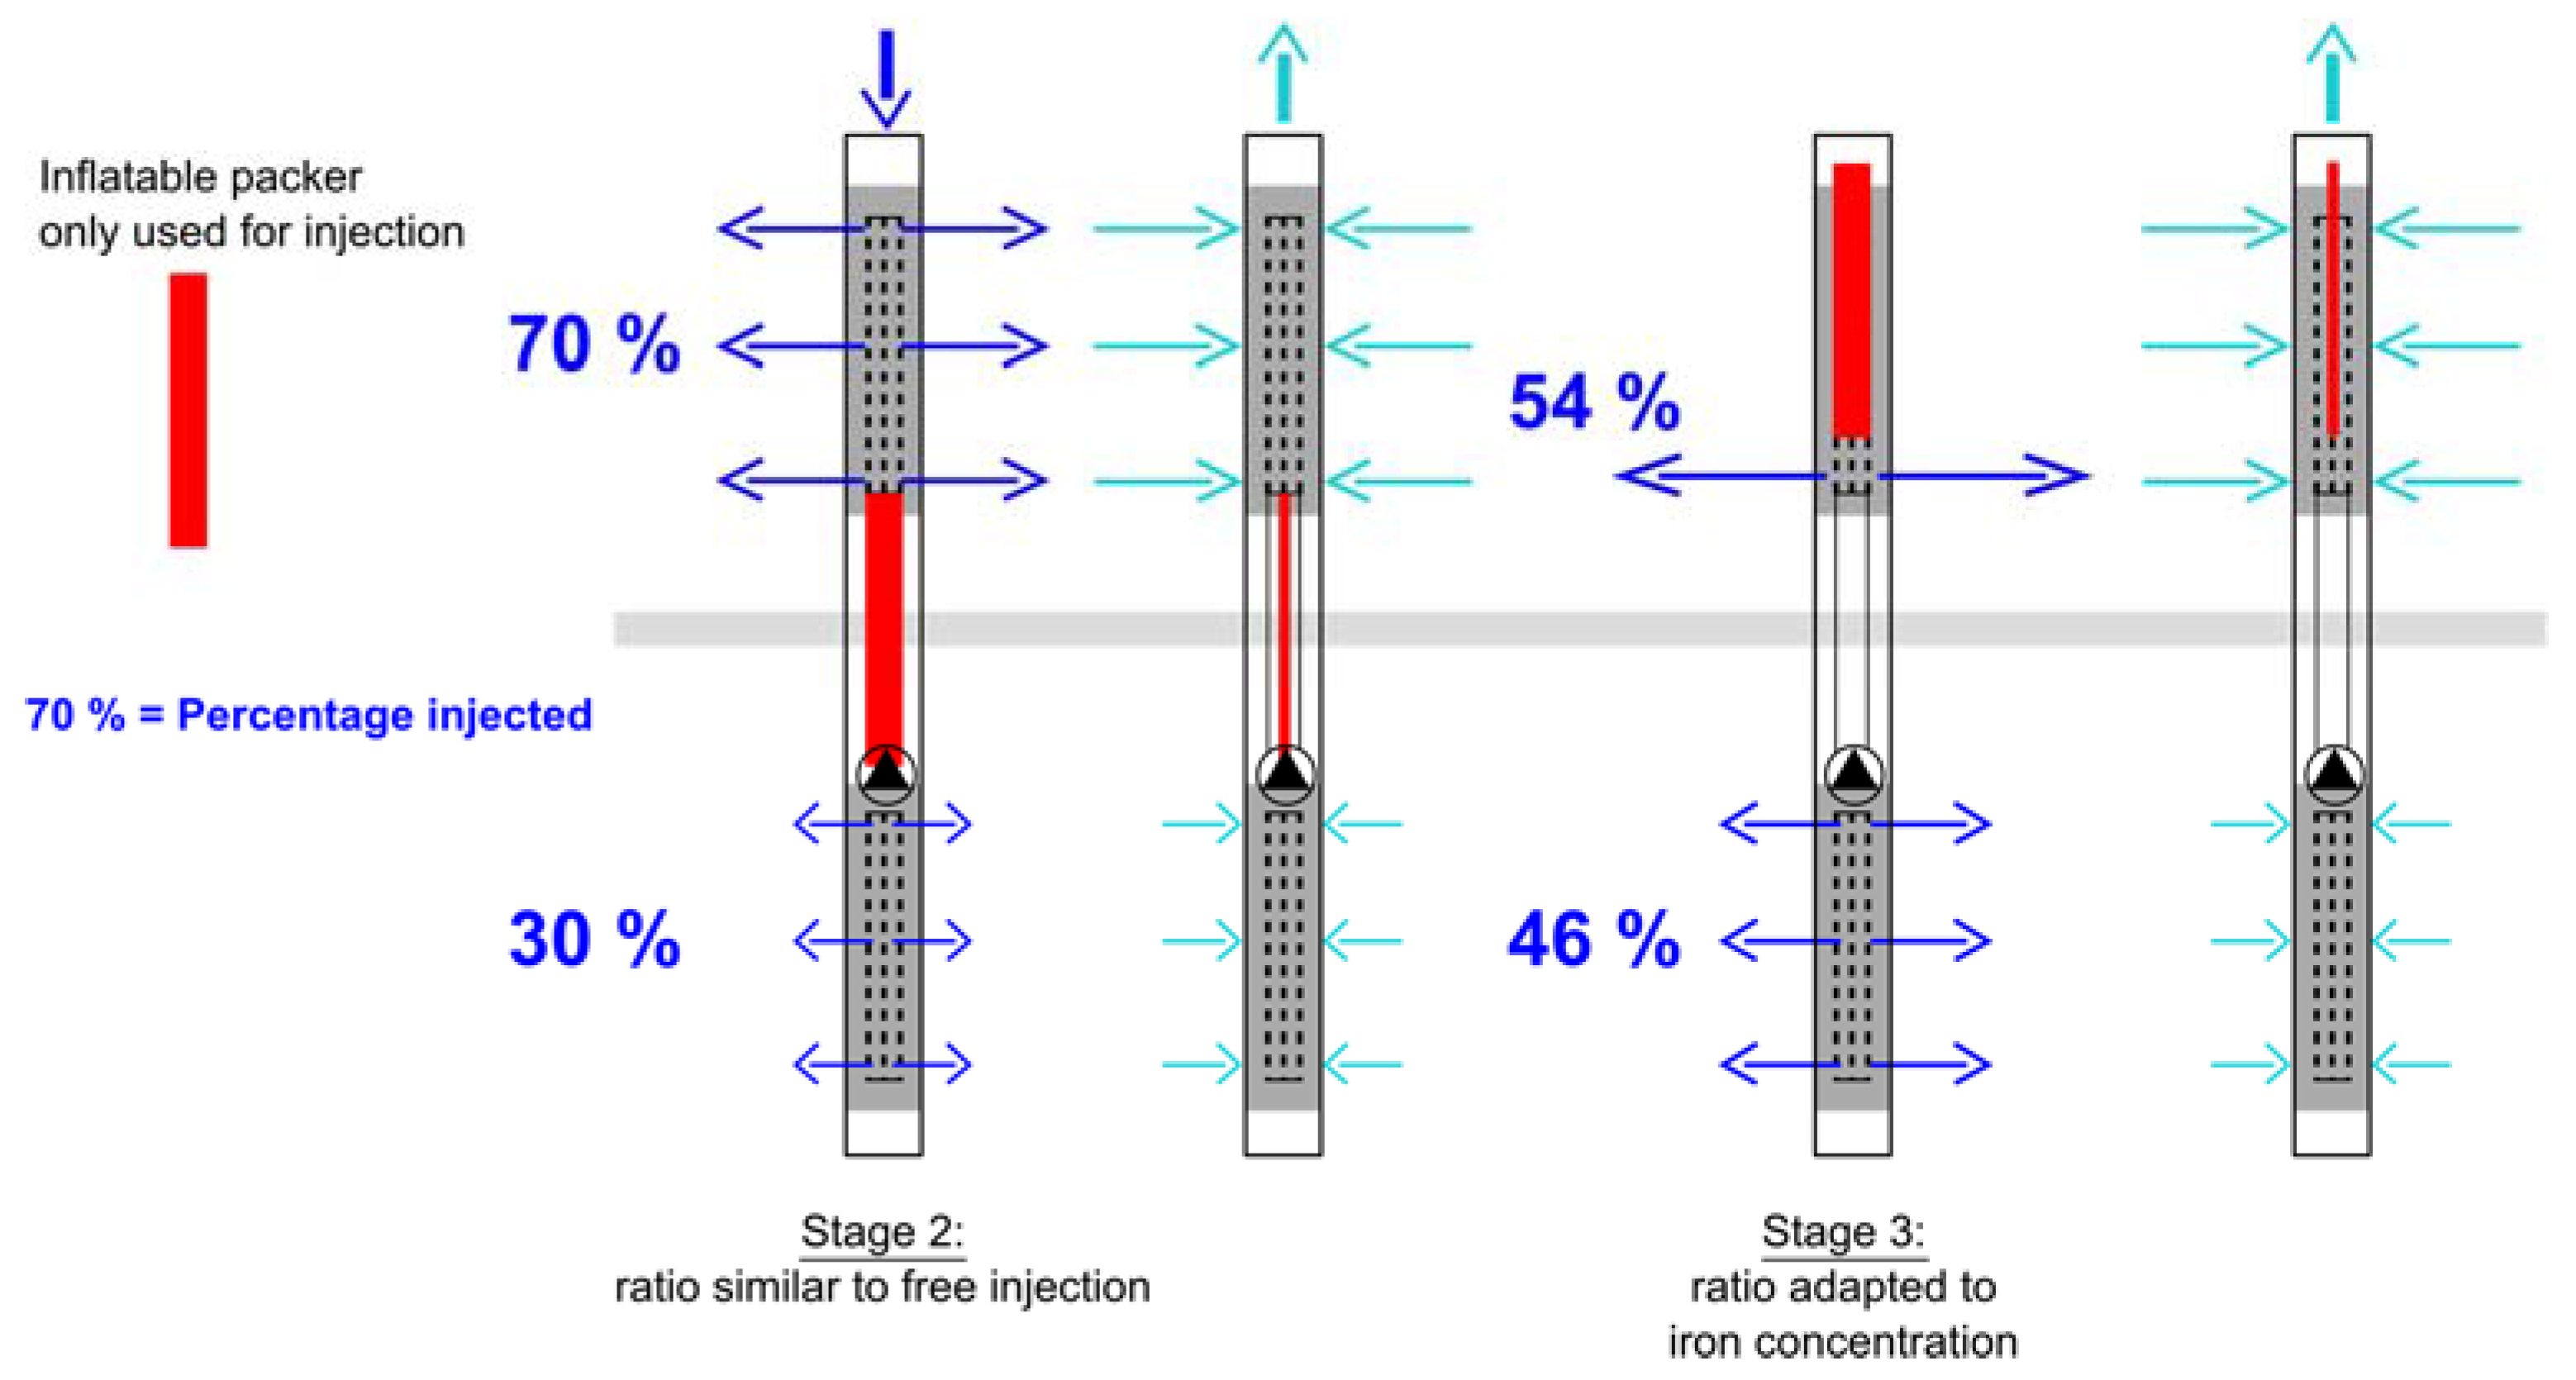
2.3. Technical Layout
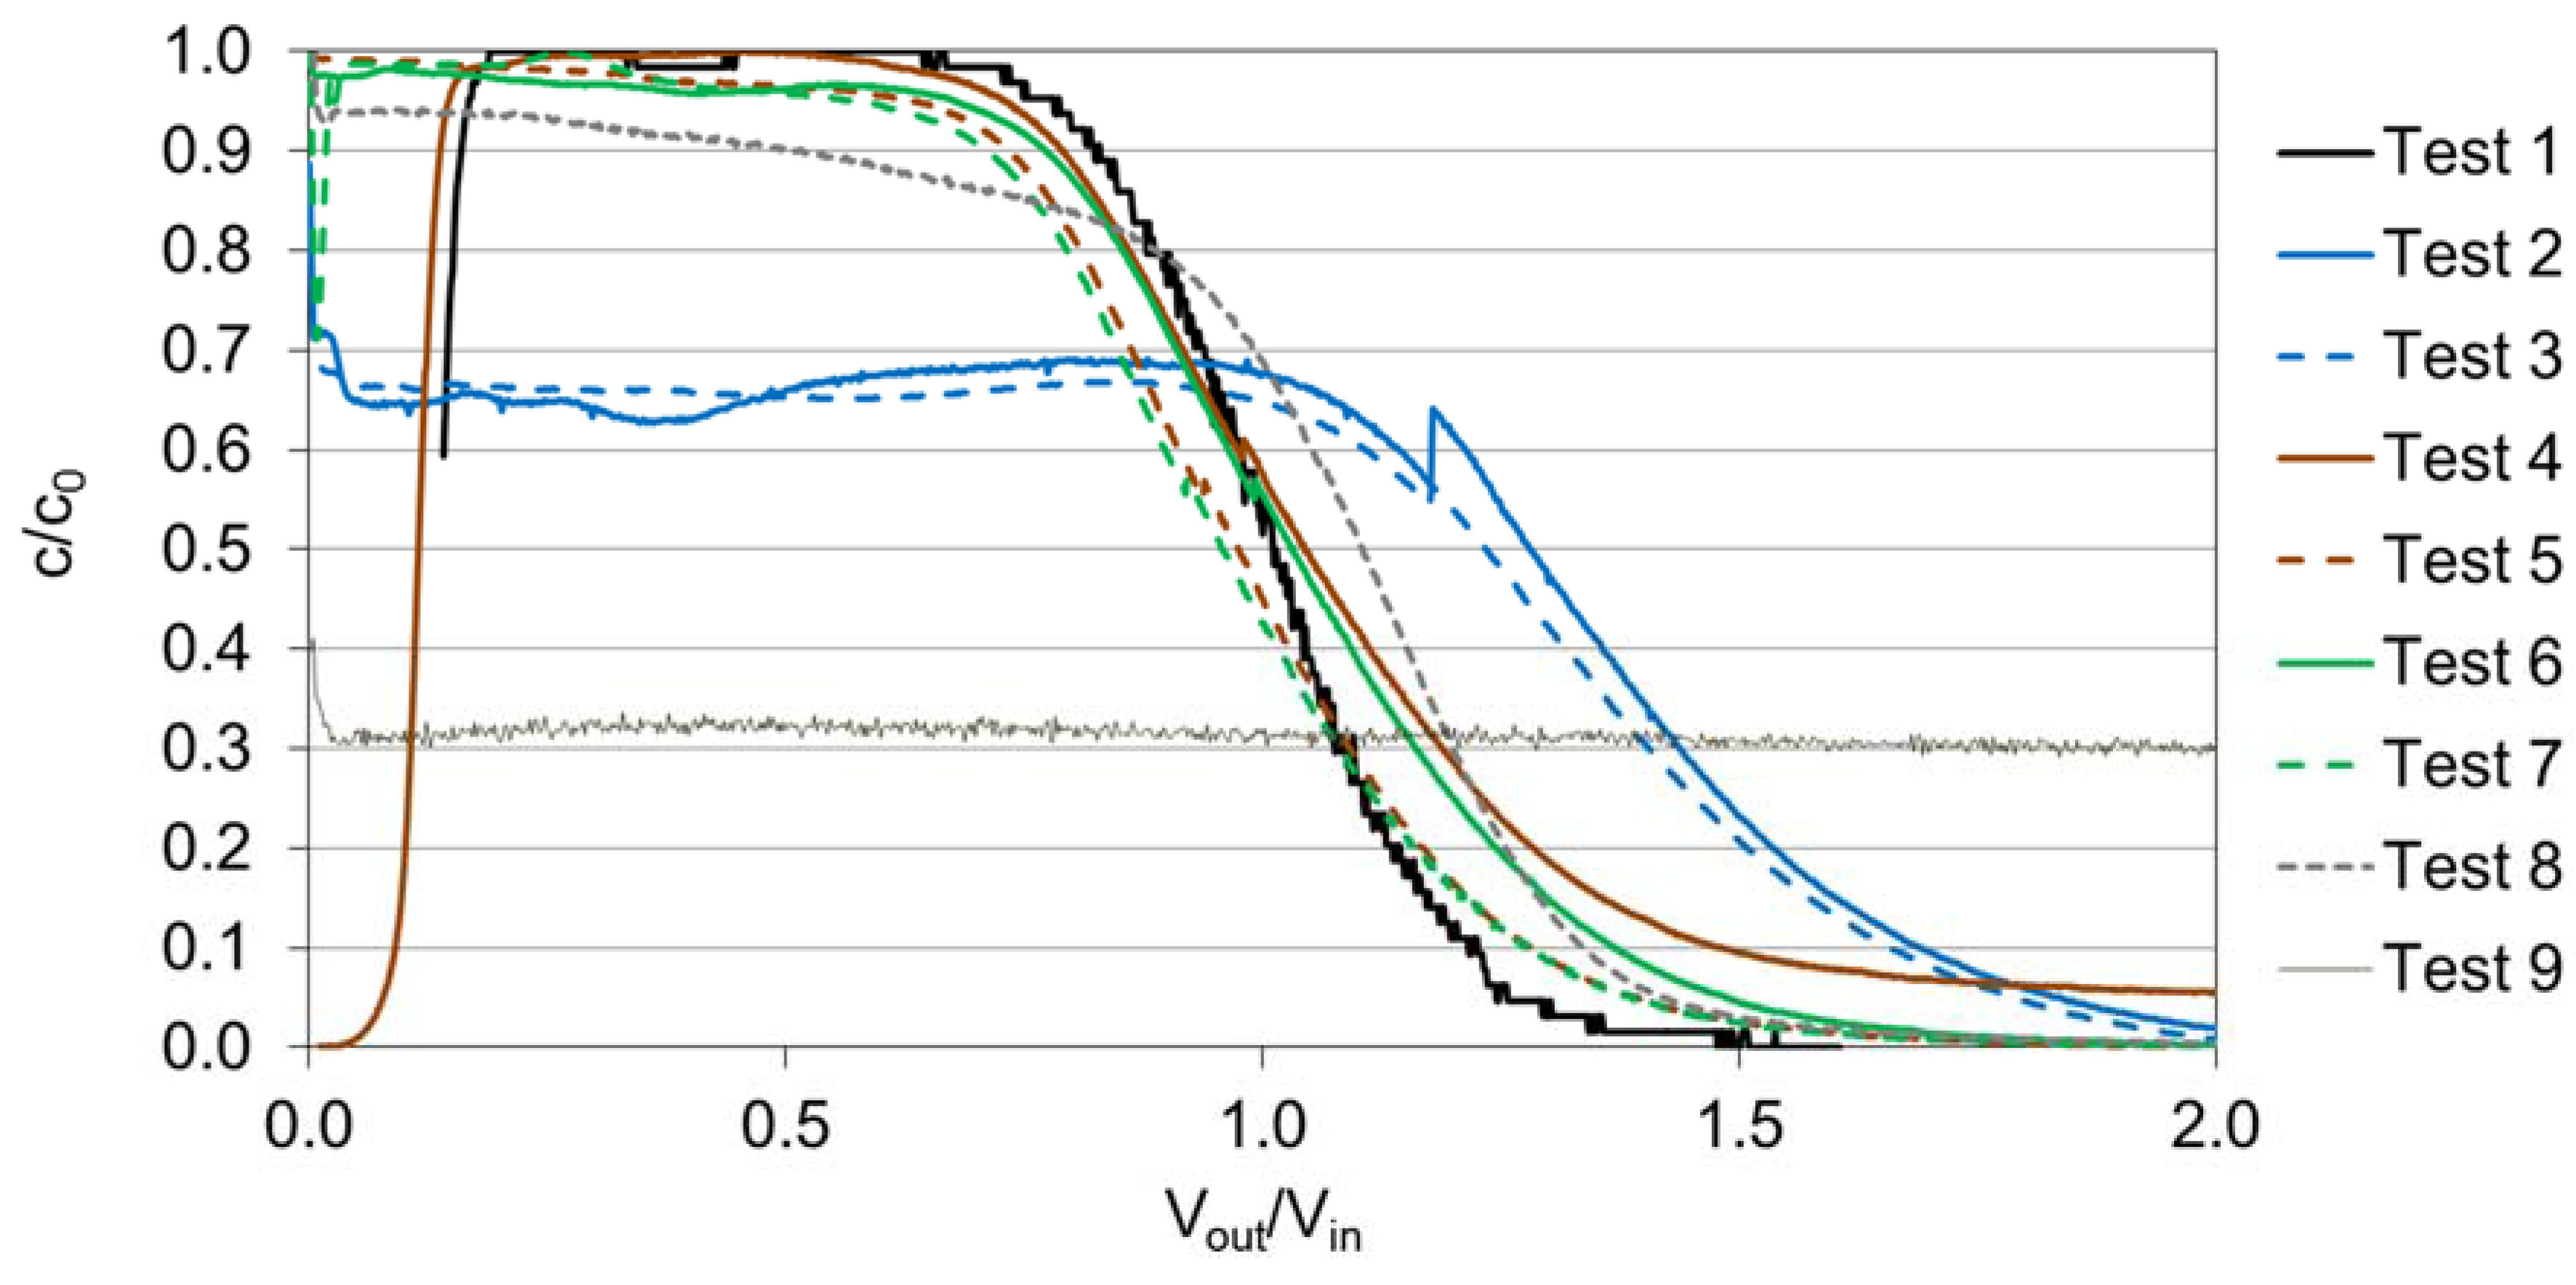
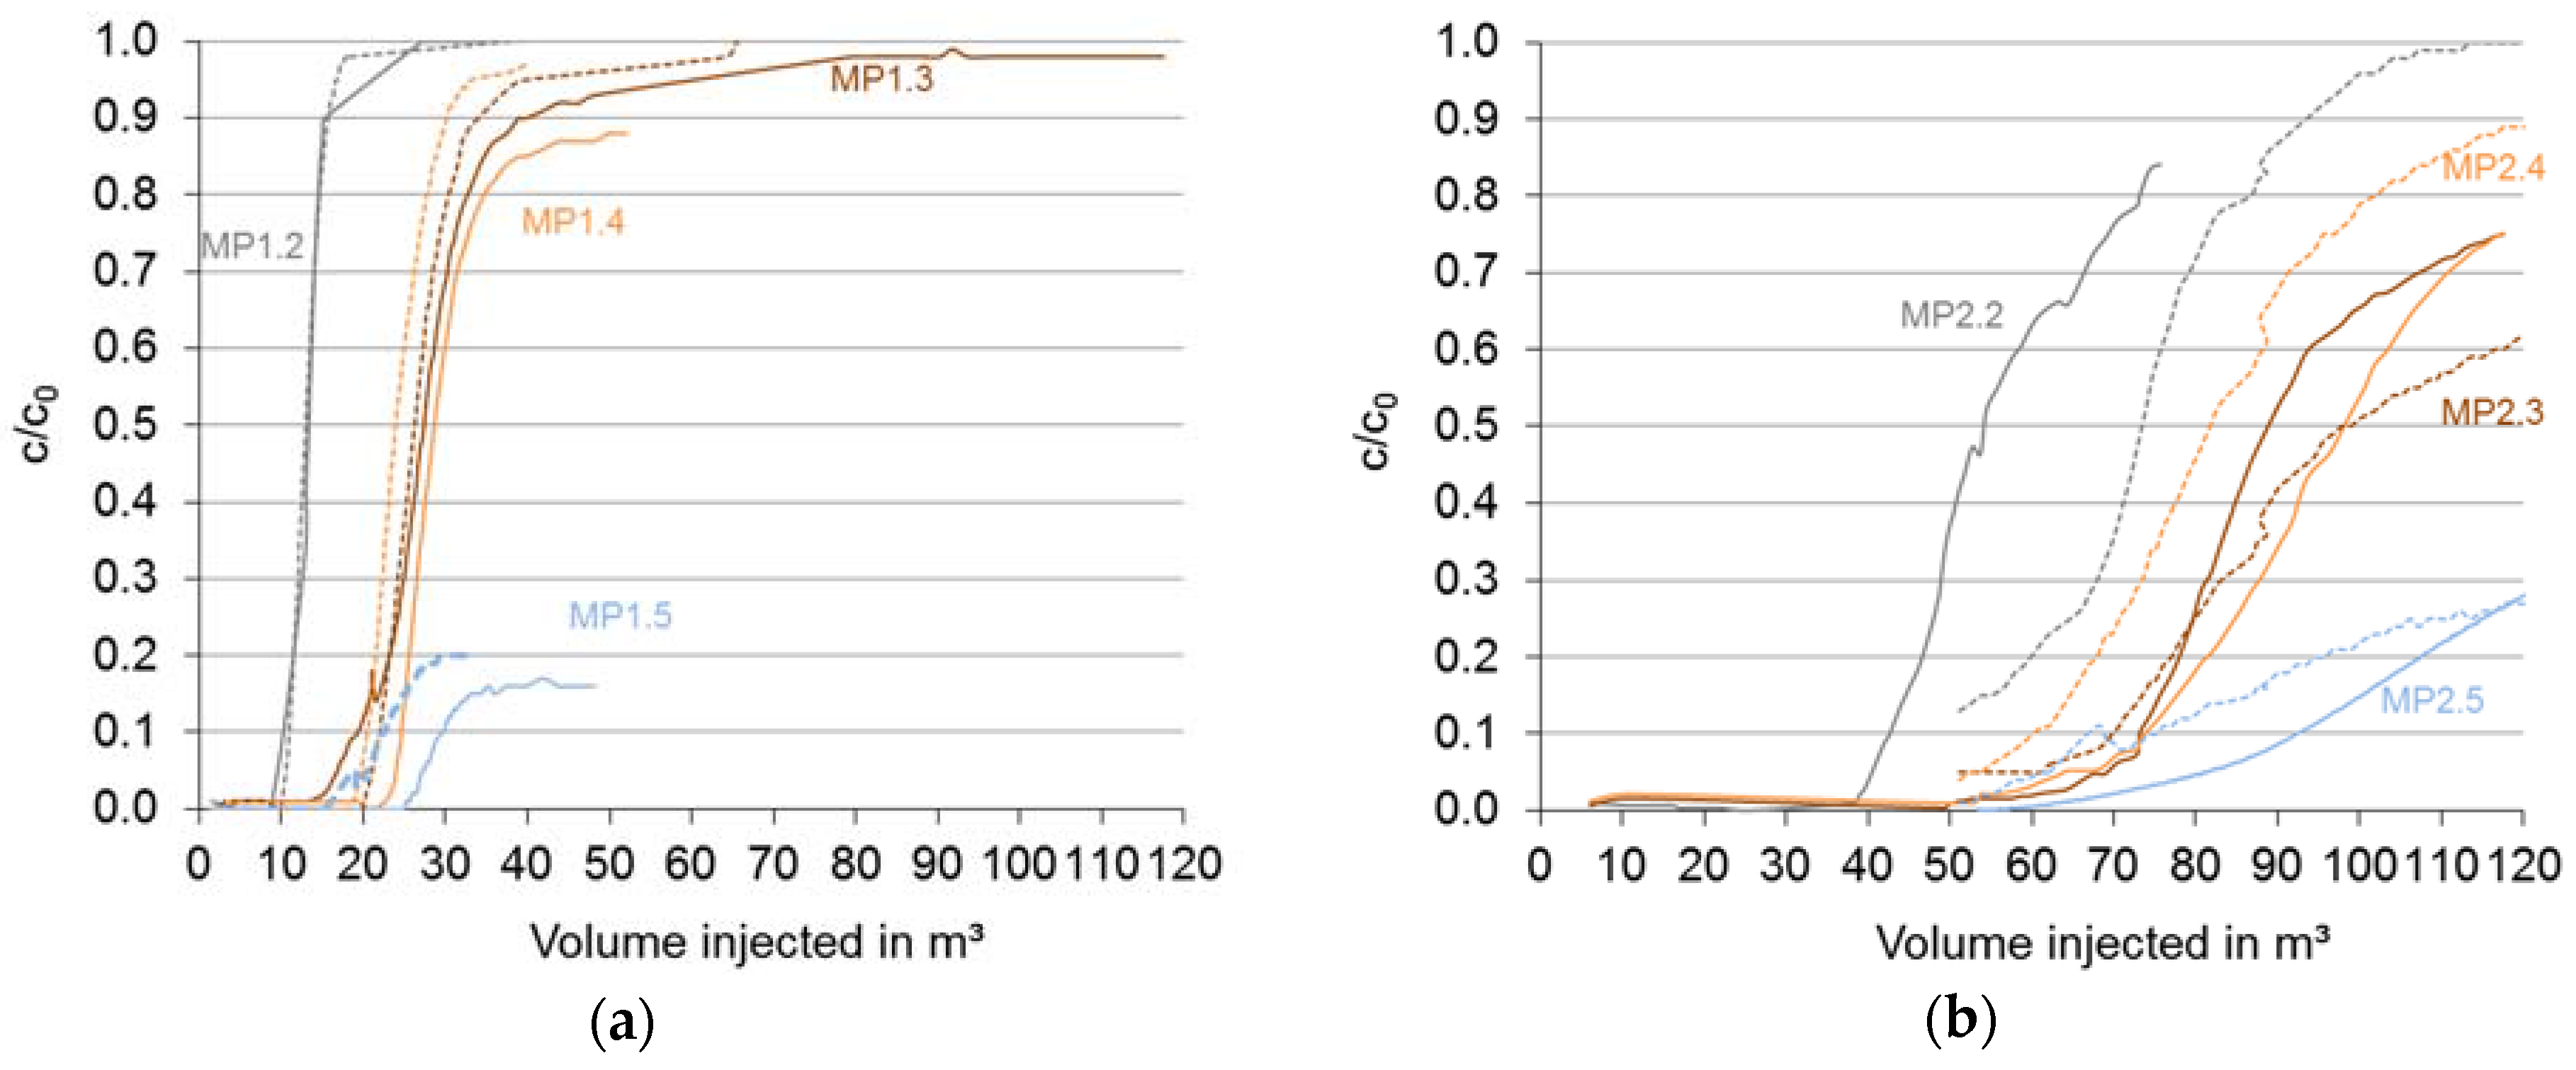
Groundwater was abstracted from both wells using submersible pumps (SQ7-40, Grundfos, Downers Grove, IL, USA). Flow rates were measured by inductive flow meters (Q1 to Q3, Sitrans FM MAG 5100 W, Siemens, Munich, Germany). On-site water quality parameters (electrical conductivity (EC), dissolved oxygen (DO), temperature (T) and pH) were continuously measured in flow through cells, which were fed through a bypass. The micro-double-valve pumps lifted water from the MPs into air tight flow through cells, which were equipped with a special fitting for appropriate probes (EC, DO, T, pH).

2.4. Tracer Tests

Nine tracer tests, consisting of both injection and abstraction phase, were performed with the EC of water as tracer before the SIR test in 2014. Natural groundwater from Well 2 (EC = 271 µS/cm) was spiked through a bypass with a NaClsolution and injected into Well 1 with an EC of approximately 1000 µS/cm. The nine tests differed among each other through different boundary conditions such as variable locations of both the injection pipe outlet and the pump inlet as well as the inactivation of screens with an inflatable 3 meter-long packer (Table 1). The inflow distribution was also determined by direct propeller flow meter measurements during injection and abstraction similar to Test No. 1 and with Q = 2.1 and 8.9 m3/h. Two additional tracer tests have been performed in 2015 during SIR test in stages two (cycle 5) and three (cycle 10).

2.5. Subsurface Iron Removal Pilot Tests

The pump inlet in Well 2 was located in the blank casing above the screen and in Well 1 in the blank casing below the packer above the lower screen (as later presented, the location of the pump inlet was found to have no significant effect). The packer was inflated before injection and evacuated with a vacuum pump before pumping. The abstracted water was pumped into a cascade for deacidification and enrichment with air oxygen and then piped by gravity into a degassing tank. From there, all or only a part of the water flow was injected by a suction pump (Aspri 35N 6 GG, ESPA, Banyoles, Spain) as infiltrate into the injection well.
A series of scenarios was numerically simulated in Processing Modflow for Windows (PMWIN, Simcore Software, CA, US) (advection only) to identify the optimum location of the inflatable packer with respect to the vertical aquifer stratification (K-value) and the iron concentration. The budget manager was used to quantify layer by layer flow. The iron concentration in abstracted water was calculated as mass balance according to the vertical iron distribution measured in the MWs (see the section on water quality). Furthermore, it was assumed that 50% of the DO is available for iron oxidation, adsorption onto fresh iron hydroxide was neglected and iron breakthrough was instantaneous (with no dispersion and after DO was consumed stoichiometrically). The maximum allowable iron concentration in the abstracted water was set to 5.0 mg/L in order to calculate the efficiency coefficient.
The SIR pilot test was divided into three experimental stages. During the first two stages, the packer in Well 1 was located in the blank casing between the upper and lower screen. The infiltrate was injected through two separate injection pipes equipped with inductive flow meters (Q2 and Q3) at a ratio of 70:30 (upper to lower screen), which was similar to the ratio determined during the tracer and pump tests. The first four injection phases (two cycles) were designed with Vout/Vin = 1 and a subsequent increase in volume from 40 m3 to 120 m3 (stage 1, final maximum injection volume). In the second stage, the abstraction was increased to final volume of 230 m3 (Vout/Vin = 1.9) within two full cycles and then kept constant for all following cycles (stage 2). After that, the inflatable packer was moved upward to seal 4/5 of the upper screen according to the modeling results (stage 3, optimized injection with the highest efficiency coefficient). Only the lower 4/5 or 0.6 m filter sections of the upper screen were left unsealed (Figure 3) because the model predicted an inflow of iron rich groundwater from the interface between the semi-confining layer. The packer had only one pipe connection and water was injected and abstracted through the pump via a single pipe. In this case, only the total injected volume was measured at Q2. A timeline of the sequence of tests is depicted in Table 2.

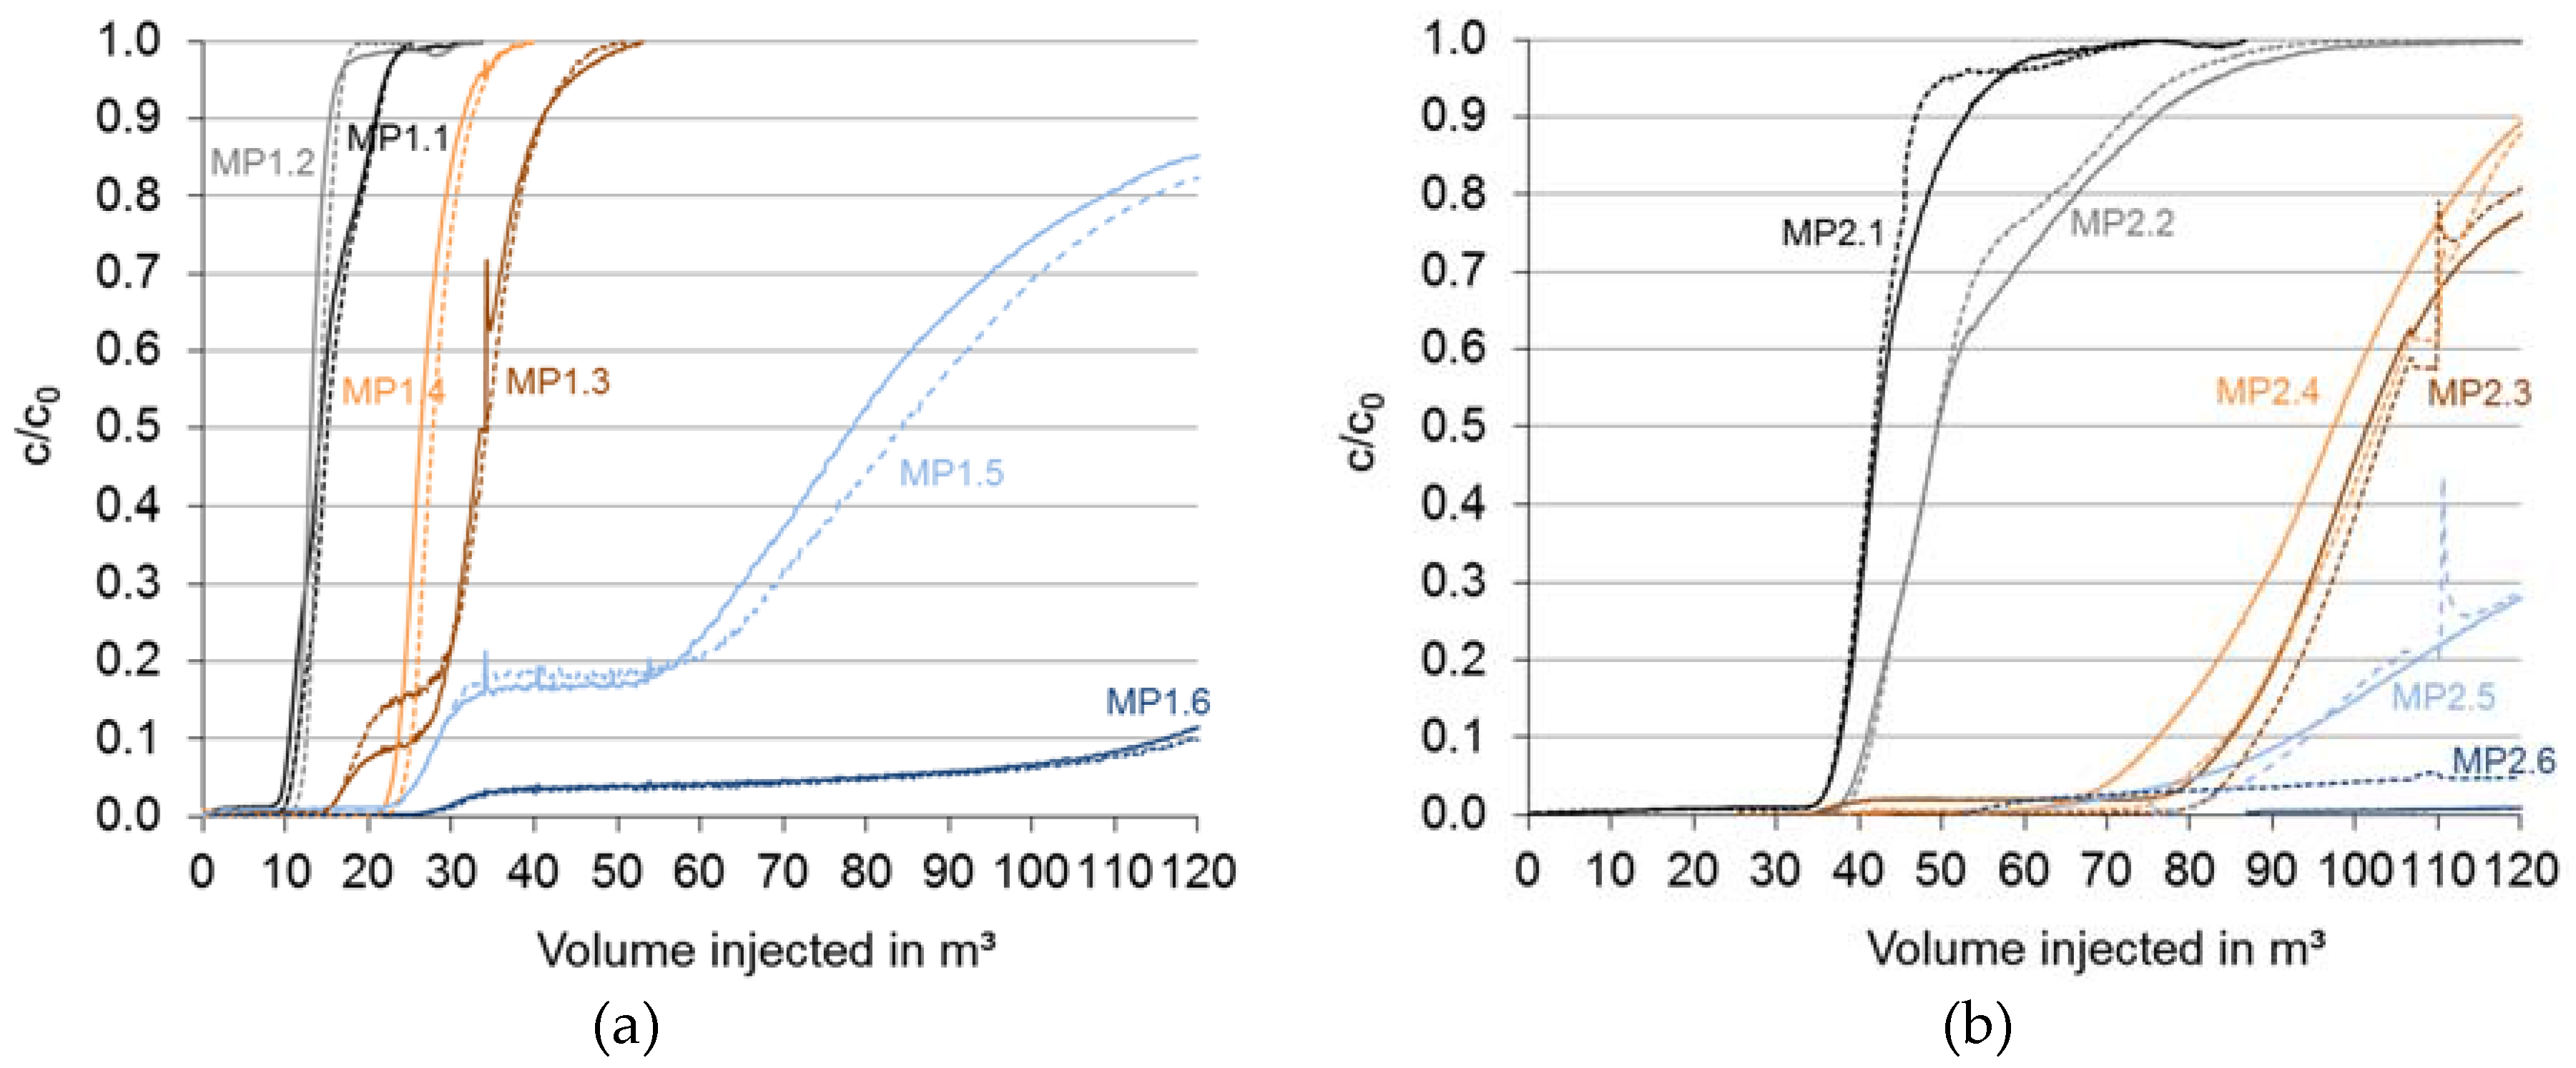
2.6. Groundwater Sampling

Groundwater sampling was performed at Well 1: (a) at constant discharge but varying location of the pump inlet, (b) depth dependent (separately from both screens using an inflatable packer) with flow rates adjusted to the measured inflow distribution in 2014 (70:30), and (c) at regular intervals during the SIR stages in 2015. Continuous depth dependent sampling was performed at both MWs before and during the SIR test.

2.7. Water Analysis

On-site parameters pH, O2, EC and T were determined using WTW Multi 3430 and appropriate electrodes (WTW, Weilheim, Germany). Total Fe concentration c(Fe) was measured in unfiltered samples in the field using a colorimetric iron test kit with color disk comparator (Merck 114759 MColortest, Darmstadt, Germany) and in the laboratory together with other cations using ICP-OES (Optima 4300 DV, Perkin Elmer, Waltham, MA, USA). Alkalinity and acidity was determined on-site via automatic titration with 0.1 M HCl (Compact Titrator G20, Mettler Toledo, Gießen, Germany) and manually with phenolphthalein and 0.1 M NaOH, respectively. Anions were analysed with ion chromatography (ICS 900, Dionex, Sunnyvale, CA, USA).

3. Results

3.1. Pump and Tracer Tests

The flow meter measurements indicated a flow distribution during injection and abstraction with Q = 2.1 and 8.9 m³/h at a ratio of 70:30 for the upper and lower well screen, respectively. No clear differences in the relative flow ratios were observed between the resulting vertical pipe velocities, so that hydraulic friction losses in the well had only negligible influence on the flow distribution. The flow distribution measured by the flow meter was confirmed by the tracer signals measured in the abstracted water (Figure 4).
While in tests with injection and abstraction through the same active screens, the total salt load was recovered in the beginning of the pumping phase (Test 1 and Tests 4–8), nearly 70% was recovered through both screens when the tracer was injected only through the upper screen (Tests 2 and 3) and 30% when injected through the lower (Test 9). When the injection pipe outlet and pump inlet were placed at the same location inside the well (above or below the screen), the ratio of Vout/Vin for the normalized tracer concentration at c/c0 = 0.5 was identical (Vout/Vin = 1.04 and 1.03, Tests 4 and 6). The ratio decreased to Vout/Vin = 0.96 and 0.97 when the two elements were placed at two different elevations (Tests 5 and 7). No difference was observed (<1%) for the order of arrangement inside the well (pump inlet above the injection inlet or vice versa).
A tracer breakthrough was first measured in the MW after injection through both screens in MP 1.1/2.1 and MP 1.2/2.2 (Figure 5), which were located at an elevation similar to the top of the upper screen (Figure 2). MP 1.3/2.3 were located inside a sediment layer with a reduced K-value and breakthrough was delayed compared to MP 1.4/2.4, which are located below MP 1.3/2.3 and at an elevation similar to the top of the lower screen. The weakest tracer signal was measured in MP 1.6 and 2.6. The location of the injection pipe outlet while injecting through both screens (Tests 4 and 5) had very little effect on the breakthrough in the MPs. Hereby, the volume injected by the time 50% of the normalized tracer concentration (breakthrough volume) differed at MP 1.1–MP 1.5 and MP 2.1–MP 2.4 between −1.4 % to 7.6 %.
Since hydraulic losses and the location of the injection/abstraction elements had no significant influence on the flow distribution, a targeted injection control was only achieved by placing a packer between the upper and the lower screen and injecting through either the upper or lower screen. In this way, tracer breakthrough signals were absent or weak (MP 1.4, Test 2) along inactive screens. On the basis of the tracer signals, it was again apparent that MP 1.3/2.3 were located in a less hydraulic conductive layer.

3.2. Subsurface Iron Removal Test

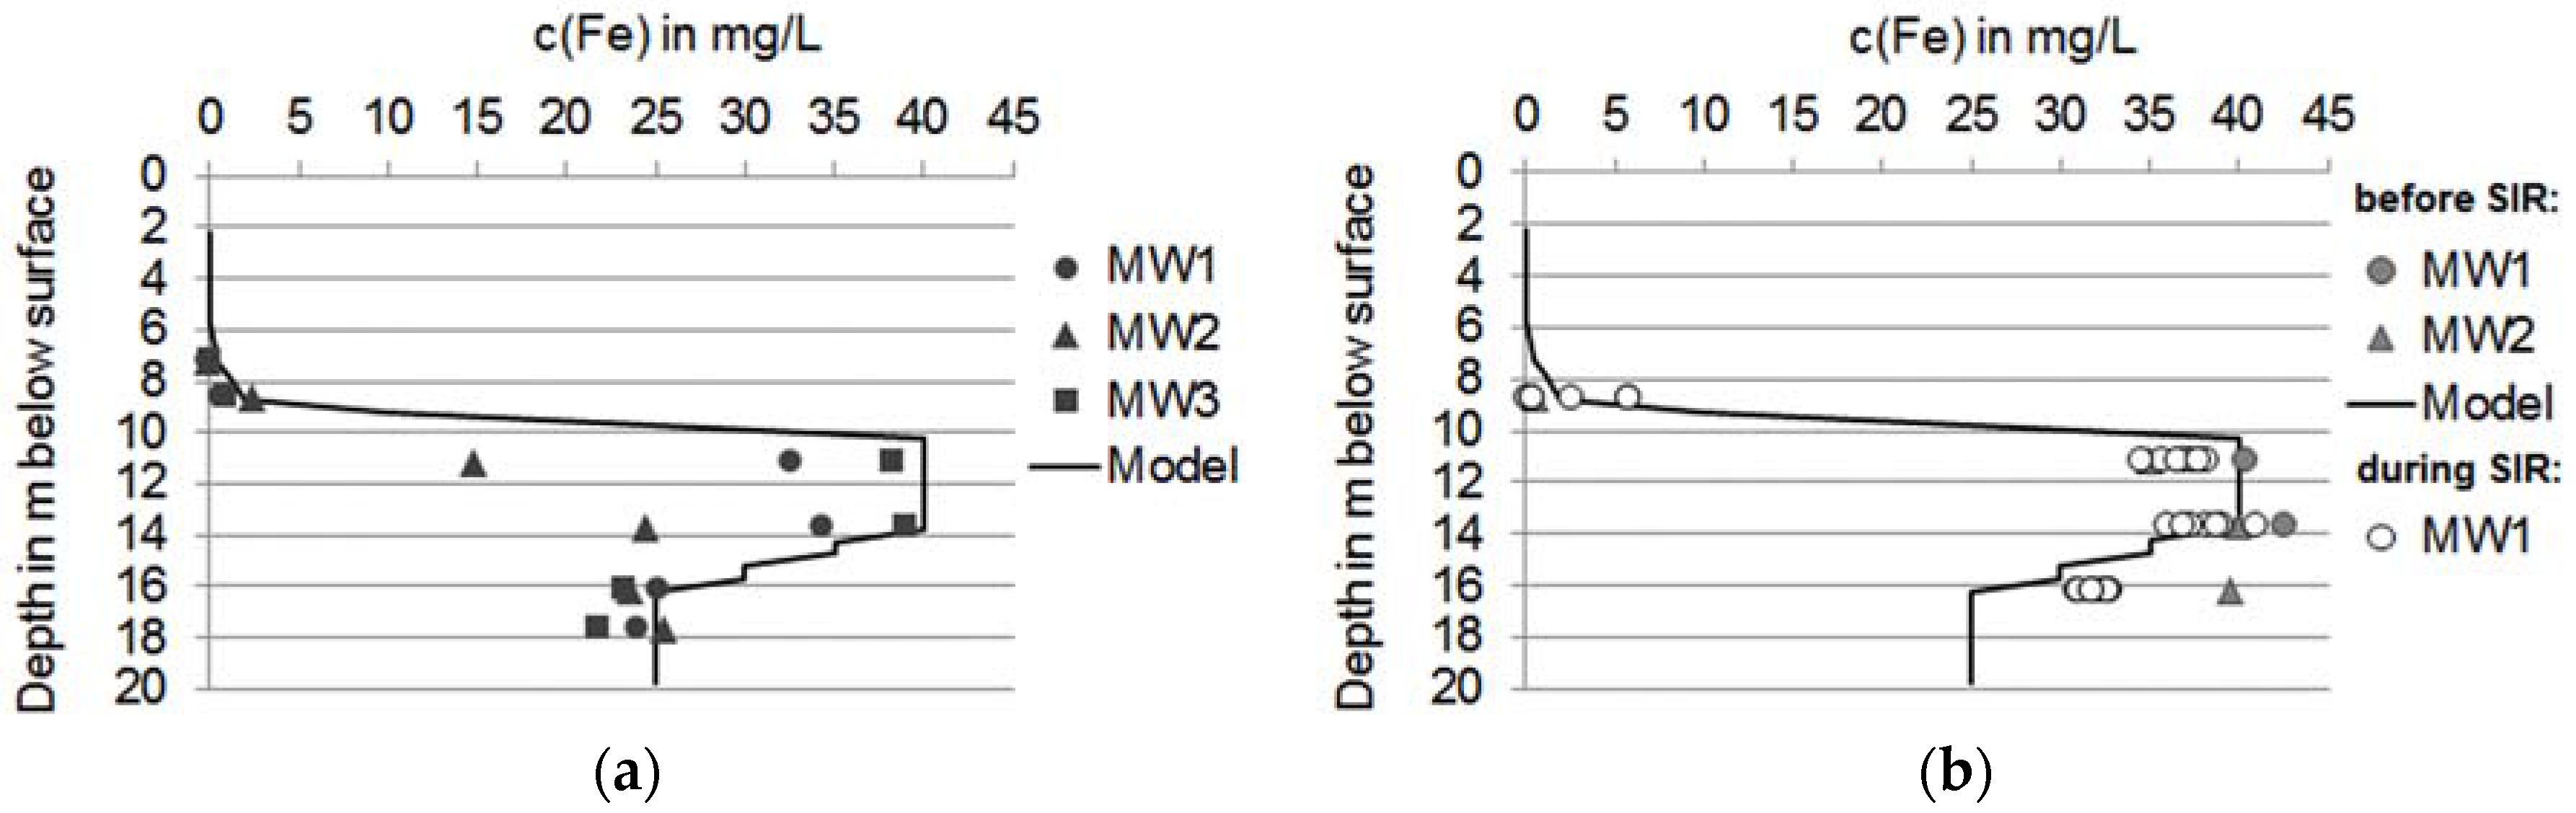
3.2.1. Ambient Groundwater Quality
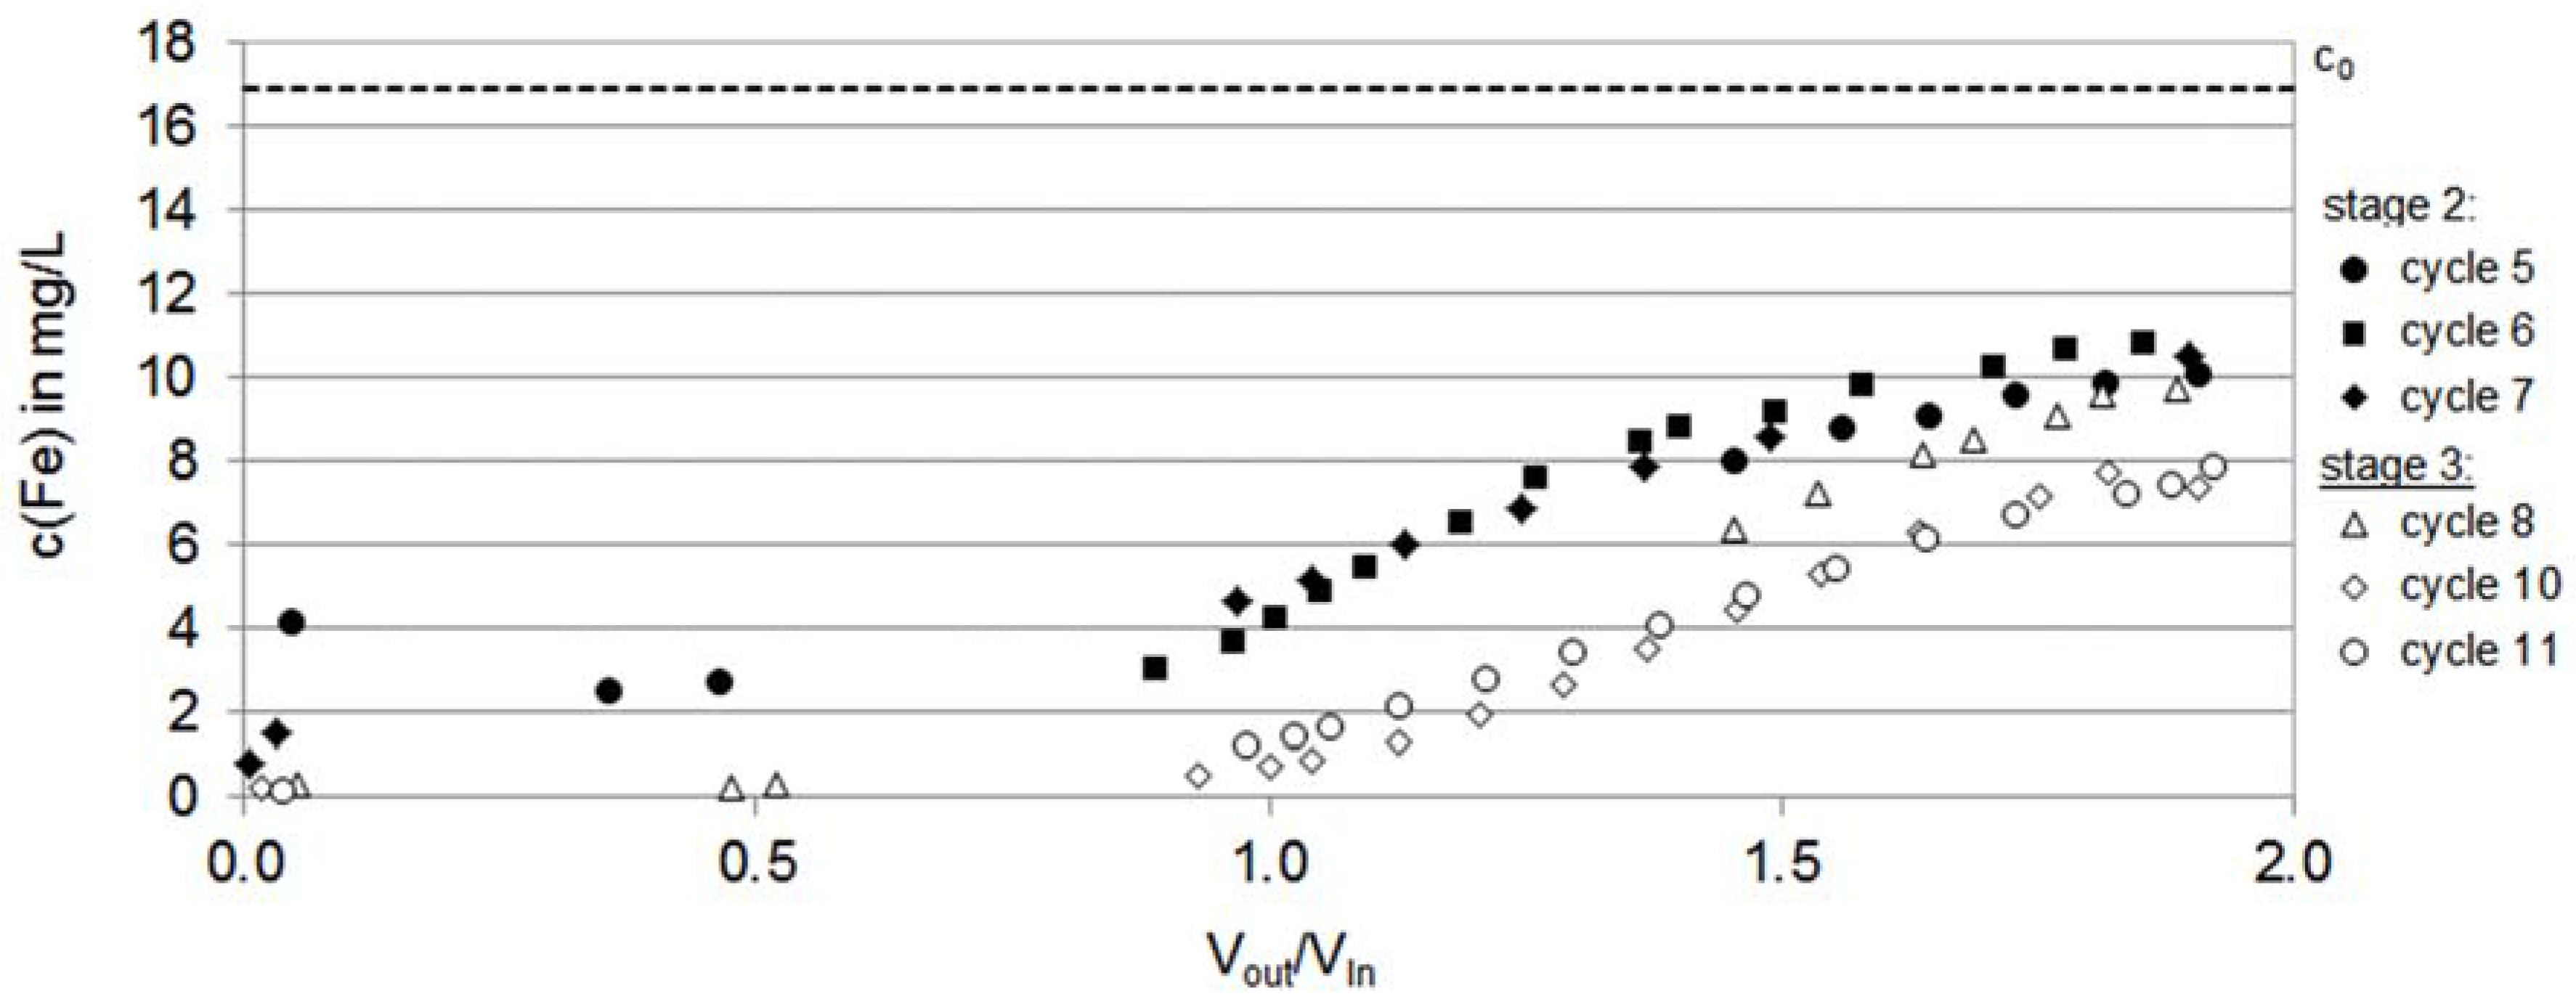
Analysis of the sampling performed before the SIR test at a constant discharge but varying location of the pump inlet showed an absolute deviation of the main cation concentration and the on-site parameters of <2% compared to the conventional location in the blank casing above the screens when the pump inlet was placed below the screens inside the sump. The deviation increased up to 5% when the inlet was moved between the filters. In the latter setting, however, the pumping rate was 0.5 m3/h higher than in the previous settings (data not shown).
The groundwater at the site is of calcium–magnesium–sulfate type (Table 3), weakly buffered and nitrate was below the detection limit. Pumped water quality differs significantly between the upper and lower screen for dissolved oxygen and iron. The upper part is oxic and groundwater contains c(Fe) =0 – < 0.55 mg/L (Figure 6). The pH-value ranged between 5.8 and 6.0 and alkalinity was 0.4 mmol/L. The iron concentration c(Fe) from 2014 was implemented in the model and is displayed in Figure 6a. The vertical variation of c(Fe) in 2015 before the SIR test was similar to 2014 until 14 m below surface (Figure 6b). The deeper part is anaerobic with c(Fe) = 31–43 mg/L (Figure 6b). The pH-value was higher and between 6.4 and 6.6. The initial iron concentrations in the MPs below 14 m depth were 8.1 mg/L (MW 1) to 16 mg/L (MW 2) higher compared to 2014 and as applied in the numerical model. Hence, the stoichiometric oxygen demand for the iron oxidation was underestimated in the model and thus the increases in the efficiency coefficient overestimated.

3.2.2. Iron Removal

Before atmospheric oxygen enriched water was injected into the aquifer, iron concentration of Well 1 was measured at c(Fe) = 5.6 mg/L in water abstracted only from the upper screen, c(Fe) = 35 mg/L in water abstracted only from the lower screen and 16.9 mg/L in water flowing into the well from both screens (regular operation). Inflow distribution was estimated to 62:38 based on a mixing calculation for iron, calcium, magnesium and potassium concentrations and different to preliminary investigation due to a drought period and a decline in groundwater levels (Table 3). In theory, natural groundwater is abstracted at a ratio of Vout/Vin > 1. In practice, however, the portion of groundwater already increases at Vout/Vin < 1 due to dispersion and under the influence of a natural groundwater gradient. The efficiency of the optimized injection in stage 3 can be evaluated based on the iron removal and hence on the iron concentration in the abstracted water.
The injected DO concentration (both wells) varied from 9.6 to 10.6 mg/L. The pH was weakly buffered and dropped in Well 1 from a mean value of 6.3 (injected) to 5.9 (abstracted) already after the first cycle. It was therefore decided to dispose the first 60 m3 of the reinfiltrate to stabilize the pH after the final injection and abstraction volumes were reached. With this operation regime, the injection phase lasted until the end of the pumping phase in order to inject fresh groundwater with a higher pH but at the expense of low iron concentrations. As a result, pH stabilized in the second stage between 4.8 and 5.1 but decreased further in the third stage to 4.2–4.4 when more DO was injected into the iron rich zones of the aquifer. Because of the pH-dependent iron oxidation kinetic, the short retention time (<10 min) in the degassing tank and the absence of any alternative iron free water sources, the iron abstracted from the pumping well was reinjected into the injection well (c(Fe)out = c(Fe)in) at concentrations varying from 3 to 11 mg/L in Well 2 and from 3 to 8 mg/L in Well 1.
Mean iron concentrations in the abstracted water from Well 1 in cycles 5–7 with Vout/Vin = 1.9 were c(Fe) = 5.4–5.8 mg/L. Due to the unfavorably low alkalinity, the pH dropped below 5 and iron was measured at concentrations above the technical limit of 0.1 mg/L at all times and increased from 1 mg/L to 11 mg/L while pumping Vout/Vin = 1.9. When the inflatable packer was used to control the formation of a reaction zone, iron breakthrough was clearly delayed (Figure 7). Mean iron concentrations dropped to c(Fe) = 2.3–2.6 mg/L and iron concentration ranged from <0.1 mg/L to 8 mg/L in cycles 10 and 11. Cycle 8 was characterized by higher concentration as the additional cation adsorption capacity had to be created first. Cycle 9 was negatively affected by the groundwater flow velocity in conjunction with a long storage phase (56 h compared to 1–22 h in cycles 8, 10 and 11), which can result in lateral drift and distortion of the injected plume [26,27]. The total iron removal still increased by 25% from 1287 to 1600 g when ambient and injectant iron concentration were taken into account.
The Vout/Vin achieved in this study was very low and attributed to the unfavorably low alkalinity and pH. Unfortunately, it was not possible to perform the test at a different site. The primary goal was not to meet the drinking water limit for iron but to increase the iron removal and the efficiency coefficient through an optimized injection in stage 3. Our test therefore represents a worst case scenario. Under favorable hydrochemical conditions, SIR wells usually achieve efficiency coefficients between 3 and 12 and meet drinking water limits for iron [9].

3.2.3. Hydraulic Effects

The tracer breakthrough curves measured at the MPs are compared for the injection phases of cycles 5 and 10 (Figure 8a,b). Breakthrough curves measured in the stage 3 at MPs along the lower screen were ahead of those from stage 2. Hence, injection velocity and thus injection volume through the lower screen increased accordingly. At the same time, the breakthrough curve measured at MP 2.2 was delayed, which means that the injection through this screen was reduced.
A comparison of the injected water fronts in stage 2 and 3 is shown in Figure 9 as a vertical profile of the breakthrough volume. Note that (1) MW 2 is located at twice the distance from the well compared to MW 1 and (2) the higher the breakthrough volume measured at the MPs, the lower the injected volume at this depth. According to the preliminary modeling, the outflow distribution in the controlled scenario ratio should have changed by 16%. Because this effect could not be directly measured, a decrease in the breakthrough volume was anticipated in the MPs located along the lower screen (and an increase along the upper). In practice, breakthrough volumes in MW 2 along the upper screen increased by 10%–36% and decreased by 13%–17% along the lower. A decrease of 16%–24% was observed for the lower screen in MW 1.
The theoretical tracer breakthrough (“cylinder” in Figure 9) was calculated to be after the injection of 12 m3 and 27 m3 in MW 1 and after 41 m3 and 95 m3 in MW2 assuming a cylindrical shape, a ratio of 70:30 for the upper and lower well screen and an effective porosity of 0.3. A good agreement was observed between the measured and the calculated volume in MW 1 at a distance of 1.6 m from Well 1. A relatively good agreement could also be observed in MW 2 at MP 2.4 (top of lower screen) because the injected water was transported laterally away as upward movement was hindered by the layer of lower hydraulic conductivity. On the contrary, MP 2.2 is located at an elevation similar to the middle of the upper screen. In this part, vertical flow was much higher because of the absence of a restricting layer, and the agreement between measured and calculated breakthrough time expressed as volume injected was poor with 32% difference. The shape of a convex reaction zone, which was first described by Olthoff [3], could therefore be confirmed by the tracer test. The breakthrough in MP 1.3/2.3 was caused by the pressure gradient between below and above the layer of lower conductivity and the subsequent flow-through. A downward flow was minor as it was seen by the weak tracer signal in MP 1.5/2.5.
As seen from Figure 8 and Figure 9, the volume injected and thus the available dissolved oxygen in the deeper iron rich part of the aquifer was increased by the controlled injection. If other oxygen-consuming processes are neglected, the 25% increase for iron removal would correspond to a stoichiometric increase (ratio of 1:7 for O2 and Fe, respectively) in available dissolved oxygen in the deeper aquifer of 4%.

4. Discussion

The SIR test with and without an optimized injection showed that the efficacy of the subsurface treatment can be improved for wells with long well screens or for wells with multiple screens in an aquifer with varying water quality using an inflatable packer. Based on pump and tracer tests, it was shown that the water injected in the blank casing above or below the filter may not always be sufficient at a specific depth in terms of the stoichiometric ratio of dissolved oxygen to dissolved iron, even though the relative inflow from this part of the aquifer is low. Hence, iron breakthrough will occur through the deeper parts of the well screen where the cation exchange capacity for iron is insufficient. Numerical modeling was performed and a doubling of the system efficiency was predicted in comparison to a conventional injection by inactivating certain sections of the screen during injection.
The temporal inactivation of certain well screen sections was realized in stage 3 through the use of an inflatable packer, which was evacuated by a vacuum pump before abstraction and remained deflated inside the well while pumping. Measured total iron removal increased by 25% in stage 3 compared to the conventional injection in stage 2 but remained below the 41% predicted by the model. This was mainly attributed to the unfavorable in situ pH (pH in the re- and infiltrate was <4.5). The simulated iron removal assumed a complete oxygen consumption for iron oxidation (50%) and other oxygen-consuming processes (50%). In practice, however, the dissolved oxygen concentration measured in the abstracted water was still c(O2) = 2 mg/L after Vout/Vin = 1.0, and a part of the total injected DO was not used. It is assumed that, due to the low pH in the injected water, the iron oxidation took place mainly at the injectant–groundwater interface as pH here was more favorable. In order to increase the efficiency coefficient at this site, the re-infiltrate could have been filtered through half-burnt dolomite to stabilize the pH. Furthermore, the predicted change in the inflow distribution from 70:30 to 54:46 was overestimated by 10%. In practice, a change of approximately 4% was achieved. This was attributed to a long drought period in 2015. Water levels were lower compared to 2014 and the natural well inflow distribution was different from the investigations in the previous year. A higher injection volume was observed than was anticipated for the upper screen. However, it was not possible to repeat the SIR test due to time constraints and the high effort required.

Acknowledgments

All primary data was collected within the FHProfUnt-project “Optimization of bank filtration and subsurface iron and manganese removal” funded by the BMBF (Grant No. 03FH042PX2). The authors gratefully acknowledge support from Jobst Herlitzius during system design, Andreas Heisler for well drilling, Richard Pörschke, Philipp Marx, Julia Wiedmann, Sarah Trepte, Sebastian Paufler and Fabian Musche for water sampling, on-site water analysis and system operations, as well as Jörg Feller for the water analyses.

Author Contributions

W.M and T.G. conceived and designed the field tests; R.B. and W.M. performed the tests and analyzed the data; and R.B. and T.G. wrote the paper.

Conflicts of Interest

The authors declare no conflict of interest. The founding sponsors had no role in the design of the study; in the collection, analyses, or interpretation of data; in the writing of the manuscript, and in the decision to publish the results.

Abbreviations

The following abbreviations are used in this manuscript:
MW:Ground water monitoring well
MP:Monitoring point
SIR:Subsurface iron removal
DO:Dissolved oxygen
EC:Electrical conductivity
c(Fe):Iron concentration
Vin:Volume injected
Vout:Volume abstracted
c/c0:Normalized concentration

References

  1. Appelo, C.A.J.; Drijver, B.; Hekkenberg, R.; de Jonge, M. Modeling in situ iron removal from groundwater. Ground Water 1999, 37, 811–817. [Google Scholar] [CrossRef]
  2. Meyerhoff, R.; Rott, U. Mass balances for the estimation of the applicability and efficiency for in situ-treatment of iron and manganese containing groundwater. gwf Wasser Abwasser 1997, 138, 173–180. (In German) [Google Scholar]
  3. Olthoff, R. Groundwater iron removal in aquifers-treatment mechanisms and investigation results. gwf Wasser Abwasser 1988, 129, 327–339. (In German) [Google Scholar]
  4. Treskatis, C.; Nillert, P. Regular need for adjustment of the DVGW regulatory by progress and practical developments in well design. bbr 2009, 7–8, 44–53. (In German) [Google Scholar]
  5. Eichhorn, D. Contribution to the Theory of Subsurface Iron Removal. PhD Thesis, Department of Water Sciences, TU Dresden, Dresden, Germany, 1985. [Google Scholar]
  6. Rott, U.; Kaufmann, H.; Meyer, C. Arsenic elimination in drinking water treatment in developing countries. In Proceedings of the 35 Essener Tagung für Wasser- und Abfallwirtschaft, Essen, Germany, 20–22 March 2002; Wasser Abwasser GWA: Essen, Germany, 2002; Volume 188, pp. 39.1–39.21. (In German)[Google Scholar]
  7. Winkelnkemper, H. Subsurface iron and manganese removal. wwt Wasserwirtschaft Wassertechnik 2004, 4, 38–41. (In German) [Google Scholar]
  8. Groth, P.; Bühring, F.; Dannöhl, R.; Ließfeld, R.; Olthoff, R.; Rott, U. Subsurface iron and manganese removal—status report. gwf Wasser Abwasser 1997, 129, 321–327. (In German) [Google Scholar]
  9. Rott, U.; Friedle, M. Eco-friendly and cost-efficient removal of arsenic, iron and manganese by means of subterranean ground-water treatment. Water Supply 2000, 18, 632–636. [Google Scholar]
  10. Herlitzius, J.; Bilek, F.; Grischek, T. Subsurface iron and manganese removal. In Proceedings of DGFZ e.V., Grundwassertage; GWZ: Dresden, Germany, 2013; pp. 205–225. (In German) [Google Scholar]
  11. DVGW. Iron and Manganese Removal—Design and Operational Guidelines for Subsurface Treatment Installations; Worksheet W223-3; German Technical and Scientific Association for Gas and Water: Bonn, Germany, 2005; p. 7. [Google Scholar]
  12. Houben, G.J. Modeling the buildup of iron oxide encrustations in wells. Ground Water 2006, 42, 78–82. [Google Scholar] [CrossRef]
  13. Bieske, E.; Rubbert, W.; Treskatis, C. Drilled Wells, 8th ed.; R. Oldenbourg Verlag: München, Wien, Germany, 1998; pp. 191–192. [Google Scholar]
  14. van Halem, D.; Moed, D.H.; Verberk, J.Q.J.C.; Amy, G.L.; van Dijk, J.C. Cation exchange during subsurface iron removal. Water Res. 2012, 46, 307–315. [Google Scholar] [CrossRef] [PubMed]
  15. Ebermann, J.P.; Eichhorn, D.; Macheleidt, W.; Ahrns, J.; Grischek, T. Field tests for subsurface iron removal at a dairy farm in Saxony, Germany. In Groundwater Quality Sustainability. Selected Papers on Hydrogeology 17, 1st ed.; Maloszewski, P., Witczak, S., Malina, G., Eds.; Taylor & Francis Group: London, UK, 2012; pp. 29–40. [Google Scholar]
  16. Grischek, T.; Feistel, U.; Musche, F.; Ebermann, J.; Uhlmann, W. Hydrochemical evaluation of subsurface iron removal in Schleife. In Proceedings of Jahrestagung der Wasserchemischen Gesellschaft, Bamberg, Germany, 2–4 May 2016; Gesellschaft Dt. Chemiker: Bamberg, Germany, 2016; pp. 332–336. (In German)[Google Scholar]
  17. Roessner, U.; Sailer, C.; Ebermann, J.; Grischek, T.; Plassmann, C. Potential for subsurface iron removal through the use of different injection waters. gwf Wasser Abwasser 2013, 154, 466–472. (In German) [Google Scholar]
  18. Schöfmann, T. Test on Subsurface Iron and Manganese Removal in Well Group Altmanns Part 2. Diploma Thesis, University of Natural Resources and Life Sciences, Vienna, Austria, 2003. [Google Scholar]
  19. Rubbert, T.; Treskatis, C. Numerically supported well design for capturing different water qualities. bbr 2008, 12, 80–87. (In German) [Google Scholar]
  20. Herlitzius, J.; Sumpf, H.; Grischek, T. Design of a large-scale subsurface treatment technology. bbr 2011, 62, 54–57. [Google Scholar]
  21. Korom, S.F.; Bekker, K.F.; Helweg, O.J. Influence of pump intake location on well efficiency. J. Hydrol. Eng. 2003, 8, 197–203. [Google Scholar] [CrossRef]
  22. VonHofe, F.; Helweg, O.J. Modeling well hydrodynamics. J. Hydraul. Eng. 1998, 124, 1198–1202. [Google Scholar] [CrossRef]
  23. Mansuy, N. Water Well Rehabilitation: A Practical Guide to Understanding Well Problems and Solutions; CRC Press: Boca Raton, FL, USA, 1998; pp. 73–74. [Google Scholar]
  24. Beyer, W. Determination of the hydraulic conductivity of gravels and sands based on grain size analysis. Wasserwirtschaft-Wassertechnik 1964, 14, 165–168. (In German) [Google Scholar]
  25. Macheleidt, W.; Bartak, R.; Ahrns, J.; Pörschke, J.; Grischek, T. Use of a multilevel sampling system to delineate a subsurface reaction zone. gwf Wasser Abwasser 2016, 157, 847–853. (In German) [Google Scholar]
  26. Ward, J.D.; Simmons, C.T.; Dillon, P.J.; Pavelic, P. Integrated assessment of lateral flow, density effects and dispersion in aquifer storage and recovery. J. Hydrol. 2009, 370, 83–99. [Google Scholar] [CrossRef]
  27. Zuurbier, K.G.; Bakker, M.; Zaadnoordijk, J.; Stuyfzand, P.J. Identification of potential sites for aquifer storage and recovery (ASR) in coastal areas using ASR performance estimation methods. Hydrogeol. J. 2013, 21, 1373–1383. [Google Scholar] [CrossRef]
Figure 1. Location map. SIR: Subsurface Iron Removal; MW: Monitoring Well.
Water 09 00087 g001
Figure 2. Scheme of the SIR pilot test. c: concentration; EC: Electrical conductivity; T: Temperature; MP: Monitoring point.
Water 09 00087 g002
Figure 3. Schematic drawing of the optimized injection in stage 3.
Water 09 00087 g003
Figure 4. Tracer signals in abstracted water from Well 1.
Water 09 00087 g004
Figure 5. Tracer breakthrough in (a) MW 1 and (b) MW 2 (dashed lines = test 5; solid lines = test 7).
Water 09 00087 g005
Figure 6. Iron concentration (a) during tracer tests (2014) and (b) during SIR pilot test (2015).
Water 09 00087 g006
Figure 7. SIR pilot test–iron concentration in abstracted water with and without injection control.
Water 09 00087 g007
Figure 8. Tracer breakthrough in (a) MW 1 and (b) MW 2 (solid lines = stage 2, dashed lines = stage 3).
Water 09 00087 g008
Figure 9. Effect of injection control by comparison of injected volumes at c/c0 = 0.5.
Water 09 00087 g009
Table 1. Boundary conditions of the tracer tests.
Test No.Active Injection ScreenActive Abstraction ScreenLocation of Injection Pipe Outlet/Pump InletInjection/Abstraction a Volume in m3
1upperupperupper b/upper70/115
2upperbothupper/upper58/127
3upperbothupper/lower c60/124
4bothbothupper/upper120/255
5bothbothlower/upper120/237
6bothbothlower/lower120/255
7bothbothupper/lower123/303
8lowerlowerlower/lower60/134
9lowerbothlower/upper60/150
a Q = 8 m3/h, b upper = in blank casing above screen, c lower = in sump below screen.
Table 2. Timeline of all tests.
Quarter20142015TableFigure
IIIIIIIVIIIIIIIV
Construction 1, 2
Pumping test
Water quality 5a
Flow meter
Tracer test 12, 3, 4
Modeling
Water quality 25b
SIR-pilot test 2, 5b, 6
Tracer test 7, 8
SIR: subsurface iron removal.
Table 3. Water quality of Well 1 before SIR test (2015).
ParameterUnitCalc. Both Screens 70:30Both ScreensUpper ScreenLower ScreenMeasured Ratio
Q m³/h-7.75.52.4-
T°C-10.210.310.3-
pH-6.226.276.096.5359:41
O2mg/L0.750.921.010.11-
ECµS/cm28127928427544:56 1
Alkalinitymmol/L0.50.50.40.659:41
Aciditymmol/L0.8–1.11.20.80.8–1.7 260:40
Ca2+mg/L20.819.525.410.261:39
Mg2+mg/L6.36.07.43.662:38
Na+mg/L6.66.66.56.867:33
K+mg/L1.41.41.61.162:38
Femg/L14.416.95.635.062:38
Mnmg/L0.230.260.110.5062:38
Srmg/L0.240.220.310.0959:41
Bamg/L0.050.050.060.04-
Clmg/L21.5n.d.324.913.5-
NO3mg/L<0.05<0.05<0.05<0.05-
SO42−mg/L96941008657:43
1 low difference in EC-values, 2 color change difficult to see due to high iron concentration, 3 not determined. Q: Flow; T: Temperature; EC: Electrical conductivity.

