Next Article in Journal
Energy Recovery in Existing Water Networks: Towards Greater Sustainability
Previous Article in Journal
Small Scale Direct Potable Reuse (DPR) Project for a Remote Area
 
 
Erratum published on 16 June 2017, see Water 2017, 9(6), 435.
Article

Borehole Logging and Slug Tests for Evaluating the Applicability of Electrical Resistivity Tomography for Groundwater Exploration in Nampula Complex, Mozambique

by
Farisse Chirindja
1,2,*,
Jan-Erik Rosberg
1 and
Torleif Dahlin
1
1
Engineering Geology, Lund University, Box 118, S-221 00 Lund, Sweden
2
Geology Department, Eduardo Mondlane University, Av. Mozambique km 1.5, P.O. Box 273, Maputo, Mozambique
*
Author to whom correspondence should be addressed.
Water 2017, 9(2), 95; https://doi.org/10.3390/w9020095
Submission received: 8 December 2016 / Revised: 21 January 2017 / Accepted: 3 February 2017 / Published: 8 February 2017

Abstract

:
In Nampula province, Mozambique, there is a high number of water wells considered as having failed for having too low a pumping yield. Two Electrical Resistivity Tomography (ERT) measurement campaigns were conducted in the area for evaluating the reasons of failures. However, in some cases it was difficult to verify and interpret the ERT results by only using the inadequate lithological description presented in drilling reports. In this paper the integration of borehole logging and slug testing is presented as a solution to add more information and to enhance the interpretation of ERT models. The borehole logging tool measured resistivity, magnetic susceptibility and natural gamma. The logging results proved that the ERT models are accurate in estimating the resistivity for basement (>1400 Ωm), fractured layer (220–1400 Ωm), semi-weathered layer with clay accumulation (10–220 Ωm), and weathered and leached layer (220–2700 Ωm). The slug testing gave results of high hydraulic conductivity (K) values where the ERT indicates well-developed weathered and fractured layers, and low K values where these are less developed. The borehole interpretation can be extrapolated using the ERT model to give a geometric characterization of the aquifer. Therefore, the implementation of the ERT method in groundwater exploration is encouraged.

1. Introduction

Geophysical methods have made a valuable contribution to identification of groundwater resources in basement aquifers [1,2]. As the geology is complex, the interpretation of geophysical data is always problematic. It needs additional information from aerial photography, geological and tectonic maps and core description to reduce uncertainties. When such information is not available, a combination of different geophysical methods can improve the interpretation.
In 2010, a project funded by US Millennium Challenge Corporation drilled 600 water points in Nampula and Cabo Delgado provinces in North Mozambique. Each water point consisted of a well, a water pump and a communal washing basin. For each constructed borehole, there is a report with information about the drilling rate, geological logging, borehole and groundwater depth, dynamic and static level, and pumping test and water quality results. However, the accuracy of these reports is questionable due to inconsistency of the information. It was reported as a failure rate of about 25% [3] due to the geological conditions. A borehole is considered as failed if, at the time of the drilling, the measured yield was less than 600 L/h [3]. It was not possible with the existing documentation to explain the failures for sites that the pre-investigation indicated as potential. It is known that failure rate generally is high in consolidated rock areas of Nampula province [3].
Electrical Resistivity Tomography (ERT) measurements were performed in two field campaigns in an attempt to explain the failures. In addition, the Magnetic Resonance Sounding (MRS) method was tested in the first campaign and the Induced Polarization (IP) method in the second campaign. None of the methods contributed information that could improve the interpretation of ERT results, as both suffered severely from low signal-to-noise ratio [4,5]. The investigation demonstrated that the boreholes when placed above or on the edge of a high resistivity zone are likely to be unsuccessful. Thus, the thickness of the aquifer and the occurrence of open fractures are the most important factors [4].
ERT proved to give more details in consolidated rock areas than Vertical Electric Sounding (VES) [4] but questions remain. The main concern is about the inverted ERT models in the Rapale district with a thin, low-resistive layer underlain by a highly resistive formation. For such inverted ERT models, an unsuccessful borehole was expected but in some boreholes the yield was high and turned into a successful well. In Mongicual district, the inverted ERT models indicated that some boreholes did not reach the basement contradicting what is written in the drilling report. To explain the contradictions, in this study borehole logging was performed in these and other boreholes in an attempt to improve the understanding, and enhance the interpretation, of ERT results. Additionally, slug testing was performed in the same boreholes to quantify hydraulic properties, and an attempt was made to correlate the results to ERT inverted models.
From the borehole logging, different physical properties of the rock can be measured [6]. Electrical conductivity, natural gamma, and magnetic susceptibility are examples of parameters that can be measured. For hydraulic characterization of the aquifers, slug testing was conducted. Slug testing is a rapid aquifer testing method performed in a borehole to estimate hydraulic conductivity (K) and transmissivity (T). The slug testing is relatively easy and inexpensive to perform, so it has been widely done [7]. However, the results are usually questionable due to the limited time it takes to perform it, the unknown thickness of the aquifer under investigation and the radius of influence [8,9].
As the existing documentation of the boreholes is questionable as ground truth, a new approach to validate the ERT models is needed. Therefore, the main objective is to evaluate if ERT is applicable in this geological environment and can be used to reduce the number of failed wells. The specific objectives are to:
i.  
Estimate the thickness of the productive zone
ii. 
Identify possible fractures that were not detected by ERT
iii.
Correlate ERT models with hydraulic properties of the aquifer.
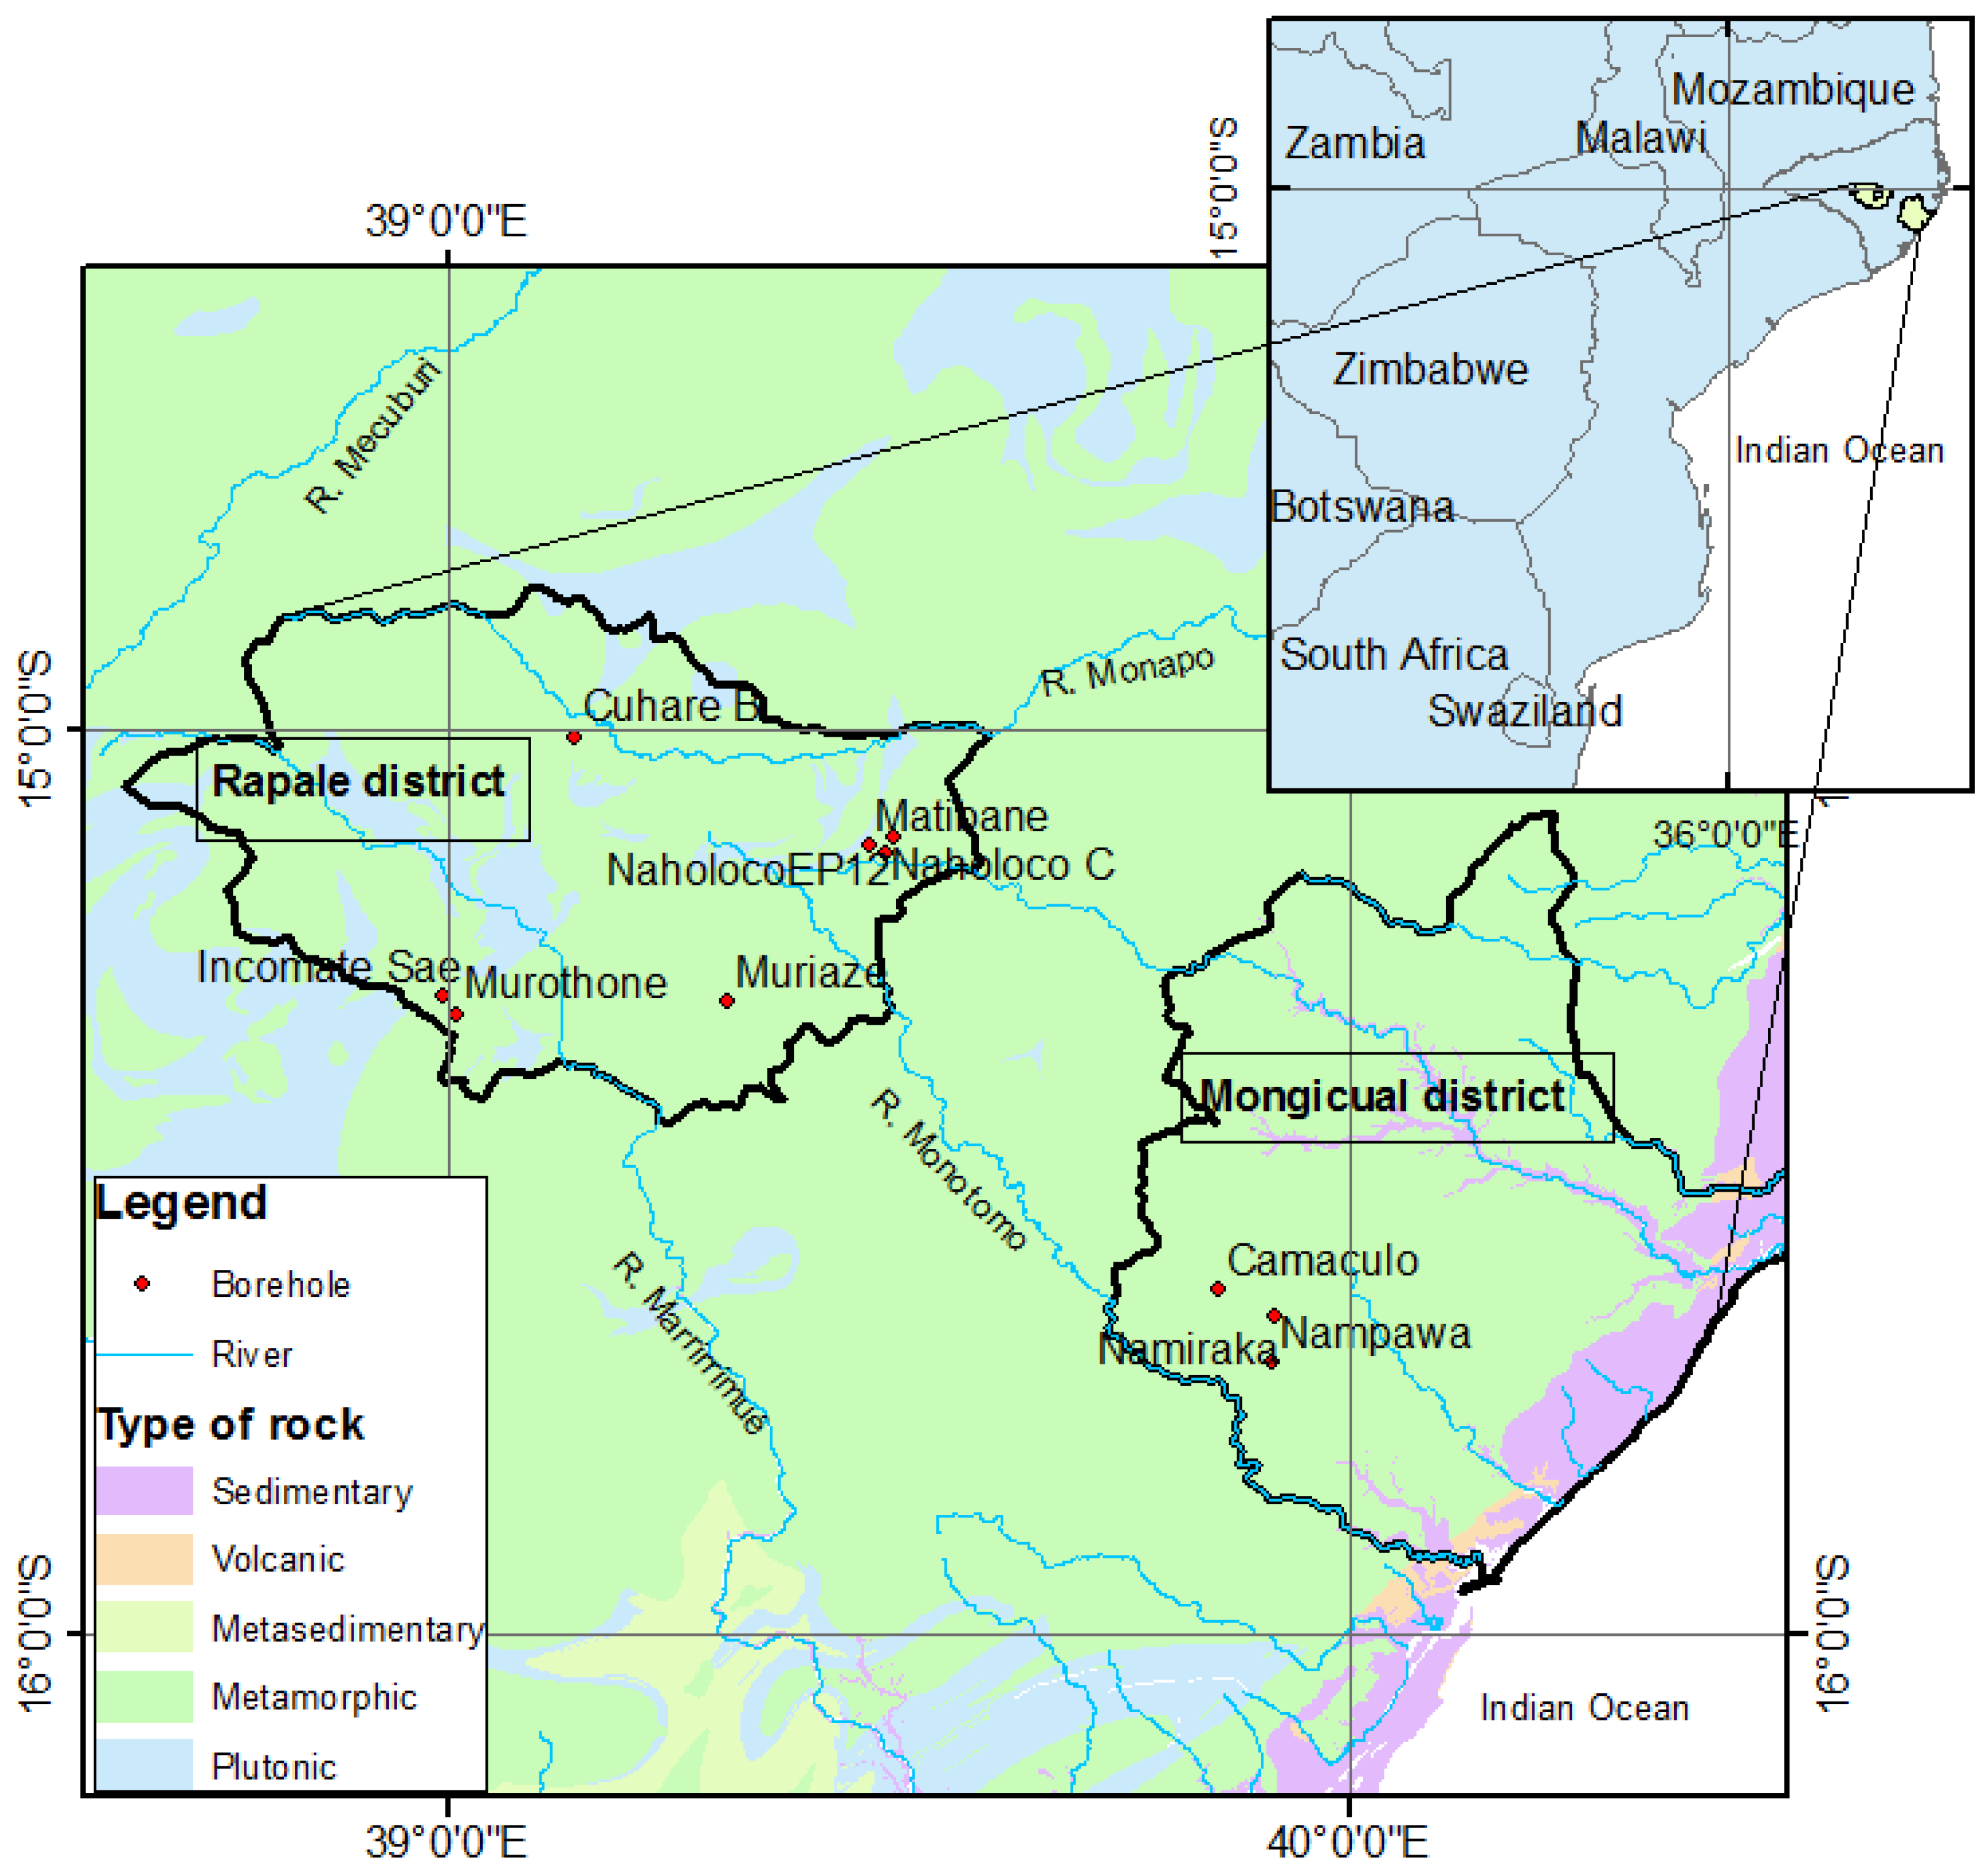
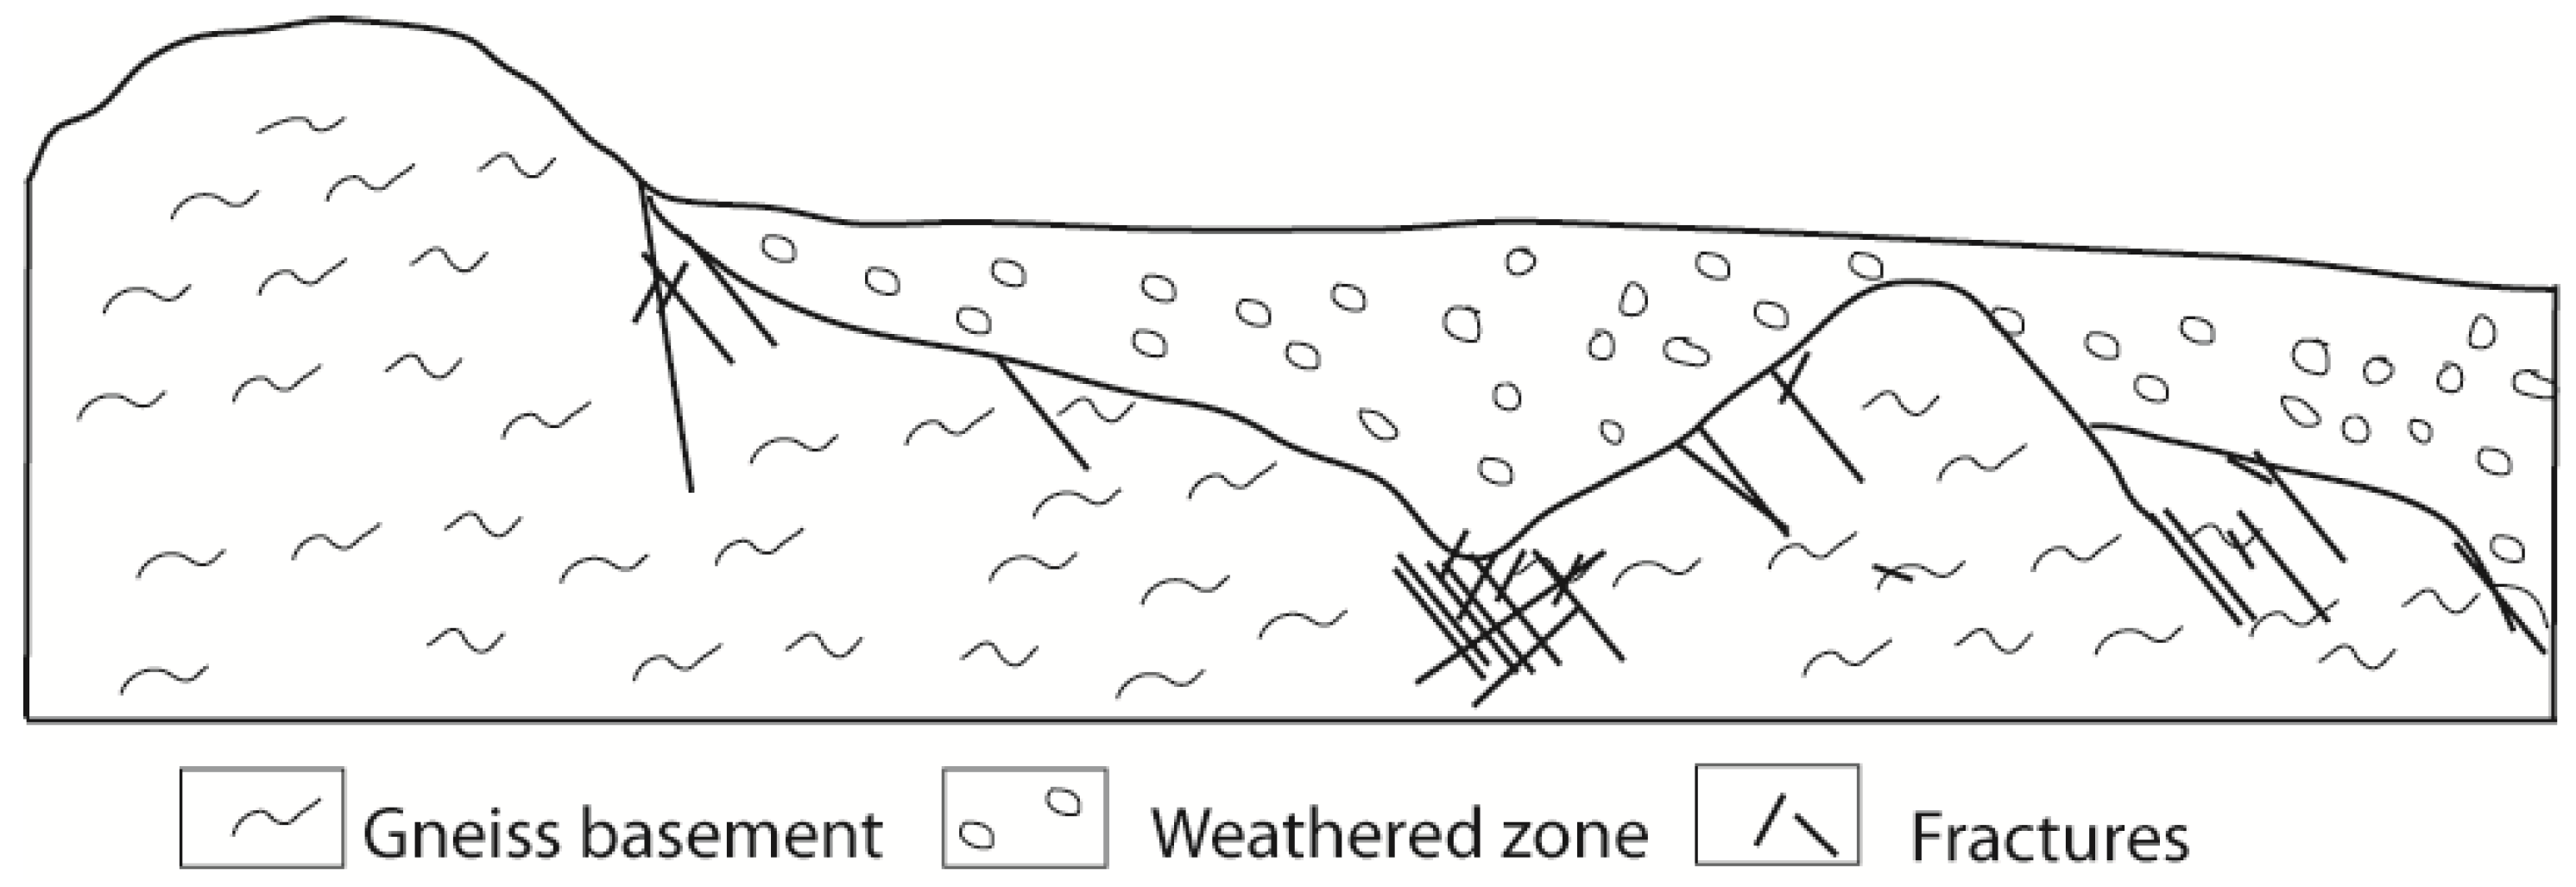
The outcome will presumably increase the knowledge about hydraulic properties of aquifers in the region, a knowledge that can also be used for other aquifers located in a similar geological environment. The survey will help to describe the hydraulic properties of the area in an attempt to develop better methods of finding safe and easily accessible water in the future in areas of similar geology.

2. The Study Area

The study area shown in Figure 1 is situated in Nampula province in North of Mozambique. The Rapale district is located in central part of the province and close to Nampula city and Mongicual city is located in the East part of the province. The study area belongs to a tropical region. The general elevation ranges from 40 to 300 m above the sea level (masl) in Mongicual district and from 400 to 550 masl in Rapale district. However, the presence of Inselbergs increases elevation locally in both districts. The populations in both districts are using groundwater extracted from the wells drilled in deep weathered and fractured gneiss. During the rainy season, the population extracts water from the seasonal rivers crossing both districts.
The geology of Rapale and Mongicual district is similar (Figure 1). It is mainly underlain by plutonic and metamorphic rocks of the Nampula complex, followed by a weathered layer. In the Mongicual district the weathered layer is also covered by eolian sand dunes [11,12]. The basement rock is composed of Mesoproterozoic gneiss of different grade of metamorphism as a result of deformation and migmatization [11]. The volcanic rocks (Figure 1) are represented by tonalities and thondhjemites of the Rapale gneiss and granites, quartz mononites, and granitoides [11] and also the late to post-tectonic quartz monazite, alkali granites, and syenites. The granites form large individual plutons (some over 10 km wide) and dykes of variable sizes that cross-cut older country rock units. The Mesozoic and Cenozoic geology is restricted to the coastal zone of the Mongicual district. The high coastal red sand ridge rises to over 100 masl and extends up to 15 km in-land. This composite dune form comprises several generations of sand dunes accreted during the mid-to-late Pleistocene and Holocene, however, the erosion of the ridge and weathering has removed all original records. Therefore, they can be distinguished on the basis of the progressively higher clay content, acidification, and redding in old sediments, caused by pedogenic weathering [11]. The sedimentary rock areas also include alluvial gravel, sand, and clay along the rivers and recent sand dunes along the coast.
The landscape is flat (Figure 2) however, previous ERT measurements [4,5] indicated that the weathered layer is not uniform. The weathered layer varies laterally and is narrow close to inselbergs.
The basement rock in the study area has low porosity and permeability. The secondary porosity is formed due to the dynamic process of weathering. The weathering front acts along the fracture, fissure, and joints over a period of time, thus advancing the process of weathering. The weathered layer forms the repository for groundwater accumulation and movement [13]. The yield is lower than 3000 L/h [14]. The paleo sand dunes have low porosity and permeability due the weathering process and the productivity is conditioned by the thickness of the weathered layer. The yield of these aquifers is variable. It can reach 5000 L/h where the weathering is insignificant [14].

3. Methodology

3.1. Selection of the Investigated Boreholes

The surveyed boreholes are all located in Nampula province. The drilling method was a combination of mud rotary (for the first unconsolidated formation) and percussion for the consolidated formation. The depths of the boreholes range from 30 to 70 m [14]. The drilled boreholes were cased and completed as gravel-packed screen completions, using gravel pack consisting of a material with an effective grain size greater than that of the aquifer formation [14]. The casing is a PVC pipe with an internal diameter of 103 mm [14].
From the 22 boreholes surveyed with ERT in previous campaigns, 10 boreholes were selected for logging and slug testing. The selected boreholes in Mongicual district are Camaculo, Nampawa, and Namiraka (Figure 1). The boreholes from Mongicual district were selected because the lithology description of each borehole indicated that drilling stopped in the basement contradicting the inverted ERT models. At this depth, the corresponding inverted ERT models gives resistivity value interpreted as the fractured and weathered zone. For the same reason, at Rapale district the boreholes Cuhare B, Incomate Sae, Naholoco C, and Naholoco EP12 (Figure 1) were also selected. The boreholes Muriaze, Murhotone, and Matibane (Figure 1) were selected for borehole logging and slug testing because they were drilled in very resistive formation interpreted as fresh basement but were considered as successful boreholes. The success of the drilled borehole was based on the yield, where a successful borehole should have a yield higher than 900 L/h. However, in a small community with few families, the yield could be lowered to 600 L/h and bellow this limit, the borehole was considered unsuccessful.
In total, 10 boreholes were investigated, and at each borehole both borehole logging and slug testing were performed. Before the testing, the AfriDev pump was dismantled and the pump tubing was also pulled out from the well.

3.2. Electrical Resistivity Tomography

The resistivity data collection was organized in two campaigns. In the first campaign in the Rapale district a system based on an ABEM Terrameter SAS4000 (ABEM Instrument AB, Sundbyberg; Sweden) was used and in the second campaign, in the Mongicual district, an ABEM Terrameter LS was used. A perpendicular cross with two 400 m survey lines was made close to the borehole, except in a few cases where physical restrictions limited it to one line. In total, 81 electrodes separated by 5 m spacing divided between four cables gave a spread of 400 m. The multiple gradient array was used throughout as it gives a suitable combination of lateral and vertical resolution, and is well suited for multi-channel measuring, thus making the field work time efficient [15].
All data were inverted with the Res2dinv software (Geotomosoft Solutions, Penang, Malaysia) using robust (L1 norm type) inversion [16]. The option for grid refinement, giving model cells with half the width of the electrode spacing, was used throughout.

3.3. Borehole Geophysical Logging
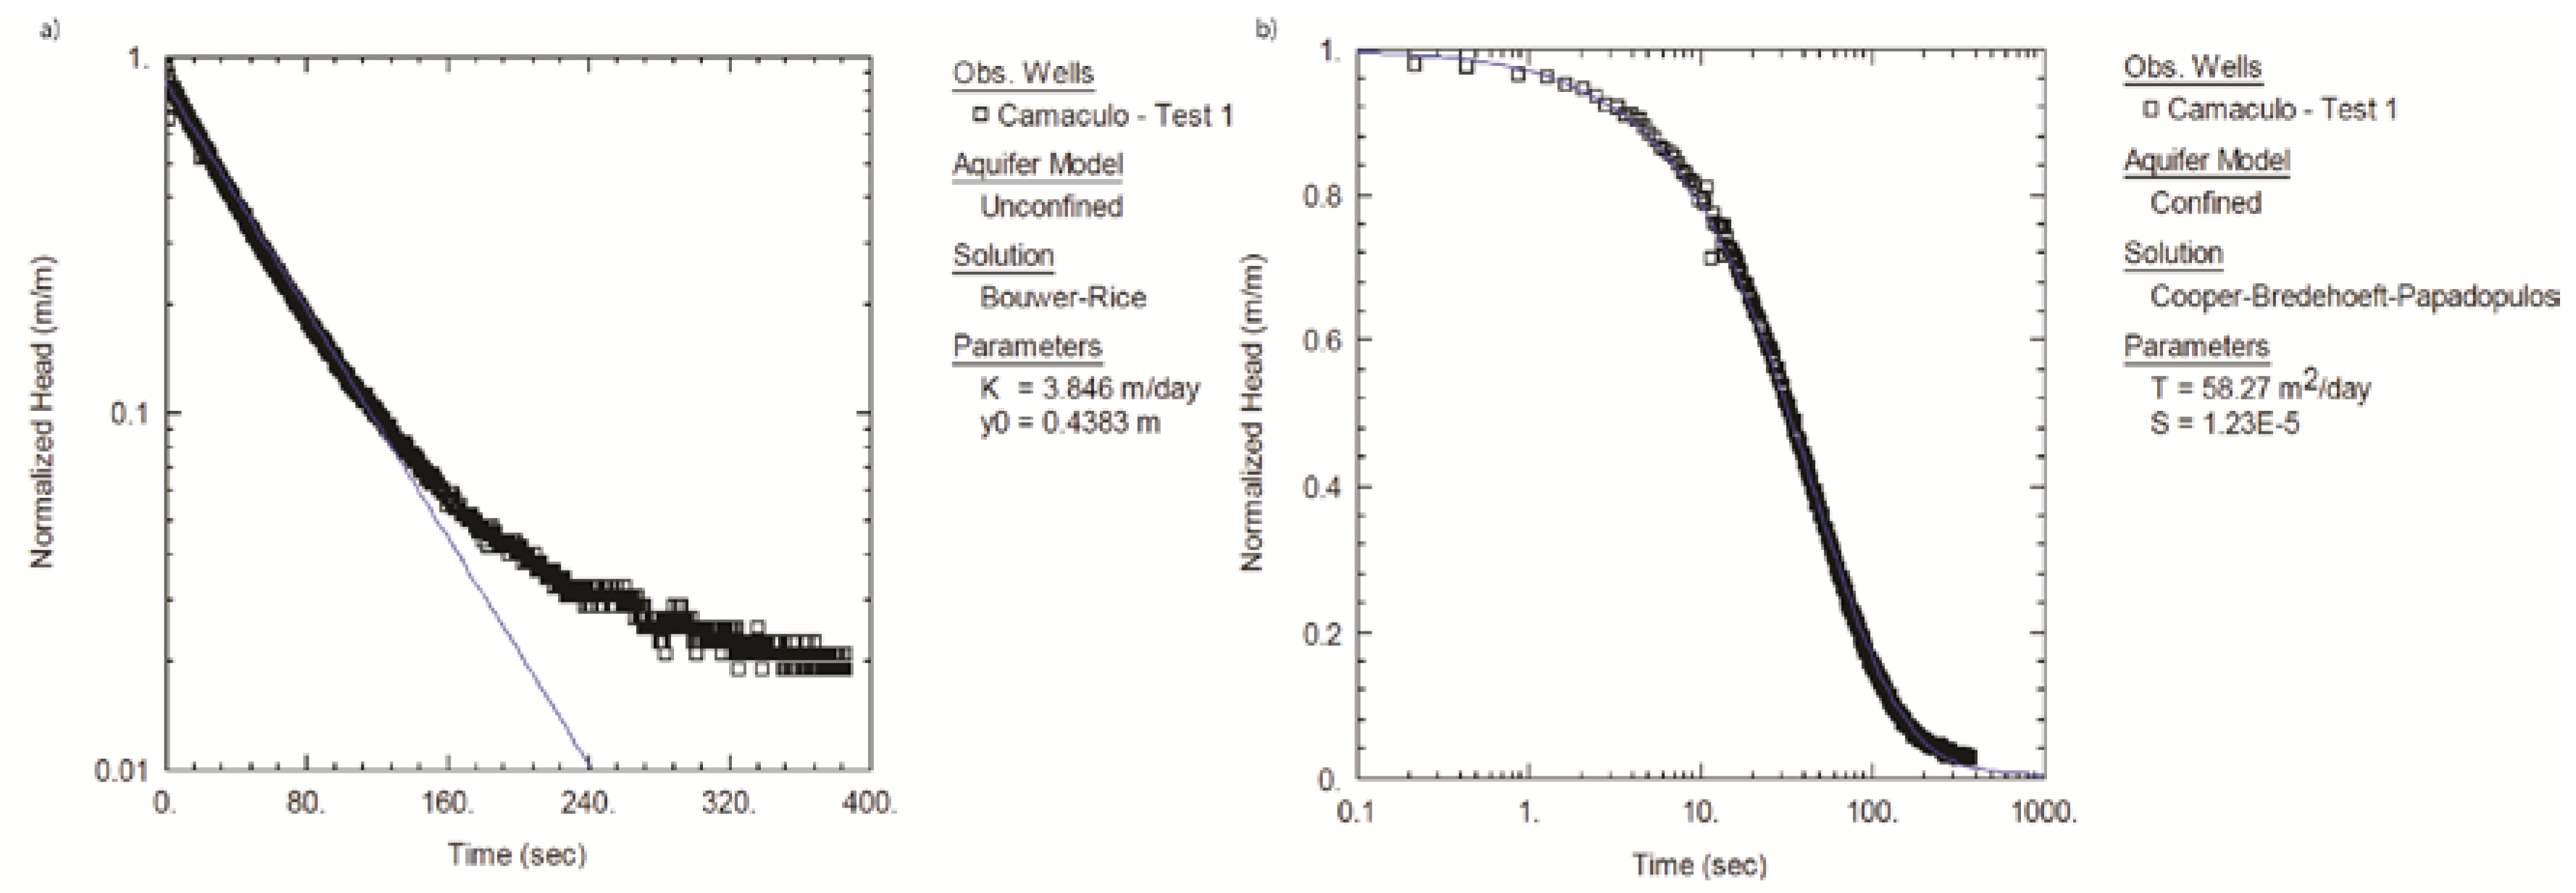
The Robertson Geologging dual induction logging probe [17] was used for this study. The probe measures formation electrical conductivity, magnetic susceptibility and natural gamma radiation in the borehole. According to the manufacturer, the magnetic susceptibility is detected, but it is not scaled and count per second (cps) is a raw un-scaled output.
Electric conductivity and magnetic susceptibility are acquired at two receiver coils placed 52 and 84 cm from the bottom of the sonde, called short conductivity (SCON) and long conductivity (LCON) respectively [18] The difference between the two is the obtained penetration depth into the rock formation, i.e., the SCON gives information in the vicinity of the borehole and LCON penetrates deeper into the formation.
In this study, the result is presented as resistivity, i.e., the inverse of the measured conductivity. The resistivity variation in the borehole is caused by change in geological material. The main geological process taking place in the study area is the weathering. Acworth [19] has developed a weathering crystalline rock basement profile including resistivity values for each layer (Table 1).
Generally, groundwater is found in soils ‘c’ and ‘d’ which are located between the overlying accumulated clay layer and the unweathered basement, with resistivity ranging between 60 and 600 Ωm.
The soil ‘b’ horizon is clay-rich and influenced by surface waters with increased ion concentration which decreases the resistivity [19]. The soil ‘b’ is unsaturated throughout the year, and no significant change in resistivity will be seen between the dry season and wet season. The groundwater quality is a key factor of resistivity response. Unfortunately, there is no water chemical data available for the studied areas, and although this can be expected to have an influence on the measured formation resistivity, it was not studied due to lack of data.
The layers described by Acworth [19] were identified in inverted ERT models as layer 1 for soil ‘A’, layer 2 for soil ‘b’ and ‘c’, and layer 3 for soil ‘d’ [4,5].

3.4. Slug Test

Slug testing is used to estimate hydraulic conductivity and transmissivity. A sudden change in head and return to a static condition is measured. The change in head is caused by: (i) adding or reducing of a known volume of water in the well; or (ii) introducing and removing a solid slug rapidly from the well [20]. The speed of which the water level returns to static conditions after the induced head from the slug is connected to the hydraulic conductivity or transmissivity of the formation [21]. The advantages of the slug test method are, e.g., the relatively low cost, simplicity and that it is a relatively fast method [21].
The field measurement started by measuring the water depth. Two solid slugs of different volume were used to initiate the slug test [22]. The first test was conducted as a falling head test and the second as a rising head test. The same procedure was repeated for the following tests. There is a possibility to evaluate directional dependence by comparing the results from falling head and rising head tests.
A series of slug tests (falling head and rising head) was conducted in each borehole. Primarily with one slug, then double slug, and finally one slug again, giving a minimum of six tests performed. It is always a good practice to use the same initial displacement during the first and last test to assess if the well is hydraulically improved or clogged throughout the test.
The selected slug test solutions for this study were the Bouwer and Rice [23] and Cooper et al. [24]. The Bouwer and Rice [23] solution can be used for fully or partially penetrating wells in confined and unconfined aquifers. The assumptions are that the aquifer is homogeneous, has uniform thickness and infinite areal extent, and that the hydraulic head in the aquifer varies with time but the specific storage is neglected. The Cooper et al. [24] solution is developed for fully penetrating wells in confined aquifers. The assumption is that the aquifer has infinite extent, is homogeneous and isotropic with uniform thickness. In contrast to the Bouwer and Rice [23] solution is the use of a specific storage parameter.
The software Aqtesolv (HydroSolve, Inc, Reston, VA, USA) was used to estimate K using the Bouwer and Rice [23] and Cooper et al. [24] solutions.

3.5. Additional Information

The surveyed area is lacking in bibliographical information. The existing information includes all the drilling reports, geological and hydrogeological maps of the study area. The lithology column found in the drilling reports was used to evaluate the geophysical borehole logging. In addition, specific capacity was calculated from the performed short-term pumping test data [22].

4. Results

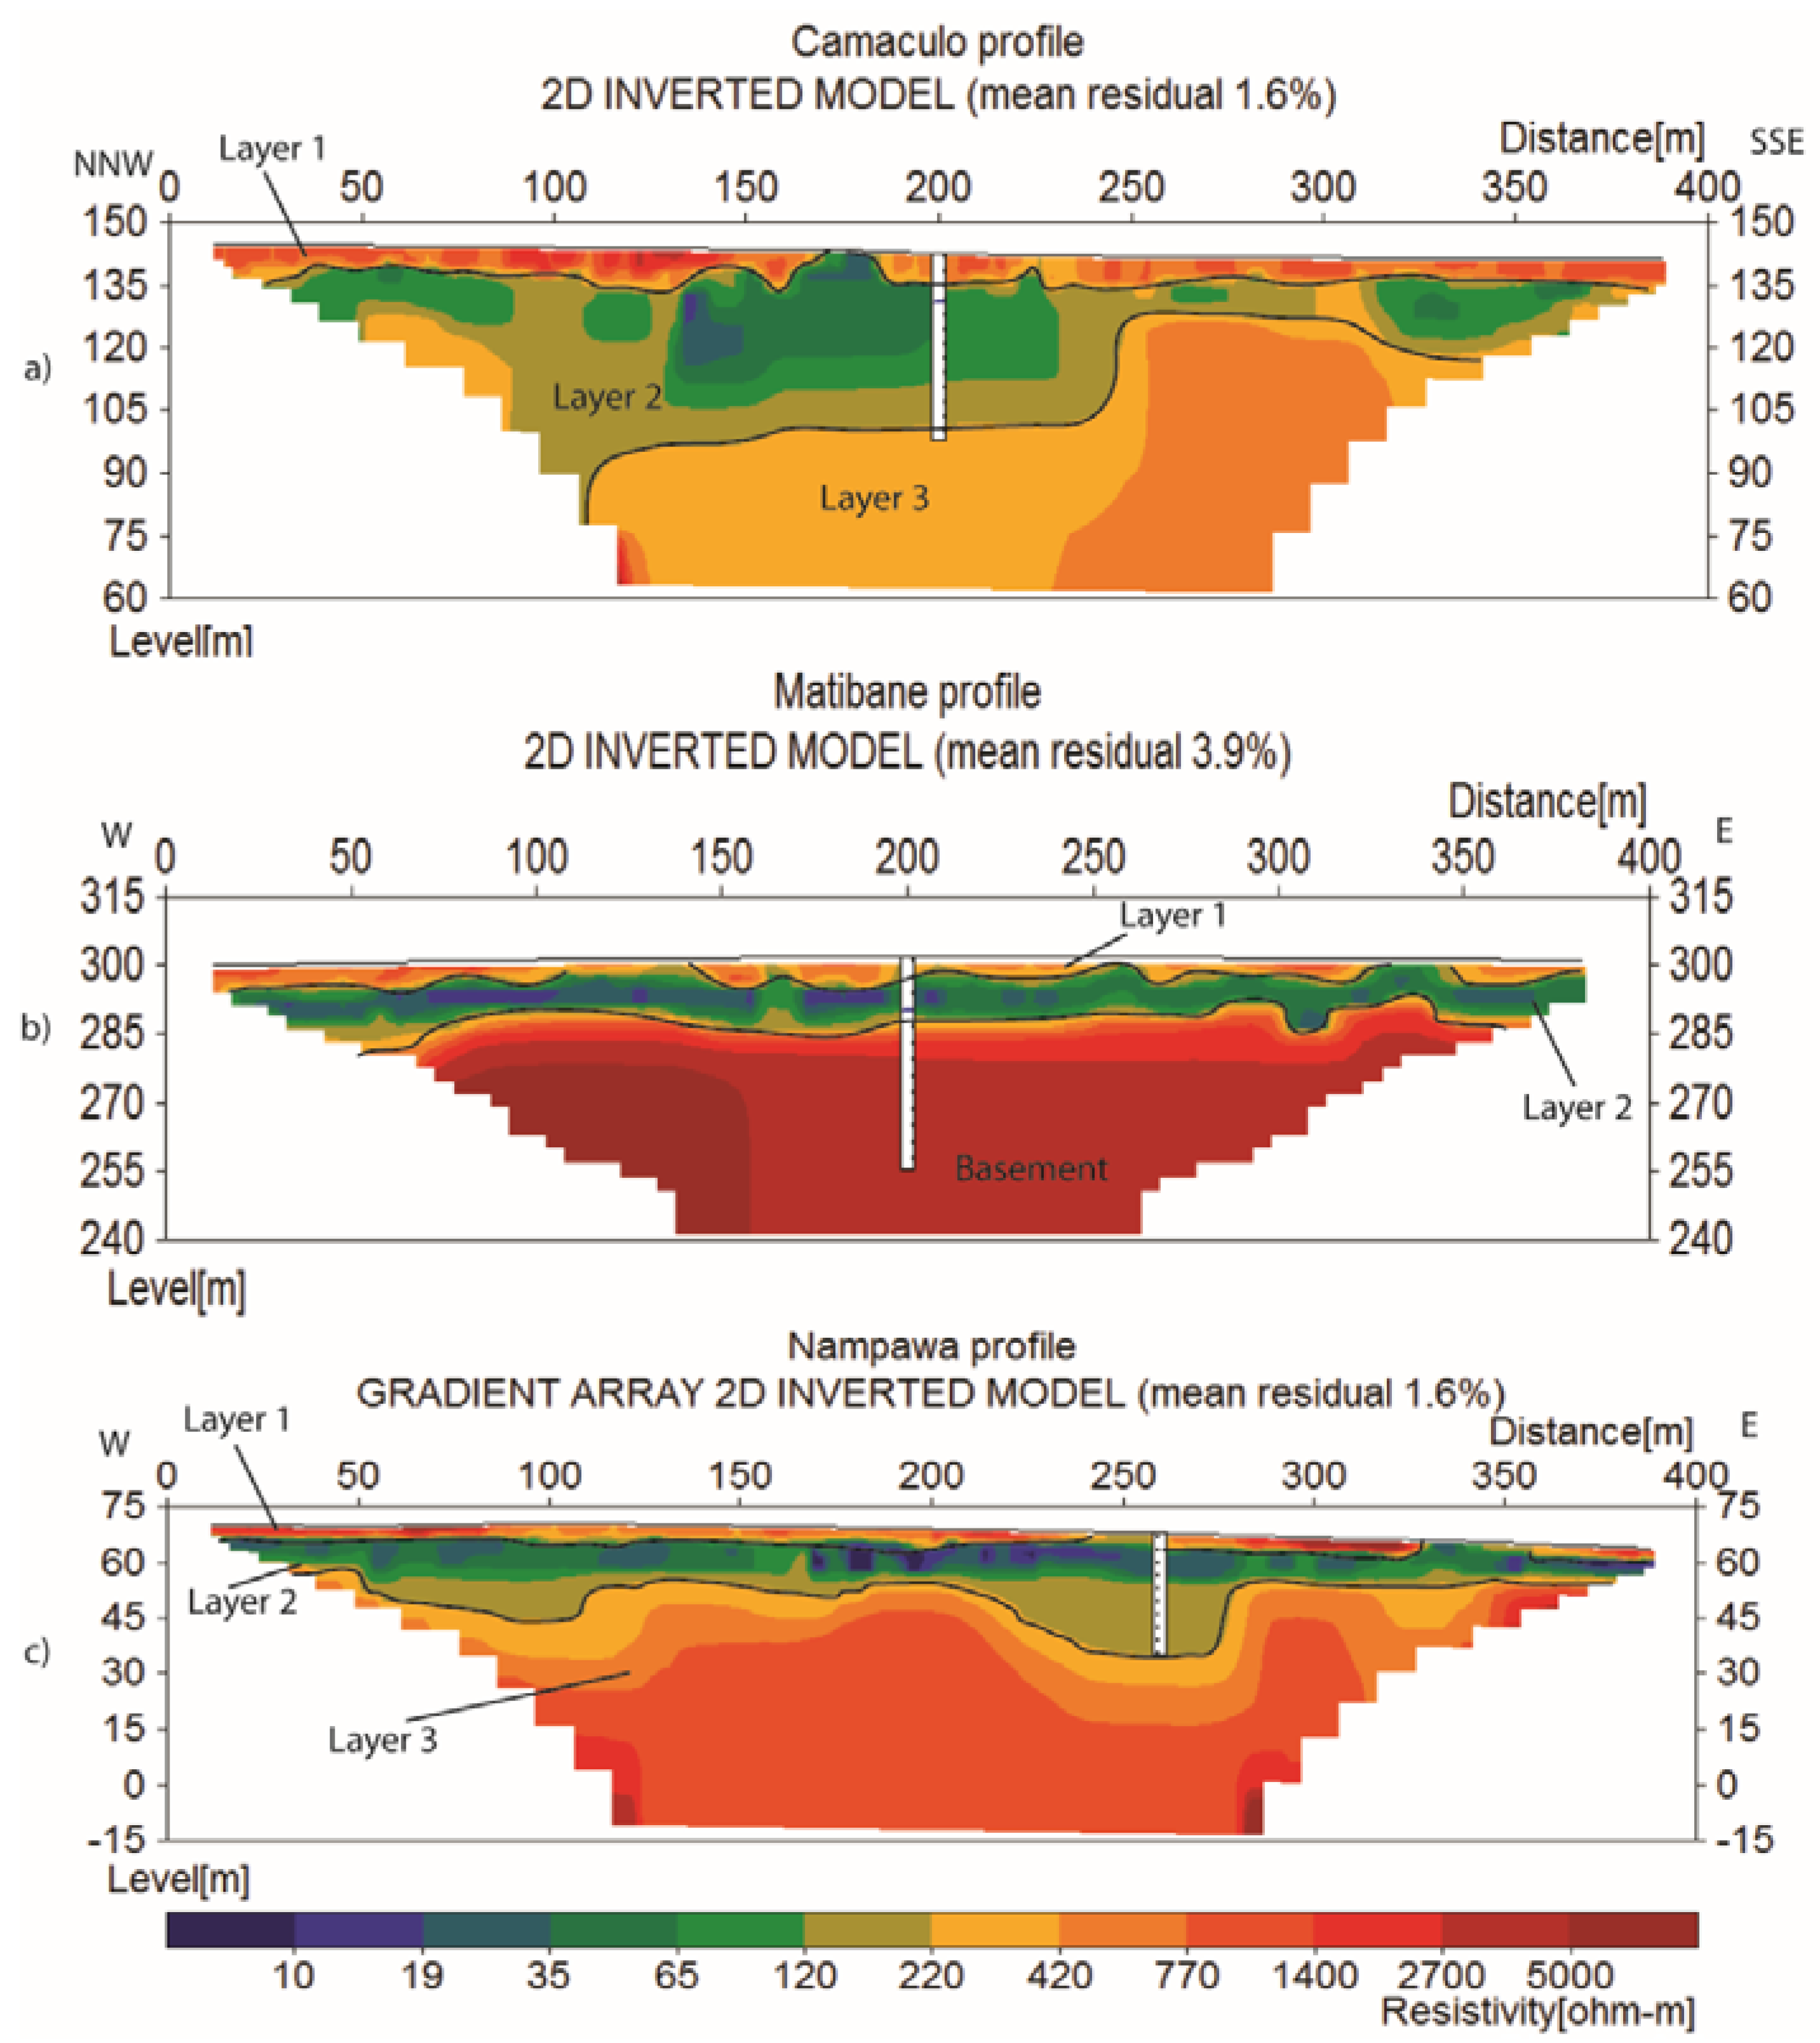
4.1. Electrical Resistivity Tomography

ERT survey have been conducted, as mentioned before, at 22 boreholes in the study areas. The inverted ERT models were classified in three different layers based on the information of Acworth weathering profile. Examples of inverted ERT models from the Camaculo, Matibane, and Nampawa profiles are shown in Figure 3.
Layer 1 is a highly weathered and leached layer with resistivity values ranging from 220 to 2700 Ωm. It is a combination of soil ‘A’ and ‘a’ (Table 1). Layer 2 is interpreted as a weathered to semi-weathered layer with a resistivity ranging from 10 and 220 Ωm and corresponds to soil ‘b’ and ‘c’ in Acworth weathering profile (Table 2). Layer 3 is interpreted as a fractured layer with a resistivity ranging from 220 to 1400 Ωm and corresponds to soil ‘d’ in Acworth weathering profile (Table 2). When the resistivity value, below the fractured layer, is higher than 1400 Ωm it is interpreted as basement (Figure 3b). The groundwater is expected to be accumulated in layers 2 and 3.
From the drilling reports the yield was used together with dynamic and static water level to calculate the specific capacity of each borehole. Due to the uncertainty of these values, no further calculations were made to estimate the transmissivity and hydraulic conductivity. Table 2 shows the geophysical layers extracted from ERT models, well depth and specific capacity.
The specific capacity of the studied borehole varies from 0.60 to 3.57 m2/day. The boreholes at Camaculo, Naholoco EP1-2, and Cuhare B have the highest specific capacity whereas the boreholes at Matibane and Nampawa have the lowest specific capacity.
The thickness of the geophysical layers extracted from the ERT inverted models are indicated in Table 2. The drilling at boreholes Nampawa, Camaculo, Naholoco C, and Incomate did not reach the fresh basement. According to the ERT models, the boreholes Matibane, Murothone, Naholoco EP1, and Namiraca were drilled quite deep into fresh basement. For the boreholes drilled into fresh basement, the expected yield was lower than 600 L/h, however, they were considered as successful boreholes although with low yield. The obtained inverted ERT models could not show the reason, which might be a rather narrow fracture zone because small structures are not resolved by ERT method [4]. It was expected that the borehole geophysical logging would improve the interpretation in such a situation.

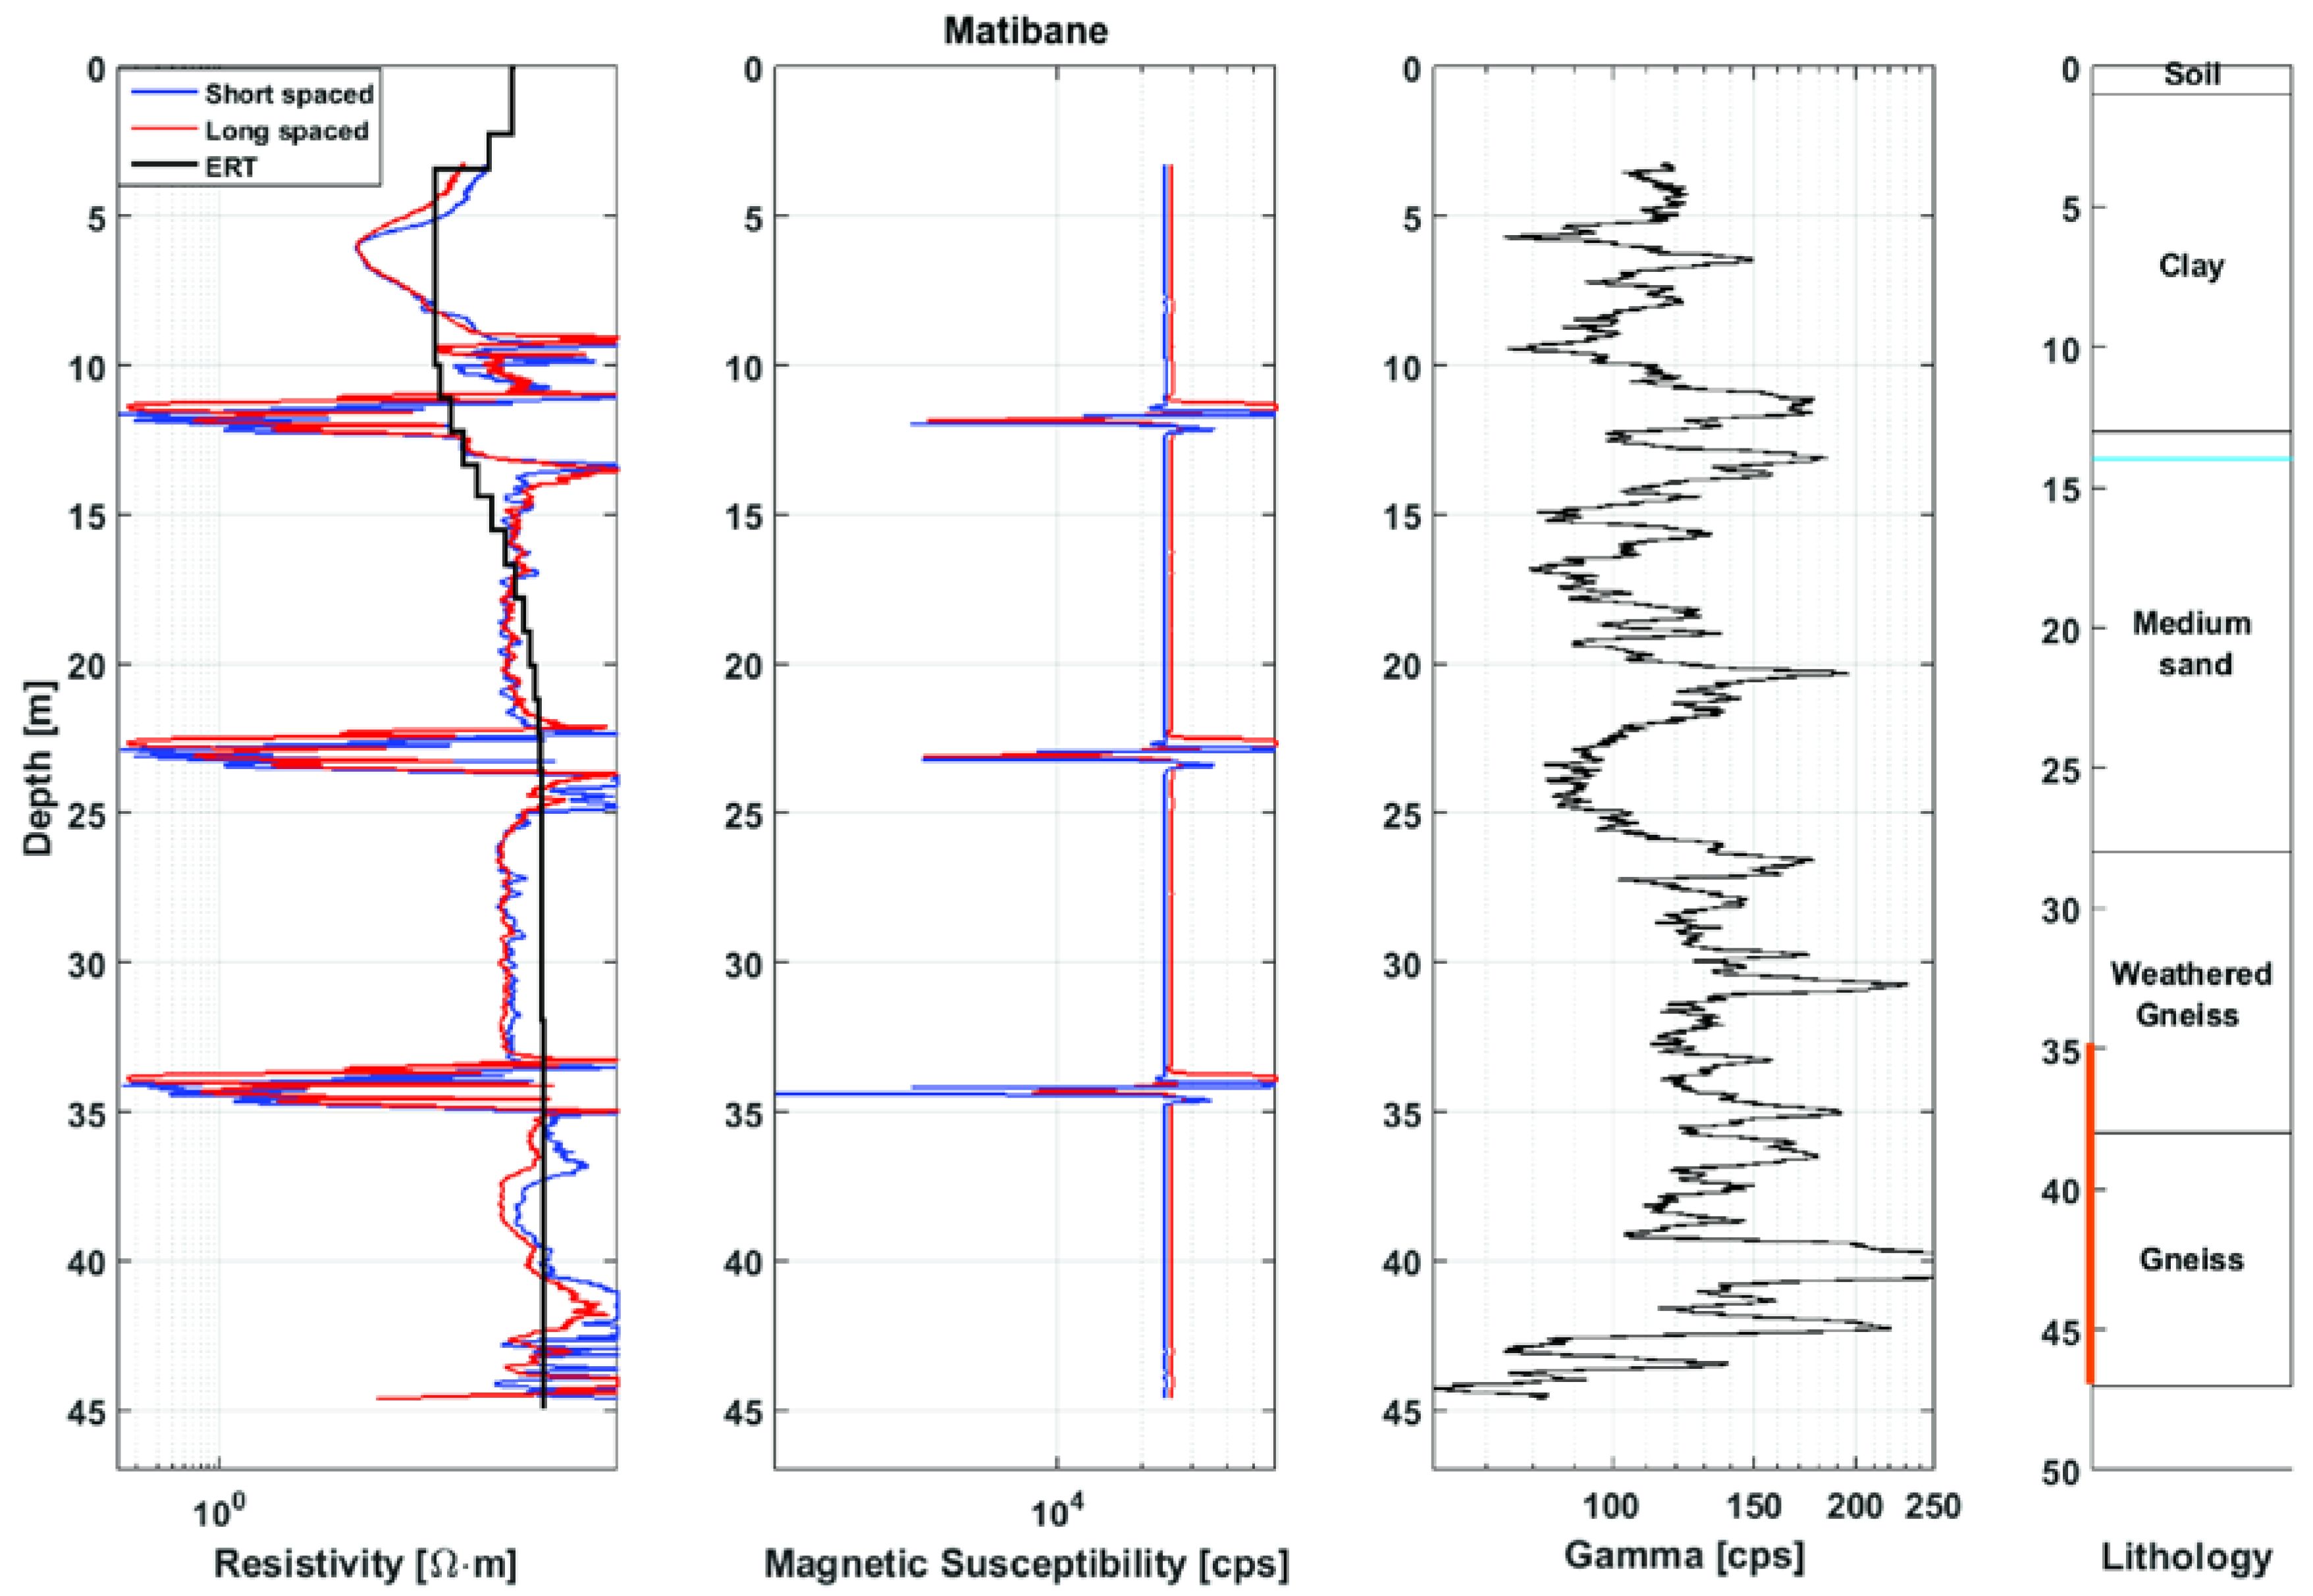
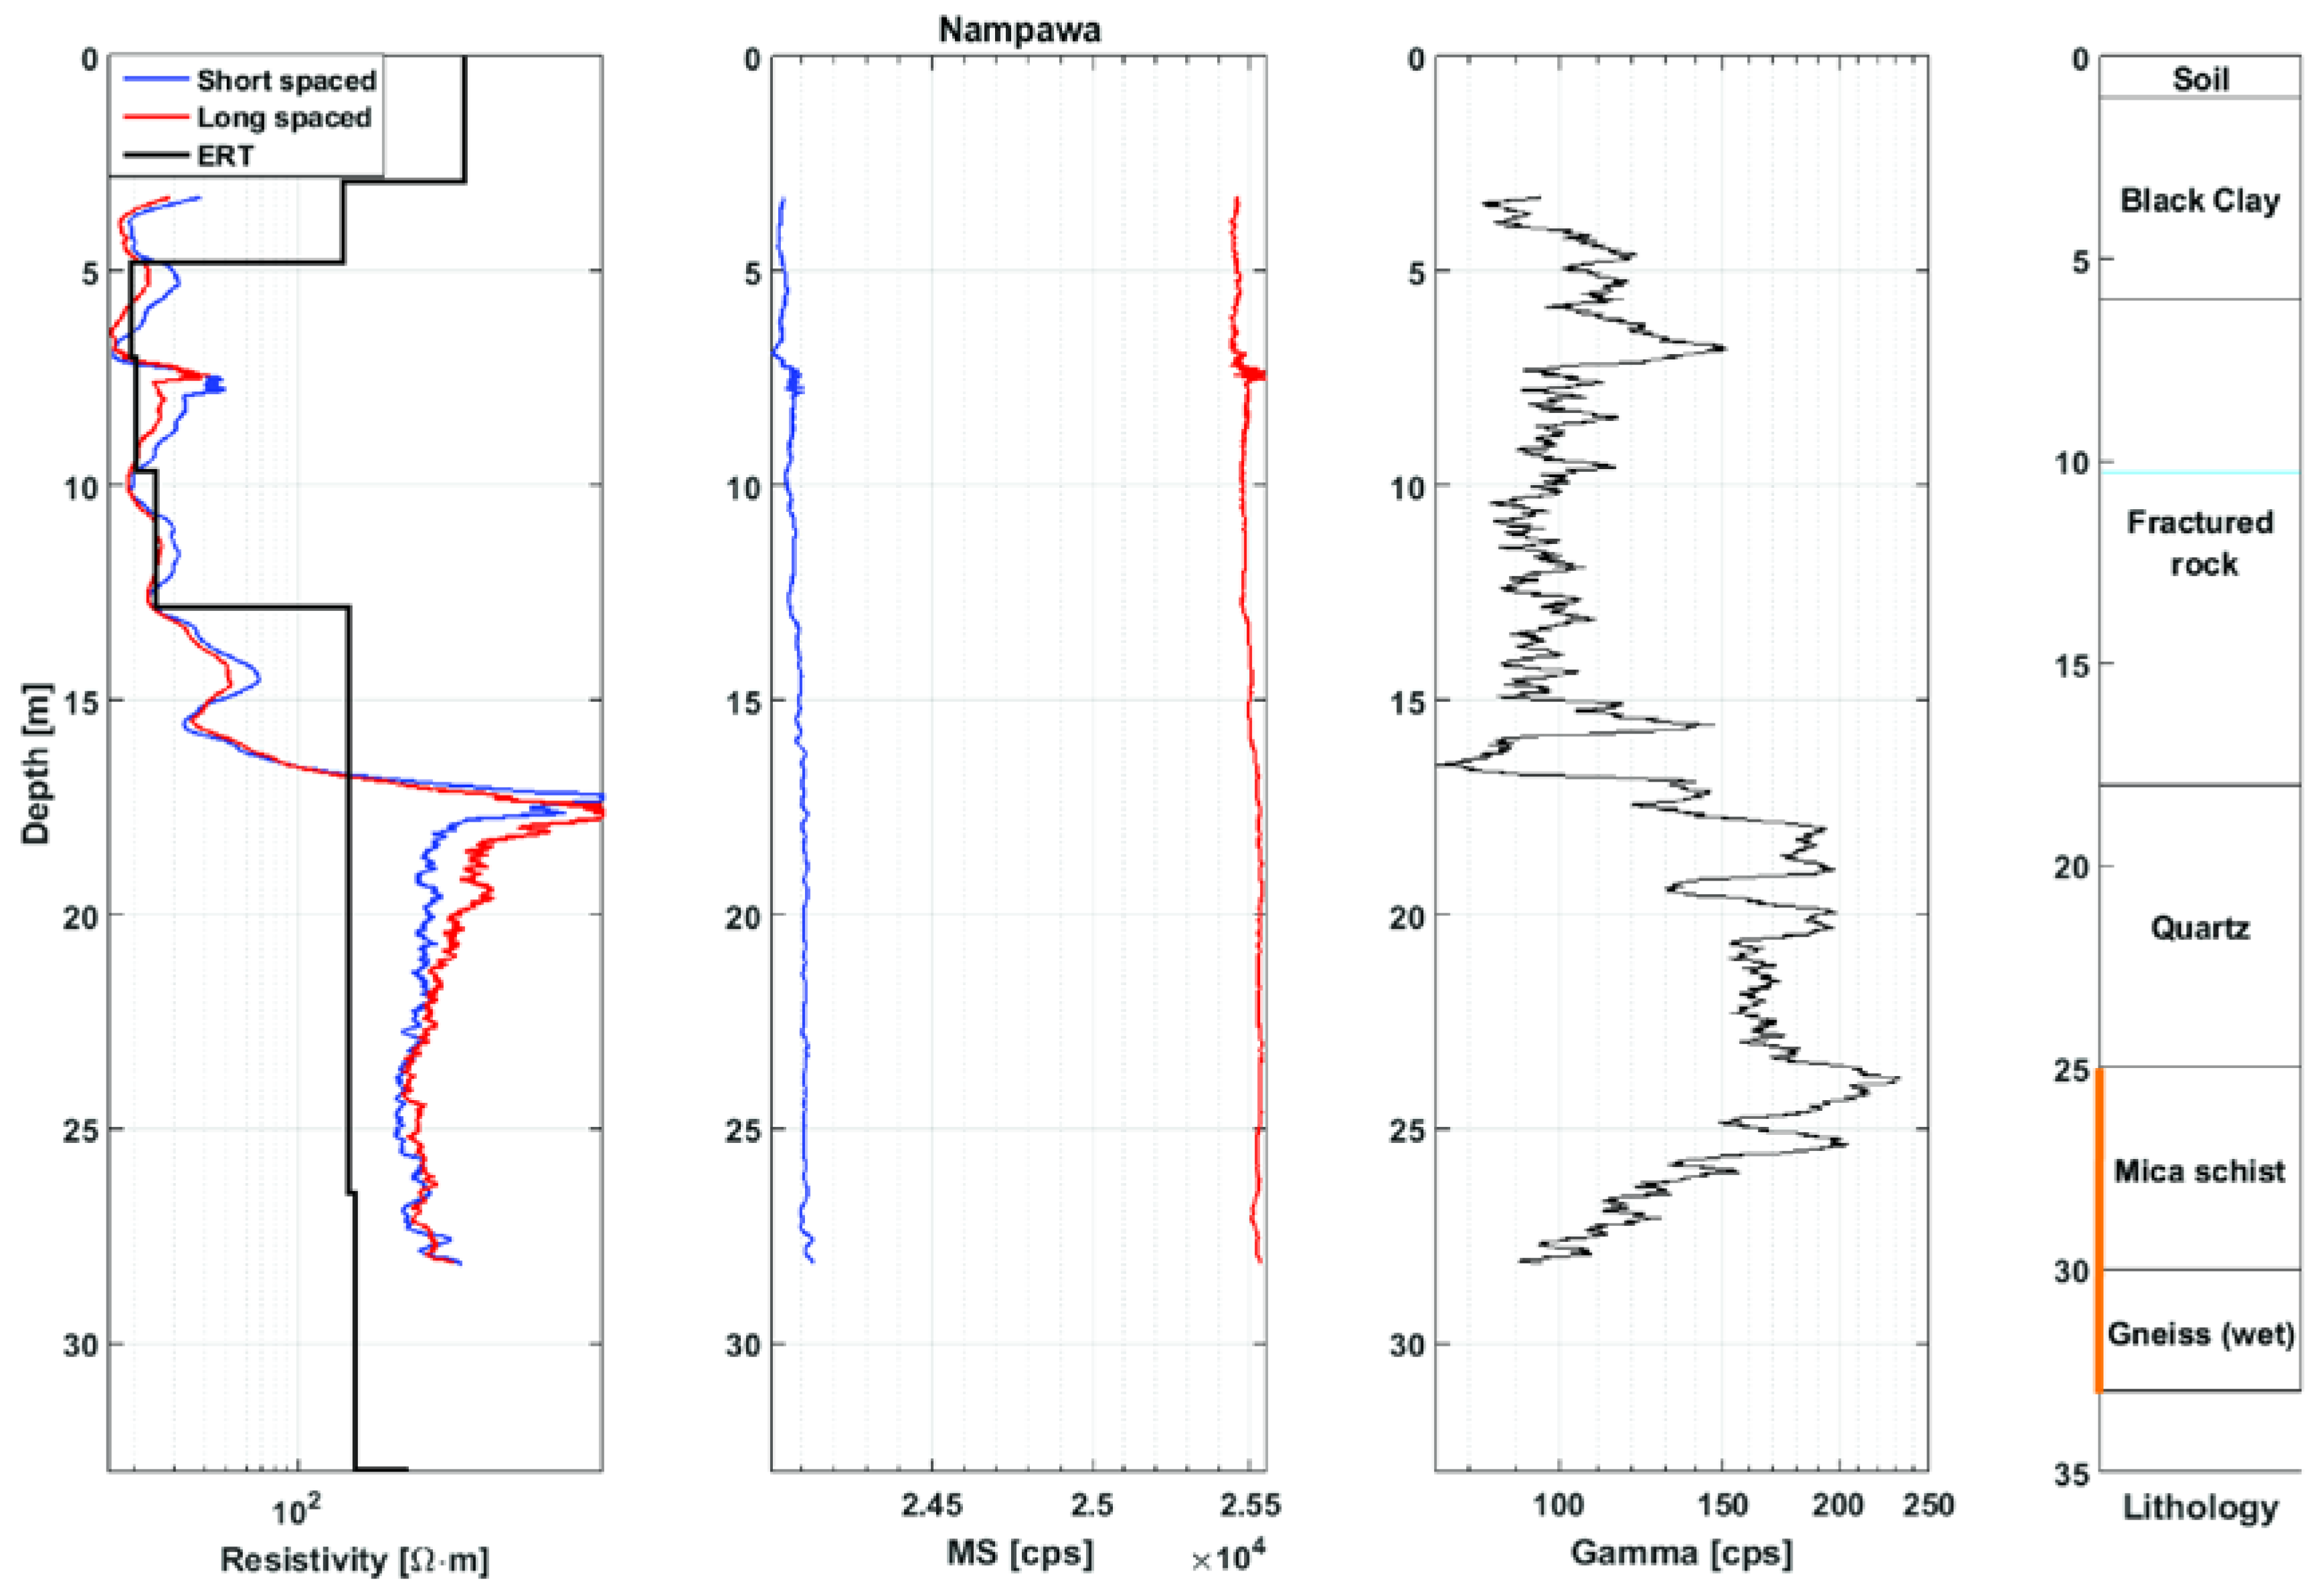
4.2. Geophysical Logging
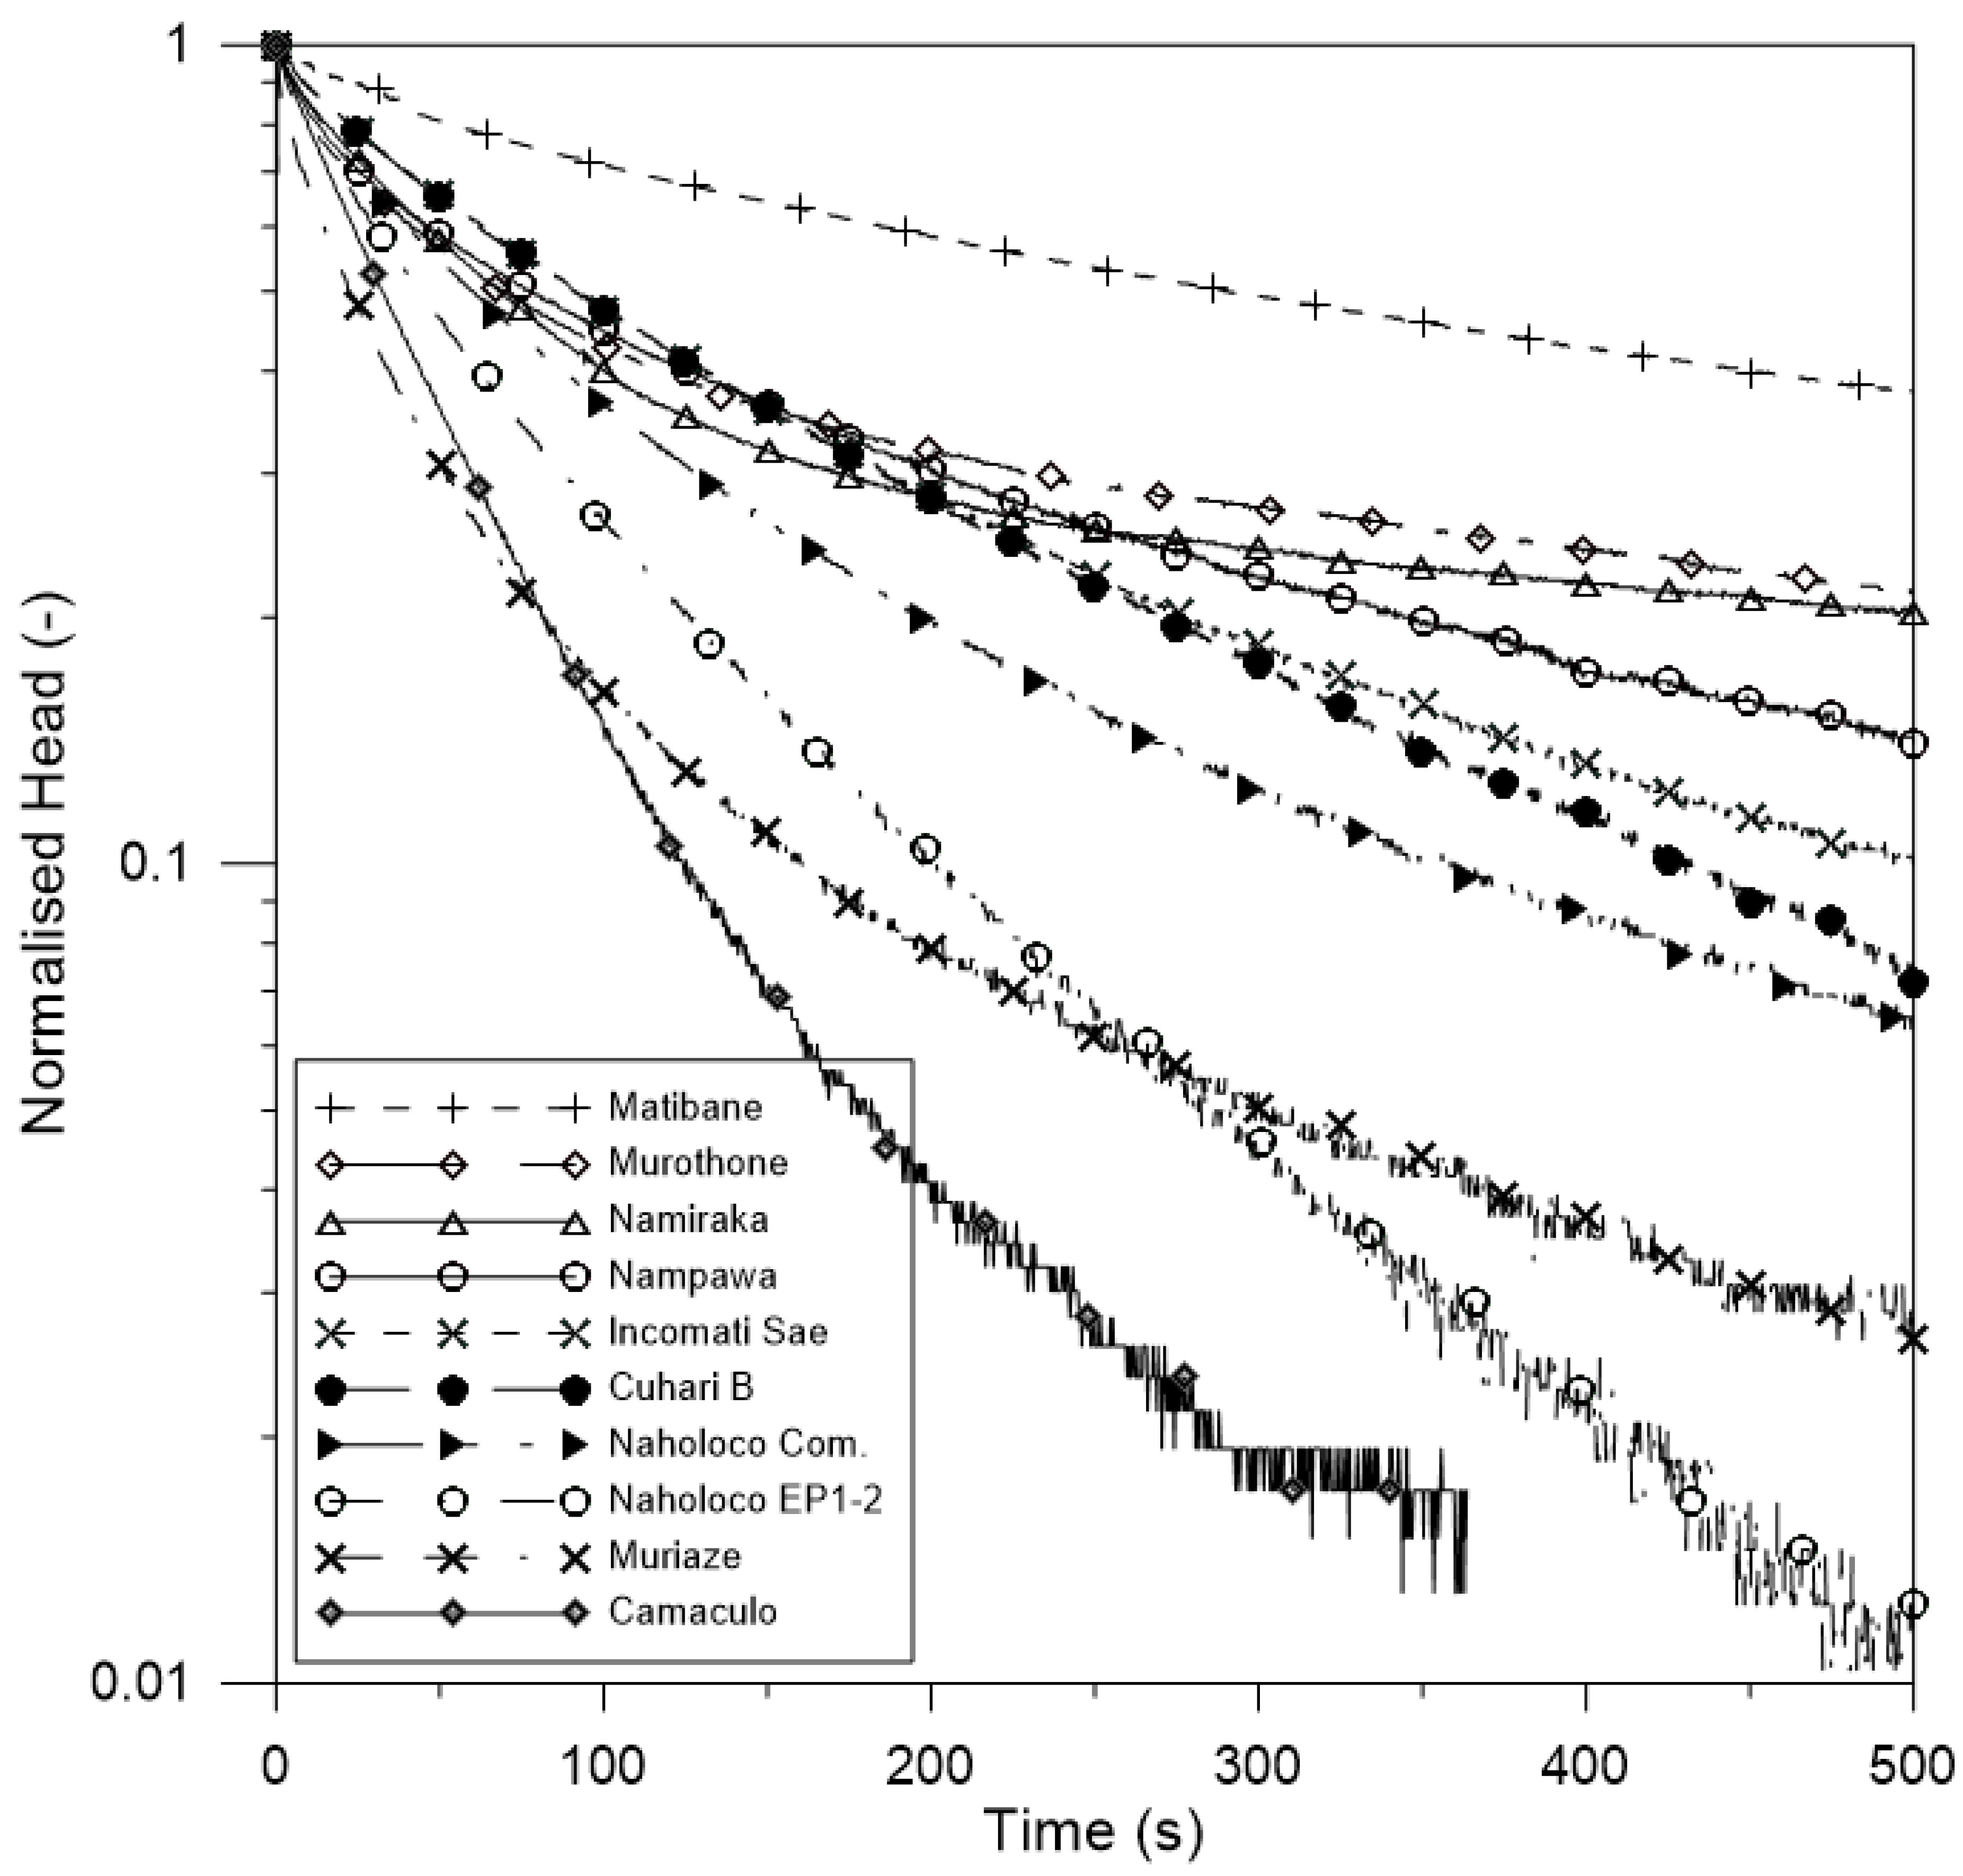
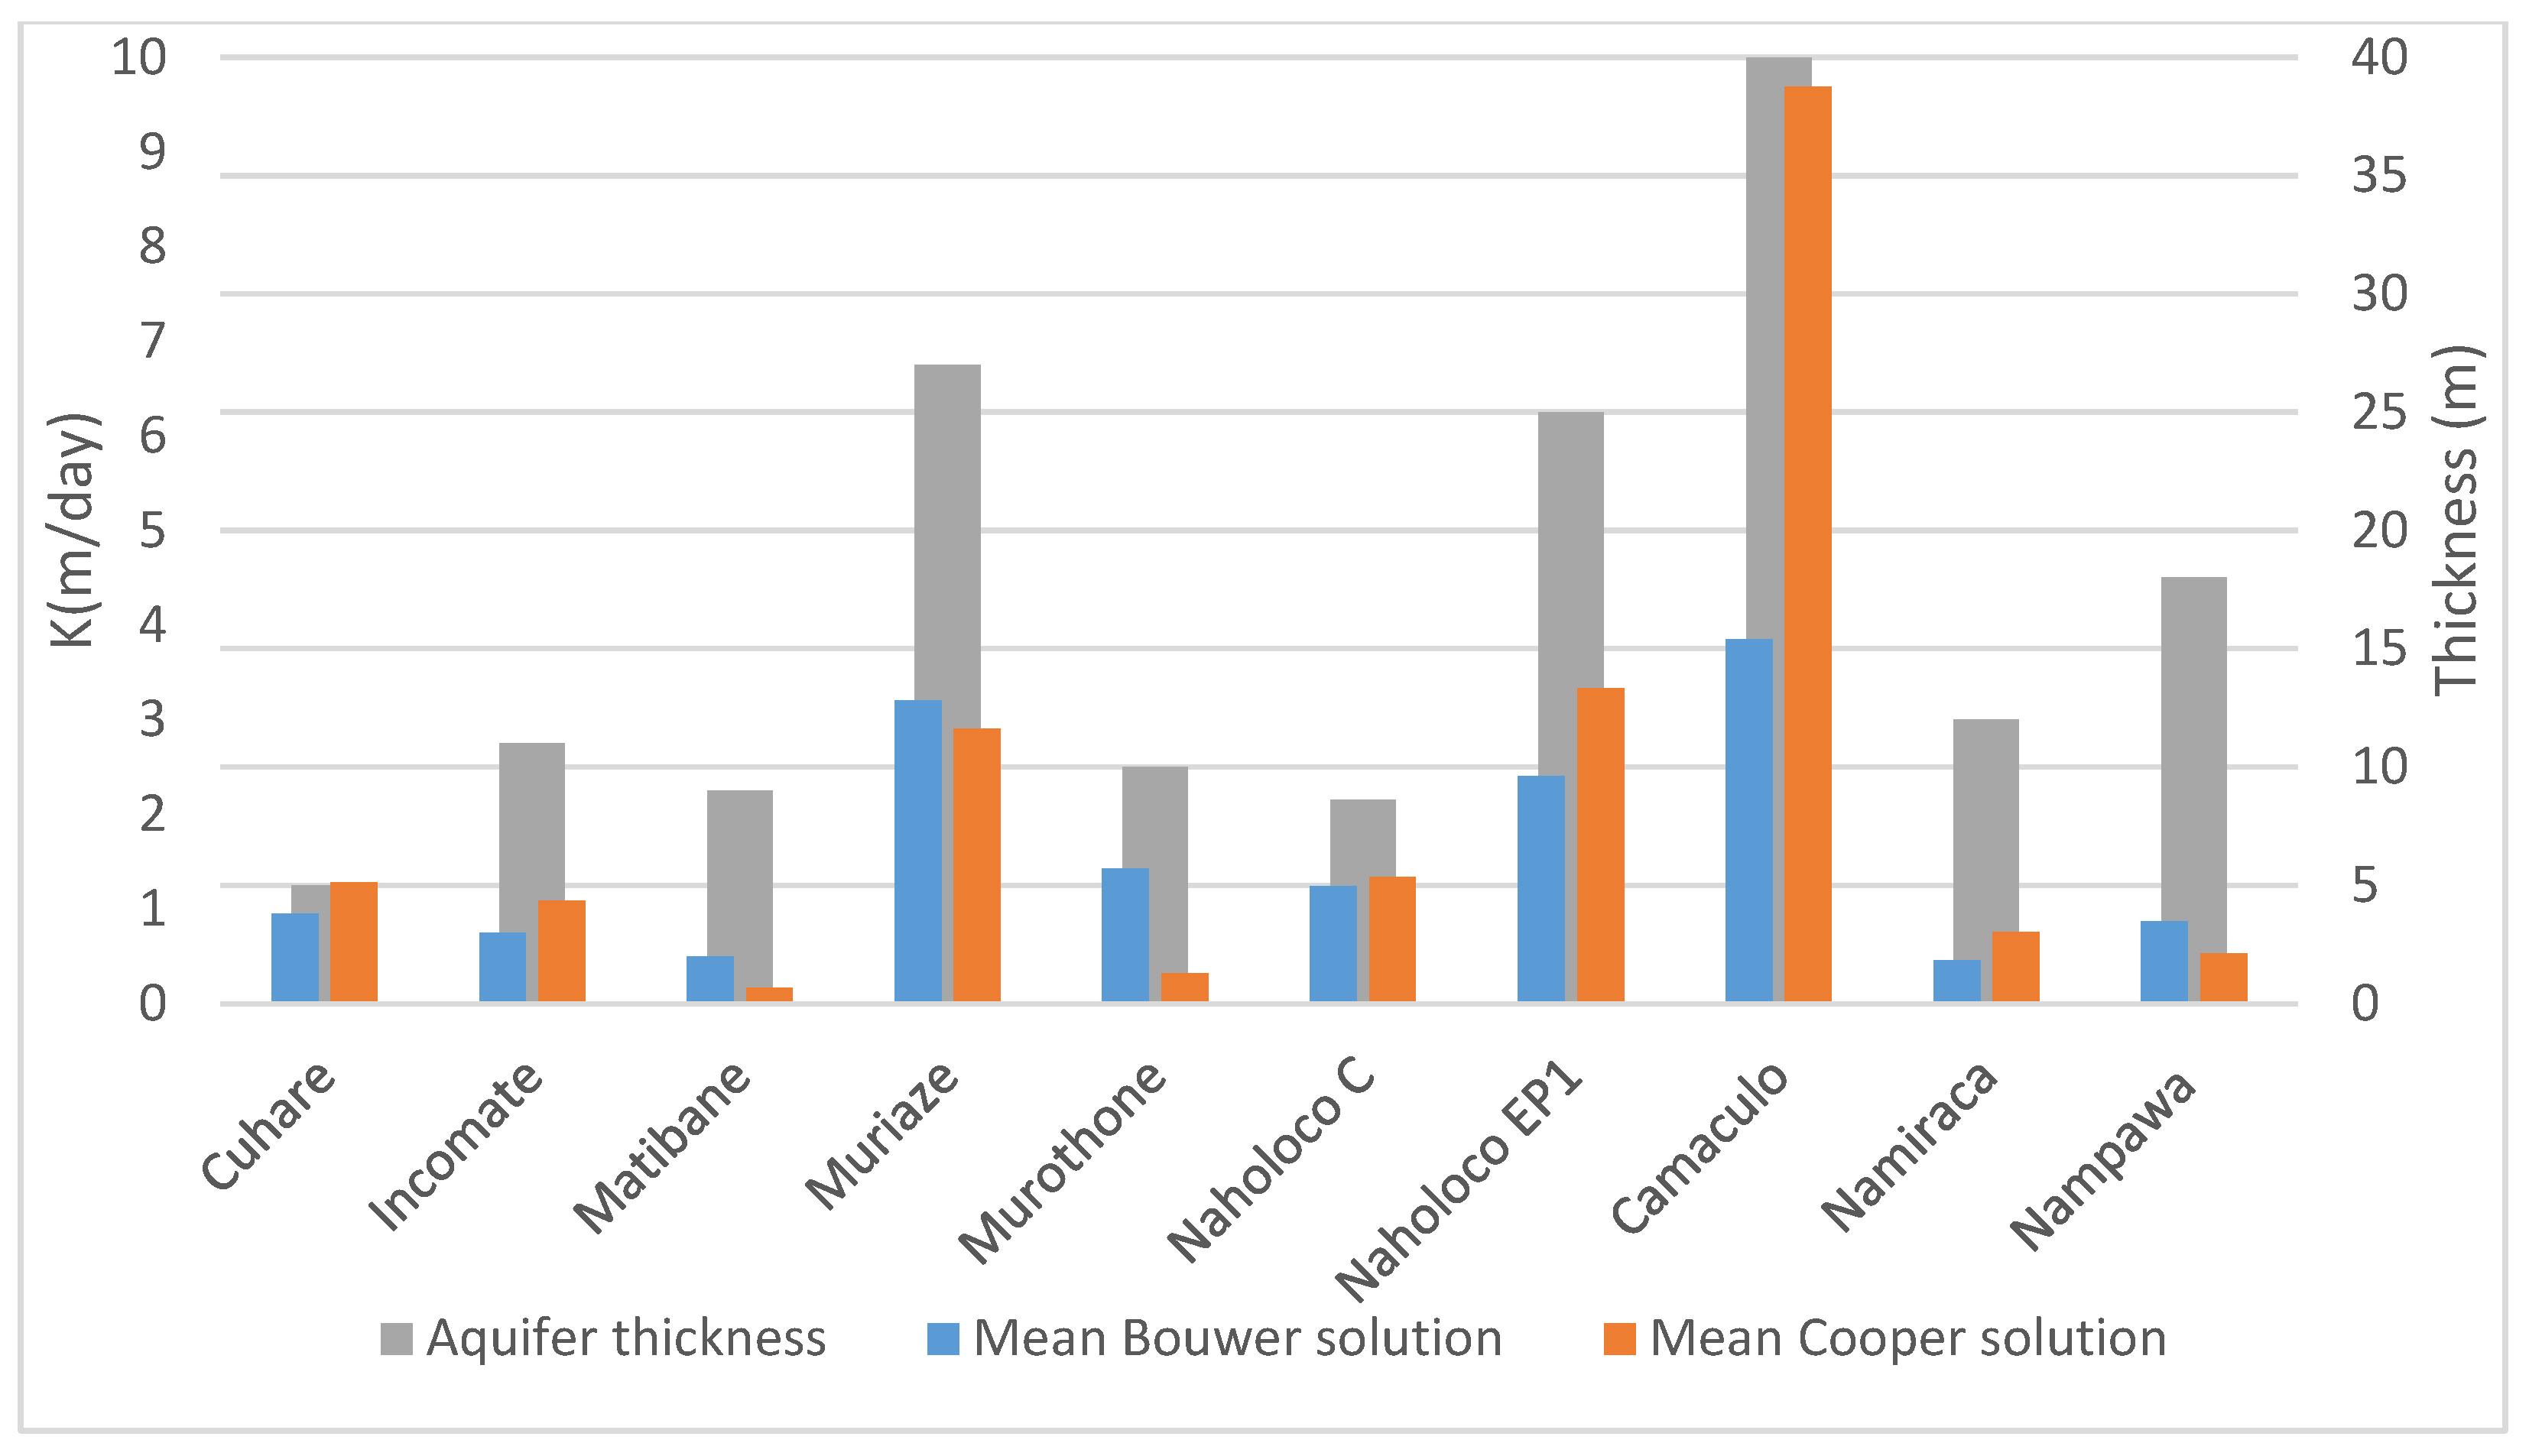
Two geophysical logging runs were conducted at each site to be able to assess the repeatability. All loggings started at a depth between 2 and 3 m, and therefore the geological interpretations were done from this point. Above this depth, interpretation of the structures are speculations based on geological knowledge. Due to limitation of the logging instrument, the maximum resistivity reading was set to 2000 Ωm which is the case of the boreholes Murothone, Cuhare B, and Matibane [18].
The results are presented as mean values of the two runs for the resistivity, magnetic susceptibility, and natural gamma. The borehole logging in boreholes Matibane, Naholoco C, Naholoco EP12, Cuhare B, and Murothone (see the location in Figure 1) were affected by interferences of metal centralizers attached to the plastic casing. The use of metal centralizers was not included in the drilling report. An example of the peaks caused by the metal centralizers can be seen in the resistivity and magnetic susceptibility in Figure 4.
The metal centralizers were detected both in resistivity and magnetic susceptibility (MS) readings as indicated by the peaks at depth of 12, 23 and 34 m (Figure 4). The resistivity curve extracted from the ERT inverted model has the same variation with depth as both short and long spaced measurements shown between the disturbed intervals. The natural gamma variation indicates presence of two layers. The bottom layer has lower values ranging between 50 and 100 cps (Figure 4). The upper layer is thick with natural gamma values ranging between 100 and 150 cps. The two layers are separated by a thin layer with higher gamma values (>600 cps). The peak is most likely caused by clay-infilled fractures or lithological variation of the basement, which could be associated with narrow but possibly hydraulically conductive fractures in the contact zone between the lithological units.
An example of variation in resistivity and magnetic susceptibility measured in a boreholes with nonmetallic centralizers can be seen in Figure 5.
Figure 5 shows the variation of resistivity and magnetic susceptibility at Nampawa borehole. The resistivity extracted from ERT (black line in Figure 5) is also included for comparison of the curves. Both curves and extracted ERT have similar variation in the upper 15 m. From around 15 m depth, the resistivity value change in both measurements but to different magnitude. The resistivity value of the first layer, with a thickness of 15 m, is 30 Ωm and was interpreted as a highly weathered layer. It is in line with geological logging that characterizes this layer as containing black clay and quartz. The quartz could comprise all fine, medium and coarse sand resulting from the weathering of the basement rock. The second resistivity layer has 200–300 Ωm and was interpreted as the semi weathered layer. The fresh basement could not be detected from the resistivity measurements. The absence of fresh basement based on interpretation of the geophysical measurements in this borehole contradict the geological logging done during the drilling. The magnetic susceptibility could not give any additional information for both short and long spaced measurements due to the nature of the local geology.
The natural gamma variation indicates three different layers. The first layer with homogeneous variation in range of 90 to 110 cps with a peak at seven meters (peak also detected by resistivity and magnetic susceptibility as seen in Figure 5). The second layer starts from 16 to 25 m and is characterized by an increase in natural gamma value. In this layer the natural gamma varies from 120 to 220 cps. In the third layer the natural gamma values decreases from 220 to 90 cps. The variation in natural gamma value was interpreted as variation in lithology rather than degree of weathering.
For the boreholes Namiraka, Camaculo, and Muriaze, the logging measurements were affected by high noise of unknown source, possibly metal objects in the well installation or backfill. The noise made the approach of supporting the interpretation of ERT inverted models more difficult. Only in the Nampawa borehole the resistivity logging result (Figure 5) appears unaffected by anthropogenic material. Here, the resistivity value of the bottom layer is 400 Ωm which is considered as fractured layer 3 (soil ‘c’ in Table 1).

4.3. Slug Test

At each site 6–10 slug tests were conducted, giving in total 68 tests for the 10 surveyed boreholes. Each slug test was evaluated using Aqtesolv (HydroSolve, Inc, Reston, VA, USA) giving in total 136 evaluations [22]. Unfortunately, no specific method is developed for weathered crystalline rock. The Aqtesolv program (HydroSOLVE, Inc., Reston, VA, USA) has a solution for fractured rocks [25], however too many initial parameters are needed to use the method. The average hydraulic conductivity from all sites was calculated using Bouwer and Rice [23] and Cooper et al. [24] solutions [22].
The Figure 6 respectively presents example of the Bouwer and Rice (Figure 6a) and the Cooper et al. (Figure 6b) solution fit to the measured head at the Camaculo borehole using Aqtesolv (HydroSolve, Inc., Reston, VA, USA) The field data fit well in both solutions except for the part after 120 s in Bouwer and Rice solution.
The last slug test taken at all sites are plotted as the logarithm of normalized heads against time (Figure 7). The graph shows only the slopes of the lines in the first 500 s for visualization purpose. Figure 7 shows chages in slopes over time in Murothone, Naholoco C, Nampawa, Namiraca, Matibane and Incomate Sae D while other sites show a more linear behavior. Due to change in slope, the double straight line method was used [22].
Figure 8 shows the aquifer thickness as estimated from ERT and K value of each surveyed borehole. The aquifer thickness is the sum of layers 2 and 3 (Table 2). The K value is presented for both the Bouwer & Rice and Cooper et al solutions. The slug testing at Camaculo borehole gave the highest value of K both by the Bouwer & Rice and Cooper et al. methods (Figure 8). The well-developed weathered layer and fractured layer at Camaculo profile (Figure 8) and absence of the fresh basement (Figure 3b) can be related to the high K value. On the other hand, the borehole Matibane gave the lowest value for both methods (Figure 8). For the Matibane borehole the weathered layer is thin and the fractured layer was not detected in the ERT profile (Figure 3a). The boreholes at Cuhare, Naholoco C, and Murothone (Table 2) have a fairly well developed aquifer thickness but with low K values (Figure 8) which could be caused by high clay content in layer 2. The aquifer thickness observed in Nampawa and Namiraca (Figure 8) presented low K values. The possible additional sediments deposited on top of the weathered layer 2 have increased the observed thickness. The additional sediments are paleo coastal dunes. These paleo coastal dunes are characterized by high clay content, acidification and redding in old sediments caused by pedogenic weathering (oxidation).

5. Discussion

The logging in plastic cased boreholes were expected to give good results because none of the measured geophysical parameters are affected by plastic material. However, the presence of metal centralizers caused peaks that influenced the measurement of both resistivity and magnetic susceptibility. In three cases (Cuhare B, Naholoco Communidade, and Naholoco EP1-2) it is not obvious how the anomalies (caused by the metallic centralizers) affect the resistivity. However, when compared with the extracted ERT inverted model, the trend between the anomalous zones is the same. On the other hand, for the Nampawa borehole, with nonmetallic centralizers, the resistivity variation indicates that the drilling stopped in a fractured layer with a resistivity of 400 Ωm. This is in line with the interpretation made from the ERT inverted result and resistivity value of soil ‘d’ (Table 1). However, this confirmation contradicts the lithology presented in the report (as seen in Figure 5). The described lithology at the end of the drilled borehole was considered as gneiss instead of fractured gneiss, but it should be kept in mind that the description was based on cuts for which it is difficult or impossible to detect fractures.
The measured natural gamma in borehole Matibane is in range of 50–200 cps for the bottom layer and 100–200 cps for the upper layer. This range of natural gamma is common in gneiss rocks [26]. The inverted ERT model of Matibane borehole shows a high resistive layer interpreted as fresh gneiss (Figure 2b). The observed peak between these two layers can be interpreted as a wellbore damage zone or as lithological variation that could be associated with clay-infilled fractures. The resistivity log does not clearly indicate any fracture zone, but this may be because the resolution is insufficient and it might have been detected if the uncased borehole was logged with a focused resistivity probe. It would have been possible to correlate the natural gamma signatures with lithology if more detailed documentation of the boreholes existed, especially if the drilled borehole would have been cored. A rock sample that gave a natural gamma value of 600 cps investigated by Gundersen and Wanty [27] gave indication of vertical fractures filled by clay. Maybe a lithological classification based on interpretation of natural gamma could provide useful information, however, due to lack of borehole details, it is not possible to add more conclusions from the results.
The obtained K value for each borehole is a result from a narrow radius of influence. The radius of influence was not discussed in this study however, it is known that the value of hydraulic conductivity is highly influenced by heterogeneity of the local geology, mix of different grain sizes and most likely also fracture zones, as represented in the typical weathering profile [19]. Obtained K value are representing the most permeable zones.
The log normalized displacement plot displayed a concave upward curvature in sites where the double straight line was used in the Bouwer [26] The concave upward curvature is generally displayed if the flow is primarily horizontal [21]. The slope of the log normalized displacement is interpreted as the hydraulic conductivity using the Bouwer and Rice [23] method were the high negative slope represents a high K value. The curved log normalized displacements in Figure 7 probably represent a decrease of hydraulic conductivity over time. According to [22] the decrease of K over the time may be interpreted as a representation of the vertically heterogeneous typical weathering profile. The tail of slow response found at some wells when the normalized displacement were plotted using Bouwer and Rice [23] may be a response from clay content of the weathered zone.
Low values of specific capacity are found together with low values of K and the high values of specific capacity are also in line with high K values. The low values were found in Matibane and Namiraca boreholes and the higher values were found Camaculo borehole. Naholoco EP12 and Muriaze boreholes also have high value of specific capacity value but intermediate value of K.
The high values observed at Camaculo borehole can be explained by well-developed weathered and fractured layers (Table 2). For the Matibane borehole (low specific capacity and K values) the interpreted weathered layer is not well developed and the fractured layer is only 4 m thick (Table 2). Although Matibane and Namiraca wells were classified as successful boreholes, they have low yield and ERT shows how the weathered layer is not well developed (Table 2).
Domenico and Schwartz [28] presented K value for fractured igneous and metamorphic rocks between 6.9 × 10⁻⁴ and 25.9 m/day which are in line with the estimated K values in this study. For the same basement aquifer type in Zimbabwe, the transmissivity varies from 1.3 to 25.7 m2/day and the specific capacity varies from 4 to 33.9 m2/day [29].

6. Conclusions

Previous ERT results from Rapale and Mongicual districts of Nampula province were confirmed by the geophysical borehole logging. ERT measurements in this hydrogeological environment are well suited for locating geophysical strata that are favorable spots to place boreholes. The semi-weathered (layer 2) and fractured (layer 3) zones are the potential layers for extracting groundwater. The ERT and borehole logging methods detected fairly well these two layers because of the contrast with the resistivity of the basement. However, a fractured zone that was not detected by ERT method was inferred in natural gamma logging of the Matibane borehole, however such fractures are too small to be resolved by the ERT method. In such situations, the natural gamma radiation can be a useful method. On the other hand, the magnetic susceptibility did not add any useful information and is therefore not recommended for future loggings.
Proper borehole logging should be performed before installing the casing to avoid disturbances from the well installations. The results of borehole logging would help place the well screens correctly in order to get a more highly productive well.
The hydraulic conductivities obtained from the slug test wells are estimated to be between 0.2 and 9.7 m/day, depending on the evaluation method. The used evaluation methods were developed for porous aquifers, but it is found that the methods can be applied for weathered and fractured rocks as well. The relationship between values of ERT inverted models and the slug testing cannot be absolute. In this study, it was inferred that when the weathered layer and fractured layer are well developed based on interpretation of inverted ERT models, the hydraulic conductivity is high. This is not applicable when the weathering profile is covered by other sediments as in the case of the Nampawa and Namiraca boreholes.
Nevertheless, it has been shown that the ERT can be useful to indicate the geometry of the hydraulic conductivity variation in the aquifer. With the geometry information, one can easily pinpoint potential sites to drill a successful borehole which would decrease the failure rate.

Acknowledgments

We would like to thank Cowater International Inc. and Solomon Lda for technical and logistical help for supporting this survey in the Nampula province. We also would like to thank the provincial directorate of water and Eduardo Mondlane staff for all kinds of support during the survey. Furthermore, we thank Elin Olsson, Sofia Hallerbäck, Björn Andersson, Tom Björklund, Oskar Enkel and Erik Sjöstrand for the excellent work done during their thesis projects. We gratefully acknowledge that Sida funded the study as part of the bilateral cooperation framework between Eduardo Mondlane University (Mozambique) and Lund University (Sweden). Sida also funded the MFS (Minor Field Study) grants for the Swedish students. Furthermore, J. Gustaf Richert stiftelse funded part of the borehole logging equipment used.

Author Contributions

Torleif Dahlin, Farisse Chirindja and Jan-Erik Rosberg conceived and designed this study. Farisse Chirindja conducted part of the field-work; analyzed the data and prepared the initial manuscript. Torleif Dahlin and Jan-Erik Rosberg supervised the field-work, the data analysis and the manuscript preparation. All three authors finalized the research article together.

Conflicts of Interest

The authors declare no conflict of interest.

References

  1. MacDonald, A.; Calow, R. Developing groundwater for secure rural water supplies in Africa. Desalination 2009, 248, 546–556. [Google Scholar] [CrossRef]
  2. Wright, E.P.; Burgess, W. The hydrogeology of crystalline basement aquifers in Africa. Geol. Soc. Spec. Publ. 1992, 66, 1–27. [Google Scholar] [CrossRef]
  3. Salomon. Design Report No. 1 for 150 Water Points—Cabo Delgado and Nampula Rural Water Point Installation Program Mozambique; Cowater International Inc. and Salomon Lda: Maputo, Mozambique, 2010; p. 181. [Google Scholar]
  4. Chirindja, F.; Dahlin, T.; Juizo, D. Improving groundwater well sitting approach in consolidated rock in Nampula province, Mozambique. Hydrogeology 2016, in press. [Google Scholar]
  5. Chirindja, F.; Dahlin, T.; Juizo, D.; Stainbrunch, F. Reconstructing the formation of a coastal aquifer in Nampula province, Mozambique from ERT and IP methods for water prospection. Environ. Earth Sci. J. 2017, 76. [Google Scholar] [CrossRef]
  6. Darling, T. Well Logging and Formation Evaluation; Elsevier: Burlington, MA, USA, 2005; p. 335. [Google Scholar]
  7. McElwee, C. Improving the analysis of slug tests. J. Hydrol. 2002, 269, 122–133. [Google Scholar] [CrossRef]
  8. George, R.J. Hydraulic properties of groundwater systems in the saprolite and sediments of the wheatbelt, Western Australia. J. Hydrol. 1992, 130, 251–278. [Google Scholar] [CrossRef]
  9. Vermeulen, P.; van Tonder, G. Slug Tests in Fractured Rock Formations: Value, Pitfalls and Misinterpretations. In Water Resources of Arid Areas, Proceedings of the International Conference on Water Resources of Arid and Semi-Arid Regions of Africa, Gaborone, Botswana, 3–6 August 2004; Taylor & Francis: London, UK; p. 21.
  10. Geologia, D.N.D. Base de Dados do Mapa Geológica de Mocambique Escala 1:1000,000 (Data Base of Mozambique Geological Map); National Directorate of Mines: Maputo, Mozambique, 1989; p. 350.
  11. Geoscience, C.F. Map Explanation: Sheets 1537 Alto Molócuè, 1538 Murrupula, 1539 Nampula, 1540 Mogincual, 1637 Errego, 1638 Gilé and 1639–40 Angoche; Mozambique and Council for Geoscience: Pretoria, South Africa, 2007. [Google Scholar]
  12. Lächelt, R. Geology and Mineral Resources of Mozambique; National Directorate of Mines: Maputo, Mozambique, 2004.
  13. Kumar, D.; Mondal, S.; Nandan, M.; Harini, P.; Sekhar, B.S.; Sen, M.K. Two-dimensional electrical resistivity tomography (ERT) and time-domain-induced polarization (TDIP) study in hard rock for groundwater investigation: A case study at Choutuppal Telangana, India. Arab. J. Geosci. 2016, 9, 1–15. [Google Scholar] [CrossRef]
  14. Ferro, B.; Bouman, D. Explanatory Notes of the Hydrogeological Map of Mozambique, Scale 1:1,000,000. Project of the Hydrogeological Map of Mozambique; National Directorate of Water Affairs: Maputo, Mozambique, 1987.
  15. Dahlin, T.; Zhou, B. Multiple-gradient array measurements for multichannel 2d resistivity imaging. Near Surf. Geophys. 2006, 4, 113–123. [Google Scholar] [CrossRef]
  16. Loke, M.H.; Acworth, I.; Dahlin, T. A comparison of smooth and blocky inversion methods in 2d electrical imaging surveys. Explor. Geophys. 2003, 34, 182–187. [Google Scholar] [CrossRef]
  17. Limited, R.G. Winlogger Software. Available online: http://www.webcitation.org/query?url=http%3A%2F%2Fwww.geologging.com%2Fslimhole-logging%2Fwinlogger-software%2F+&date=2016–12–07 (accessed on 30 September 2016).
  18. Olsson, E. Water Well Investigation in Nampula Province—A Minor Field Study. Master’s Thesis, Lund University, Lund, Sweden, March 2016. [Google Scholar]
  19. Acworth, I. The electrical image method compared with resistivity sounding and electromagnetic profiling for investigation in areas of complex geology: A case study from groundwater investigation in a weathered crystalline rock environment. Explor. Geophys. 2001, 32, 119–128. [Google Scholar] [CrossRef]
  20. Todd, D.; Mays, L. Grounwater Hydrology; John Wiley & Sons: San Francisco, CA, USA, 2005. [Google Scholar]
  21. Butler, J.J., Jr. The Design, Performance, and Analysis of Slug Tests; CRC Press: Boca Raton, FL, USA, 1997. [Google Scholar]
  22. Hallerbäck, S. Water Well Investigation in Nampula Province—Slug Tests in Weathered Crystalline Rock—A Minor Field Study. Bachelor’s Thesis, Lund University, Lund, Sweden, March 2016. [Google Scholar]
  23. Bouwer, H.; Rice, R. A slug test for determining hydraulic conductivity of unconfined aquifers with completely or partially penetrating wells. Water Resour. Res. 1976, 12, 423–428. [Google Scholar] [CrossRef]
  24. Cooper, H.H.; Bredehoeft, J.D.; Papadopulos, I.S. Response of a finite-diameter well to an instantaneous charge of water. Water Resour. Res. 1967, 3, 263–269. [Google Scholar] [CrossRef]
  25. Barker, J.A.; Black, J.H. Slug tests in fissured aquifers. Water Resour. Res. 1983, 19, 1558–1564. [Google Scholar] [CrossRef]
  26. Shedlock, S. Borehole Geophysical Logging in Masvingo Province, Zimbabwe; British Geological Survey: Nottingham, UK, 1987; 44p. [Google Scholar]
  27. Gundersen, L.C.; Wanty, R.B. Field Studies of Radon in Rocks, Soils, and Water; Geological Survey: Alexandria, VA, USA, 1991.
  28. Domenico, P.A.; Schwartz, F.W. Physical and Chemical Hydrogeology; Wiley: New York, NY, USA, 1998; Volume 506. [Google Scholar]
  29. Sharp, J.M. Fractured Rock Hydrogeology; Taylor & Francis: London, UK, 2014. [Google Scholar]
Figure 1. Regional geology and location of the study sites: Rapale district and Mongicual district (adapted from Geologia [10]).
Water 09 00095 g001
Figure 2. Conceptual geological model of the study area in W-E direction.
Water 09 00095 g002
Figure 3. Three ERT profiles of 400 m showing three geophysical layers. (a) The NNW-SSE Camaculo profile with 45 m deep borehole located in the middle of the profile; (b) The W-E Matibane with 47 m deep borehole located in the middle of the profile; (c) the W-E Nampawa profile with a 33 m deep borehole located at 260 m in the profile [5].
Water 09 00095 g003
Figure 4. Borehole logging at Matibane community with result of resistivity, magnetic susceptibility natural, gamma and lithology. Blue horizontal line—water level and orange vertical line—well-screen placement (logging data from [18]).
Water 09 00095 g004
Figure 5. Resistivity (long and short spaced), ERT extracted resistivity, magnetic susceptibility (long and short spaced), natural gamma and lithology of the Nampawa borehole. cps stands for counts per second. Blue horizontal line—water level and orange vertical line—well-screen placement (logging data from [18]).
Water 09 00095 g005
Figure 6. Data fit of test 1 to Bouwer and Rice (a) and Cooper et al. (b) solutions in the Cuhare B borehole [22].
Water 09 00095 g006
Figure 7. Normalized head of the displacements for the last slug test at all test sites for the first 500 seconds (adapted from [22]).
Water 09 00095 g007
Figure 8. Results of hydraulic conductivity [22] from the Bouwer and Rice [23] and Cooper at al. [24] solutions and the thickness of the aquifer at each borehole.
Water 09 00095 g008
Table 1. Ranges of resistivity values for the layers of a weathered crystalline rock basement [19].
SoilDescription of Typical LithologyResistivity (Ωm)
Soil ‘A’Generally less than 0.5 m thick. Generally red sandy soil, high porosity, well drained and leached. Laterite seldom present in areas of active erosion160–200 (wet) 2000–4000 (dry)
Soil ‘a’Few meters thick sand and clay or clay sand, often concretionary100–200
Soil ‘b’Massive accumulation of secondary minerals (clay) in which some stable primary minerals remain. Low permeability and high porosity. Usually damp but yields little water.10–90
Soil ‘c’1 to 30 m thick. Rock which is progressively altered upward to a granular friable layer of disintegrated crystal aggregates and rock fragments. Intermediate porosity and permeability. This zone frequently contains sub-artesian water, confined by upper clay rich material.60–300
Soil ‘d’1 to 20 m thick. Fractured and fissured rock. Low porosity but moderate to high permeability in fissures.300–600
Fresh rockUnweathered migmatite and granite2000–6000
Table 2. Thickness of different ERT layers, drilled depth and specific capacity of the surveyed boreholes [4,5].
BoreholeLayer 1 (m)Layer 2 (m)Layer 3 (m)Basement (m)Depth (m)Specific Capacity (m2/day) [22]
Cuhare B51554342.67
Incomate720110382.27
Matibane129026470.60
Muriaze101890372.21
Murothone010028381.05
Naholoco C52580381.14
Naholoco EP1252018453.33
Camaculo525150453.57
Namiraca310228430.83
Nampawa015180331.71

