Article

Effect of Climate Change on Hydrology, Sediment and Nutrient Losses in Two Lowland Catchments in Poland

1
Department of Hydraulic Engineering, Warsaw University of Life Sciences, Warsaw 02-774, Poland
2
Potsdam Institute for Climate Impact Research, Potsdam 14473, Germany
3
Norwegian Meteorological Institute, Oslo 0313, Norway
4
Departments of Ecosystem Science and Management and Biological and Agricultural Engineering, Texas A&M University, College Station, TX 77843, USA
*
Author to whom correspondence should be addressed.
Water 2017, 9(3), 156; https://doi.org/10.3390/w9030156
Submission received: 30 December 2016 / Accepted: 21 February 2017 / Published: 23 February 2017

Abstract

:
Future climate change is projected to have significant impact on water resources availability and quality in many parts of the world. The objective of this paper is to assess the effect of projected climate change on water quantity and quality in two lowland catchments (the Upper Narew and the Barycz) in Poland in two future periods (near future: 2021–2050, and far future: 2071–2100). The hydrological model SWAT was driven by climate forcing data from an ensemble of nine bias-corrected General Circulation Models—Regional Climate Models (GCM-RCM) runs based on the Coordinated Downscaling Experiment—European Domain (EURO-CORDEX). Hydrological response to climate warming and wetter conditions (particularly in winter and spring) in both catchments includes: lower snowmelt, increased percolation and baseflow and higher runoff. Seasonal differences in the response between catchments can be explained by their properties (e.g., different thermal conditions and soil permeability). Projections suggest only moderate increases in sediment loss, occurring mainly in summer and winter. A sharper increase is projected in both catchments for TN losses, especially in the Barycz catchment characterized by a more intensive agriculture. The signal of change in annual TP losses is blurred by climate model uncertainty in the Barycz catchment, whereas a weak and uncertain increase is projected in the Upper Narew catchment.

1. Introduction

The threat of climate change is one of the greatest challenges of the modern age and preventing it is a key strategic priority for the European Union. According to Intergovernmental Panel on Climate Change (IPCC) Synthesis Report [1], climate change will cause significant changes in the quality and availability of water resources. However, while it is a robust finding that precipitation is projected to grow in northern Europe and decrease in southern Europe [2], both annually and during the summer, changes in central and eastern Europe are more complex. There is a moderate consensus between large-scale hydrological projections driven by EURO-CORDEX that both floods and droughts might be on the rise in this region [3,4,5].
Although climate change is not explicitly included in the text of the European Water Framework Directive (WFD), the step-wise approach of the river basin management planning process makes it well suited to adaptively manage climate change impacts. Potentially, all elements included in the definition of WFD qualitative and quantitative status of water are sensitive to climate change. However, the present practice shows that climate change problems have not been adequately dealt with in water resources management and policy formulation in Poland and many other European countries. For example, in Poland, recent updates of the river basin management plans lacked consideration of effects of climate change on water quality and did not look beyond the upcoming horizon of 2030. The role of research within the context of international and national policies and actions to adapt to climate change is crucial. It provides the basis for: (i) understanding the causes of climate change; (ii) projecting future changes; (iii) assessing and quantifying the impacts and vulnerabilities at global and regional scale; and (iv) elaborating effective adaptation and mitigation policies and their practical implementation [1]. The great challenge for policy and decision-makers is to understand these climate change impacts and to develop policies while ensuring an optimal level of adaptation. In order to make decisions on how to best adapt, it is crucial to have access to accurate and reliable data on the possible impact of climate change.
Climate scenarios downscaled from GCMsthat use either empirical-statistical or dynamical downscaling, provide the best available information for assessing future impacts of climate change on the water quality of surface water bodies [6]. A common technique for investigating their impact at the catchment scale is to use climate forcing data (precipitation, temperature, and sometimes other variables) obtained from climate models as new input for hydrological models [7]. Modeling, with a notable use of fully-distributed physically-based or semi-distributed process-based models of intermediate complexity, is the most feasible approach to establish projections of climate change impacts on freshwater resources [6]. There are a great number of studies, which have been carried out to assess the possible effects of climate change on the water quality parameters using different hydrological models at a range of spatial scales.
Table 1 lists selected studies applying different hydrological models to assess the impact of future climate change projections. The projections are based on various emission scenarios and climate models, on water flow and water quality parameters. Most studies focus on multi-variable analysis (mostly total nitrogen (TN), total phosphorus (TP), total suspended sediment (TSS) and nitrate nitrogen (NO3-N), but single-variable studies can also be found. Nearly all studies have shown that climate change is likely to have a significant impact on contaminants’ loads. Most indicate an overall increase in contaminants loads [8,9,10,11,12,13,14,15,16]. It is obvious that this increase corresponds to water flow augmentation driven by precipitation increase. The opposite results that indicate the contaminants loads are decreasing [17,18,19] are likewise strongly correlated with the flow pattern which is projected to decrease in these particular studies. Mixed nutrients emission response reported by Arheimer et al. [20], Records et al. [21] and Molina-Navaro et al. [22] is an effect of diverse flow changes during the projected periods. Very few studies indicate that future climate change is likely to have a negligible impact on single variables like sediment [11,23], TN [24], and NO3-N [25].
To date, Poland has not been a region with intensive studies investigating climate change effects on water, sediment and nutrient losses. Two exceptions, included in Table 1, are: (1) the study of Piniewski et al. [10] conducted in a small catchment in north Poland, using only one climate scenario, and the “delta change” approach as the method of processing the climate forcing into the hydrological model; and (2) the study of Hesse et al. [26], covering mainly Russia and only a small part of coastal area in north Poland, using 15 scenarios from the ENSEMBLES project [27]. No studies were performed for the dominant type of Polish landscape, i.e., the Polish plain, a diverse region with variable levels of agricultural intensity and other pressures on water resources. In a wider context, none of the studies listed in Table 1 used the newest generation of climate model runs from CORDEX experiment (although two studies [18,21] used statistically downscaled CMIP5 projections). They are available at higher resolution than all predecessors which is an important features for hydrological modeling.
Against this background, the objective of this paper is to assess the effect of projected climate change on water quantity (annual and seasonal water balance components and discharge) and quality (sediment, TN and TP losses). The SWAT model is used in two Polish catchments and it is representative for the majority of the lowland areas of the country. The study looks into projected changes for two future time horizons within 21st century (2021–2050 and 2071–2100) under the Representative Concentration Pathway (RCP) 4.5, using an ensemble of nine EURO-CORDEX model scenarios [2].

2. Materials and Methods
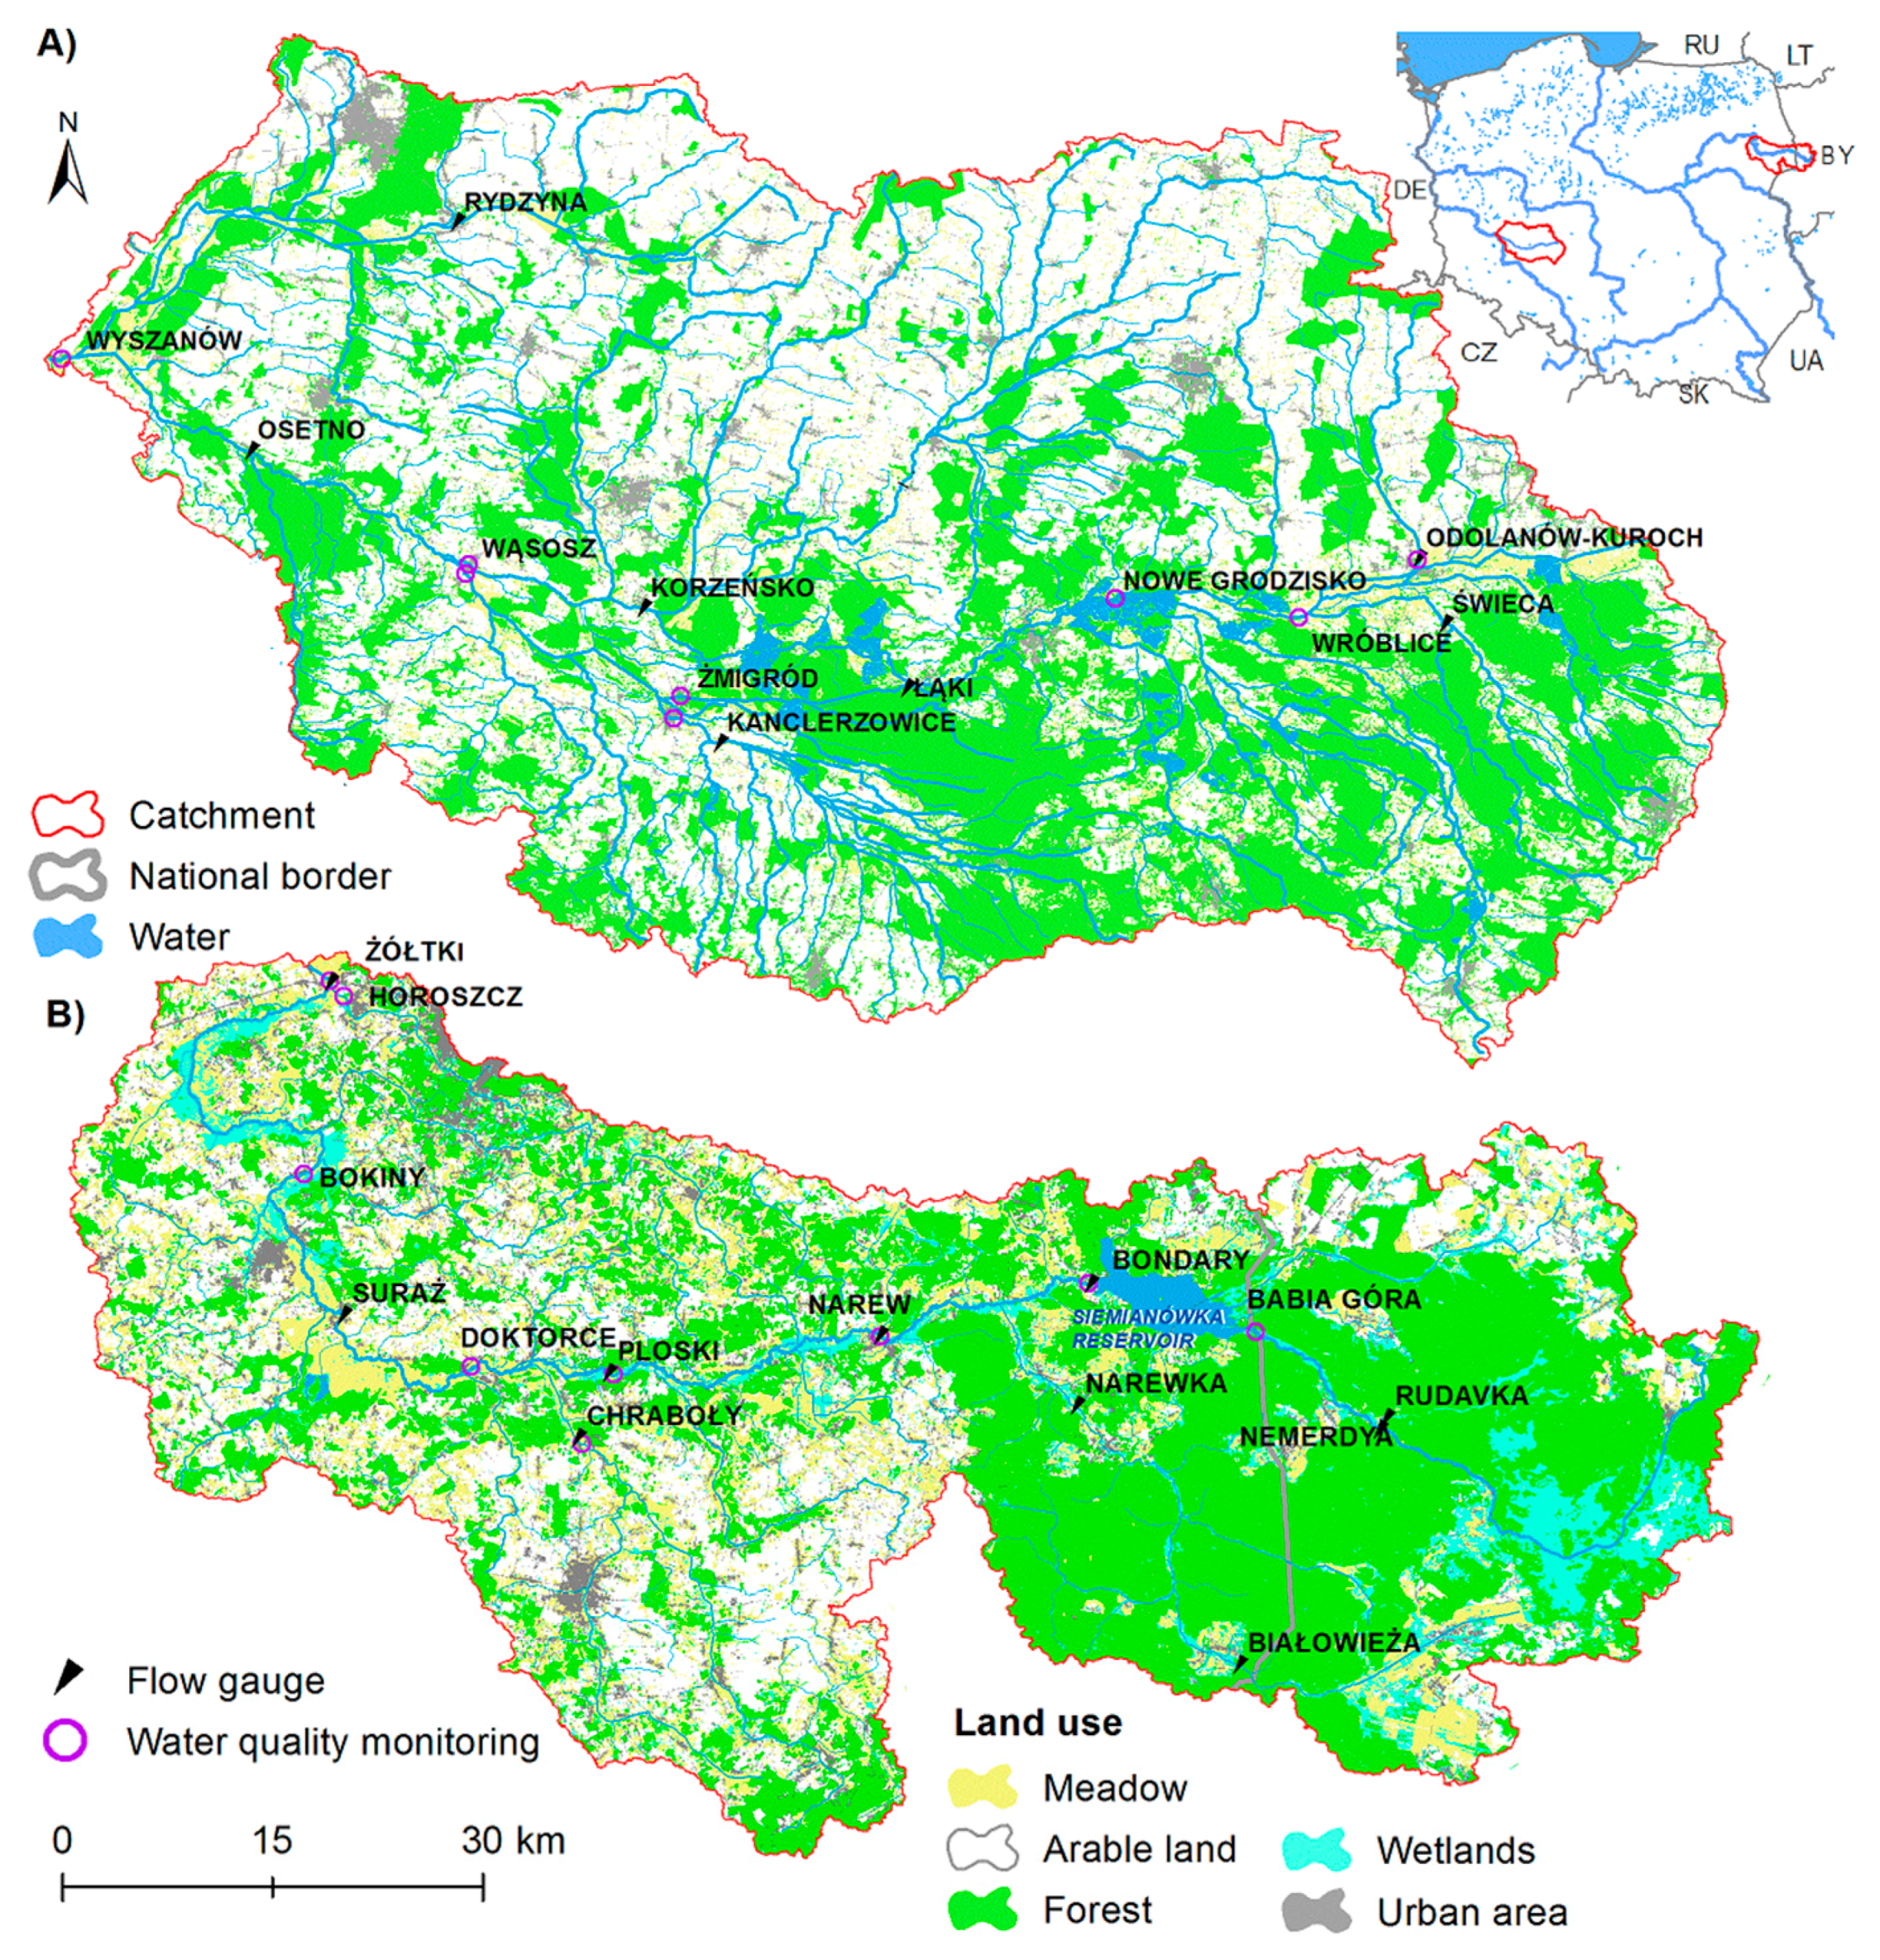
2.1. Study Area

The Upper Narew (NE Poland) and the Barycz (SW Poland) catchments in which the study was conducted are the sub-catchments of two large Polish river basins (the Vistula and the Odra, respectively) (Figure 1). They drain areas of 4231 km2 (Upper Narew, of which 27% belong to Belarus) and 5522 km2 (Barycz). Both belong to the vast Polish Plain. According to the geographical regionalization of Kondracki (1997), the Barycz catchment belongs to the Central European Plain, while the Upper Narew catchment to Easter European Plain. These two regions were formed by glacial erosion in the Pleistocene ice age. Both catchments are within the extent of most Pleistocene glaciations, with two exceptions: the first one, Gunz, that covered only the Upper Narew catchment; and the last one, Würm, whose southern border almost touched both watersheds. Consequently, both catchments are characterized by a flat relief with an average elevation of 152 m a.s.l. in the Upper Narew and 127 m a.s.l. in the Barycz. In both, the prevailing type of soils are sands and loamy sands, whereas heavy, impervious soils are rare. However, the fraction of permeable soils in the Barycz catchment is distinctly higher (62.8% vs. 27.3%, estimates based on the input soil map and classification of Pazdro [28]). Moderate differences in land cover also can be observed. Total area of forests is slightly higher in the Upper Narew than in the Barycz catchment (43.6% vs. 38.9%). Compared to much lower values for the Barycz catchment (0% and 8%), the Upper Narew catchment has a high abundance of wetlands and grasslands (8% and 16%, respectively).
The climate of the Upper Narew catchment is more continental, being often influenced by cold polar air masses from Russia and Scandinavia, whereas the climate of the Barycz catchment is milder, with more frequent influence of maritime air from the West. This is reflected in mean annual air temperature that equals 7.1 and 8.3 °C for the Upper Narew and the Barycz catchments, respectively (climate statistics based on [29]). The difference in mean winter temperature (−3.2 vs. −0.6 °C) is much larger than between mean summer temperature (17 vs. 17.7 °C). Mean annual precipitation total, equal to 670 mm in the Upper Narew catchment, is slightly higher compared to the Barycz catchment (632 mm). However, winter and summer total precipitation have very similar magnitude in both catchments: 127–129 mm, and 234–237 mm, respectively.
The differences in climatic and physiographic characteristics between two catchments clearly affect their hydrology. Annual total runoff coefficient equal to 0.26 in the Upper Narew catchment is much higher than the corresponding value for the Barycz catchment (0.19). However, what is important is the difference in monthly distribution of runoff (Figure 2a). A more continental climate together with less permeable soils and higher water retention capacity (wetlands, grasslands and forests) in the Upper Narew catchment lead to a higher magnitude and later occurrence of spring snow-melt floods. The magnitude of these types of floods, occurring in the Barycz catchment in March, is roughly half of the magnitude of the Narew floods. At the same, time runoff in January and February is higher in the Barycz catchment than in the Upper Narew catchment.
Significant differences, placing the studied catchments on the extreme opposite ends, are noted in terms of the human dimension (Table 2, Figure 3):
  • agriculture: its intensity, reflected by the crop structure, fertilizer rates, livestock density and the level of drainage;
  • population density and its derivatives, e.g., the amount of pollution from the wastewater treatment plants (WWTPs); and
  • water retention (reservoirs and ponds).
In general, waters of the Barycz catchment are subject to more intensified human pressures due to greater numbers of point sources and more intensive agriculture. In this context, the Upper Narew catchment is representative for less economically developed eastern Poland, while the Barycz catchment is more similar (although less developed) to western European countries. Additionally, it has probably the most intensive level of freshwater aquaculture (carp ponds) in Poland, with 8100 ha of ponds of the total capacity estimated as 73.1 million m3. In contrast, the Upper Narew catchment has very little ponds and one relatively large reservoir (Siemianówka, situated in the upstream part) with a total capacity of 79.5 million m3, which is the only important water management facility in this catchment. Mean monthly runoff of the Upper Narew shown in Figure 2 is not influenced by Siemianówka reservoir because the underlying data come from the period prior to construction year (1991). However, the effect of fish ponds on the Barycz runoff can be assessed by comparing the plots between two gauges: Osetno (influenced by the whole pond system), and Korzeńsko (under the negligible influence of ponds). Lower runoff values in January and February for Osetno reflect upstream withdrawals for filling the ponds. Higher values of runoff observed in September and October at Osetno gauge illustrate upstream discharges of pond water into the stream network.
The differences in human pressures between catchments are well reflected in their surface water quality characteristics, as shown in Figure 2b–f. Annual mean concentrations of five analyzed elements, total suspended solids (TSS), nitrate-nitrogen (NO3-N), total nitrogen (TN), mineral phosphorus (PO4-P) and total phosphorus (TP), are distinctly higher for both stations in the Barycz catchment than in station located in the Upper Narew catchment. It is noteworthy that the threshold concentrations of good ecological status are frequently exceeded in the Barycz catchment, while being rarely exceeded in the Narew catchment. With exception of TSS, pollution is much higher in the Orla tributary of the Barycz river, which can be explained by the fact that its catchment has the highest level of agricultural intensity within the Barycz catchment (cf. Figure 3). The monthly dynamic of the nitrogen and phosphorus compounds differs considerably. Both TN and NO3-N have a strong correlation with runoff and achieve the highest values in winter and the lowest in summer, in all three stations. Such a seasonal pattern, related to the physics of nitrogen transport within the catchment, is typical for catchments in Poland [32,33]. This type of seasonal fluctuation is caused mainly by high mobility of nitrates not being assimilated by plants during dormancy season and contributing to streams via lateral and groundwater flow. These two transport pathways are favored, especially in winter and early spring, when evapotranspiration is low whereas infiltration can be high. During the growing season and intensive plant uptake, less mineral nitrogen particles are transported to streams. A different pattern, with highest values in the low flow period (summer and autumn), can be observed for both phosphorus forms, which is also in line with literature on P dynamics in different types of Polish rivers [33,34].

2.2. Modelling Approach

In this study, we build upon the existing, extensively calibrated and validated SWAT models of the Barycz and the Upper Narew catchments [35]. While the full description of model setup, calibration and validation was presented in the latter study, here we provide a brief overview, important in the context of the main goal of the present paper.

2.2.1. Model Setup, Calibration and Validation

SWAT is a process-based, semi-distributed, continuous-time model which simulates the movement of water, sediment, and nutrients on a catchment scale [36]. It is a comprehensive tool suitable for investigating the interaction between climate, land use and water quantity or quality. It enables simulation of long-term impacts of land use and climate changes on water, sediment, and nutrient yields in catchments with varied topography, land use, soils and management conditions [22].
Major data items and their sources used to create the SWAT model setup of the Upper Narew and Barycz catchments are listed in Table 3. Throughout the whole process of developing the model setups, an attempt was made to use the same data sources and approaches for both catchments. Nevertheless, for the upstream part of the Upper Narew (lying in Belarus), data from various global databases, usually characterized by lower resolution had to be used.
Delineation of the catchment based on the 10-m resolution DEM resulted in division of the Upper Narew catchment into 243 sub-basins and 503 of the Barycz catchment. The land cover map was a combination of CORINE Land Cover (CLC) 2006 and post-processed Landsat 8. Intersection of land cover map, soil map, and slope classes resulted in creation of 4509 HRUs in the Upper Narew catchment and 8569 in the Barycz catchment. Daily precipitation and air temperature (minimum and maximum) data (1951–2013) were acquired from 5 km resolution gridded, interpolated using kriging techniques, dataset (CPLFD-GDPT5) based on meteorological observations coming from the Institute of Meteorology and Water Management (IMGW-PIB; Polish stations) [37]. The use of interpolated climate data in the SWAT model was reported to increase the model performance for a case study in Poland [38].
Parameterization of different pollution sources present in the catchment plays a critical role in water quality modeling. The following anthropogenic pollution sources were analyzed:
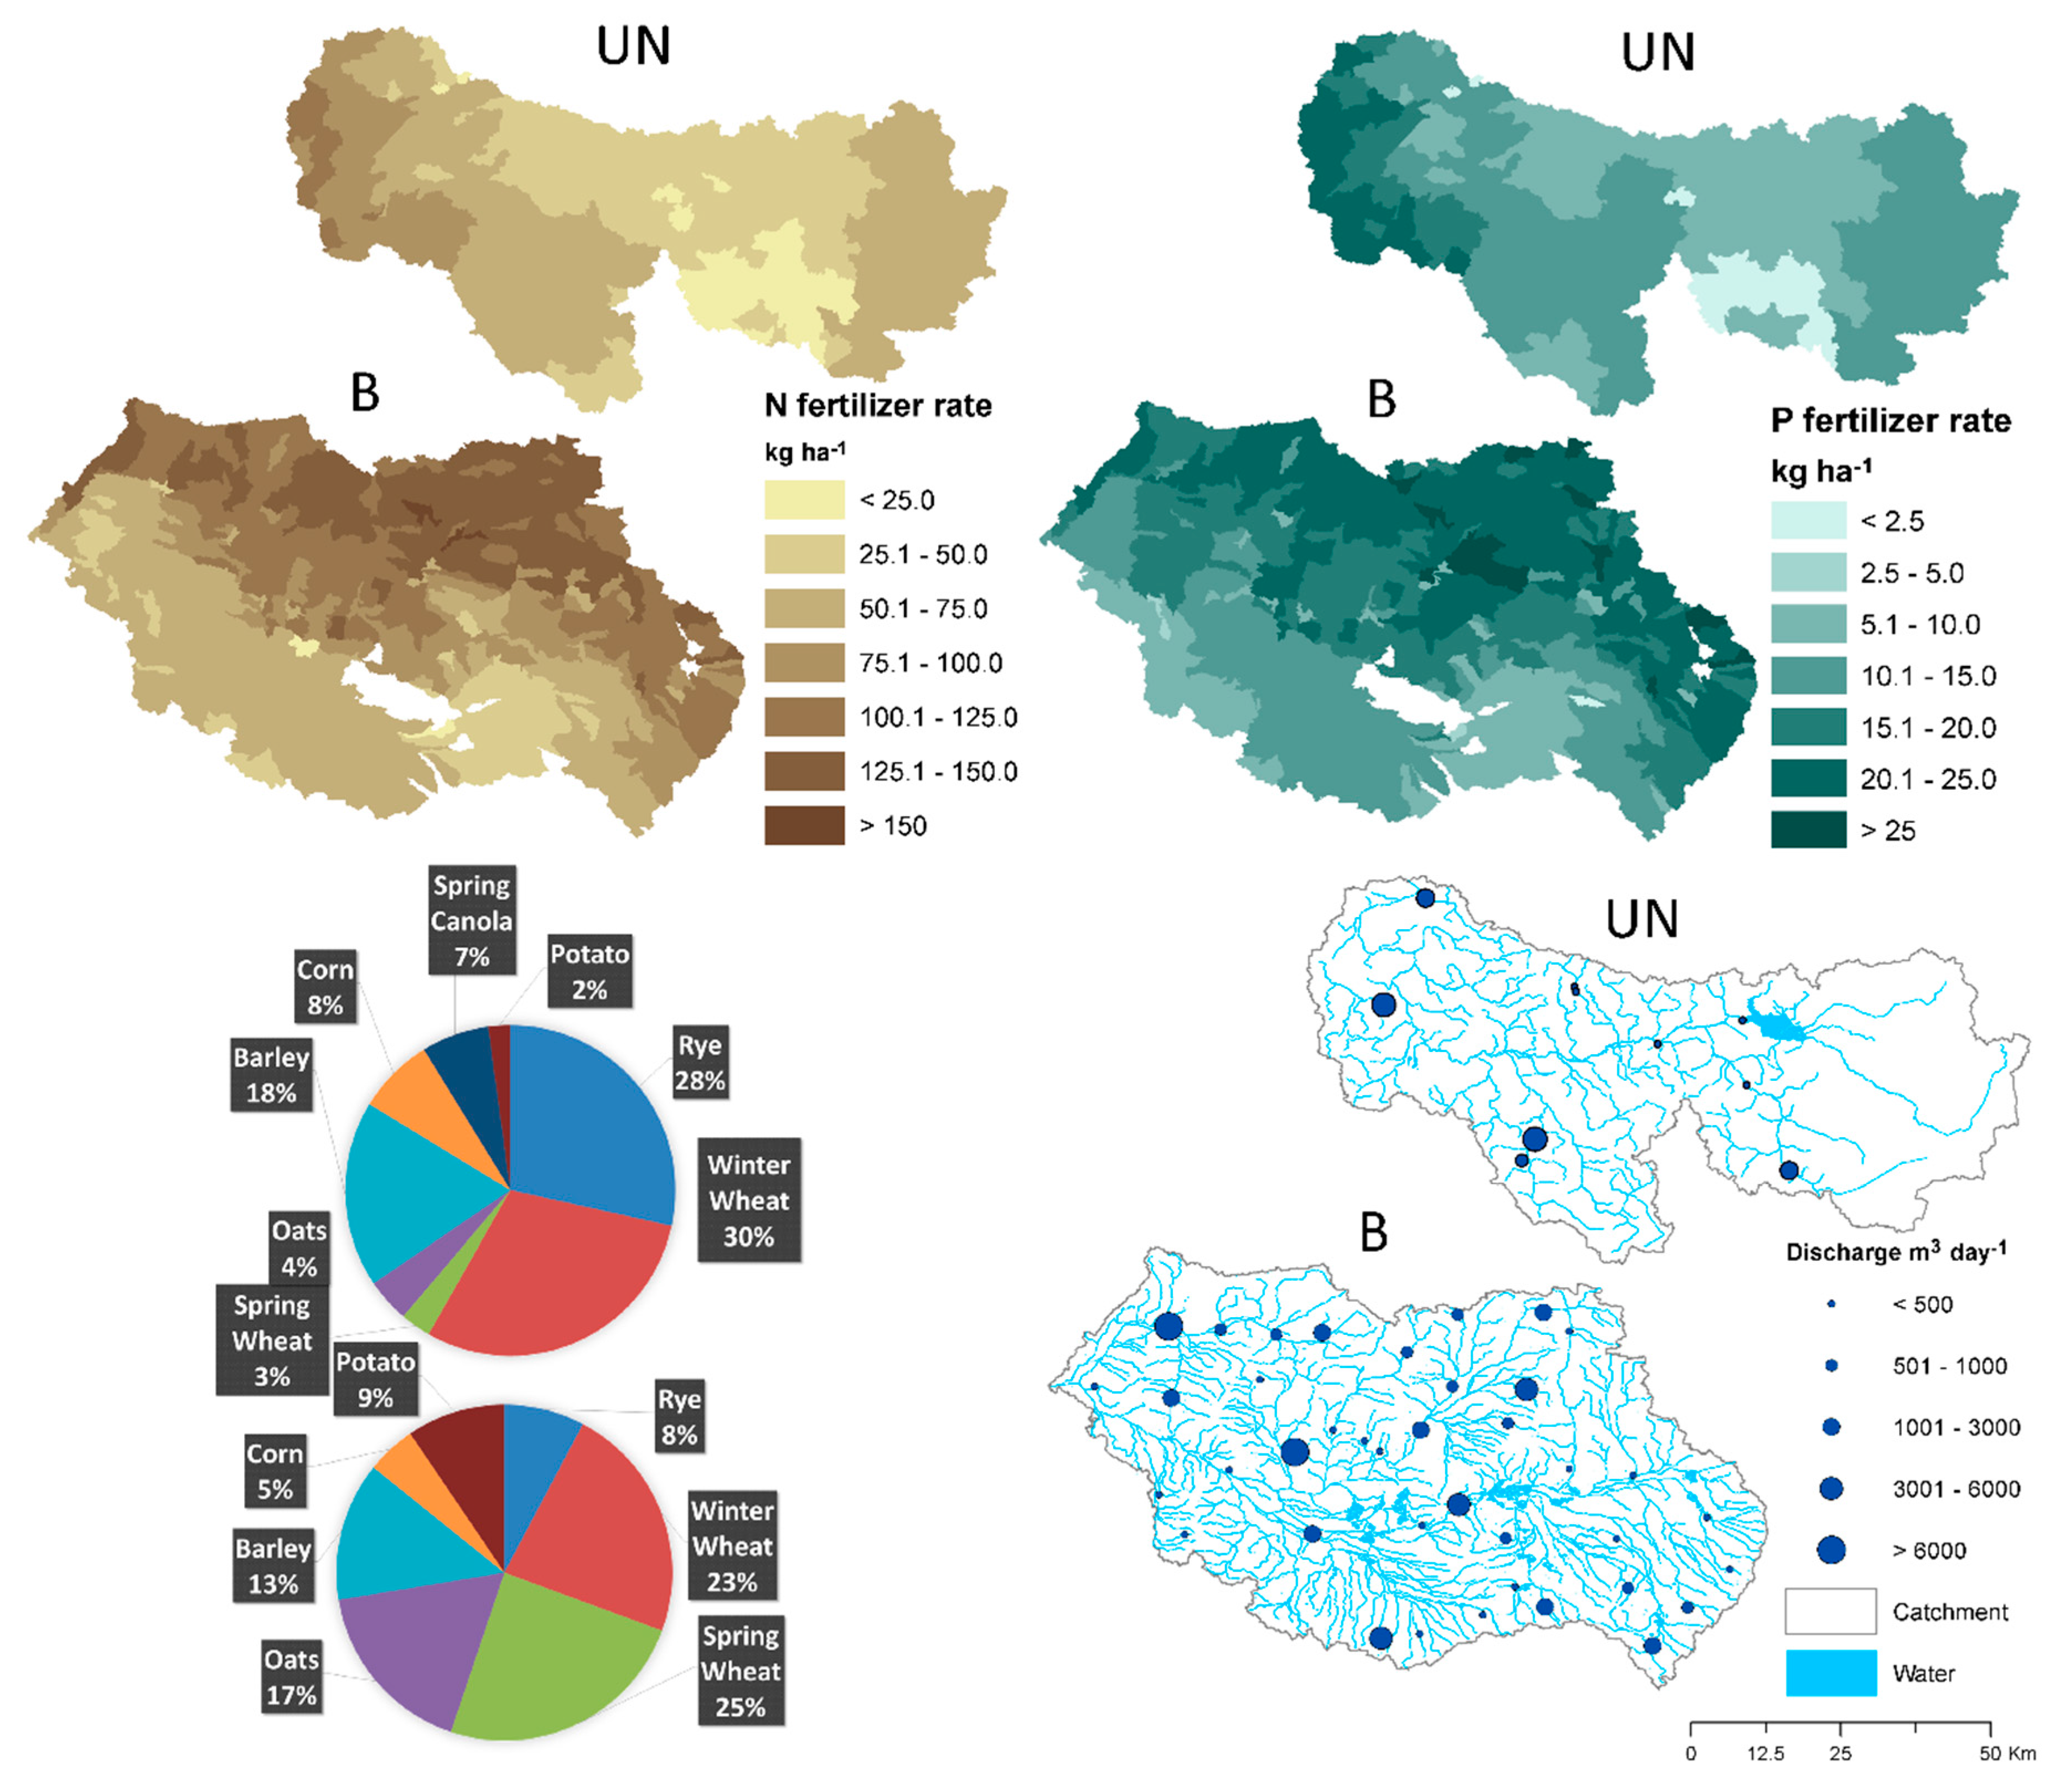
  • Diffuse pollution from agricultural areas: Commune-level statistical data were used to determine mineral fertilizer use and livestock population in order to impose a spatial variability of fertilizer rates in the model setup.
  • WWTPs: Defined in the model setup only when the daily average wastewater discharge exceeded 50 m3·day−1. For each WWTP, discharge and nutrient loads were expressed as constant or mean yearly values depending on the available data, usually originating from plant operators.
  • The septic systems function of SWAT was used to model the effect of pollution loads coming from population not connected to WWTPs (using cesspits or septic tanks, with or without sub-surface drainage).
  • Atmospheric deposition (dry and wet) of nitrogen (nitrate and ammonium): Defined based on one station for the Upper Narew and three stations for the Barycz as a fixed average value for the entire catchments.
Calibration phase was conducted in SWAT-CUP using the SUFI-2 algorithm (Sequential Uncertainty Fitting Procedure Version 2) where the Kling–Gupta efficiency (KGE) was used as an objective function [39]. Additionally, percent bias (PBIAS) that measures the average tendency of the modeled data to be larger or smaller than their observed counterparts, was also tracked. In the calibration and validation, ten flow gauges (data acquired from IMGW-PIB) and nine water quality monitoring stations (concentration data acquired from the General Inspectorate of Environmental Protection) were used in the Upper Narew. Likewise, in the Barycz there were seven flow gauges and eight water quality monitoring stations (Figure 1). Discharge, TSS, NO3-N, TN, PO4-P and TP loads were calibrated and validated in each catchment. For both catchments the calibration period for discharge was 1976–1985, and the validation period was 1986–1991, whereas for water quality variables these periods were set to 1999–2005 and 2006–2010, respectively. The inconsistency in selection of periods for discharge and water quality was because selection was optimized with respect to the abundance of observation data. Due to an objective of capturing spatial patterns of runoff and sediment/nutrient transport, a good spatial representation of gauges was crucial. About one half of flow gauging stations in both catchments were closed in 1990s, which was a reason for selecting an earlier period for discharge. In contrast, water quality monitoring by state agencies became more frequent and more abundant only in late 1990s.
Marcinkowski et al. [35] reported variable values of goodness-of-fit measures across different gauges and variables. For discharge, simulations were assessed as good (median KGE above 0.7 in both catchments). For other variables, spatial, multi-site calibration revealed problems in achieving satisfactory results for the entire set of stations taken into consideration. In consequence, there were both stations with good and satisfactory fit (KGE above 0.5), and stations with unsatisfactory behavior (PBIAS higher than 55% for sediment and higher than 75% for nutrients, cf. Moriasi et al. [40] for evaluation criteria). Among reasons for poor behavior in some stations, Marcinkowski et al. [35] reported: (1) the dominant importance of global over local parameters in calibration; (2) simultaneous calibration of different pools of water quality parameters (with different optimal parameter sets achieved for different pools); and (3) input uncertainty (e.g., differences between defined agricultural management operations and the reality). A previous study applying SWAT in Poland for modeling water quality also showed that [41], frequently, the magnitude of the highest observed loads of nutrients is captured well by the model, but there is a shift in timing by a few days (the flood peak is sometimes advanced or lagged by 1–3 days compared with the timing of the peak identified in the observed data) which has a negative effect on the objective function value.
It should be noted that even though there was a temporal inconsistency between certain input (e.g., land cover) and output (discharge) data of over 20 years, it did not affect the results much. We estimated the magnitude of land cover changes between 1990 and 2012 using CORINE Land Cover maps from the corresponding years. The analysis indicated that the patterns of change in both catchments were similar (agriculture areas converted mainly into artificial surfaces or forests). However, the rates of change were not very high, not exceeding 5% in any of the catchments. Furthermore, additional evaluation of discharge simulation in the more contemporary period (1990–2013) showed that the goodness-of-fit measures remain satisfactory.

2.2.2. Climate Change Scenarios

In this paper, SWAT is driven by climate forcing data from the CHASE-PL Climate Projections: 5-km Gridded Daily Precipitation & Temperature Dataset (CPLCP-GDPT5) [42], consisting of nine bias-corrected GCM-RCM runs (involving four different GCMs and four different RCMs) provided within the EURO-CORDEX experiment projected to the year 2100 under RCP 4.5 [43]. A quantile mapping method (QMAP) developed by the Norwegian Meteorological Institute was applied as a bias correction procedure [44]. All bias-corrected values of parameters of concern were available for the following three time slices: 1971–2000, 2021–2050, and 2071–2100. Three first years of each period were truncated, since a warm-up period of three years is used for SWAT simulations. The corresponding time horizons will be hereafter referred to as “historical period”, “near future” and “far future”, respectively. Future changes in simulated discharge, water balance components and water quality variables were estimated by comparing model outputs for the future periods relative to historical period.
The model runs were carried out assuming constant land use and absence of water management (reservoirs, fish ponds), in order to illustrate pure climate change effect. For the sake of map presentation, projected changes from nine ensemble members were summarized as the ensemble median change, whereas climate model uncertainty was analyzed on the level of areal mean catchment responses.

3. Results

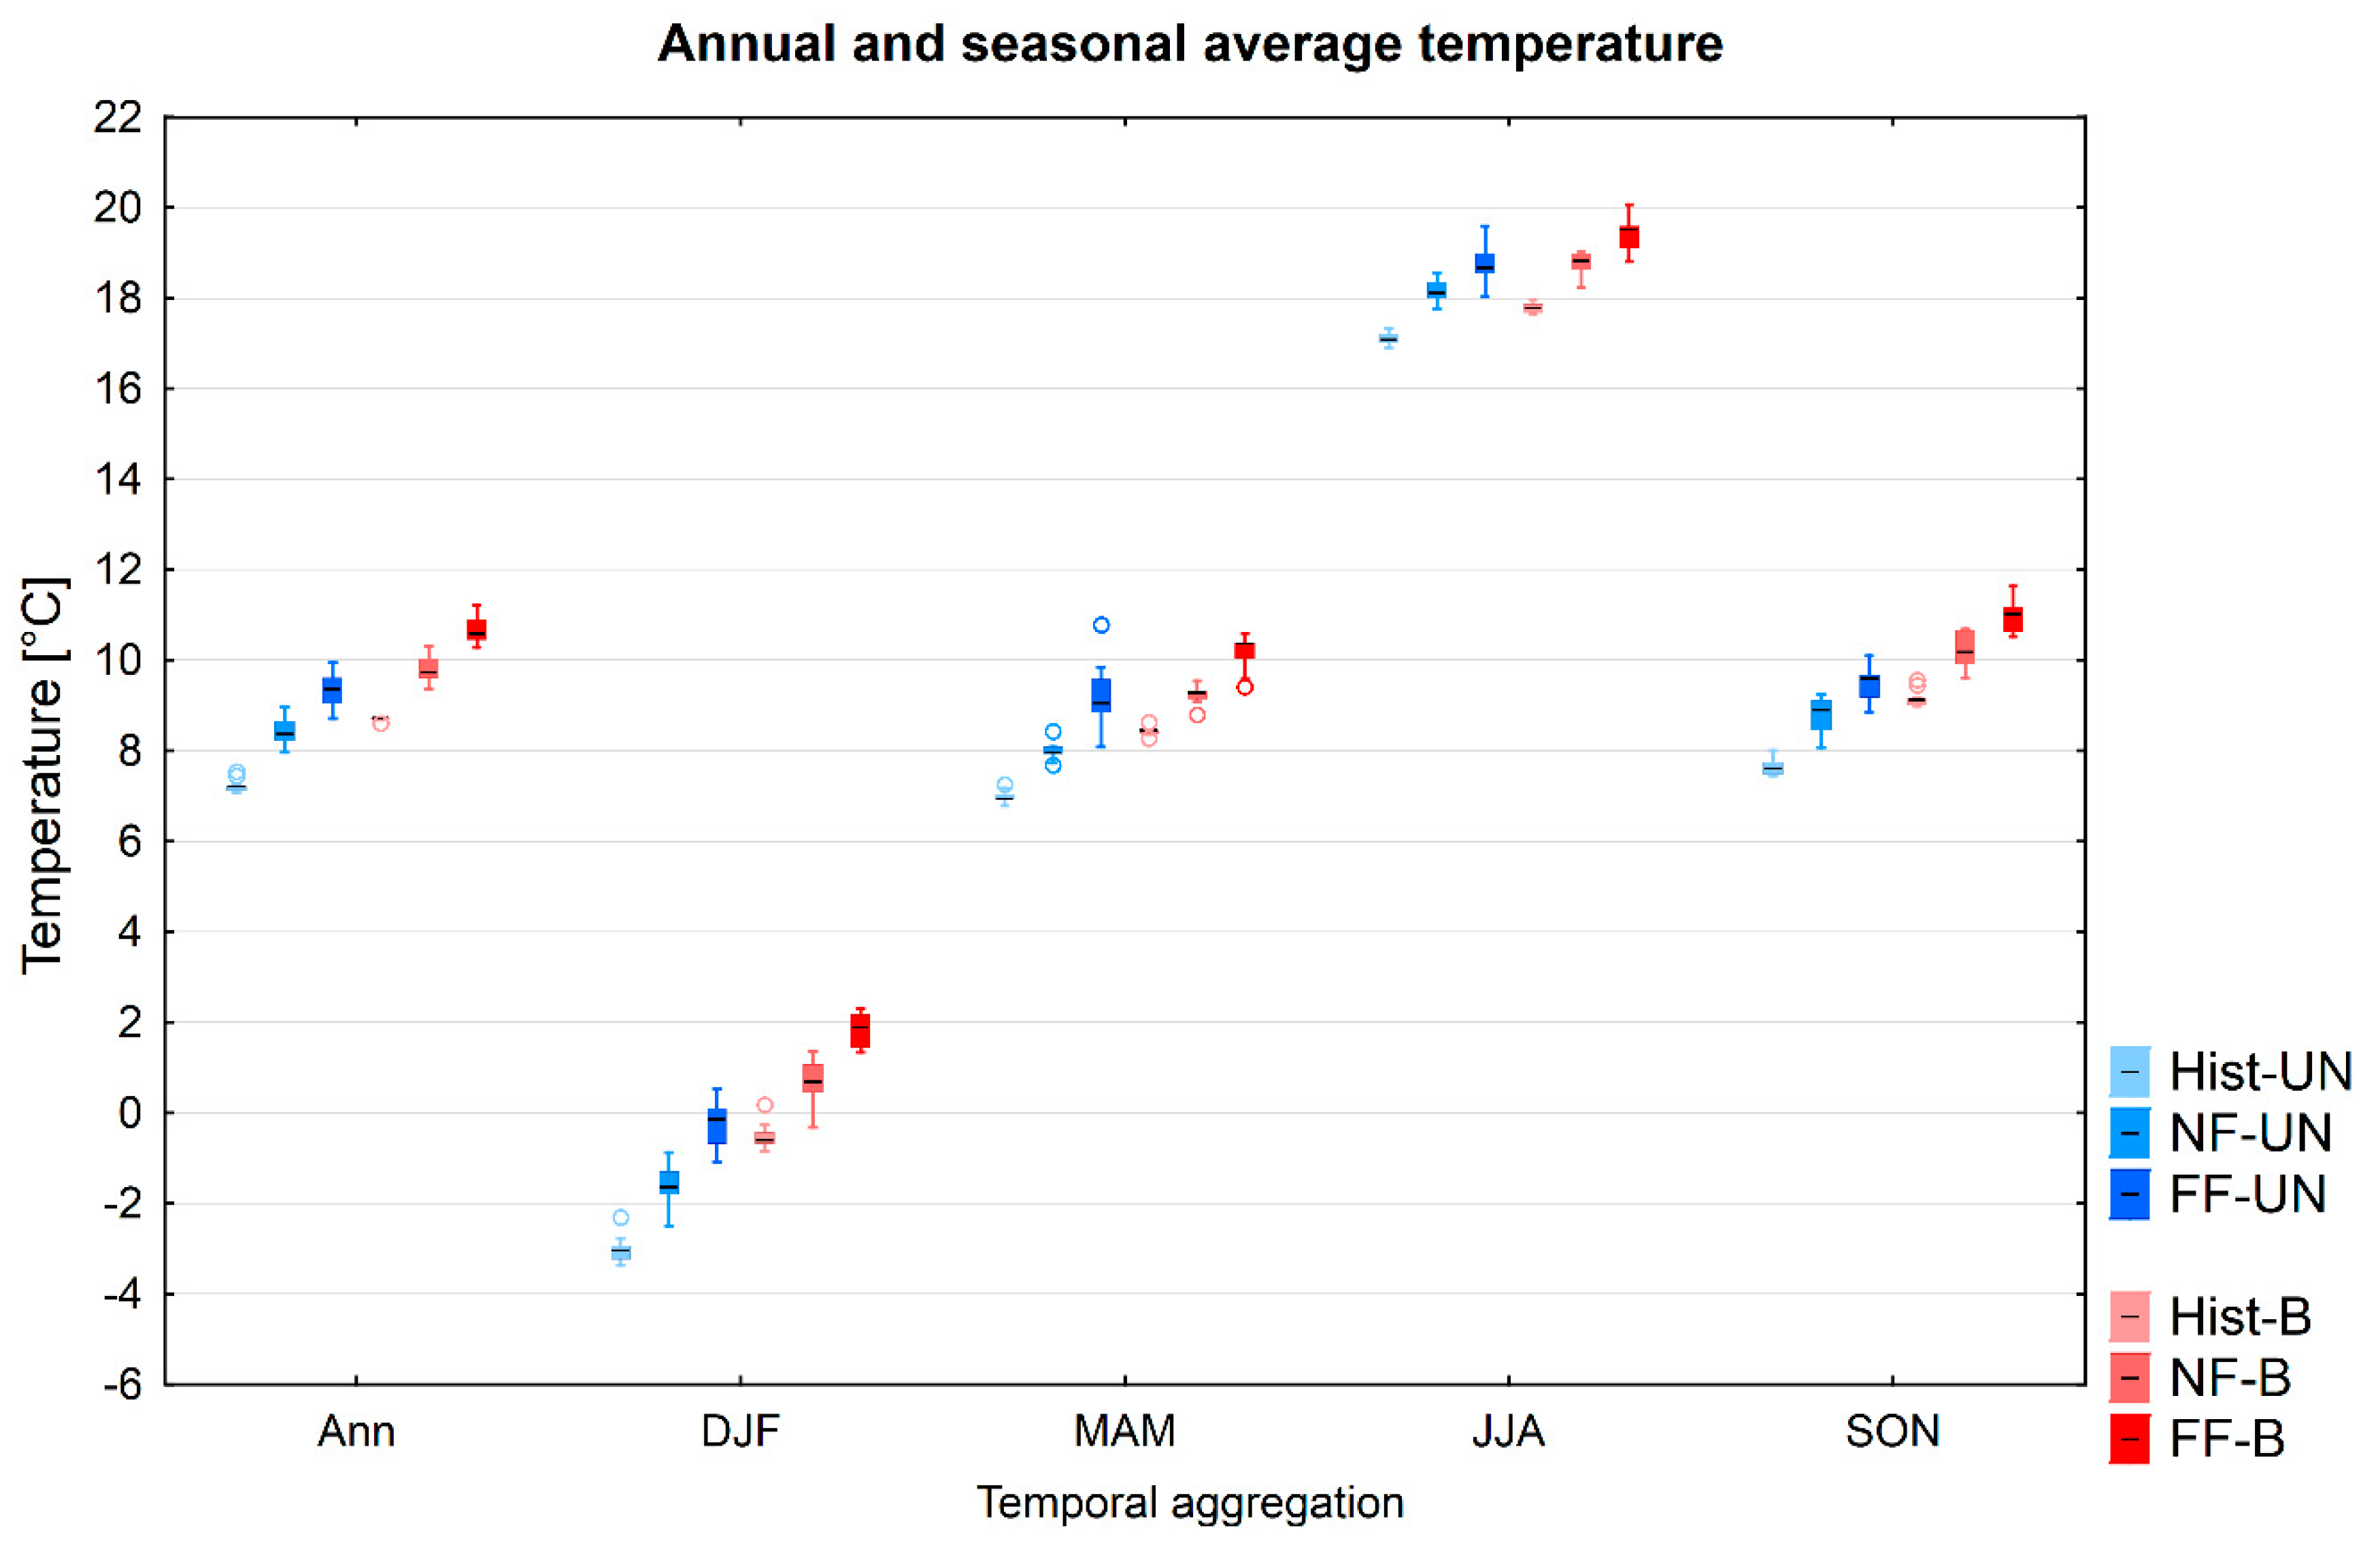
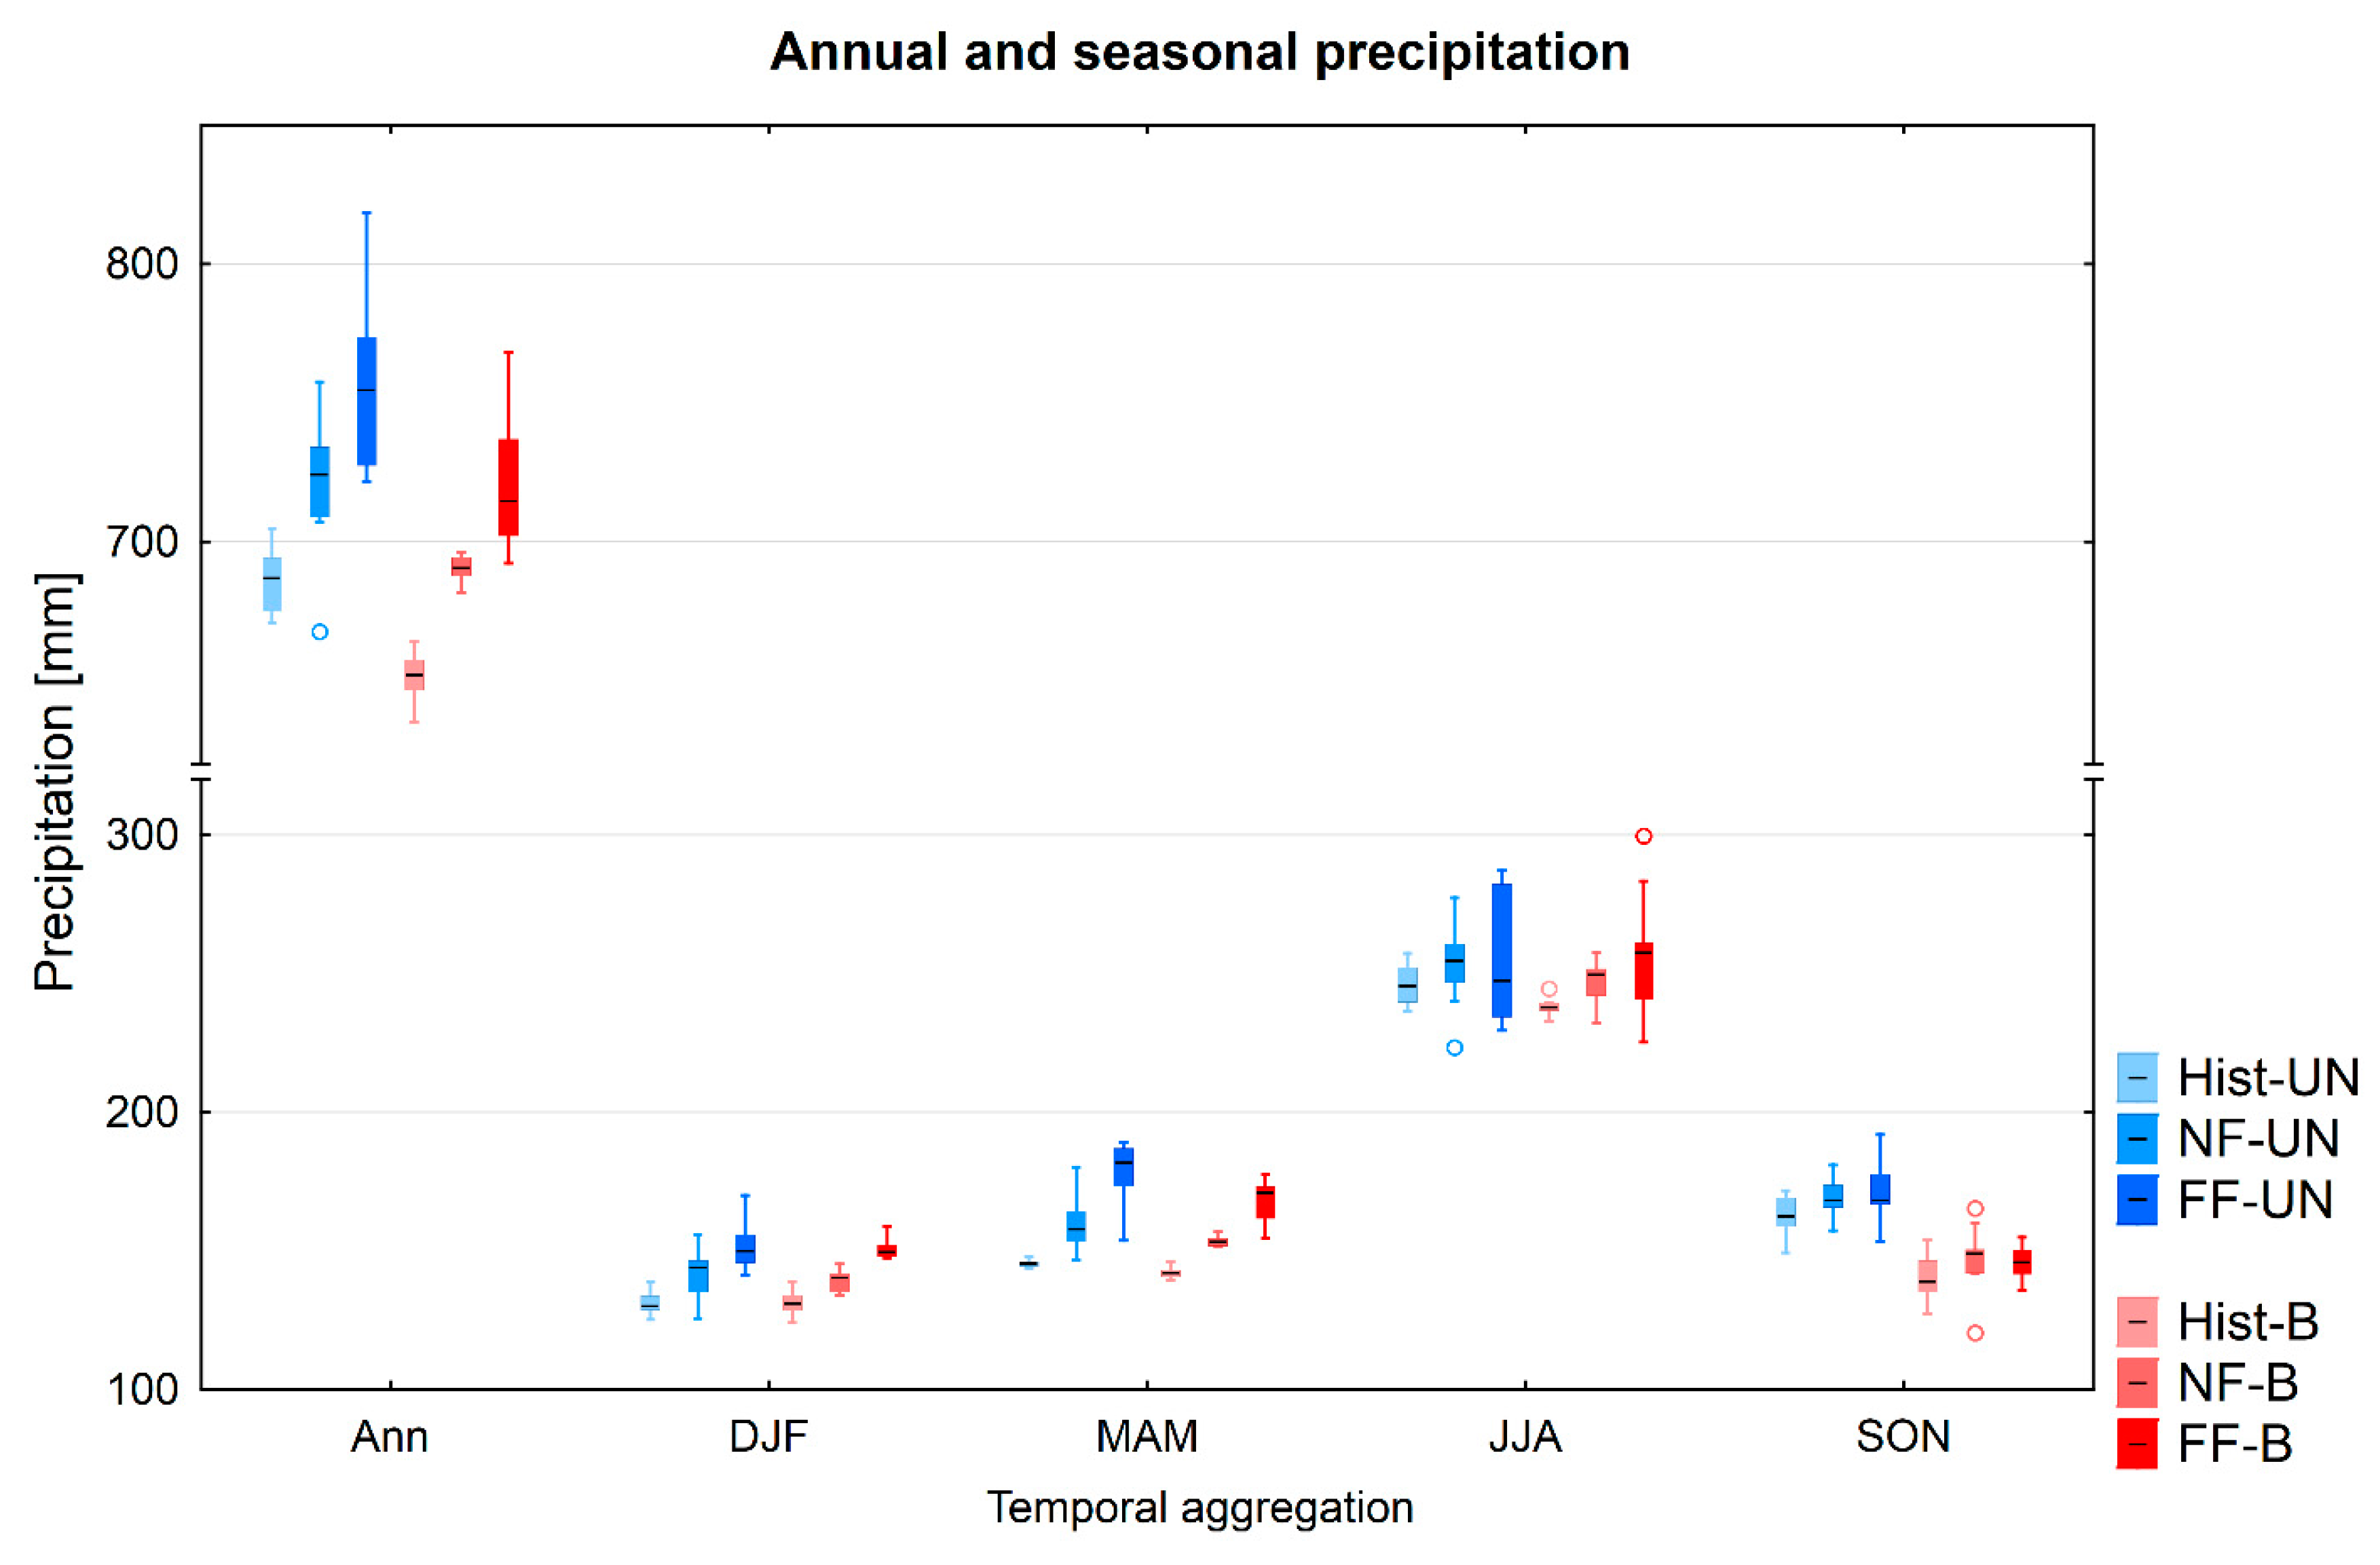
3.1. Climatic Projections

Since within-catchment spatial variability of projected temperature and precipitation change is low in both catchments, the analysis focuses on areal mean changes. The annual and seasonal climate change signal is similar in both catchments (Figure 4). The warming is ubiquitous and accelerating in time for each individual climate model. The mean annual warming rate is slightly higher in the Upper Narew than in the Barycz catchment. Seasonal patterns are similar, with the winter increase higher than the increase projected in remaining seasons. The largest difference between two investigated catchments is projected for the minimum temperature in winter and spring in the far future: it is higher by 0.5 °C in the Upper Narew than in the Barycz catchment. The robustness (sensu [45]) of annual temperature increase is high in both catchments (cf. [43]). Seasonal temperature projections are more robust for the minimum temperature, Tmin, than for the maximum temperature, Tmax. Notably, in the near future, Tmax projections in winter and summer are characterized by a substantial model disagreement in the Barycz catchment.
Annual total precipitation is projected to increase in both catchments by 5.6% in the near future and by 9.1%–9.5% in the far future. Although the spread in projections related to different RCMs is substantial (slightly higher for the Upper Narew catchment), the agreement on the direction of change is ubiquitous (Figure 5). The seasonal patterns are also similar between catchments, with a relatively high increase in winter and spring and a weaker increase or a decrease in summer and autumn. In the far future the spring precipitation increase is distinctly higher than in other seasons, exceeding 20% in both catchments. The largest difference between catchments can be observed for summer precipitation in the far future that is (i.e., the ensemble median) projected to increase by 6.5% in the Barycz catchment and only by 0.1% in the Upper Narew catchment. The uncertainty of summer precipitation is the largest among all seasons in both catchments.
Annual precipitation change projections for the near future are not statistically significant according to most of the climate models in both catchments. The models agree well that the projected change is low. Despite the fact that the distance between catchments is almost 500 km, the precipitation change signal is similar. Seasonal projections of changes are significant for winter and spring, and insignificant for summer and autumn. Lack of robustness (statistically significant changes, but large disagreement about the magnitude) can be observed in the far future for both annual and spring totals. More in-depth characteristics of robustness of precipitation projections performed at a larger scale of the Vistula and Odra basins can be found in Piniewski et al. [43].

3.2. Hydrological Response to Climate Change
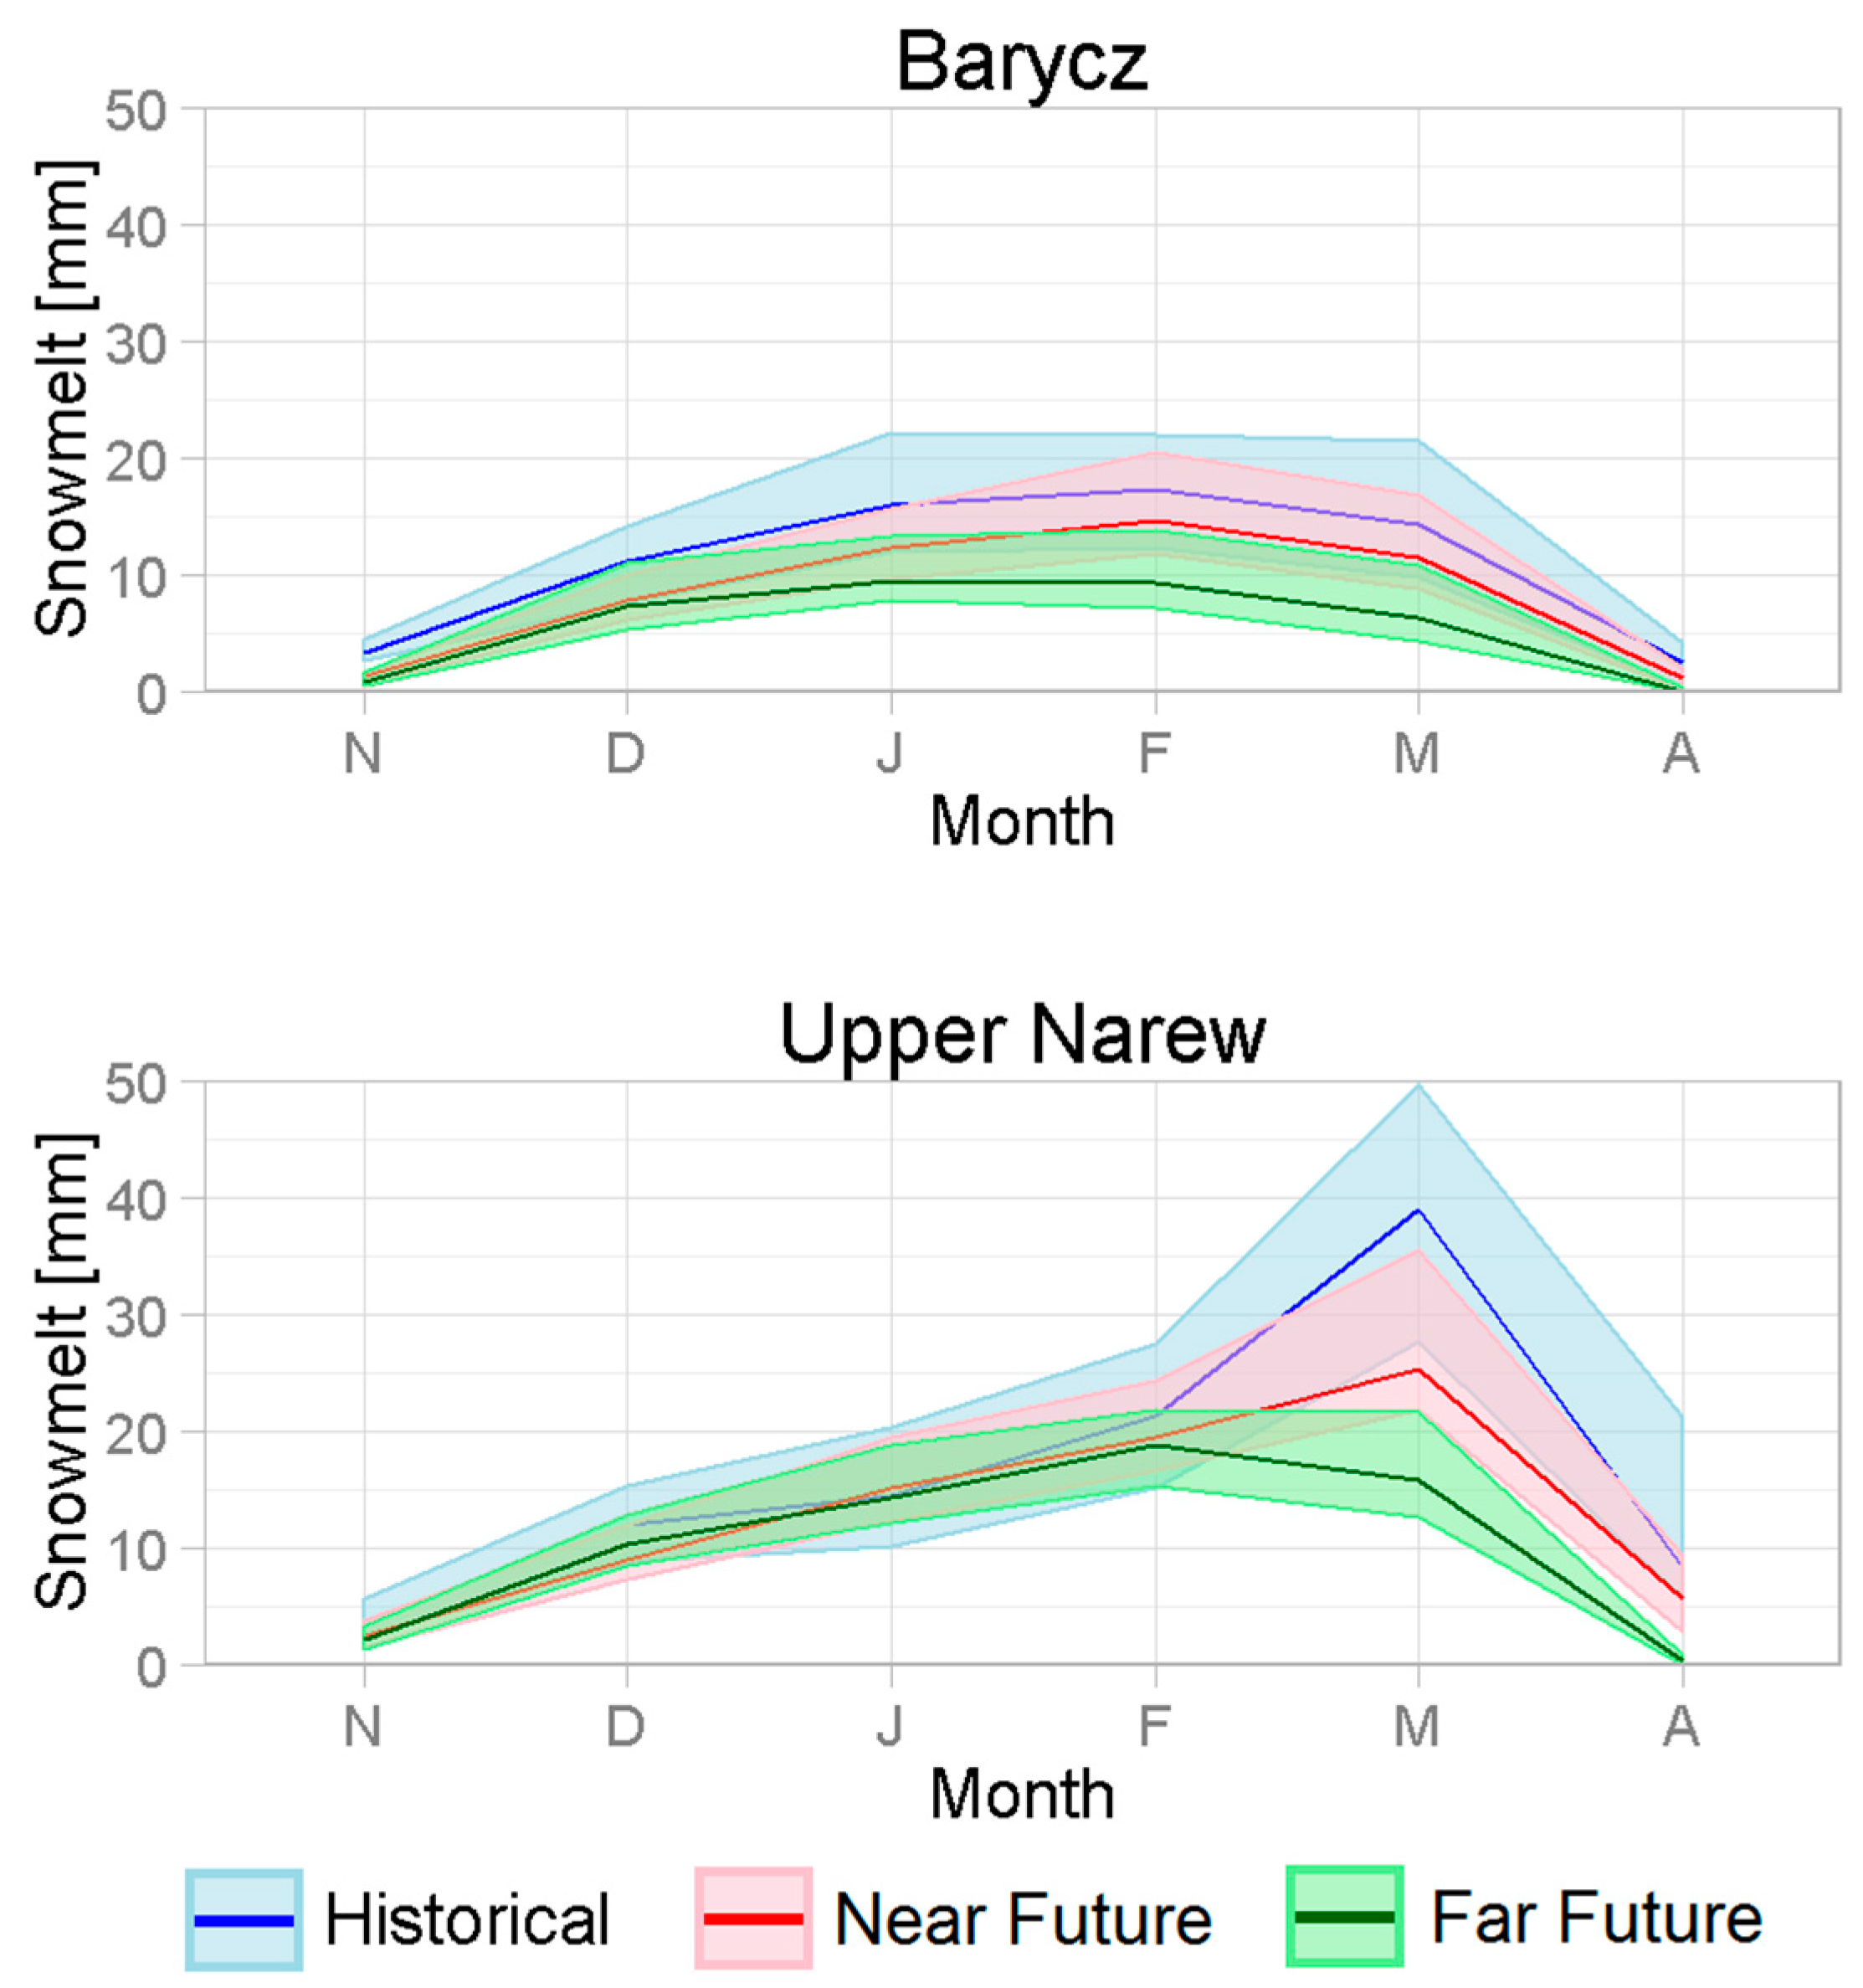
Hydrology of both catchments is considerably affected by projected warming and changes in precipitation patterns. As shown in Figure 2 and discussed in Section 2.1, the baseline hydrology of investigated catchments differs substantially, so it is very interesting to assess the effect of roughly similar climate change signal (cf. Figure 3 and Figure 4) on different baseline hydrological conditions of two lowland catchments.

3.2.1. Snow Melt

Snow conditions are characterized in SWAT by the amount of melted snow [36]. The amount of water originating from snow melt is projected to substantially decrease, by 23% and 40% (ensemble median) in both catchments, in the near and far future, respectively (Figure 6). However, due to the difference in climate conditions (i.e., the frequency of temperatures falling below zero) between catchments, the response varies considerably across months. In the Barycz catchment snow melt in autumn and spring is projected to almost vanish by the end of 21st century, whereas in winter it is shown to decrease by 37%. In contrast, snow melt occurring between November and February in the Upper Narew catchment will remain almost unchanged, which can be explained by an increase in precipitation compensating an increase in temperature (cf. Figure 4). However, snow melt occurring in March and April in the Upper Narew catchment will undergo the largest change. While in the historical period a very distinct peak in snow melt occurs in March, in the near future this peak is much less apparent, and in the far future it is shifted to February. April snow melt is expected to literally vanish by the end of the century.

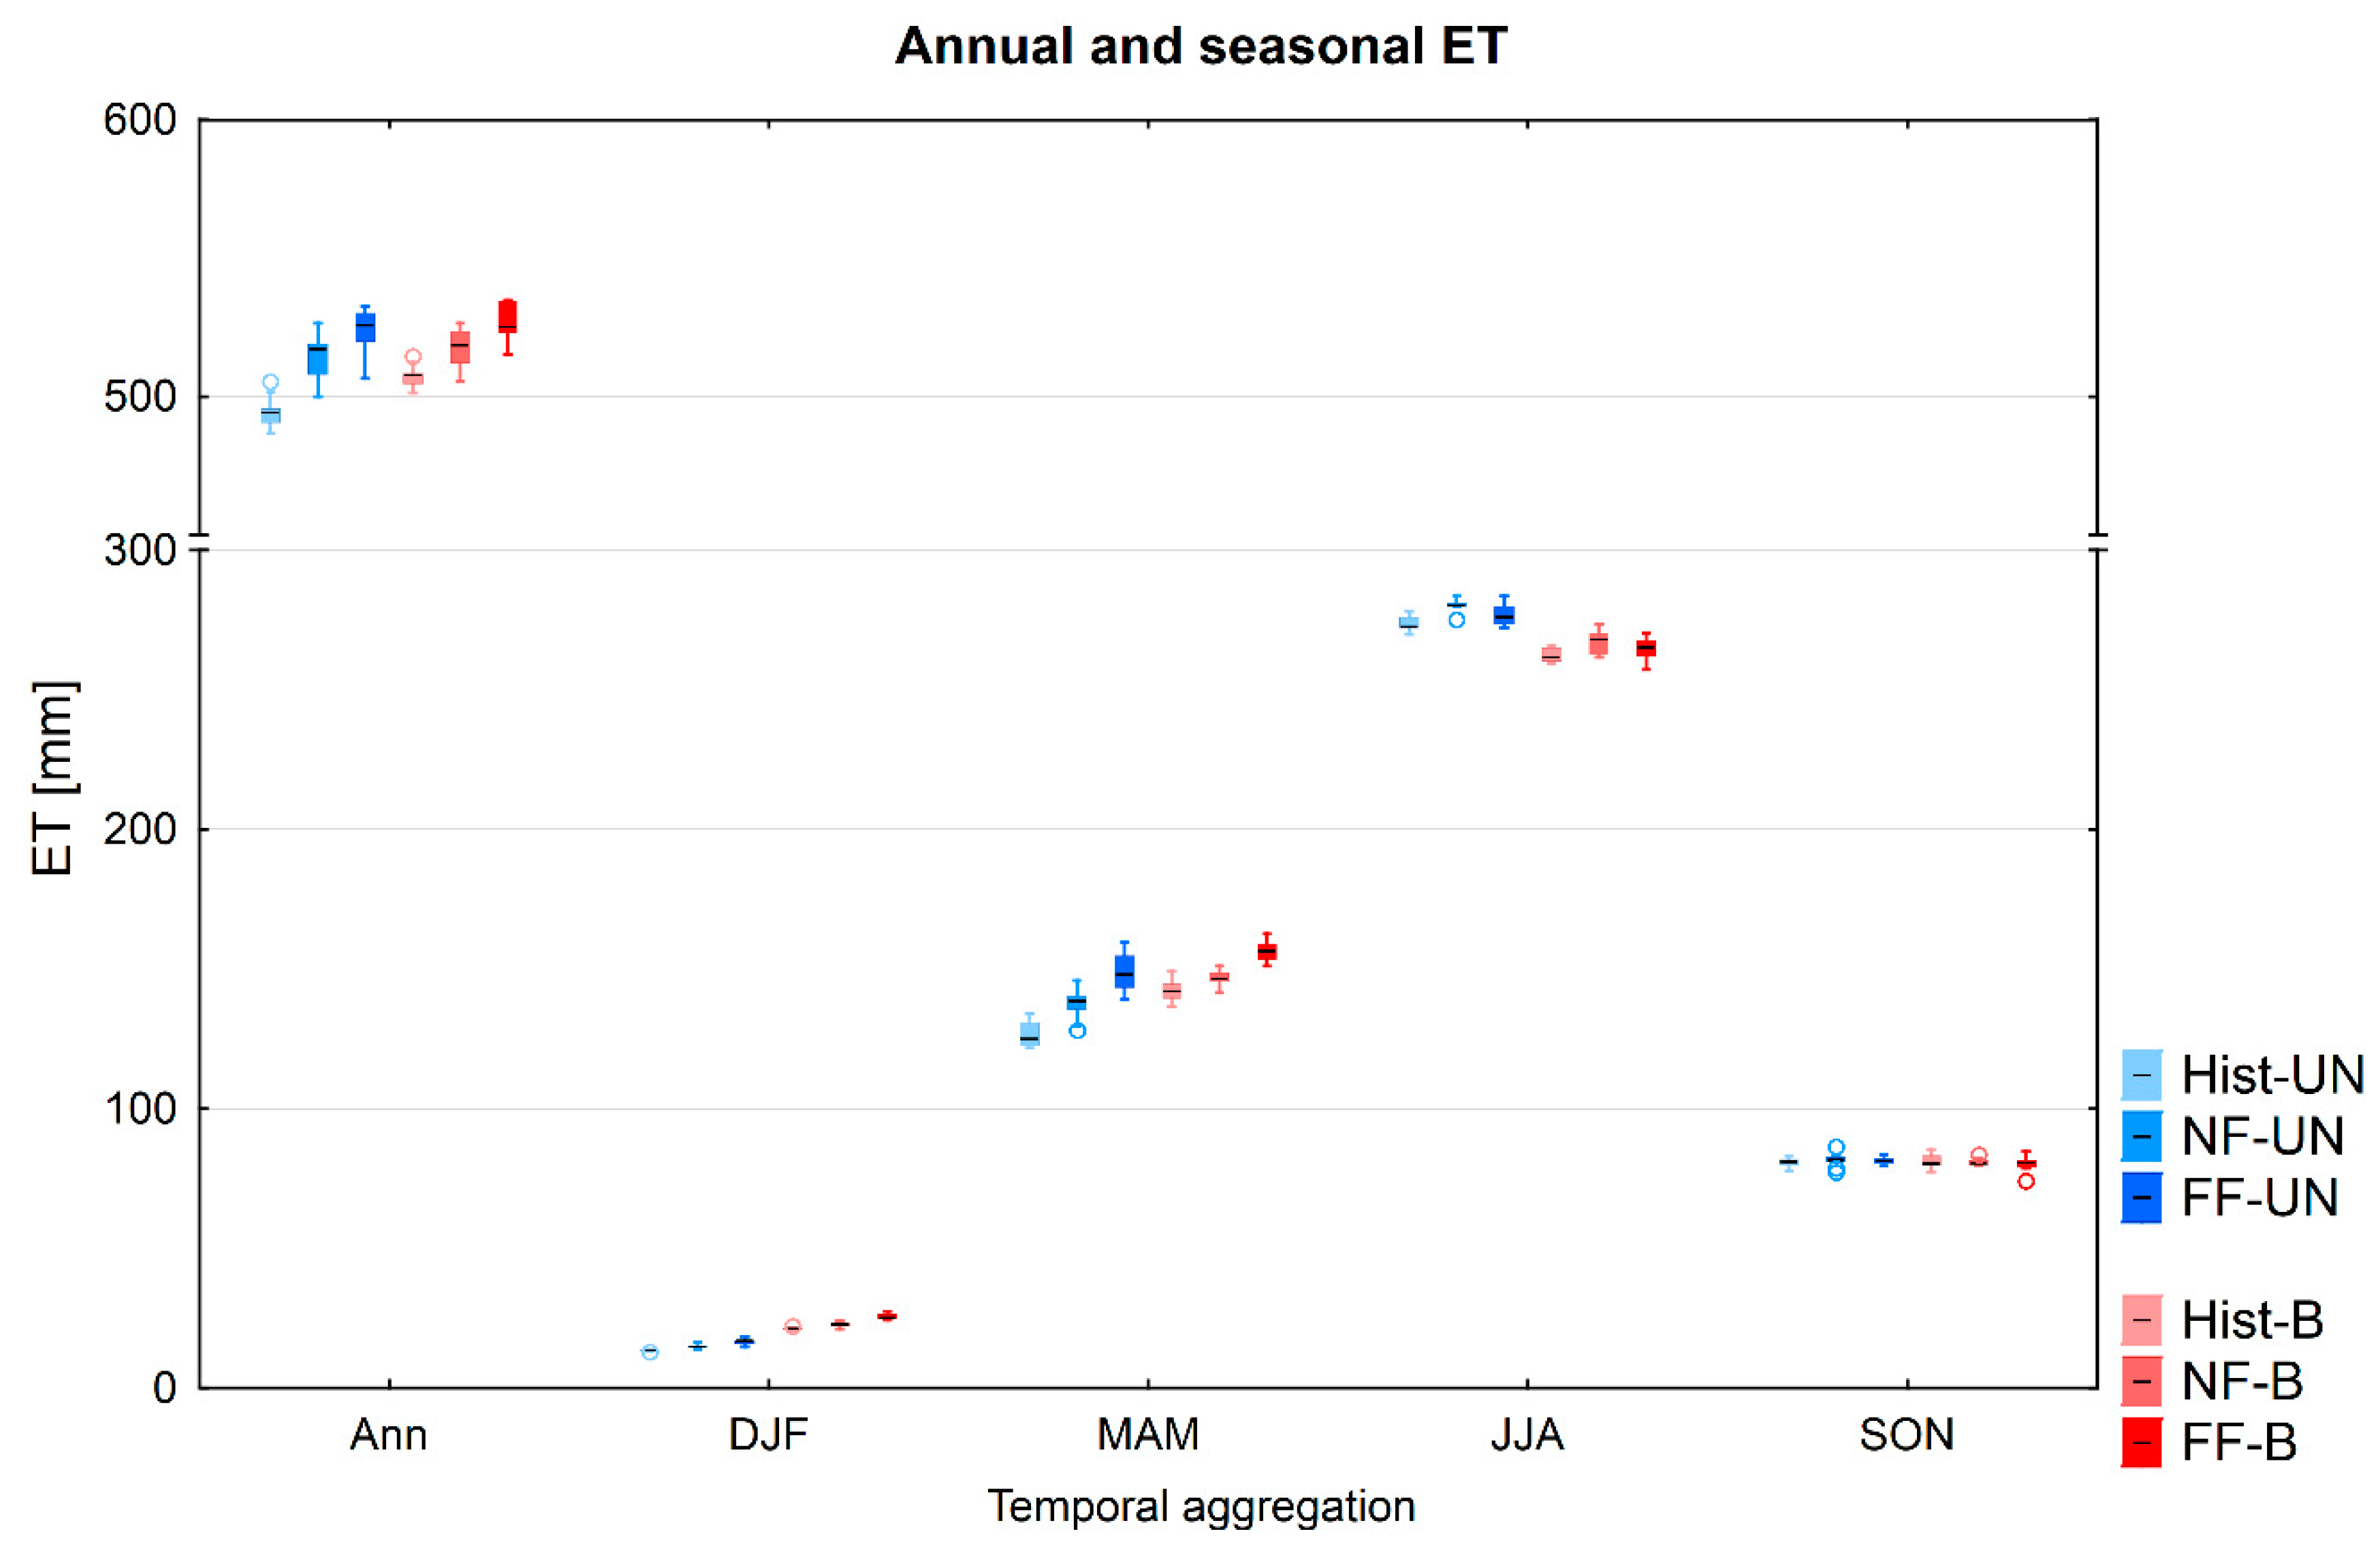
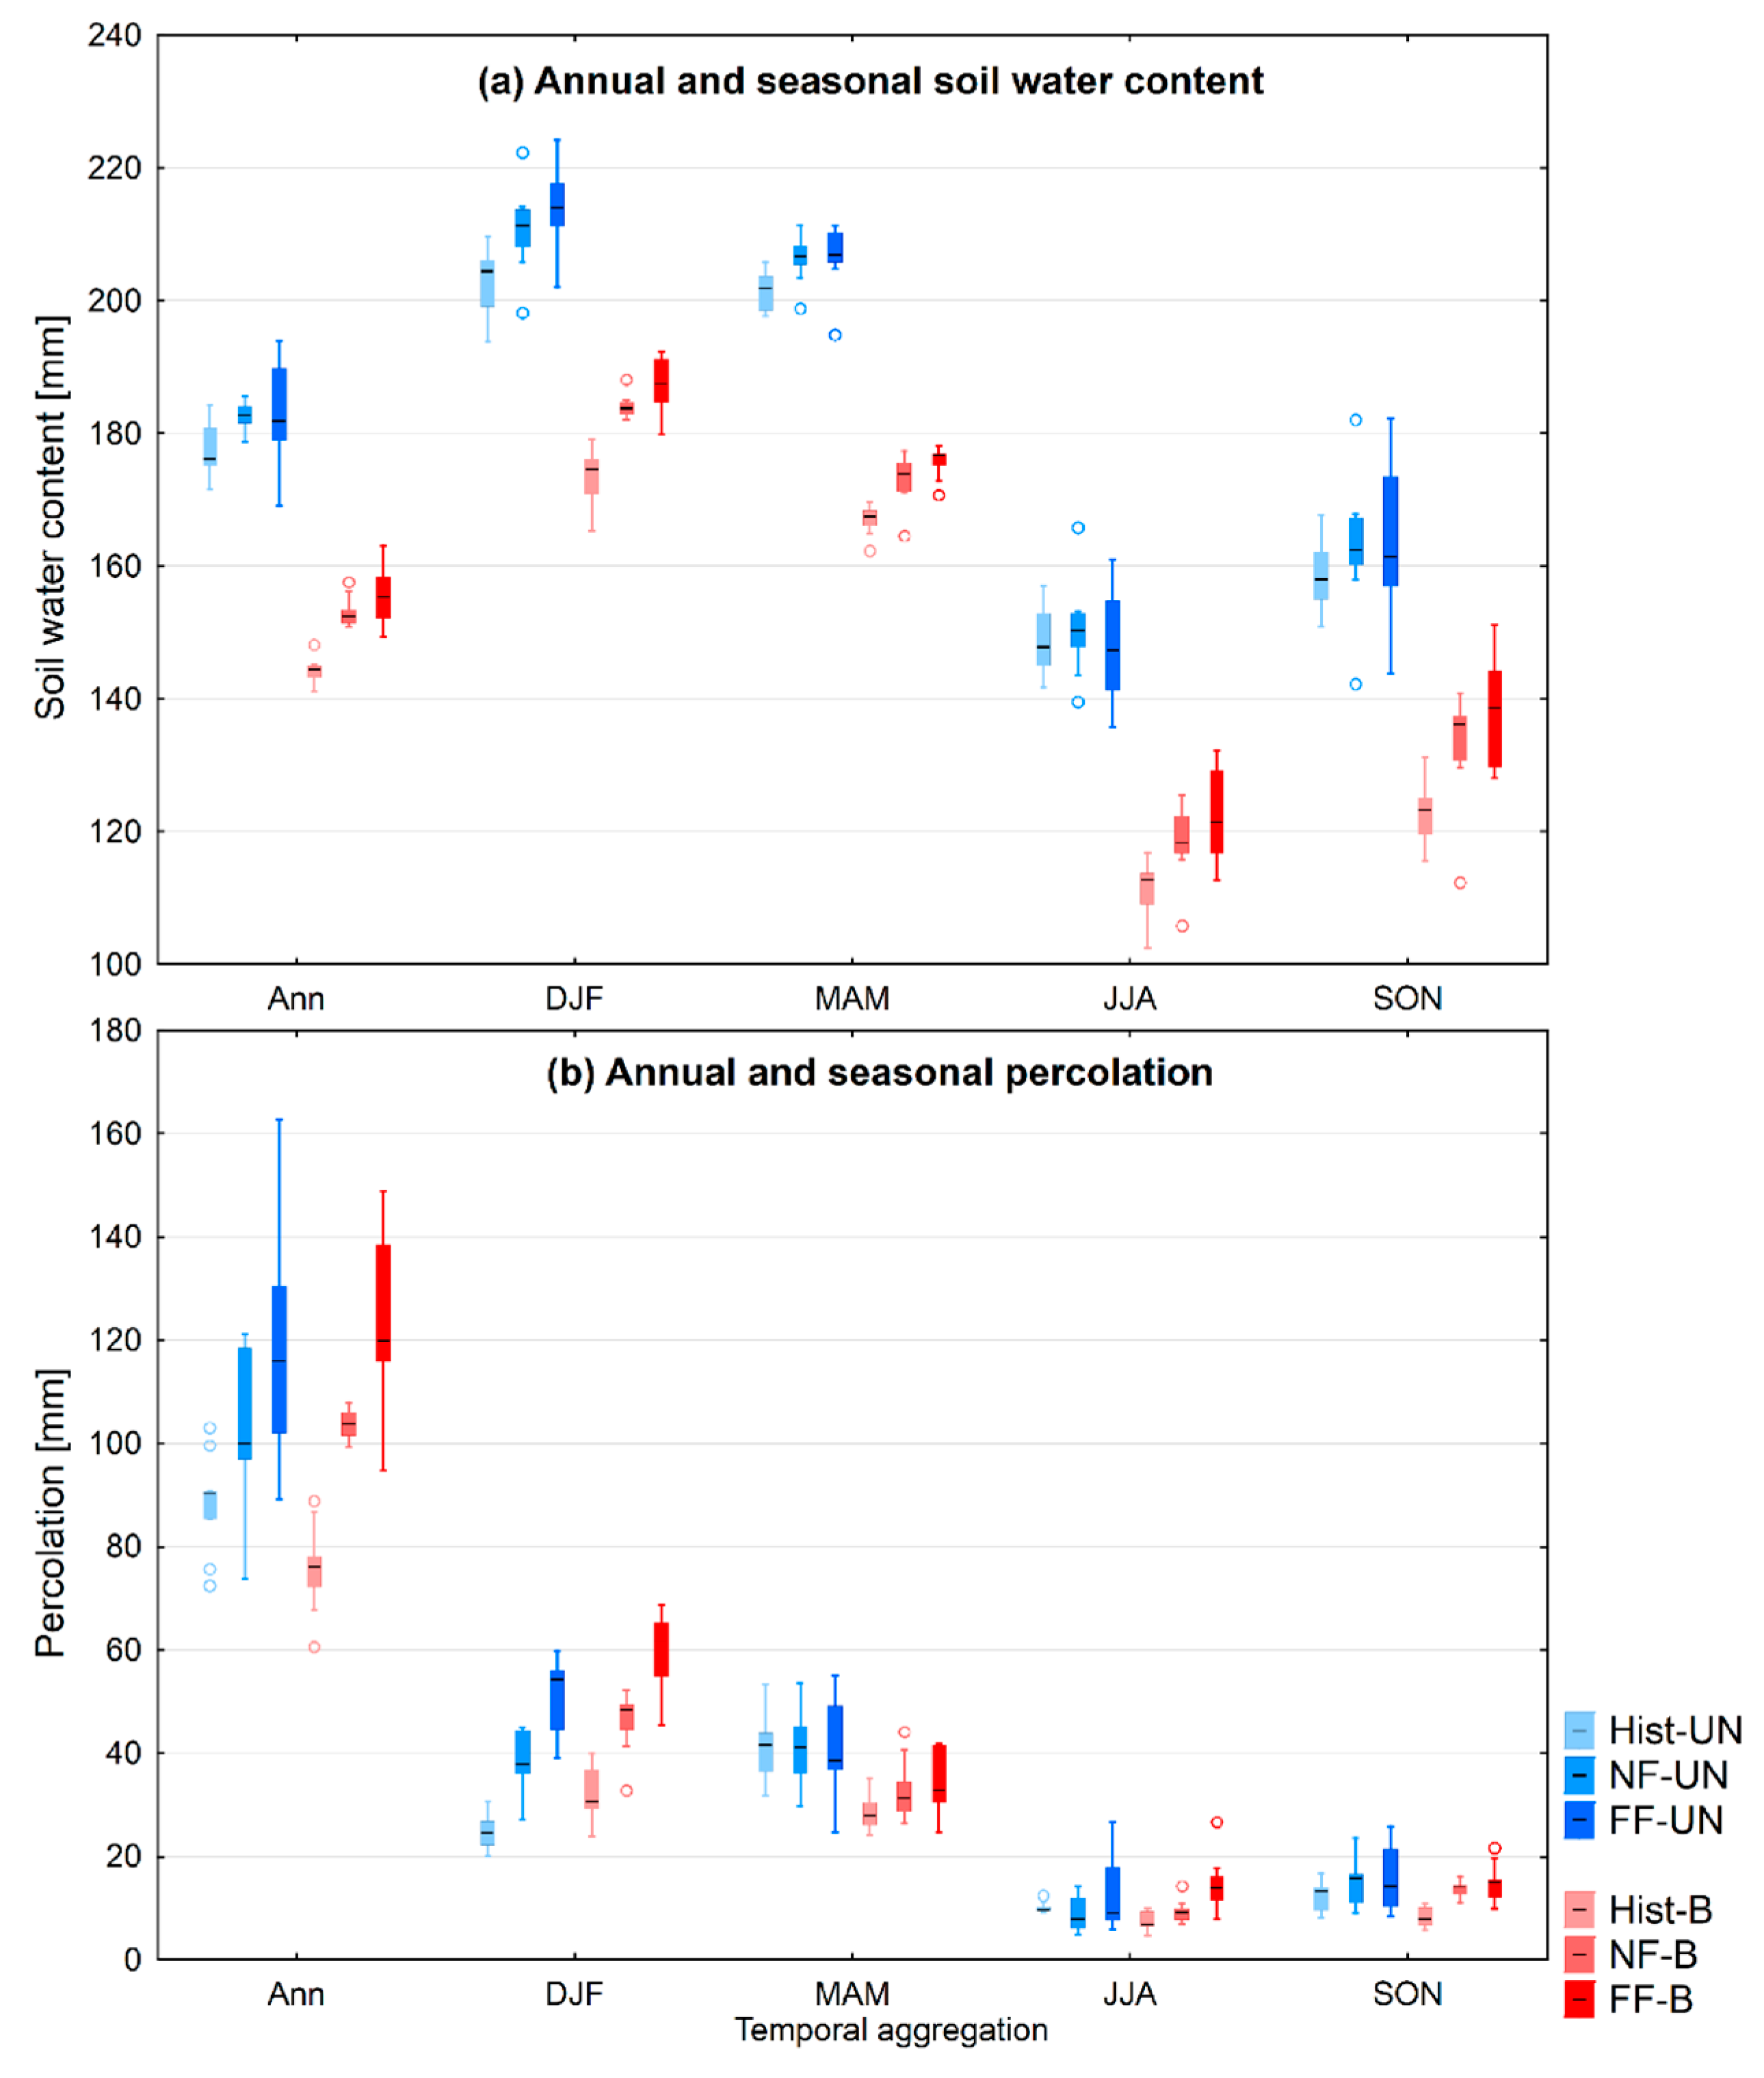
3.2.2. Evapotranspiration and Soil Water

Actual evapotranspiration (ET) is projected to increase in both catchments by 2.6%–3.3% in the near future and by 3.7%–6.8% in the far future (ensemble medians), in accordance with projected temperature increase (cf. Figure 4). Actual ET in the Upper Narew catchment is projected to undergo a higher increase than in the Barycz catchment, and this happens mainly due to the projected increase in spring season. Both the magnitude of change and the spread of the ET projections among all ensemble members are relative low (Figure 7). The highest relative increase, reaching 8% in the far future, is projected in winter, but since the historical value for winter is very low, this change is not very high when expressed in absolute values. It is noteworthy that projected changes in potential evapotranspiration (simulated in SWAT using Hargreaves method) are quite similar, although the magnitude of change in the far future is slightly lower.
According to the ensemble median, projected increase in mean annual soil water content (amount of water in the soil profile expressed in mm) is relatively low in both catchments, not exceeding 9% in the far future, and is slightly higher for the Barycz than for the Upper Narew catchment (Figure 8a). Climate model spread for the far future is more than double of the baseline period spread. Since the Upper Narew catchment is characterized by heavier soils, the mean soil water content is slightly higher there. However, seasonal patterns in both catchments are the same, with winter maximum and summer minimum. While in winter and spring soil water is projected to increase according to SWAT projections driven by the majority of RCMs in both catchments. The difference between catchments can be observed for summer and autumn: in the Barycz the increase is projected, but for the Upper Narew the direction and magnitude of projected changes are highly uncertain. This can be related to lower increases (or decreases) in summer and autumn precipitation for the latter, particularly in the far future (cf. Figure 5), but also to the differences in soil physical characteristics.
Annual percolation (movement of water past the bottom of the soil profile to the groundwater aquifers) is projected to increase by a rate at least two times higher in the Barycz catchment than in the Upper Narew catchment (Figure 8b). Due to the nature of projected changes in winter precipitation and temperatures, more rainfall is projected in winter in both catchments, which triggers a sharp increase in percolation in this season in both catchments, i.e., more than the two-fold increase for the far future. Catchments behave differently for the remaining seasons: while for the Upper Narew catchments no clear conclusion can be made, as the model spread increases, low to moderate increases are projected for the Barycz catchment.

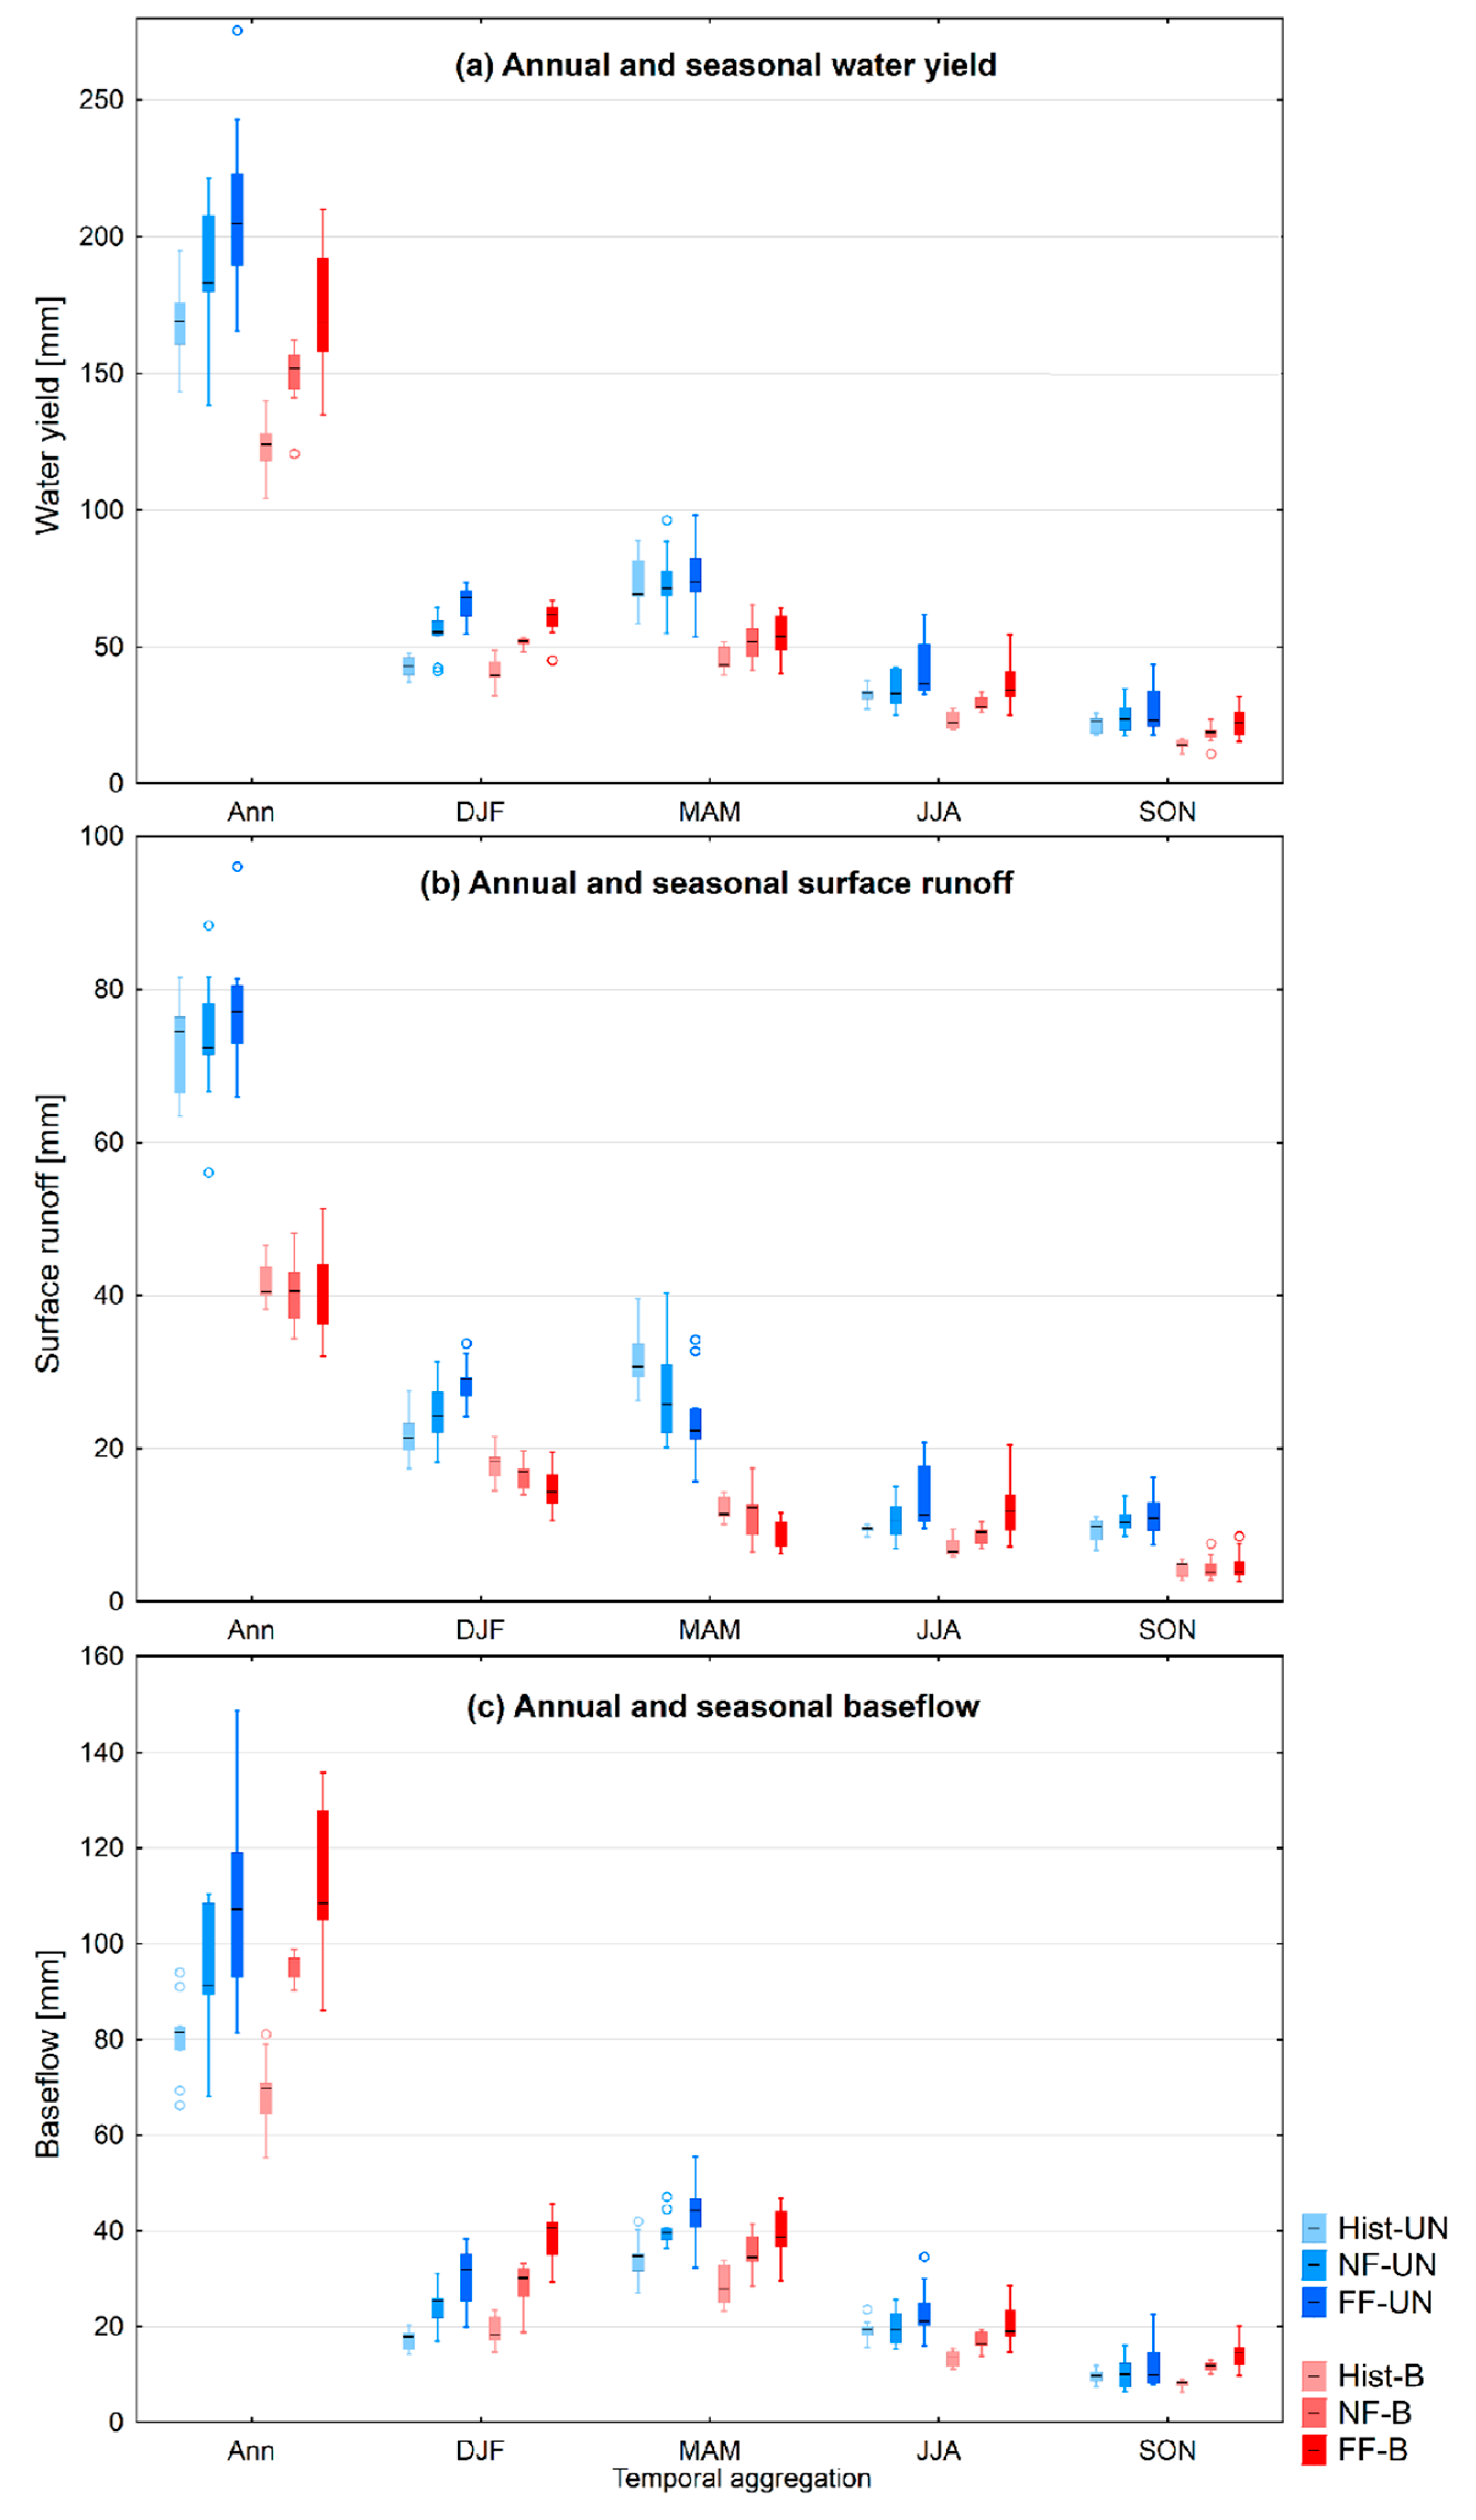
3.2.3. Water Yield, Surface Runoff and Baseflow

In SWAT, water yield is calculated as the sum of surface runoff, lateral (sub-surface) flow and baseflow, in the absence of transmission losses. Both in the Barycz and the Upper Narew catchment surface runoff and baseflow are dominating components and constitute approximately 90% of total water yield, so they are discussed in more detail below.
The median of projected changes in water yield, i.e., the portion of precipitation that reaches the stream, is significantly higher for the Barycz catchment (24% and 38% in the near and far future, respectively), than in the Upper Narew catchment (9% and 20%, respectively; Figure 9a). This large difference is partly explained by the fact that the baseline value for the latter is considerably higher, i.e., 170 mm vs. 123 mm (cf. Figure 2). Seasonal patterns of change are quite similar, with the most pronounced increase occurring in winter, which is in line with projections of other variables shown above. In three remaining seasons, the increases are either low or the uncertainty is so high that it is difficult to conclude on the direction of change.
Present differences in water yield between two investigated catchments can be to a large extent explained by differences in surface runoff, whose annual total is equal to 40 mm in the Barycz catchment, and nearly the double of it in the Upper Narew catchment (Figure 9b). Little can be concluded on projections of surface runoff on annual level, as the climate model uncertainty dominates. However, interesting patterns can be noted on seasonal level. In the Upper Narew catchment, a moderate increase in surface runoff is projected in winter and a moderate decrease in spring. In contrast, in the Barycz catchment surface runoff decreases in both seasons, although with a rather low rate. These behaviors can be well explained by projected patterns in precipitation (Figure 6) and snow melt (Figure 7). With milder and wetter winters, more (or less) melted snow forms more (or less) surface runoff, whereas more rainfall contributes to higher infiltration, as the occurrence of soil freezing is more rare. In contrast, in summer and autumn, changes in surface runoff follow to a large extent changes in rainfall. As shown in Figure 9b, overall, the uncertainty in these two seasons increases, especially in summer. Higher projected summer precipitation increase for the Barycz catchment translates into higher surface runoff change, although in absolute values the figure remains low (14 mm).
Projected changes in baseflow (Figure 9c) follow to a large extent changes in percolation (Figure 8b), although a lag in seasonal pattern can be visible (maximum values reached in spring rather than in winter). In general, both the signal of change and the uncertainty increase their magnitude in the future horizons. While in the baseline period the Upper Narew catchment has higher baseflow than the Barycz catchment, an inverse relationship occurs in the far future. Projected changes in the lateral flow component (not shown) are similar to those presented for the baseflow.

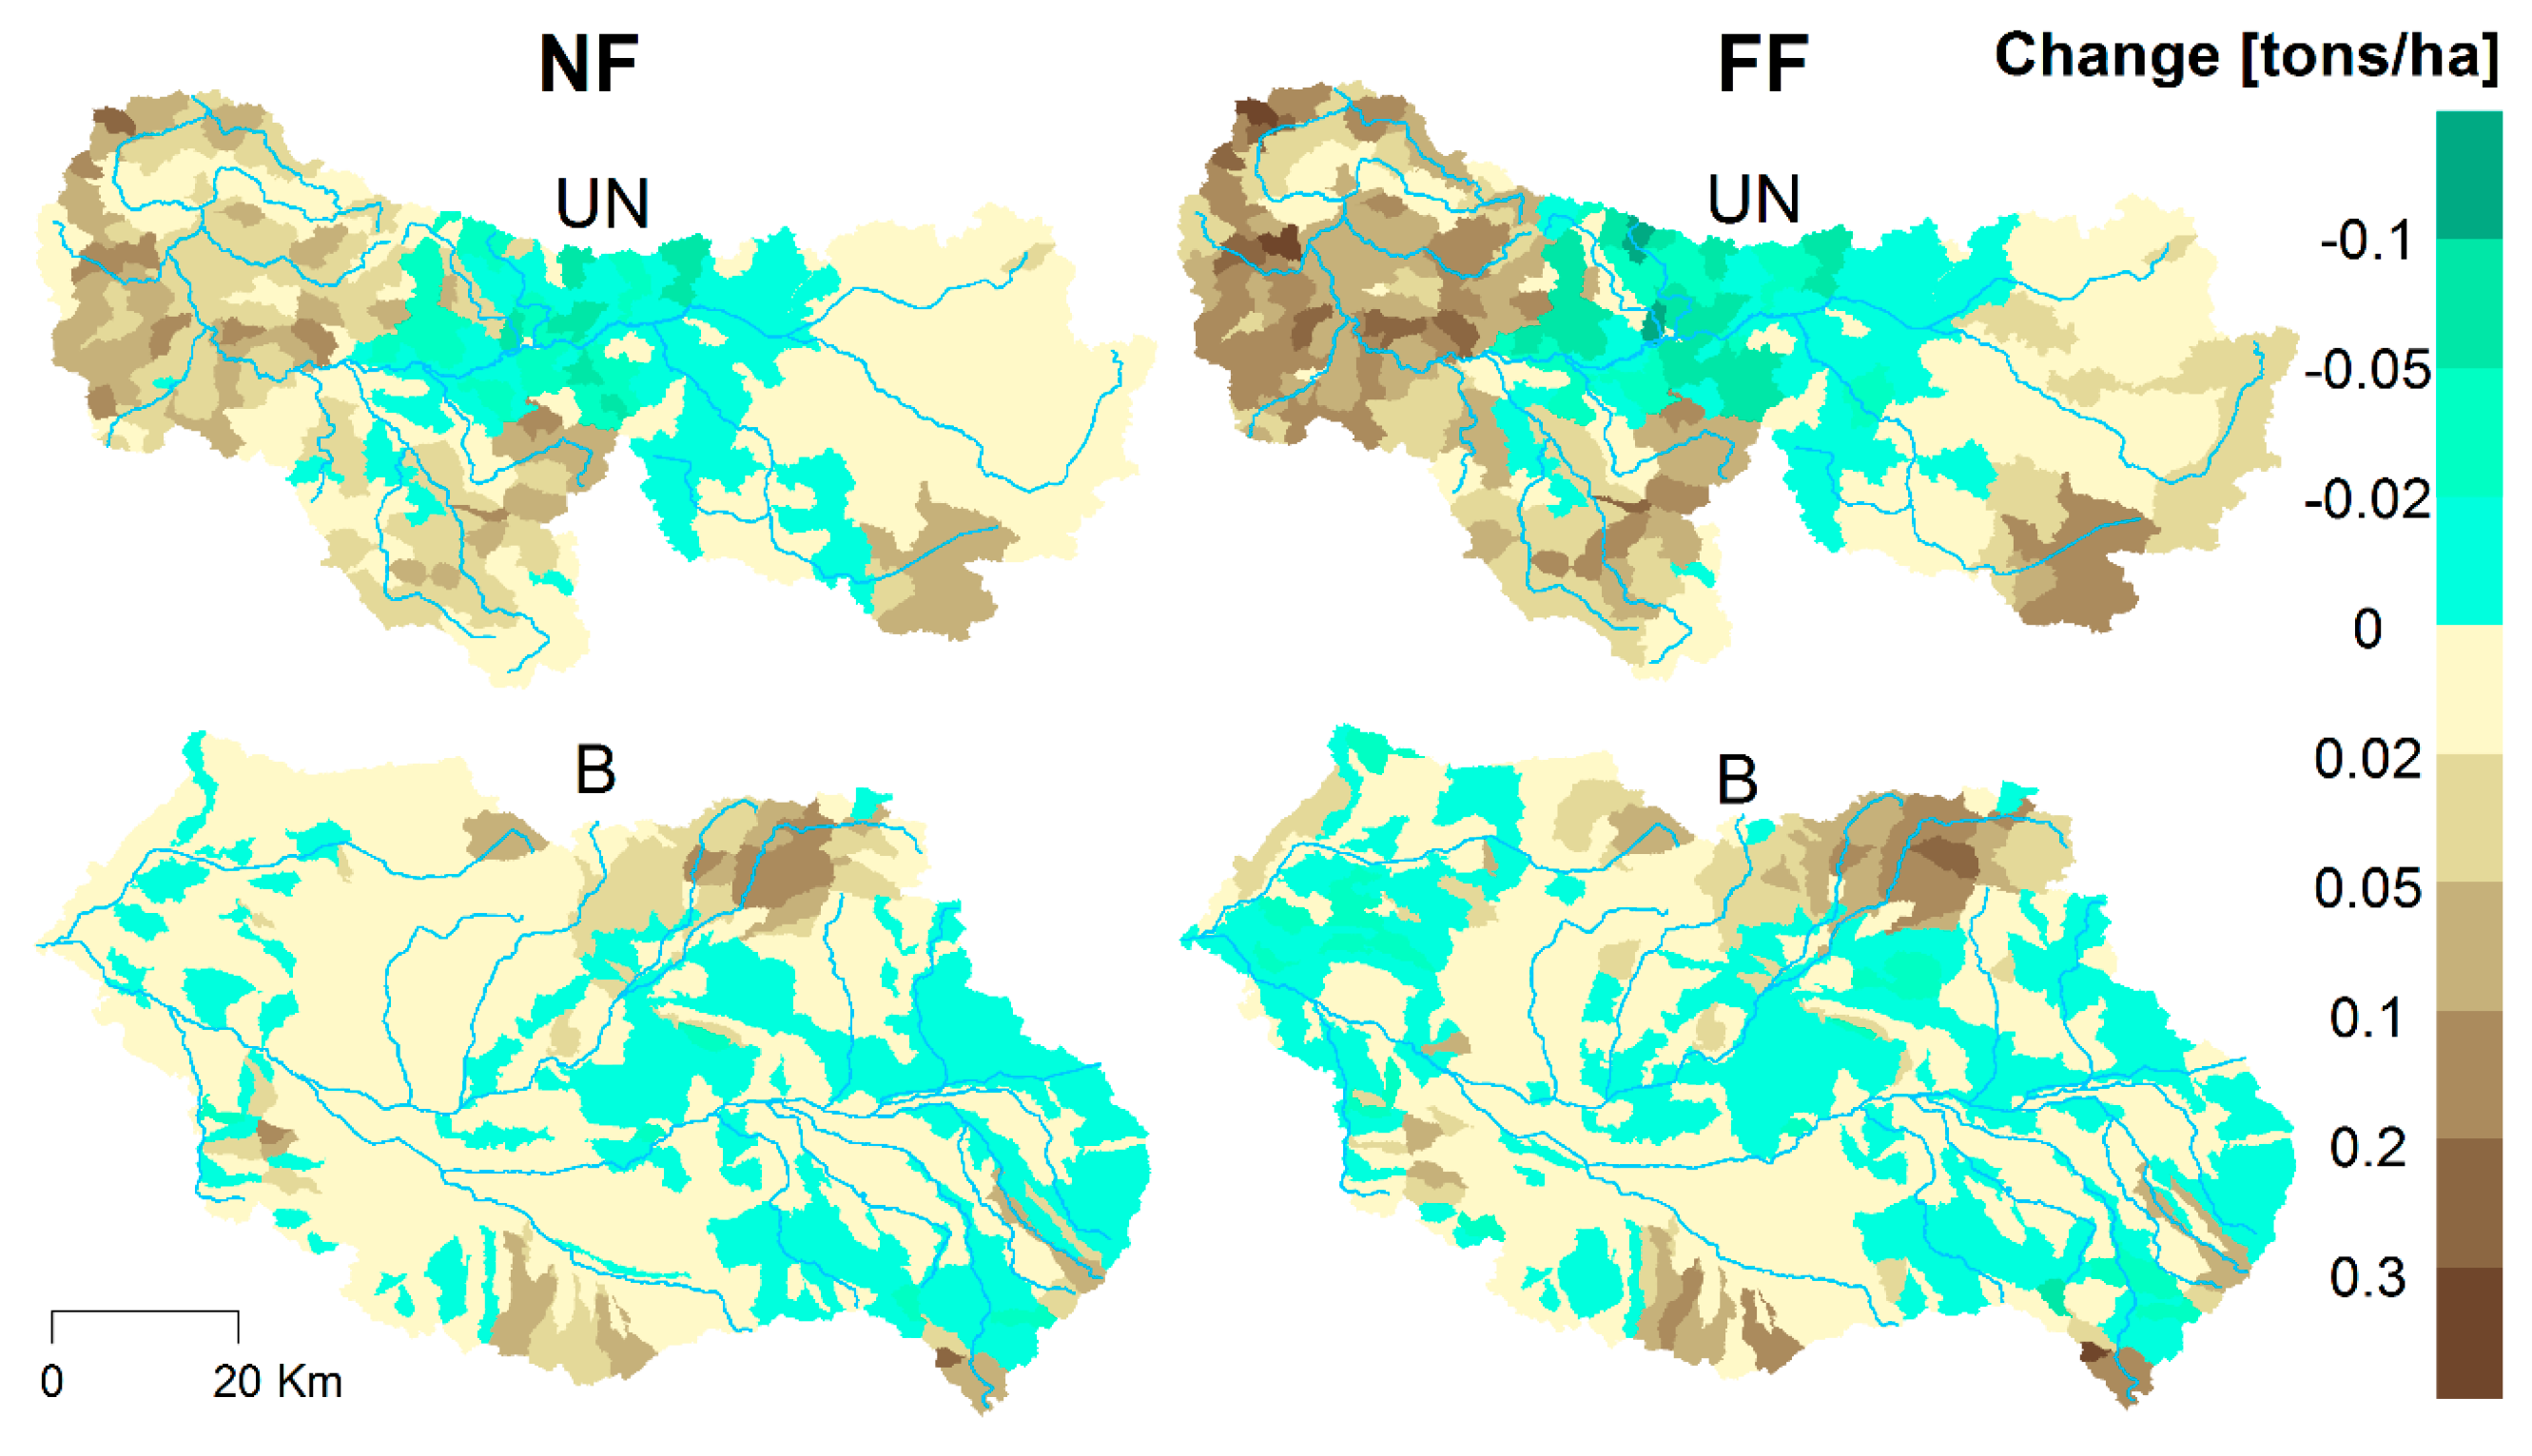
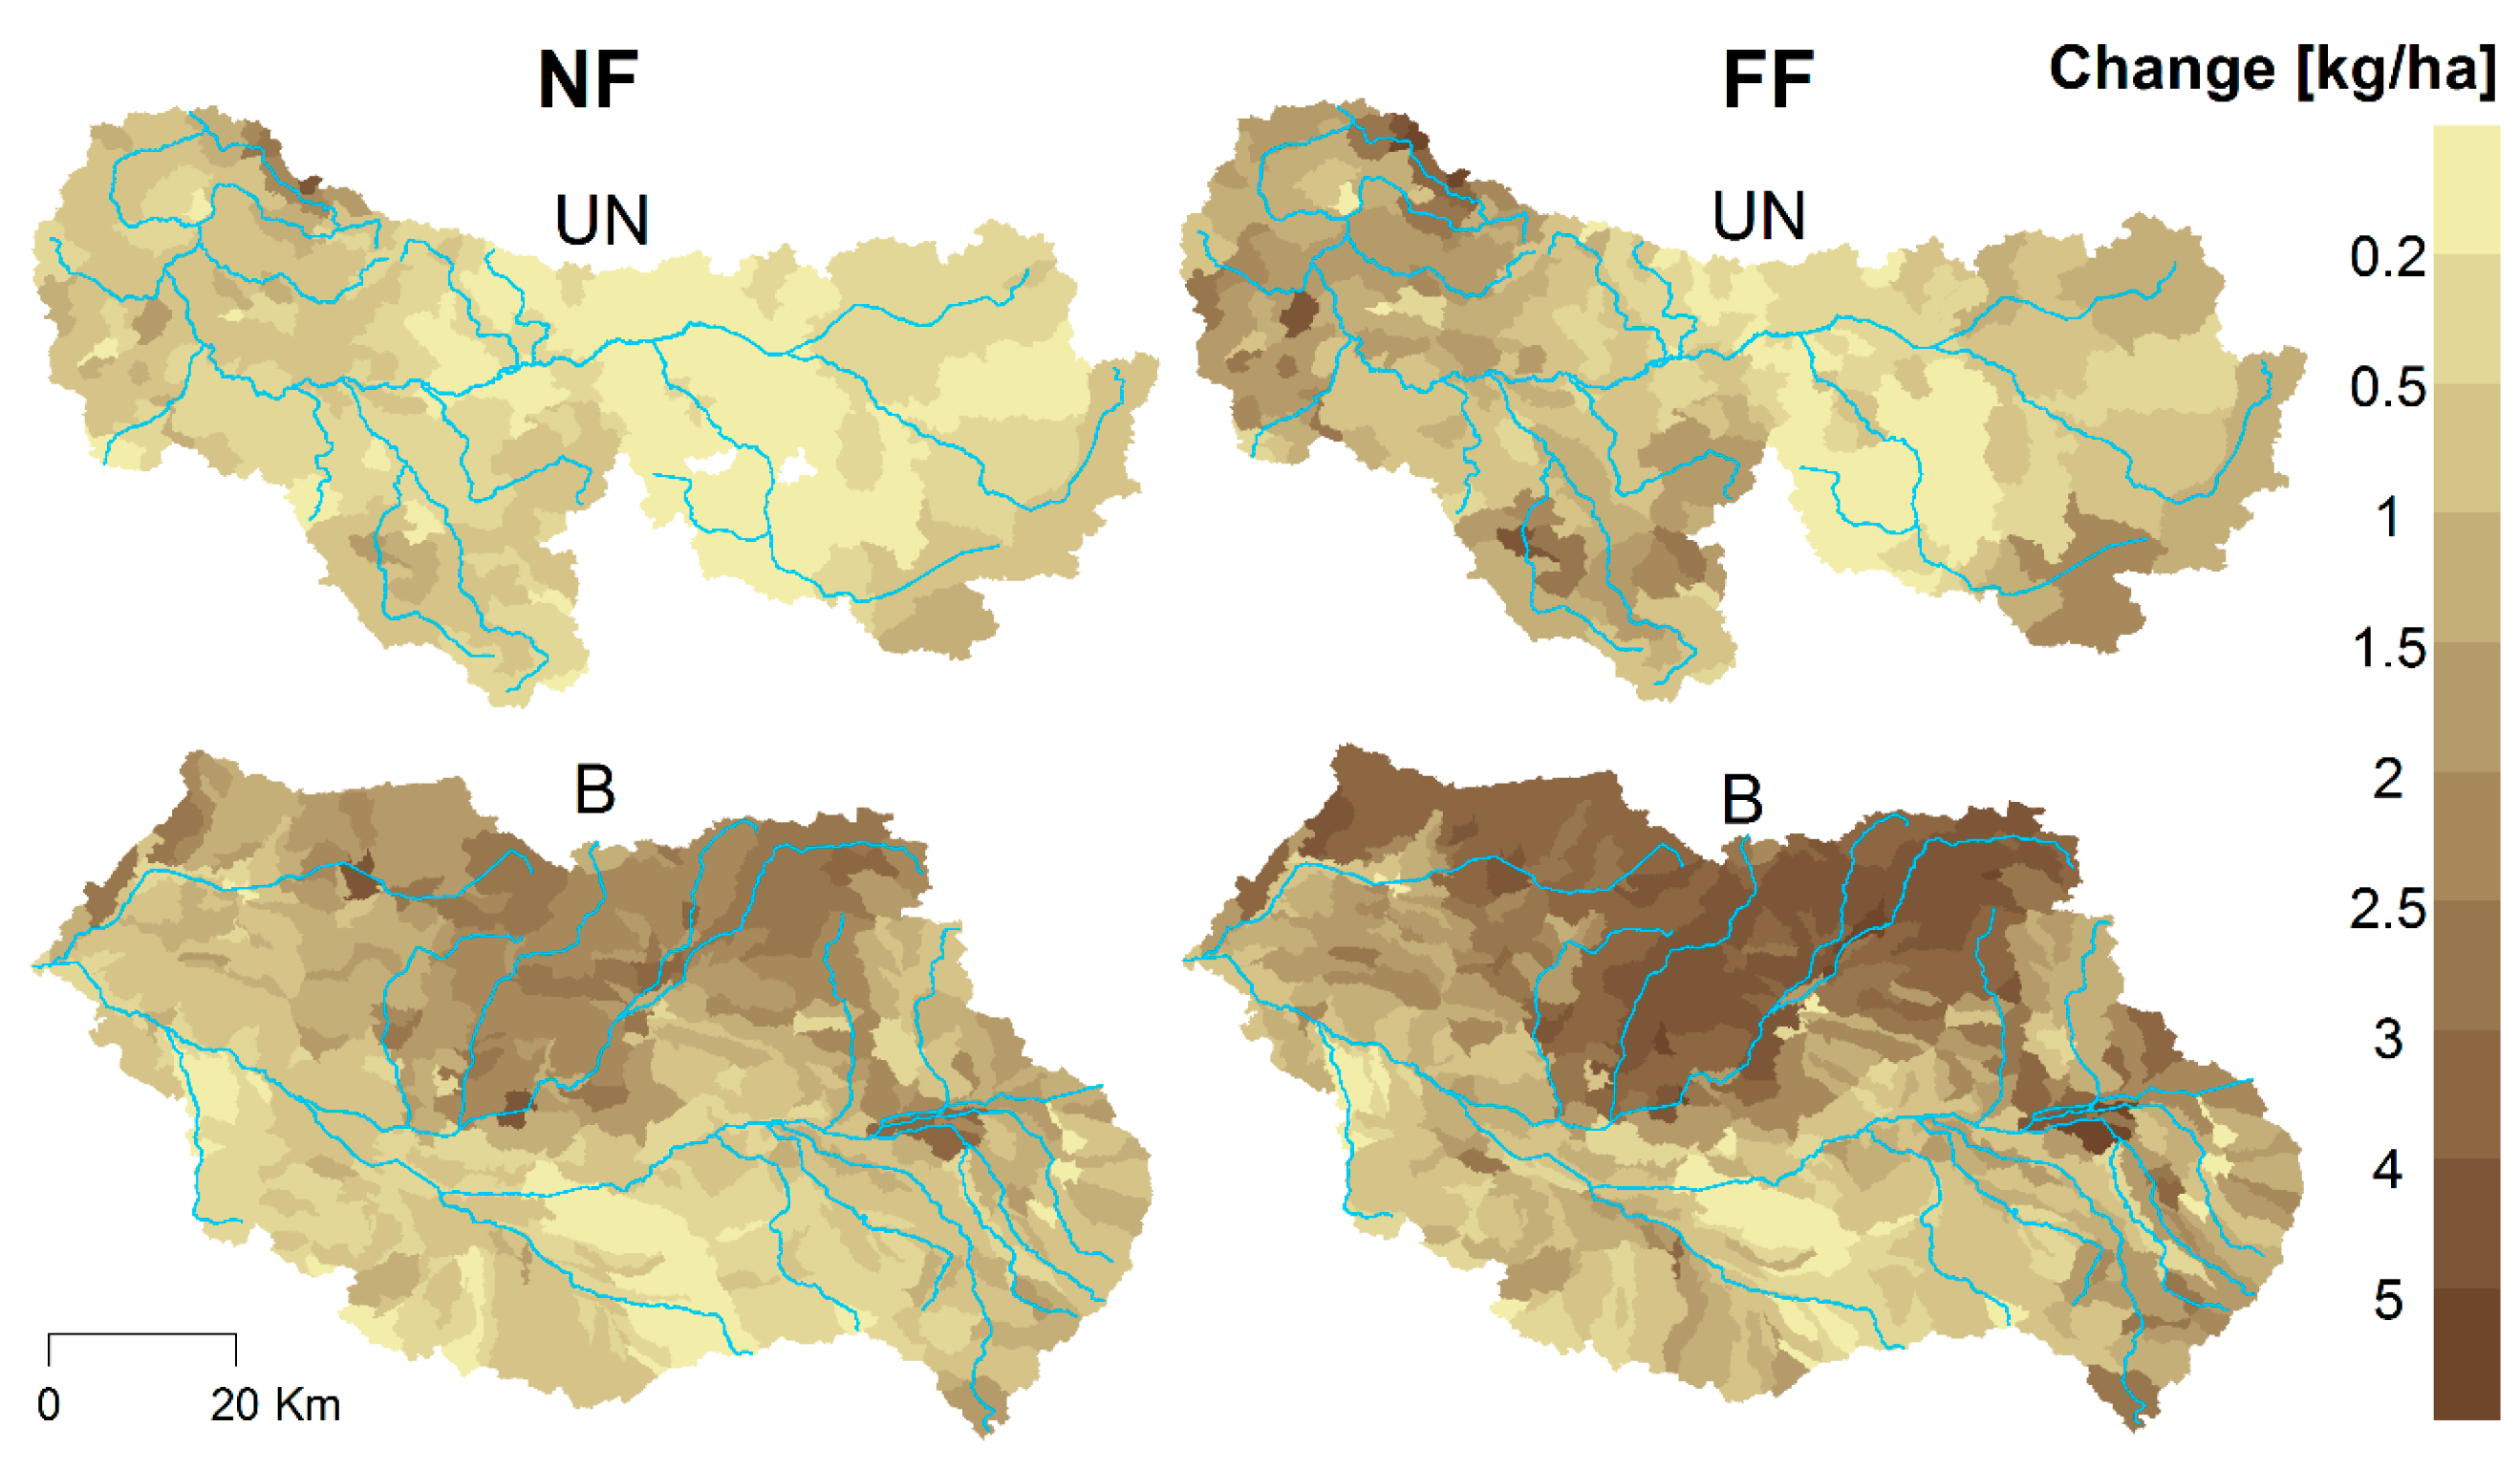
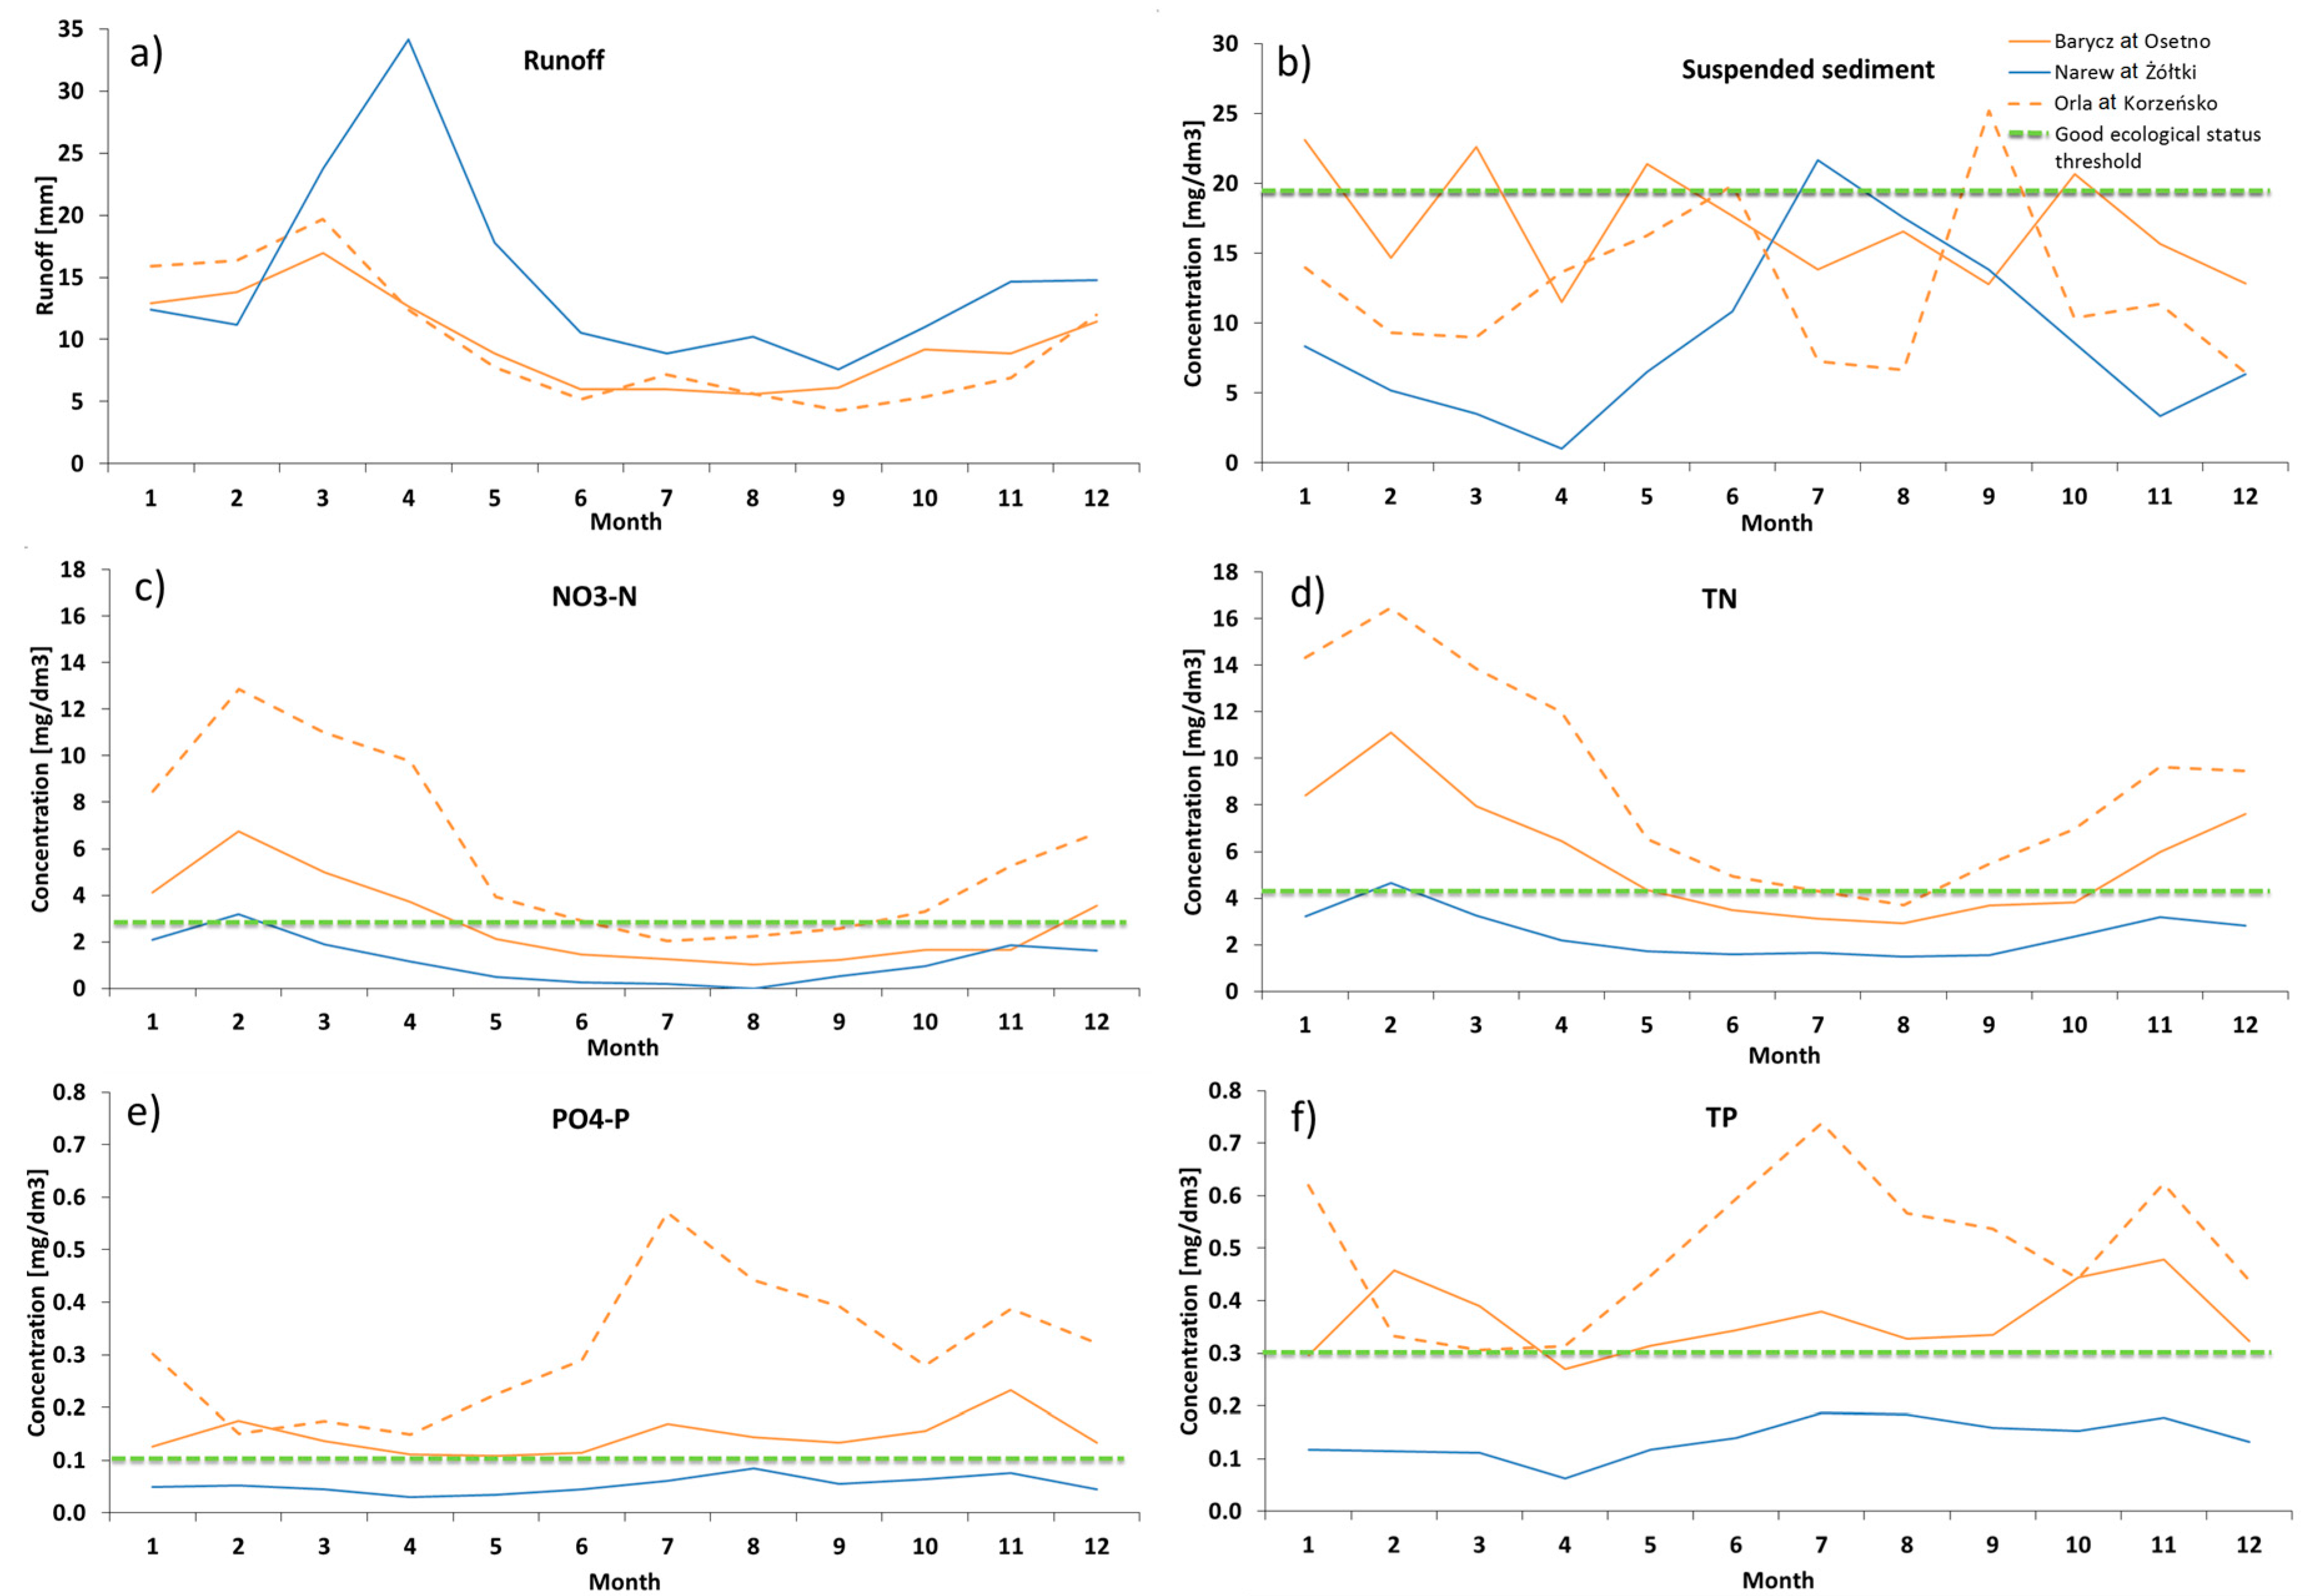
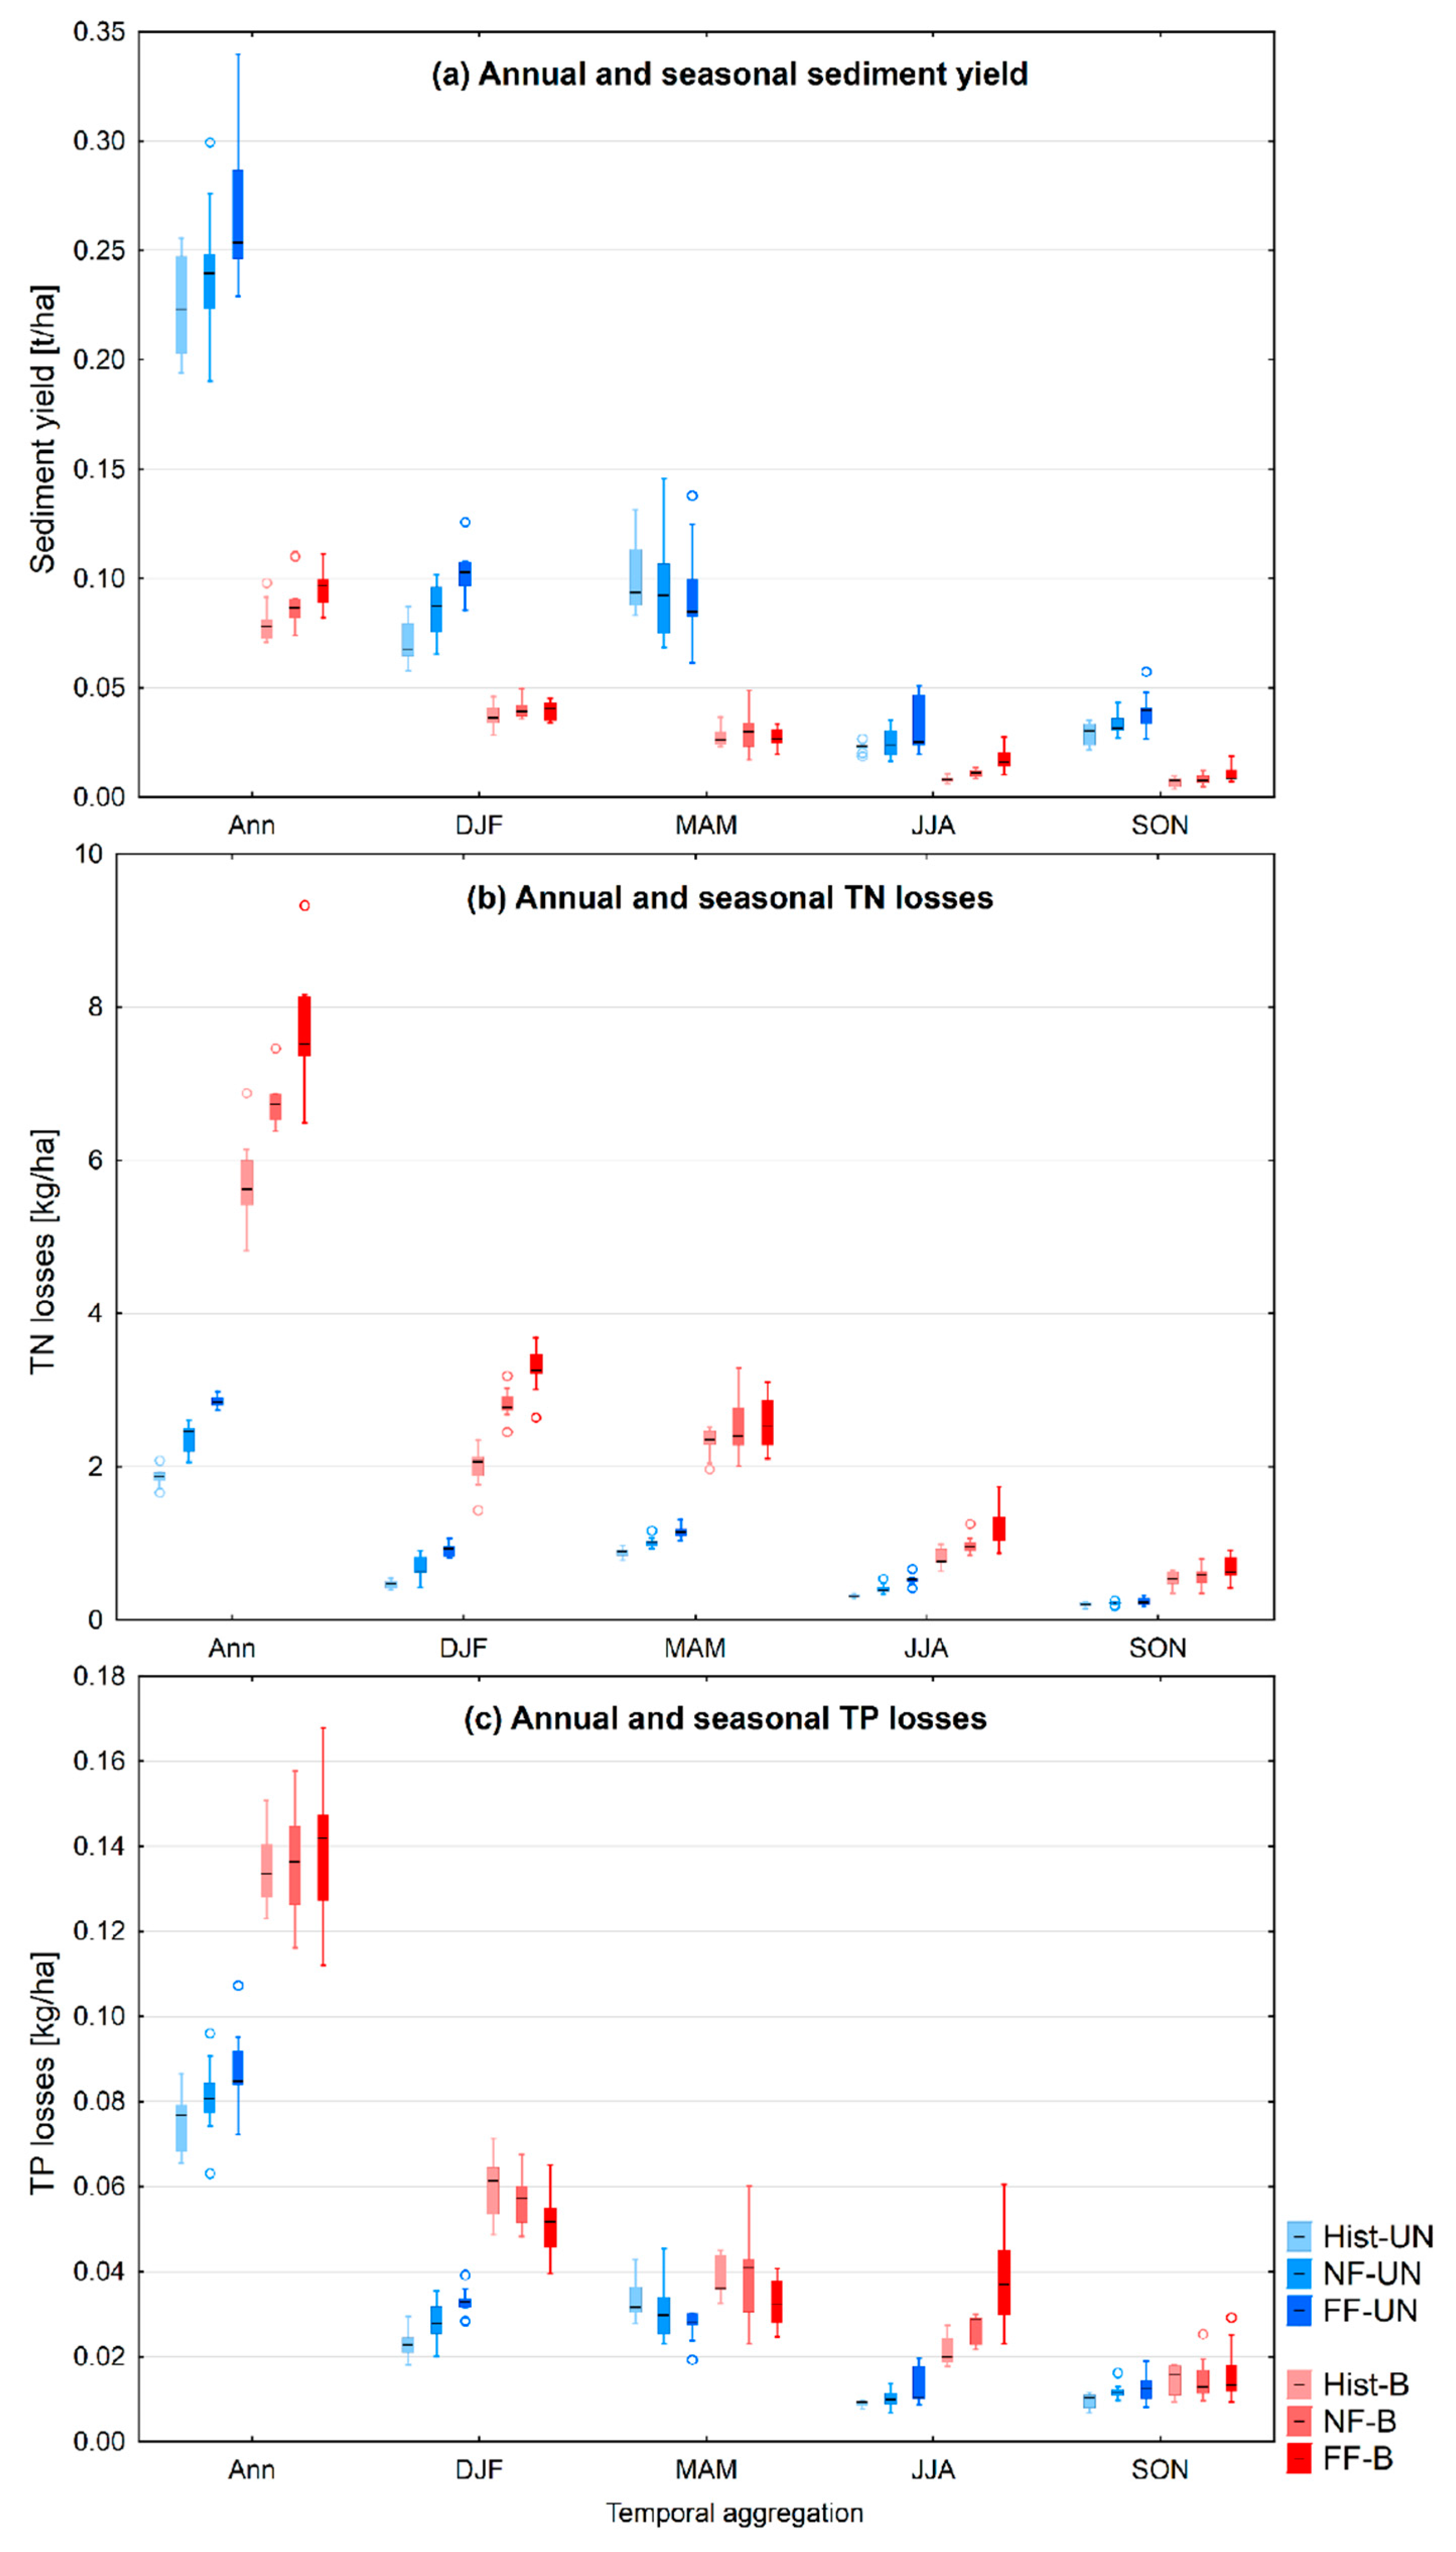
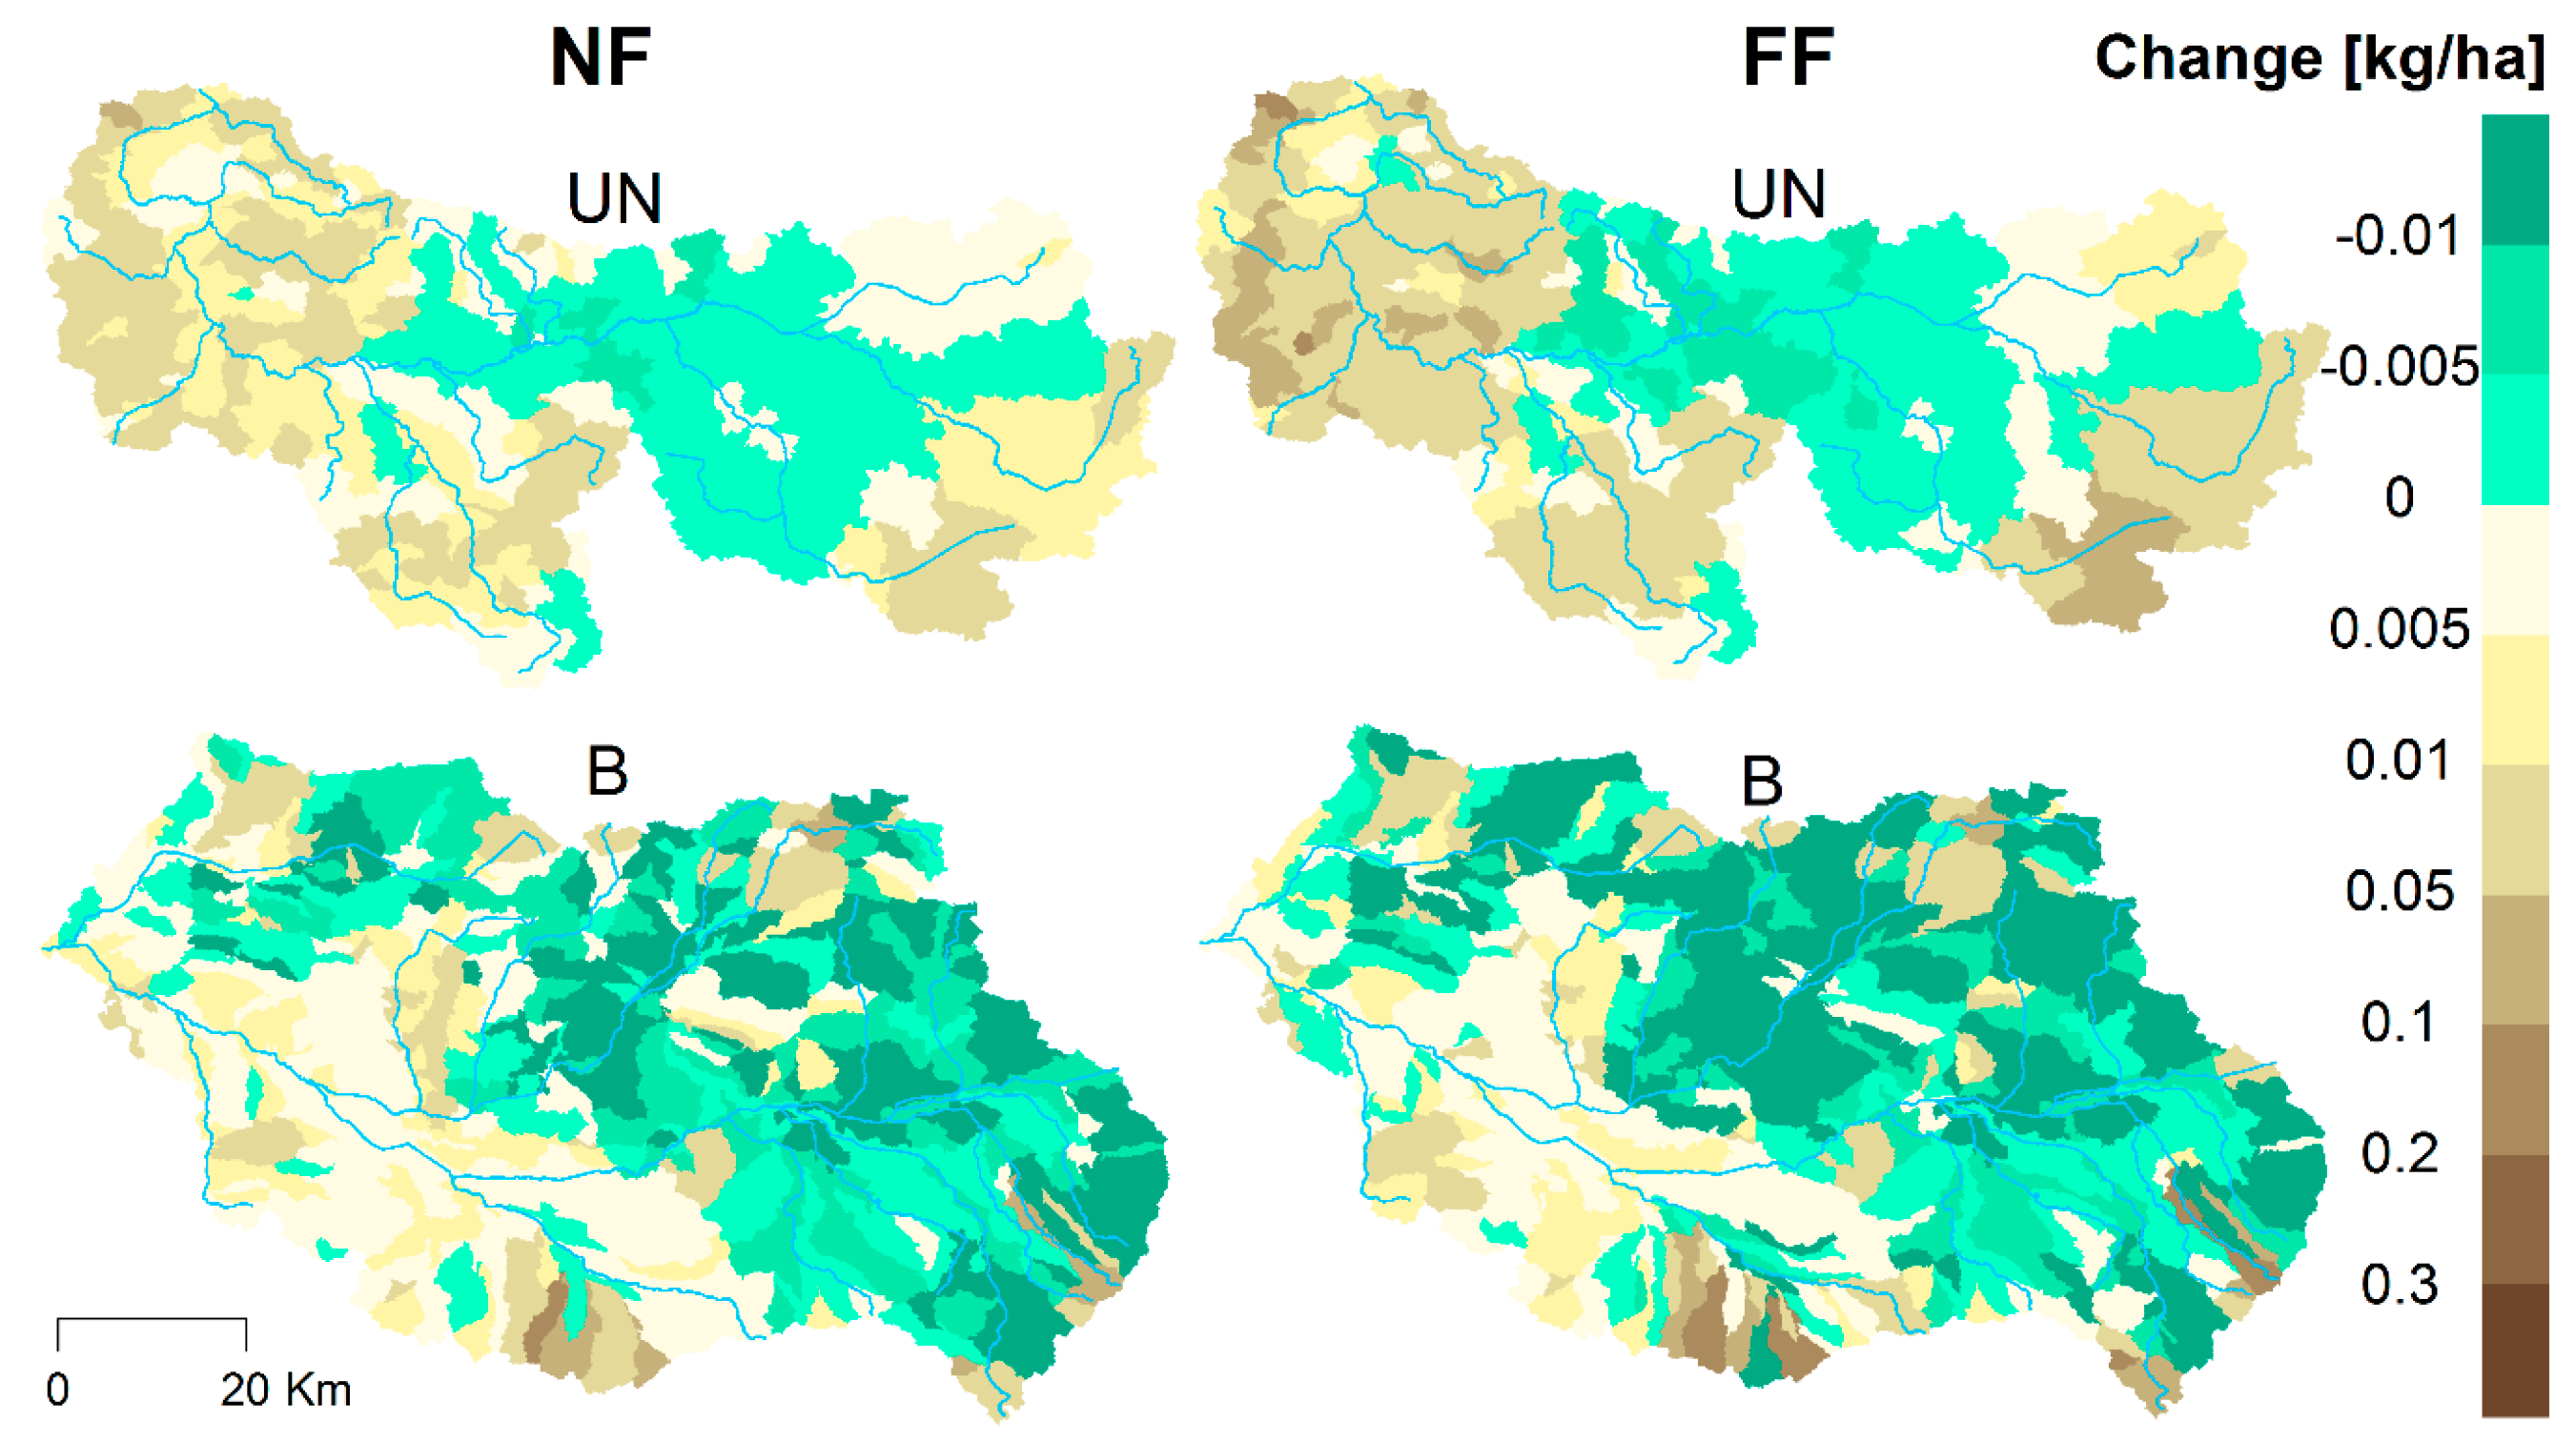
3.3. Sediment and Nutrient Transport Response to Climate Change

Sediment and nutrient transport response to climate change forcing is presented in two forms: (1) catchment-averaged sediment, TN and TP losses, i.e., the amount of sediment, TN and TP that is transported from land (sub-basins) to the river network, shown as box plots across all climate models; and (2) spatially-explicit changes in sediment, TN and TP losses presented on maps of the ensemble median. The results are presented as differences between future periods and the reference period, expressed in kg·ha−1.
Mean annual sediment losses are projected to increase in both catchments, although the baseline levels are different: roughly three-fold higher values in the Upper Narew catchment, illustrating higher fraction of erosive soils in this region (Figure 10a). Projected changes follow, to some extent, changes in surface runoff (Figure 9b), showing an increase in sediment losses in winter and summer in the Upper Narew catchment, and a decrease in winter and an increase in summer in the Barycz catchment.
Mean annual TN losses in the historical period are nearly three-fold higher in the Barycz catchment (5.6 kg/ha) than in the Upper Narew catchment (1.9 kg/ha; Figure 10b). This is presumably related to different levels of agricultural intensification of both catchments (cf. Figure 2). An increase by 35% in TN losses is projected for the Barycz catchment in the far future, whereas an increase by 45% is projected for the Upper Narew catchments according to the ensemble median. In both catchments, but notably in the Barycz catchment, most of projected increase occurs in winter, which is in line with projections of percolation (Figure 8b) and baseflow (Figure 9c). While in the present climate, spring is the season with highest TN losses in the Barycz catchment, in the far future climate it is likely to be winter rather than spring.
Intensive agriculture of the Barycz catchment is likely to explain differences in the baseline period mean annual TP losses, i.e., values that are nearly two-fold higher than in the Upper Narew catchment (Figure 10c). The SWAT model projections of climate change impacts show moderate increases for the Upper Narew catchment and high uncertainty for the Barycz catchment. However, seasonal patterns are slightly different. In the Barycz catchment, the most distinct signal is projected in summer, forced by an increase in precipitation in this season. In contrast, in winter, TN losses are projected to decrease. In the Upper Narew catchment, increases are prevailing in winter and summer, whereas small decreases occur in spring. Autumn is the season with high model spread.
Projected sediment, TN and TP losses are characterized by high spatial variability (Figure 11, Figure 12 and Figure 13). For TN, the western part of the Upper Narew catchment (including sub-catchments of Horodnianka, Awissa and Orlanka) has the highest increase, exceeding 2 kg·ha−1 in the far future (Figure 12). In the Barycz catchment, spatial variability is even higher, and the north of the catchment, including sub-catchments of Orla, Dąbroczna and Polski Rów, has the highest increase, exceeding 5 kg·ha−1 in the far future. In both catchments, areas with the highest projected increase in TN losses coincide with areas with the most intensive agriculture (Figure 2). For both sediment and TP losses, the situation is more complex, i.e., there are areas with both increases and decreases in each catchment and projection horizon. This is presumably related to a different dominant transport pathway of sediment and TP (surface runoff), whose projected changes are also variable in space. Patchy patterns also reflect the fact that, as shown in Figure 10a,c, sediment and TP losses projections are actually highly uncertain, so within the ensemble there exist climate models for which the increases would be prevailing as well as models for which decreases would be prevailing.

4. Discussion

Projections of climate change derived from an ensemble of nine bias-corrected RCMs under RCP 4.5 consistently suggest an increase in temperature and precipitation over Poland [29,42]. An important feature of precipitation change for two catchments investigated in this paper, the Upper Narew located in the east and the Barycz located in the west, is that it is not seasonally constant, but is much higher for winter (by 13%–15% in the far future) and spring (by 21%–24% in the far future) than for summer and autumn (changes not statistically significant). This signal, uniform across two catchments, forces a complex response in hydrology. First, snow melt is projected to decrease considerably, but this decrease is distributed equally over winter and spring in the Barycz catchment, and occurs almost exclusively in spring in the Upper Narew catchment. Small increases (but with a low spread as well) in actual evapotranspiration are projected in both catchments. In contrast, increases in soil water content are blurred by high climate model spread, with exception of winter and spring, when the signal is stronger. Higher fraction of permeable soils in the Barycz catchment leads to a higher increase in percolation and baseflow as compared to the Upper Narew catchment. For annual surface runoff projections, the signal is overshadowed by the noise, but two different types of signals emerge in the seasonal projections: mild decreases in winter and spring and a mild increase in summer in the Barycz catchment, and an increase in winter and summer accompanied by a decrease in spring in the Upper Narew catchment.
Projected changes in sediment and nutrient losses result from a combination of reasons: climate change itself, projected changes in hydrology, as well as different soil conditions and land cover. Soil erosion was not a major problem in investigated catchments in the reference period and future projections suggest only moderate increases in sediment loss, occurring mainly in summer (both catchments) and winter (the Upper Narew, related to increased surface runoff). A sharper increase is projected in both catchments for TN losses. Here, much higher changes are projected for the Barycz catchment, which is already subject to a nearly three-fold higher TN losses than the Upper Narew catchment in the reference period. Seasonal changes in TN losses are connected to the dominant transport pathway of TN, which is sub-surface flow. The strongest increase is projected for winter season in the Barycz catchment, when percolation and baseflow are also projected to increase significantly. These results are overall consistent with the previous study carried out in Poland by Piniewski et al. [10], reporting projected increases in NO3-N leaching to groundwater and river loads in a small coastal catchment in north Poland, according to a single, “warmer and wetter” climate scenario. In contrast, Hesse et al. [26] reported that majority of Polish and Russian rivers in the Vistula Lagoon are expected to have decreased loads of NO3-N and NH4-N. On the other hand, the ENSEMBLES projections used in their study were less consistent in agreement on precipitation increase than the EURO-CORDEX projections used here.
A slightly different picture occurs for TP losses: at annual level, the uncertainty dominates in the Barycz catchment, whereas a weak and uncertain increase is projected in the Upper Narew catchment. Since surface runoff is the principal transport pathway of TP, the seasonal changes in TP losses follow those of surface runoff: an increase in summer in both catchments (but stronger in the Barycz catchment) and in winter season, an increase in the Upper Narew catchment and a decrease in the Barycz catchment. Previous impact studies in Polish catchments [10,26] reported more apparent increases in phosphorus (PO4-P) loads than in the present study.
This study has evaluated the pure effect of changing climate on water quantity and quality in two different lowland catchments in Poland, using state-of-the-art climate projections and estimating their uncertainty propagating by the hydrological model. Among several limitations of this study, one has to note that the results are based on a single RCP 4.5. It is well known that the current greenhouse gases emissions are on the RCP 8.5 trajectory, so it would be interesting to analyze the projections for this forcing as well. The same ensemble of climate models as the one used here, but driven by RCP 8.5, shows that both the rate of temperature increase and the rate of precipitation increases are expected to be higher for this RCP in both studied catchments [43]. Particularly, high increases in precipitation are projected in winter and spring seasons. Runoff change projections studied in another paper [46] demonstrate that the increases in runoff are also higher under RCP 8.5 than under RCP 4.5. This shows that the changes of precipitation are not compensated by the changes in temperature and evapotranspiration under warmer and wetter conditions. Even though water quality simulations have not been carried out under RCP 8.5 within this study, it can be expected that with a higher magnitude of increase in winter runoff, higher TN losses could be projected, whereas the results for sediment and TP losses are more uncertain. In fact, as shown in the study of Sun et al. [47], the effect of water quality parameter uncertainty on total suspended solids and total phosphorus load projections was generally greater than the effect of GCM uncertainties, particularly during high-load events.
For water resources management in Poland, the message is mixed. First, “wetter” scenarios on the Polish Plain may seem beneficial, as this region is generally known to be affected by water scarcity [48]. Particularly, in the Barycz catchment, increased water availability is likely to help sustain water-demanding fish pond systems. In the Upper Narew catchment, it may help sustain environmental flows through the wetlands of the Narew National Park [49]. Secondly, increased sub-surface runoff is expected to trigger an increase in TN losses, particularly in the Barycz catchment, characterized by a high fraction of land vulnerable to nitrate leaching. These results suggest that climate change may require additional adaptation actions on top of the “business-as-usual” actions aimed at non-point source pollution mitigation in Poland. Future studies should assess what kind of measures would help achieve the highest reduction in future TN losses, particularly in the more vulnerable Barycz catchment. An important finding of this study is that the majority of the projected increase in TN losses occurs in winter season, suggesting that maintaining vegetative cover on agricultural fields in winter could be a good solution [10,50,51].

Acknowledgments

Support of the project CHASE-PL (Climate change impact assessment for selected sectors in Poland) of the Polish-Norwegian Research Programme operated by the National Centre for Research and Development (NCBiR) under the Norwegian Financial Mechanism 2009–2014 in the frame of Project Contract No. Pol Nor/200799/90/2014 is gratefully acknowledged. The Institute of Meteorology and Water Management —State Research Institute (IMGW-PIB) is kindly acknowledged for providing the hydrometeorological data used in this work. The second author is grateful for support to the Alexander von Humboldt Foundation and the Ministry of Science and Higher Education of the Republic of Poland. Constructive comments from two anonymous reviewers that helped to improve the quality of the manuscript are highly appreciated.

Author Contributions

Mikołaj Piniewski, Ignacy Kardel, Stefan Ignar, Tomasz Okruszko, Rasmus Benestad and Raghavan Srinivasan developed the methodological framework. Paweł Marcinkowski, Mikołaj Piniewski and Ignacy Kardel developed the model setup. Paweł Marcinkowski and Mikołaj Piniewski performed model calibration. Mikołaj Piniewski, Paweł Marcinkowski, Mateusz Szcześniak, and Ignacy Kardel run the model scenarios. Paweł Marcinkowski and Mikołaj Piniewski wrote the manuscript. Paweł Marcinkowski, Mikołaj Piniewski and Ignacy Kardel created the art work.

Conflicts of Interest

The authors declare no conflict of interest.

References

  1. Pachauri, R.K.; Meyer, L.A. Climate Change 2014: Synthesis Report. Contribution of Working Groups I, II and III to the Fifth Assessment Report of the Intergovernmental Panel on Climate Change; IPCC: Geneva, Switzerland, 2014; p. 151. [Google Scholar]
  2. Jacob, D.; Petersen, J.; Eggert, B.; Alias, A.; Christensen, O.B.; Bouwer, L.M.; Braun, A.; Colette, A.; Déqué, M.; Georgievski, G.; et al. EURO-CORDEX: New high-resolution climate change projections for European impact research. Reg. Environ. Chang. 2014, 14, 563–578. [Google Scholar] [CrossRef]
  3. Alfieri, L.; Burek, P.; Feyen, L.; Forzieri, G. Global warming increases the frequency of river floods in Europe. Hydrol. Earth Syst. Sci. 2015, 19, 2247–2260. [Google Scholar] [CrossRef] [Green Version]
  4. Roudier, P.; Andersson, J.C.M.; Donnelly, C.; Feyen, L.; Greuell, W.; Ludwig, F. Projections of future floods and hydrological droughts in Europe under a +2 °C global warming. Clim. Chang. 2016, 135, 341–355. [Google Scholar] [CrossRef] [Green Version]
  5. Papadimitriou, L.V.; Koutroulis, A.G.; Grillakis, M.G.; Tsanis, I.K. High-end climate change impact on European runoff and low flows—Exploring the effects of forcing biases. Hydrol. Earth Syst. Sci. 2016, 20, 1785–1808. [Google Scholar] [CrossRef]
  6. Krysanova, V.; Kundzewicz, Z.W.; Piniewski, M. Assessment of climate change impact on water resoures. In Handbook of Applied Hydrology, 2nd ed.; Singh, V.P., Ed.; McGraw-Hill Education: New York, NY, USA, 2016; p. 1440. [Google Scholar]
  7. Teutschbein, C.; Seibert, J. Regional Climate Models for Hydrological Impact Studies at the Catchment Scale: A Review of Recent Modeling Strategies: Regional climate models for hydrological impact studies. Geogr. Compass 2010, 4, 834–860. [Google Scholar] [CrossRef] [Green Version]
  8. Martínková, M.; Hesse, C.; Krysanova, V.; Vetter, T.; Hanel, M. Potential impact of climate change on nitrate load from the Jizera catchment (Czech Republic). Phys. Chem. Earth Parts ABC 2011, 36, 673–683. [Google Scholar] [CrossRef]
  9. Meier, H.E.M.; Müller-Karulis, B.; Andersson, H.C.; Dieterich, C.; Eilola, K.; Gustafsson, B.G.; Höglund, A.; Hordoir, R.; Kuznetsov, I.; Neumann, T.; et al. Impact of Climate Change on Ecological Quality Indicators and Biogeochemical Fluxes in the Baltic Sea: A Multi-Model Ensemble Study. AMBIO 2012, 41, 558–573. [Google Scholar] [CrossRef] [PubMed]
  10. Piniewski, M.; Kardel, I.; Giełczewski, M.; Marcinkowski, P.; Okruszko, T. Climate Change and Agricultural Development: Adapting Polish Agriculture to Reduce Future Nutrient Loads in a Coastal Watershed. AMBIO 2014, 43, 644–660. [Google Scholar] [CrossRef] [PubMed]
  11. Ahmadi, M.; Records, R.; Arabi, M. Impact of climate change on diffuse pollutant fluxes at the watershed scale. Hydrol. Process. 2014, 28, 1962–1972. [Google Scholar] [CrossRef]
  12. Huttunen, I.; Lehtonen, H.; Huttunen, M.; Piirainen, V.; Korppoo, M.; Veijalainen, N.; Viitasalo, M.; Vehviläinen, B. Effects of climate change and agricultural adaptation on nutrient loading from Finnish catchments to the Baltic Sea. Sci. Total Environ. 2015, 529, 168–181. [Google Scholar] [CrossRef] [PubMed]
  13. Glavan, M.; Ceglar, A.; Pintar, M. Assessing the impacts of climate change on water quantity and quality modelling in small Slovenian Mediterranean catchment—Lesson for policy and decision makers: Assessing the impacts of climate change on river basin modelling. Hydrol. Process. 2015, 29, 3124–3144. [Google Scholar] [CrossRef]
  14. Mehdi, B.; Ludwig, R.; Lehner, B. Evaluating the impacts of climate change and crop land use change on streamflow, nitrates and phosphorus: A modeling study in Bavaria. J. Hydrol. Reg. Stud. 2015, 4, 60–90. [Google Scholar] [CrossRef]
  15. Gombault, C.; Madramootoo, C.A.; Michaud, A.; Beaudin, I.; Sottile, M.-F.; Chikhaoui, M.; Ngwa, F. Impacts of climate change on nutrient losses from the Pike River watershed of southern Québec. Can. J. Soil Sci. 2015, 95, 337–358. [Google Scholar] [CrossRef]
  16. Malsy, M.; Flörke, M.; Borchardt, D. What drives the water quality changes in the Selenga Basin: Climate change or socio-economic development? Reg. Environ. Chang. 2016, 16, 209–216. [Google Scholar] [CrossRef]
  17. Ye, L.; Grimm, N.B. Modelling potential impacts of climate change on water and nitrate export from a mid-sized, semiarid watershed in the US Southwest. Clim. Chang. 2013, 120, 419–431. [Google Scholar] [CrossRef]
  18. Cousino, L.K.; Becker, R.H.; Zmijewski, K.A. Modeling the effects of climate change on water, sediment, and nutrient yields from the Maumee River watershed. J. Hydrol. Reg. Stud. 2015, 4, 762–775. [Google Scholar] [CrossRef]
  19. Jha, M.K.; Gassman, P.W.; Panagopoulos, Y. Regional changes in nitrate loadings in the Upper Mississippi River Basin under predicted mid-century climate. Reg. Environ. Chang. 2015, 15, 449–460. [Google Scholar] [CrossRef]
  20. Arheimer, B.; Dahné, J.; Donnelly, C. Climate Change Impact on Riverine Nutrient Load and Land-Based Remedial Measures of the Baltic Sea Action Plan. AMBIO 2012, 41, 600–612. [Google Scholar] [CrossRef] [PubMed]
  21. Records, R.M.; Arabi, M.; Fassnacht, S.R.; Duffy, W.G.; Ahmadi, M.; Hegewisch, K.C. Climate change and wetland loss impacts on a western river’s water quality. Hydrol. Earth Syst. Sci. 2014, 18, 4509–4527. [Google Scholar] [CrossRef]
  22. Molina-Navarro, E.; Trolle, D.; Martínez-Pérez, S.; Sastre-Merlín, A.; Jeppesen, E. Hydrological and water quality impact assessment of a Mediterranean limno-reservoir under climate change and land use management scenarios. J. Hydrol. 2014, 509, 354–366. [Google Scholar] [CrossRef]
  23. Mehdi, B.; Lehner, B.; Gombault, C.; Michaud, A.; Beaudin, I.; Sottile, M.-F.; Blondlot, A. Simulated impacts of climate change and agricultural land use change on surface water quality with and without adaptation management strategies. Agric. Ecosyst. Environ. 2015, 213, 47–60. [Google Scholar] [CrossRef]
  24. Jayakody, P.; Parajuli, P.B.; Cathcart, T.P. Impacts of climate variability on water quality with best management practices in sub-tropical climate of USA. Hydrol. Process. 2014, 28, 5776–5790. [Google Scholar] [CrossRef]
  25. El-Khoury, A.; Seidou, O.; Lapen, D.R.; Que, Z.; Mohammadian, M.; Sunohara, M.; Bahram, D. Combined impacts of future climate and land use changes on discharge, nitrogen and phosphorus loads for a Canadian river basin. J. Environ. Manag. 2015, 151, 76–86. [Google Scholar] [CrossRef] [PubMed]
  26. Hesse, C.; Krysanova, V.; Stefanova, A.; Bielecka, M.; Domnin, D.A. Assessment of climate change impacts on water quantity and quality of the multi-river Vistula Lagoon catchment. Hydrol. Sci. J. 2015, 1–22. [Google Scholar] [CrossRef]
  27. Van der Linden, P.; Mitchell, J.F.B. ENSEMBLES: Climate Change and Its Impacts: Summary of Research and Results from the ENSEMBLES Project—European Environment Agency; Met Office Hadley Centre: Exeter, UK, 2009.
  28. Pazdro, Z.; Kozerski, B. Hydrogeologia Ogólna; Wyd. 4. uzup.; Wydaw. Geol: Warsaw, Poland, 1990. (In Polish) [Google Scholar]
  29. Piniewski, M.; Szcześniak, M.; Kardel, I.; Berezowski, T.; Okruszko, T.; Srinivasan, R.; Schulerd, V.; Kundzewicz, Z.W. Hydrological modelling of the Vistula and Odra river basins using SWAT. Hydrol. Sci. J. 2017. accepted. [Google Scholar]
  30. Central Statistical Office Local Data Bank—Statistics for Year 2010. Available online: http://bdl.stat.gov.pl (accessed on 20 November 2016).
  31. Map of Hydrological Division of Poland in the scale 1:10 000; General of National Water Management Authority: Warsaw, Poland, 2013.
  32. Miatkowski, Z.; Smarzyńska, K. Dynamika zmian stężenia związków azotu w wodach górnej Zgłowiączki w latach 1990–2011. Woda-Śr.-Obsz. Wiej. 2014, 3, 99–111. Available online: http://www.itep.edu.pl/wydawnictwo/woda/zeszyt_47_2014/artykuly/Miatkowski%20Smarzynska.pdf (accessed on 20 November 2016). [Google Scholar]
  33. Ilnicki, P.; Gorecki, K.; Lewandowski, P.; Farat, R. Long-Term Variability of Total Nitrogen and Total Phosphorus Concentration and Load in the South Part of the Baltic Sea Basin. Fresenius Environ. Bull. 2016, 25, 3923–3940. [Google Scholar]
  34. Banaszuk, P.; Wysocka-Czubaszek, A. Phosphorus dynamics and fluxes in a lowland river: The Narew Anastomosing River System, NE Poland. Ecol. Eng. 2005, 25, 429–441. [Google Scholar] [CrossRef]
  35. Marcinkowski, P.; Piniewski, M.; Kardel, I.; Srinivasan, R.; Okruszko, T. Challenges in modelling of water quantity and quality in two contrasting meso-scale catchments in Poland. J. Water Land Dev. 2016, 31, 97–111. [Google Scholar] [CrossRef]
  36. Neitsch, S.; Arnold, J.; Kiniry, J.; Williams, J. Soil and Water Assessment Tool Theoretical Documentation Version 2009. Technical Report TR-406; Texas A&M University: College Station, TX, USA, 2011; Available online: http://swat.tamu.edu/media/99192/swat2009-theory.pdf (accessed on 1 November 2016).
  37. Berezowski, T.; Szcześniak, M.; Kardel, I.; Michałowski, R.; Okruszko, T.; Mezghani, A.; Piniewski, M. CPLFD-GDPT5: High-resolution gridded daily precipitation and temperature data set for two largest Polish river basins. Earth Syst. Sci. Data 2016, 8, 127–139. [Google Scholar] [CrossRef]
  38. Szcześniak, M.; Piniewski, M. Improvement of Hydrological Simulations by Applying Daily Precipitation Interpolation Schemes in Meso-Scale Catchments. Water 2015, 7, 747–779. [Google Scholar] [CrossRef]
  39. Gupta, H.V.; Kling, H.; Yilmaz, K.K.; Martinez, G.F. Decomposition of the mean squared error and NSE performance criteria: Implications for improving hydrological modelling. J. Hydrol. 2009, 377, 80–91. [Google Scholar] [CrossRef]
  40. Moriasi, D.N.; Arnold, J.G.; Van, L.; Bingner, R.L.; Harmel, R.D.; Veith, T.L. Model evaluation guidelines for systematic quantification of accuracy in watershed simulations. Trans. ASABE 2007, 50, 885–900. [Google Scholar] [CrossRef]
  41. Piniewski, M.; Marcinkowski, P.; Kardel, I.; Giełczewski, M.; Izydorczyk, K.; Frątczak, W. Spatial Quantification of Non-Point Source Pollution in a Meso-Scale Catchment for an Assessment of Buffer Zones Efficiency. Water 2015, 7, 1889–1920. [Google Scholar] [CrossRef]
  42. Mezghani, A.; Dobler, A.; Haugen, J.H. CHASE-PL Climate Projections: 5-km Gridded Daily Precipitation & Temperature Dataset (CPLCP-GDPT5). Available online: http://data.4tu.nl/repository/uuid:e940ec1a-71a0-449e-bbe3-29217f2ba31d (accessed on 10 November 2016).
  43. Piniewski, M.; Szcześniak, M.; Mezghani, A.; Kundzewicz, Z.W. Regional projections of temperature and precipitation changes: Robustness and uncertainty aspects. Meteorol. Z. 2017. accepted. [Google Scholar]
  44. Gudmundsson, L.; Bremnes, J.B.; Haugen, J.E.; Engen-Skaugen, T. Technical Note: Downscaling RCM precipitation to the station scale using statistical transformations—A comparison of methods. Hydrol. Earth Syst. Sci. 2012, 16, 3383–3390. [Google Scholar] [CrossRef]
  45. Knutti, R.; Sedláček, J. Robustness and uncertainties in the new CMIP5 climate model projections. Nat. Clim. Chang. 2013, 3, 369–373. [Google Scholar] [CrossRef]
  46. Piniewski, M.; Szcześniak, M.; Huang, S.; Kundzewicz, Z.W. Projections of runoff in the Vistula and the Odra river basins with the help of the SWAT Model. Hydrol. Res. 2017. under review. [Google Scholar]
  47. Sun, N.; Yearsley, J.; Baptiste, M.; Cao, Q.; Lettenmaier, D.P.; Nijssen, B. A spatially distributed model for assessment of the effects of changing land use and climate on urban stream quality: Development of a Spatially Distributed Urban Water Quality Model. Hydrol. Process. 2016, 30, 4779–4798. [Google Scholar] [CrossRef]
  48. Kundzewicz, Z.W. Water problems of central and eastern Europe—A region in transition. Hydrol. Sci. J. 2001, 46, 883–896. [Google Scholar] [CrossRef]
  49. Szporak-Wasilewska, S.; Piniewski, M.; Kubrak, J.; Okruszko, T. What we can learn from a wetland water balance? Narew National Park case study. Ecohydrol. Hydrobiol. 2015, 15, 136–149. [Google Scholar] [CrossRef]
  50. Thorup-Kristensen, K.; Nielsen, N.E. Modelling and measuring the effect of nitrogen catch crops on the nitrogen supply for succeeding crops. Plant Soil 1998, 203, 79–89. [Google Scholar] [CrossRef]
  51. Laurent, F.; Ruelland, D. Assessing impacts of alternative land use and agricultural practices on nitrate pollution at the catchment scale. J. Hydrol. 2011, 409, 440–450. [Google Scholar] [CrossRef]
Figure 1. Location of investigated catchments: (A) the Barycz catchment; and (B) the Upper Narew catchment. Three gauges labeled with red font (Osetno and Korzeńsko for the Barycz and Żółtki for the Upper Narew) are used for showing plots of measured flow and concentrations in Figure 2.
Water 09 00156 g001
Figure 2. Mean monthly statistics of hydrological and water quality parameters for two stations (cf. Figure 1 for location) in the Barycz catchment (the Barycz river at Osetno and the Orla river at Korzeńsko) and one in the Upper Narew catchment (the Narew river at Żółtki): (a) runoff; (b) sediment concentration; (c) NO3–N; (d) TN; (e) PO4–P; and (f) TP. Joint period of flow data (source: Institute of Meteorology and Water Management—National Research Institute) availability (1961–1986) was selected for calculations of runoff. In the case of water quality parameters (source: General Inspectorate of Environmental Protection), the period of available data was 1992–2013, with typically one measurement per month, although many years had missing values.
Water 09 00156 g002
Figure 3. Spatial comparison of selected human pressure characteristics of the Upper Narew (UN) and the Barycz (B) catchment. Top panels show fertilizer rates, bottom left panel shows the crop structure and bottom right panel shows discharges from the wastewater treatment plants in both catchments.
Water 09 00156 g003
Figure 4. Multi-model ensemble projections of annual and seasonal average temperature for the near (NF) and the far (FF) future under RCP 4.5 in comparison to the historical (Hist) period. B stands for the Barycz catchment and UN stands for the Upper Narew catchment.
Water 09 00156 g004
Figure 5. Multi-model ensemble projections of annual and seasonal precipitation for the near (NF) and the far (FF) future under RCP 4.5 in comparison to the historical (Hist) period. B stands for the Barycz catchment and UN stands for the Upper Narew catchment.
Water 09 00156 g005
Figure 6. Multi-model ensemble projections of monthly snow melt (between November and April) for the near and the far future under RCP 4.5 in comparison to the historical period.
Water 09 00156 g006
Figure 7. Multi-model ensemble projections of annual and seasonal actual evapotranspiration (ET) for the near (NF) and the far (FF) future under RCP 4.5 in comparison to the historical (Hist) period. B stands for the Barycz catchment and UN stands for the Upper Narew catchment.
Water 09 00156 g007
Figure 8. Multi-model ensemble projections of annual and seasonal soil water content (a) and percolation (b) for the near (NF) and the far (FF) future under RCP 4.5 in comparison to the historical (Hist) period. B stands for the Barycz catchment and UN stands for the Upper Narew catchment.
Water 09 00156 g008
Figure 9. Multi-model ensemble projections of annual and seasonal water yield (a) and its two major components, surface runoff (b) and baseflow (c), for the near (NF) and the far (FF) future under RCP 4.5 in comparison to the historical (Hist) period. B stands for the Barycz catchment and UN stands for the Upper Narew catchment.
Water 09 00156 g009
Figure 10. Multi-model ensemble projections of annual and: seasonal sediment (a); TN (b); and TP (c) losses, for the near (NF) and the far (FF) future under RCP 4.5 in comparison to the historical (Hist) period. B stands for the Barycz catchment and UN stands for the Upper Narew catchment.
Water 09 00156 g010
Figure 11. Projected change in sediment losses (total amount of sediment transported from sub-basins to streams) in the Upper Narew and Barycz catchments in the near and far future according to the ensemble median.
Water 09 00156 g011
Figure 12. Projected change in TN losses (TN transported by all types of pathways from sub-basins to streams) in the Upper Narew and Barycz catchments in the near and far future according to the ensemble median.
Water 09 00156 g012
Figure 13. Projected change in TP losses (TP transported by all types of pathways form sub-basins to streams) in the Upper Narew and Barycz catchments in the near and far future according to the ensemble median.
Water 09 00156 g013
Table 1. Selected studies assessing climate change impact on water quantity and quality. The last four columns show the dominant direction of simulated effects of climate change on different parameters (see legend below the table).
ReferenceCountry/RegionArea (km2)Hydrological ModelClimate Models (Emission Scenarios)Future HorizonsEffect on:
FlowSediment LoadTN * LoadTP * Load
[11]USA248SWAT112(3)2015–2034
2045–2064
2080–2099
------
[20]Baltic Sea Basin1,700,000HYPE16(4)1971–2000
2071–2100
↓↑ ↓↑↓↑
[18]USA17,000SWAT19(4)2046–2065
2080–2099
[25]Canada3858SWAT1(1)2025-2050 --- NO3↑PO4
[13]Slovenia30SWAT6(1)2001–2030
2031–2060
2061–2090
[15]Canada630SWAT6(1)2041-2070
[26]Poland, Russia20,730SWIM15(1)1971–2000
2011–2040
2041–2070
2071–2098
↓NO3↑PO4
[12]Finland301,300VEMALA3(1)1971–2000
2010–2039
2040–2069
[24]USA7588SWAT3(3)2046–2065
2080–2099
---
[19]USA492,000SWAT1(1)2046–2065 ↓NO3
[16]Mongolia447,000WaterGAP31(1)2071–2100
[8]Czech Republic2180SWIM2(1)2011–2040
2041–2070
2071–2100
↑NO3
[23]Canada629SWAT3(1)2041–2070---
[14]Germany980SWAT7(2)2041–2070 ↑NO3
[9]Baltic Sea Basin1,700,000HYPE/STAT8(2)1961–2099
[22]Spain88SWAT11(3)2046–2065
2081–2100
↓NO3↓↑
[10]Poland482SWAT1(1)2050 ↑NO3↑PO4
[21]USA4000SWAT6(2)2030–2059↓↑↓↑↓↑↓↑
[17]USA505SWAT1(1)2011–2040
2041–2070
2071–2100
↓NO3
Notes: Legend: ↑ mostly increase; ↓ mostly decrease; ↓↑ mixed pattern; --- no significant changes. * Whenever NO3 or PO4 is given in parentheses, it means that the study dealt with either NO3–N or PO4–P, and not TN and TP.
Table 2. Comparison of selected human pressure characteristics of the Upper Narew and the Barycz catchment (sources: [30,31]).
CategoryParameterBaryczUpper Narew *
AgricultureFraction of arable land (%)4723
Fraction of grassland (%)918
Mineral nitrogen fertilizer rate (kg·ha−1)9145
Mineral phosphorus fertilizer rate (kg·ha−1)1710
Livestock density (LSU·ha−1)1.210.73
UrbanPopulation density (persons·km−2)8936
Fraction of high density urban land cover (%)1.20.45
Number of point sources (per 1000 km2)7.13.5
Specific wastewater discharge from WWTPs (dm3·s−1·km−2)0.090.03
Specific sediment load from WWTPs (Mg year−1·km−2)0.30.03
Specific TN load from WWTPs (kg·year−1·km−2)47.536.9
Specific TP load from WWTPs (kg·year−1·km−2)8.22.8
Water RetentionFish ponds volume (103 m3/km2)12.91.3
Reservoir volume (103 m3/km2)-20
Note: * All parameters are calculated exclusively for the Polish part of the Upper Narew catchment.
Table 3. Data items and sources used to create the SWAT model setup of the Upper Narew and Barycz catchments.
Data TypeSourceResolution/Scale
DEM PLCODGiK10 m
DEM BYSRTM v4.1 (NASA)Horizontal 90 m;
Vertical 16 m
Rivers and lakes PLMPHP2010 (IMGW-PIB)1:10,000
Land Cover PLLandsat 8
CLC 2006 (GDOS)
30 m
100 m
Land Cover BYMODIS Landcover500 m
Soil map PLIUNG-PIB1:100,000
Soil map BYHWSD v 1.21:1,000,000
Climate PL/BYCPLFD-GDPT55 km
Atmospheric deposition of nitrogen (dry and wet)GIOS 1 station for the Upper Narew/3 stations for the Barycz (outside the catchment)
Agricultural statisticsGUSCommune level
Notes: Abbreviations: BY, Belarus; CLC, Corine Land Cover; CODGiK, Central Agency for Geodetic and Cartographic Documentation; CPLFD-GDPT5, CHASE-PL Forcing Data–Gridded Daily Precipitation & Temperature Dataset–5 km [37]; DEM, Digital Elevation Model; GDOS, General Directorate of the Environmental Protection; GIOS, Chief Inspectorate of Environmental Protection; GUS, Central Statistical Office of Poland; HWSD, Harmonized World Soil Database; IMGW-PIB, Institute of Meteorology and Water Management, National Research Institute; IUNG-PIB, Institute of Soil Science and Plant Cultivation, National Research; MPHP, Hydrographic Map of Poland; NASA, National Aeronautics; PL, Poland; SRTM, Shuttle Radar Topography Mission.

