1. Introduction
An urban water management that considers environmental problems for sustainable development has become a major issue due to climate change and rapid urbanization. Low impact development (LID) based on best management practices (BMPs) has become a prevalent means of coping with frequent natural disasters [
1,
2,
3,
4,
5].
Several hydrologic models that analyze various hydrologic, hydraulic, and water quality processes with certainty have been developed [
6]. However, very few of these models can simulate LID performances. In particular, the Storm Water Management Model (SWMM), one of the most widely used dynamic rainfall-runoff simulation models for urban areas, developed by the United States Environmental Protection Agency (USEPA), was updated to assess the hydrologic performance of LID types in 2009. The latest version of EPA SWMM 5.1 supports a function that compares two simulation results of before and after the installation of LID structure.
Several extended programs based on the U.S. EPA’s (Environmental Protection Agency) SWMM have been developed to simulate the hydrologic cycle. These models have been widely applied for real urban structure designs after the functional execution of high-quality GUI (Graphical User Interface) and 2D and 3D numerical analyses. The PCSWMM is well known for its intelligent tools that are supported through different GIS platforms [
7], and it offers a sensitivity-based radio tuning calibration (SRTC) tool that allows users to easily determine SWMM parameter sensitivity to identify optimum parameters [
8,
9,
10]. The XPSWMM is another commonly used program that simplifies and combines different data sources drawn from experts in multiple fields [
11,
12]. In addition, the System for Urban Stormwater Treatment and Analysis INtegration (SUSTAIN) is a comprehensive simulation-optimization model that can evaluate the effectiveness of diverse green infrastructure (GI) applications [
13,
14]. Recent studies on LID applications incorporating the above-mentioned decision support systems (DSSs) based on the SWMM show that these applications effectively mitigate flood risk, reduce runoff and pollutant levels, improve the management of sewage systems, and aid in other management activities in urban areas [
15,
16,
17,
18,
19].
Although various DSSs based on the EPA SWMM, such as the PCSWMM, XP-SWMM, Info-SWMM, and others present unique advantages, they cannot consider the best physical specifications of LID design and planning fitted to a study area. While the EPA SWMM, PCSWMM and XP-SWMM serve as powerful tools for analyzing the hydrologic effects of various LID types, they cannot simultaneously simulate multiple scenarios of LID designs and planning. Although the PCSWMM’s SRTC tool can determine the sensitivity of model output to geological factors, it cannot be used to derive the best combination of LID properties. The SUSTAIN offers multi-scale applications and cost optimization analyses of LID plans, but it cannot identify LID design considerations fitted to the study area.
Various forms of uncertainty, however, are expected to arise when realizing LID, as there are numerous types of LID and various physical parameters that can define any single LID structures [
7]. Optimal determinations of proper LID types and their physical specifications are very difficult to determine because they are all cross-dependent. That is, different LID types and capacities can have the same effect on the hydrologic aspects. Therefore, many studies have shown that watershed characteristics [
20], LID designs [
21], LID locations [
13,
22], coordination of LIDs [
23] and capacities [
24] are important factors that heavily affect hydrological results at the LID design and planning stage [
25]. Furthermore, to address such uncertainties, fuzzy logic analyses have been used to improve spatial decision making when LID practices are employed [
26,
27,
28]. Frameworks for the optimization of LID size have been developed and applied in six different LID scenarios [
11]. That is, previous studies have particularly focused on the application of LID types and LID planning strategies to determine the best ways to improve quantity and quality levels. However, there are few studies that address the development of a systematic procedure to decide the values for LID design specification and how many LID structures should be used for the target at the LID planning.
Therefore, this study used a web-based DSS for the EPA’s SWMM 5.1, referred to as the Water Management Analysis Module (WMAM) which had been developed by [
29], to determine the most effective LID design and planning specifications for a real area. The WMAM is applied to a real urban region of university campus of Malaysia. Thus, this study provides a best solution on what values for physical parameters will be the best for a specified LID type and what capacities can achieve the particular objective using WMAM.
2. Materials and Methods
2.1. Procedure of This Study
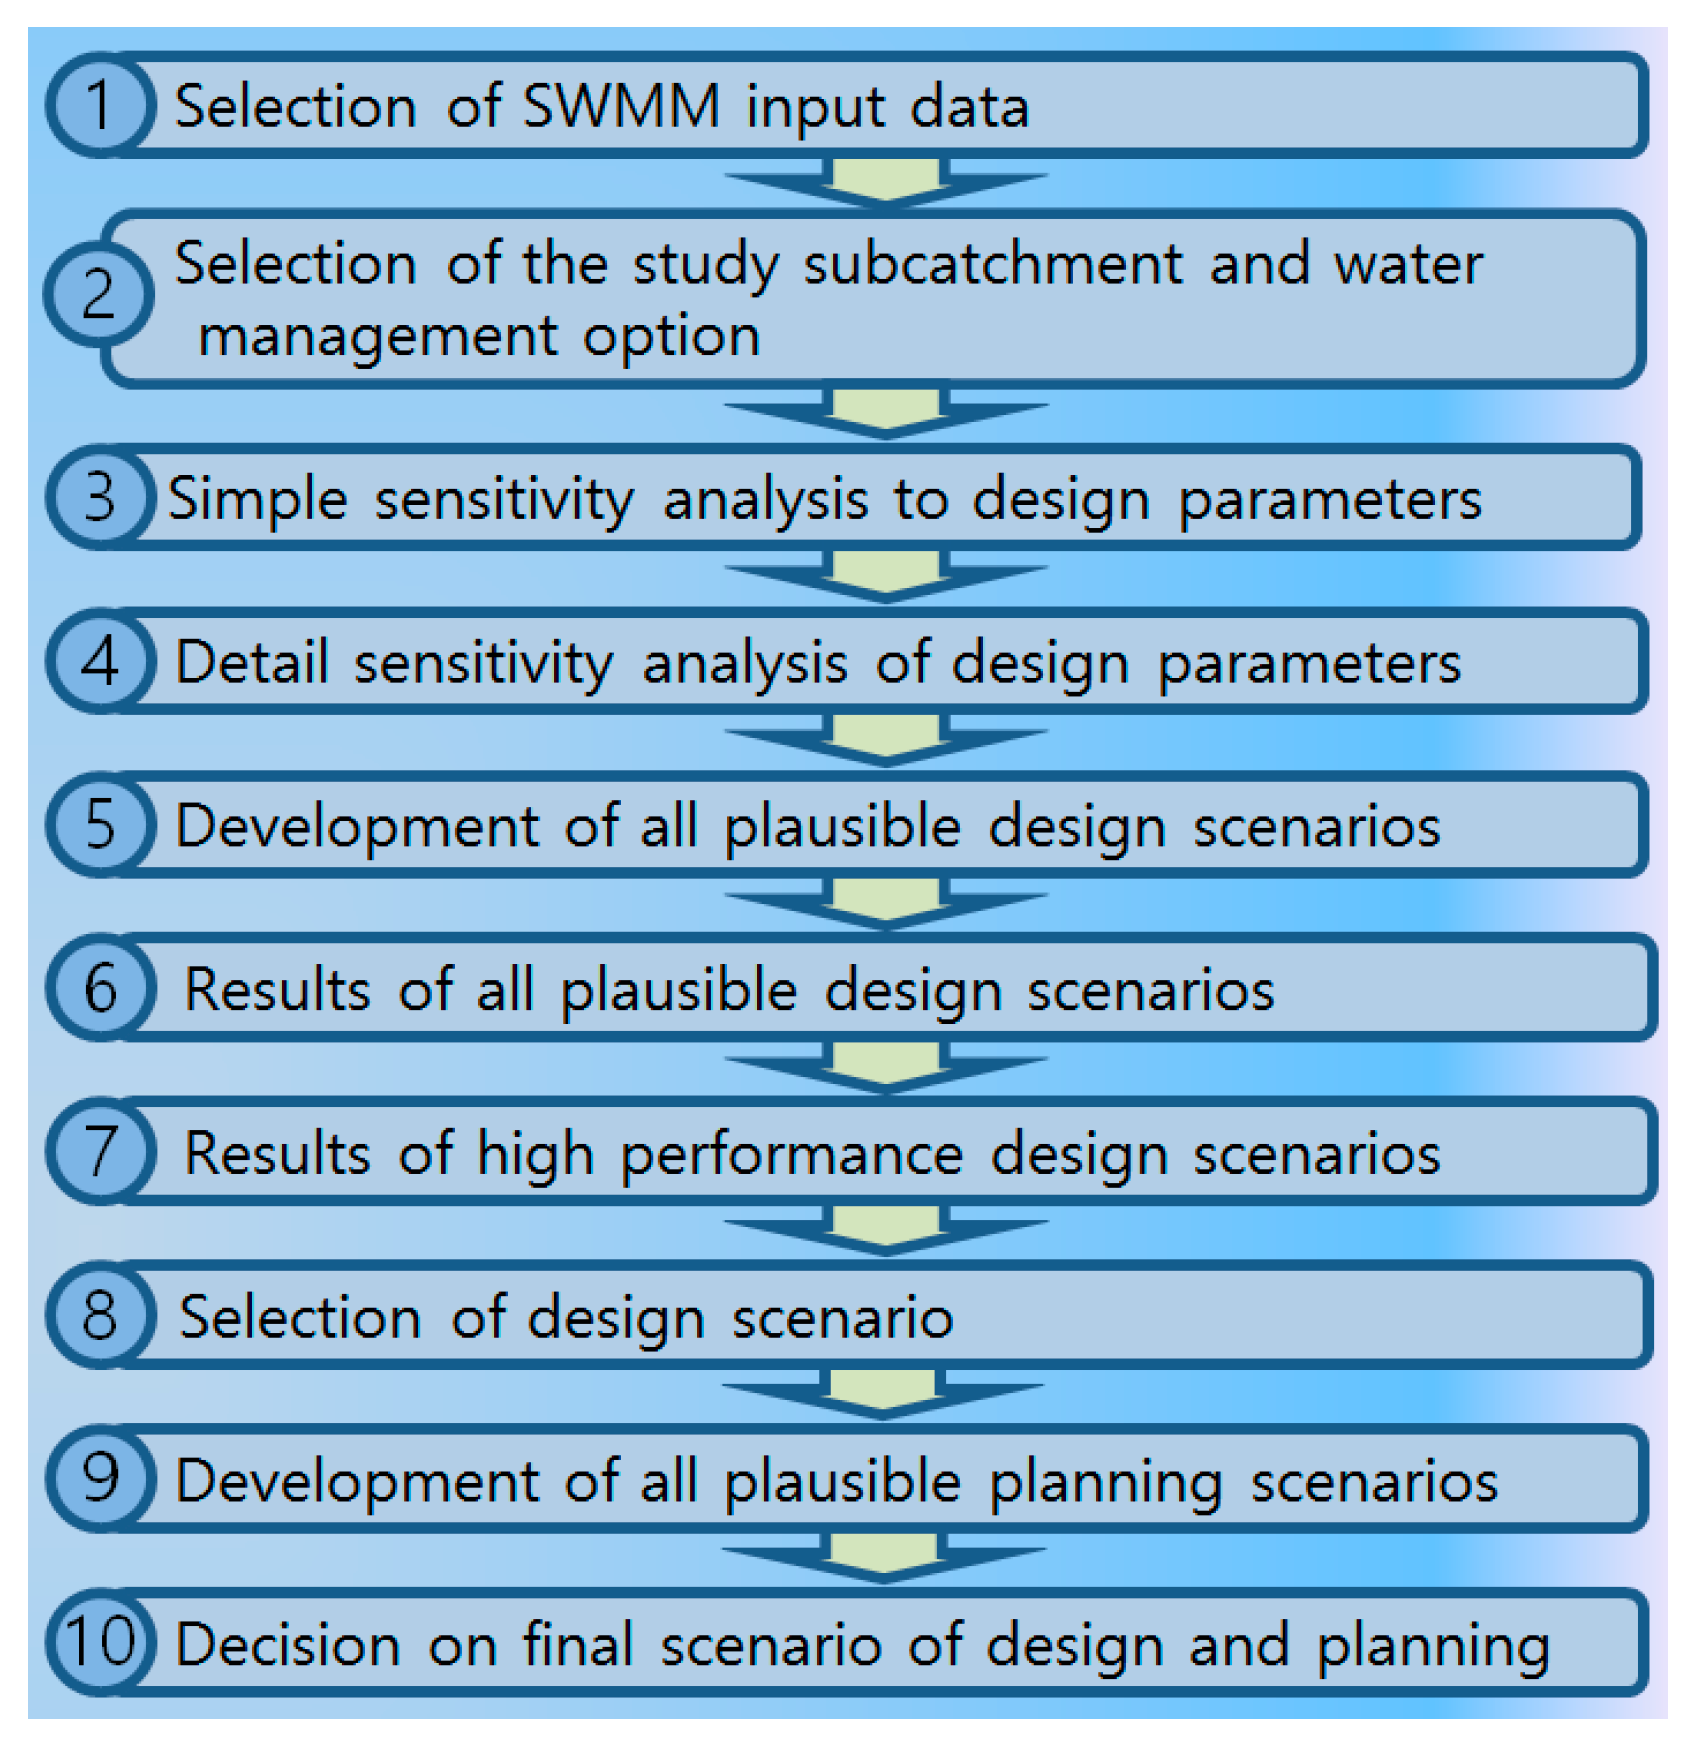
The procedure developed through this study uses EPA SWMM software to identify effective design and planning specifications of LID structures based on automatic high-quality SWMM simulation results. This framework systemized in the WMAM involves ten steps as shown in
Figure 1.
For the WMAM, an SWMM input file, containing any LID structure should be constructed for the real region. Therefore, users must load a SWMM input file describing a real region in Step 1. Then, the WMAM determines the availability of this SWMM input file. In the second step, the WMAM automatically recognizes all sub-catchments and all established LID structures, and then users select the target sub-catchment and LID type for LID design and planning.
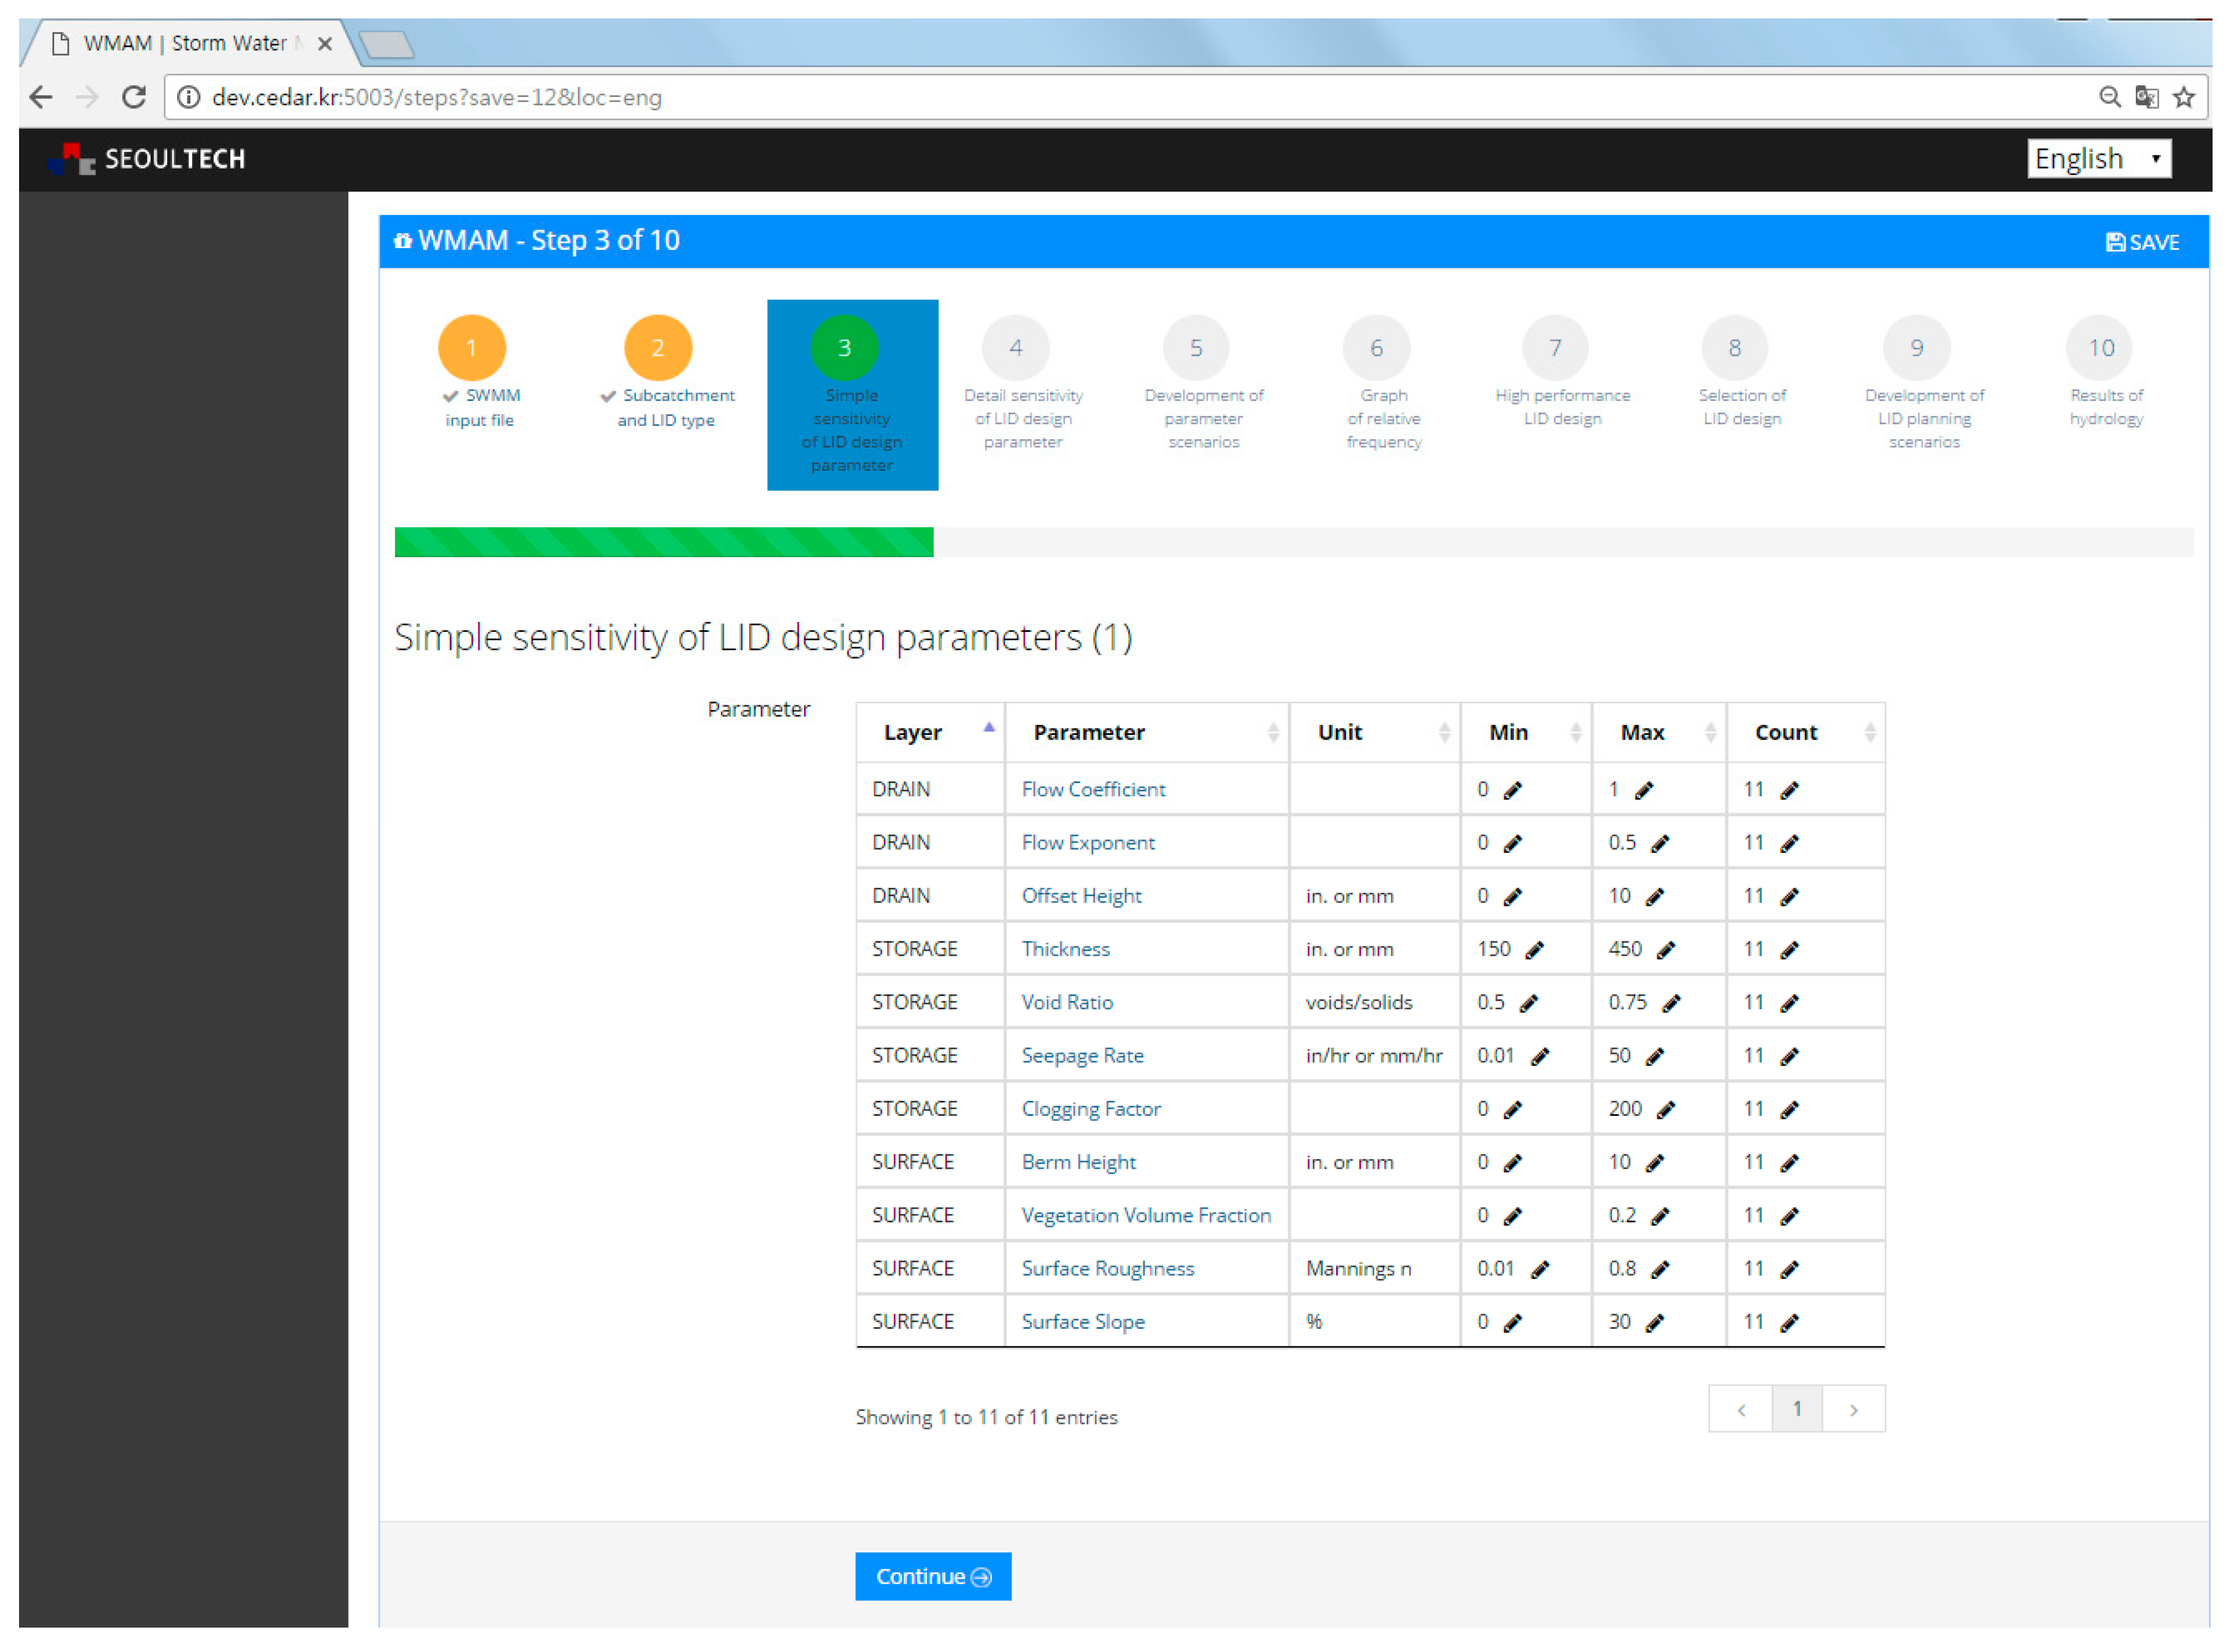
In step 3, users enter all available value ranges of LID design parameters to determine degrees of sensitivity to hydrological cycle components. As the required parameters differ depending on the LID type, the necessary parameters automatically appear according to the LID selected. Three values consisting of minimum and maximum parameter values and the number of scenarios considered are then determined. These values define all available scenarios for the sensitivity analysis. In Step, 4 the WMAM automatically simulates all of the selected scenarios defined in Step 3 with a single click and then analyze the simulated results. Hydrological component values (e.g., total runoff, peak runoff, runoff coefficient, infiltration loss, surface outflow, final storage, etc.) are illustrated in graphs and tables. Users can determine which design parameters of LID structures influence the hydrological results most, and critical parameters can be identified in the next step. This procedure plays a key role by largely reducing the number of meaningful combined scenarios. In step 5, LID design parameters selected during the fourth step automatically appear, and users are then required to re-enter all considered value ranges of the selected LID design parameters to determine the performance of the hydrological variables. Target scenarios are defined in the same way that they are defined in Step 3. However, the combined scenarios of all LID design parameters are included during this step. Therefore, proper values should be selected carefully. In step 6, the resulting relative frequency graph appears after calculations are completed, and users can then determine the distribution of hydrological performance. Another calculation can be conducted if users wish to redefine narrower value ranges of LID design parameters for a specific LID design. In step 7, users can recalibrate all results to a specific hydrological component and the top performance scenario can be checked and individually downloaded. In step 8, users must select the most effective scenario for LID design. As some scenarios provide the same performance for all hydrological components, users can select one based on other criteria (e.g., economic efficiency and social preferences).
In step 9, users must enter all available value ranges of LID planning parameters to determine degrees of sensitivity to hydrological components. Scenarios are defined in the same way that they are in Step 5. However, the combined scenarios of all LID planning parameters are included in this step. As the several LID planning parameters are closely related to construction costs, appropriate values should be considered. In the final step, relative frequency graphs are revealed based on the selected hydrological components. Users can thus identify appropriate LID planning parameters with satisfactory performance.
2.2. Description of Study Area
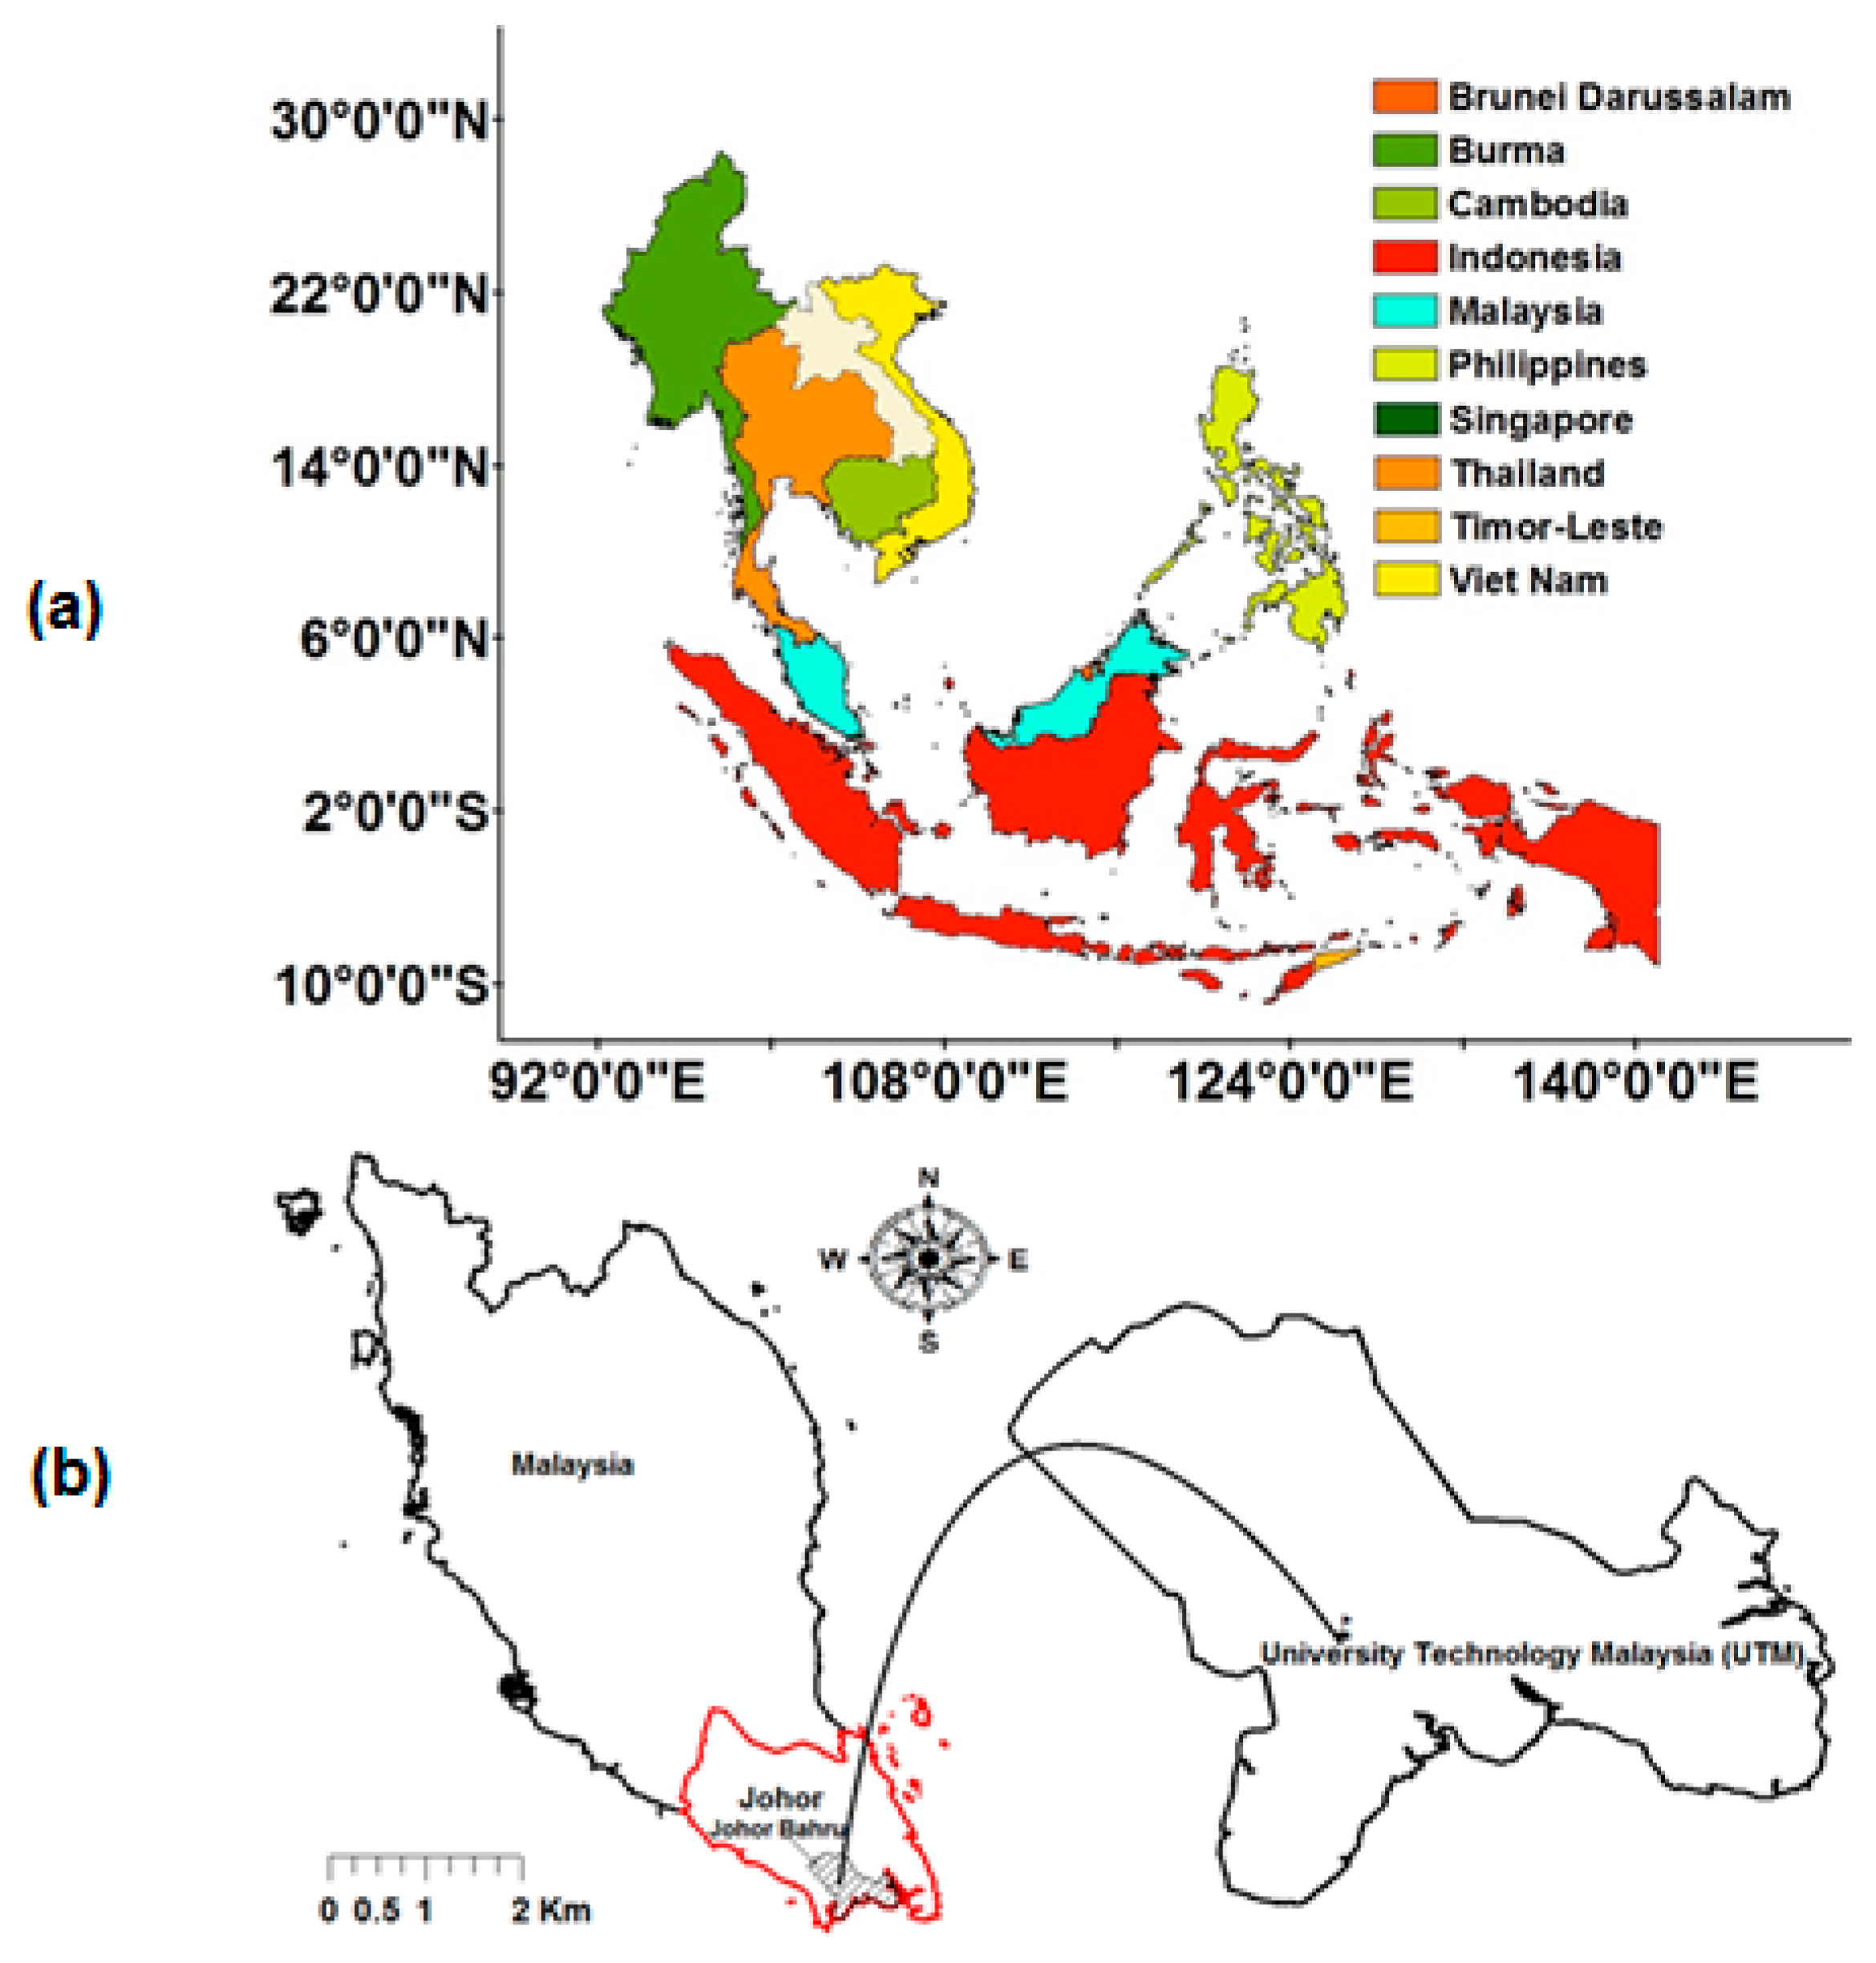
The study catchment is the main campus of University Technology Malaysia (UTM) which is located in Skudai, Johor Bahru, Malaysia. The location of Malaysia in Southeast Asia (
Figure 2a) and location of study area are shown in
Figure 2b. UTM covers an area of 11.45 km
2 with 24% built-up area. The topography of the study area is hilly with several small natural and manmade streams. Most of the streams are ephemeral-type in nature, where they tend to be depleted during the prolonged dry periods. The climate in the study area is generally humid with uniform high temperature, high relative humidity and moderate rainfall throughout the year. The temperature ranges from 21 °C to 32 °C. The Northeast monsoon from November to March brings heavy rain with an average depth of 2363 mm per year and strong wind. Year to year variation of mean rainfall is 18.6%. Due to either relatively short duration with high intensity or a longer duration rainfall for several days with lower intensity, the basin often experiences flooding. Maximum one-hour rainfall in the station was recorded as 158 mm in 11 August 1982. Due to its close proximity to the equator, the relative humidity ranges between 85% and 87% while air temperature ranges between 22 and 32 °C all year round.
2.3. Hydrologic Simulation Model
EPA SWMM5 is a dynamic rainfall-runoff simulation model that can be used for either single events or long-term (continuous) simulation of runoff quantity and quality. The model is highly recommended for the runoff quantity and quality simulation in urban areas [
7]. The hydrologic component of SWMM5.1 receives precipitation and generates runoff, while the routing portion transports the runoff through a system of pipes, channels, storage treatment devices, pumps, and regulators. SWMM5 tracks the quantity of generated flow in each sub watershed, as well as flow rate and flow depth in each channel during the simulation period. SWMM5.1 is also used to quantify the performance benefits of LID practices [
30].
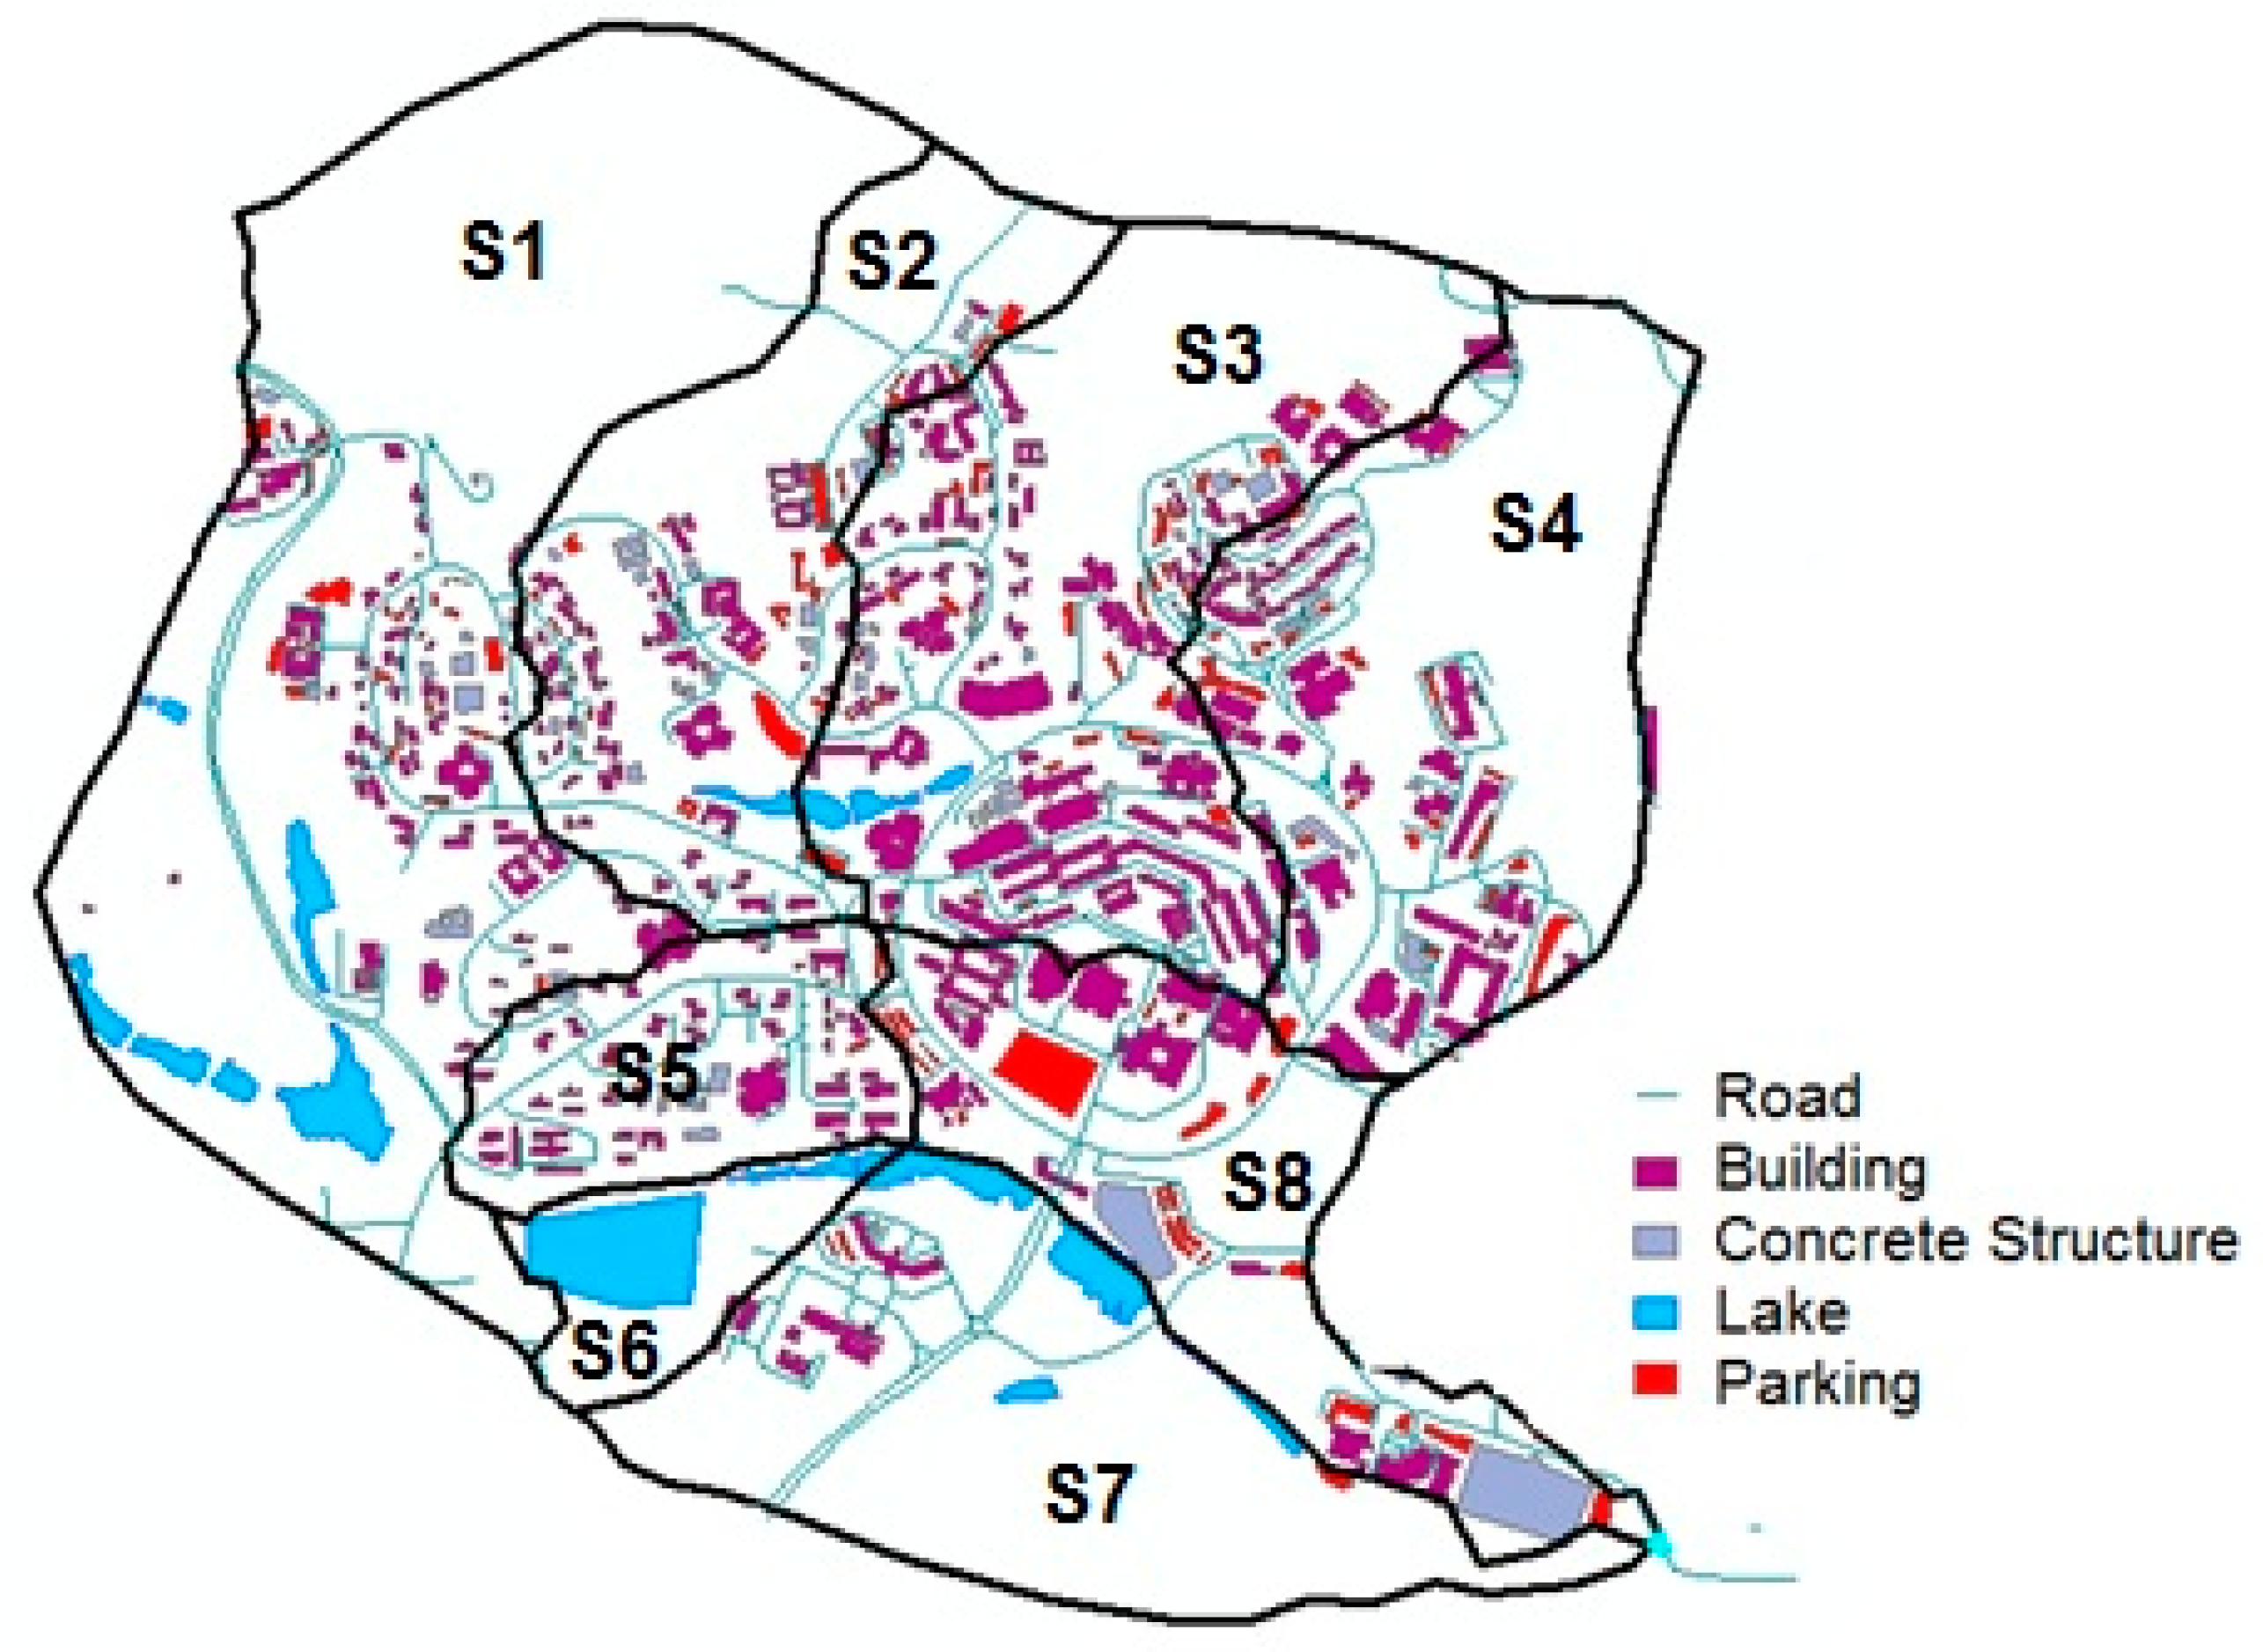
SWMM5.1 requires three basic types of information, i.e., physical characteristics of the catchment, rainfall and infiltration data for modelling. Most data were collected from Google Earth and drainage maps. However, some field inspections were carried out to confirm some information. The study area was delineated into eight sub catchments with five major junctions. The locations of roads, buildings, lake, concrete structures, parking’s within each catchment are shown
Figure 3. It can be seen that catchment S1 is the largest in area and S6 is the smallest in area.
The kinematic wave routing method with 30-s time steps was used for calculating runoff transport. Daily rainfall data for 2 July 2016, to 10 July 2016, for the UTM observatory were used in this analysis. The major aim for selecting the daily rainfall event from 2 July to 10 July 2016 was to tract the main rainfall event occurred during that period. The maximum rainfall event of each day from 2 to 10 July was considered in the analysis. Major rainfall events were studied, as they proved more appropriate for the LID performance analysis [
31]. The infiltration loss on pervious area was estimated by Horton equation. Due to lack field samples, the infiltration rates derived by [
32] based on the soil types were used. In addition, the basic SWMM parameters are introduced from the previous study [
33]. The groundwater, which is normally modelled in the SWMM is not considered due to unavailability of data.
2.4. LID Design and Planning Parameters in SWMM5.1
EPA SWMM5 has a hydrologic simulation function of eight LID types including permeable pavement, rain gardens, green roofs, street planters, rain barrels, infiltration trenches, rooftop disconnections, and vegetative swales. However, WMAM can analyze six LIDs while rooftop disconnections were not added to the SWMM when WMAM was developed and vegetative swales were excluded because SWMM cannot represent water conveyance of vegetative swales [
29]. In this study, an infiltration trench was considered to the study region. For the reference scenario, the parameters values for LID design and planning were fixed according to [
7] as shown in
Table 1.
2.5. Sensitivity Analysis
Sensitivity analysis is one of the most important steps in hydrological modelling that deals with the uncertainties arising from different input sources [
34]. For any LID type, several design parameters are interactively associated. Consequently, it is very important to identify the best LID design specifications by combining highly effective parameters. The choice for the best design parameters is generally very difficult when some design parameters are considered because the numbers of all combinations with all available design parameters become tremendous. Therefore, it would be very useful to reduce the number of considerable parameters by screening several insensitive parameters via sensitivity analysis.
Sensitivity analysis can be used to measure the effect of parametric variations on the output. Using the following equation, parametric sensitivity can be mathematically expressed as
where
represents the sensitivity of parameter
,
is the output function, and
is the parameter of the system response function under consideration.
However, as hydrologic models have become more complex, derivation of parametric sensitivity analysis has become difficult and often impossible to compute. The general definition can be changed to another form by simply considering the input and output functions. Specifically, component sensitivity can be used to measure the effect of varying input function
I on the output function
Q [
35].
Therefore, input sensitivity can be defined as the rate of change in one output factor with respect to change in input factors such as berm height, thickness, void ratio, and so on.
This analysis is based on one-at-a-time sensitivity measure, which is the simplest approach for analyzing sensitivity by repeating an entire simulation and by varying one parameter at a time while holding the others fixed [
36]. Using the one-at-a time sensitivity measure helps the hydrologist to identify most influential parameters. This study used water management analysis module (WMAM) that is a decision support system (DSS) for the design and planning of LID structures based on the EPA’s SWMM 5.1. WMAM has the capability to generate and simulate all input files for sensitivity analysis of the all available LID design parameters with a user-friendly control window (
Figure 4).
3. Results and Discussions
In this study, WMAM was used to compare the simulation results of various scenarios before and after LID structure installation. Infiltration trench was proposed to be constructed in the selected sub-catchments. Peak and total runoffs, and infiltration were compared at every case. Since LID structures are designed to reduce peak runoff rate by infiltrating, storing, and filtering, it can be considered to be much more effective when peak runoff becomes lower and total infiltration gets higher. At first, the study area without infiltration trench was simulated. Then, the infiltration trench was designed and planned at the sub-catchment S1 and S6 using SWMM LID control and usage editors, manually. Finally, WMAM was used to derive the best design and planning for the infiltration trench at the sub-catchments, S1 and S6 among various scenarios.
3.1. Hydrologic Comparison with and Without LID Structure
For the reference case, EPA SWMM5.1 was used to simulate the hydrological cycle in two stages. In the first stage, the hydrologic components were quantified without the LID installation while in the second stage LID structure was included in SWMM simulation. Hence, the LID performances for two different scenarios were compared. Obtained results (
Table 2) from simulation without LID structure showed that sub-catchment (S1) had the highest peak discharge 144.57 (LPS) while sub-catchment (S6) had the lowest peak discharge 4.49 (LPS) as compared with the peak flows of other catchments. On the other hand, lowest flow was observed in S6 where the area is also small. It can also be observed that runoff is also high in catchments where impervious area is high. For example, S3 has highest impervious area where runoff is relatively high as compared with other catchments. Therefore, S1 and S6 were considered as extremes for further analysis.
In the second scenario, an infiltration trench was planned and designed for the sub-catchment, S1 and S6. Several design parameters such as storage height and surface roughness and several planning parameters such as unit area and quantity were assumed and estimated based on field conditions as shown in
Table 1. Obtained results with and without LID, i.e., infiltration trench, are presented in
Table 3. It showed that LID structure was able to reduce the runoff in selected catchments. The total runoff was found to reduce from 1.72 (mm) to 1.62 (mm) with a peak runoff of 144.57 (LPS) to 136.66 (LPS) and 1.74 (mm) to 1.71 (mm) with a peak runoff of 15.60 (LPS) to 14.72 (LPS) for two study sub-catchments, S1 and S6, respectively.
3.2. Sensitivity Analysis Using WMAM
The better performances of LID, i.e., the design specifications for infiltration trench can be achieved by many simulations in EPA’s SWMM 5.1. However, these simulations are the time-consuming process and therefore, it would be very difficult to identify the best design and planning specifications. Therefore, the user-friendly interface of WMAM is used to reduce the time and efforts and clearly identify the best design parameters through its automatic system.
Before characterizing the differences of various LID design specifications on reducing peak discharge, the sensitivity analysis was conducted for eleven design parameters of infiltration trench. Minimum values, maximum values, and the number (
n) of considered values for eleven design parameters were used to define all feasible scenarios, and then 11 ×
n times scenarios were automatically simulated and analyzed using WMAM. The details of these parameters are provided in
Table 1.
WMAM can conduct the sensitivity analysis for each parameter while other parameters are fixed. The results of sensitivity analysis given in
Table 4 showed that the flow coefficient, flow exponent, offset height, and void ratio are enough sensitive to distinctly influence the hydrologic component. It can be noticed that all feasible scenarios for design parameters have been differently inserted and peak runoff values are compared. For example, inserted void ratio values for the sensitivity analysis reached a minimum of 0.5 and a maximum of 0.75 and were found to be sensitive, while peak runoffs from WMAM results varied from 136.66 to 146.51 (LPS) and 14.72 to 15.78 (LPS) for S1 and S6, respectively.
3.3. Determination of LID Design Parameters
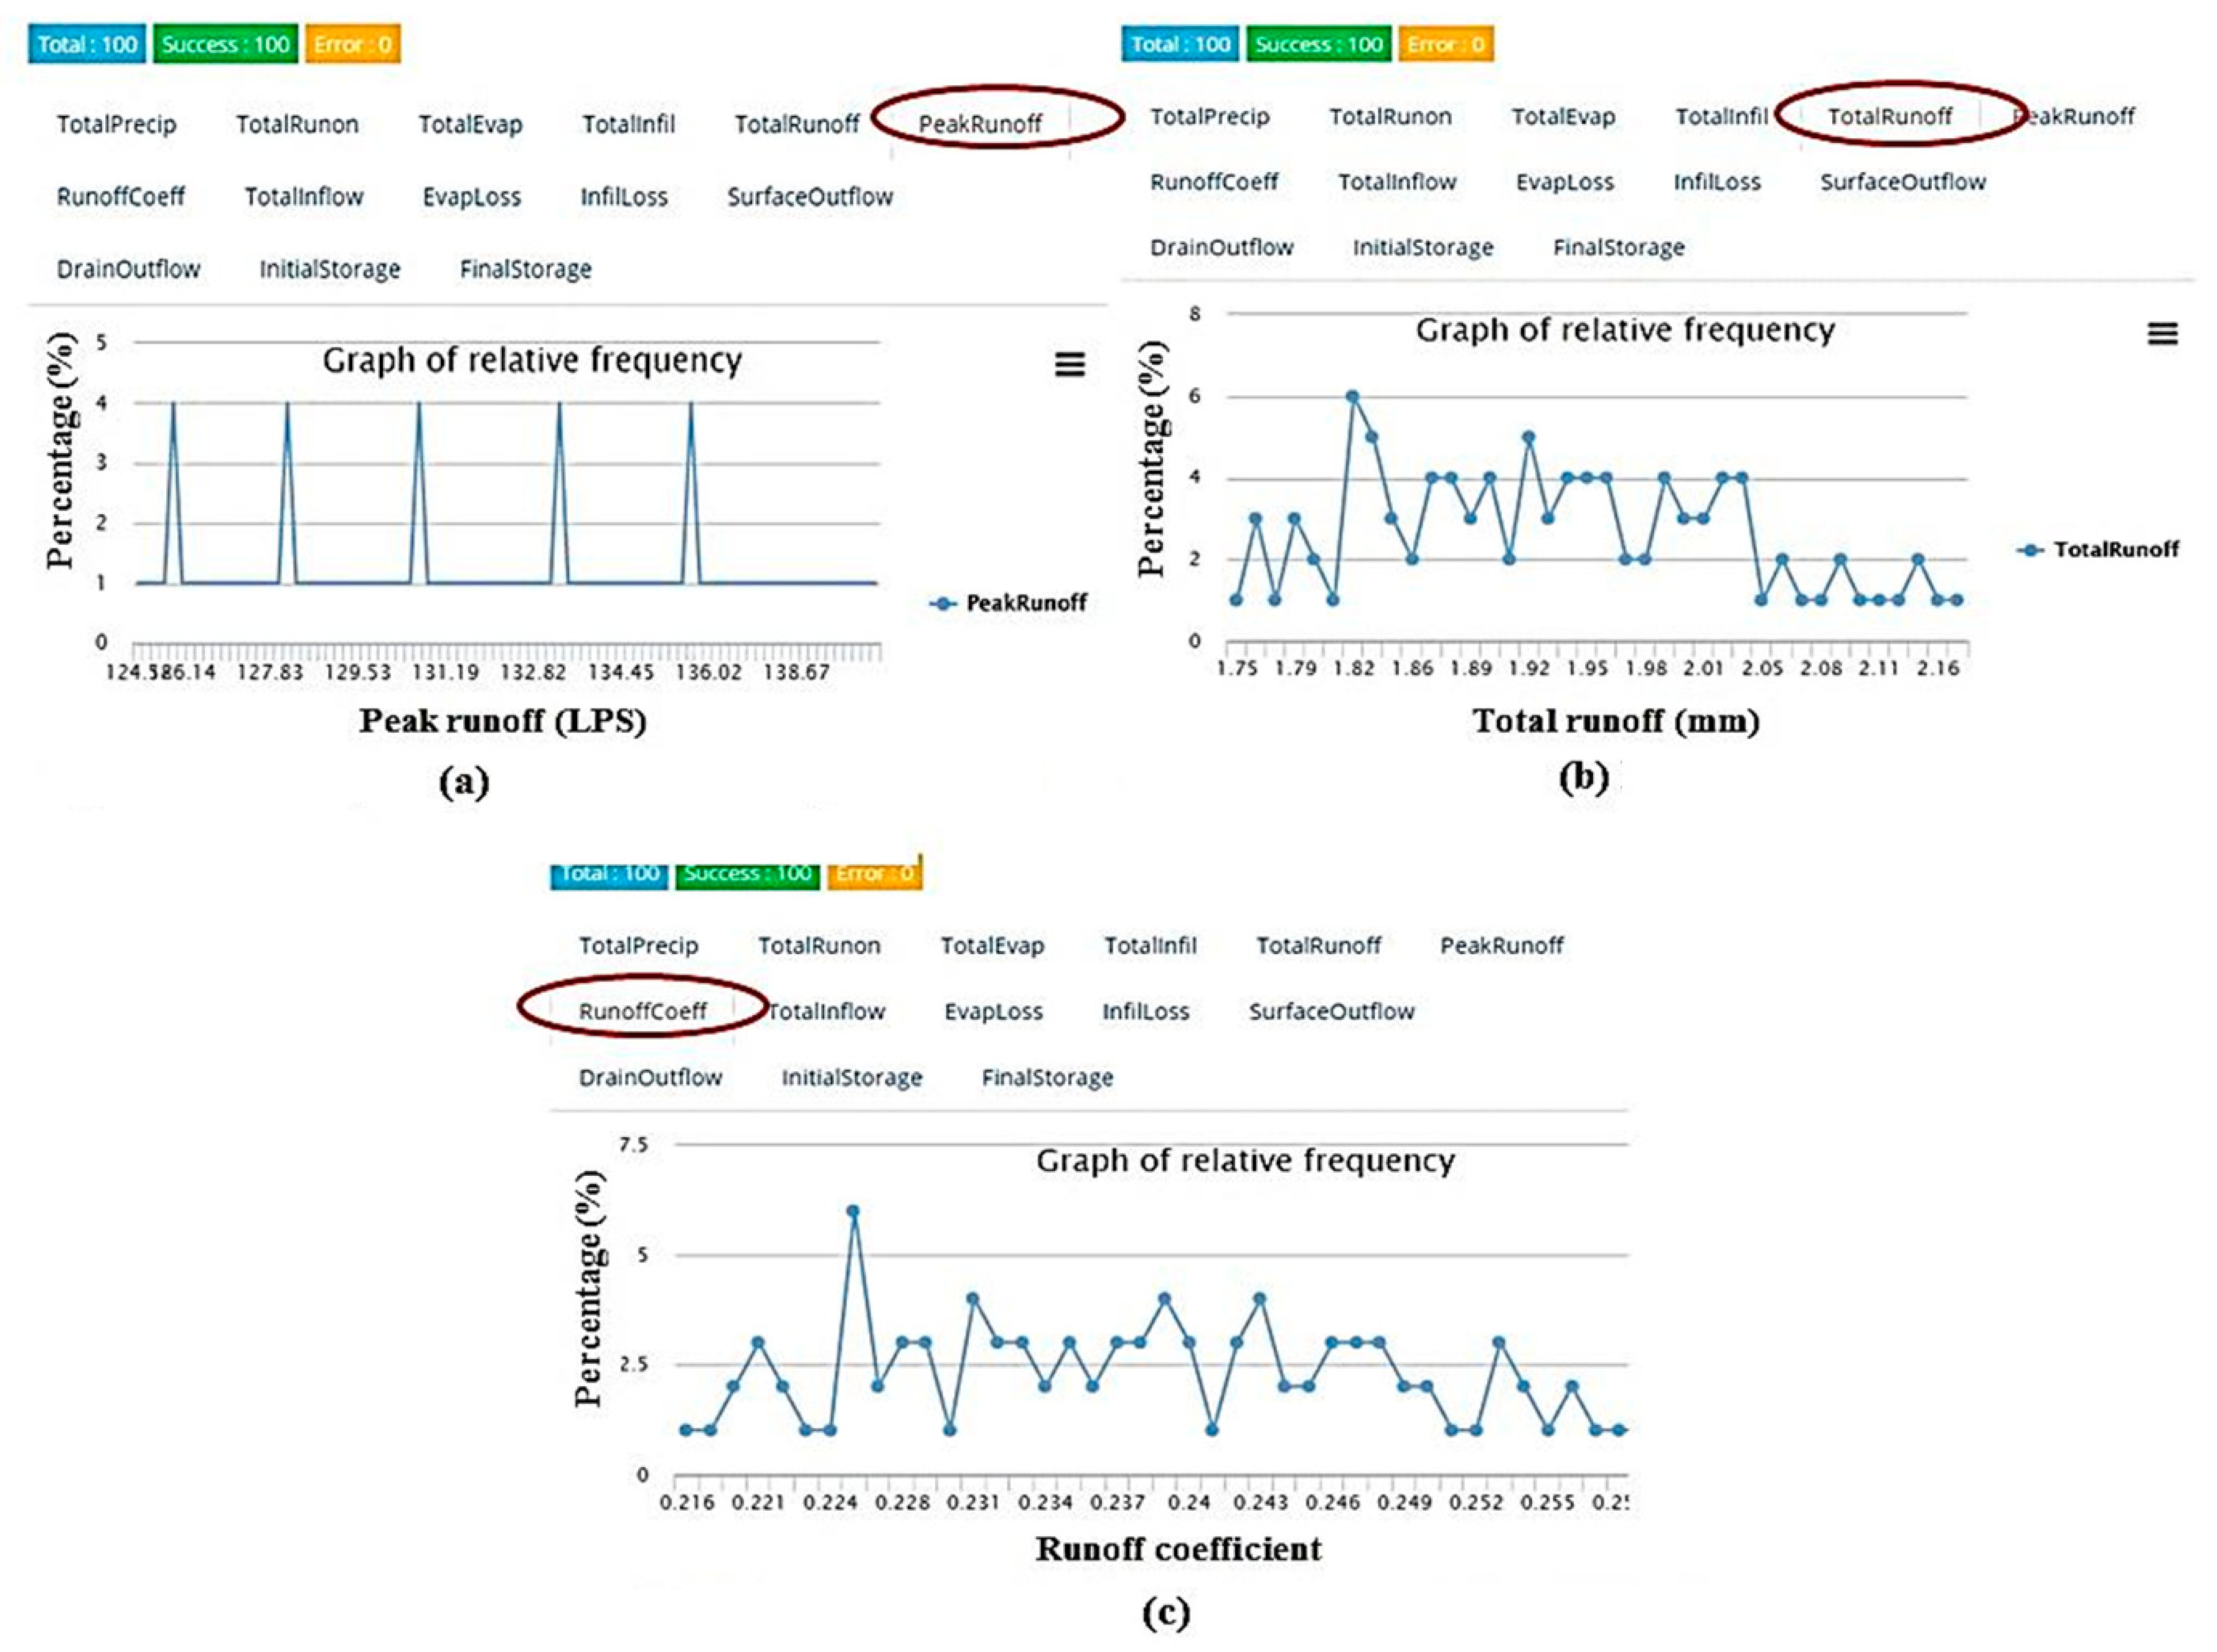
One of the major advantages of WMAM is its capability to generate and simulate all combinations of several sensitive LID design parameters using multiple scenario analysis. After considering all plausible design parameters, 100 combinations were generated and automatically simulated. The relative frequency analysis normally used to determine the performance from selected combinations is shown in
Figure 5 for sub-catchment S1 which resulted from WMAM. In
Figure 5a, it can be seen that among 100 scenarios, one of the scenarios showed the lowest value of peak runoff, 124.58 (LPS). As a result, four sensitive parameters were identified to provide the best combinations of LID design. The relative frequency graphs also show other hydrologic component results e.g., total runoff (
Figure 5b), runoff coefficient (
Figure 5c), final storage, surface outflow, and infiltration loss, etc. The minimum total runoff and the runoff coefficient from the best scenario correspond to the results of peak runoff, because they are the minimum values, 1.75 mm and 0.216, respectively. The results for the sub-catchment S2 can be also checked at this stage. In this study, the derived scenario for LID design specifications also showed the best performances in the sub-catchment S2.
The outstanding specification of infiltration trench are depicted in
Table 5 which shows that the lowest value of peak discharge for S1 was 124.58 (LPS) achieved when the flow coefficient (FC), flow exponent (FE), offset height (OH), and void ratio (VR) were 0.5, 0.2, 10 (mm), and 0.75, respectively. Similarly, lowest peak discharge for the sub-catchment, S6, is achieved as 13.42 (LPS) when the flow coefficient (FC), flow exponent (FE), offset height (OH), and void ratio (VR) were 0.5, 0.2, 10 (mm), and 0.75, individually. Similar results were also similarly shown for other parameters like total runoff, runoff coefficient, final storage, surface outflow, infiltration loss, etc.
3.4. Sensitivity Analysis for LID Planning Parameters
Finally, all specifications of plausible LID planning scenarios were considered in this study as given in
Table 6. It provides the minimum and maximum values of each LID parameter for two sub-catchments, S1 and S6. It can be seen that three numbers such as (4600, 5600 and 3) are entered the area of each unit (AoEU) values; values used to combine scenarios will be (4600, 4900 and 5400). Similarly, (0, 5, 10, 15, 20 and 25) was used as the percentage of initially saturated (PoIS), (30, 70) was used as the percentage of impervious area treated (PoIAT). Then, (20, 24) was applied as the number of units (NoU), and (0, 10) was used as the surface width per unit (SWPU). Finally, 0 and 1, which are positive/negative terms of the return all outflow to previous area (RAOTPA), were used as different values to generate LID planning parameter scenarios. Overall, 288 SWMM input files were automatically generated and simulated using WMAM.
Among the case of 100 combinations of design parameters and 288 combinations of planning parameters, the best design and planning scenario for the infiltration trench in sub-catchment S1 was derived. Best LID design and planning scenarios are given in
Table 7 for S1 and S6. Finally, the result obtained from the infiltration trench, initially designed in SWMM was compared with optimal infiltration trench designed based on WMAM scenario are provided in
Table 8. It can be seen that the peak discharge is reduced in WMAM by 20.95% and 17.50% for S1 and S6, respectively. Area of S6 is much smaller than S1, and since the rate of LID planned in area S1 and S6 are equal, the reduction of total runoff is much higher in S1 and, similarly, the total infiltration increased more in S1. The peak discharge can be further reduced by installing more LIDs. Overall, the LID showed the reduction in flow and the systematic assessment of WMAM made the analysis more robust.
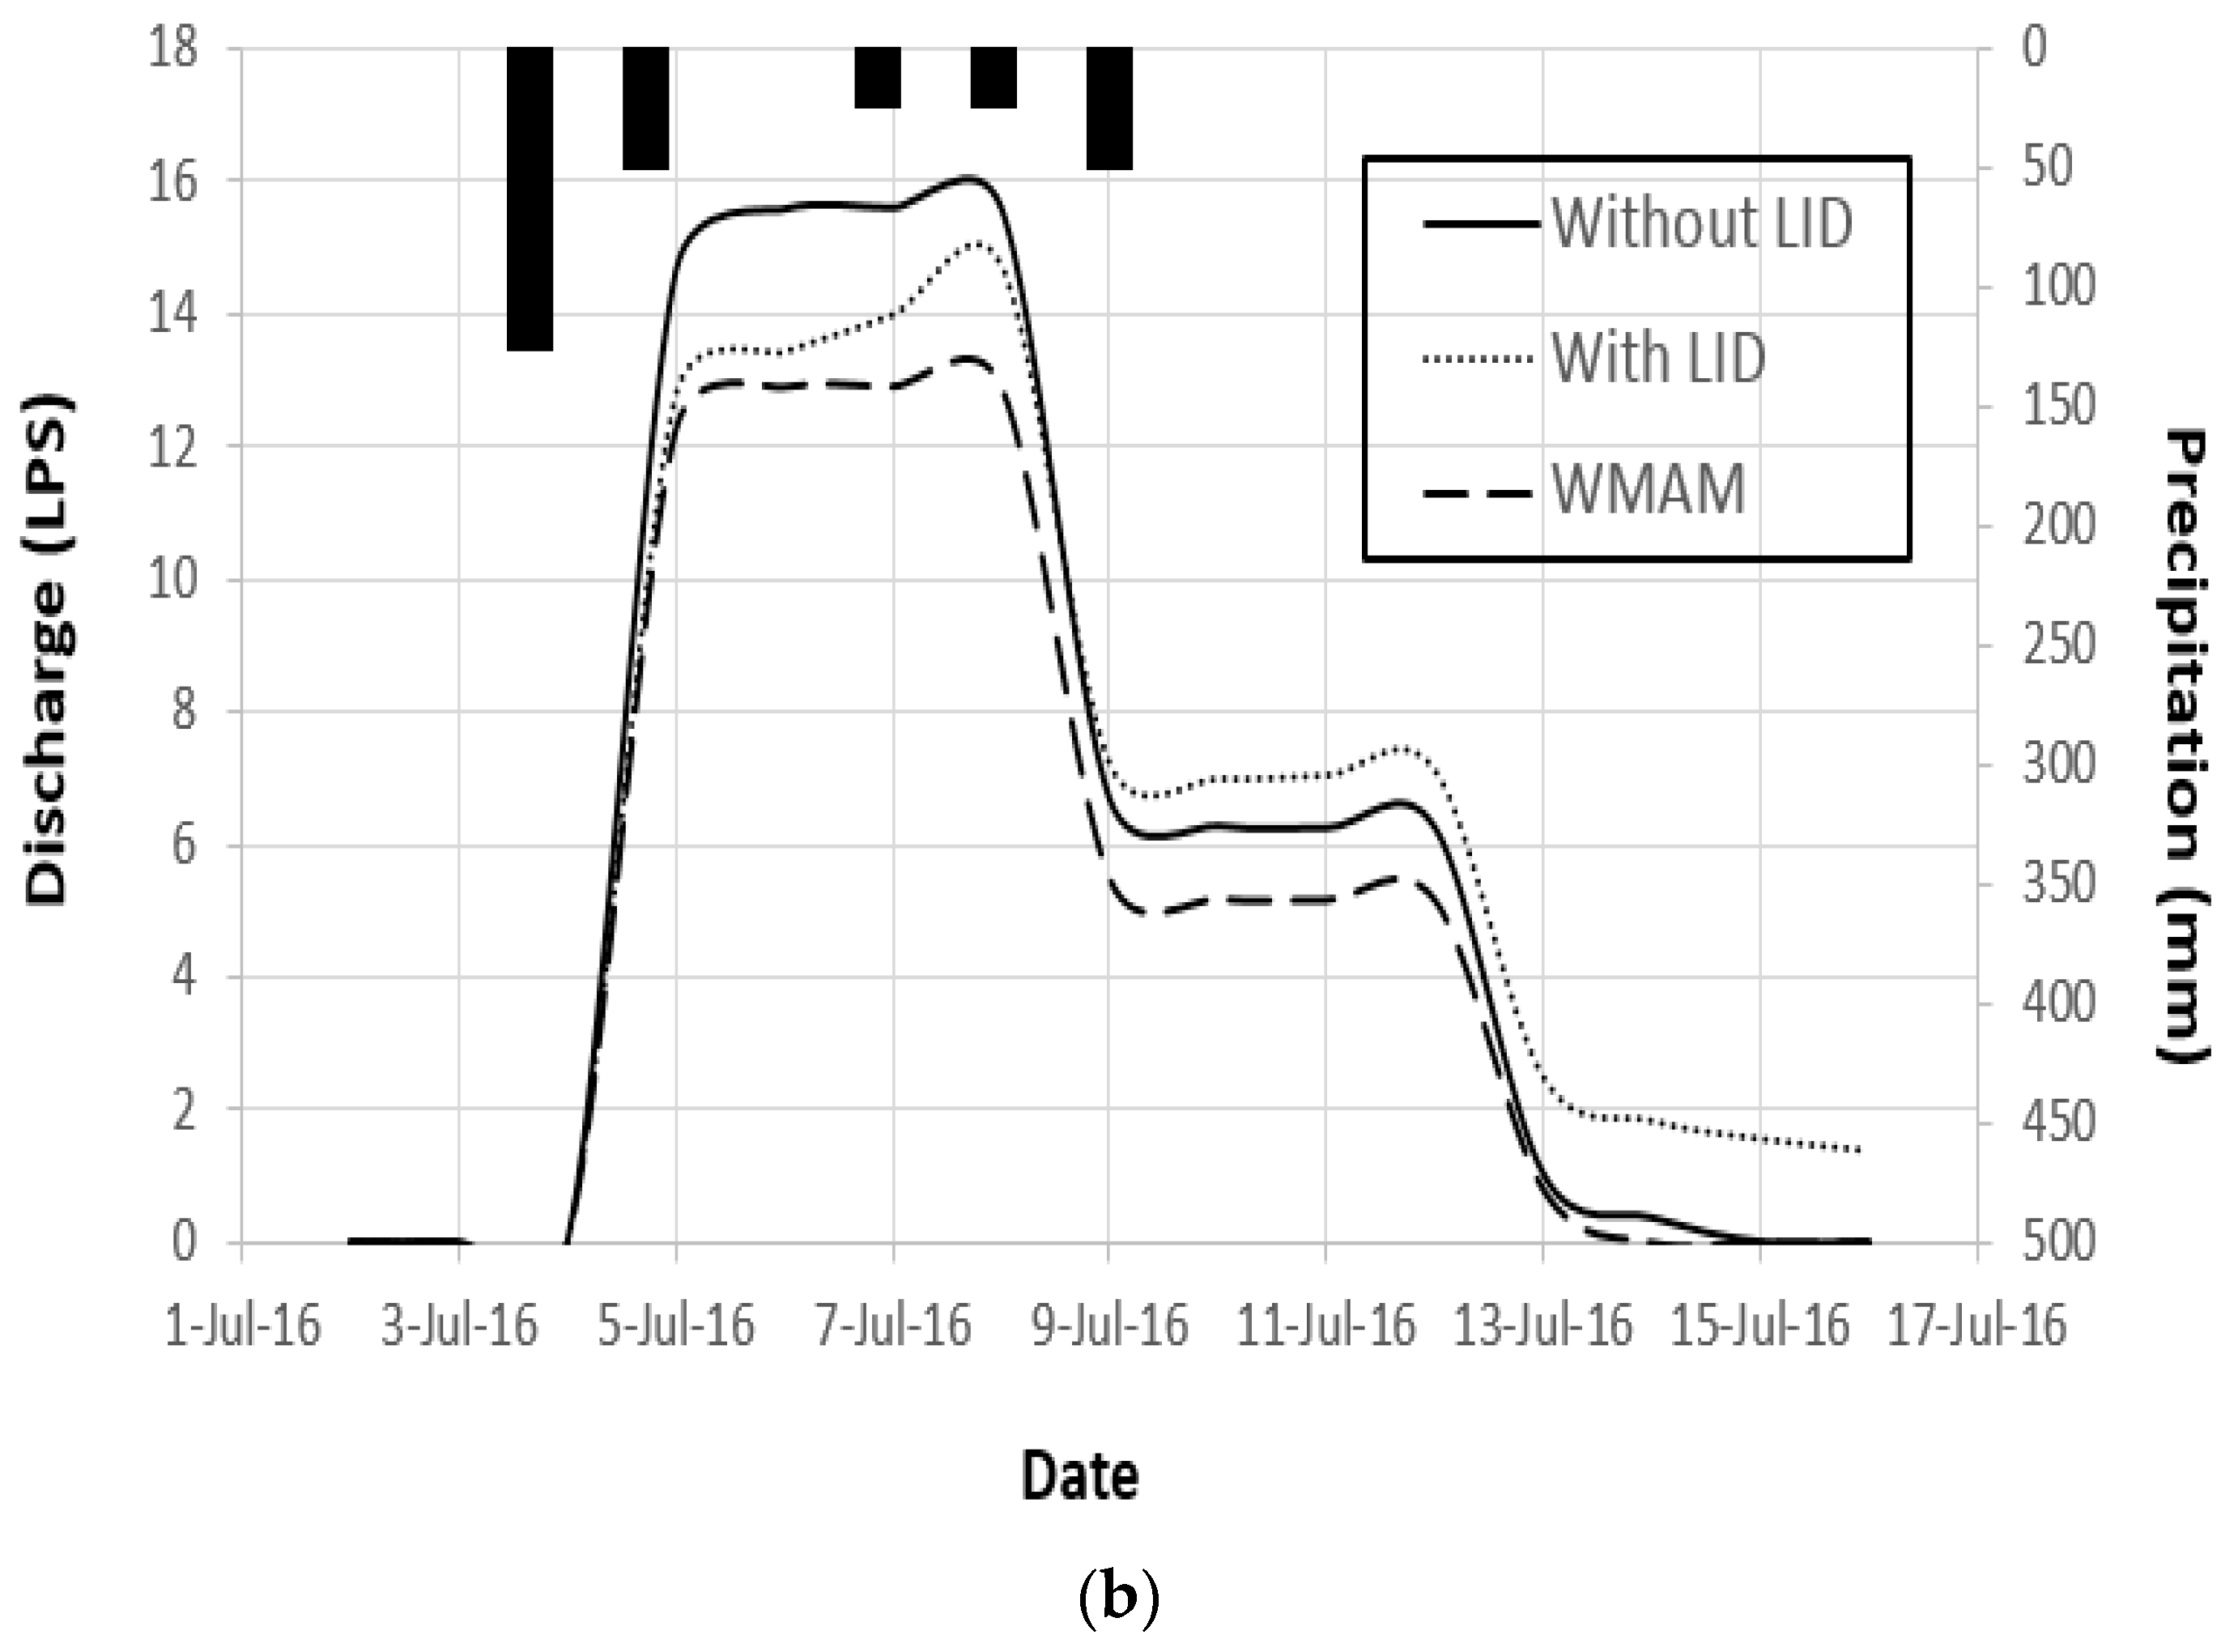
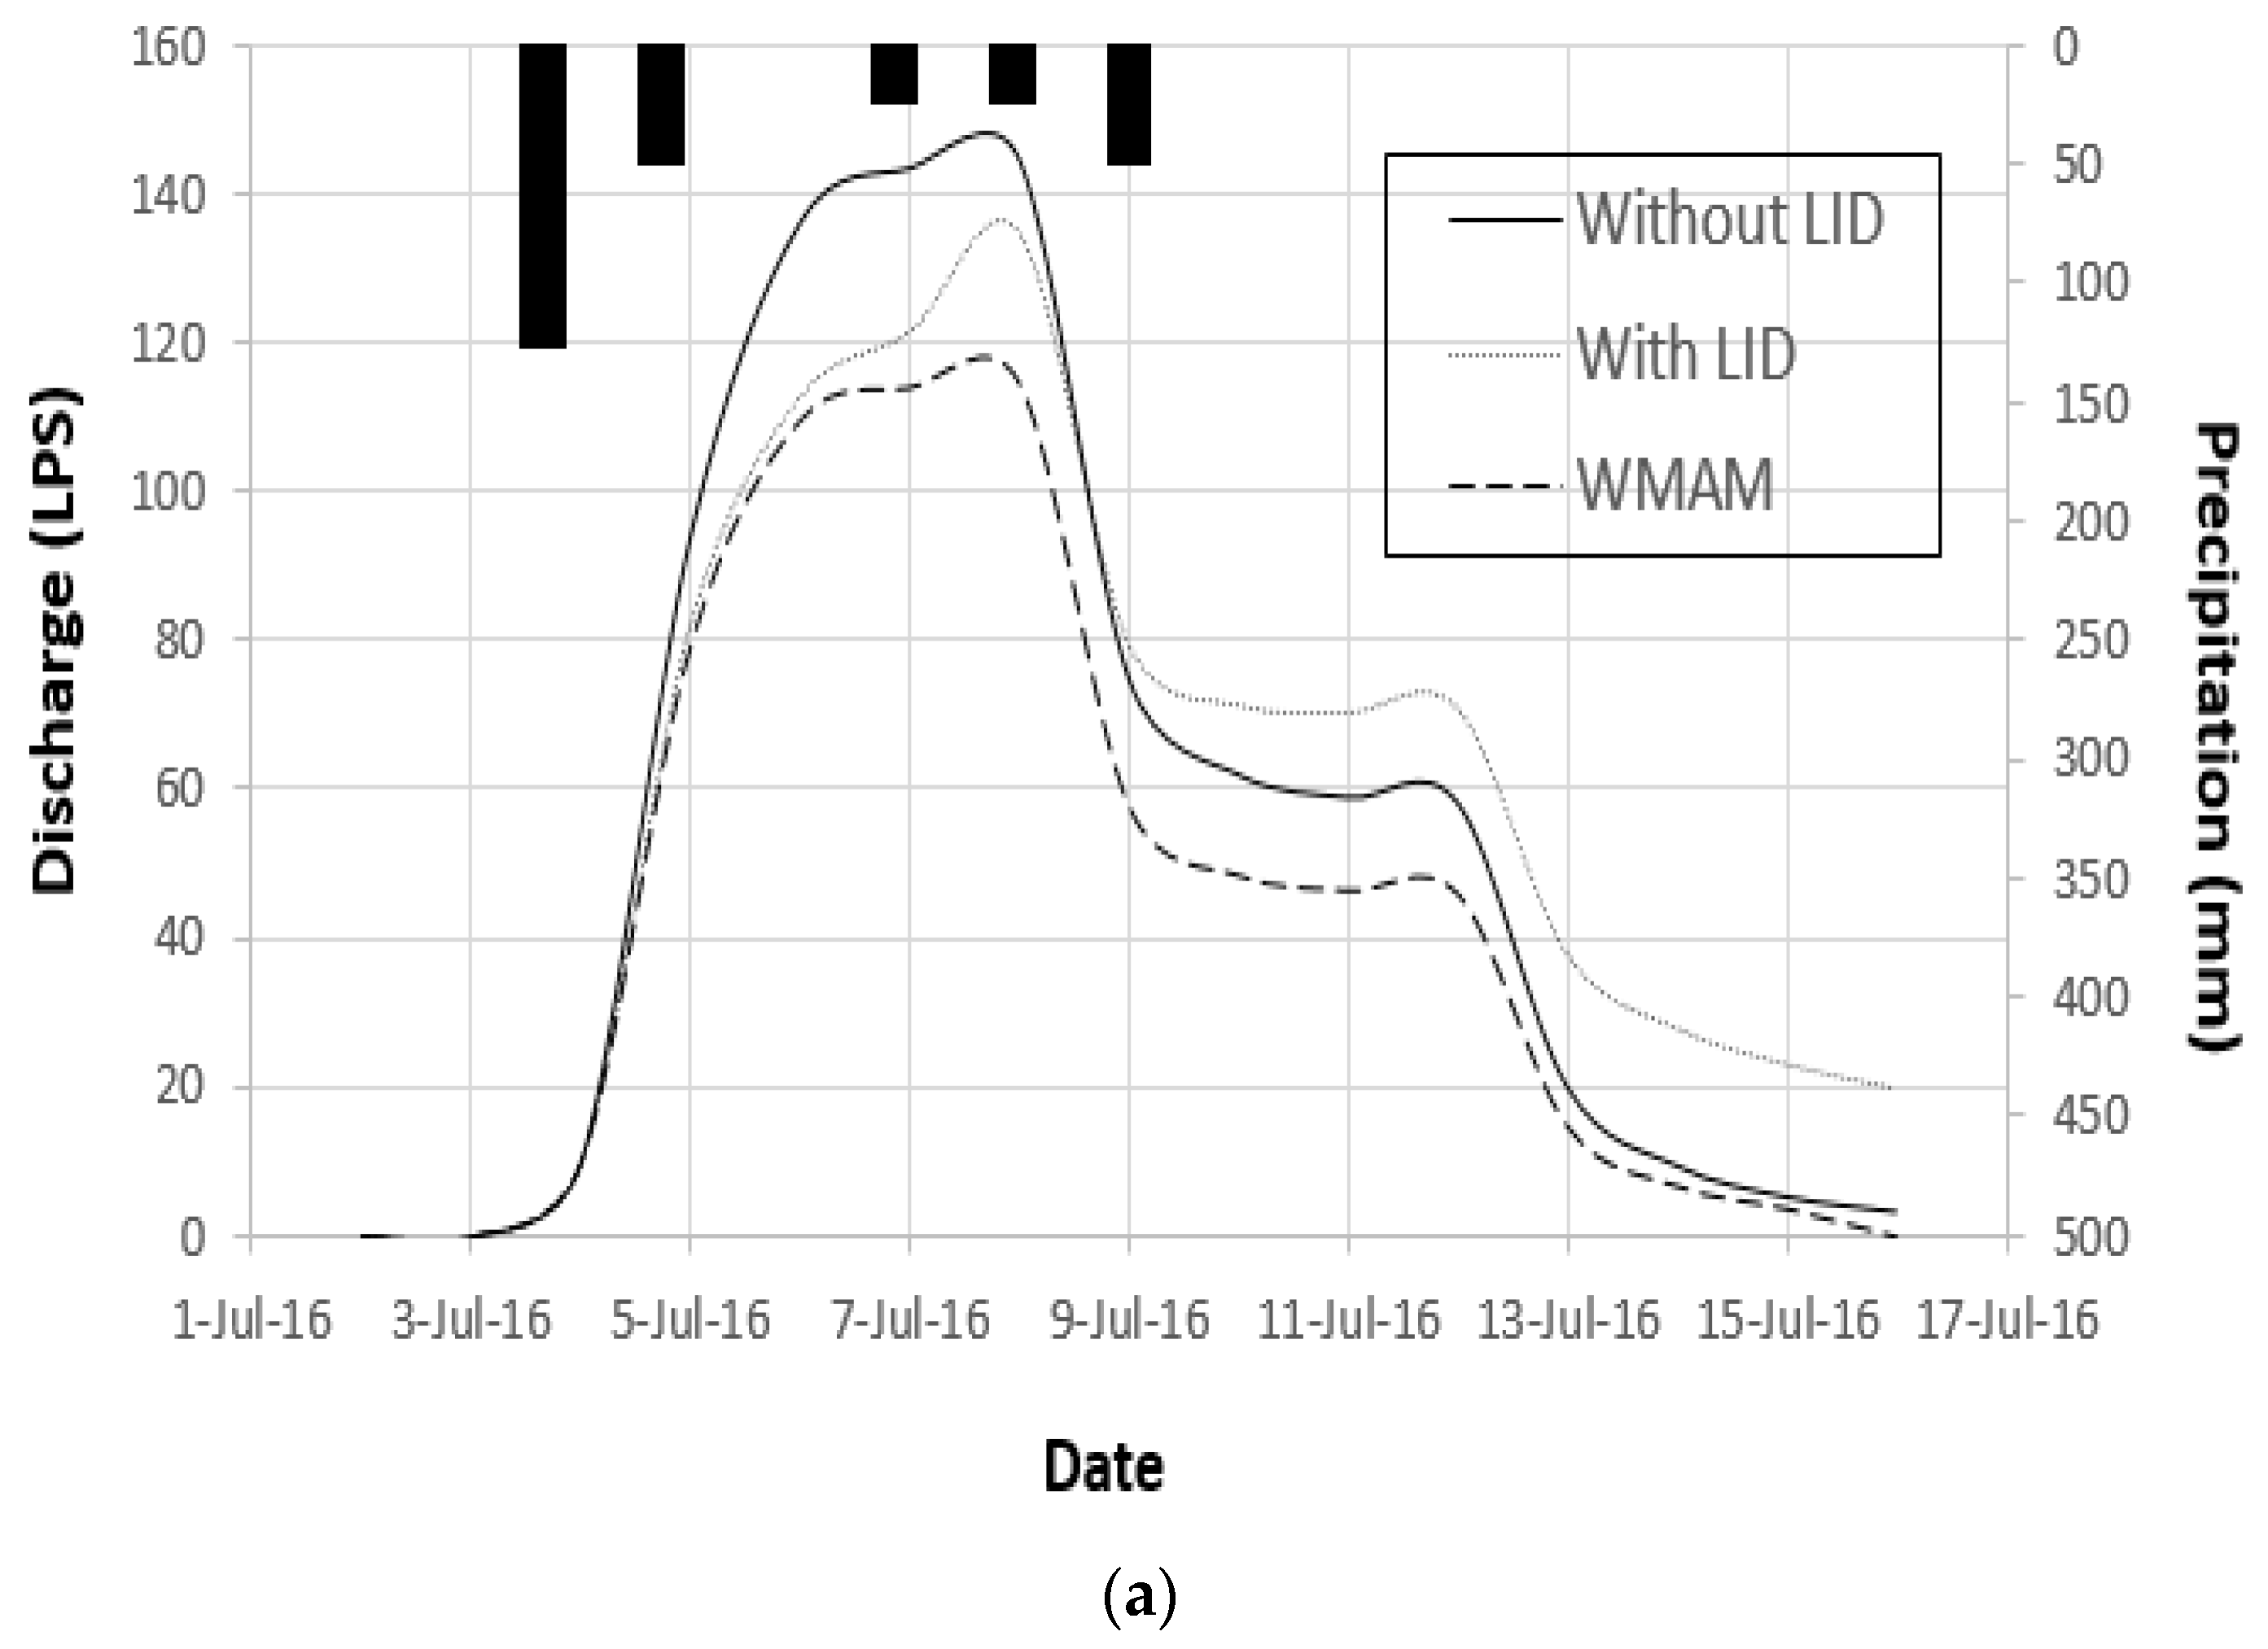
Based on the final results for design and planning parameters of LID practices, hydrographs of two sub-catchments, S1 and S6 were drawn as shown in
Figure 6. The hydrograph without LID practice was the highest at the peak flow and that with LID has the next. On the other hand, the hydrographs of S1 and S6 were apparently lower than the others. It means that the WMAM should be very effective to derive the best design specification of LID practice.
4. Conclusions
This study assessed the impacts of LIDs on peak runoff in an urban catchment of university campus in Johor Bahru of Malaysia. The hydrology was simulated using EPA SWMM5.1 with and without LID. The sensitivity analysis was also carried out using WMAM. Results of study indicate that LID can be effective for reducing peak flow. The determined scenarios from WMAM are much more effective at determining all design and planning parameters of an infiltration trench by lowering the rate of total and peak runoffs and by increasing the rate of infiltration. This study compared the SWMM simulation results from WMAM with those from artificially selected LID design parameters of SWMM. The derivation of outstanding scenarios of LID design and planning parameters for hydrological variables will not only assist researchers and designers who engage in urban watershed planning and management but will also help decision makers establish better strategies when developing urban areas. Thus, this study provides a tool for the best solution on what values for physical parameters will be the best for a specified LID type and what capacities can achieve the particular objective using WMAM.
There are still more limitations and improvements in the WMAM. First, more critical hydrologic performance indices such as baseflow increase, and pollutant reduction efficiency, can be added after the usefulness is investigated. Second, the hydrologic effectiveness of LID design and planning specifications should be differently analyzed at the catchment or the sub-catchment scales. Third, additional steps will be enhanced to determine the economic efficiencies of multiple LID planning scenarios based on cost effectiveness ratios.


