1. Introduction
Water policy has become one of the first and, in many countries, probably the most profusely regulated areas of environmental policy. European environmental policy has progressed alongside European integration, and water is currently the issue with the most comprehensive coverage in EU environmental regulation. EU water policy has undergone a transformation from a standard approach towards an integrated policy with an emphasis on institutional and participatory aspects. A number of different water directives have been approved since the 1970s, dealing with critical aspects of water functions.
The Water Framework Directive (WFD) [
1] integrates all the existing regulations and sets ambitious targets regarding water quality objectives. There are precedents for these ambitious goals in other developed countries, notably long enforced in the United States of America, but the major challenge of the directive is to combine the ecological dream with an economic ideal, which has no equivalent in the United States [
2].
The European WFD adopts an integrated and public participation and governance methodology to water management and gives a critical role to economic instruments. Article 5 determines the need for economic analysis of water uses and also the provisions for derogation from the obligation to achieve a ‘good environmental status’, which member states may choose to do in light of a cost-benefit analysis. Article 9 proposes the use of ‘full cost recovery of water services’, which has been modified to adapt it to the different realities in the European Union. Indeed, the European Commission [
3] reaffirms that 100% cost recovery is not required in all circumstances due to differences on national laws and competences. In this workshop, it was also pointed out that “the difficulties regarding data such as data availability, format, ownership, collection, and processing of different data formats and the related costs”. Furthermore, environmental and resource cost recovery have not been fully addressed. To deal with these issues, the European Union has made important strides towards harmonization of technical procedures.
The harmonization of monitoring procedures for all EU member states is a difficult task but one which is a priority for the European Environment Agency and the European Commission WFD implementation. Sustainable water management requires knowledge, robust data, and indicators that can show the links between water management, social and economic benefits, and ecosystem services in order to provide a greater understanding of the natural capital stocks and flows that drive our economies [
4]. Some exercises for biota monitoring standardization [
5] and chemical pollution [
6] speak to the difficulties in reaching a standard monitoring and reporting method that accounts for diverse ecosystems and institutional differences.
Harmonizing economic analysis and reporting is a difficult task due to the complexity and variability of the different situations related to different uses in each member state, but first steps emerged from WATECO working group [
7] as part of the Common Implementation Strategy. Later, some efforts have been made to integrate information and procedures in different issues as recovery of the cost of water services [
3], cost effectiveness, or cost benefit analysis [
8,
9]. Nevertheless, limited economic information has been reported by EU member states and still lacks in transparency of the results, methods, and assumptions presented [
10]. The aim of this research is therefore to propose a methodology that may fill this gap. Our proposal is based upon the System of Environmental and Economic Accounting (SEEA) of the United Nations Statistics Division (UNSD), and specifically in SEEA-Water [
11] which can be applied not only to the European WFD but to any water policy.
Our proposal to use of SEEA-Water as a methodology for the economic analysis established in the WFD may allow the harmonization of EU member states’ economic analysis of water and will ease the international comparison of water policy measures and the state of water resources and, specifically for European policy, it would facilitate Member States’ WFD reporting to the European Commission.
SEAA-Water system has not been used for WFD reporting, with the exception of Borrego-Marín et al. [
12], who apply SEEA-Water to estimate cost-recovery ratios (according to Article 9 of WFD). Therefore, the use of SEEA-Water for Article 5 reporting summarized in this paper may be considered a novel contribution and a useful means of producing a standard and replicable estimation of this information.
The next section reviews the concept of economic characterization in the context of WFD, followed by an introduction to SEEA-Water and some examples of application of SEEA-Water. This is followed by an outline of the case study and our proposed methodology, then the presentation of our results, followed by a discussion of these results and finally some concluding remarks.
2. Economic Characterization in the Water Framework Directive
One of the most innovative aspects of the WFD is the fact that economic methods and instruments are included explicitly as a backbone of the norm implementation in order to reach environmental objectives. In the process of implementing of the WFD, there have been many ad hoc solutions due to the obligation to meet deadlines and because of a lack of information and general procedures. The economic aspects of the WFD are included in:
Article 4: Use of cost-benefit analysis (CBA) for exemptions and disproportionate cost decision.
Article 5: Economic analysis of water use and scenarios development.
Article 9: Application of the cost‑recovery principle, including environmental and resource cost, through water pricing (probably the most extensively referenced economic aspect).
Article 11: Cost-Effectiveness Analysis (CEA) for selecting the measures.
All these economic instruments, whether analytical or policy tools, are simply a means of achieving the ultimate objective of attaining good environmental status in all water bodies. To this end, the most important task of WFD implementation is the design and approval of a ‘Programme of Measures’ developed based on sound knowledge and with extensive public participation. Although CEA has been proposed as a general method for decision making (Art. 11), CBA is recommended as a tool to deal with possible derogation from the environmental objectives (Art. 4). Again, we found that most derogations have been justified by ‘affordability’ arguments, focusing either on public or private budgetary capacities. CBA has rarely been applied in WFD implementation according to the European Commission [
13]. Similarly, there have been very few applications of CEA to water policy [
14,
15].
Article 5 is aimed to characterize river basins and should support the cost recovery decisions included in Article 9 defined as “an adequate contribution of the different water uses, disaggregated into at least industry, households and agriculture, to the recovery of the costs of water services, based on the economic analysis conducted”. Therefore, economic analysis and cost-recovery estimations require harmonization.
The European Commission maintains the application of the ‘cost recovery’ and ‘water pricing’ principles summarized and the ‘Blueprint for Water’ communication and the reports of the WFD river basin Programme of Measures [
16] includes also a new objective of the water policy which is the analysis water use efficiency. The new emphasis in resource efficiency is derived from EU compromise towards an efficient use of water resources and climate change mitigation [
4,
10]. Nevertheless, water pricing is not the unique way to reach water efficiency. In fact, many authors have pointed out that agricultural water pricing is not a useful tool in areas coping with water scarcity. Instead, other economic instruments to achieve resource efficiency can be used such as fiscal instruments, setting qualitative and quantitative requirements, institutional cooperation, and water markets [
17].
The reform of the Common Agricultural Policy includes the mandatory eco-conditionality linked to the receipt of agricultural first-pillar subsidies. Regarding irrigation investments of the second pillar, the ex-ante conditionality consists of the existence of (i) a water pricing policy which provides adequate incentives for users to use water resources efficiently and (ii) an adequate contribution of the different water uses to the recovery of the costs of water services at a rate determined in the approved river basin management plan for investment supported by the programs [
18]. The emphasis in water pricing, cost recovery, and resource efficiency implies an in-depth analysis of water uses in the basin and the Article 5 ‘characterization’ may support this requirement. Complementary to water saving measures, the CAP can also support natural retention measures (NWRM) such as water retention, flood alleviation, river and wetland restoration, and flood management. The study by European Commission (NWRM project) [
19] detected that most of the EU member states have financed NWRM projects with the support of CAP funds. A valuation of flood retention measures by farmers can be found in Grygoruk et al. [
20].
Our proposal is based on the use of SEEA-Water methodology and, therefore, we apply the definitions contained in the SEEA accounting framework described in the next section. The paper focuses on the economic analysis that, according to the European Commission first-stage WFD implementation report, was the weakest part of Article 5 reporting. The report [
10] affirms that “on the basis of the information provided, a comparable performance analysis could only be made on a few topics for which most information was available”. This is the gap that our research aims to fill: the lack of a common standard methodology for economic analysis.
The WFD uses the DPSIR framework (Drivers, Pressure, State, Impact, Response) as a methodology for analysis. Consequently, Article 5 determines that each member state shall provide for each river basin district or portion of an international river basin falling within its territory:
An analysis of its characteristics.
A review of the impact of human activity on the status of surface waters and on groundwater.
An economic analysis of water use.
As we mentioned above, an international effort is being made to harmonize technical, biological and chemical monitoring, and reporting procedures but no equivalent effort has yet been made for economic analysis.
3. SEEA-Water Accounting framework
The System of Environmental-Economic Accounting for Water, or SEEA-Water, [
11] defines a framework for organizing hydrological and economic information consistently. It has been developed by the Department of Economic and Social Affairs of the United Nations Secretariat with the support of other institutions. This is a key issue, as it means that the system is grounded in economics and the nature of the accounts is hybrid. In our opinion, water accounts facilitate the analysis of both dimensions, economic and physical.
In Godfrey and Chalmers [
21], international experts answer the question: what role can water accounting play in resolving individual, organizational, industry, national and international economic, social, and environmental issues? They explore how various forms of water accounting, SEEA-Water among them, are utilized and the issues that they address.
Water accounting has been seen as a way of measuring physical units of water diverted, used or consumed, but the advantage environmental-economics accounting offers over other types of water statistics is its ability to integrate water accounts with economic information, thus facilitating economic analysis. Water accounting performed by SEEA-Water is basically a collection of tables that includes information on supply, use, consumption, returns, pollutant emissions, and the economic output associated to each activity, as well as interrelation among these economic activities, including wastewater services. There are a growing number of countries producing water accounts and SEEA-Water has been developed and implemented in countries in a relatively short space of time [
22] that has led to some applications throughout the world.
Lange et al. [
23] carry out water accounting following SEEA-Water for the Orange River Basin, taking an economic perspective on managing a transboundary resource by building water accounts for Botswana, Namibia, and South Africa at a national level. The accounts include supply and use tables, which are used to compare the contribution each riparian state makes to water supply with the amount it uses. The water accounts are then linked to economic data for each country to calculate water use and productivity by industry and country.
An adaptation to SEEA-Water framework of national-level water account practices by the Australia Bureau of Statistics (ABS) is presented by Vardon et al. [
24]. In China, the objectives of the Chinese Water Accounting Framework (CWAF) are consistent with those of SEEA [
25] and an evaluation of measures to improve water management in arid regions has been developed [
26]. Edens and Graveland [
27] present an experimental evaluation of Dutch water resources according to SNA and SEEA, discussing approaches for establishing the value of water resources to the Dutch economy in terms of provisioning services.
In Spain, the SEEA-Water accounting framework was successfully applied to the Segura River Basin [
28]. After an intensive process of data collection and processing, the authors derive and analyze an annual set of use-to-availability water indicators, under two contrasting climate conditions: a normal-precipitation period (2001–2004) and an extreme-moderately dry period characterized by low interbasin inflows. Finally, different water management practices and measures adopted under a scenario of population growth and decreasing conventional water resources were evaluated in terms of their impact on the basin’s water indicators.
SEEA-Water has been also integrated with other systems such as AQUATOOL or WEAP. Pedro-Monzonís et al. [
29] integrate SEEA-Water and AQUATOOL Decision Support System (DSS), using the latter to fill in the physical water supply and use tables, and the asset accounts presented in the former. Similarly, Dimova et al. [
30] use WEAP (Water Evaluation and Planning System) to underpin the development of asset water accounts within the SEEA-Water platform in Bulgaria.
Most applications use the hybrid nature of the tables to produce ratios of apparent water productivity by sector/region. In this regard, Borrego-Marín et al. [
31] show that SEEA-Water can be used to study the productivity of water and the economic impact of the different droughts.
A precedent for our proposal is the work by Borrego-Marín et al. [
12], who propose the use of SEEA-Water to estimate cost-recovery rates required by Articles 5 and 9 of the WFD. An advantage of the methodology is that it enables the standardization and harmonization of a difficult but critical task for full cost-recovery implementation. The authors determined an estimated cost-recovery ratio for water services in Guadalquivir of around 78%, a figure which is in line with previous reported estimations.
SEEA-Water does not include any ecosystem services accounting apart from provisioning services to economic units, so it is not possible to account for positive or negative externalities provide by water. Accounting for ecosystem services is developed in the SEEA—Experimental Ecosystem Accounting [
32], not included in the present work.
4. Material and Methods
4.1. Case Study
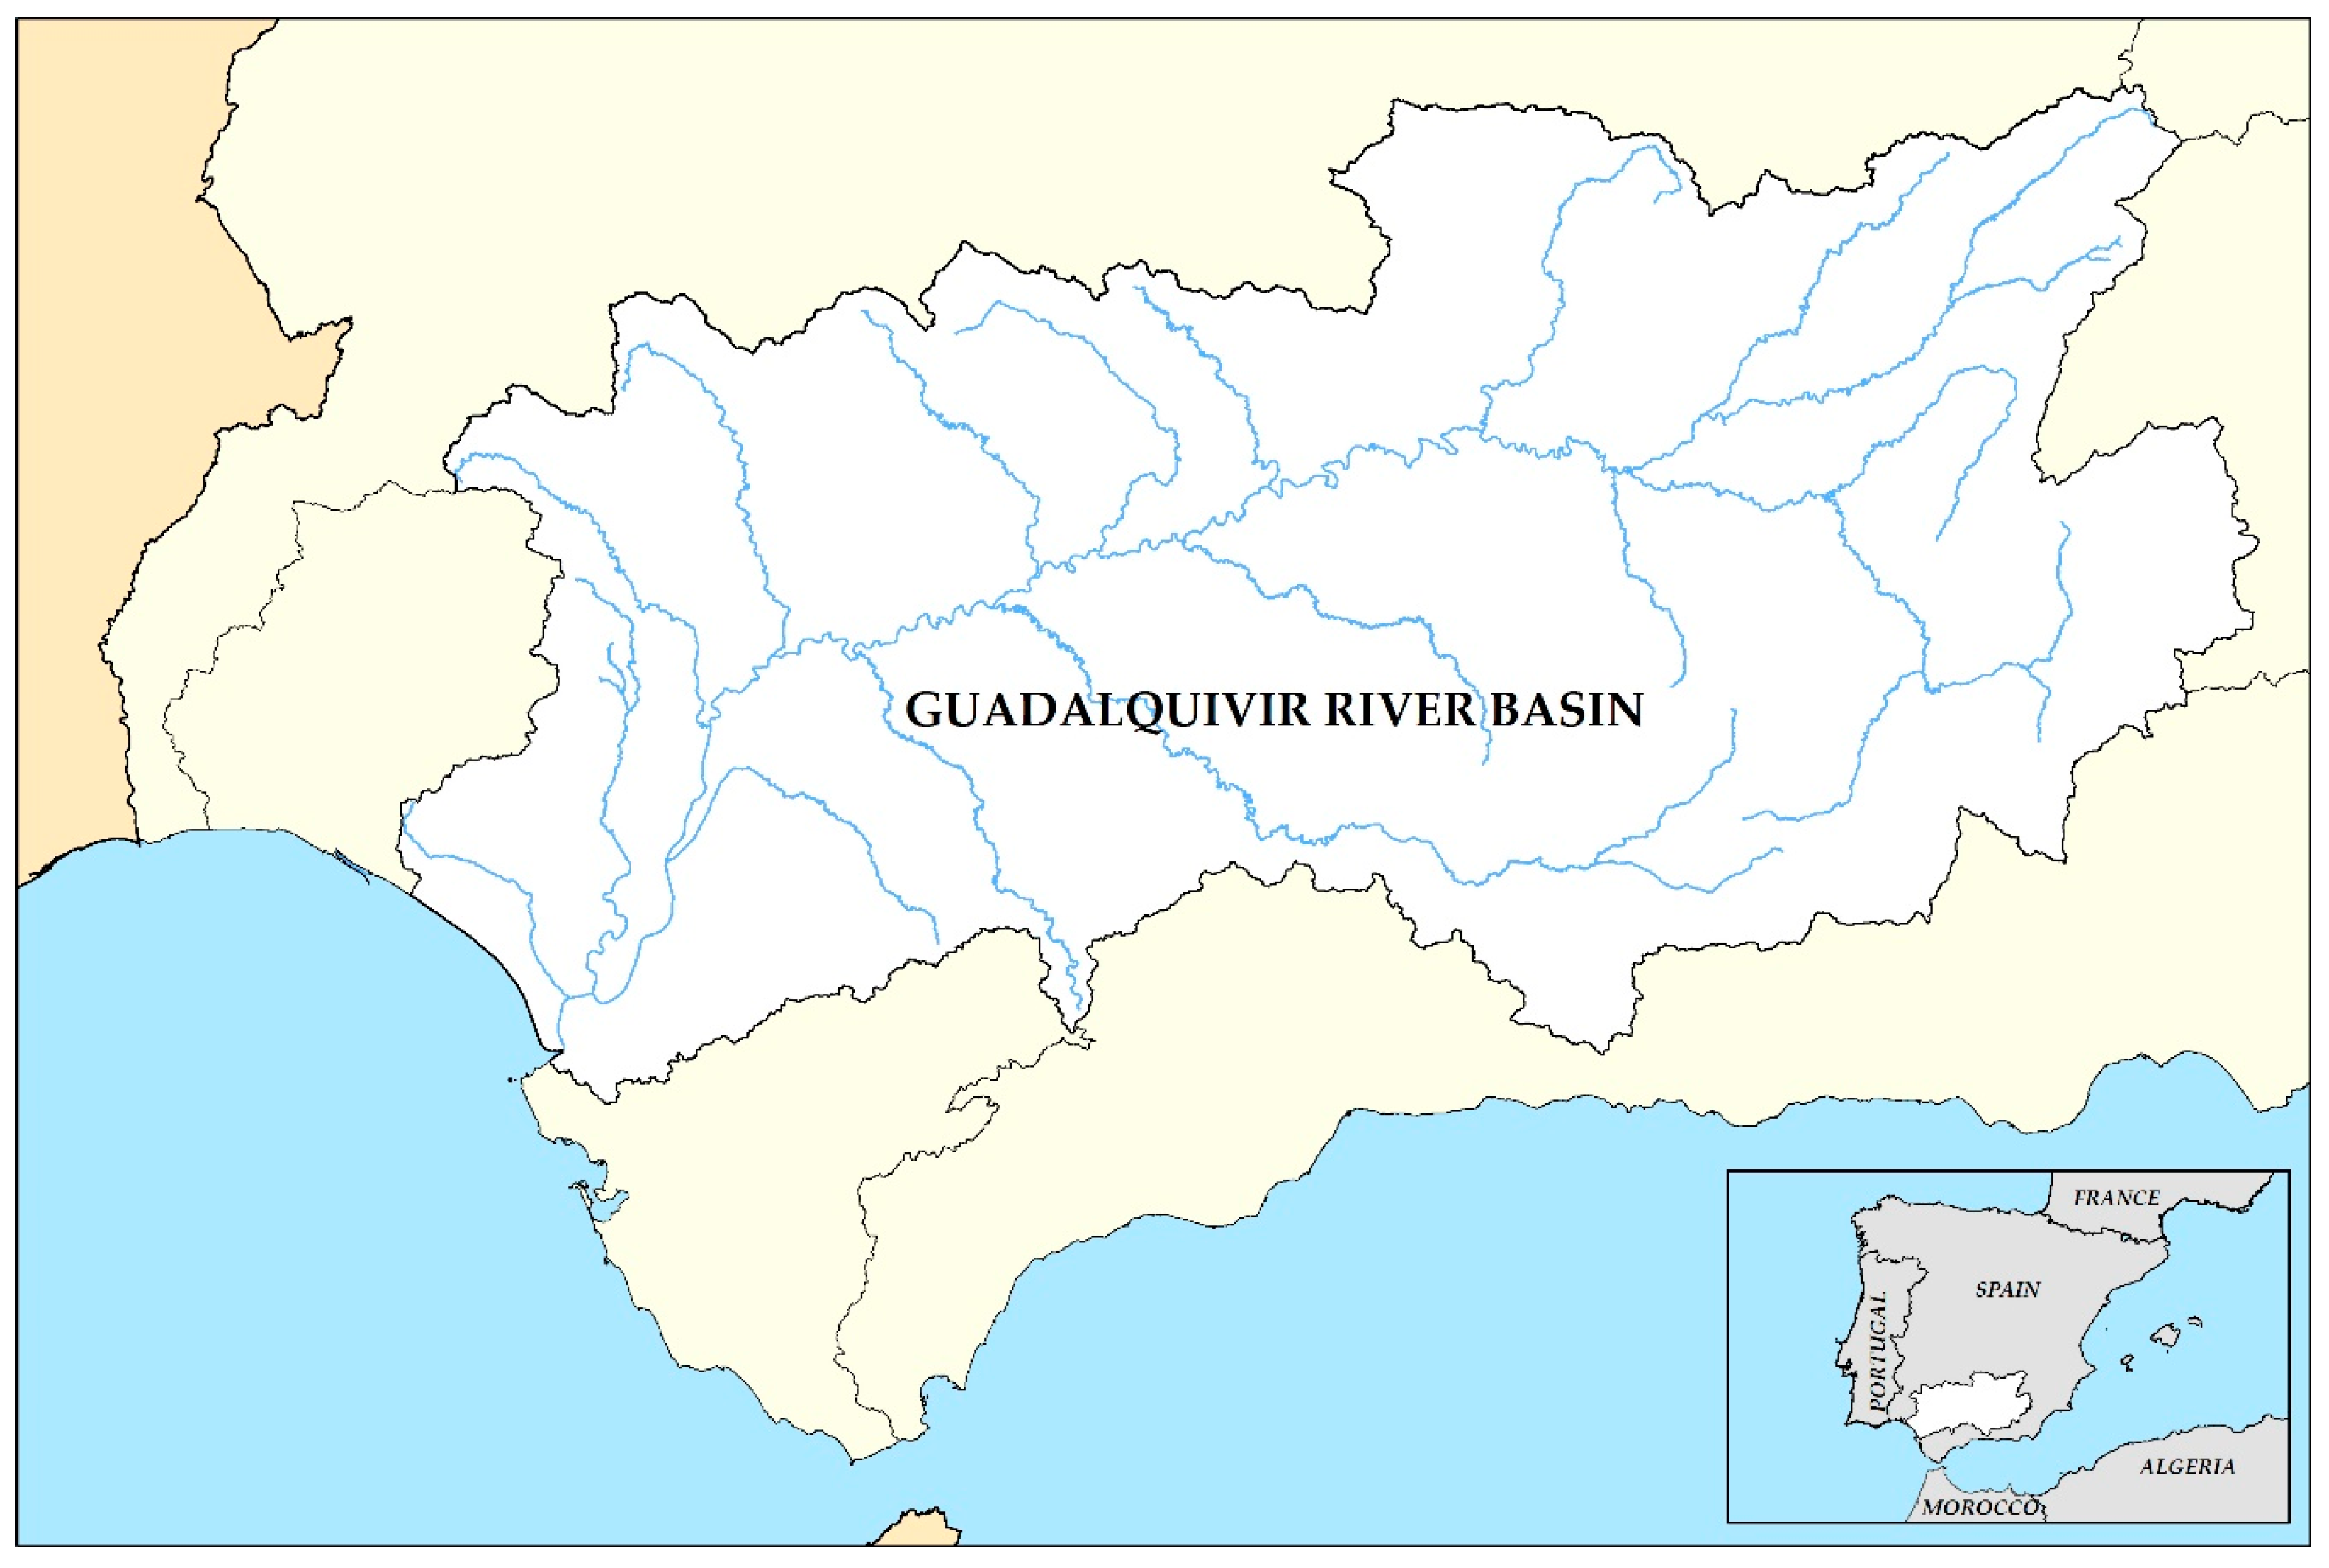
The Guadalquivir River (
Figure 1) is the longest river in southern Spain with a length of around 650 km. Its basin covers an area of 57,527 km
2 and has a population of 4,107,598 inhabitants. The basin has a Mediterranean climate with a heterogeneous precipitation distribution, and from 1940 to 2012, the annual average temperature was 16.8 °C, and the annual precipitation averaged 573 mm, with a range between 260 mm and 983 mm (standard deviation of 161 mm). In this period, according to hydrological plan and the Spanish methodology, the average renewable resources in the basin amounted to 7043 (arithmetic mean) or 5078 hm
3/year (median), ranging from a minimum of 372 hm
3/year to a maximum of 15,180 hm
3/year.
Berbel et al. [
33] describe the River Basin Management Plan, choosing the Guadalquivir river district as a case study because it is probably the largest basin with severe scarcity problems in Europe. The growing demand for water resources has been driven by a competitive agribusiness. Guadalquivir produces more than 50% of the olive oil produced in Spain, and almost 50% of the olive groves are irrigated with a prevalence of high-tech intensive cultivation. In addition, some high-value crops, such as early season fruits and strawberries, increase the demand for irrigation water, while urban development and industrial demand simultaneously intensify the pressures, a situation which led to the ‘administrative closure’ of the basin when the old policy of supply (storage) increase could not meet the gap between demand and supply of resources. Berbel et al. [
34] discuss changes over time in the basin’s water supply and extraction.
The presence in the basin of iconic ecosystems such as the Doñana wetland in the mouth of the river makes this case study an even more pertinent example of the European Mediterranean district. Additionally, the basin is large enough to have detailed information available, and the fact that 98% of the territory and 96% of the population belongs to the Autonomous Region of Andalusia facilitates the collection of economic data. The following section will detail the material used for the SEEA-Water implementation.
4.2. Material
SEEA-Water system has been developed to improve the efficiency of data collection and management in order to interconnect regularly published official sources and avoid time consuming ad hoc research and estimations. Consequently, following this principle, we have used only existing databases and official sources to complete the SEEA-Water tables.
Physical hydrological data has been obtained from the official Ministry for Environment framework SIMPA—Integrated System for Rainfall-Runoff Modelling [
35]. The Guadalquivir River Basin Authority (GRBA), based in SIMPA, publishes measures of water consumption and river flow, which allows us to integrate annual resources use into the SEEA tables. The information about economic variables, mainly gross value added per sector, has been obtained from the Spanish National Statistics Institute (INE), and detailed cost and value added data is taken from Andalusian Regional Input/Output Tables. Finally, e!Sankey 4.0 software has been used for the Sankey diagram of water flows.
4.3. Method
This research follows United Nations’ SEEA-Water guidelines [
11] to gather and organize information to build accounting tables for water, both physical and economic. Because of the impossibility of summarizing the process of gathering and organizing information in SEEA-Water and all its implication, only variations from the original guideline have been pointed out in this section.
SEEA-Water defines the users that are involved in water accounts according to the United Nations International Standard Industrial Classification of All Economic Activities (ISIC) groups. For economic analysis purposes, water supply (originally ISIC division 36 in SEEA-Water) has been divided into three different economic units in our research. GRBA is responsible for water storage and supplying water to other agents. ISIC division 36—water collection, treatment, and supply—corresponds to the economic unit that receives water from GRBA and (following treatment) supplies it to industry, service sector, and households. Finally, Water Users Associations (WUA), which are supplied by GRBA, supply water to farmers. So, at the top of the diagram is GRBA, which supplies water to ISIC division 36 for urban uses and to WUA for agricultural uses. GRBA abstraction is known in Spain as ‘upper distribution’, while distribution of water by ISIC division 36 and by WUA are referred to as ‘lower distribution’.
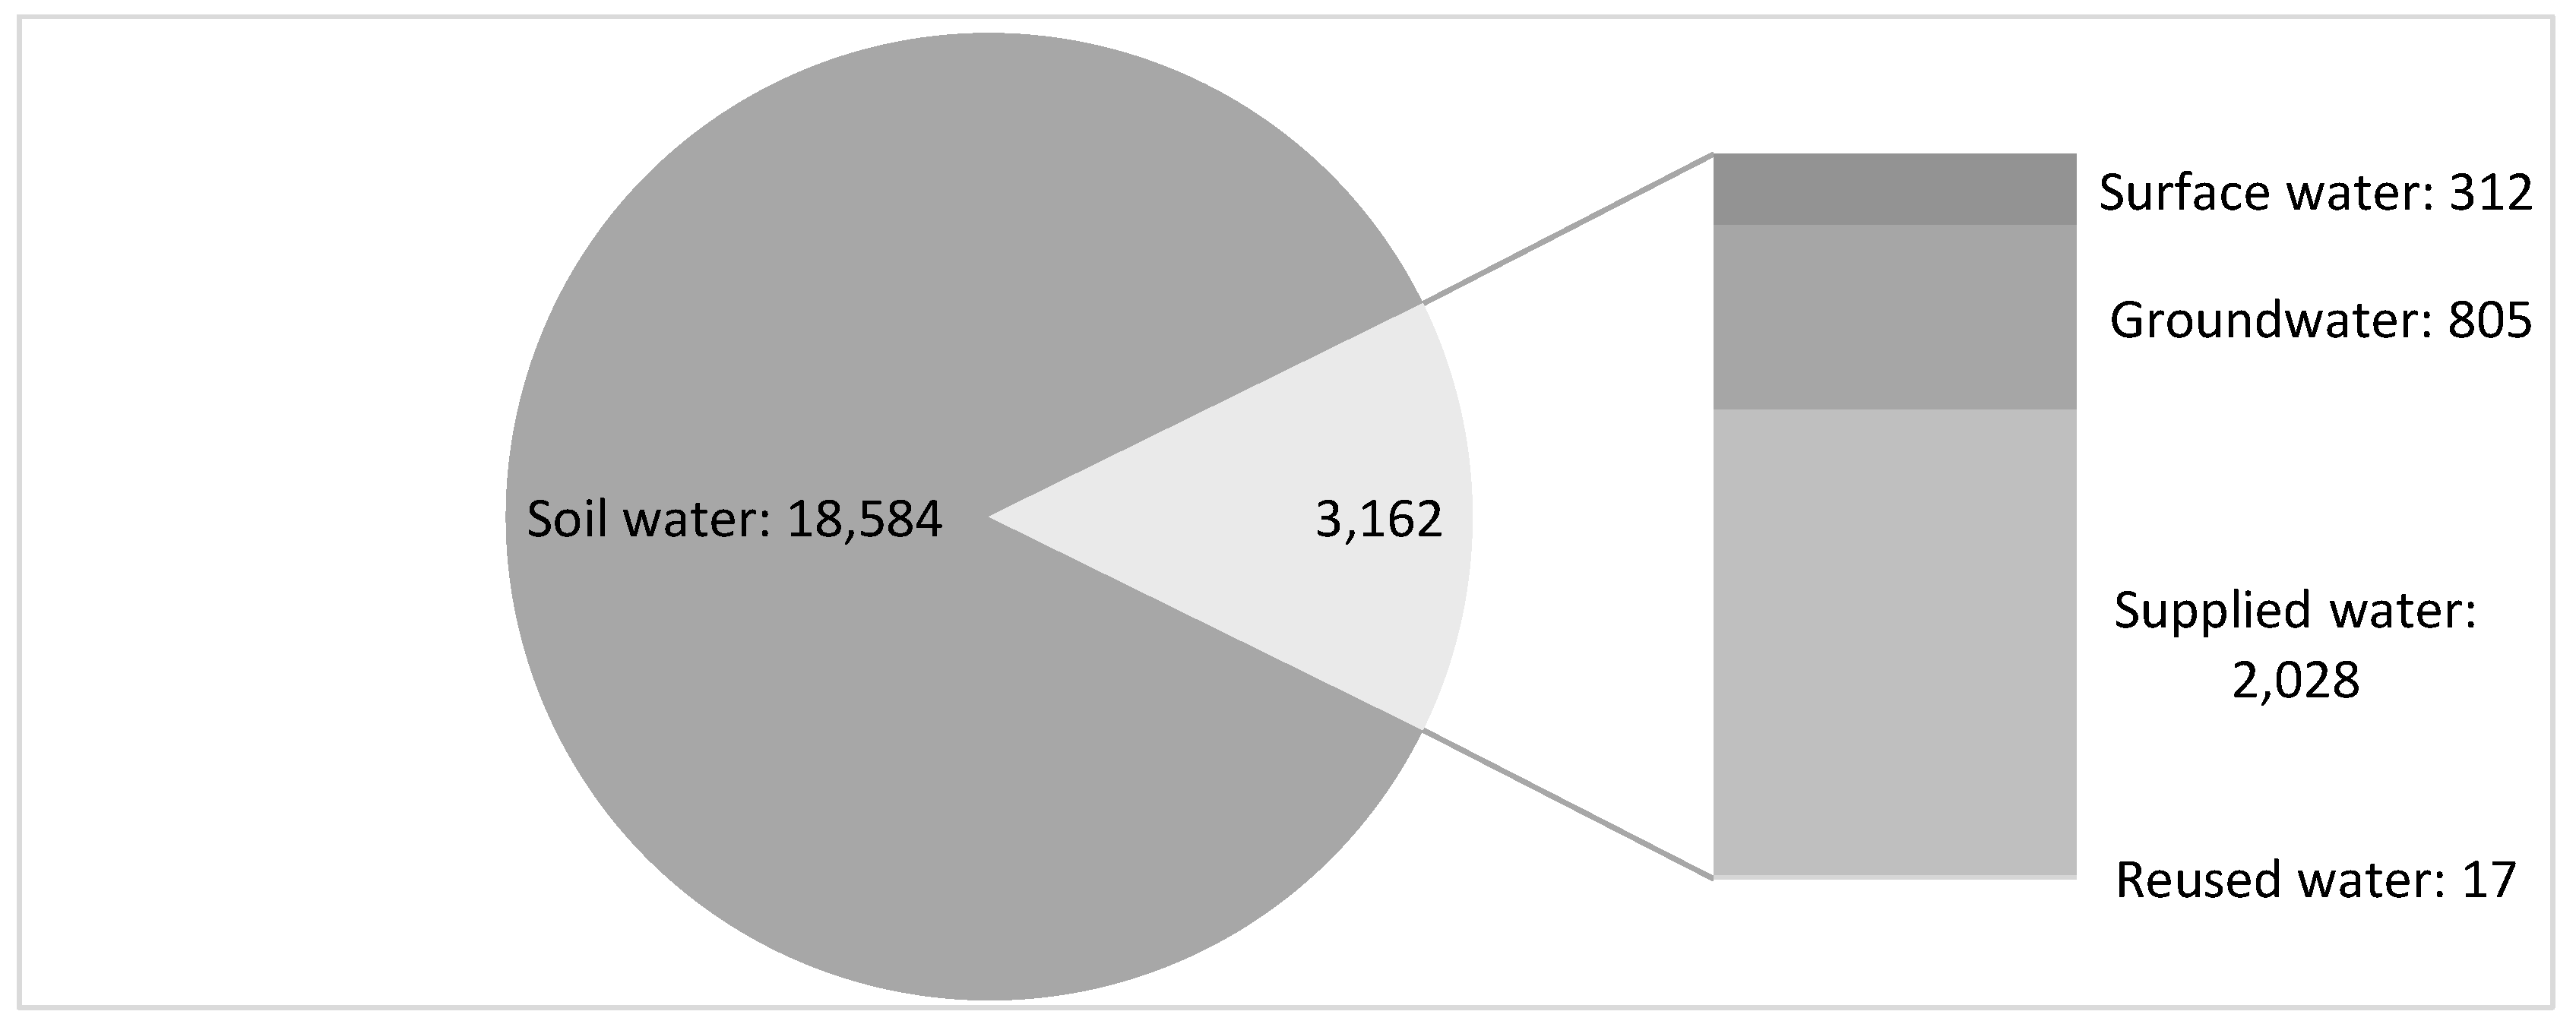
Water-supply economic units do not consume water themselves; their input (abstracted water) is equal to the output (supply to other economic units).
SEEA-Water defines water abstraction as “the amount of water that is removed from any source, either permanently or temporarily”. This definition includes soil water, which according to SEEA-Water is equivalent to the concept of ‘green water’ used in the hydrological literature, whereas ‘blue water’ refers to surface and groundwater that is abstracted, stored, transported, and applied. However, WFD focuses on ‘water bodies’ as the unit of analysis, taking only surface and groundwater resources into account, while soil water is not directly addressed by WFD because Article 9 (cost recovery and water pricing) deals with the cost related to the provision of ‘blue water’, especially in agriculture, industry and domestic uses. The cost recovery obligation in Article 9 does not apply to energy or shipping, which are the two main pressures on European water in terms of morphological impact [
36].
The integration of SEEA-Water and Article 5 of the WFD recommends the analysis of the following sectors (the ISIC divisions are shown in parentheses):
Agriculture (1–3)
Industry (5–33/41–43)
Energy (35)
Services (38–39/45–99)
Households
SEEA-Water ‘S1.1 Standard physical supply and use table for water’ provides us with all the relevant data concerning water use, abstractions, supply and consumption, among other variables. It is important here to clarify the difference between use and consumption: use refers to the amount of water utilized in a sector, not necessarily lost; while consumption is the amount of water that does not return to either water resources or the sea. Consumption can therefore be determined by subtracting returns of water into the environment from use.
SEEA-Water ‘S1.3 Hybrid supply and use table’ offers us all the information about the output (monetary units) as well as total use and supply (physical units) by economic sectors.
Our methodology makes use of the SEEA-Water framework (basically
Table S1.1 and S1.3) applied to the Guadalquivir River Basin in the period 2004–2012. During this period, there has been a severe drought (from 2005 to 2008) and investments in water saving technologies with an increase in water prices due to the use of pressurized networks and the increase of energy’s price.
5. Results
Table 1 and
Table 2 serve as analytical report for WFD Article 5 and come directly from SEEA-Water
Table S1.1. They show each sector’s water use for the years under study. The total water use in GRB in 2012 was 32,361 hm
3. As explained earlier, the concept of water consumption gives an indication of the amount of water that leaves the basin when used by the economic sectors. The water leaves the basin because it is incorporated into products, exported to other basins, evaporated, transpired by plants, or simply consumed by households or livestock and so does not return to the environment in the basin in question.
An analysis of
Table 1 shows that hydropower generation makes up 31% of total use. It should be noted that, although short-term flow fluctuations induced by hydroelectric power generation cause adverse effects on macrophytes and fish fauna [
37] and its life cycle cause greenhouse gas emissions [
38], almost all water abstracted for hydropower is returned to the ecosystem, while abstracted soil water is evapotranspired and lost from the basin (‘consumed’ in hydrological terms). There is, therefore, a crucial difference between abstracted (used) water and consumed water.
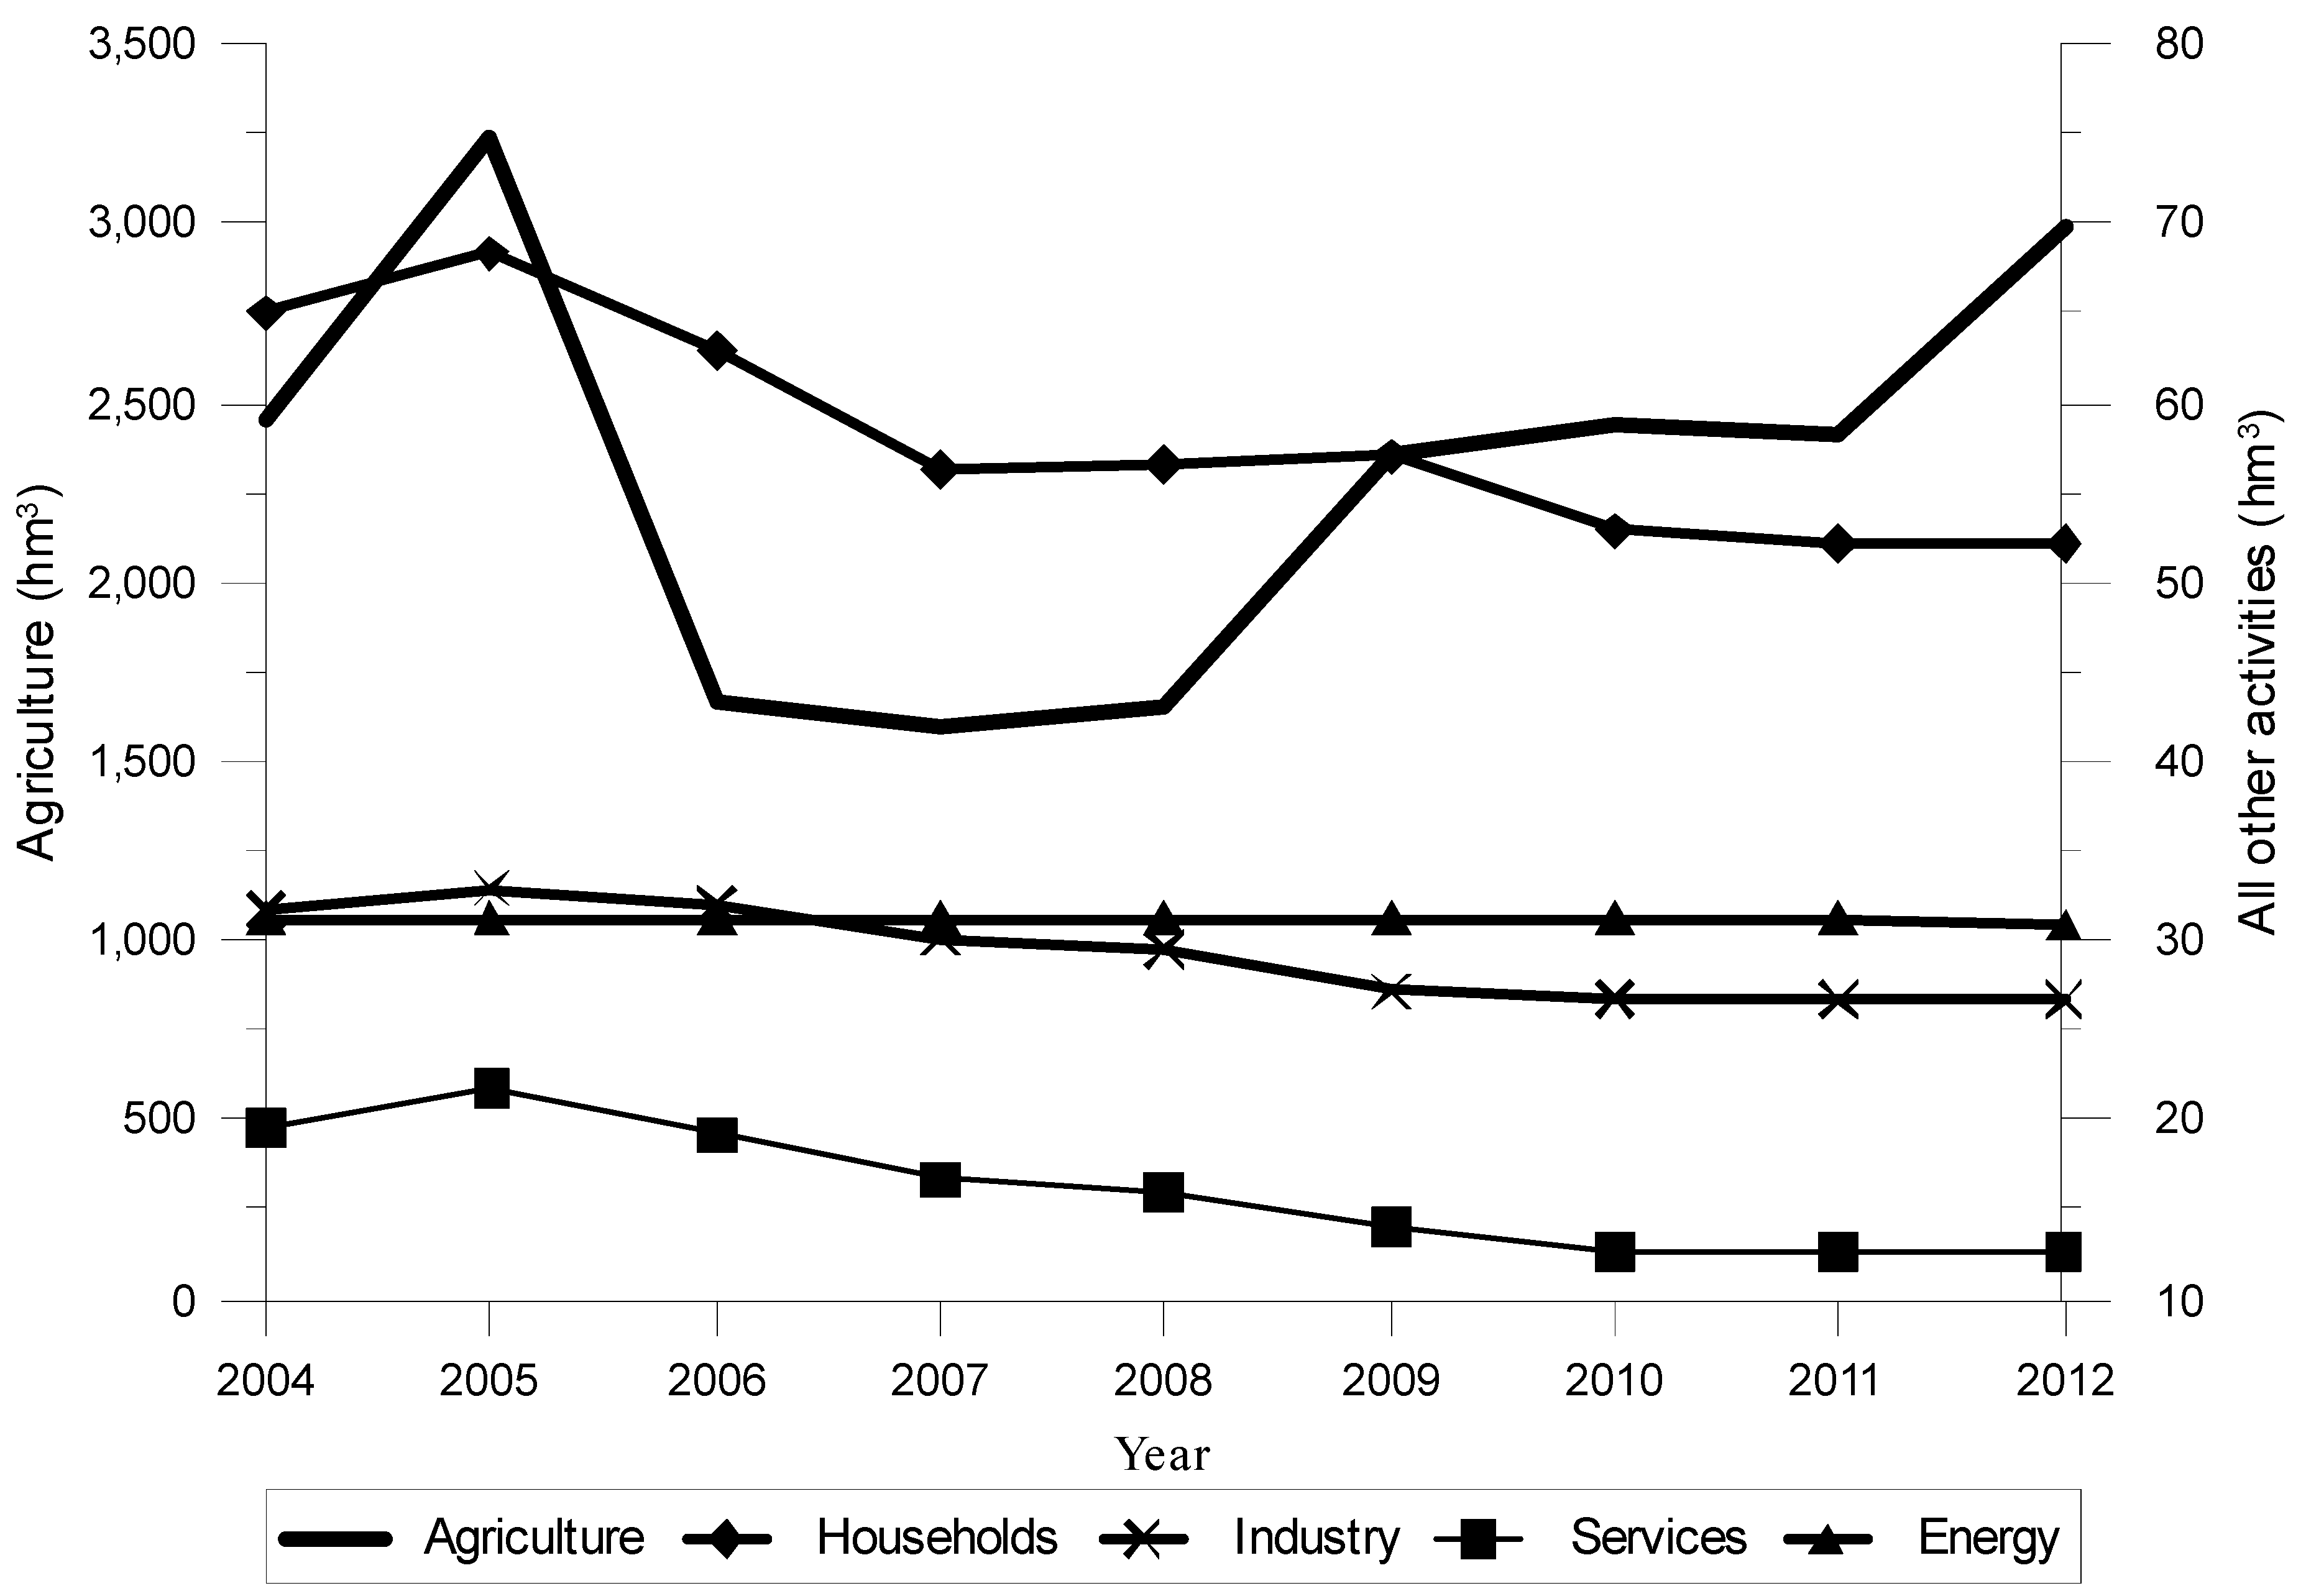
Figure 2 graphically shows changes in water consumption throughout the period under study, without taking soil water into account. It was revealed that there has been a decrease in households, industry, and services uses (2.5%, 1.9%, and 4.9% annually, respectively), while agricultural water consumption varies depending on precipitation (
Figure 2).
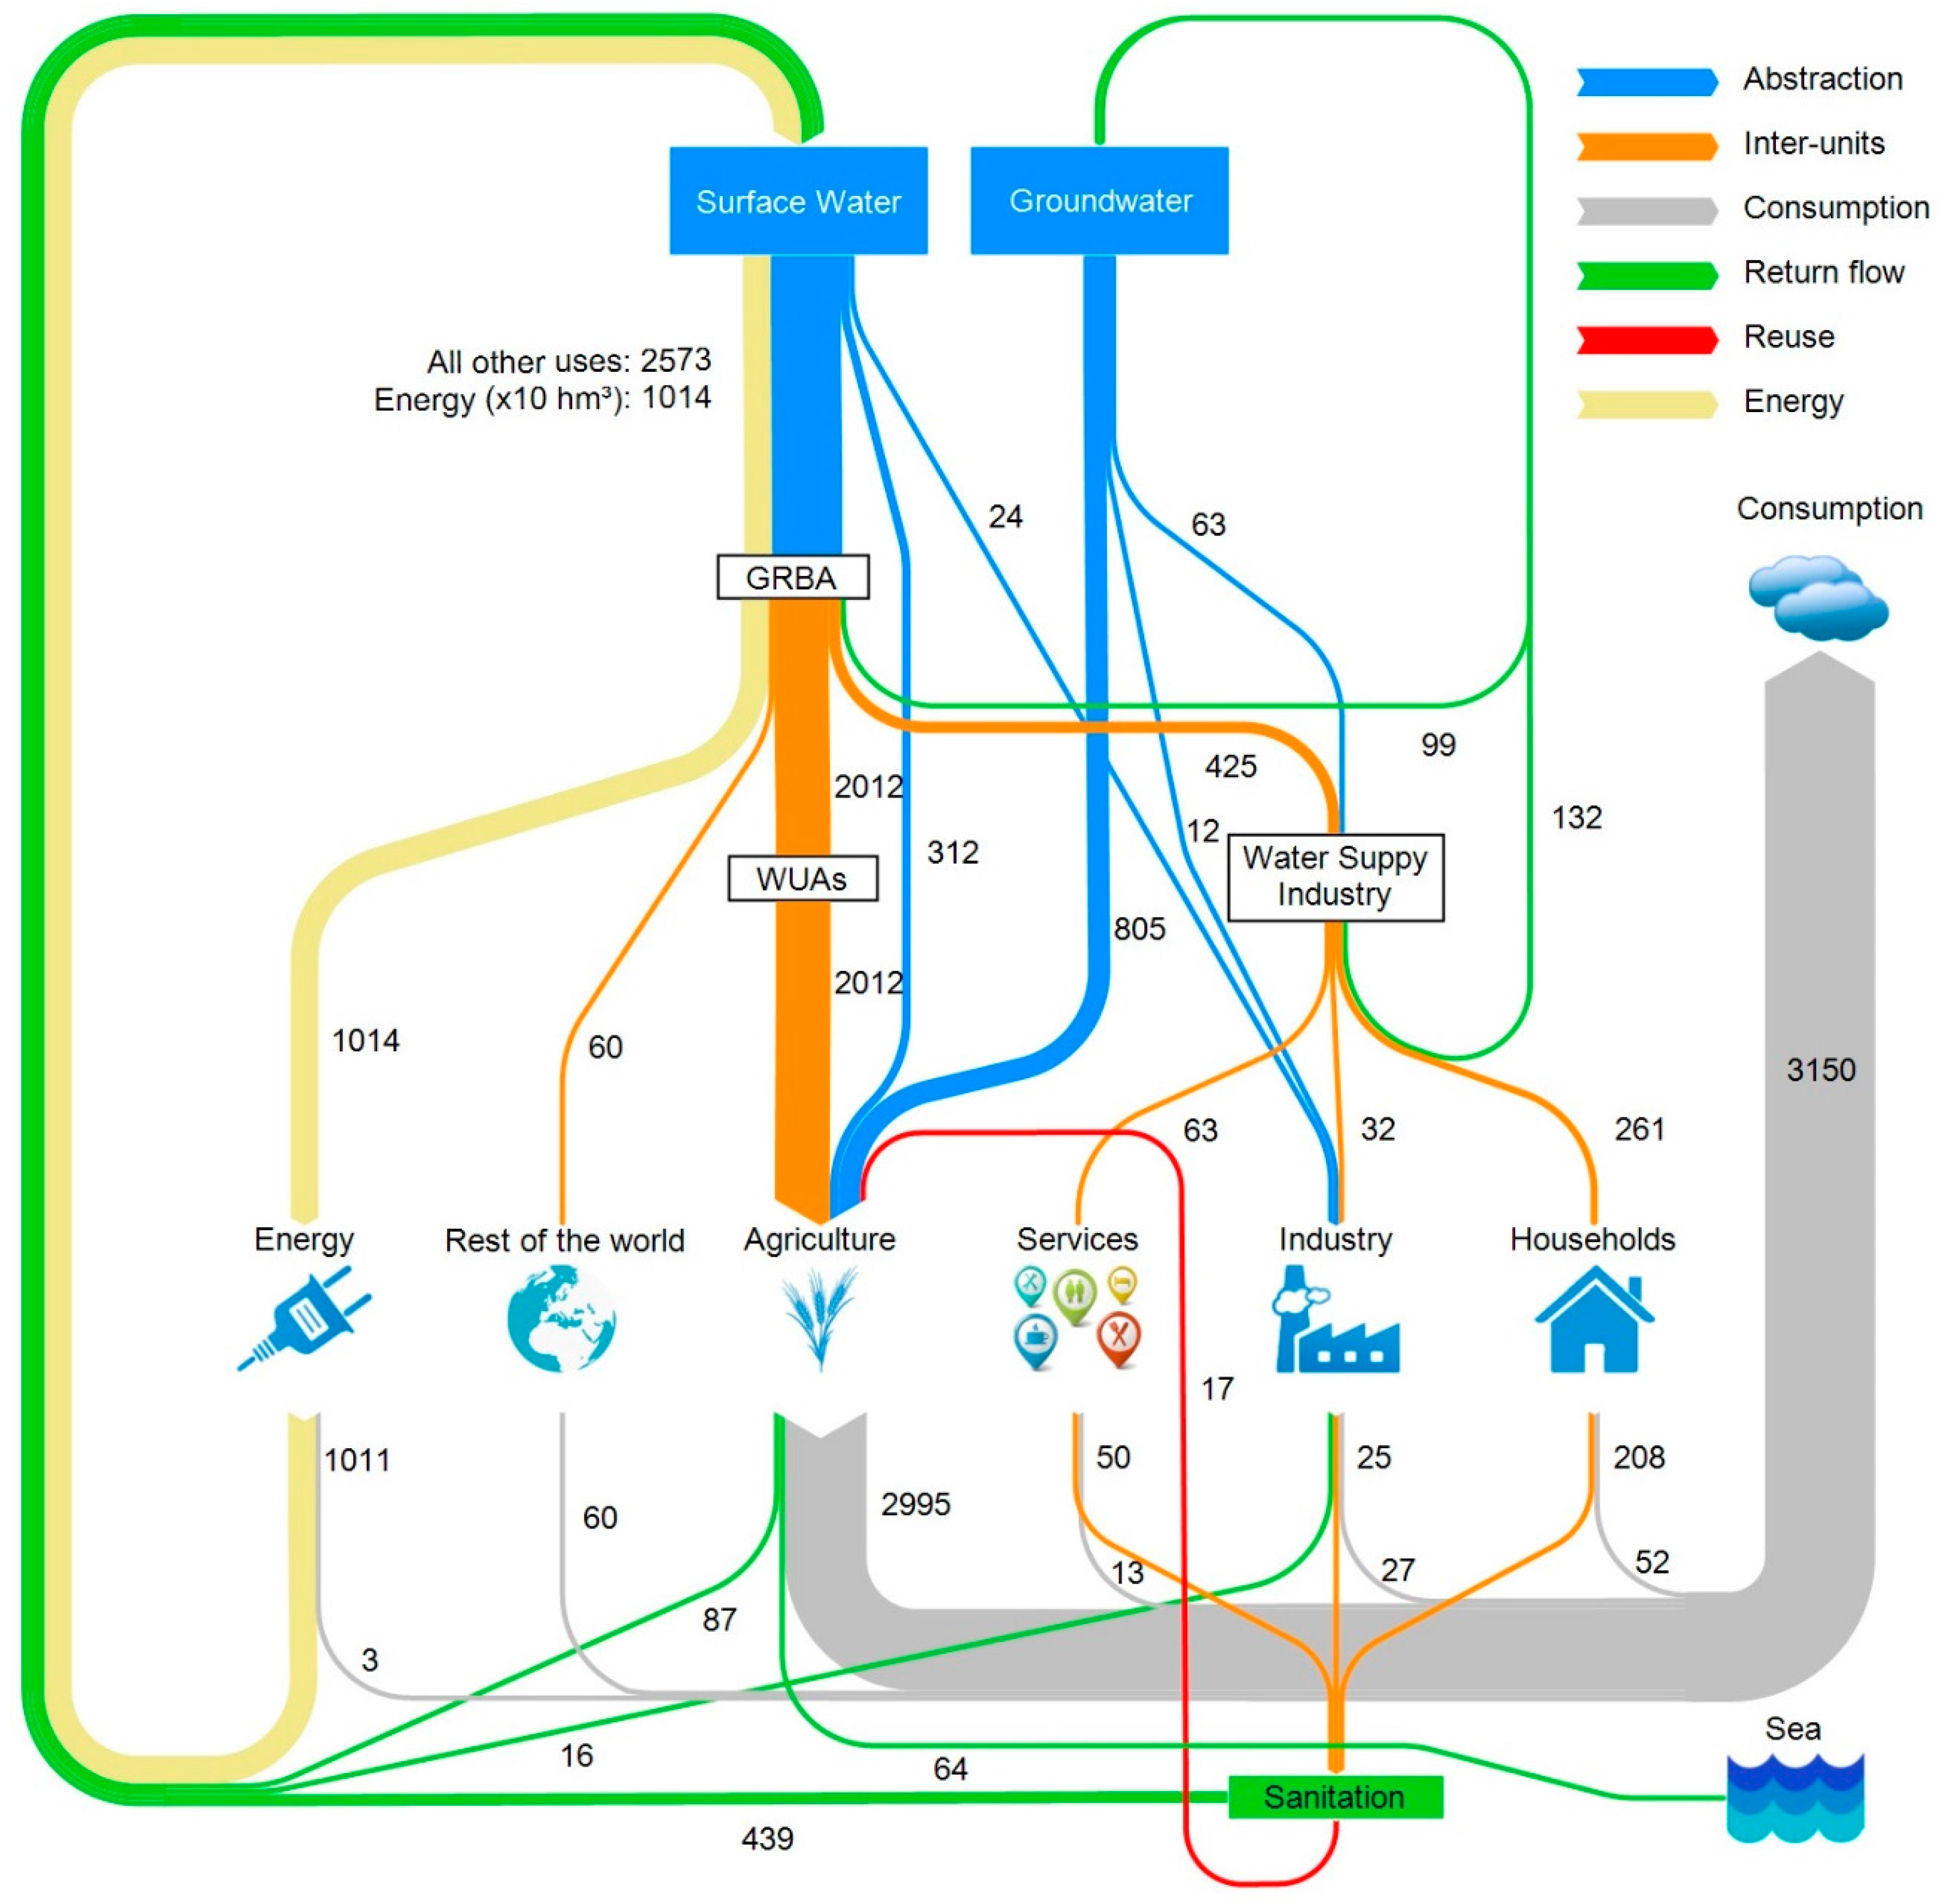
Figure 3 is a Sankey diagram that shows, at a glance, several aspects of the water cycle such as economic units, abstraction, supply, use, consumption, and returns to environment (soil water not included). In studying water use pathways, Sankey diagrams illustrate quantitative information about flows, their relationships, and their transformations. Curmi et al. [
40] describe several developments of Sankey diagrams related to water and show results of a stochastic water model using this kind of diagram. Smith et al. [
41] produced a Sankey diagram of water flows in the economy for each state in the USA and Kumar et al. [
42] developed separate Sankey diagrams for water use and allocation.
The Sankey diagram in
Figure 3 shows nodes or economics units: (1) water sources are represented by blue boxes; (2) water suppliers are in white boxes; (3) all final users are shown, including the ‘rest of the world’ (water transfers to other basins) and sanitation as a previous step to return flows to environment. Regarding flows, the diagram shows: (1) water abstracted from surface or groundwater sources by water suppliers and users; (2) water distributed from suppliers to final users; (3) water use by economic units; (4) water consumption by economic units that are ‘lost’ to the atmosphere; and (5) returns of water to the environment either directly or through sewerage.
5.1. Agriculture
Soil water is not a part of water supply by agents as it is abstracted directly from the environment by plants (forest, pasture or agricultural land, irrigated, and rain-fed alike). Soil water is also known as ‘green water’ although the notions of green and blue water imply that soil moisture, groundwater, and surface flows are separate, distinct, and independent sources of water, whereas they are in fact interdependent components of the same hydrological system [
43]. The hydrologic impact of the conversion of forest land to crop and livestock production has been to decrease in situ evapotranspiration (green water consumption), while increasing irrigation (blue water production). The sum of green water plus blue water explains the large quantity of water used by agriculture.
As
Figure 4 illustrates, in Guadalquivir, soil water represents 86% of the water consumed by the primary sector, with the remaining 14% supplied by irrigation (blue water). Total consumption quantity that only includes blue water for agriculture is a more familiar measure for those who have analyzed the basin. As far as consumption is concerned, water for agricultural purposes was 96% of total consumption in 2012. As agriculture is the basin’s main consumer of blue water, the River Basin Plan focuses on quantitative measures in the implementation of water-saving measures for this sector (see Berbel et al. [
14,
44] for an analysis of the cost and impact of water-saving investment in the basin).
5.2. Industry
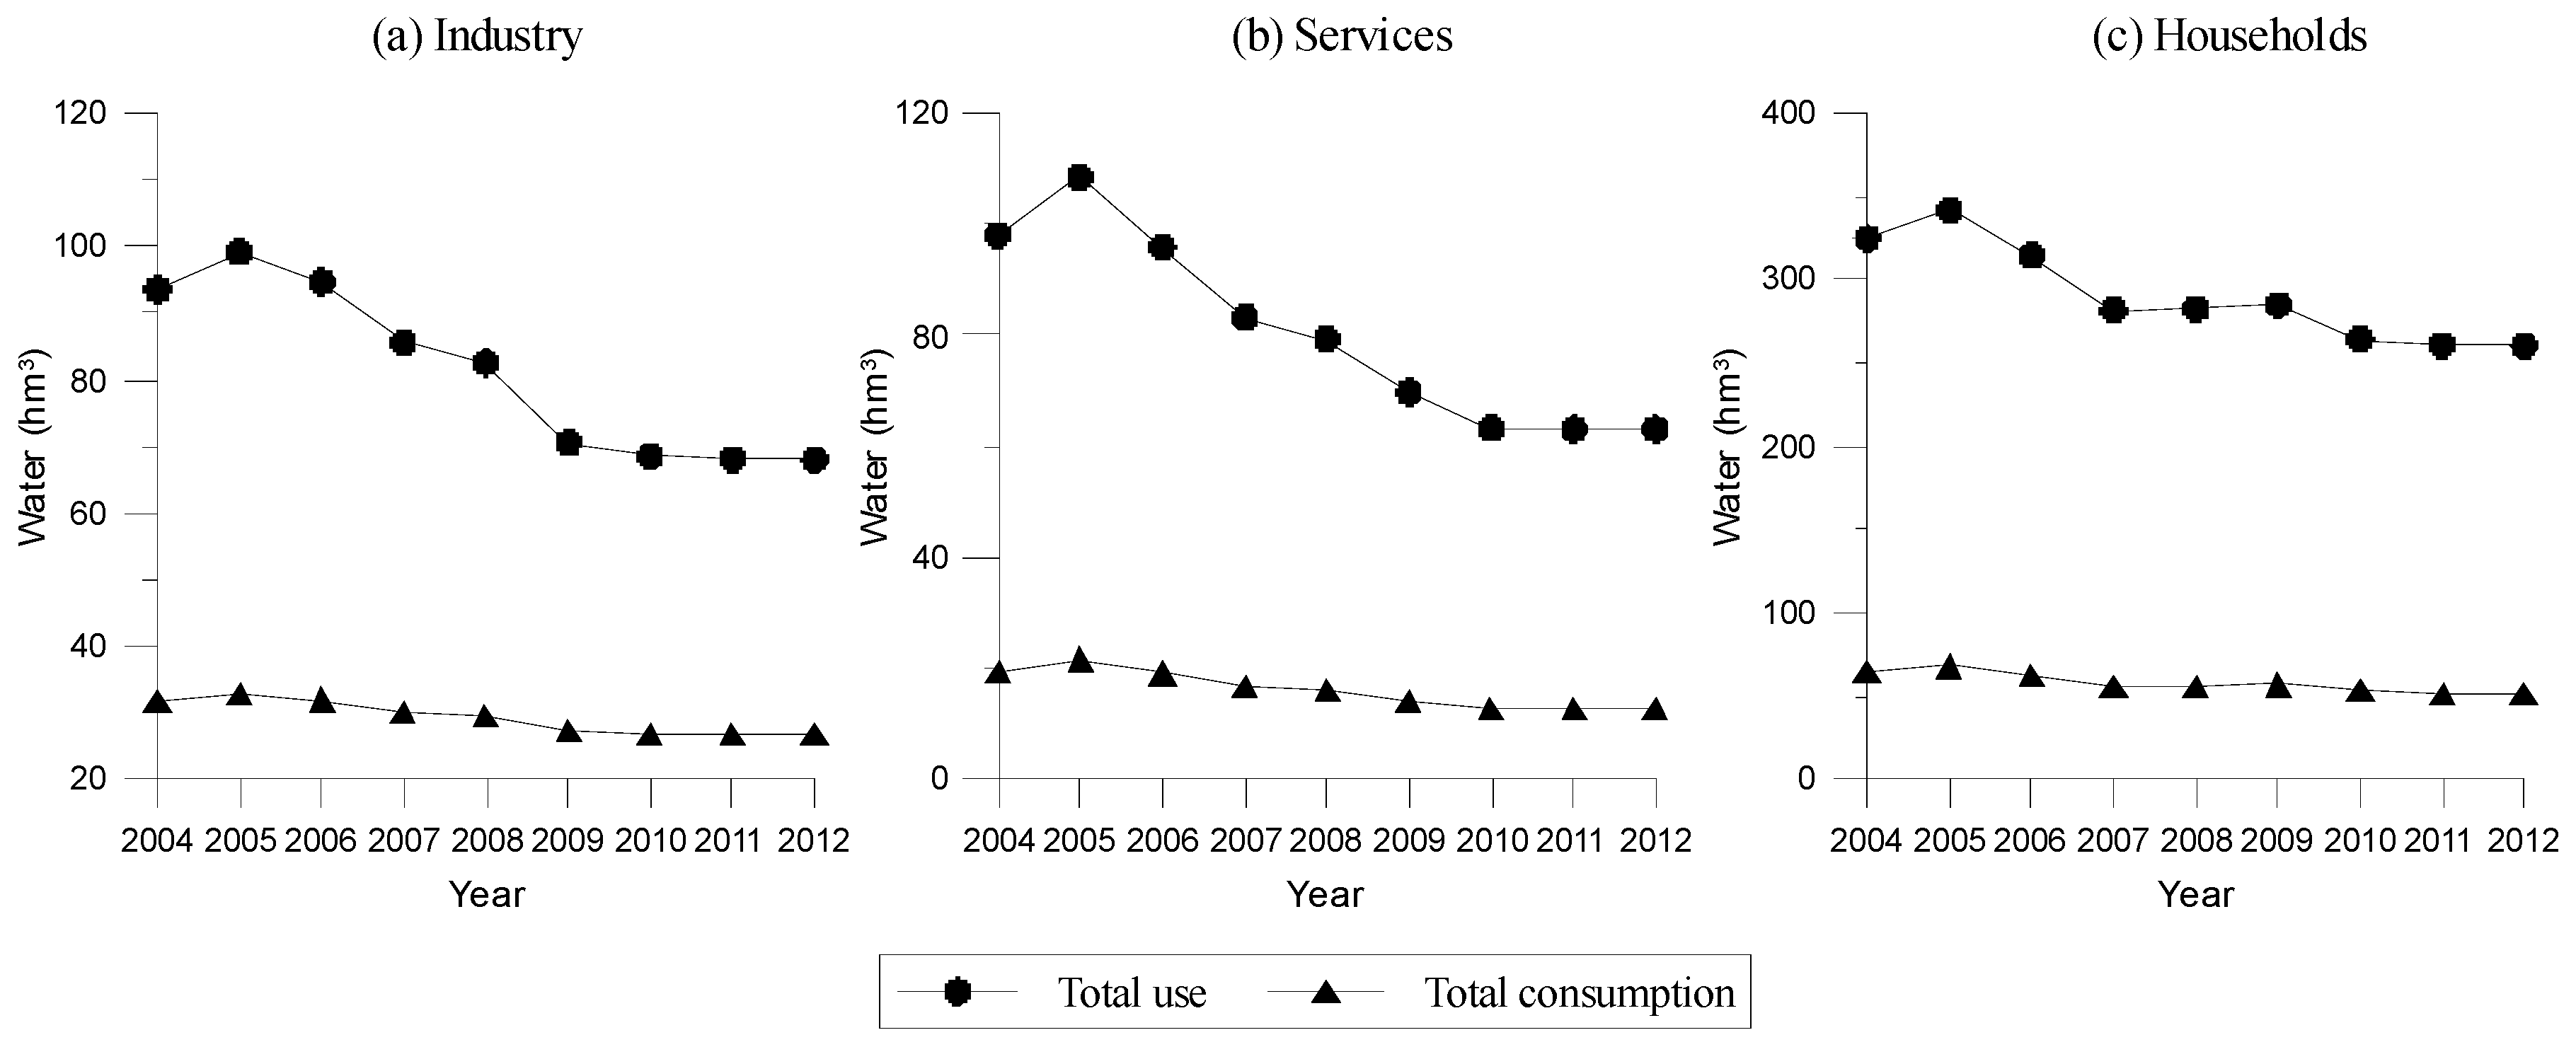
Industry uses less than 1% of total water in the GRB and represents around 1% of total consumption. Returns to environment are important in this sector and on average only 36% of water used by the sector is consumed (see
Figure 5a). Both total use and consumption have decreased in the period analyzed, but use has dropped more sharply than consumption, which shows only a slight decrease. The different slope of these two curves illustrates the industrial sector’s improved water efficiency.
5.3. Energy
The energy sector uses a large amount of water as 10,139 hm3 is supplied by GRBA but it only consumes 31 hm3, representing a small proportion of use. The energy sector’s water use represented 21% of total use of water in 2012, (average 17%–19% in meteorologically normal years). It also represents 38% to 41% of supplied water but, as pointed out above, it only represents less than 0.2% of total consumption in the basin. This water is used in hydroelectricity power generation and in cooling water for thermal power generation. Water for hydroelectricity power generation is returned immediately to the environment, whereas discharging cooling water may cause thermal pollution.
5.4. Services
Service industries are supplied by ISIC division 36, water collection, treatment, and supply. The service sector consumes a small proportion of supplied water and discharges wastewater to sewerage. From 2005 onwards, a reduction in both water use and water consumption can be observed in service industries (see
Figure 5b). As in the industrial sector, there is a sharper decrease in water use than in consumption, suggesting an improvement in water use efficiency.
5.5. Households
In 2012, the 4,107,598 inhabitants of the Guadalquivir River Basin used 261 hm
3 supplied by ISIC division 36, collection, treatment, and supply of water. It should be noted that the physical supply of water by households generally represents a flow of wastewater to ISIC division 37, sewerage. Households consumption is estimated at 20% of water supplied, representing between 1.7% and 3.5% (depending on the year) of total water consumption in the basin. Nevertheless, it is worth noting that households are a priority user.
Figure 5c, in line with previous analysis, shows how households’ water use decreases steadily from 2005 onwards.
5.6. GVA and Water Productivity
The estimation of Gross Value Added (GVA) by sector is based on different official databases that have been used to compute GVA principally in terms of the economic units included in SEEA-Water
Table S1.4. Economic activities in Guadalquivir River Basin generated around €65.8 billion in 2012, equivalent to 7% of the value of Spanish production. Over 75% of GVA in the Guadalquivir River Basin is concentrated in the service sector. The weight of industrial activities is lower at about 18% of GVA, while agricultural activity at 5% and energy production at 1% are relatively less important in terms of GVA.
It should be noted that Common Agricultural Policy (CAP) subsidies have been removed from the agricultural GVA for the years 2004 and 2005. From 2006 onward, the reformed CAP no longer includes price support, and so to allow comparison of all economic data in the period we have subtracted price support from the official GVA data for the first two years of the series. This ad hoc solution does not mean a loss in replicability. Although we perform this adjustment to make the estimation more realistic, it will not be necessary to make ad hoc adjustments for data after 2006 (
Table 3).
The industrial and energy sectors show decreasing relative rates of change in the period under study, of 1.5% and 1.1% per year respectively, while the services sector has experienced growth of approximately 4.7% per year in the same period and the agricultural sector remains broadly unchanged.
Physical and economic data allow us to produce an apparent productivity index for each sector as an indicator of water-resource efficiency [
4]. Nevertheless, apparent water productivity captures not only the productivity of the water resource, but also includes other factors, mainly land, labor, capital, and management [
45].
Table 4 shows a proposal to evaluate the (apparent) productivity of the different sectors based on GVA and use of blue water. The result is unexpected as the energy sector registers the lowest productivity in GVA/m
3, because the denominator is water use and not consumption. Another relevant result is the high (apparent) productivity of irrigation with values close to 1.33 EUR/m
3, which would be much lower if soil water were taken into account.
6. Discussion
Systems integration is a key issue for consistent hydrological and economic data. Several systems have been used to develop SEEA-Water physical tables [
29,
30]. At the same time, SEEA-Water has to be useful to others as a platform that combines physical and economic data, being especially suitable for Article 5 of the WFD.
Although the baseline scenario is similar to others in previous studies of Guadalquivir [
46,
47], the different studies show very different changes in water use over time. Although those authors estimated increasing water use based on past trends, actual water use has decreased for industry, services, and households. This observation is in line with the analysis of other Spanish basins, and there are a number of reasons for this change: the economic crisis, increased distribution efficiency (improved networks), social education, reduced household water use, the effectiveness of the Programme of Measures (first cycle of WFD implementation), water price increases, etc. More research is needed to understand the driving forces of the decline in both use and consumption of these economics units, and this would help us to estimate coming trends for the next stage of the WFD. Nevertheless, the trend in agricultural water use does appear to correspond to that indicated by these authors, although the variability of the agricultural sector is more driven by the meteorological and hydrological conditions, since there is limited irrigated area. Again, further research is needed to assess the effect of investment in water system efficiency and management at the farm level.
The analysis of changes in water consumption that we report in
Figure 5 shows an improvement in the economic productivity of water use, and the analysis of
Table 4 shows a fluctuating value of water that depends on the existence of drought conditions and the general economic context. Nevertheless, even with this instability, there is an upward trend in productivity both globally and also by individual sectors, which points to increasing productivity of water. This positive effect can be explained by multiple factors including general technical progress, influence of WFD, CAP and European environmental policy, social consciousness, response to increasing water prices or resource scarcity, as well as many other factors that require further analysis and are beyond the scope of this research.
Apparent productivity values are in the range of the values reported by the Hydrological Plan [
48]; estimating the value of irrigation water at 0.77 EUR/m
3, energy generation in the range 0.004 cent·€/m
3 to 0.134 cent·€/m
3, and industry productivity 82.69 EUR/m
3. Carrasco et al. [
49] studied changes in irrigated crop water productivity for the Guadalquivir basin between 1989 and 2005 using statistical data at a regional and crop level, indicating that the irrigated crop water productivity was (in 2005 prices) 0.12 EUR/m
3 in 1989 and increased to 0.50 EUR/m
3 for 2005 (9% annual growth). Exposito and Berbel [
50] continue this analysis finding that irrigation water productivity in the basin has stagnated between 2005 and 2012. Berbel et al. [
51] also studied water productivity ratios, producing a similar figure for 2005. Borrego-Marín et al. [
31] study the productivity of water based on SEEA-Water methodology. They separately examine blue water productivity and total water productivity (blue plus green) within irrigated agriculture, finding an average productivity of 1.33 EUR/m
3 and 0.48 EUR/m
3, respectively.
The use of SEEA-Water as a common tool may harmonize the reporting process of WFD member states. Unfortunately, however, we are not able to offer more extrapolation of the results to some problems of the others regions or basins because the number of available case studies (regions or basins) where SEEA-Water has been applied is limited (see literature review).
7. Conclusions
The objective of our research is to show if it is possible to rely on SEEA-Water for the reporting process of the Water Framework Directive. We have developed a methodology to integrate both and tested its applicability in a European basin from 2004 to 2012. From our point of view, we have demonstrated that this integration is possible and it may help to harmonize reporting process of WFD, especially regarding economic analysis (Article 5, economic characterization of water uses; and Article 9, recovery of the cost of water services).
The results show that SEEA-Water can be valuable for the WFD in several ways: (i) it can be used to perform an analysis of water use almost directly from hybrid tables; (ii) it allows an estimation of river basin water productivity values with the economic data included in the water accounting (the analysis of the ratio over the 2004–2012 period for the economic sectors in Guadalquivir River Basin provides useful knowledge about water productivity in these years); and (iii) the hybrid nature of the accounts enables analysts to assess the cost recovery of water services.
We believe that this paper demonstrates that the use of the SEEA-Water to analyze economic characteristics offers many advantages in terms of standardizing reporting procedures and knowledge sharing in the implementation of WFD Article 5. These advantages include (a) common definition from SEEA handbook; (b) common requirements for information from official published sources; (c) standard presentation through common templates; (d) hybrid tables linking economic and physical data; and (e) easy revision in subsequent cycles. These advantages allow for accounting and analysis of the pressures, which helps to evaluate the impact on the state of the water bodies and therefore to define the measures needed. Additionally, studying time series changes in water indicators can be observed. This is particularly useful when analyzing effects of water policy measures.
Nevertheless, this methodology has some limitation in its development. Firstly, it is necessary that information was available for every item to be accounted for. This depends on the data availability in each region or country and not always it is possible. Occasionally, this leads to making some assumptions that may be justified. Secondly, even when information is available, it is not always in the appropriate scale; it is quite common for the information to be on an administrative scale that does not match the required hydrographic scale when working at basin level. Finally, SEEA-Water cannot be used to account for ecosystem services apart from provisioning ones, which constitutes a promising line for a future research.
Finally, as far as the case study is concerned, recent years show an inversion of the expected trend in some economic units. In this regard, all urban water final uses—including industry, services and households—have reduced both water use and consumption, with the latter reduction being more than proportional to the former. Further research will be needed to assess the driving forces that lead to these results, in order to forecast water use in the Guadalquivir River Basin.


