Article

Experimental Manipulation of Precipitation Affects Soil Nitrogen Availability in Semiarid Mongolian Pine (Pinus sylvestris var. mongolica) Plantation

1
Institute of Eco-Environmental Sciences, Liaoning Shihua University, Fushun 113001, Liaoning, China
2
Institute of Applied Ecology, Chinese Academy of Sciences, Shenyang 110016, Liaoning, China
3
Department of Medical Administration, the General Hospital of Shenyang Military Area, Shenyang 110001, Liaoning, China
*
Authors to whom correspondence should be addressed.
Water 2017, 9(3), 208; https://doi.org/10.3390/w9030208
Submission received: 28 October 2016 / Revised: 22 February 2017 / Accepted: 9 March 2017 / Published: 12 March 2017

Abstract

:
Expected changes in precipitation over large regions of the world under global climate change will have profound effects on terrestrial ecosystems in arid and semiarid regions. To explore how changes in the amount of precipitation in the growing season would affect soil nitrogen (N) availability in a semiarid ecosystem, we established rainout shelters and irrigation systems by simulating 30% reduced (DRY) and 30% increased precipitation (WET) relative to natural precipitation (Control) to measure some key soil process properties for two growing seasons in a nutrient-poor Mongolian pine (P. sylvestris var. mongolica) plantation. Both WET and DRY treatments significantly affected monthly soil inorganic nitrogen concentrations, which showed a higher inorganic N under DRY than Control in each month and lower in WET than Control. Monthly soil microbial biomass N content was reduced by DRY and raised by WET treatments. The results indicated the asynchrony of the availability of soil moisture and soil nutrients in Mongolian pine plantations at the Horqin Sandy Lands in Northeast China. Water limited plant growth in Mongolian pine plantations when precipitation decreased, and nitrogen limitation became increasingly important when precipitation increased. Accumulation of N in microbial biomass is an important mechanism for N cycling in this ecosystem. To effectively manage Mongolian pine plantations, it is advised that evapotranspiration is minimized when precipitation decreases and that there is an increase in soil N availability by protecting litterfall when precipitation increases.

1. Introduction

Global climate change is expected to alter precipitation regimes over large regions of the world [1,2,3,4]. A great deal of research has focused on the effects of precipitation on biomass production [5,6,7], with fewer studies examining the effects of precipitation change in the soil properties of arid and semiarid ecosystems [8,9,10,11,12]. Weltzin et al. [13] proposed that changes in precipitation regimes will have greater effects on ecological processes in arid and semiarid regions than global warming and increasing levels of CO2 due to the central role that water plays in determining the future structure and function of ecosystems. In water-limited ecosystems, water availability affects the dynamics of ecosystems both directly through water supply to organisms and indirectly through soil moisture effects on key ecosystem processes like decomposition, mineralization, and nutrient availability [8,10,14]. Precipitation is a key driver in determining chemical and biological processes; however, previous studies on the relationships between water and N availability have yielded mixed results, with N availability increasing with decreasing water content [8,9,15]. Therefore, further experiments were needed to determine the details of altered N availability following changes in precipitation.
In arid and semiarid regions, nitrogen (N) is a key factor—after water—that determines plant productivity [16,17]. The study of controls on N cycling is challenging due to the complexity of desert ecosystems, in particular, the effects of changes in precipitation and soil moisture as governing factors in microbial mineralization and the resulting soil inorganic N availability are poorly understood [10,12]. The main methods for studying such effects are: (1) laboratory incubations [15]; (2) long-term site observations [18]; (3) measurements along natural precipitation gradients [8,19]; and (4) manipulative field experiments [9,10,20,21,22]. Each of these approaches have advantages and limitations. For instance, the laboratory incubation of soil containing different soil water content is a logical way to simulate the effects of a change in water availability on the N mineralization rate; however, the laboratory environment can rarely simulate natural conditions accurately. Although they are an important source of information regarding the amount of precipitation and soil N availability, long-term site observations are difficult to obtain over the long term and are therefore scarce. The effects of precipitation are difficult to distinguish from the effects of other factors such as temperature, soil property, and altitude [13,19] using observations across natural precipitation gradients, as is the degree to which the ecosystem is in a state. Furthermore, an inter-annual variability of precipitation is critical in deserts [23,24,25]. N accumulates in the soil and becomes available to plants when moisture conditions are optimal. This phenomenon constrains long-term observations at desert sites and observations across natural precipitation gradients. The manipulative field experiment—although not without its shortcomings [13]—is another approach where the relationship between precipitation and N availability can be explored, as it can effectively target a certain vegetation type or ecosystem [9,10,21,26].
We conducted a manipulative field study on a Mongolian pine (P. sylvestris var. mongolica) plantation located in the Horqin Sandy Lands, northeast China. The experiment was designed to explore how the ecosystem would respond to a change in precipitation in the semiarid, nutrient-poor Horqin Sandy Lands, where accurate forecasts for future precipitation change are currently unavailable [27,28]. Our main hypotheses were to examine: (1) whether increased precipitation would decrease N availability; and (2) whether decreased precipitation would restrain the microbial immobilization of N. Our main objective was to test these hypotheses and explore how these effects occur in this ecosystem. Such information is important in the management of Mongolian pine plantations and other natural resources for maintaining stability and protecting the biodiversity of the ecosystem under potential precipitation changes.

2. Materials and Methods

2.1. Study Site

Mongolian pine—a geographical variety of Scots pine (Pinus sylvestris)—is a cold- and drought-resistant coniferous species that is widely used in sandy infertile soils for the establishment of protective plantations in the “Three-North” (Northwest, North, and Northeast) region of China. In the past 60 years, Mongolian pine trees have been planted for wind prevention and soil erosion control in more than 300 counties belonging to 13 provinces in the Three-North regions, and the total area has reached more than 300,000 ha in Northern China [29,30]. More broadly, Scots pine is an important tree species both commercially and environmentally, and is widely distributed throughout the northern hemisphere, between 40° and 70° N.
The study was carried out at the Daqinggou Ecological Station, which is located at the southeastern edge of the Horqin Sandy Lands, Northeast China (42°54’ N, 122°24’ E) (Figure 1), in Kezuohou County, Inner Mongolia Autonomous Region. The site is located at an elevation of 247 m and belongs to a dry sub-humid monsoon temperate climate zone characterized by cold, dry winters and warm, humid summers. The mean annual precipitation is 452 mm with more than 60% occurring between June and September, and the mean annual evaporation is 1780 mm [31]. The mean annual temperature is 6.2 °C; the coldest month is January, which has an average of −16.2 °C; and the hottest month is July, which has an average temperature of 23.8 °C. The average annual frost-free period is 150 days [28,32]. The soil is an aeolian sandy soil with a typical composition of 90.9% sand, 5.0% silt, and 4.1% clay, which developed from sandy parent material through the action of wind and is characterized by coarse texture and loose structure [28,33,34]. The soil total organic carbon (TOC), total nitrogen (TN) and total P (TP) concentration at 0–15 cm are 4.35–5.22 g·kg−1, 300–346 mg·kg−1, and 125–149 mg·kg−1, respectively. The gravimetric soil water content at field capacity is about 22% [31].
The Mongolian pine plantation was established in the early Spring of 2002 with the planting of 4-year-old seedlings at a spacing of 2.5 m × 3.5 m, before the area was fenced off to prevent disturbance by humans or local fauna. Immediately prior to beginning the installations of the precipitation systems in October 2006, the average tree height was 2.86 m, with an average diameter at breast height of 9.50 cm and an average canopy size of 1.8 × 1.8 m. The understory forbs and grasses had a cover of 85%–90% and were dominated by Artemisia scoparia, Cannabis sativa, Chenopodium acuminatum, and Erodium stephanianum. The root systems of the Mongolian pine trees and understory species were partitioned in the soil profile. The roots of the understory species were predominantly (>80%) distributed in the top 0–15 cm layer with some roots extending deeper; whereas the roots of Mongolian pine trees around 15–20 years of age [32,35] were predominantly (>80%) found in the 10–30 cm layer with some roots extending to depths of about 100 cm.

2.2. Experimental Design

The precipitation systems were installed in October 2006. During the first two growing seasons, the trees and understory were restored when needed to ensure adequate vegetation growth before the precipitation manipulation system was used so that the effects of disturbance on the trees and understory were minimized. Subsequently, soil was quantified for soil N availability by investigating nine 13 × 7 m2 plots based on a 5-year precipitation experiment at Daqinggou Ecological Station. In 2014, the average tree height was 3.28 ± 0.28 m; the average diameter at breast height was 7.27 ± 0.34 cm; and the average canopy closure was 65% ± 4.27%. Nine 13 × 7 m2 plots were selected, where each plot had two rows of trees with six trees in each row (Figure 1). Precipitation was manipulated during the growing season in these plots (three plots for each treatment) to achieve three treatments, as follows: (1) natural precipitation quantity (our control treatment under ambient precipitation conditions, denoted CK) where these plots were fenced and precipitation events were not altered; (2) reduced precipitation quantity (denoted DRY), where fixed-location rainout shelters and irrigation systems were built to exclude natural precipitation and manipulate the precipitation quantity. Each time a natural precipitation event occurred, only 70% of the natural precipitation amount was immediately applied to these DRY plots. The last three plots were to monitor increased precipitation quantity (denoted WET), where irrigation systems to manipulate the precipitation quantity were built. After receiving natural precipitation, an additional amount equating to 30% of the natural precipitation was applied to these plots immediately. Thus, in these three treatments, the precipitation quantity was manipulated without altering the timing of the precipitation events. The 30% decrease and 30% increase in precipitation quantity were designed as they represented rare but documented precipitation quantities in the current climate [21].
To eliminate the interactions with surrounding plants, water, and nutrients, we trenched a 1.5 m depth around each plot and lined it with black polyethylene film to prevent lateral movement of soil water and the effects of neighboring plants. When these trenches were backfilled, we extended the barrier 15 cm above the ground surface to prevent the lateral movement of surface water flow.

2.3. Precipitation Manipulation System

Aside from the rainout shelters constructed to exclude natural rainwater over the three replicate plots for the DRY treatment, the plots were left exposed to the natural elements. The rainout shelter consisted of a steel frame coated with a clear polyethylene film and a rainwater collection and storage system (Figure 2). The arched roof was held 2 m above ground at the two sides and was 3.5 m high at the apex. Gutters on two sides channeled rainwater into a storage tank, which was made of sheet iron covered with PVC to minimize light penetration. The tank was completely sealed except for two holes for rainwater input and output. The rainout shelters were open-sided to maximize air movement and minimize impacts to temperature and relative humidity (Figure 2). As we wished to manipulate precipitation only during the growing season, each rainout shelter was covered with polyethylene film from the beginning of May and removed at the end of October.
Irrigation systems were installed over the six plots; three each for the DRY and WET treatments, but not for the CK treatment receiving natural precipitation. The irrigation system consisted of a series of irrigation nozzles arranged over a plot. The rainwater intercepted by the rainout shelters was pumped from the storage tank to the nozzles. Irrigation was applied immediately after natural precipitation events during the growing season from May to October.
A series of measurements were taken once a week in each treatment plot to examine the magnitude of the potential effects of the precipitation manipulation system on the microclimate during the growing season. PAR (photosynthetically active radiation) measurements were taken at two-hour intervals with a 1.0 m linear LiCor quantum sensor (LI-190SB; Li-Cor Inc., Lincoln, NE, USA) placed 1.5 m above ground level. AT (air temperature) and RH (relative humidity) were measured at one-hour intervals with a series of HOBO 8-bit temperature/RH smart sensors (Onset Computer, Bourne, MA, USA) at 1.5 m above ground level. ST (soil temperature) was measured at one-hour intervals with thermometers placed at a depth of 10 cm.

2.4. Sample Collection and Analysis

Three subsamples were collected from each plot mid-month from June–October 2014 (first year) and 2015 (second year). Three soil cores were taken randomly from the top 0–15 cm layer with a 5.0 cm inner-diameter soil coring device before all cores were mixed together and treated as one bulk sample. Soil cores were taken from random locations within the plots at least 80 cm away from the plot borders, but were not taken from locations beneath tree canopies. The soil samples were placed in water-tight polyethylene bags at the time of collection to maintain field moisture content. The heights of the Mongolian pine trees were recorded using tape measures, and the diameter at breast height (DBH) was taken using Vernier calipers to calculate growth. The trees in each plot were all measured in May 2014 and again in May 2015. Around mid-August, during the period of peak biomass accumulation, five 1 × 1 m2 subplots in each plot were selected and all the aboveground biomass of grasses was harvested to estimate the aboveground net primary productivity (ANPP). A soil core was extracted from each subplot using a 10 cm diameter auger. Roots were picked from the cores first by hand, before the soil was washed through 0.5 mm mesh sieves. The root fractions were dried and weighed, and their combined weight was used as the estimate of root biomass.
Needle samples were collected (total fresh mass >300 g) from different canopy positions, mixed evenly, stored in closed bags, and brought back to the laboratory for measurement and then cleaned with deionized water. The needle and understory samples were oven-dried at 70 °C to a constant weight so that the total mass of all the dried samples could be weighed to determine the dry mass. The oven-dried plant samples were then ground to analyze nutrient concentration. N concentration was subsequently determined using the Kjeldahl method [31]. The plant N uptake by both Mongolian pines and understory vegetation was estimated as the biomass incensement and N concentration.
On return to the laboratory, the gravimetric soil water content (SWC, mg·g−1) was determined by placing a subsample of soil in the oven at 105 °C for 48 h. The remainder of each bulk soil sample was sieved through a 2 mm mesh to remove the coarse fraction and roots. Soil samples were stored in a refrigerator until they were analyzed within 48 h of sampling. Soil NH4+-N (mg·kg−1) and NO3-N (mg·kg−1) were extracted from 20 g subsamples in 50 mL 2 mol·L−1 KCl solution shaken for 0.5 h [36], and then measured with a continuous-flow analysis (AutoAnalyzer 3, Bran+Luebbe GmbH, Norderstedt, Germany). The soil inorganic N (mg·kg−1) was calculated as the sum of NH4+-N and NO3-N. The soil microbial biomass nitrogen content (MBN, mg·kg−1) was determined using the chloroform fumigation-extraction method [37].

2.5. Data Analyses

The main effect of precipitation on soil N availability, plant N concentration, and plant N uptake were analyzed using one-way ANOVA (Analysis of Variance). A repeated measures analysis was performed to test for a time main effect, as well as treatment by time interactions [38]. Fisher’s protected LSD (least-significant difference) test was used to compare means for all significant effects (p < 0.05). Pearson’s correlation coefficients between MBN (Soil microbial biomass nitrogen) and soil NH4+-N, NO3-N, and inorganic N were calculated. Linear fitting was used for the relationship between SWC and NH4+-N, NO3-N, and MBN during the growing season for all plots. All statistical analyses were performed using SPSS 22.0.

3. Results

3.1. Precipitation Manipulation and Its Effects on Microenvironment

Precipitation during the growing season (May–October, inclusive) was 236 mm in 2014—a value less than the growing-season mean of 270 mm. In 2015, precipitation during the growing season (May–October, inclusive) was 357 mm, and was concentrated during July–August (Figure 3). The efficiency of rainfall collection by the rainout shelters was over 97% (rain gauge estimate was 2147.6 L, actual storage was 2083.2 L). Precipitation amounts (i.e., total water) applied during the growing season in DRY and WET treatments were 160.2 mm and 297.6 mm in 2014 and 242.3 mm and 450.2 mm 2015, respectively.
The changes in microenvironment caused by precipitation manipulation were small. The average high daily PAR was reduced by 8.5%–16.3% under the rainout shelters compared to CK. AT and RH under the rainout shelters and in CK were almost the same at night. Daytime air temperature was increased by 0.3–0.6 °C and daytime RH was reduced by 3.0%–3.3% under the rainout shelters, compared to the CK. ST increased on average by 2.1 °C and 2.3 °C under the rainout shelters during the daytime and night-time, respectively (Table 1).

3.2. Gravimetric Soil Water Content

During the growing season, increased precipitation (WET treatment) significantly raised the soil water content (SWC), while decreased precipitation (DRY treatment) significantly reduced it (p < 0.05) (Table 2); therefore, the SWC dynamics during the two periods of growing season showed a similar pattern across the three treatments, with maximums in August and minimums in June. For example, the SWC ranged from 0.125 to 0.766 mg·g−1 in the WET treatment, 0.040 to 0.410 mg·g−1 in the DRY treatment, and 0.068 to 0.623 mg·g−1 in the CK treatment in 2014. When compared to the CK, the WET treatment caused a large increase in SWC by 83.9% (2014) and 52.5% (2015) in June when soils were relatively dry, and caused a smaller increase in SWC by 22.9% (2014) and 37.3% (2015) in August when soils were wetter.
The DRY treatment had nearly symmetrical effects on the SWC where it declined by 41.78%–59.31% in June and July, and 27.75%–73.23% in later months. The precipitation treatment, month, and precipitation treatment by month interactions all had significant effects on the SWC (p < 0.05) (Table 3).

3.3. Soil Nitrogen Fractions

The pattern of seasonal fluctuations in soil NH4+-N and inorganic N (NH4+-N plus NO3-N) concentrations were similar across the three treatments. Soil NH4+-N and inorganic N concentrations were strongly positively correlated (Table 4) and were characterized by higher concentrations in June, July, and October; and were lower in August and September (Figure 4 and Figure 6) during the two periods of the growing season. During the growing season, the concentrations of NH4+-N, NO3-N, and inorganic N in June, July, and October were reduced in the WET and significantly increased in the DRY (p < 0.05) (Figure 4, Figure 5 and Figure 6).
In August, the concentrations of NH4+-N, NO3-N, and inorganic N were significantly higher in the DRY than in the CK treatment, while the difference of NO3-N and inorganic N between the WET and CK treatments was not significant except for the second growing season (Figure 4). The mean concentrations of NH4+-N in 2015 were significantly lower than 2014 (Figure 4).
NH4+-N concentrations were very low in September, and there were no significant differences among the three treatments in 2014 (Figure 4). In contrast, NO3-N concentrations were significantly reduced by the WET and raised by the DRY treatment (p < 0.05) (Figure 5). NH4+-N concentration levels in September showed no statistically significant responses to WET or CK treatments, but 2015 levels were significantly higher in the DRY than in the WET treatment (Figure 4), where the same trend of inorganic N was found in 2014 (Figure 6). The precipitation treatment, month, and precipitation treatment by month interactions all had significant effects on NH4+-N, NO3-N, inorganic N, and MBN (p < 0.05) (Table 3).
Similar seasonal patterns in all treatments were shown in the MBN, where higher values occurred in August and September and lower values in July and October (Figure 7). The MBN was significantly lower in the DRY and higher in the WET treatment compared to CK in each month. Pearson’s correlations showed that there was a significant negative relationship between the MBN and NH4+-N (r = −0.668, p < 0.05, n = 12), and NO3-N (r = −0.679, p < 0.05, n = 12), and inorganic N (r = −0.778, p < 0.01, n = 12) (Table 4). Soil NH4+-N, NO3-N was negatively correlated with the SWC during two growing seasons (R2 = 0.413 to 0.451, p < 0.05, Figure 8). With the increase of SWC, the soil NH4+-N concentration declined faster than NO3-N. Furthermore, the MBN was positively associated with soil SWC (R2 = 0.604, p < 0.05, Figure 8).

3.4. Plant Growth in Monglian Pine Plantation and Plant N Uptake

Neither the WET nor DRY treatment had a significant effect on the height and diameter at breast height (DBH) growth of Mongolian pine (Table 5). The difference in the aboveground net primary productivity (ANPP) of the understory among the three treatments was significant (p < 0.05). The ANPP of understory was 1.75–1.98 times greater in the WET than in the DRY treatment, and was intermediate in CK (Table 5). Thus, both WET and DRY treatments had significant effects on the ANPP of the understory and root biomass compared to CK (Table 5). There were no significant differences in needle N concentration in Mongolian pine among all treatments (Figure 9). The values of plant N uptake of Mongolian pine and the understory are shown in Table 6. Total plant N uptake of Mongolian pine and understory was estimated at 12.38–12.89, 15.22–15.54, and 17.64–19.61 g N·m−2 for the growing season in DRY, CK, and WET treatments, respectively (Table 6).

4. Discussion

Global climate change is predicted to alter the rainfall patterns during the growing season. Such changes may affect soil, plant, and ecosystem properties and ultimately impact their productivity [21]. Changes to rainfall are thought to be important in structuring arid and semi-arid plant communities. From an applied perspective, productivity responses to rainfall during the growing season are important, as they influence the capacity of the drylands to sequester carbon [
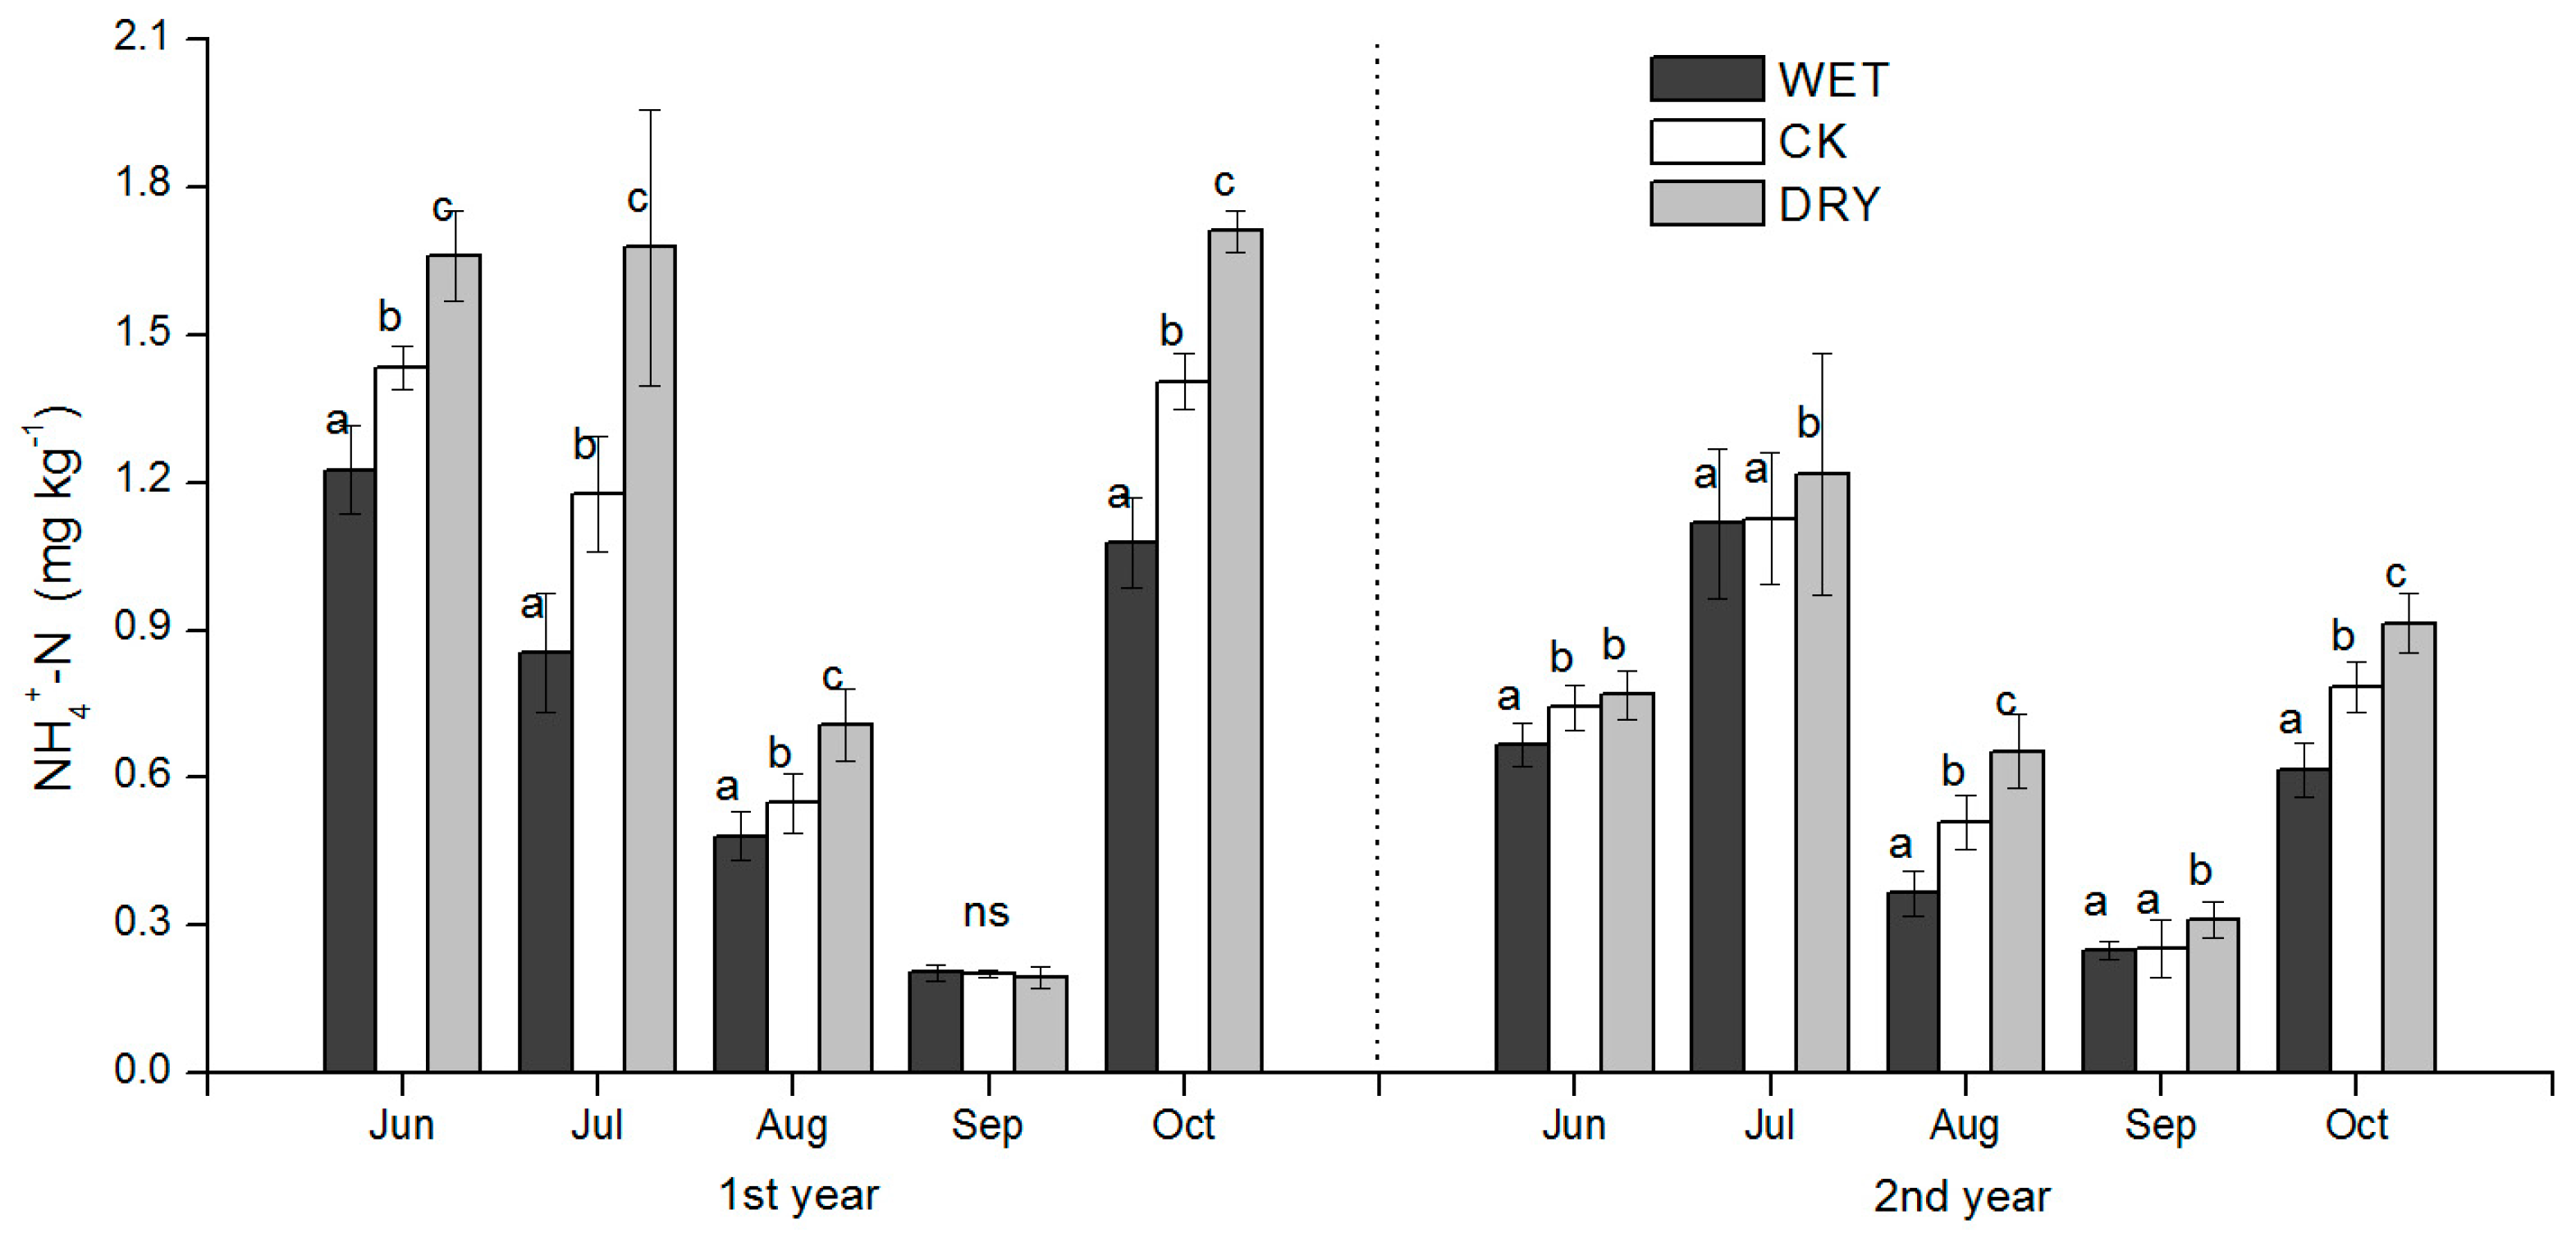
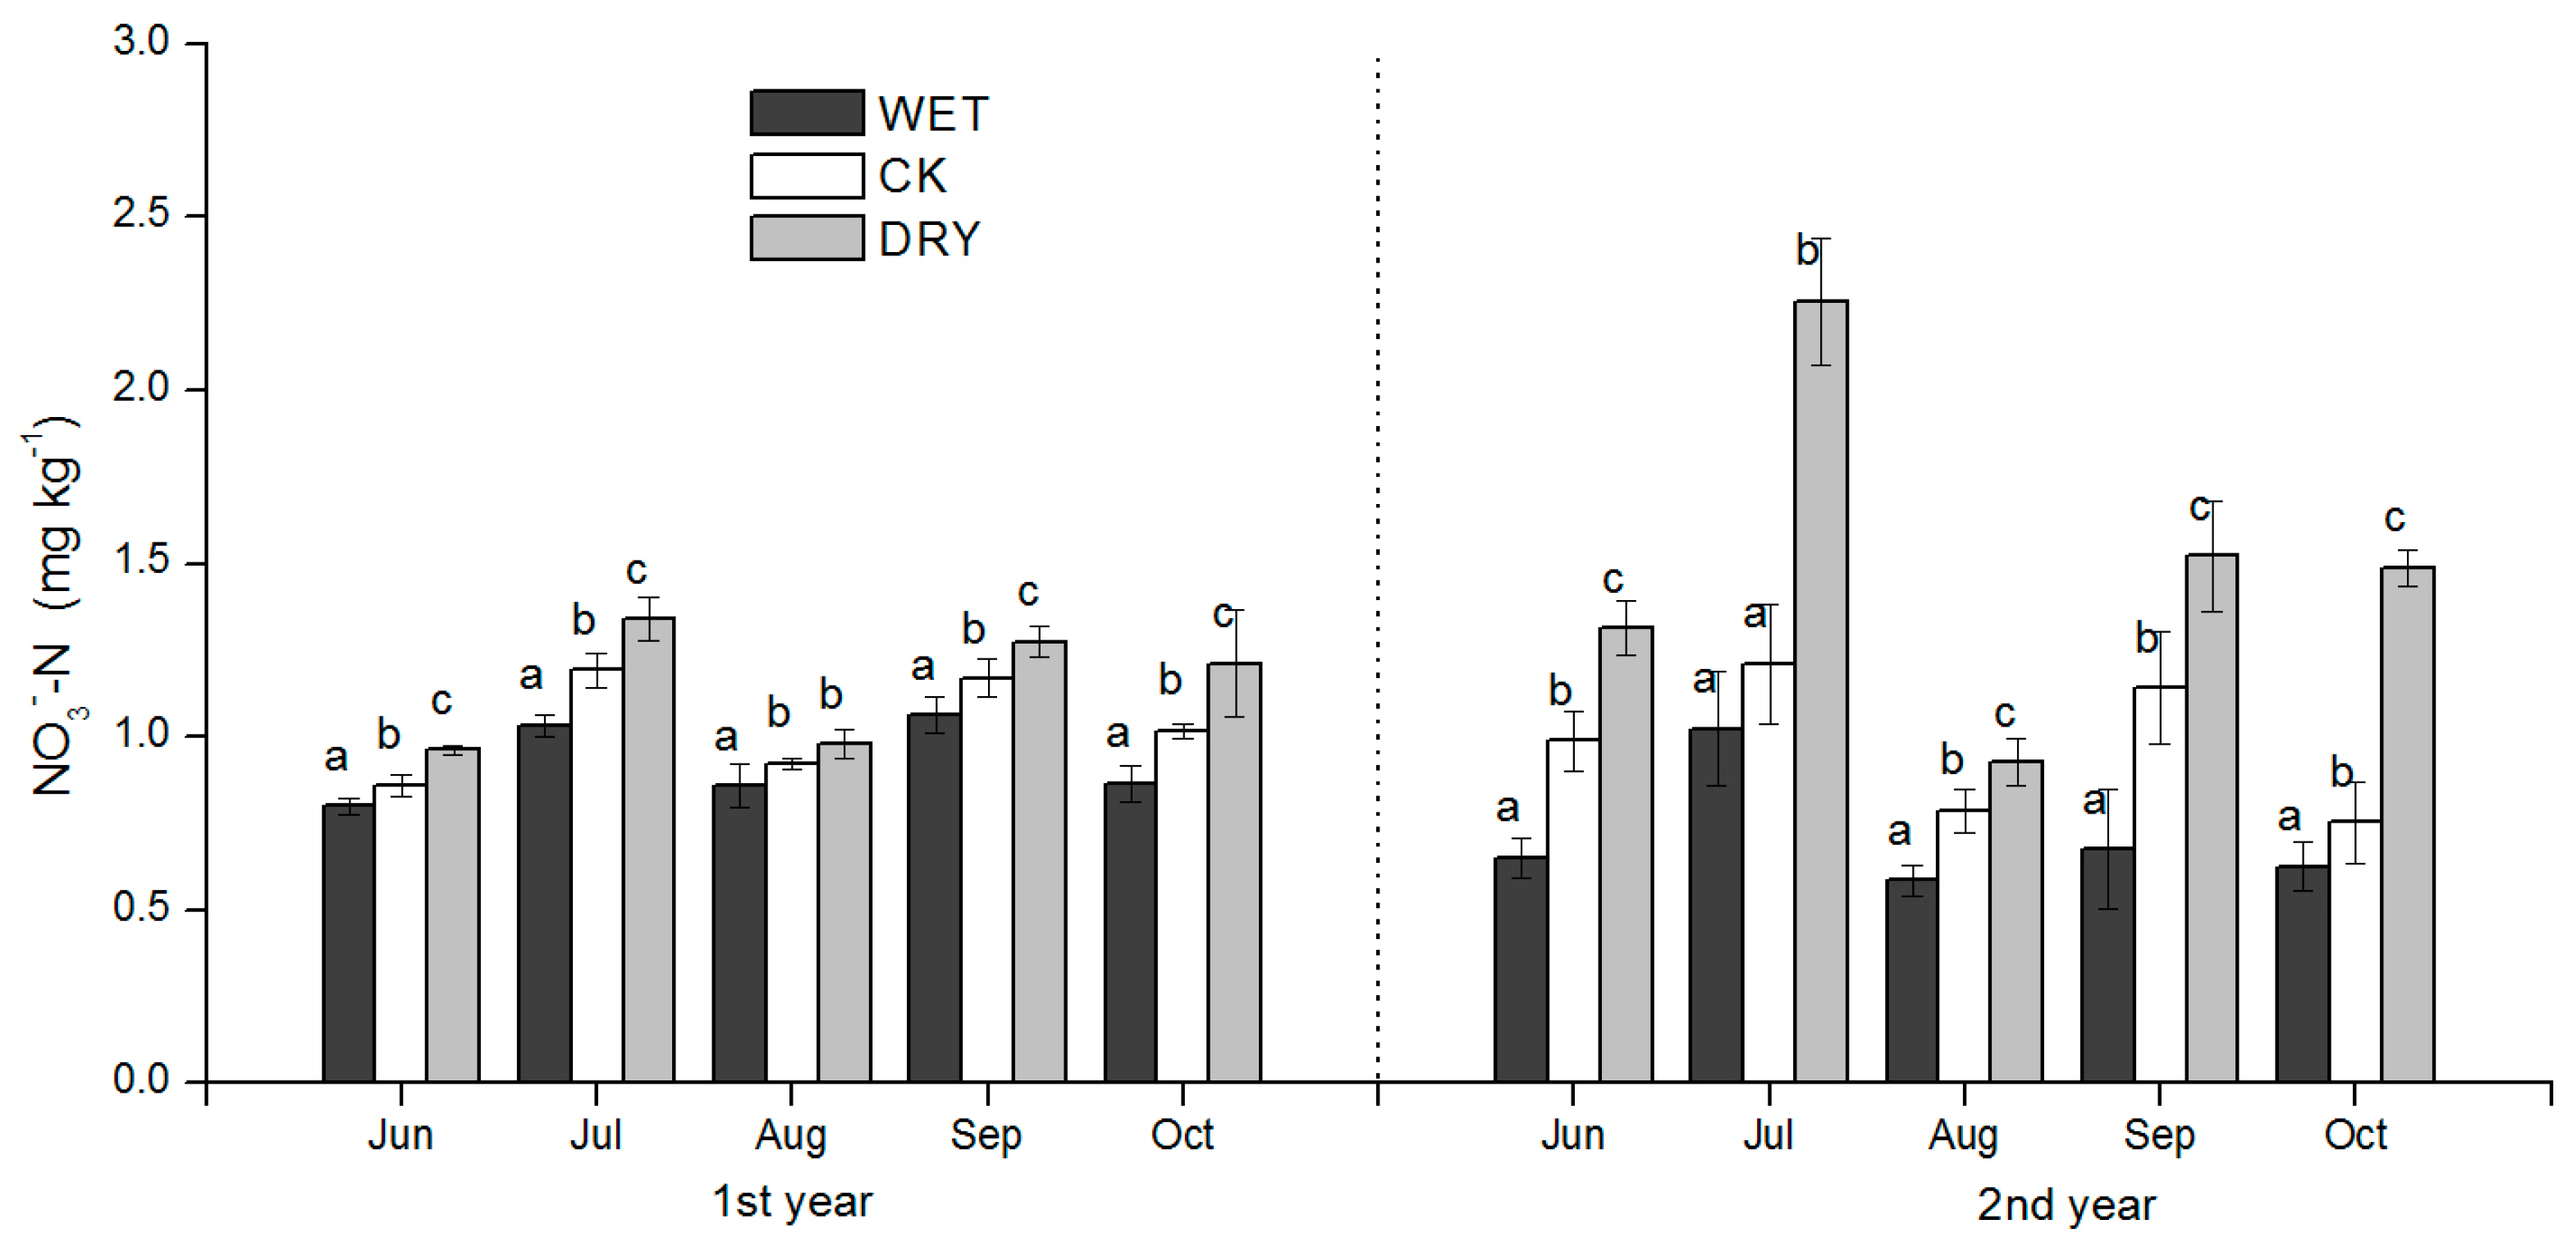
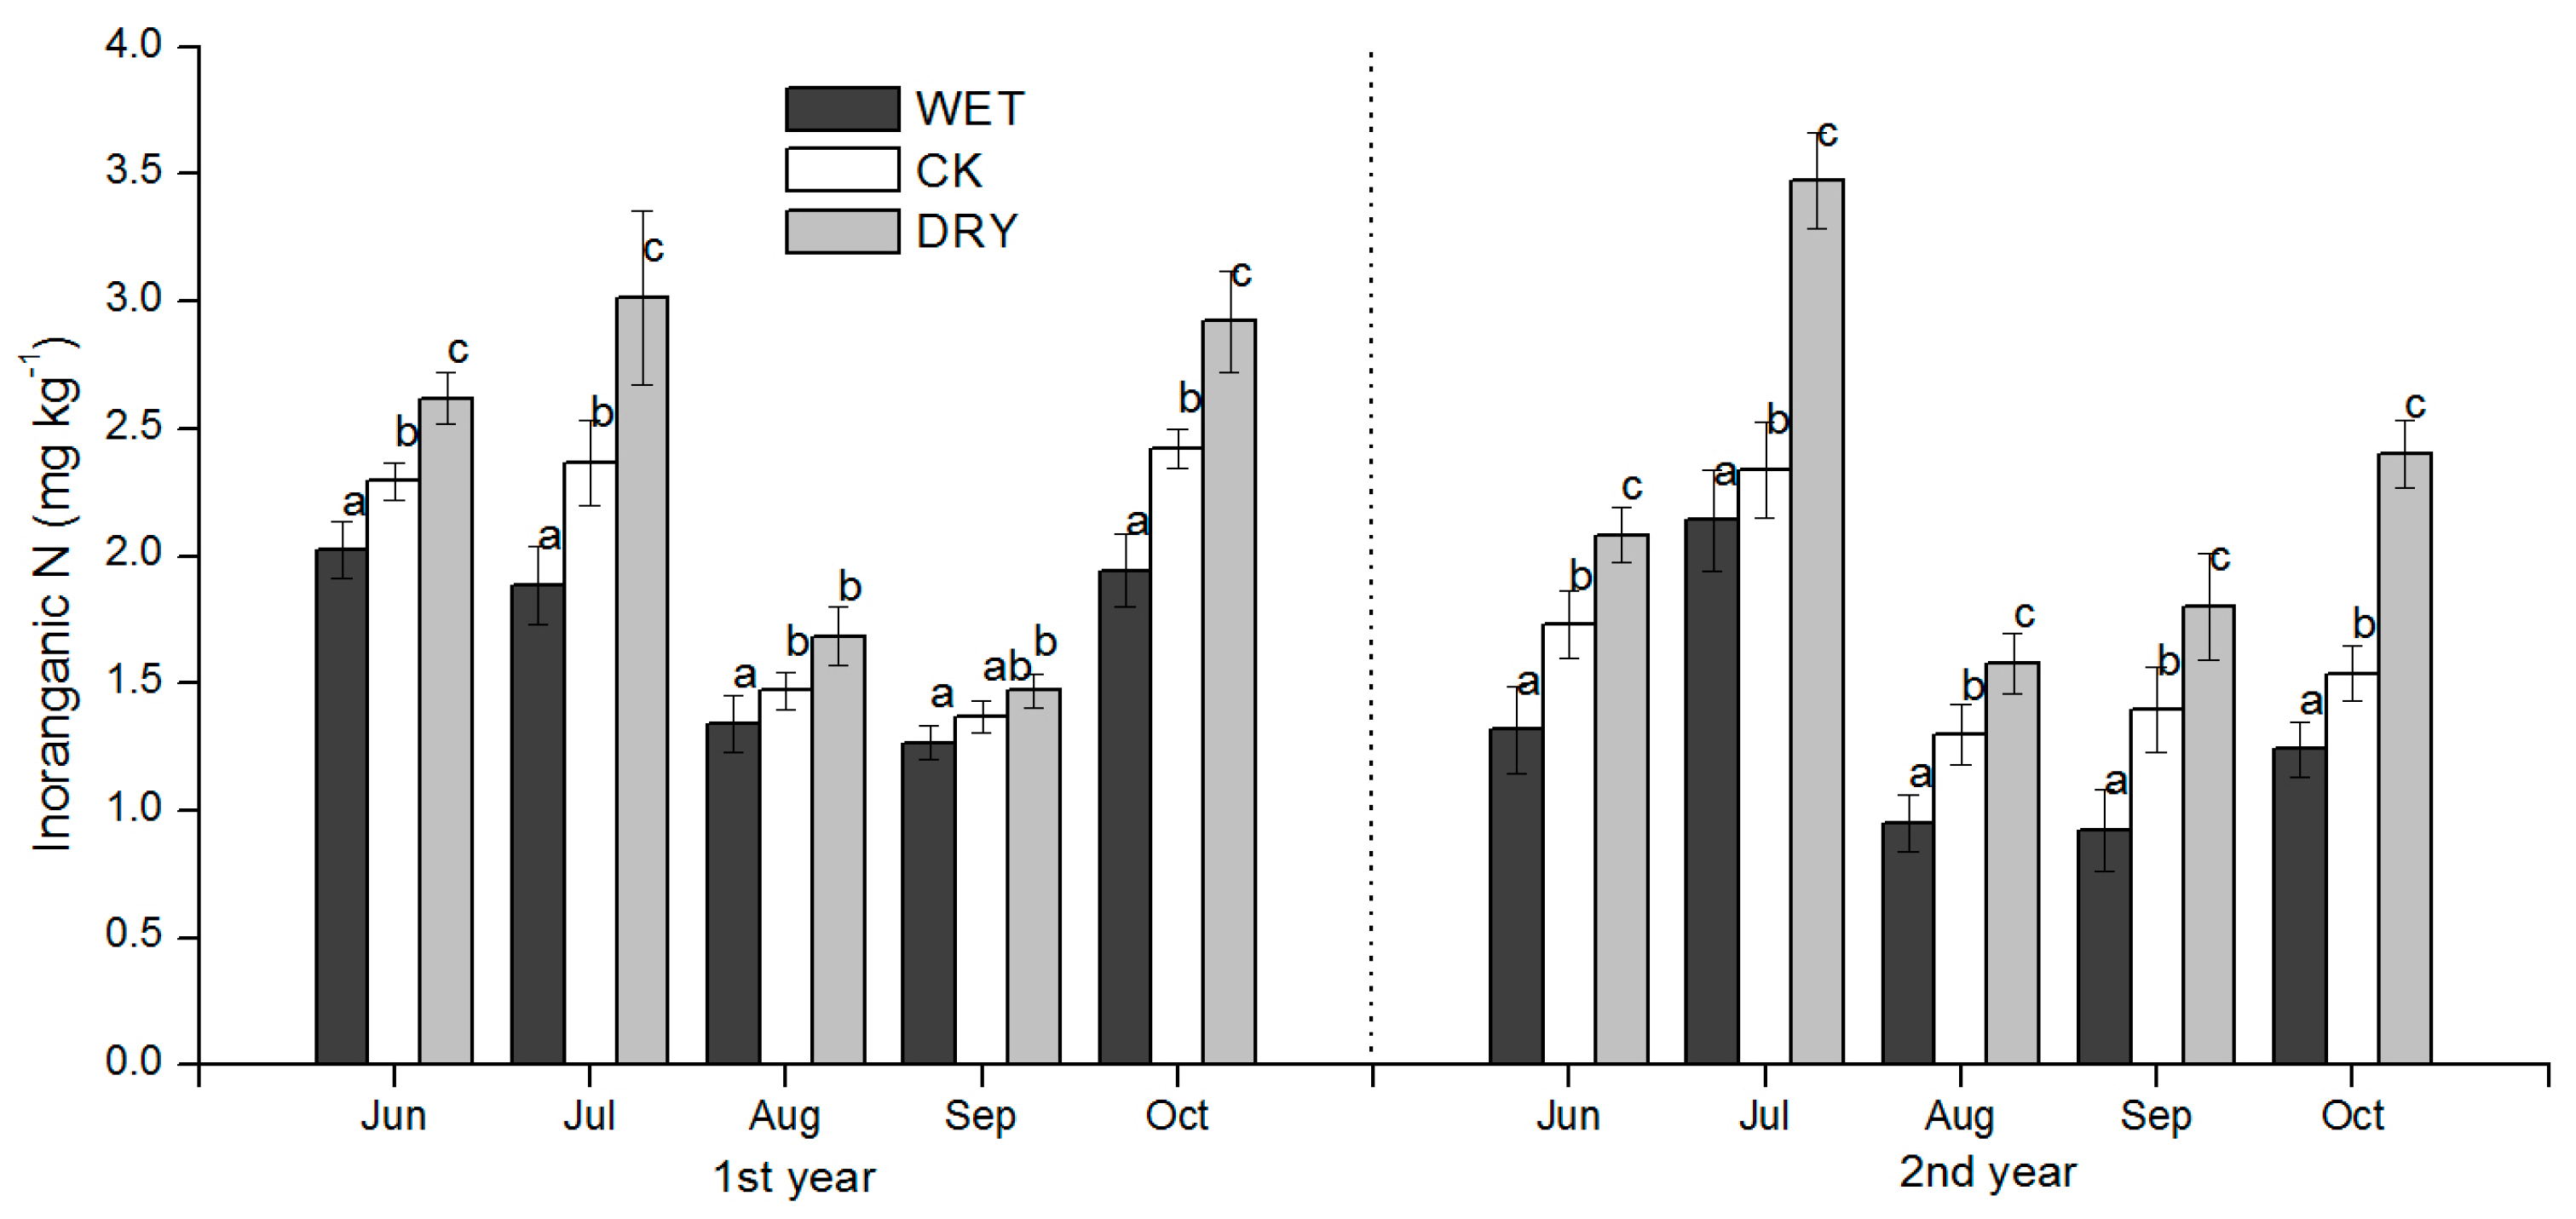
27]. Mongolian pine plantation growth is often water limited, with changes to rainfall during the growth season directly affecting plant photosynthetic characteristics (e.g., stomatal conductance) in semiarid Mongolian pine plantations. The precipitation amount in the growing season had a significant effect on the measured soil inorganic N content, and the direction of change was clear. Our results therefore confirm our hypothesis that in a semiarid Mongolian pine ecosystem: (1) increased precipitation decreases N availability; and (2) decreased precipitation restrains the microbial immobilization of N. The results are consistent with previous studies that have shown an increase of mineral N following drought, and a decrease with increased moisture [8,9,15]. Soil inorganic N and component NH4+-N and NO3-N concentrations in our study were all significantly responsive to WET and DRY treatments except for NH4+-N in September after the peak rain period in July–August, but also after growth increases in microbial biomass, which was an important factor influencing soil N availability. WET and DRY treatments were also clearly reflected in monthly SWC (Table 2) and had a significant effect on the productivity of the understory, both in the peak ANPP and root biomass. We discuss these results in the context of how variation in soil N availability may have occurred under the WET and DRY treatments and what implications they have for natural resource management and further study.

4.1. How Did the Variation in Soil N Availability Occur?

The effects of the increased precipitation amount (WET treatment) and decreased precipitation amount (DRY treatment) were significant over the growing season, and added to the background temporal variation observed under natural precipitation conditions. The effect of changes in the precipitation amount on soil N availability under Mongolian pine plantation (Figure 4, Figure 5 and Figure 6) may be explained by processes controlled by soil moisture such as the immobilization of N by microbes, plant N uptake, and N losses via leaching and volatilization.
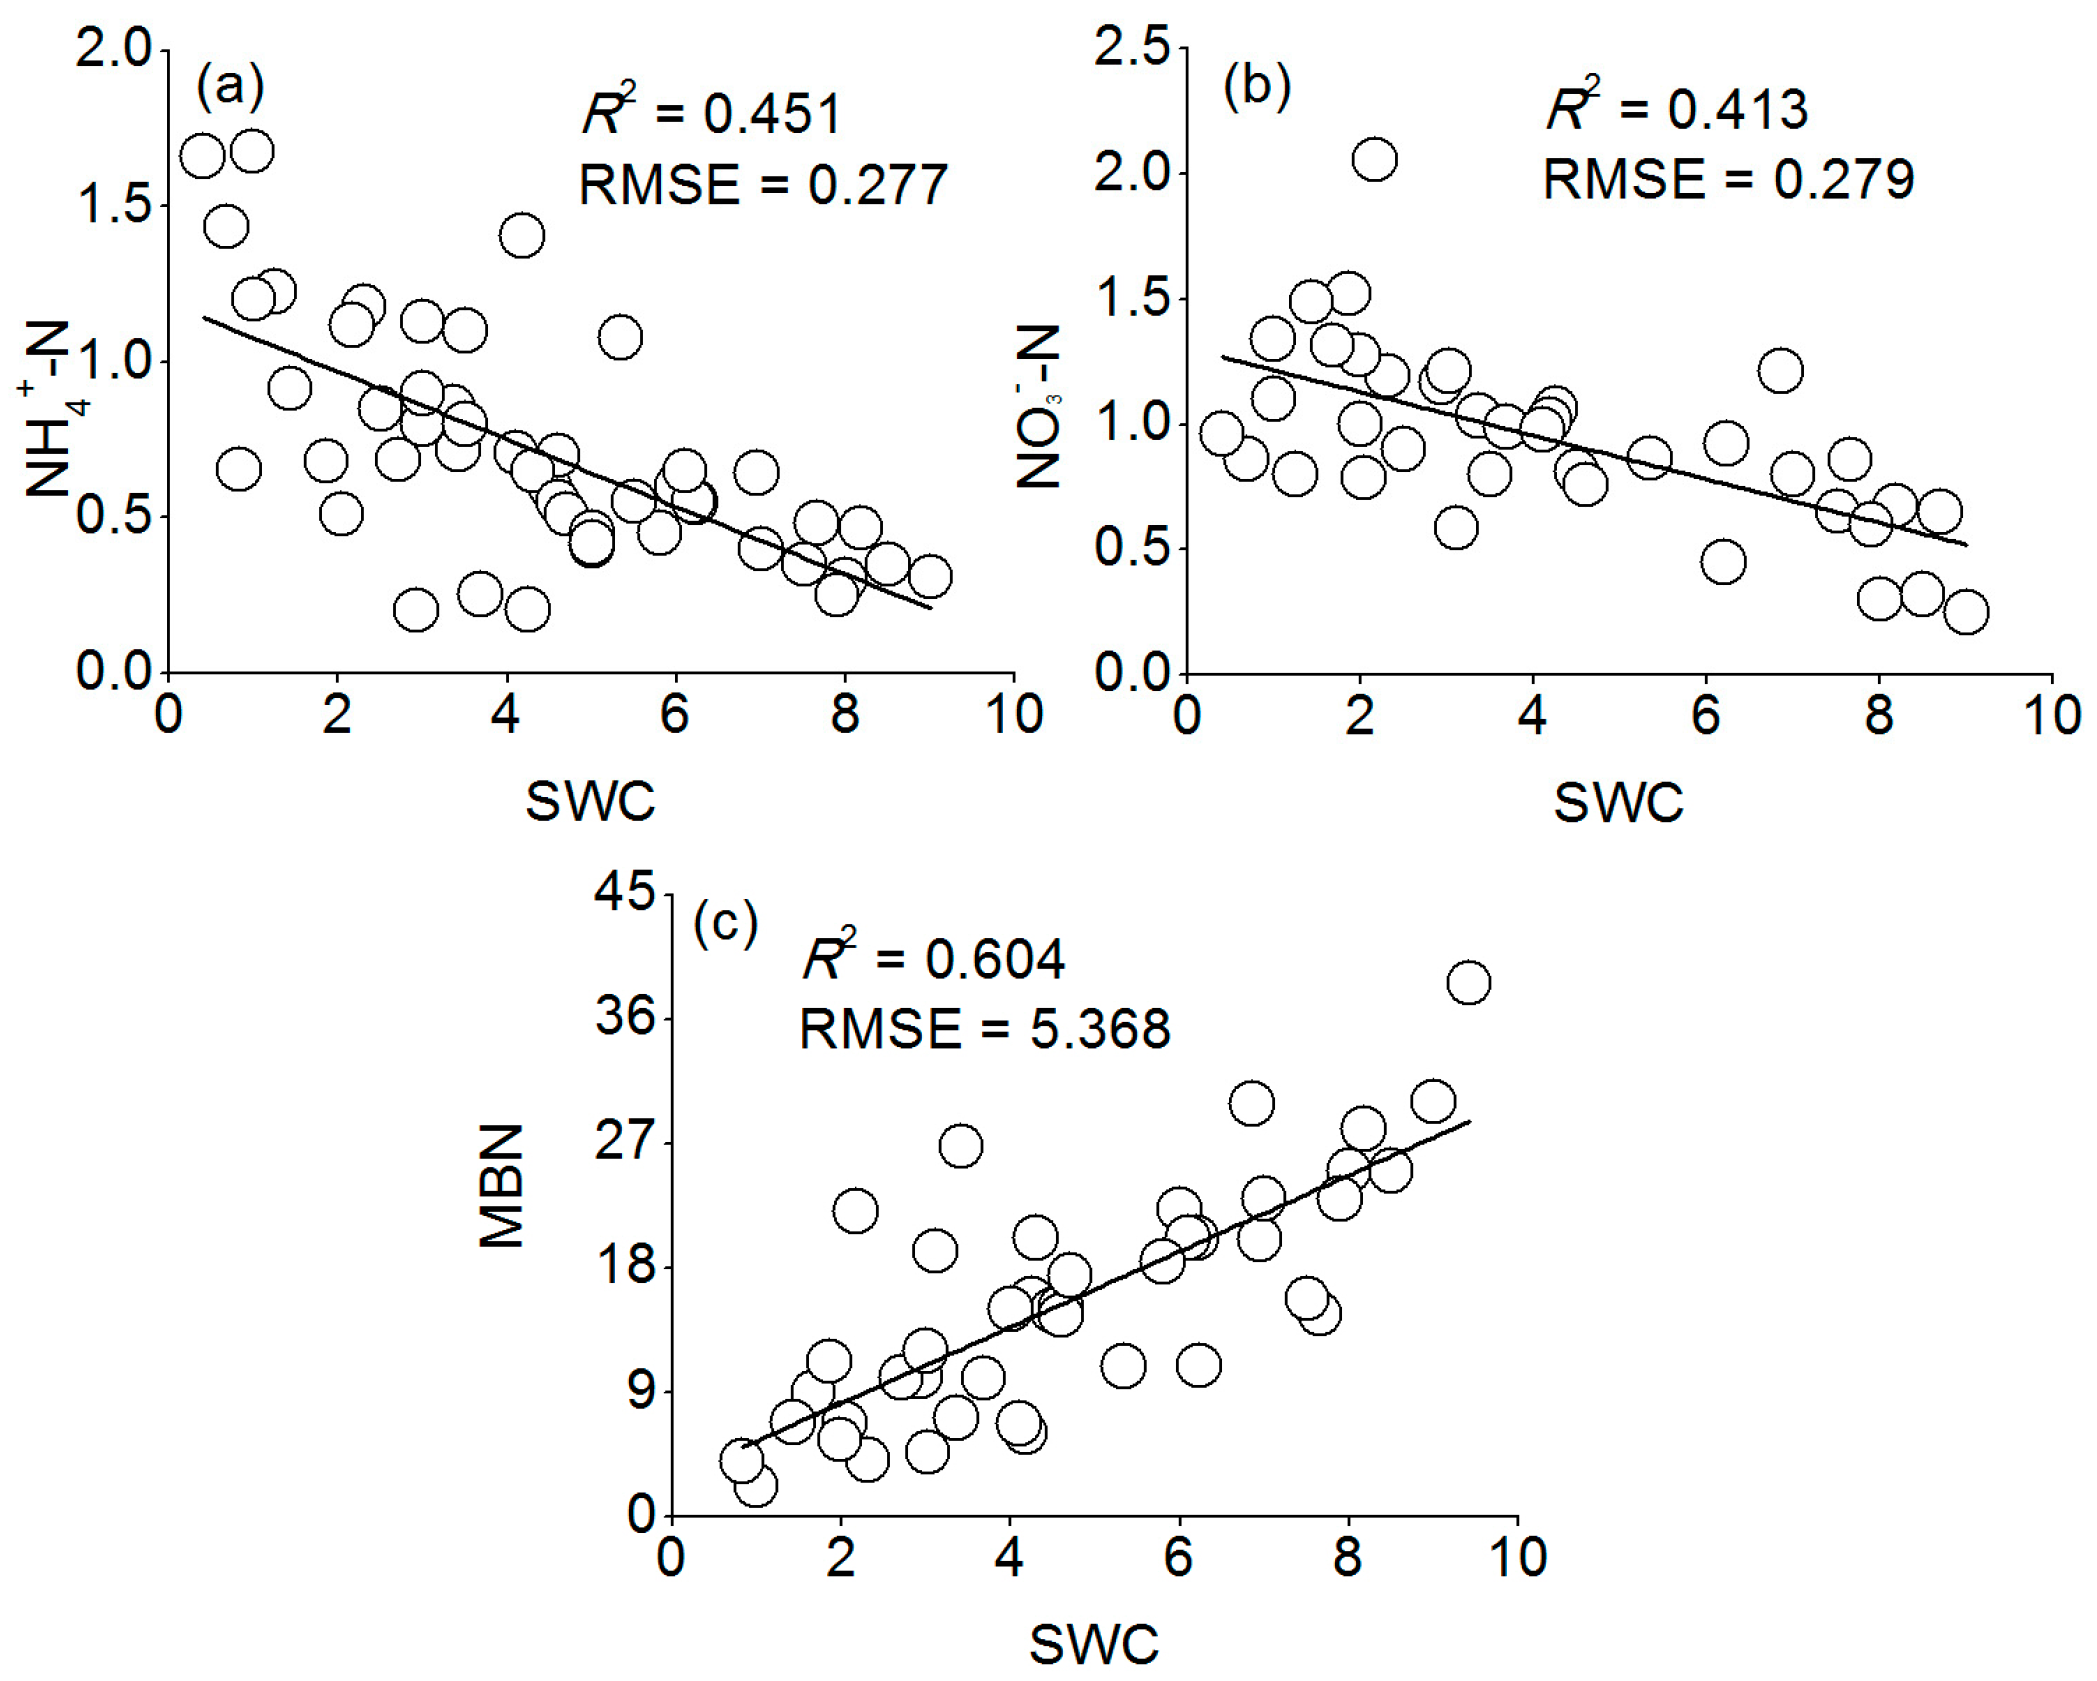
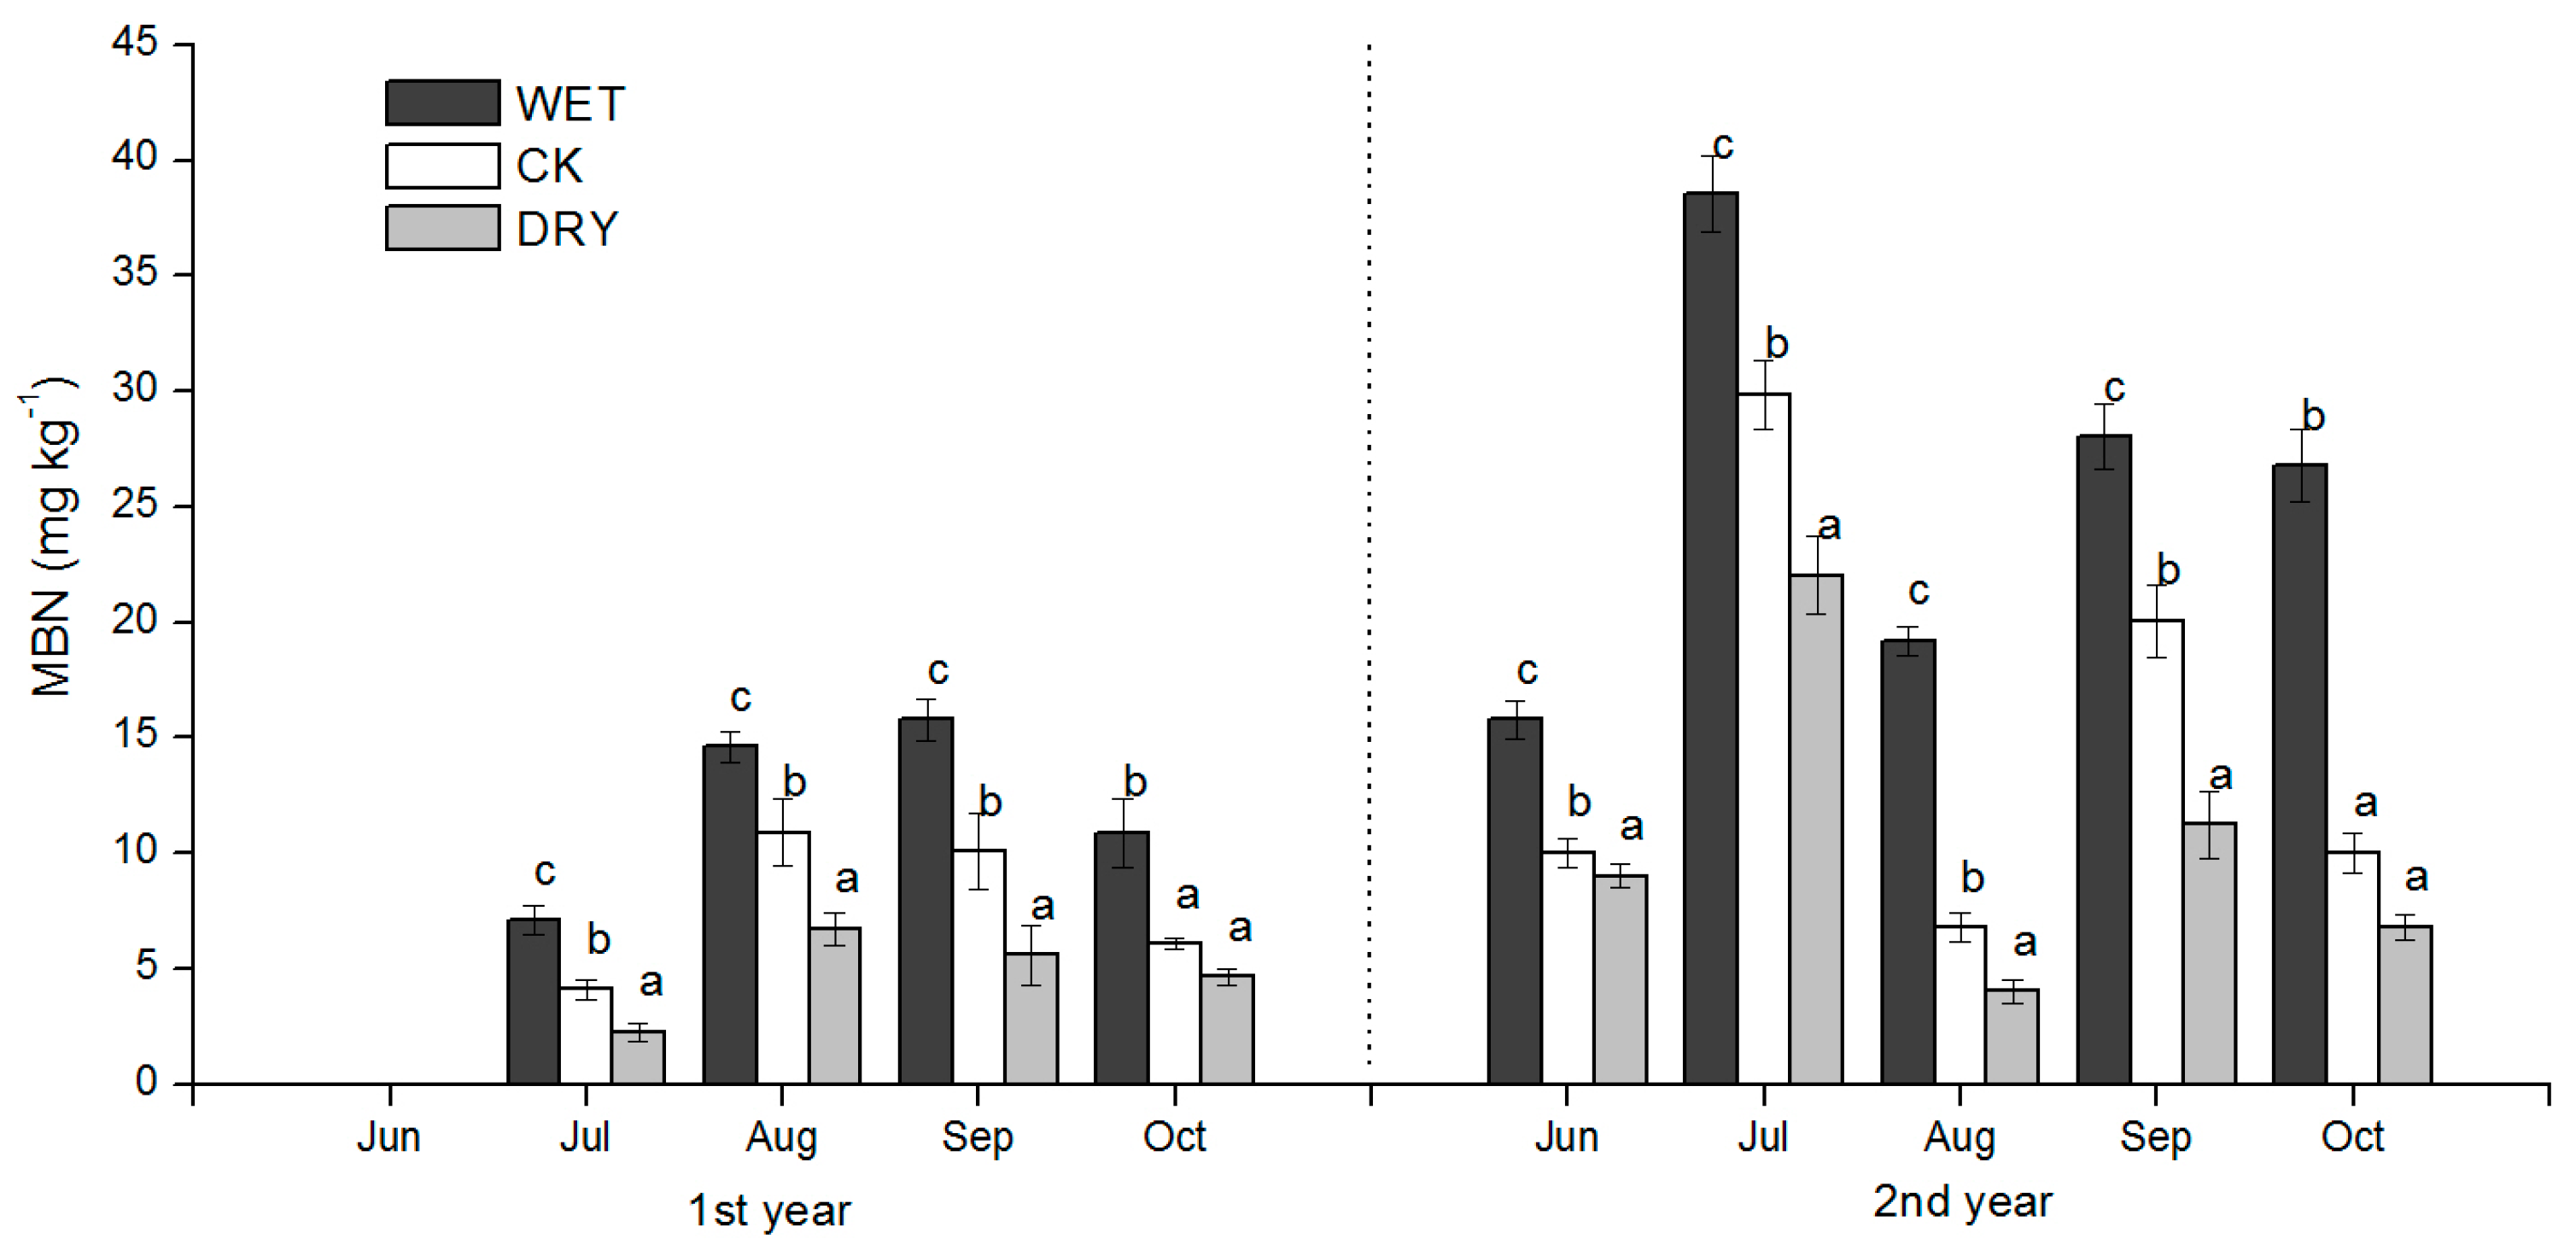
Our results showed that there was a significant negative relationship between the MBN and inorganic N (r = −0.778, p < 0.01) (Table 4), and that the MBN was positively associated with soil SWC (R2 = 0.604, p < 0.05, Figure 8c). Therefore, we argue that the microbial immobilization of N under Mongolian pine plantations was restrained under decreased precipitation due to slow microbial activity, which resulted in the accumulation of inorganic N in the soil. This mechanism is also supported by the findings of Fisher et al. [15] and Reynolds et al. [9]. Microbial biomass can thus either act as a sink or a source of nutrients [39,40]. As a sink, the microbial biomass is a mechanism for immobilizing N, effectively reducing N losses through leaching or associated denitrification [41,42]. In other words, the MBN is an indicator of the immobilization of N by microbes, and is considered a regulator of N dynamics in arid and semiarid regions [41,43]. Fisher et al. [15] reported that levels of extractable N (NH4+-N and NO3-N) in the Jornada Basin directly decreased after rainfall, which they attributed to increased N immobilization in the microbial biomass, as well as to increased leaching of N. Reynolds et al. [9] concluded that extractable N (NH4+-N and NO3-N) accumulation during the summer drought in the Jornada Basin could result from the effects of drought upon N immobilization in the microbial biomass and plant access to soil moisture and nutrients.
The amount of N uptake by plants could be indicated by plant biomass [44,45]. In our experiment, the biomass of Mongolian pine trees was insensitive to changes to the precipitation amount compared to the understory vegetation during the growing season. Our results indicated that changes in precipitation amount had an effect on the growth of Mongolian pine trees, but that the ANPP (aboveground net primary production) of the understory was significantly lowered by decreased precipitation and significantly increased with increased precipitation. Consequently, the changed amount of N uptake by plants mainly came from changes in the understory biomass. Many previous studies have reported that the ANPP increased linearly with increasing precipitation in sites below 1500 mm MAP (mean annual precipitation) [46,47], which is consistent with our results. With decreased precipitation, plant access to soil moisture and nutrients was reduced; therefore, N uptake was limited by water, which supports the results of the accumulation of inorganic N in soils [9,48]. Plant N uptake was relative to soil inorganic N levels—particularly for the understory vegetation, for which N uptake presumably increases over the growing season, and is consistent with the seasonal pattern of biomass accumulation and increased N demand by new plant tissue [44]. The understory N uptake is likely to have influenced temporal soil inorganic N levels; therefore, the lower concentration of inorganic N during August and September may be partly explained by higher plant N uptake during the rainy season.
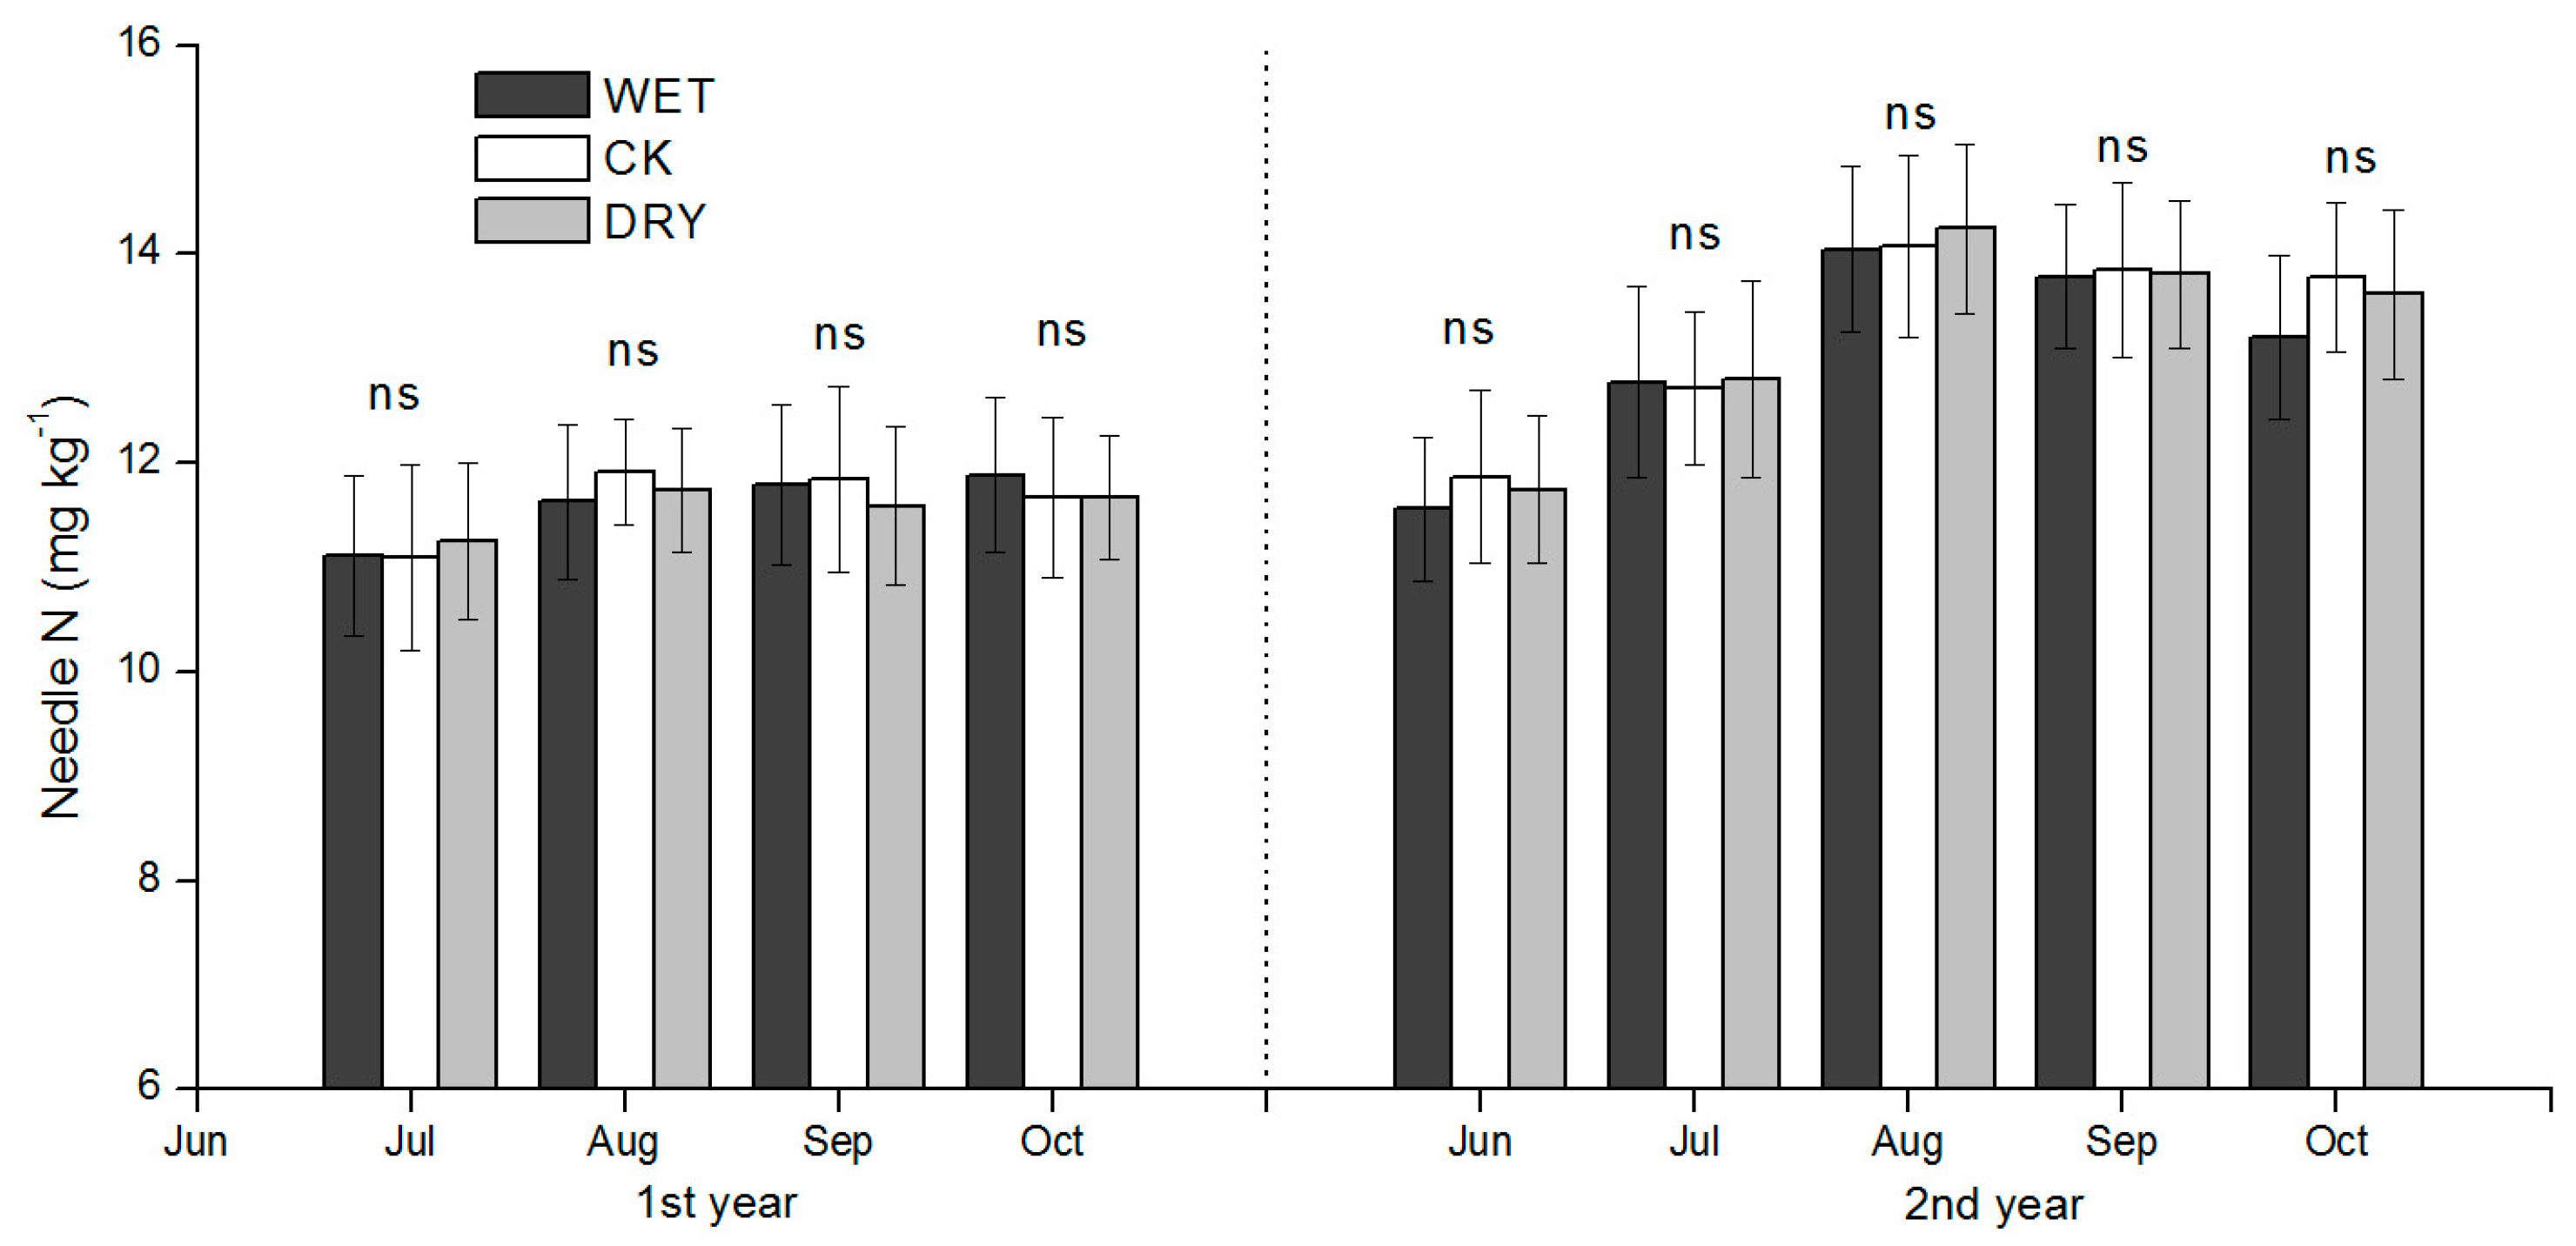
Increased leaching of N under increased precipitation amounts may have contributed to lower concentration of soil inorganic N. However, if N loss from the surface soil layer was substantial, it was not reflected in the Mongolian pine N uptake due to the lack of significant differences in needle N concentration in Mongolian pine among treatments. Nitrogen loss from the soil through leaching is generally assumed to be negligible in desert ecosystems [49,50]; however, Walvoord et al. [51] found a large reservoir of available nitrogen (as NO3-N) in subsoil zones of arid regions that indicates important long-term leaching from desert soils. Austin and Vitousek [8] evaluated soil nutrients on a precipitation gradient in Hawaii and concluded that decreasing concentrations of rock-derived nutrients in soils (NH4+-N, NO3-N and PO4-P) as precipitation increased indicated that the effects of increased precipitation on leaching exceeded its effects on weathering. Yahdjian et al. [10] also found that soil NO3-N content significantly decreased with increasing precipitation input in the semiarid Patagonian steppe, and explained it as the increased leaching of N, as well as increased microbial growth and plant uptake.
Variation in N emissions can be positively associated with variation in soil moisture content [50,52]; thus, the WET treatment may have affected N emissions. Denitrification also largely depends on anoxic conditions, which are unlikely to persist for long periods in the porous sandy soils at the study site. Therefore, the loss of soil N via emissions is likely to be small in this ecosystem relative to estimates reported in other studies [53,54,55].
Rain water collection and storage successfully enabled the manipulation of water quantity. Compared to other rainout shelter designs, the microenvironment changes under our rainout shelters were generally small [21,27,56]. Svejcar et al. [56] found that rain shelters reduced wind speed by 28%; relative humidity by 15%; and increased soil and air temperatures by 16% and 4%, respectively. Fay et al. [21] also found that peak daytime PFD (photosynthetic photon flux density) and net radiation influxes were reduced by approximately 22%; and that soil temperatures were 1.2–1.8 °C higher under the shelters compared with unsheltered control plots. Yahdjian et al. [27] reported that the soil temperature was lower under the shelter than outside, with a mean difference of 1.8–2 °C and a maximum of 6–6.5 °C when the temperature was high. We used a clear polycarbonate material allowing a higher transmission of PAR; therefore, this approach was suitable for evaluating the semiarid Mongolian pine plantation responses to precipitation. The field simulation of changes in precipitation using the methodology in our study therefore proved to be effective.

4.2. Insights Relevant for Management and Further Study

The release of labile N from dead microbial biomass and plant roots could also be a contributing factor in the observed variation in soil inorganic N content [57]. Under decreased precipitation, increased soil microbial biomass mortality is expected, as is as dying plant roots due to drought, which releases labile N into the soil and contributes to the accumulation of inorganic N [9,44,58]. The understory root biomass decreased in response to the DRY treatment, and may have released some N. In arid and semiarid regions, microbial mortality during dry seasons may account for 40% or more of the gross inorganic N produced during subsequent wet seasons [18]. Metabolic (labile) and structural fractions of litterfall above- and below-ground contribute N to plants and microbial biomass. The understory vegetation in this ecosystem represents a substantial N input to soil when they senesce at the end of every growing season [59,60]. Based on the results of our recent study [60,61], this N input will be larger after a wet growing season than after a dry growing season, which has important implications for N supply on timescales greater than one year. Moreover, when this N input is large, more N may make its way to the predominately distributed root soil layers and thus be readily available to Mongolian pine trees at the beginning of the next growing season. Considering the size of the understory N accumulation in the biomass relative to Mongolian pine N uptake (Table 6), this could be an important mechanism in supporting the growth of Mongolian pine trees.
A consequence of the accumulation of inorganic N under decreased precipitation appears to be the asynchrony of soil moisture and soil N levels. When inorganic N concentrations are high, plants are inactive and unable to respond because of drought effects [10,18]. In our study, soil inorganic N concentrations significantly decrease with increasing precipitation, with consequent increases in microbial biomass and the ANPP of the understory vegetation, which suggests that water availability is the overriding limiting factor on the growth of microbial biomass and understory plants at the study site. Dry conditions cause increased soil N, which then becomes available to plants when it rains. However, N limitation became increasingly important when precipitation increased due to the asynchrony of soil moisture and soil N availability in the Mongolian pine plantation. To manage Mongolian pine plantations for potential changes in precipitation in the Horqin Sandy Lands, the pruning, thinning, and protection of litterfall has been advised to minimize evapotranspiration when precipitation decreases [60,62,63]. Traditionally, the understory vegetation and litterfall are removed in managed forests to reduce resource competition between trees and the understory community; however, this may be a poor management strategy, as the understory plant community and litterfall can increase forest nutrient retention. With precipitation increases, soil N availability could feasibly be enhanced by protecting litterfall. As controls on N cycling are complicated, further study and long-term data on the effects of changes in precipitation on soil nitrogen availability in Mongolian pine plantations are highly desirable.

5. Conclusions

Changes in the amount of precipitation during the growing season have significant effects on soil N availability in Mongolian pine ecosystems. The WET and DRY treatments had a significant effect on soil moisture for the growing season. Both WET and DRY treatments significantly affected monthly soil inorganic N concentration, which showed a higher inorganic N under DRY than CK each month and lower in WET than CK. The MBN in each month was significantly reduced by DRY and raised by WET treatments compared with CK. Our results indicated that water availability is the overriding limiting factor on understory growth in Mongolian pine forests when precipitation decreased, and that N limitation became increasingly important when precipitation increased. Accumulation of N in the microbial biomass and understory vegetation, and the subsequent input of their labile and structural N contents, are important mechanisms for N cycling in this ecosystem.

Acknowledgments

This work was supported by the National Key Technology R&D Program of China (No. 2015BAD07B030102), and the Natural Science Foundation of Liaoning Province of China (No. 201602473, 2014020108), and the Talent Scientific Research Fund of LSHU (No. 2014XJJ-014, 2016XJJ-048), and the National Natural Science Foundation of China (No. 30972418, 41401262). We thank the staff workers of the Daqinggou Ecological Station, who helped construct rainout shelters, and to Qin Si and Wenfu Gao for looking after the rainout shelters. We are also grateful for the suggestions provided by Dr. David Pepper and Dr. David Thoms. Special thanks to two anonymous referees for their valuable comments that greatly improved the manuscript.

Author Contributions

Zhiping Fan, Zhihua Tu, and Yanbin Qin designed the study and supervised the research; Dongzhou Deng analyzed the data; Zhiping Fan, Zhihua Tu, Dongzhou Deng and Fayun Li wrote the paper; Dehui Zeng, Xuekai Sun, Qiong Zhao and Yalin Hu performed the laboratory analyses.

Conflicts of Interest

The authors declare no conflict of interest.

References

  1. Oreskes, N. The scientific consensus on climate change. Science 2004, 306, 1686. [Google Scholar] [CrossRef] [PubMed]
  2. Intergovernmental Panel on Climate Change (IPCC). Climate Change 2013: The Physical Science Basis. Contribution of Working Group I to the Fifth Assessment Report of the Intergovernmental Panel on Climate Change; Cambridge University Press: Cambridge, UK, 2013. [Google Scholar]
  3. Ibrahim, B.; Karambiri, H.; Polcher, J.; Yacouba, H.; Ribstein, P. Changes in rainfall regime over Burkina Faso under the climate change conditions simulated by 5 regional climate models. Clim. Dyn. 2014, 42, 1363–1381. [Google Scholar] [CrossRef] [Green Version]
  4. Knapp, A.K.; Hoover, D.L.; Wilcox, K.R.; Avolio, M.L.; Koerner, S.E.; La Pierre, K.J.; Loik, M.E.; Luo, Y.; Sala, O.E.; Smith, M.D. Characterizing differences in precipitation regimes of extreme wet and dry years: Implications for climate change experiments. Glob. Chang. Biol. 2015, 21, 2624–2633. [Google Scholar] [CrossRef] [PubMed]
  5. Weltzin, J.F.; McPherson, G.R. Implications of precipitation redistribution for shifts in temperate savanna ecotones. Ecology 2000, 81, 1902–1913. [Google Scholar] [CrossRef]
  6. Jentsch, A.; Kreyling, J.; Beierkuhnlein, C. A new generation of climate-change experiments: Events, not trends. Front. Ecol. Environ. 2007, 5, 365–374. [Google Scholar] [CrossRef]
  7. Lim, H.; Oren, R.; Palmroth, S.; Tor-Ngern, P.; Mörling, T.; Näsholm, T.; Lundmark, T.; Helmisaari, H.-S.; Leppälammi-Kujansuu, J.; Linder, S. Inter-annual variability of precipitation constrains the production response of boreal Pinus sylvestris to nitrogen fertilization. For. Ecol. Manag. 2015, 348, 31–45. [Google Scholar] [CrossRef]
  8. Austin, A.T.; Vitousek, P.M. Nutrient dynamics on a precipitation gradient in Hawai’i. Oecologia 1998, 113, 519–529. [Google Scholar] [CrossRef]
  9. Reynolds, J.F.; Virginia, R.A.; Kemp, P.R.; de Soyza, A.G.; Tremmel, D.C. Impact of drought on desert shrubs: Effects of seasonality and degree of resource island development. Ecol. Monogr. 1999, 69, 69–106. [Google Scholar] [CrossRef]
  10. Yahdjian, L.; Sala, O.E.; Austin, A.T. Differential controls of water input on litter decomposition and nitrogen dynamics in the Patagonian steppe. Ecosystems 2006, 9, 128–141. [Google Scholar] [CrossRef]
  11. Cregger, M.A.; Schadt, C.W.; McDowell, N.G.; Pockman, W.T.; Classen, A.T. Response of the soil microbial community to changes in precipitation in a semiarid ecosystem. Appl. Environ. Microb. 2012, 78, 8587–8594. [Google Scholar] [CrossRef] [PubMed]
  12. Nielsen, U.N.; Ball, B.A. Impacts of altered precipitation regimes on soil communities and biogeochemistry in arid and semi-arid ecosystems. Glob. Chang. Biol. 2015, 21, 1407–1421. [Google Scholar] [CrossRef] [PubMed]
  13. Weltzin, J.F.; Belote, R.T.; Sanders, N.J. Biological invaders in a greenhouse world: Will elevated CO2 fuel plant invasions? Front. Ecol. Environ. 2003, 1, 146–153. [Google Scholar] [CrossRef]
  14. Bell, C.W.; Tissue, D.T.; Loik, M.E.; Wallenstein, M.D.; Acosta-Martinez, V.; Erickson, R.A.; Zak, J.C. Soil microbial and nutrient responses to 7 years of seasonally altered precipitation in a Chihuahuan desert grassland. Glob. Chang. Biol. 2014, 20, 1657–1673. [Google Scholar] [CrossRef] [PubMed]
  15. Fisher, F.M.; Parker, L.W.; Anderson, J.P.; Whitford, W.G. Nitrogen mineralization in a desert soil: Interacting effects of soil moisture and nitrogen fertilizer. Soil Sci. Soc. Am. J. 1987, 51, 1033–1041. [Google Scholar] [CrossRef]
  16. Vitousek, P.M.; Howarth, R.W. Nitrogen limitation on land and in the sea: How can it occur? Biogeochemistry 1991, 13, 87–115. [Google Scholar] [CrossRef]
  17. Gong, X.Y.; Chen, Q.; Lin, S.; Brueck, H.; Dittert, K.; Taube, F.; Schnyder, H. Tradeoffs between nitrogen- and water-use efficiency in dominant species of the semiarid steppe of Inner Mongolia. Plant Soil 2011, 340, 227–238. [Google Scholar] [CrossRef]
  18. Mazzarino, M.J.; Bertiller, M.B.; Sain, C.; Satti, P.; Coronato, F. Soil nitrogen dynamics in northeastern Patagonia steppe under different precipitation regimes. Plant Soil 1998, 202, 125–131. [Google Scholar] [CrossRef]
  19. Austin, A.T.; Sala, O.E. Carbon and nitrogen dynamics across a natural precipitation gradient in Patagonia, Argentina. J. Veg. Sci. 2002, 13, 351–360. [Google Scholar] [CrossRef]
  20. Lauenroth, W.K.; Sala, O.E. Long-term forage production of North American shortgrass steppe. Ecol. Appl. 1992, 2, 397–403. [Google Scholar] [CrossRef] [PubMed]
  21. Fay, P.A.; Carlisle, J.D.; Knapp, A.K.; Blair, J.M.; Collins, S.L. Altering rainfall timing and quantity in a mesic grassland ecosystem: Design and performance of rainfall manipulation shelters. Ecosystems 2000, 3, 308–319. [Google Scholar] [CrossRef]
  22. Peters, D.P.C. Plant species dominance at a grassland-shrubland ecotone: An individual-based gap dynamics model of herbaceous and woody species. Ecol. Model. 2002, 152, 5–32. [Google Scholar] [CrossRef]
  23. Neilson, R.P. Transient ecotone response to climatic change: Some conceptual and modelling approaches. Ecol. Appl. 1993, 3, 385–395. [Google Scholar] [CrossRef] [PubMed]
  24. Milne, B.T.; Moore, D.I.; Betancourt, J.L.; Parks, J.A.; Swetnam, T.W.; Parmenter, R.R.; Pockman, W.T. Mulitdecadal drought cycles in south-central new mexico: Patterns and consequences. In Climate Variability and Ecosystem Response at Long-Term Ecological Research Sites; Greenland, D., Goodin, D.G., Smith, R.C., Eds.; Oxford University Press: Oxford, UK, 2003; pp. 286–307. [Google Scholar]
  25. Kosaka, Y.; Xie, S.-P.; Nakamura, H. Dynamics of interannual variability in summer precipitation over East Asia. J. Clim. 2011, 24, 5435–5453. [Google Scholar] [CrossRef]
  26. Posada, J.M.; Schuur, E.A.G. Relationships among precipitation regime, nutrient availability, and carbon turnover in tropical rain forests. Oecologia 2011, 165, 783–795. [Google Scholar] [CrossRef] [PubMed]
  27. Yahdjian, L.; Sala, O.E. A rainout shelter design for intercepting different amounts of rainfall. Oecologia 2002, 133, 95–101. [Google Scholar] [CrossRef]
  28. Yuan, J.; Ouyang, Z.; Zheng, H.; Xu, W. Effects of different grassland restoration approaches on soil properties in the southeastern Horqin Sandy Land, Northern China. Appl. Soil Ecol. 2012, 61, 34–39. [Google Scholar] [CrossRef]
  29. Zhu, J.J.; Zeng, D.H.; Kang, H.Z.; Wu, X.Y.; Fan, Z.P. Decline of Pinus Sylvestris var. Mongolica plantation on Sandy Land; China Forestry Publishing House: Beijing, China, 2005. (In Chinese) [Google Scholar]
  30. Wei, Y.F.; Fang, J.; Liu, S.; Zhao, X.Y.; Li, S.G. Stable isotopic observation of water use sources of Pinus sylvestris var. Mongolica in Horqin Sandy Land, China. Trees 2013, 27, 1249–1260. [Google Scholar]
  31. Zeng, D.H.; Li, L.J.; Fahey, T.J.; Yu, Z.Y.; Fan, Z.P.; Chen, F.S. Effects of nitrogen addition on vegetation and ecosystem carbon in a semi-arid grassland. Biogeochemistry 2010, 98, 185–193. [Google Scholar] [CrossRef]
  32. Chen, F.-S.; Zeng, D.-H.; Fahey, T.J.; Liao, P.-F. Organic carbon in soil physical fractions under different-aged plantations of Mongolian pine in semi-arid region of Northeast China. Appl. Soil Ecol. 2010, 44, 42–48. [Google Scholar] [CrossRef]
  33. Chen, F.S.; Zeng, D.H.; Zhou, B.; Singh, A.N.; Fan, Z.P. Seasonal variation in soil nitrogen availability under Mongolian pine plantations at the Keerqin Sand Lands, China. J. Arid Environ. 2006, 67, 226–239. [Google Scholar] [CrossRef]
  34. Zhao, Q.; Zeng, D.H.; Lee, D.K.; He, X.Y.; Fan, Z.P.; Jin, Y.H. Effects of Pinus sylvestris var. Mongolica afforestation on soil phosphorus status of the Keerqin Sandy Lands in China. J. Arid Environ. 2007, 69, 569–582. [Google Scholar] [CrossRef]
  35. Zhang, J.C.; Wang, J.; Li, A.D.; E, Y.H. Resesrch on root distribution and growth adaptability of Pinus sylvestris var. Mongolica. Prot. For. Sci. Technol. 2000, 44, 46–49. (In Chinese) [Google Scholar]
  36. Keeney, D.R.; Nelson, D.W. Nitrogen-inorganic forms. In Methods of Soil Analysis, 2nd ed.; Miller, R.H., Keeny, D.R., Eds.; American Society of Agronomy and Soil Science Society of America: Madison, WI, USA, 1982; pp. 643–698. [Google Scholar]
  37. Brookes, P.C.; Landman, A.; Pruden, G.; Jenkinson, D.S. Chloroform fumigation and the release of soil nitrogen: A rapid direct extraction method to measure microbial biomass nitrogen in soil. Soil Biol. Biochem. 1985, 17, 837–842. [Google Scholar] [CrossRef]
  38. Meredith, M.P.; Stehman, S.V. Repeated measures experiments in forestry: Focus on analysis of response curves. Can. J. For. Res. 1991, 21, 957–965. [Google Scholar] [CrossRef]
  39. McGill, W.B.; Cannon, K.R.; Robertson, J.A.; Cook, F.D. Dynamics of soil microbial biomass and water-soluble organic C in Breton L after 50 years of cropping to two rotations. Can. J. Soil Sci. 1986, 66, 1–19. [Google Scholar] [CrossRef]
  40. Dungait, J.A.J.; Ghee, C.; Rowan, J.S.; McKenzie, B.M.; Hawes, C.; Dixon, E.R.; Paterson, E.; Hopkins, D.W. Microbial responses to the erosional redistribution of soil organic carbon in arable fields. Soil Biol. Biochem. 2013, 60, 195–201. [Google Scholar] [CrossRef]
  41. Garcia, F.O.; Rice, C.W. Microbial biomass dynamics in tallgrass prairie. Soil Sci. Soc. Am. J. 1994, 58, 816–823. [Google Scholar] [CrossRef]
  42. Foote, J.A.; Boutton, T.W.; Scott, D.A. Soil C and N storage and microbial biomass in US southern pine forests: Influence of forest management. For. Ecol. Manag. 2015, 355, 48–57. [Google Scholar] [CrossRef]
  43. Mureithi, S.M.; Verdoodt, A.; Gachene, C.K.K.; Njoka, J.T.; Wasonga, V.O.; De Neve, S.; Meyerhoff, E.; Van Ranst, E. Impact of enclosure management on soil properties and microbial biomass in a restored semi-arid rangeland, Kenya. J. Arid Land 2014, 6, 561–570. [Google Scholar] [CrossRef]
  44. Fisher, F.M.; Whitford, W.G. Field simulation of wet and dry years in the Chihuahuan desert: Soil moisture, n mineralization and ion-exchange resin bags. Biol. Fertil. Soils 1995, 20, 137–146. [Google Scholar] [CrossRef]
  45. Wei, L.; Chen, C.; Yu, S. Uptake of organic nitrogen and preference for inorganic nitrogen by two Australian native araucariaceae species. Plant Ecol. Divers. 2015, 8, 259–264. [Google Scholar] [CrossRef]
  46. Austin, A.T. Differential effects of precipitation on production and decomposition along a rainfall gradient in Hawaii. Ecology 2002, 83, 328–338. [Google Scholar]
  47. Knapp, A.K.; Fay, P.A.; Blair, J.M.; Collins, S.L.; Smith, M.D.; Carlisle, J.D.; Harper, C.W.; Danner, B.T.; Lett, M.S.; McCarron, J.K. Rainfall variability, carbon cycling, and plant species diversity in a mesic grassland. Science 2002, 298, 2202–2205. [Google Scholar] [CrossRef] [PubMed]
  48. Brookshire, E.N.J.; Gerber, S.; Menge, D.N.L.; Hedin, L.O. Large losses of inorganic nitrogen from tropical rainforests suggest a lack of nitrogen limitation. Ecol. Lett. 2012, 15, 9–16. [Google Scholar] [CrossRef] [PubMed]
  49. West, N.E.; Skujins, J. Nitrogen in Desert Ecosystems; Dowden, Hutchinson & Ross, Inc.: Stroudsburg, PA, USA, 1978. [Google Scholar]
  50. Peterjohn, W.T.; Schlesinger, W.H. Nitrogen loss from deserts in the southwestern United States. Biogeochemistry 1990, 10, 67–79. [Google Scholar] [CrossRef]
  51. Walvoord, M.A.; Phillips, F.M.; Stonestrom, D.A.; Evans, R.D.; Hartsough, P.C.; Newman, B.D.; Striegl, R.G. A reservoir of nitrate beneath desert soils. Science 2003, 302, 1021–1024. [Google Scholar] [CrossRef] [PubMed]
  52. Li, D.; Wang, X.; Mo, J.; Sheng, G.; Fu, J. Soil nitric oxide emissions from two subtropical humid forests in South China. J. Geophys. Res. Atmos. 2007, 112, 209–232. [Google Scholar] [CrossRef]
  53. Mosier, A.R. Soil processes and global change. Biol. Fertil. Soils 1998, 27, 221–229. [Google Scholar] [CrossRef]
  54. Schindlbacher, A.; Zechmeister-Boltenstern, S.; Butterbach-Bahl, K. Effects of soil moisture and temperature on NO, NO2, and N2O emissions from European forest soils. J. Geophys. Res. Atmos. 2004, 109, D17302. [Google Scholar] [CrossRef]
  55. Pilegaard, K.; Skiba, U.; Ambus, P.; Beier, C.; Brüggemann, N.; Butterbach-Bahl, K.; Dick, J.; Dorsey, J.; Duyzer, J.; Gallagher, M.; et al. Factors controlling regional differences in forest soil emission of nitrogen oxides (NO and N2O). Biogeosciences 2006, 3, 651–661. [Google Scholar] [CrossRef]
  56. Svejcar, T.; Angell, R.; Miller, R. Fixed location rain shelters for studying precipitation effects on rangelands. J. Arid Environ. 1999, 42, 187–193. [Google Scholar] [CrossRef]
  57. Chen, X.L.; Wang, D.; Chen, X.; Wang, J.; Diao, J.J.; Zhang, J.Y.; Guan, Q.W. Soil microbial functional diversity and biomass as affected by different thinning intensities in a Chinese fir plantation. Appl. Soil Ecol. 2015, 92, 35–44. [Google Scholar] [CrossRef]
  58. Zhou, X.; Chen, C.; Wang, Y.; Xu, Z.; Duan, J.; Hao, Y.; Smaill, S. Soil extractable carbon and nitrogen, microbial biomass and microbial metabolic activity in response to warming and increased precipitation in a semiarid Inner Mongolian grassland. Geoderma 2013, 206, 24–31. [Google Scholar] [CrossRef]
  59. Lin, G.G.; Zhao, Q.; Zhao, L.; Li, H.C.; Zeng, D.H. Effects of understory removal and nitrogen addition on the soil chemical and biological properties of Pinus sylvestris var. mongolica plantation in Keerqin Sandy Land. Chin. J. Appl. Ecol. 2012, 23, 1188–1194. (In Chinese) [Google Scholar]
  60. Mao, B.; Mao, R.; Hu, Y.L.; Huang, Y.; Zeng, D.H. Decomposition of Mongolian pine litter in the presence of understory species in semi-arid Northeast China. J. For. Res. 2016, 27, 329–337. [Google Scholar] [CrossRef]
  61. Ren, H.; Xu, Z.; Huang, J.; Lü, X.; Zeng, D.H.; Yuan, Z.; Han, X.; Fang, Y. Increased precipitation induces a positive plant-soil feedback in a semi-arid grassland. Plant Soil 2015, 389, 211–223. [Google Scholar] [CrossRef]
  62. Wang, W.W.; Zhao, Q.; Zhao, X.R.; Zeng, D.H.; Ai, G.Y. Effects of litter manipulation on soil microbial community structure in Pinus sylvestris var. mongolica plantation. Chin. J. Appl. Ecol. 2015, 34, 2605–2612. (In Chinese) [Google Scholar]
  63. Liu, Y.X.; Hu, Y.L.; Zeng, D.H.; Fan, Z.P.; Zhao, Q. Effects of grassland afforestation with Mongolian pine on soil chemical and biological properties in Keerqin Sandy Land. Chin. J. Appl. Ecol. 2010, 21, 814–820. (In Chinese) [Google Scholar]
Figure 1. Geographical location of Daqinggou Ecological Station and the layout of this study showing nine rectangular plots of P. sylvestris var. mongolica plantation (PP). Other land use types at the Daqinggou Ecological Station are P. sylvestris var. mongolica sparse woodland (PSW); mixed plantation by broad-leaved trees in groups (MPBG); mixed plantation by Ulmus pumila and P. sylvestris var. mongolica (MPUP); mixed plantation by Acer mono and Tilia amurensis (MPAT); mixed plantation by P. sylvestris var. mongolica and Populus tomentosa (MPPP); Populus tomentosa/Medicago sativa agroforest (PMA); P. sylvestris var. mongolica/Arachis hypogaea agroforest (PAA); P. sylvestris var. mongolica/Zea mays agroforest (PZA); grass land (GL); and farm land (FL).
Water 09 00208 g001
Figure 2. Sketch-map of the precipitation change simulation. Rainwater was excluded via the rainout shelter and channeled by two gutters placed on two sides of the steel frame into a storage tank, which was then pumped from the storage tank to the irrigation nozzles.
Water 09 00208 g002
Figure 3. Precipitation during the growing season during the manipulation period (May–October). (A) The first year; and (B) the second year. Each bar represents the cumulative daily precipitation.
Water 09 00208 g003
Figure 4. Seasonal dynamics of soil NH4+-N during the growing season for plots subjected to the manipulation of precipitation amount. WET, CK, and DRY represent treatments of increased precipitation, natural precipitation, and decreased precipitation, respectively. Each bar represents a mean with standard deviation (n = 3). Values with different letters have significant differences each month (p < 0.05).
Water 09 00208 g004
Figure 5. Seasonal dynamics of soil NO3-N during the growing season for plots subjected to the manipulation of precipitation amount. WET, CK, and DRY represent treatments of increased precipitation, natural precipitation, and decreased precipitation, respectively. Each bar represents a mean with standard deviation (n = 3). Values with different letters have significant differences each month (p < 0.05).
Water 09 00208 g005
Figure 6. Seasonal dynamics of soil inorganic N during the growing season for plots subjected to the manipulation of precipitation amount. WET, CK, and DRY represent treatments of increased precipitation, natural precipitation, and decreased precipitation, respectively. Each bar represents a mean with standard deviation (n = 3). Values with different letters have significant differences each month (p < 0.05).
Water 09 00208 g006
Figure 7. Seasonal dynamics of soil MBN during the growing season for plots subjected to the manipulation of precipitation amount. WET, CK, and DRY represent treatments of increased precipitation, natural precipitation, and decreased precipitation, respectively. Each bar represents a mean with standard deviation (n = 3). Values with different letters have significant differences each month (p < 0.05).
Water 09 00208 g007
Figure 8. The relationship between SWC and (a) NH4+-N; (b) NO3-N; and (c) MBN during the growing season for plots subjected to the manipulation of precipitation amount. The circles represent mean plot values. RMSE: root mean square error.
Water 09 00208 g008
Figure 9. Seasonal dynamics of total nitrogen (TN) concentration of Pinus sylvestris var. mongolica needle during the growing season for different precipitation amount manipulation plots. DRY, CK, and WET represent treatments of decreased precipitation, natural precipitation, and increased precipitation, respectively. Each bar represents a mean plus standard deviation (n = 3). Values with different letters have significant differences each month (p < 0.05); ns represents no significant differences.
Water 09 00208 g009
Table 1. Effects of precipitation manipulations on the microenvironment.
Year AT (°C)ST (°C)RH (%)PAR (µmol·m−2·s−1)
DayNightDayNightDayNight
AverageDRY28.1 ± 0.521.9 ± 0.326.3 ± 0.123.4 ± 0.167.1 ± 0.691.8 ± 0.31450 ± 66
CK27.5 ± 0.321.9 ± 0.223.7 ± 0.120.8 ± 0.069.4 ± 0.490.8 ± 0.41732 ± 30
WET27.7 ± 0.321.7 ± 0.123.7 ± 0.120.7 ± 0.070.0 ± 0.590.9 ± 0.41707 ± 45
2014MaximumDRY31.1 ± 0.226.3 ± 0.128.0 ± 0.124.4 ± 0.284.7 ± 0.497.3 ± 0.5-
CK30.7 ± 0.326.3 ± 0.224.5 ± 0.322.0 ± 0.385.5 ± 0.497.6 ± 0.6-
WET30.1 ± 0.226.3 ± 0.224.5 ± 0.221.8 ± 0.285.3 ± 0.597.8 ± 0.4-
MinimumDRY24.4 ± 0.221.0 ± 0.124.6 ± 0.521.0 ± 0.455.9 ± 0.470.8 ± 0.5-
CK24.0 ± 0.121.0 ± 0.222.4 ± 0.319.5 ± 0.358.1 ± 0.370.3 ± 0.6-
WET24.0 ± 0.120.6 ± 0.122.5 ± 0.419.5 ± 0.357.8 ± 0.470.5 ± 0.3-
AverageDRY26.5 ± 0.220.8 ± 0.124.4 ± 0.122.1 ± 0.270.6 ± 0.393.6 ± 0.31560 ± 47
CK26.2 ± 0.220.7 ± 0.222.9 ± 0.220.1 ± 0.372.8 ± 0.292.6 ± 0.21705 ± 31
WET26.3 ± 0.120.5 ± 0.322.8 ± 0.320.1 ± 0.373.5 ± 0.592.7 ± 0.11713 ± 42
2015MaximumDRY29.4 ± 0.424.9 ± 0.227.1 ± 0.323.4 ± 0.288.8 ± 0.296.2 ± 0.2-
CK29.1 ± 0.224.5 ± 0.523.6 ± 0.221.2 ± 0.589.7 ± 0.396.6 ± 0.2-
WET28.5 ± 0.124.6 ± 0.223.4 ± 0.221.1 ± 0.189.5 ± 0.396.5 ± 0.3-
MinimumDRY23.2 ± 0.319.9 ± 0.323.7 ± 0.320.2 ± 0.258.6 ± 0.272.1 ± 0.3-
CK22.7 ± 0.419.5 ± 0.321.6 ± 0.218.8 ± 0.361.1 ± 0.171.6 ± 0.2-
WET22.6 ± 0.219.6 ± 0.221.5 ± 0.518.7 ± 0.260.6 ± 0.271.9 ± 0.5-
Notes: DRY, CK, and WET represent the treatments of decreased precipitation, natural precipitation and increased precipitation, respectively. Values for AT (air temperature), ST (soil temperature), RH (relative humidity), and PAR (photosynthetically active radiation) values were measured at the time of peak biomass (August). Values are means with standard deviation (n = 4).
Table 2. Seasonal dynamics of soil water content (SWC, mg·g−1) in the top 15 cm during the growing season for different precipitation amount manipulation plots.
YearTreatmentJuneJulyAugustSeptemberOctober
DRY0.040 ± 0.005a0.099 ± 0.009a0.410 ± 0.010a0.198 ± 0.008a0.302 ± 0.007a
2014CK0.068 ± 0.003b0.231 ± 0.008b0.623 ± 0.016b0.293 ± 0.015b0.418 ± 0.005b
WET0.125 ± 0.006c0.336 ± 0.053c0.766 ± 0.011c0.425 ± 0.010c0.534 ± 0.020c
DRY0.083 ± 0.012A0.167 ± 0.014A0.217 ± 0.014A0.186 ± 0.010A0.143 ± 0.009A
2015CK0.204 ± 0.021B0.368 ± 0.022B0.686 ± 0.048B0.695 ± 0.036B0.271 ± 0.018B
WET0.311 ± 0.060C0.751 ± 0.034C0.942 ± 0.020C0.818 ± 0.045C0.342 ± 0.016C
Notes: DRY, CK, and WET represent treatments of decreased precipitation, natural precipitation and increased precipitation, respectively. Values are means with standard deviation in parentheses (n = 3). Values with different lower-case letters (first year) and capital letters (second year) within a column were statistically different in different year (p < 0.05).
Table 3. Effects of precipitation and months on SWC, NH4+-N, NO3-N, inorganic N, and Microbial Biomass Nitrogen (MBN).
Source of VariationSWCNH4+-NNO3-NInorganic NMBN
dfFpdfFpdfFpdfFpdfFp
Treatment2991.95<0.0012109.80<0.001274.95<0.0012148.06<0.0012168.32<0.001
Month4908.81<0.0014450.50<0.001463.74<0.0014219.67<0.001383.10<0.001
Treatment × Month858.70<0.001813.52<0.00184.92<0.001812.60<0.00164.79<0.001
Table 4. Pearson’s correlation coefficients (n = 12, four months for each of three sites) among soil NH4+-N; NO3-N; inorganic N; and MBN under Mongolian pine plantations.
PearsonNH4+-NNO3-NInorganic NMBN
NH4+-N10.255 ns0.968 **–0.668 *
NO3-N-10.489 ns–0.679 *
Inorganic N--10.778 **
MBN---1
Notes: Asterisks indicate significant correlation between the two variables at (*) 0.05; and (**) 0.01 probability levels; and (ns) not significant.
Table 5. Diameter at breast height (DBH) growth of Mongolian pine trees, aboveground net primary productivity (ANPP) of understory and root biomass in different rainfall amount manipulation plots.
YearTreatmentHeight Increment (m·year−1)DBH Increment (m·year−1)ANPP (g·m−2)Root Biomass (g·m−2)
DRY0.28 ± 0.08a0.27 ± 0.08a242.66 ± 12.59a538.44 ± 34.27a
2014CK0.38 ± 0.03ab0.31 ± 0.05ab341.39 ± 14.89b809.70 ± 60.27b
WET0.44 ± 0.02b0.36 ± 0.07b425.52 ± 14.29c980.89 ± 72.66c
DRY0.39 ± 0.07A0.28 ± 0.04A228.60 ± 16.19A555.49 ± 51.89A
2015CK0.51 ± 0.06B0.31 ± 0.02AB326.70 ± 13.86B857.12 ± 96.00B
WET0.53 ± 0.06B0.38 ± 0.05B453.68 ± 10.29C1078.15 ± 86.90C
Note: DRY, CK, and WET represent treatments of decreased precipitation, natural precipitation, and increased precipitation, respectively. Values are means with standard deviation in parentheses (n = 3). Values with different lower-case letters (first year) and capital letters (second year) within a column were statistically different in a different year (p < 0.05).
Table 6. Understory N accumulation in biomass (U-N) and Mongolian pine N uptake (Mp-N) in different rainfall amount manipulation plots.
YearTreatmentMp-N (g·m−2 Growing·Season−1)U-N (g·m−2 Growing·Season−1)
DRY3.08 ± 0.05a9.30 ± 0.07a
2014CK5.11 ± 0.03b10.11 ± 0.08b
WET5.83 ± 0.03b11.81 ± 0.07c
DRY4.13 ± 0.09A8.76 ± 0.02A
2015CK5.86 ± 0.07A9.68 ± 0.03B
WET7.02 ± 0.03B12.59 ± 0.02C
Note: DRY, CK, and WET represent treatments of decreased precipitation, natural precipitation and increased precipitation, respectively. Values are means with standard deviation in parentheses (n = 3). Values with different lower-case letters (first year) and capital letters (second year) within a column were statistically different in a different year (p < 0.05).

