Article

Modelling Hydrology and Sediment Transport in a Semi-Arid and Anthropized Catchment Using the SWAT Model: The Case of the Tafna River (Northwest Algeria)

1
Laboratoire d’Écologie et Gastion des Ecosystmes Naturels (LECGEN), University of Tlemcen, 13000 Tlemcen, Algeria
2
Laboratoire Ecologie Fonctionnelle et Environnement (EcoLab), Université de Toulouse, CNRS, INPT, UPS, 31400 Toulouse, France
3
Géosciences Environnement Toulouse, Université de Toulouse, CNES, CNRS, IRD, UPS, 31400 Toulouse, France
*
Author to whom correspondence should be addressed.
Water 2017, 9(3), 216; https://doi.org/10.3390/w9030216
Submission received: 15 December 2016 / Revised: 6 March 2017 / Accepted: 7 March 2017 / Published: 14 March 2017
(This article belongs to the Special Issue Sediment Transport in Coastal Waters)

Abstract

:
Sediment deposits in North African catchments contribute to around 2%–5% of the yearly loss in the water storage capacity of dams. Despite its semi-arid climate, the Tafna River plays an important role in Algeria’s water self-sufficiency. There is continuous pressure on the Tafna’s dams to respond to the demand for water. The Soil and Water Assessment Tool (SWAT) was used to evaluate the contribution of different compartments in the basin to surface water and the dams’ impact on water and sediment storage and its flux to the sea in order to develop reservoir management. The hydrological modelling fitted well with the observed data (Nash varying between 0.42 and 0.75 and R2 varying between 0.25 and 0.84). A large proportion of the surface water came from surface runoff (59%) and lateral flow (40%), while the contribution of groundwater was insignificant (1%). SWAT was used to predict sediments in all the gauging stations. Tafna River carries an average annual quantity of 2942 t·yr−1 to the Mediterranean Sea. A large amount of water was stored in reservoirs (49%), which affected the irrigated agricultural zone downstream of the basin. As the dams contain a large amount of sediment, in excess of 27,000 t·yr−1 (90% of the sediment transported by Tafna), storage of sediment reduces the lifetime of reservoirs.

1. Introduction

As in most semi-arid and arid regions, which cover over 40% of the world’s land surface, water resource management in the Middle East and North Africa is more complex than it is in humid zones due to the lack of perennial rivers and other readily available water sources [1]. The population of the Middle East and North Africa was 432 million in 2007, and is projected to reach nearly 700 million by 2050 [2]. This alone would lead to a 40% drop in per capita water availability in the region by 2050 [3]. In Maghreb (Northwest Africa), which has only scarce water resources, most damage is associated with the loss of alluvial sediments from the catchment and subsequent dam siltation [4]. The study of semi-arid North African environments is problematic for several reasons. These include data gaps and considerable anthropic pressures coupled with increasingly intense dry seasons [5].
As in all North African countries, water in Algeria is one of its most valuable resources because it is one of the poorest countries in the region in terms of water potential [6]. Algeria’s rivers transport a large quantity of sediments [7,8]. The sediment deposited in Algerian dams is estimated to be 20 × 106 m3·yr−1 [9]. Competition for water between agriculture, industry, and drinking water supply—accentuated by a drought in Algeria—has shown the need for greater attention to be paid to water [10] and for it to be managed at the large basin scale [11]. Surface water resources in Algeria are evaluated to be approximately 8376 billion m3 for an average year [12]. These water resources in Algeria are characterized by wide variability—the resources for the last nine years have been significantly below this average [13]. In this context, several dams were built in Algeria to ensure water resources for the supply of drinking water to all its cities and allowed approximately 12,350 km2 of irrigated land to be developed [12,13,14]. However, dam reservoirs lose about 20 × 106 to 30 × 106 m3 of water storage every year [15,16].
Despite its semi-arid climate, the Tafna catchment plays an important role in water self-sufficiency in northwest Algeria [17]. There is always huge pressure on Tafna dams, which have a capacity of 398 × 106 m3, in order to meet the demand expressed specifically and continuously by the largest cities of northwest Algeria (Oran, which is Algeria’s second largest city with 10,000 m3·day−1; Sidi Bel Abbes, 20,000 m3·day−1; Ain Temouchent, 15,000 m3·day−1; and Tlemcen, 37,000 m3·day−1) [12,17].
The deposits of sediment in Maghreb contribute about 2%–5% of the yearly loss in the dams’ water storage capacity. In Algeria, the intercepted runoff in dams and weirs hold about 5.2 billion m3, which makes up 42% of total runoff [18]. The construction of dams has raised questions about their hydrological impacts on water resources at basin scale, especially where there are conflicts between upstream and downstream water users [19,20].
Hydrological models serve many purposes [21]. The accuracy and skill of flow prediction models can have a direct impact on decisions with regard to water resources management. Various statistical and conceptual streamflow prediction models have been developed to help urban planners, administrators, and policy makers make better and more informed decisions [22]. Hydrological models including distributed physically-based model—such as SHE [23], TOPMODEL [24], HEC [25], VIC [26], IHDM [27], and WATFLOOD [28]—are capable of simulating temporal-spatial variations in hydrological processes and assist in the understanding of mechanisms of influence behind land use impacts [29].
Out of the distributed physically-based models, the Soil and Water Assessment Tool (SWAT) [30] has been used widely to assess agricultural management practices [31], help identify pollution sources and contaminant fate [32,33], evaluate the impacts of climate change [34], and assess the hydrology and sediment transfer in various catchments [35,36]. Many authors have applied SWAT in semi-arid areas, such as southeast Africa [37], southern Australia [38], in the Mediterranean coastal basin in Spain [39], and in North Africa [40,41]. Some authors have focused on the impact of dams on water balance using SWAT because of its reservoir module [42,43], as shown in China [44] and Pakistan [45].
By applying the SWAT model, which is not widely used in Algeria, to a semi-arid anthropized catchment, the objectives of this study were: (1) to evaluate the contribution of the different compartments of the basin to surface water; (2) to evaluate the impact of the construction of dams in semi-arid catchments on water and sediment storage and (3) on suspended sediment flux to the sea, in order to facilitate, plan, and assess the management of these important reservoirs, which are a crucial part of water self-sufficiency in semi-arid regions.

2. Materials and Methods
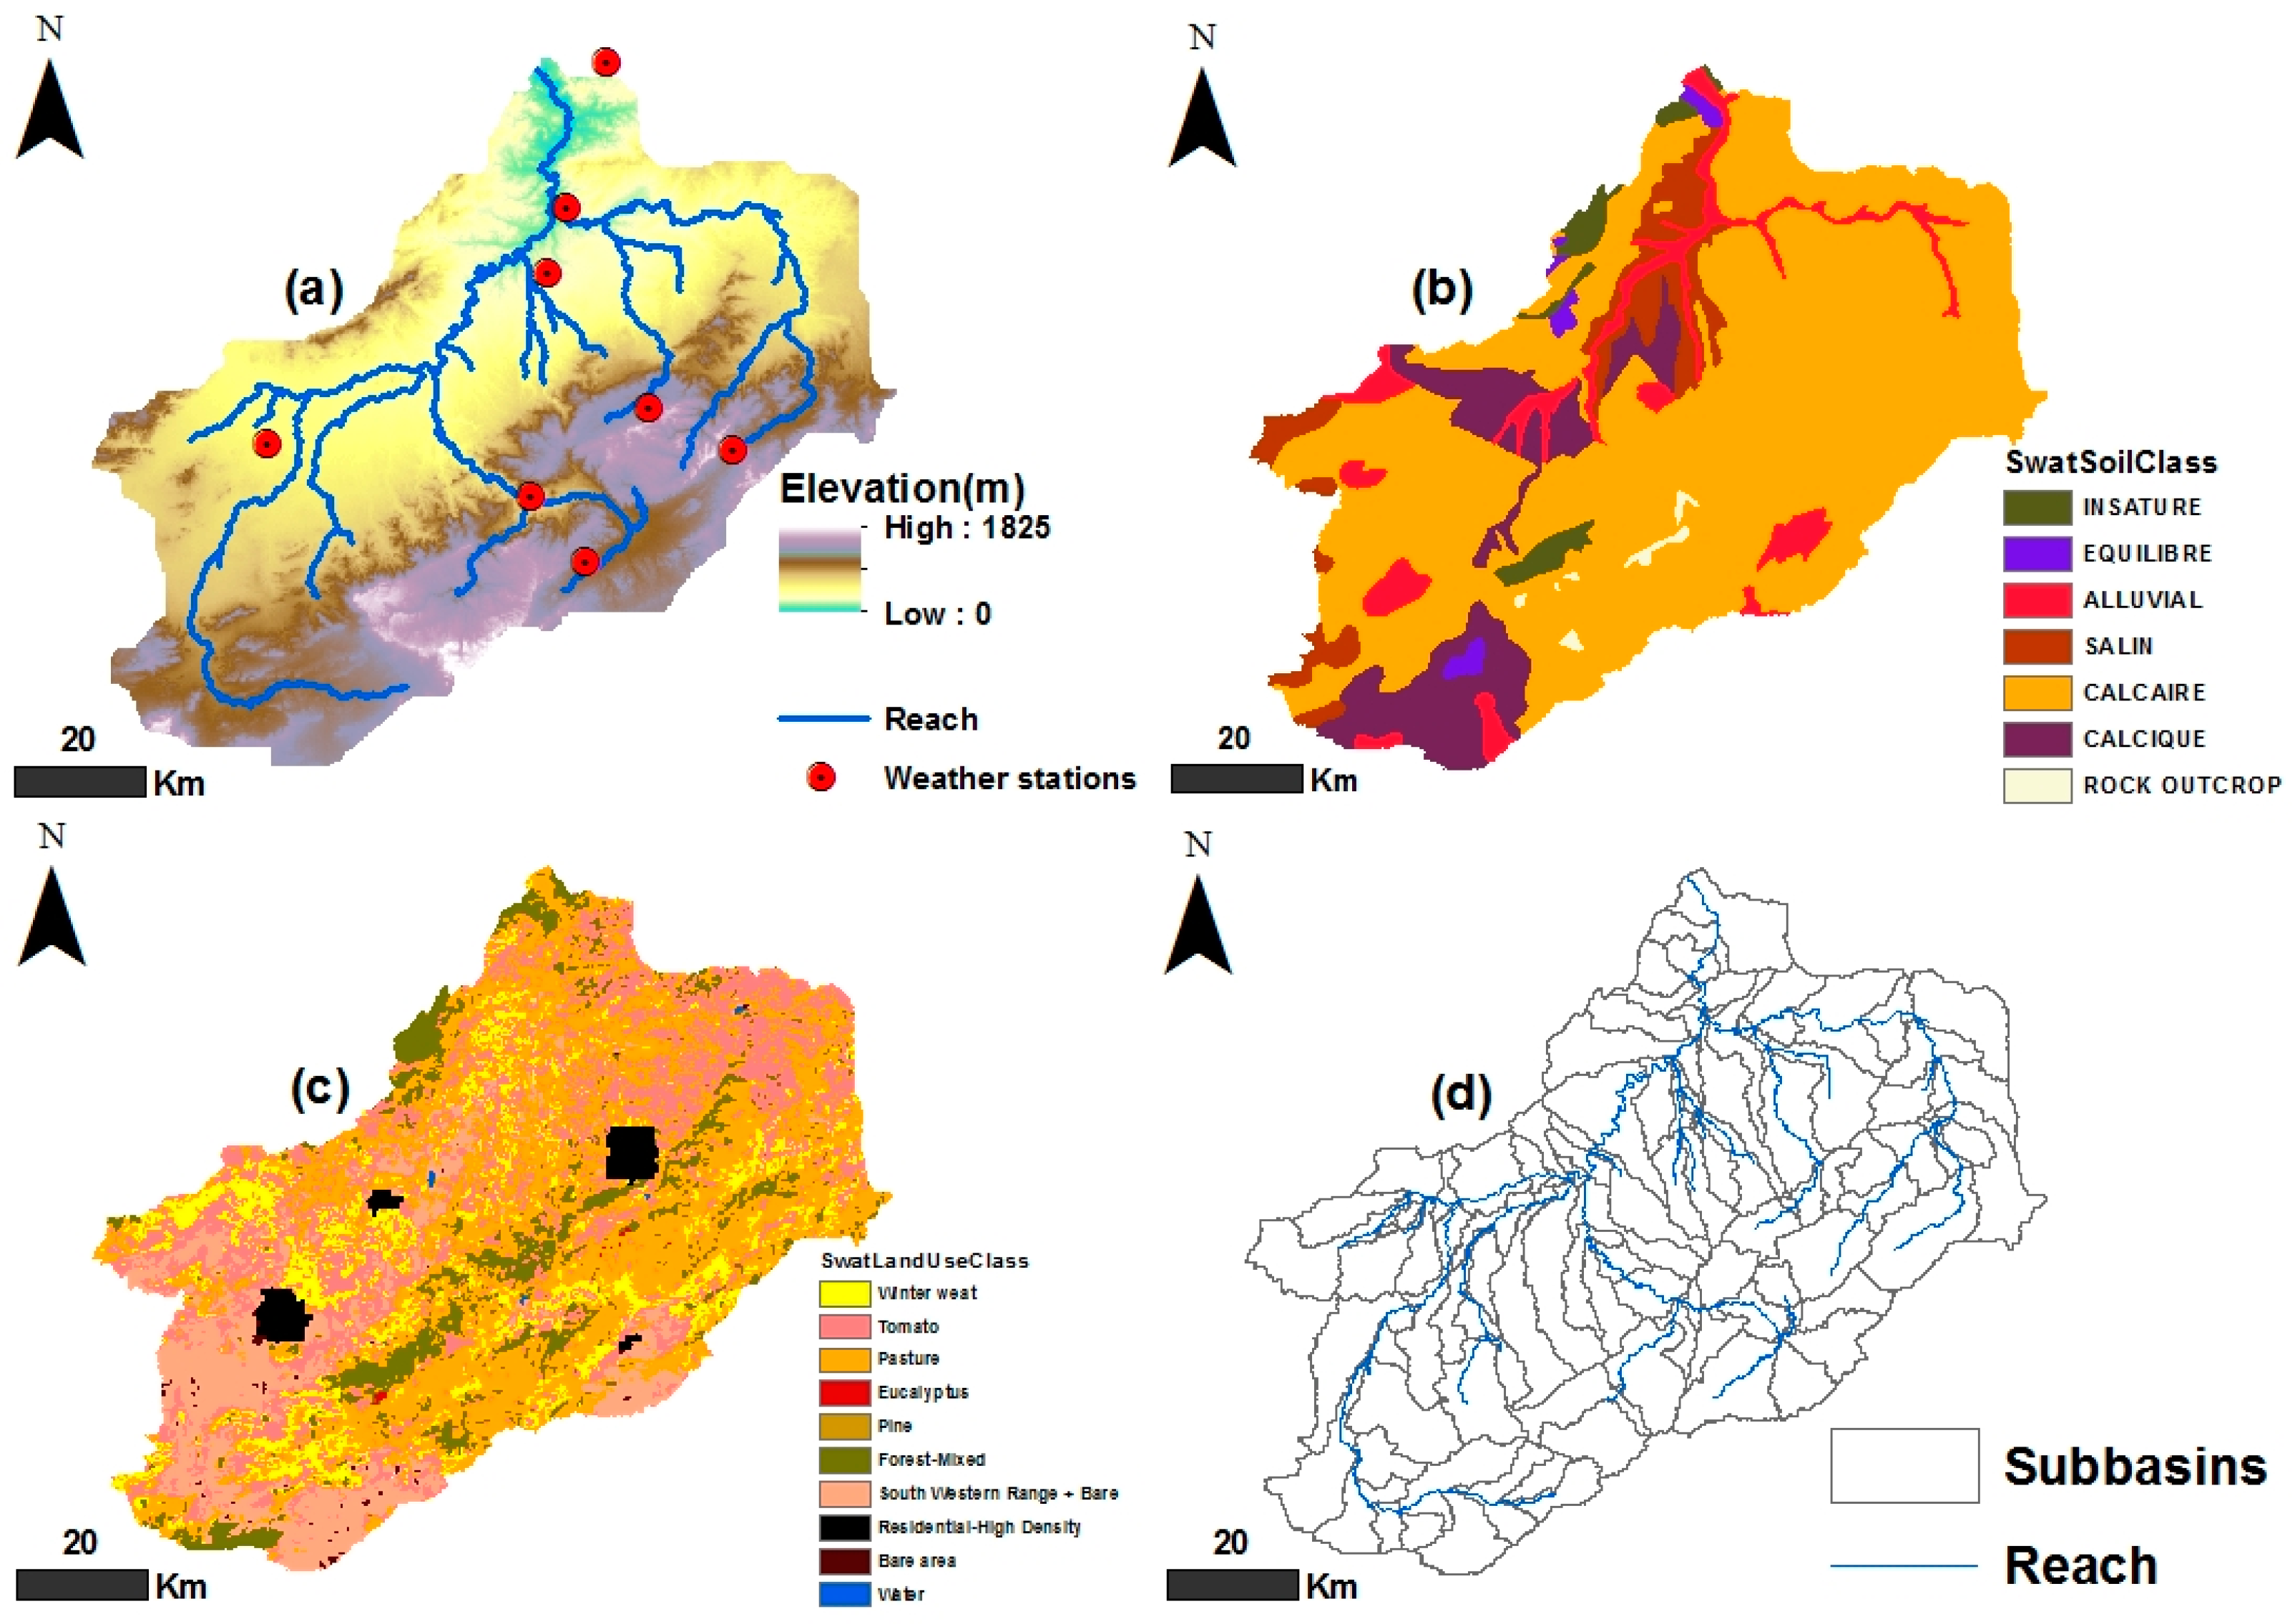
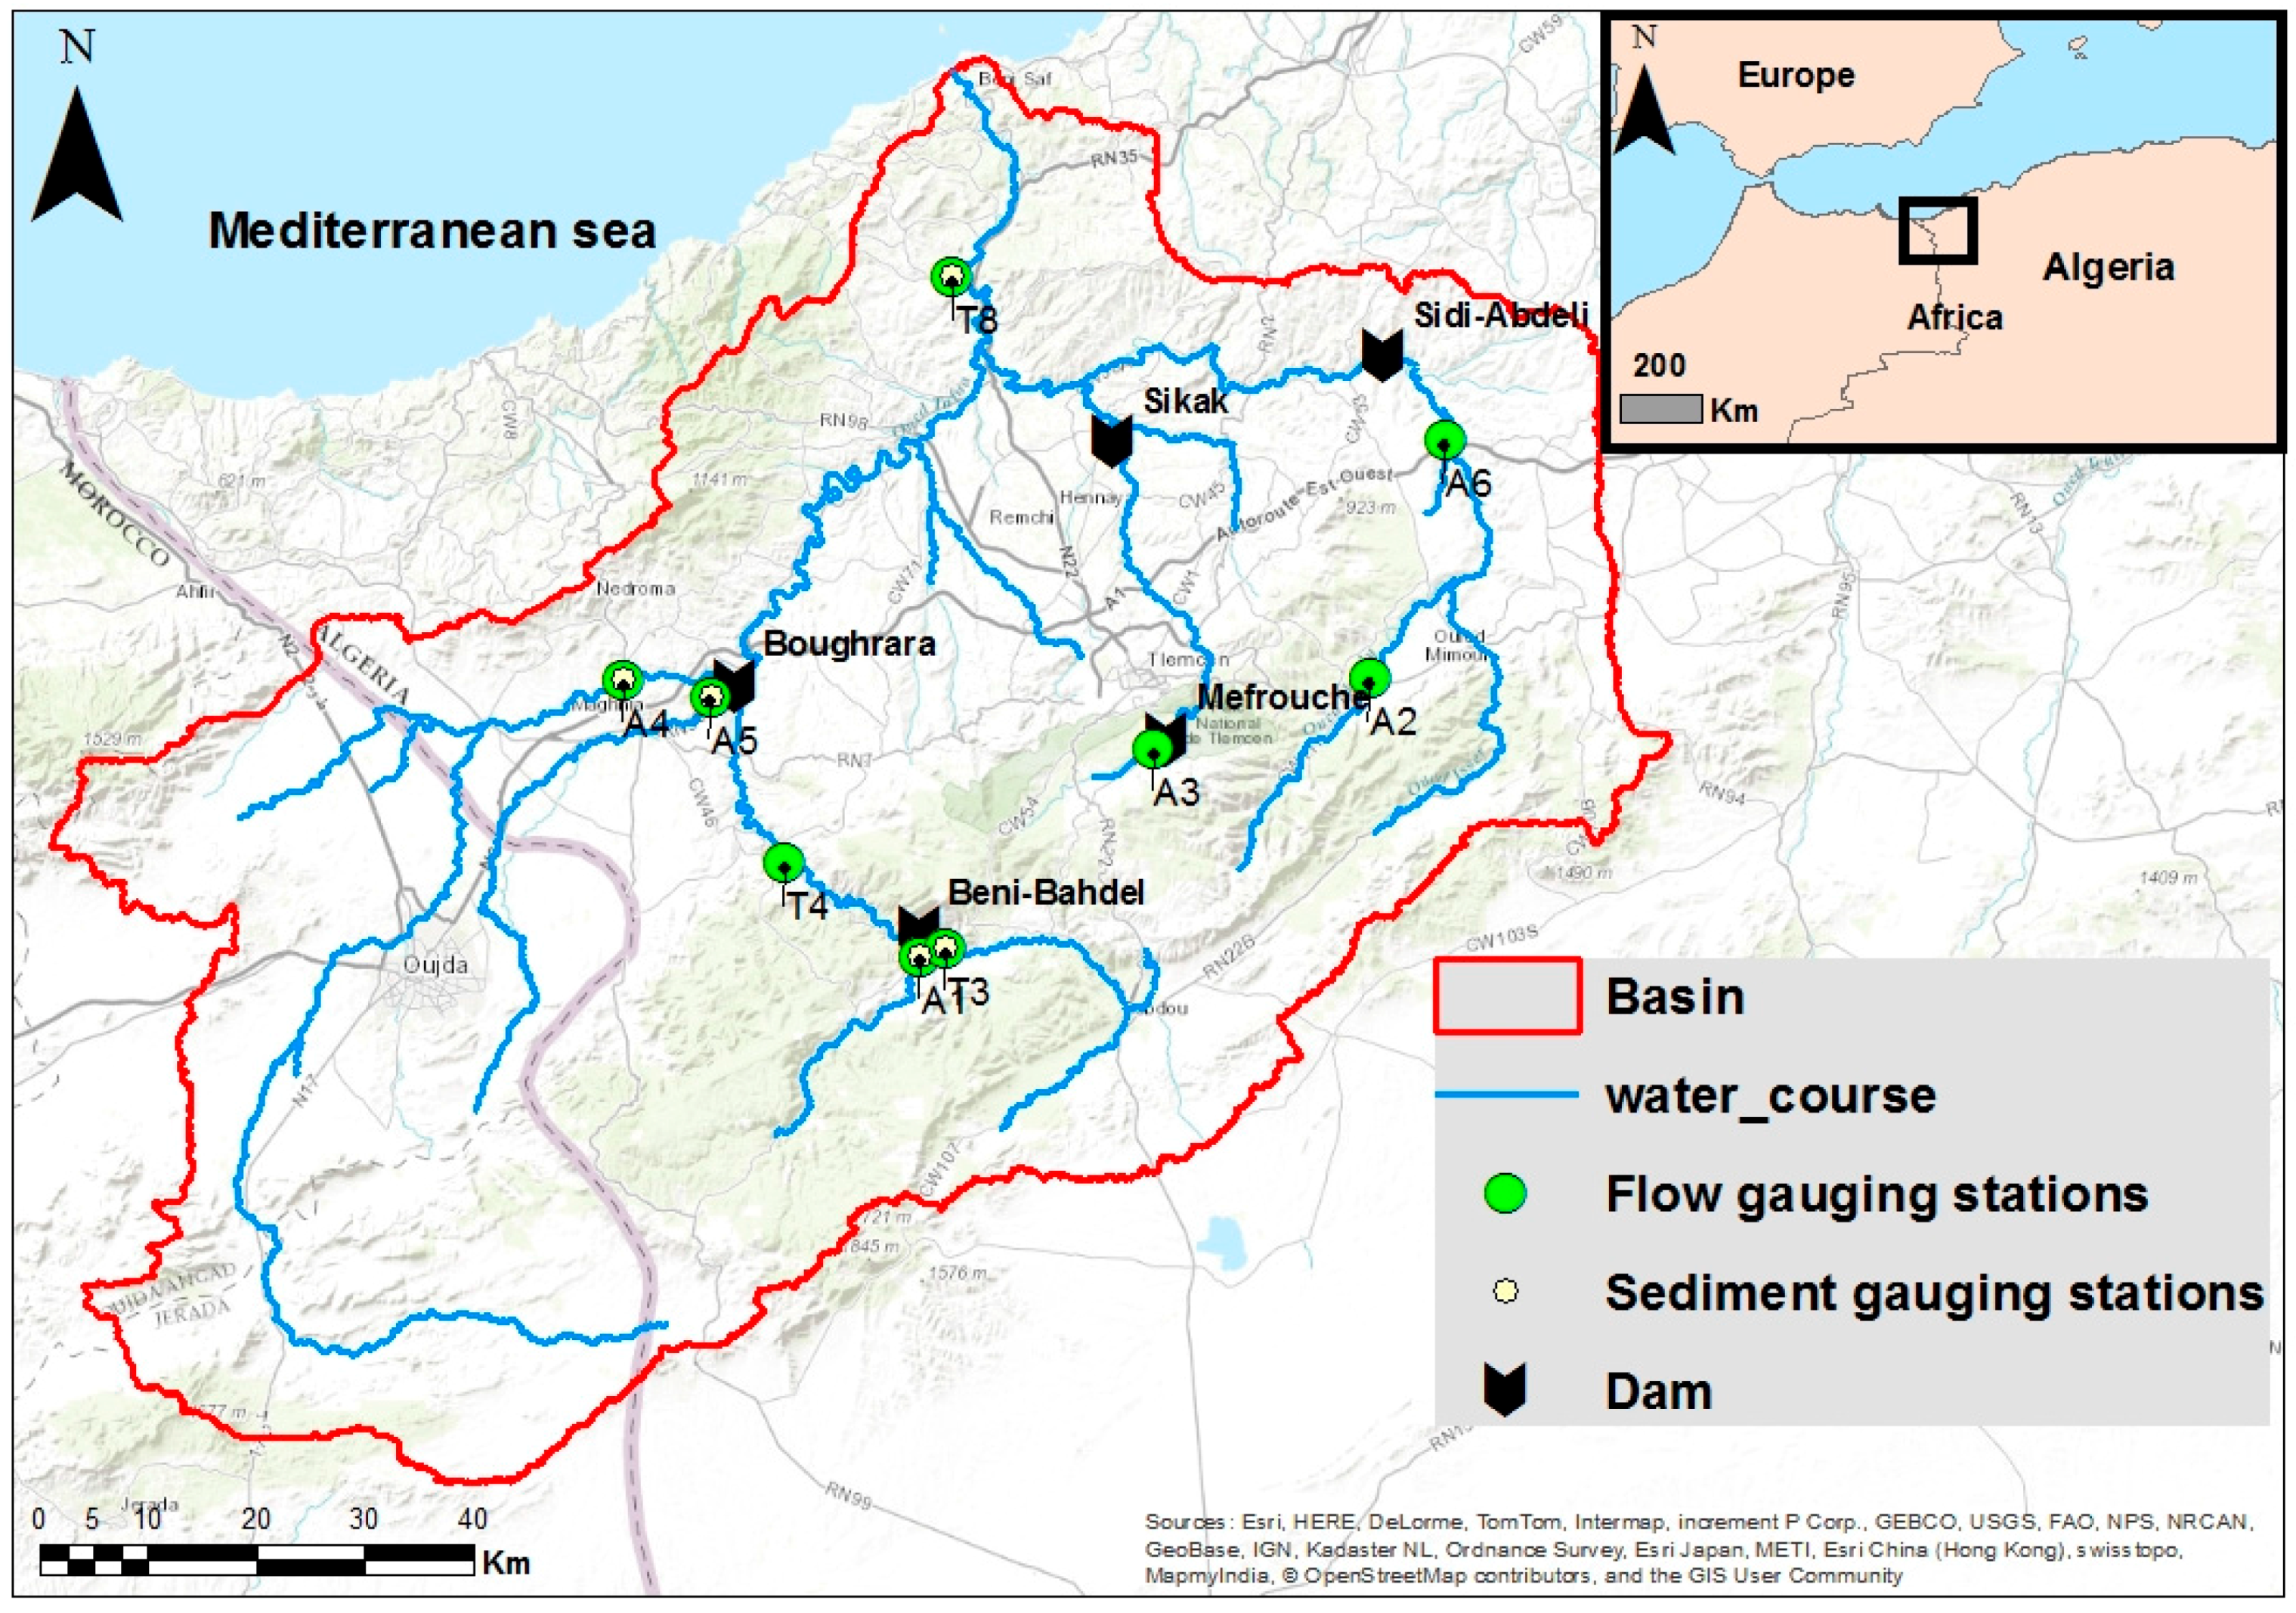
To achieve these objectives, the study was divided into two parts. First a model with dams was considered in which hydrology and sediment flux were calibrated on all the gauging stations. Then a model without dams was considered, retaining the same calibration parameters as the first model, which revealed the impact of the installation of this infrastructure on hydrology and sediment flux in this basin. To verify this method, the flows of the two projects were verified on the basis of the literature published by the Algerian National Agency of Hydrologic Resources [46,47,48].

2.1. Study Site

The Tafna watershed covers much of western Algeria (Figure 1). The Tafna Wadi is the main stream with a drainage area of 7245 km2 and elevation varying from sea level to 1100 m.a.s.l. After a 170-km course, the river reaches the Mediterranean Sea near the town of Beni-Saf. It is located between 34°11’ N, 35°19’ N latitude and 0°50’ W, 2°20’ W longitude. The catchment area of the Tafna is divided into two zones that are of a different geological nature: the upstream sector where the river runs in a canyon through Jurassic rocks rich in limestone and dolomite, and the downstream sector where it runs in a tertiary basin characterized by marls covered by recent alluvium [49].
The climate is Mediterranean with two main seasons: a long, dry, hot summer-autumn and a winter-spring with abrupt and frequent heavy rainfall. During the summer, most of the streams, especially in their downstream parts, become mostly dry between June and October. The annual average water temperature varies from 11° in winter to 28° in summer [5]. Annual rainfall is between 240 and 688 mm·yr−1 [50]. The flow at the watershed outlet ranges from 0 to 108 m3·s−1 [51]. The Tafna River has several tributaries. The most important tributary is the Mouillah Wadi, situated in Maghnia region, which is an industrial area. This tributary is polluted by domestic sewage and industrial effluent from the Moroccan cities of Oujda and El Abbes and the Ouerdeffou Wadi. Another important tributary is the Isser Wadi, but its water supply to the Tafna has decreased significantly since the construction of the Al Izdahar dam, which retains most of the water during the rainy season for irrigation purposes [52]. Five dams have been constructed in the catchment of the Tafna: Beni Bahdel, Meffrouch, Hammam Boughrara, Al Izdahar (Sidi-Abdeli), and Sikkak. Their capacities vary between 15 and 177 million m3 (Table 1).
According to the Algerian Ministry of Agriculture, agriculture occupies an important place in the catchment of the Tafna, with cereal covering 1699 km2 (23.6% of the total area), horticulture 342 km2 (4.75% of the total area) and arboriculture 263 km2 (3.65% of the total area). The basin has about 1,450,000 inhabitants [53]. The more densely populated areas are the cities of Oujda (Morocco) with 548,280 inhabitants, followed by the city of Tlemcen (Algeria), which has 140,158 inhabitants.

2.2. Discharge and Sediment Monitoring

Tafna’s daily discharge and monthly sediment measurement has been monitored since 2003 by the National Agency of Hydrologic Resources (ANRH) at nine hydrometric stations (Figure 1). River discharge was obtained from the water level, which is continuously measured by a limnimetric ladder and float water level recorder using a rating curve. Suspended sediments are defined as the portion of total solids retained by a fiberglass membrane (Whatman GF/F) of 0.6 µm porosity. The sediment collected was weighed after being dried at 105 °C for 24 h. The difference in the weight of the filter before and after filtration allowed the calculation of the suspended sediment concentration based on the volume of water filtered (C, in g·L−1).

2.3. Modelling Approach

2.3.1. The SWAT Model

SWAT was developed at the USDA Agricultural Research Service [30]. It was designed for application in catchments ranging from a few hundred to several thousand square kilometres. The model is semi-distributed: the catchment is first divided into sub-catchments and then into hydrologic response units (HRUs), which represent homogeneous combinations of soil type, land use type, and slope. Any identical combination of these three features is assumed to produce a similar agro-hydrologic response [54].

The Hydrological Component in SWAT

SWAT uses a modified SCS curve number method (USDA Soil Conservation Service, 1972) to compute the surface runoff volume for each HRU. The peak runoff rate is estimated using a modification of the rational method [55]. Daily climatic data are required for calculations. Flow is routed through the channel using a variable storage coefficient method [56].
The hydrologic cycle as simulated by SWAT is based on the water balance equation:
S W t =   S W 0 +   i = 1 i ( R d a y Q s u r f E a   W s e e p Q g w )  
where SWt is the final soil water content on day i (mm), SW0 is the initial soil water content on day i (mm), t is the time (days), R is the amount of precipitation on day i (mm), Qsurf is the amount of surface runoff on day i (mm), Ea is the amount of evapotranspiration on day i (mm), Wseep is the amount of water entering the vadose zone from the soil profile on day i (mm), and Qgw is the amount of return flow to the stream on day i (mm) [57].
The water balance of dams is given by the following equation:
V = V s t o r e d + V f l o w i n   V f l o w o u t +   V p c p   V e v a p V s e e p
where V is the volume of water in the impoundment at the end of the day (m3 H2O), Vstored is the volume of water stored in the water body at the beginning of the day (m3 H2O), Vflowin is the volume of water entering the water body during the day (m3 H2O), Vflowout is the volume of water flowing out the water body during the day (m3 H2O), Vpcp is the volume of the precipitation falling on the water body during the day (m3 H2O), Vevap is the volume of water removed from the water body by evaporation during the day (m3 H2O), and Vseep is the volume of water lost from the water body by seepage during the day (m3 H2O) [57].
Flow is routed through the channel using a variable storage coefficient method [56] or the Muskingum routing method [57].

Suspended Sediment Modelling Component in SWAT

The sediment from sheet erosion for each HRU is calculated using the modified universal soil loss equation (MUSLE) [58]. Details of the MUSLE equation factors can be found in theoretical documentation of SWAT [59]. Sediment was routed through stream channels using a modification of Bagnold’s sediment transport equation [60]. The deposition or erosion of sediment within the channel depends on the transport capacity of the flow in the channel.

2.4. SWAT Data Inputs

The following spatialized data were used in this study: (i) a digital elevation model with a 30 m × 30 m resolution from the US Geological Survey (Figure 2a); (ii) a soil map [61] (Figure 2b); (iii) a land-use map [62] (Figure 2c); (iv) daily climate data between 2000 and 2013 from eight meteorological stations (Figure 2) provided by the Algerian National Office of Meteorology that were used to simulate the reference evapotranspiration in the model using the Hargreaves method because it is the best in semi-arid regions [63]; and (v) daily discharge outflow data for the five Tafna dams provided by the Algerian National Agency for Dams and Transfers (ANBT). Version 2012 of ArcSWAT (Texas Agrilife Research, Usda Agricultural Research Service, Temple, TX, USA) was used to set up the model. The catchment was discretized into 107 sub-basins with a minimum area of 7020 km2 (Figure 2d) and 1067 HRUs. To measure the impact of the dams, two SWAT projects were undertaken with and without dams, retaining the same parameter values.

2.5. Model Calibration

In this study, the SUFI-2 (sequential uncertainty fitting, ver. 2) algorithm [64] was used for calibration and sensitivity analysis for flow and sediment output. This program is currently linked to SWAT in the calibration package SWAT-CUP (SWAT calibration uncertainty procedures) (EAWAG, Zurich, Switzerland.). The whole simulation was performed daily from January 2000 to December 2013 (excluding a three-year warm-up from 2000 to 2003). Stream flow was calibrated at a monthly time-step because of the lack of good observed daily data from January 2003 to August 2011, while sediments were calibrated at a daily time-step from January 2003 to December 2006 except for station A5, which was from January 2003 to December 2005. 150 simulations were performed for each gauging station by SWAT-CUP.

2.6. Model Evaluation

The monthly discharge performance of the model was evaluated using the Nash-Sutcliffe efficiency (NSE) index [65] and the coefficient of determination (R2):
NSE =   1 i = 1 n ( O i S i ) 2 i = 1 n ( O i O ¯ ) 2
R 2 =   { i = 1 n ( O i O ¯ ) ( S i S ¯ ) [ i = 1 n ( O i O ¯ ) 2   ] 0.5 [ i = 1 n ( S i S ¯ ) 2   ] 0.5 }
where Oi and Si are the observed and simulated values, n is the total number of paired values, O ¯ is the mean observed value, and S ¯ is the mean simulated value.
In this study, monthly NSE was deemed satisfactory at >0.5 [66] and daily and monthly R2 satisfactory at >0.5 [66].

3. Results

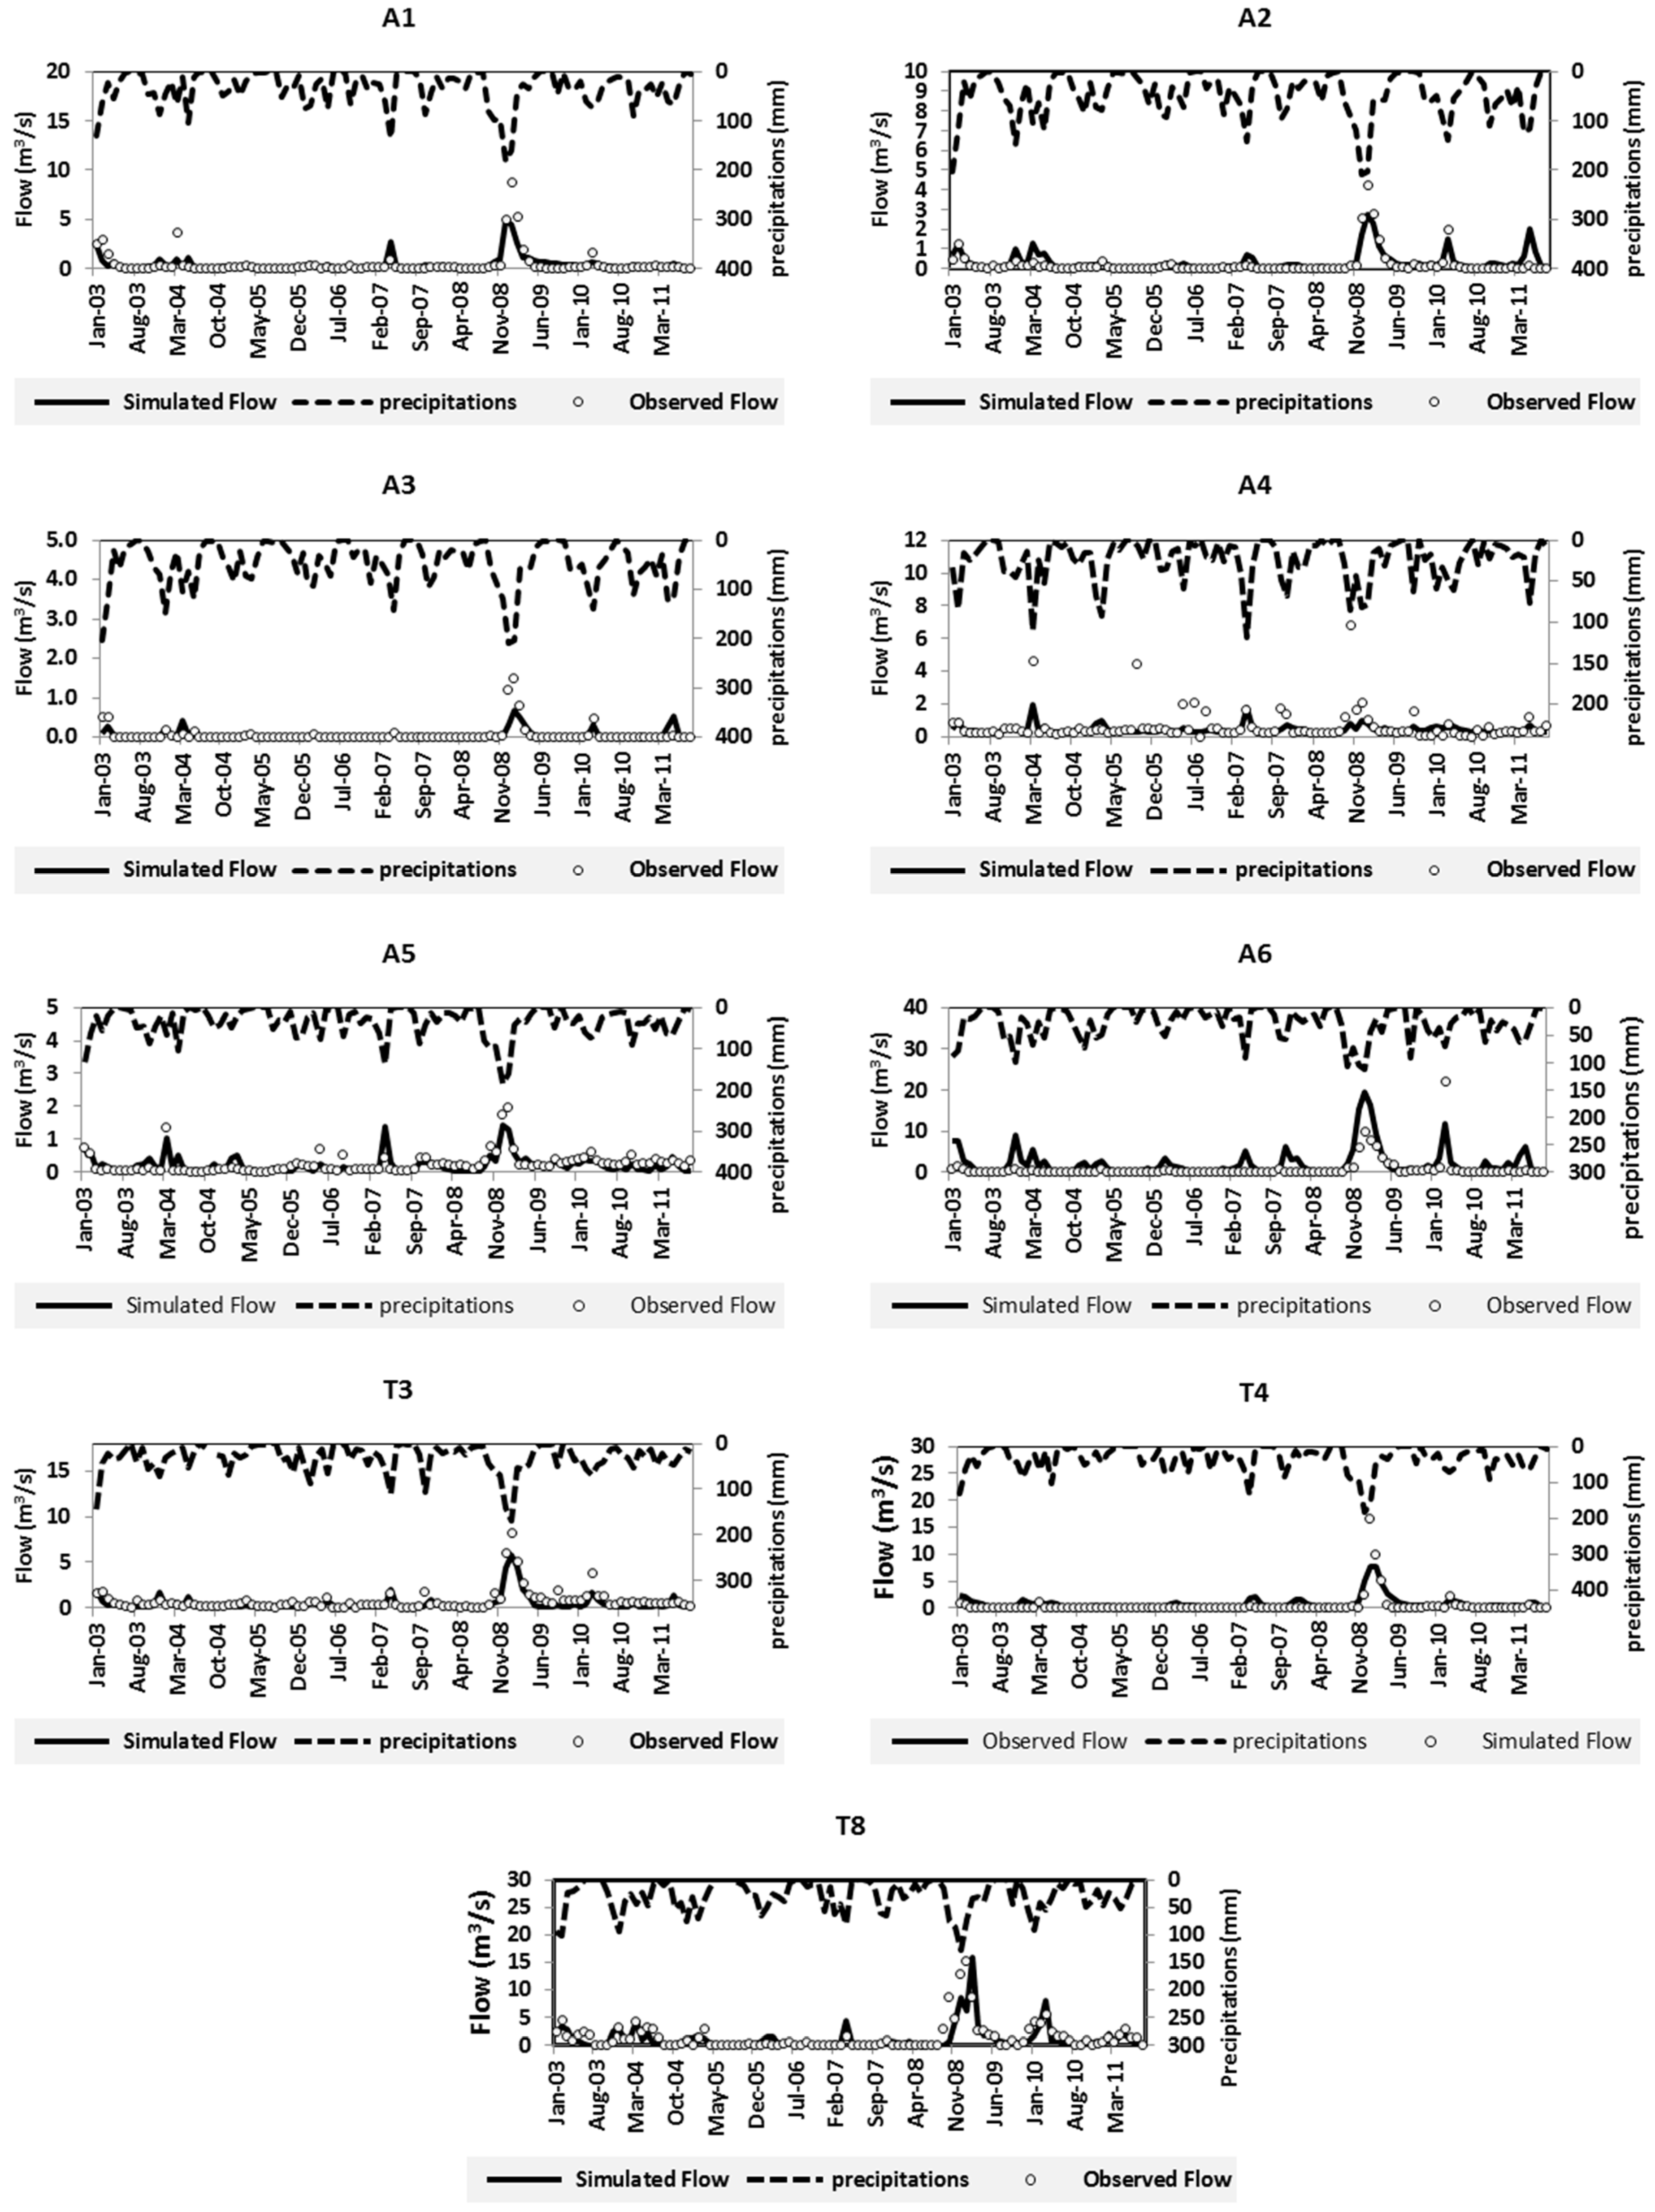
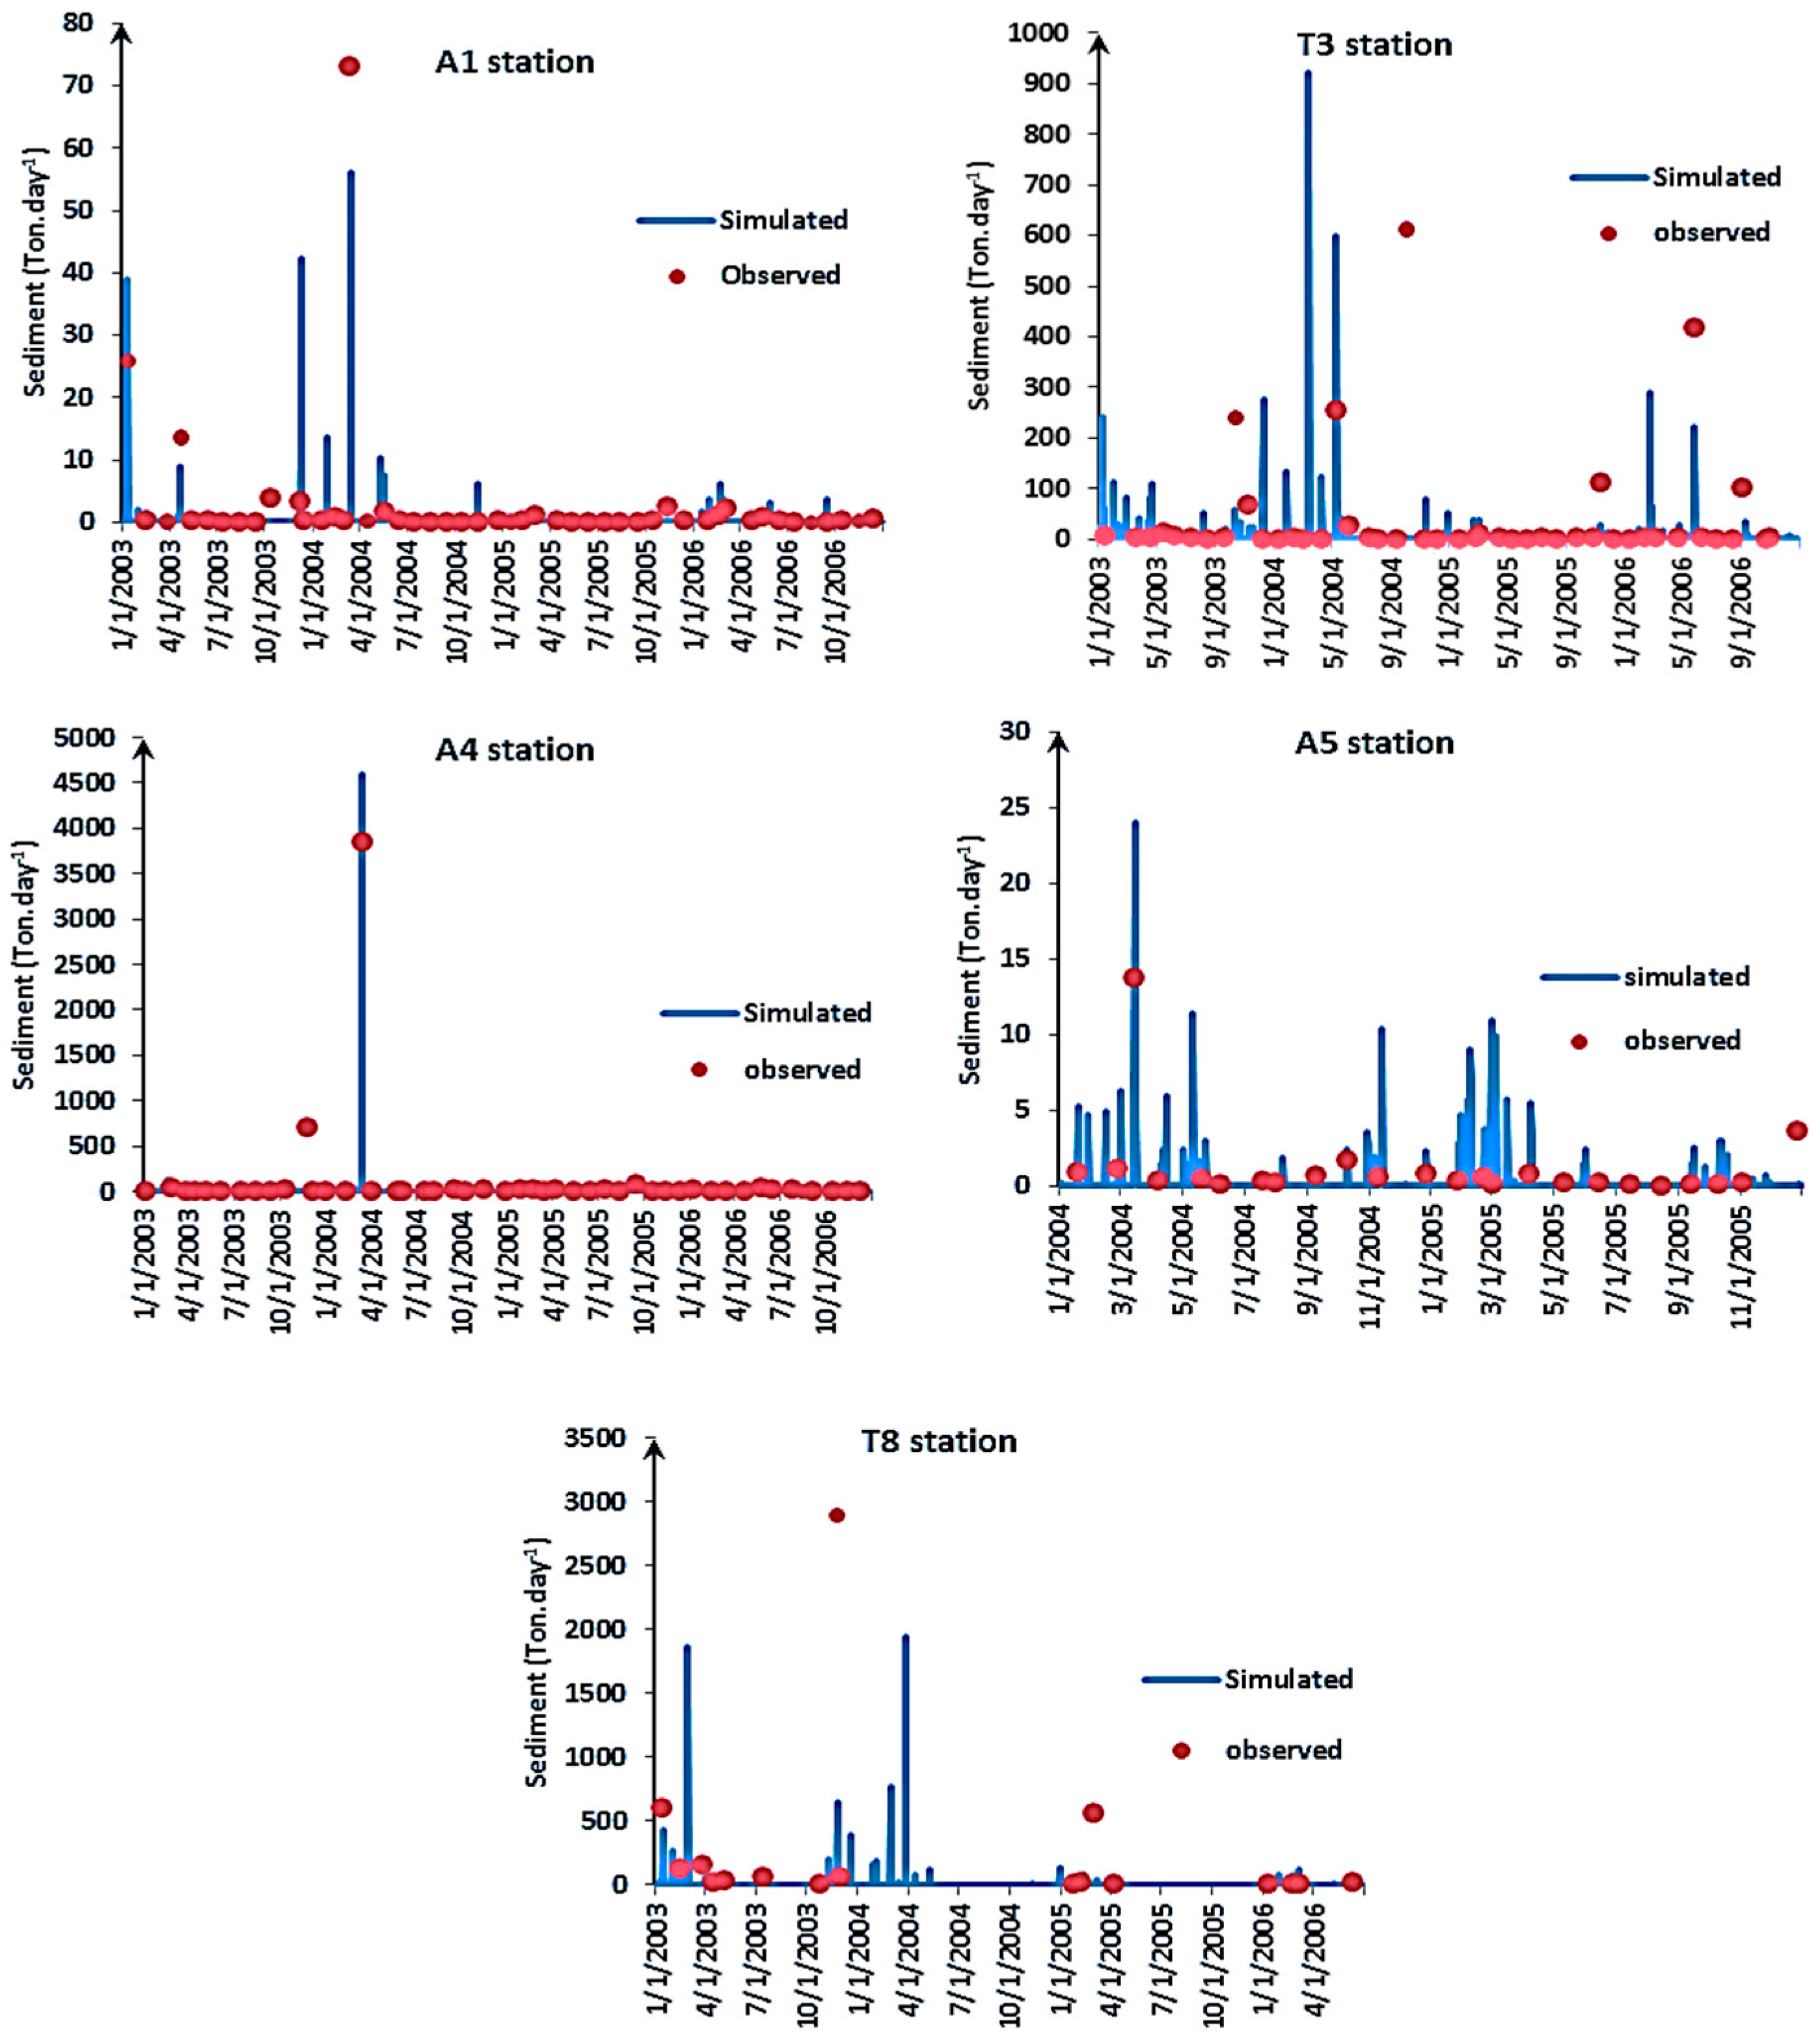
3.1. Discharge and Sediment Calibration

For discharge and sediment calibration, the following parameters, presented in (Table 2), were calibrated.
For the calibrated parameter set, the average annual rainfall of the total simulation period over the area of the catchment is 364 mm·yr−1. The model predicted the potential evapotranspiration to be 1301.4 mm·yr−1, and runoff as 26.16 mm·yr−1.
In this study, only the monthly calibration of flow without validation was performed because there were several difficulties with calibration due to the poor measurement of daily water flow in the gauging stations (renovations of the limnimetric scales and maintenance of the stations need to be undertaken). The flow was calibrated at nine gauging stations. Monthly simulated discharges were satisfactorily correlated to observations for the calibration periods, except for the A4 station (Figure 3, Table 3). It should be noted that the values of the performance of the model evaluation parameters were more satisfactory in the upstream portion, with NSE varying between 0.5 and 0.75 and R2 between 0.49 and 0.84, while in the downstream part NSE between 0.42 and 0.59 and R2 between 0.25 and 0.62 were found.
The hygrogram of the Tafna River modelled by SWAT (Figure 4) showed that a large proportion of surface water came from surface runoff (59%) and lateral flow (40%), while the contribution of groundwater was insignificant (1%).
The results of sediment calibration are shown in Figure 5.
Figure 5 compares graphically measured and simulated daily sediment yield values for the calibration. Although the observed data were limited, sediment estimation by the model showed that simulated and measured sediment yields were in a similar range for the calibration period.
The annual simulations for each sub-catchment (Figure 6) show that rainfall (Figure 6A) varied between 270 and 550 mm·yr−1, and the largest quantity (450–550 mm·yr−1) was in the Tlemcen Mountains sub-basins. The potential evapotranspiration (Figure 6B) was between 993 and 1300 mm in the downstream portion, while it was between 1300 and 1500 mm in the entire basin. Surface runoff (Figure 6C) varied between 0 and 120 mm·yr−1 (semi-arid catchment). The highest values were located in the upstream sub-basin (between 10 and 30 mm), while the lowest were downstream (between 0 and 10 mm). The rate of soil erosion ranged from 0 to 0.2 t·ha−1·yr−1 (Figure 6D), and the eastern upstream basins were identified as areas with high soil erosion in the Tafna.

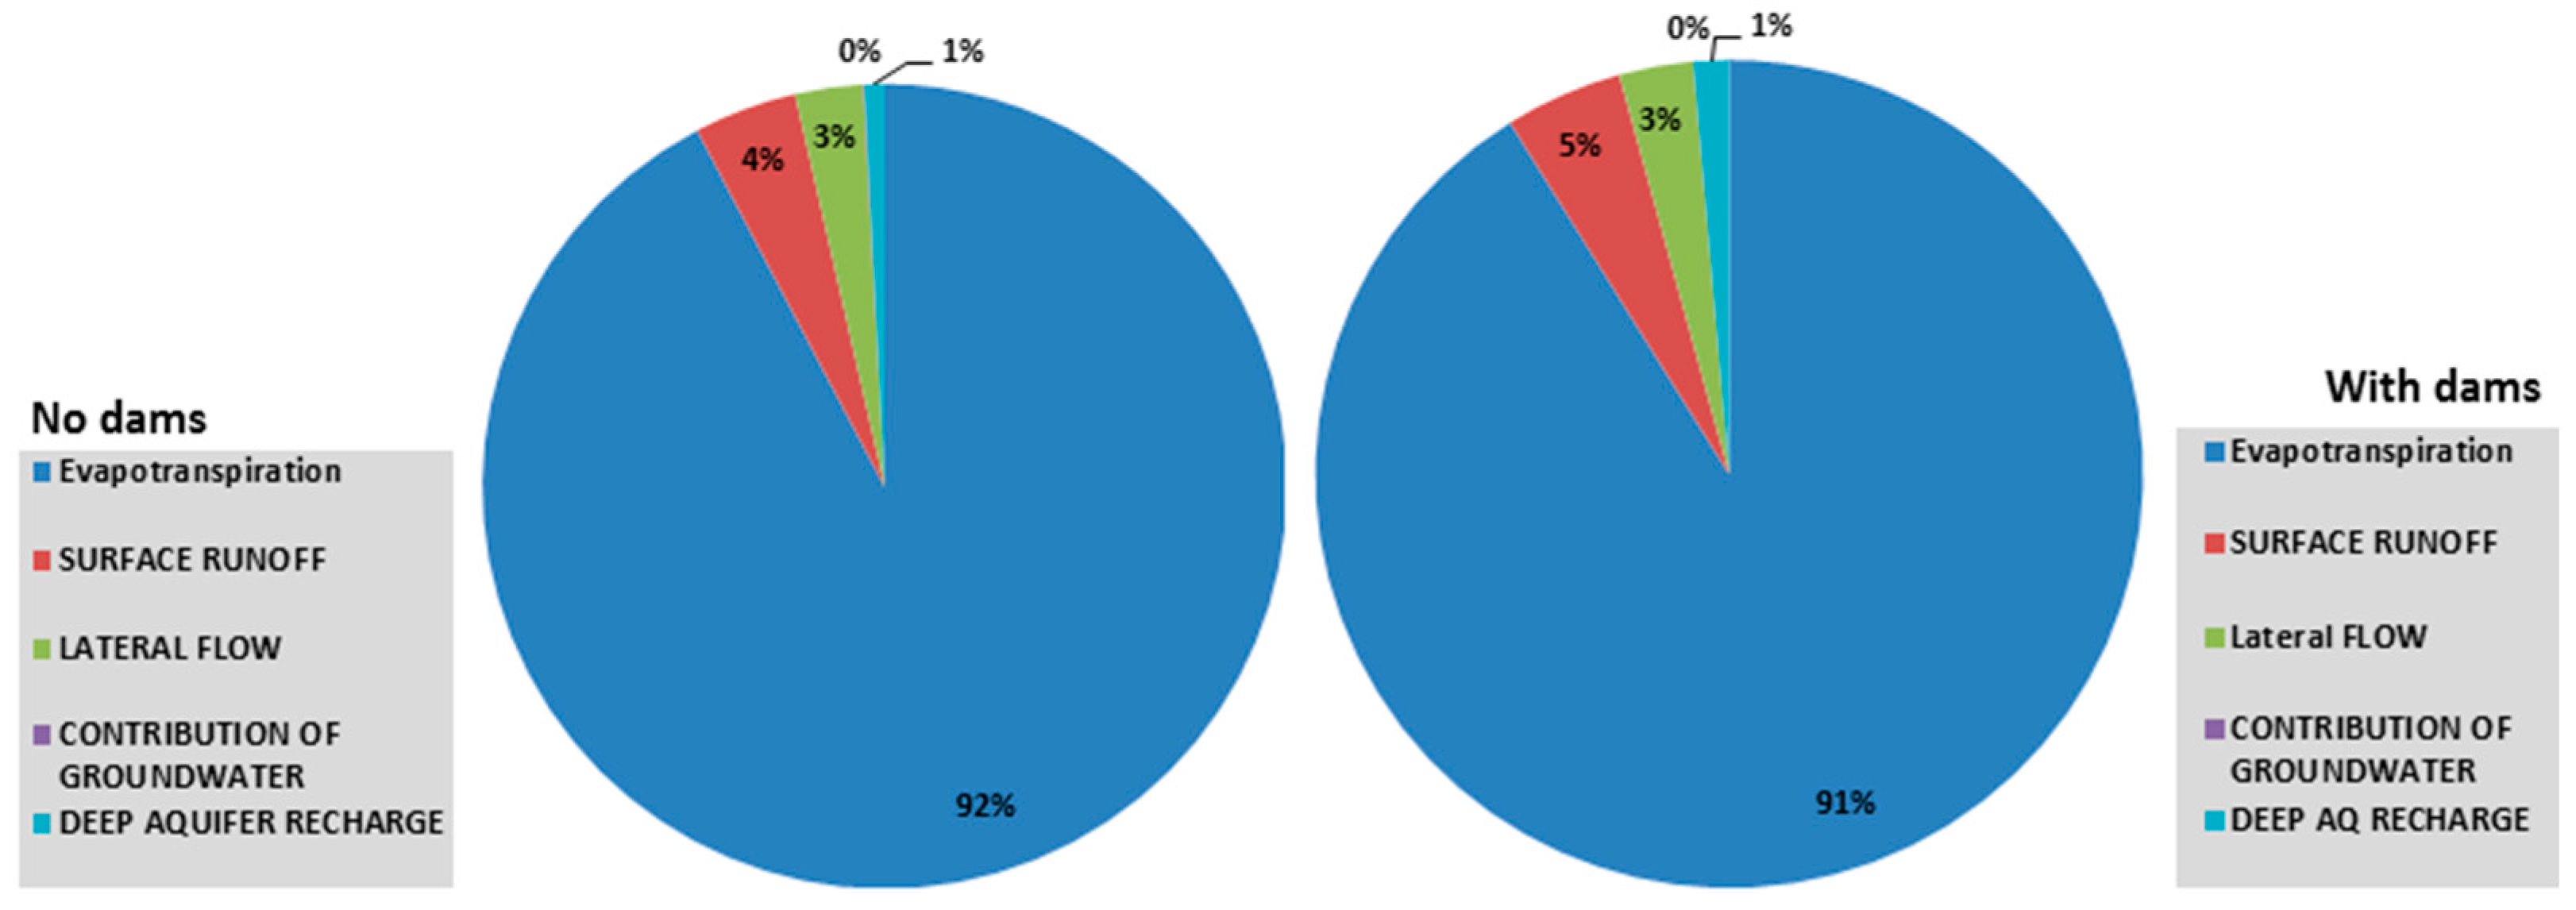
3.2. Impact of Dams on Water Balance and Sediment Loading

To assess the impact of dam construction on water balance and sediments, the SWAT model was run both with and without dams.

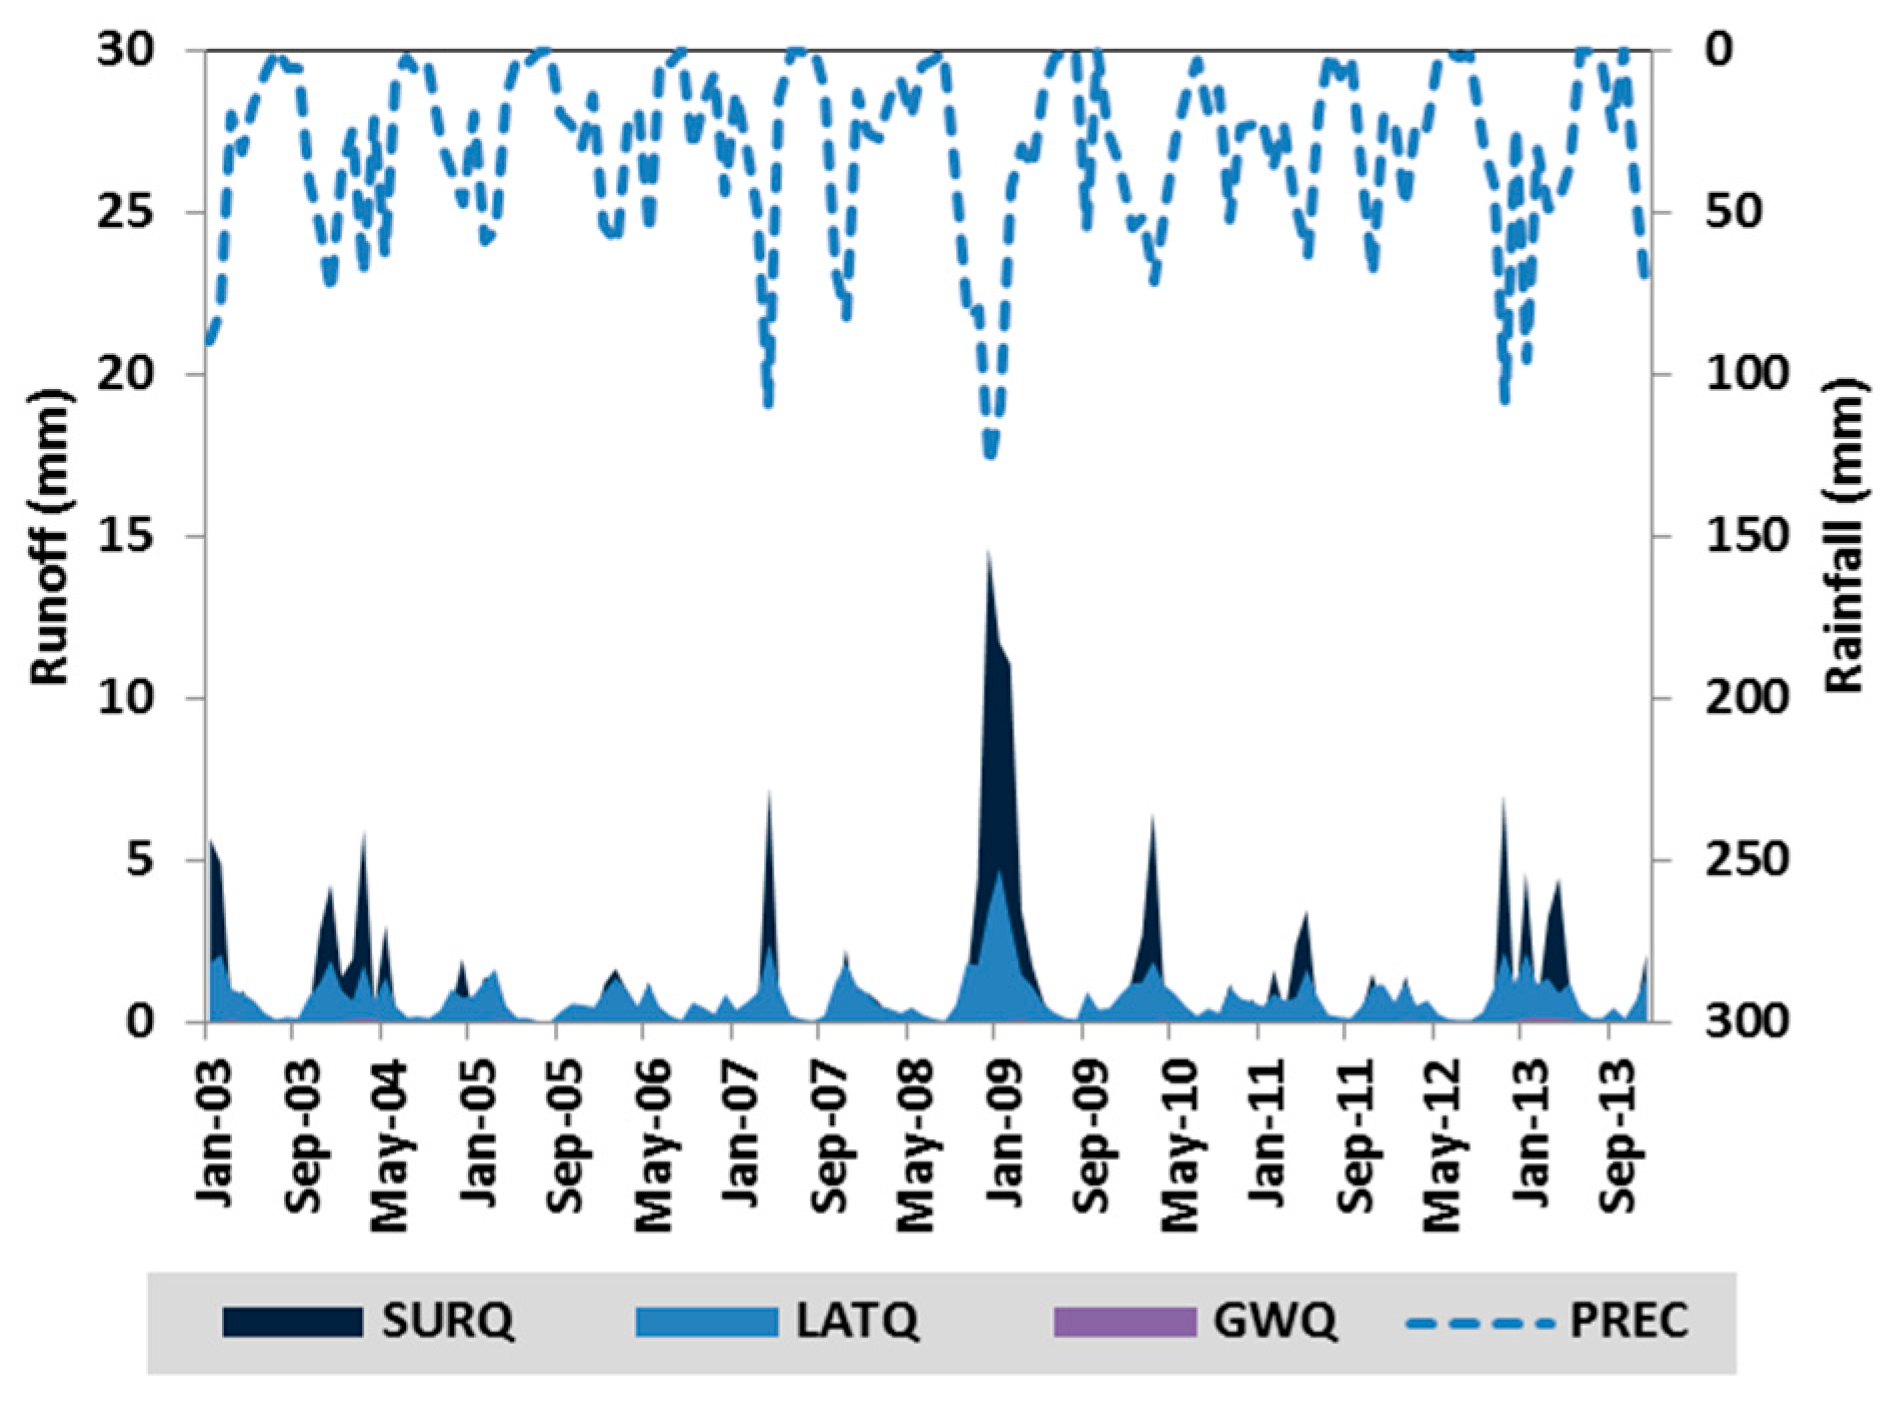
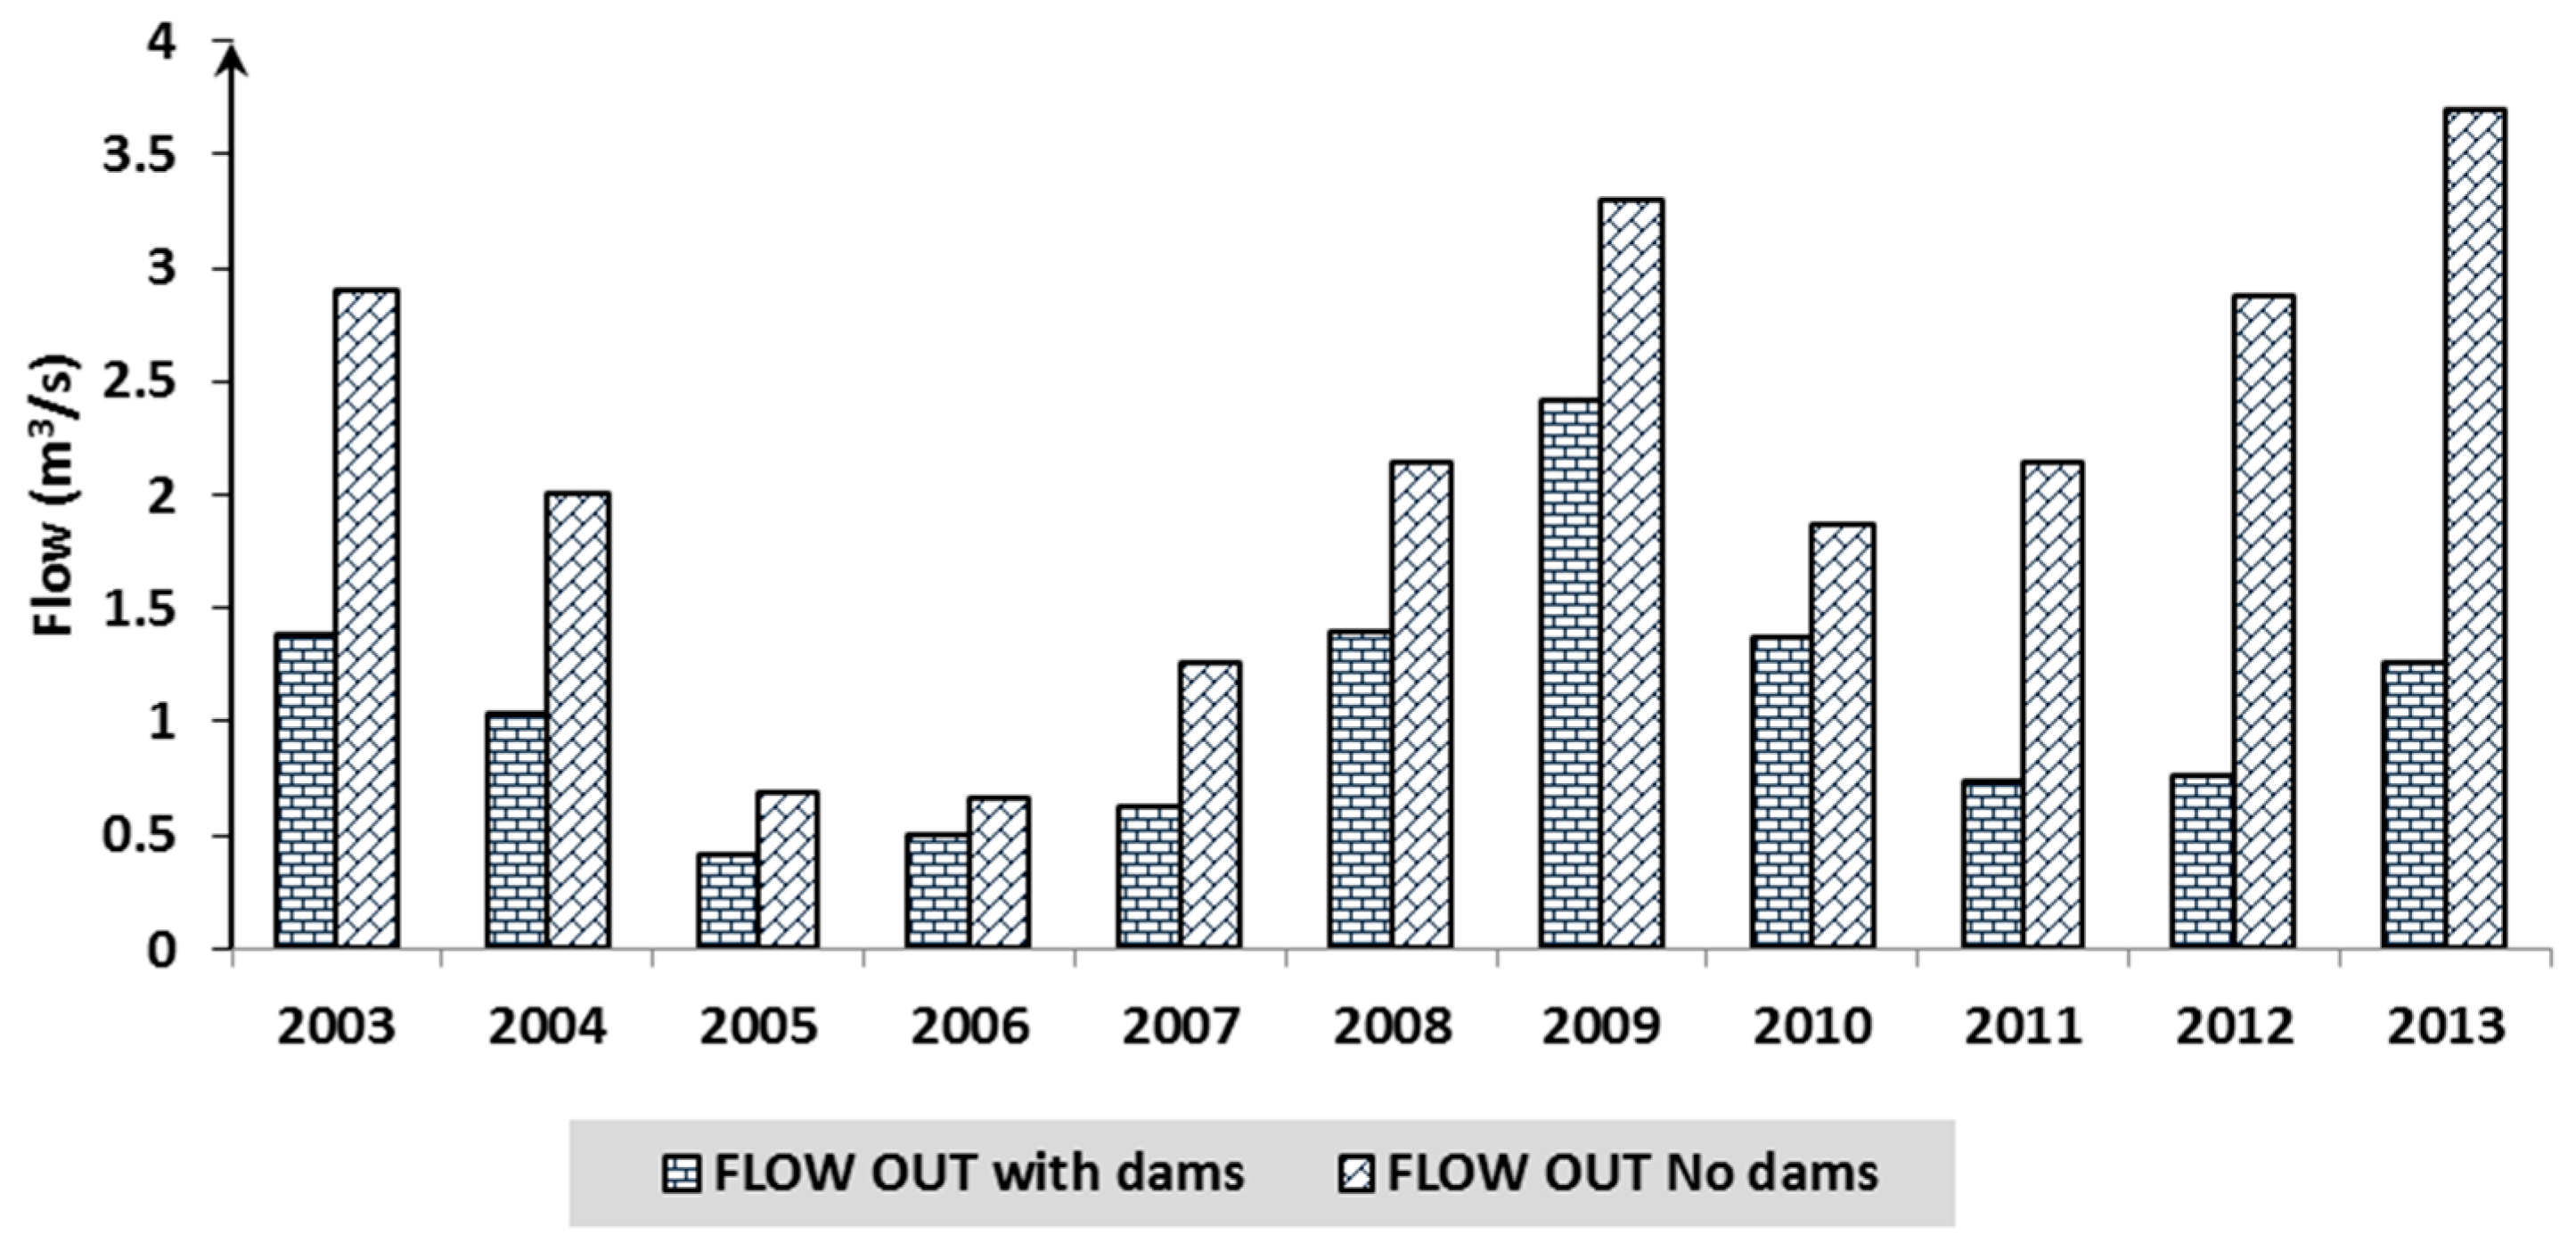
3.2.1. Impact of Dams on Water Balance

Figure 7 shows the average annual basin value for water balance, calculated as a relative percentage of average annual rainfall.
The results of the simulation between 2000 and 2013 (Figure 7) show that the construction of the dams did not disturb the Tafna water balance.
The simulation results (Figure 8) reveal that dams greatly reduced the quantity of water arriving at the outlet of the Tafna between 2003 and 2013. A large amount of water was stored in five reservoirs (49%). This difference is significant according to ANOVA (p = 0.006 <0.05).

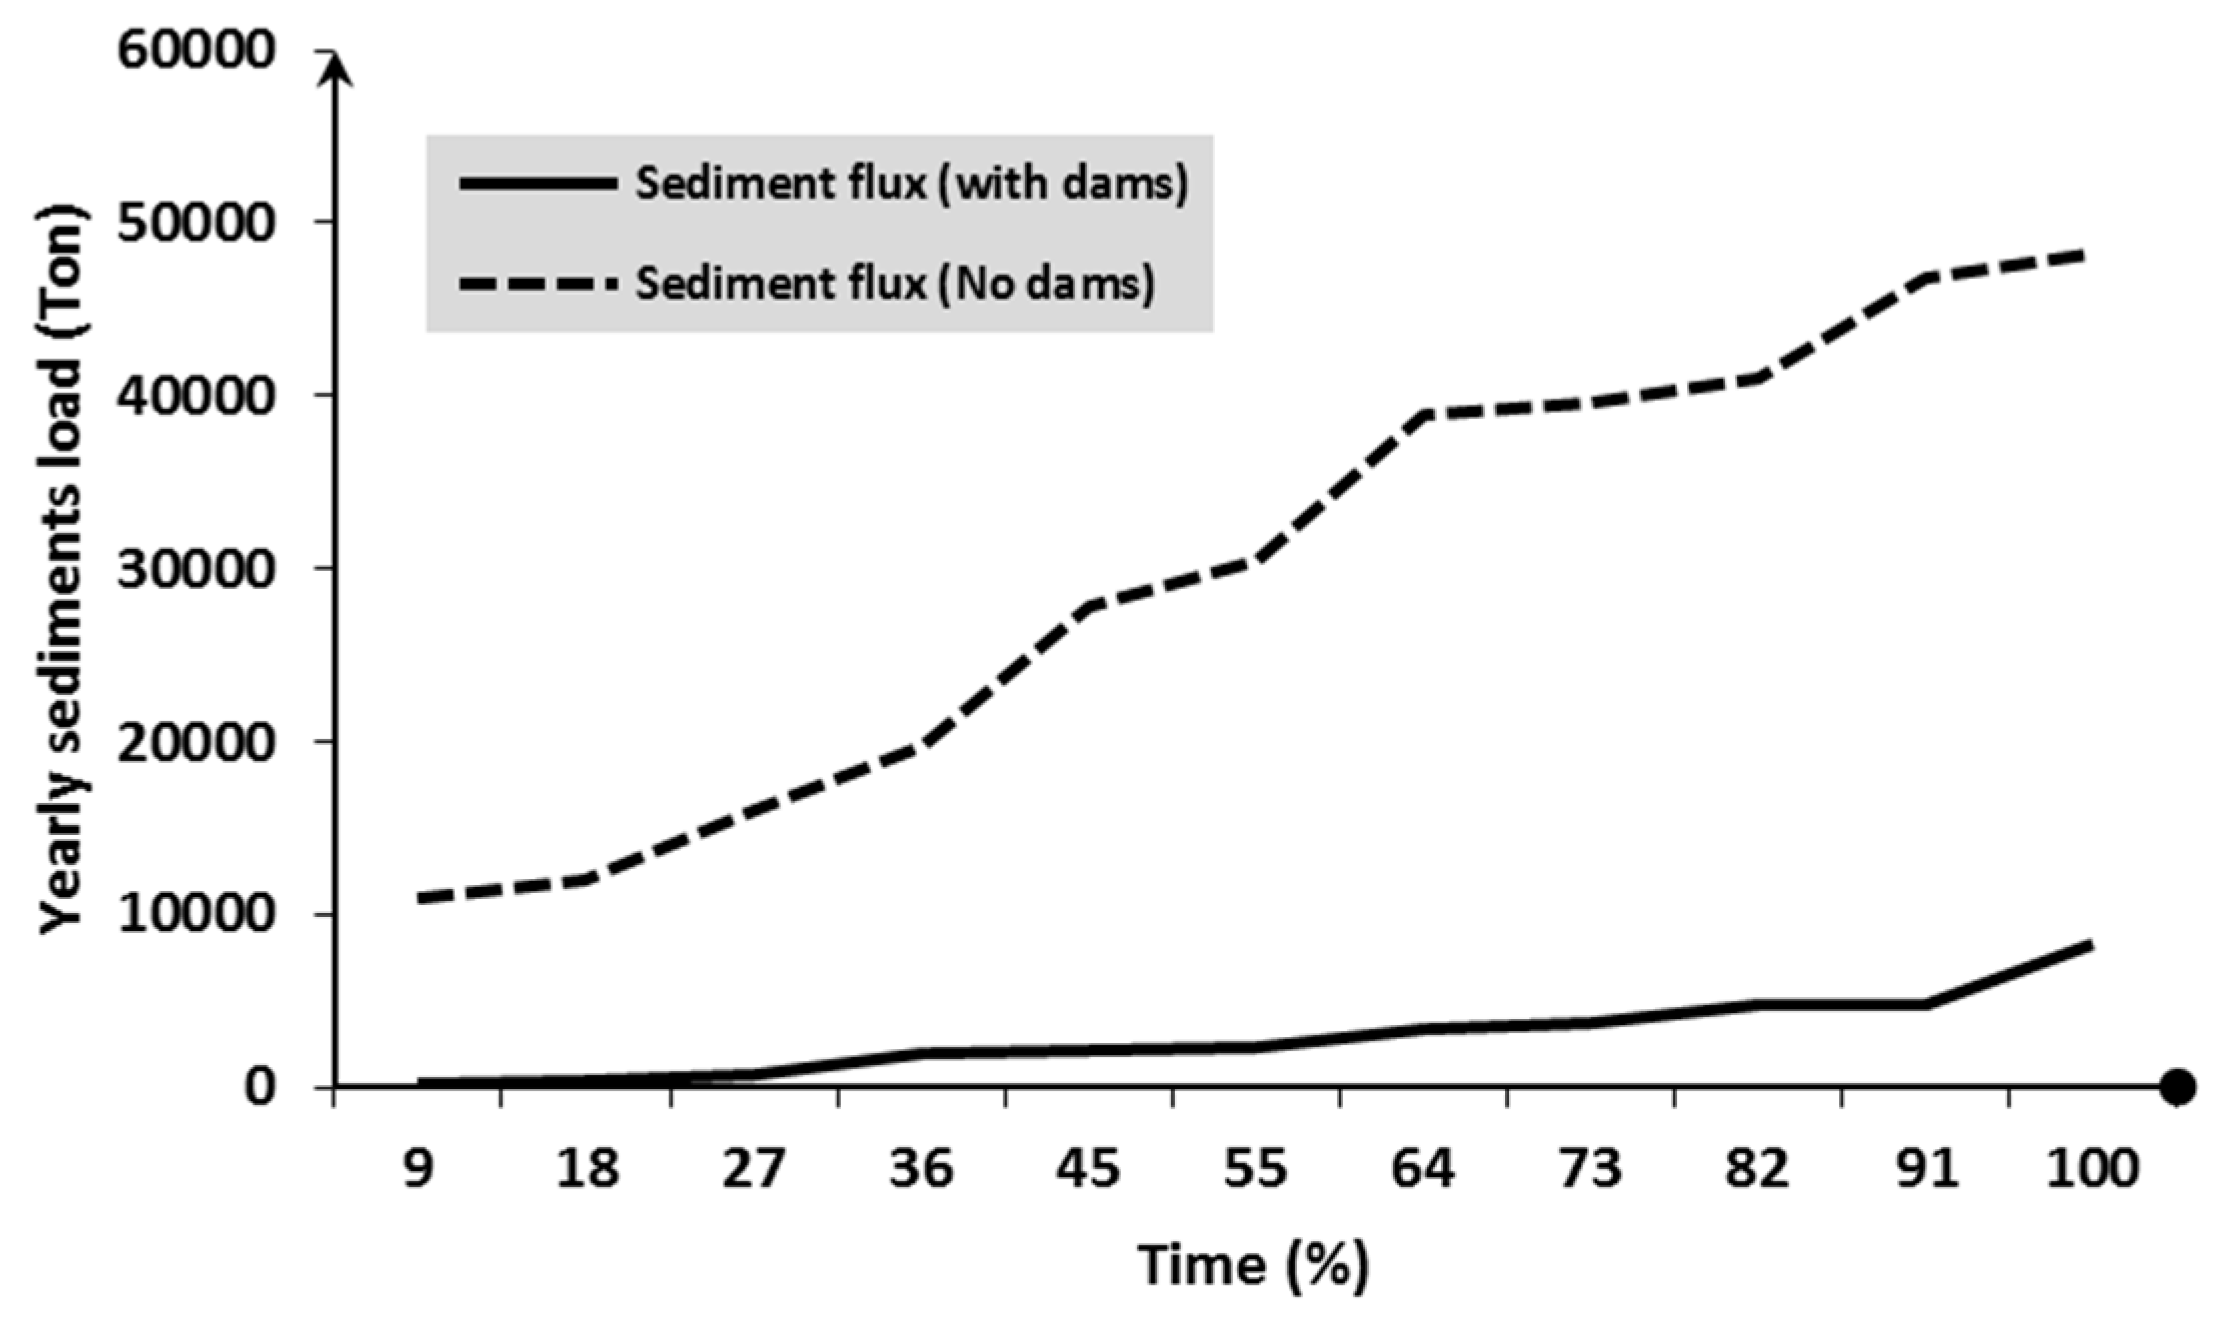
3.2.2. Impact of Dams on Sediment

The cumulative annual sediment load was also compared at the outlet of the basin (Figure 9) to quantify the amount of sediment stored in Tafna’s dams.
The SWAT simulation showed that the reservoirs in these basins stocked a large amount of sediment, in excess of 27,000 t·yr−1 (90%). Large quantities were retained mainly during flood events, representing 87%–95% of the annual sediment export.

4. Discussion

Simulation results between 2003 and 2011 showed that the model adequately predicted the watershed hydrology of the Tafna River. These values remained consistent with the values published by ANRH , which were based on a series of observations between September 1965 and August 2002 [46,47,50] concerning runoff (SWAT value = 26.16 mm·yr−1; ANRH (10–100 mm·yr−1)), potential evapotranspiration (SWAT value = 1301.4 mm·yr−1; ANRH (900–1400 mm·yr−1)), rainfall (SWAT value = 364 mm·yr−1; ANRH (250–550 mm·yr−1)) and limited groundwater resources [48]. The Tafna was characterized by very irregular flow with frequent dry summers, indicating very limited permanent reserves [67]. This study confirmed those results, affirming the good performance of SWAT in Mediterranean Karstic semi-arid watersheds [68].
The fraction of transmission losses from the main channel that enter the deep aquifer, the deep aquifer percolation fraction, and the curve number were the most sensitive parameters for stream flow. The value of the first parameter was 0.211, and the second parameter varied between 0.176 and 0.673. The Tafna sub-basins are essentially formed by semi-permeable and permeable formations that cover the whole surface of the basin, thus increasing the infiltration of surface water [69]. It was also evident that the curve number was the third most sensitive factor, varying relatively between −0.5 and 0.09. In a study of the Hathab river in Tunisia, the curve number ranged relatively between −0.5 and +0.5 [70]. In another study in Hamadan–Bahar watershed in Iran, this parameter ranged relatively between −0.32 and 1.02 [71]. These results confirmed the effect of land use spatial heterogeneity on runoff spatial heterogeneity in semi-arid catchments [72].
The results were analyzed by computing the coefficients of efficiency and determination on a monthly basis for nine water flow gauges. Multi-gauge calibration is an important step in developing a reliable watershed model in semi-arid watersheds, because the single outlet calibration of the watershed in arid and semi-arid regions can be misleading and thus requires spatial calibration to capture the spatial heterogeneity and discontinuities in the watershed [73]. Goodness-of-fit indices were satisfactory for discharge for the monthly calibration period. The Nash-Sutcliffe efficiencies at the nine flow gauges ranged from 0.42 to 0.75 and the coefficient R2 was varying from 0.25 to 0.84 for the calibrated monthly flow for sub-basins for the period from January 2003 to August 2011. It should be noted that the upstream basin stations (A1, T3, A2, A6, A3) that had a less anthropic influence had higher index efficiencies (Nash varying between 0.50 and 0.75 and R2 varying between 0.49 and 0.84) than the downstream stations (A4, A5, T8), which had a lower index efficiency (Nash varying between 0.42 and 0.59 and R2 varying between 0.25 and 0.62). These are influenced by domestic and industrial waste from the major cities of Tlemcen and Maghnia in Algeria and Oujda in Morocco. In a study of the Medjerda River basin in Tunisia, the authors found a range of Nash-Sutcliffe efficiencies between 0.31 and 0.65, and range of coefficient R2 between 0.62 and 0.8 [40]. In another study on the semi-arid river of the Hamadan-Bahar watershed in Iran, the authors found a Nash-Sutcliffe efficiency range of between 0.33 and 0.77, and a range of coefficient R2 of between 0.38 and 0.83 [68]. The calibrated SWAT model can be used successfully to predict the volume inflow to the dams and facilitate the storage and release of water [44].
Gaps between observed and simulated flow values were partly explained by errors in observed and simulated values [31]. Uncertainty in the observed discharge values came from the precision of the sensor and the use of a rating curve. Errors in simulated values could be attributed to actual local rainfall storms that were not well represented by the SWAT rainfall data interpolation [31]. The model could not capture the small peaks. Aside from the uncertainty attributed to the precipitation input, the SCS curve number method, which works on daily rainfall depths, does not consider the duration and intensity of precipitation. Representing this precipitation characteristic is necessary for semi-arid watersheds, where high-intensity short-duration precipitation occurs [74].
There were few observed suspended sediment data because, ANRH measures sediment once a month (sometimes there are no measurements) and sampling during flood periods is problematic. It is very difficult to assess the quality of the model performance as suspended matter sampling was not systematically performed for all storms, while the major losses of suspended matter occur during a small number of intensive rain events [39]. However, it was noticed that the simulated values were in the same range as the observed values. A similar observation was made in a study in Tunisia where the predicted concentrations of suspended matter were in the order of magnitude of the measured concentrations [39]. However, the low sampling frequency and lack of detailed land use and land management data did not allow an in-depth evaluation of the SWAT performance. It is recommended that future studies collect data at a greater frequency and spread along the river stretch [39]. Despite these shortcomings, the results from this study were still useful for representing the measured data [75]. The USLE soil erodibility factor, USLE equation support practice factor and peak rate adjustment factor for sediment routing in the main channel were the three sensitive parameters for sediment calibration. The value of the first parameter was 0.005, the second varied between 0.003 and 0.8, and the value of the third was 0.18.
A quantification of changes in water balance is necessary, especially after the construction of dams, for integrated watershed management in order to identify their effects on the basin [18]. The simulation results showed a considerable reduction in the quantity of water arriving at the outlet of the Tafna between 2003 and 2013, with a large amount of water stored in five reservoirs (49%). This decrease in flow downstream, which represents 18% of the basin surface, can affect the irrigated agricultural zone, especially as most of this land depends on Tafna water.
The comparison between the cumulative annual sediment load at the outlet with and without dams shows that reservoirs stock a large quantity of sediment, in excess of 27,000 t·yr−1 (90%). Large quantities are retained mainly during flood events, representing 87%–95% of the annual sediment export. In the Koiliaris river in Greece, flood events account for 63%–70% of the annual sediment export in a wet or dry year [68]. Between 37% and 98% of sediment settles in North African reservoirs [76]. These deposits contribute around 2%–5% of the yearly loss of water storage capacity [77]. The mean annual suspended sediment flux in North African rivers was estimated to be 254 million tons [78]. This storage reduces the lifetime of dams. The results of this study showed the need to implement a water resources management strategy to reduce reservoir sediment deposition, as in Tunisia where there are contour ridges for water harvesting in semi-arid catchments. The result was checked using the SWAT model in the Merguellil catchment (central Tunisia) and the contour ridges for water harvesting retained a large proportion of the entrained sediment (26%) [18].

5. Conclusions

In the present study, the hydrological SWAT model was applied to the Tafna River, which is a semi-arid basin. The model reproduced water flow and sediment in all gauging stations. The model’s weakness at simulating runoff for some months was probably due to errors in the observed values and to the poor representation of small peaks. The weakness of the model at simulating sediment was due to the improper runoff simulation and the nature and accuracy of the measured sediment data.
Prediction of runoff and soil loss is important for assessing soil erosion hazards and determining suitable land uses and soil conservation measures for a catchment [75]. In turn, this can help to derive the optimum benefit from the use of the land while minimizing the negative impacts of land degradation and other environmental problems. As there are limited data available from the study region, the model developed here could help assess different land management options [75].
The application of the model enabled an evaluation of the contribution of the different compartments of the basin to surface water. SWAT has shown that a large proportion of surface water comes from surface runoff and lateral flow, while the contribution of groundwater was insignificant. It was also noted that the application of the model gave a general idea of the impact of dam building on water balance and sediment in the Tafna semi-arid watershed. It highlighted that a large amount of water (49%) was stored in five reservoirs, decreasing the water flow in the downstream part of the basin, and could affect the irrigated agricultural zone, especially as most of this land depends on Tafna water. The dams of the Tafna have been built for the supply of drinking water and for irrigation. However, according to statistics of the National Agency of Basin and Transfer (ANBT) from January 2003 to July 2011, the largest dam basin (Hammame Boughrara) is devoted exclusively to drinking water.
These hydraulic structures were observed to stock a large quantity of sediment—in excess of 27,000 t·yr−1 (90%). Large quantities were retained mainly during flood events, representing 87%–95% of the annual sediment export. The results of this study showed the need for the implementation of a better water resources management strategy such as reforestation, and contour ridges for water harvesting upstream of the reservoirs to reduce the amount of sediment transported by the river. This is particularly important with dams in semi-arid and arid regions where water resources are limited and vary greatly with more intense low flow episodes and where rivers transport a high quantity of sediments, in order to reduce the siltation of dams and increase their lifetime. In fact, hydrological models such as SWAT demonstrate that it is a useful tool for understanding hydrological processes, even when the amount of measured data available is poor. It can be useful for identifying the most appropriate location for reservoirs and optimizing them to reduce their impact on water resources [18].
However, a general problem in watershed modelling that still needs to be addressed is the limited availability of data, especially in terms of measured water quality for calibrating and validating these models. The lack of a long time series of sediment with a daily time step and high spatial resolution limited this study’s ability to evaluate the simulations [18].
Finally, the results obtained were very encouraging. SWAT allows the dynamics of water and sediment on the Tafna to be correctly represented. This model can be useful for understanding the impact of sediment transport on the water storage capacity of dams in a semi-arid region.

Acknowledgments

The authors thank the National Agency of Hydrologic Resources (ANRH) Oran, the Algerian agency in charge of stream gauging, which provided all water flow and nitrate concentration data, especially Sidi Mohammed Boudaliya and Belkacem Sardi. The National Agency for Dams and Transfers (ANBT) Ain youcef-Tlemcen, which provided all the data on dam management, especially Bensmaine. Ayoub Bouazzaoui, a PhD student at the University of Tlemcen-Algeria, in the SVTU faculty, agroforestry department, for his help during the realization of soil map.

Author Contributions

Amin Zettam, Amina Taleb, Sabine Sauvage, Nouria Belaidi and José Miguel Sánchez-Pérez conceived and designed the experiments; Amin Zettam performed the experiments; Amin Zettam, Sabine Sauvage and José Miguel Sánchez-Pérez analyzed the data; Laurie Boithias contributed analysis tools; Amin Zettam, Amina Taleb, Sabine Sauvage, Laurie Boithias and José Miguel Sánchez-Pérez wrote the paper.

Conflicts of Interest

The authors declare no conflict of interest.

References

  1. Souza, J.O.P.; Correa, A.C.B.; Brierley, G.J. An approach to assess the impact of landscape connectivity and effective catchment area upon bedload sediment flux in Saco CreekWatershed, Semiarid Brazil. Catena 2016, 138, 13–29. [Google Scholar] [CrossRef]
  2. Roudi-Fahimi, F.; Kent, M. Challenges and opportunities—The population of the Middle East and North Africa. Popul. Bull. 2007, 62, 1–20. [Google Scholar]
  3. Terink, W.; Immerzeel, W.; Droogers, P. Climate change projections of precipitation and reference evapotranspiration for the Middle East and Northern Africa until 2050. Int. J. Climatol. 2013, 33, 3055–3072. [Google Scholar] [CrossRef]
  4. Megnounif, A.; Terfous, A.; Ouillon, S. A graphical method to study suspended sediment dynamics during flood events in the Wadi Sebdou, NW Algeria (1973–2004). J. Hydrol. 2013, 497, 24–36. [Google Scholar] [CrossRef]
  5. Taleb, A.; Belaidi, N.; Sanchez-Perez, J.M.; Vervier, P.; Sauvage, S.; Gagneur, J. The role of the hyporheic zone of a semi-arid gravel bed stream located downstream of a heavily polluted reservoir (Tafnawadi, Algeria). River Res. Appl. 2008, 24, 183–196. [Google Scholar] [CrossRef]
  6. Touati, B. Les Barrages et la Politique Hydraulique en Algérie:état, Diagnostic et Perspectives d’un Aménagement Durable. Ph.D. Thèse, Université de Constantine, Constantine, Algérie, 2010. [Google Scholar]
  7. Bourouba, M. Contribution a l’etude de l’erosion et des transports solides de l’Oued Medjerda superieur (Algerie orientale). Bull. Reseau Erosion 1998, 18, 76–97. (In French) [Google Scholar]
  8. Colombani, J.; Olivry, J.C.; Kallel, R. Phénomènes exceptionnels d’érosion et de transport solide en Afrique aride et semi-aride. In Challenges in African Hydrology and Water, Ressources; IAHS Publication: Oxfordshire, UK, 1984; Volume 144, pp. 295–300. (In French) [Google Scholar]
  9. Kettab, A. Les ressources en eau en Algérie: Stratégies, enjeux et vision. Desalination 2001, 136, 25–33. (In French) [Google Scholar] [CrossRef]
  10. Remini, B. La Problématique de l’eau en Algérie; Office des publications Universitaires: Alger, Algérie, 2005; p. 162. (In French) [Google Scholar]
  11. Boithias, L.; Acuña, V.; Vergoñós, L.; Ziv, G.; Marcé, R.; Sabater, S. Assessment of the water supply:demand ratios in a Mediterranean basin under different global change scenarios and mitigation alternatives. Sci. Total Environ. 2014, 470–471, 567–577. [Google Scholar] [CrossRef] [PubMed]
  12. Surface Water Resources Mobilization; Document of Algerian Ministry of Water Resources. Available online: http://www.mree.gov.dz (accessed on 13 March 2017).
  13. Hamiche, A.; Boudghene Stambouli, A.; Flazi, S. A review on the water and energy sectors in Algeria: Current forecasts, scenario and sustainability issues. Renew. Sustain. Energy Rev. 2015, 41, 261–276. [Google Scholar] [CrossRef]
  14. Bouzid-Lagha, S.; Djelita, B. Study of eutrophication in the Hamman Boughrara Reservoir (Wilaya de Tlemcen, Algeria). Hydrol. Sci. J. 2012, 57, 186–201. [Google Scholar] [CrossRef]
  15. Bessenasse, M.; Kettab, A.; Paquier, A.; Galeas, G.; et Ramez, P. Simulation numérique de la sédimentation dans les retenues de barrages : Cas de la retenue de Zardezas, Algérie. J. Water Sci. 2003, 16, 103–122. (In French) [Google Scholar] [CrossRef]
  16. Remini, B.; Avenard, J.-M.; Kettab, A. Évolution dans le temps de l'envasement dans une retenue de barrage dans laquelle est pratiquée la technique du soutirage. La Houille Blanche 1997, 6, 4–8. (In French) [Google Scholar]
  17. Benyahia, M.; Bechlaghem, N.; Habi, M.; Kerfouf, A. Importance des ressources hydriques de la wilaya de Tlemcen dans le cadre de l’Oranie (Algérie Nord Occidentale) et Perspectives de développement durables. In Proceedings of the Vème Colloque International-Energie, Changement Climatiques et Développement Durable, Hammamet, Tunisia, 15–17 Juin 2009. (In French)
  18. Ounissi, M.; Bouchareb, N. Nutrient distribution and fluxes from three Mediterranean coastal rivers (NE Algeria) under large damming. C. R. Geosci. 2013, 345, 81–92. [Google Scholar] [CrossRef]
  19. Abouabdillah, A.; White, M.; Arnold, J.G.; De Girolamo, A.M.; Oueslati, O.; Maataoui, A.; Lo porto, A. Evaluation of soil and water conservation measures in a semi-arid river basin in Tunisia using SWAT. Soil Use Manag. 2014, 30, 539–549. [Google Scholar] [CrossRef]
  20. Le Goulven, P.; Leduc, C.; Bachta, M.S.; Poissin, J.C. Sharing scarce resources in a Mediterranean river basin: Wadi Merguellil in Central Tunisia. In River Basin Trajectories: Societies, Environments and Development; Molle, F., Wester, P., Eds.; MPG Books Group: Bodmin, UK, 2009; pp. 147–170, ISBN-13: 978-1-84593-538-2. [Google Scholar]
  21. Todini, E. Hydrological catchment modelling: Past, present and future. Hydrol. Earth Syst. Sci. 2007, 11, 468–482. [Google Scholar] [CrossRef]
  22. Noori, N.; Kalin, L. Coupling SWAT and ANN models for enhanced daily stream flow Prediction. J. Hydrol. 2016, 533, 141–151. [Google Scholar] [CrossRef]
  23. Abbott, M.B.; Bathurst, J.C.; Cunge, J.A.; O’Connell, P.E.; Rasmussen, J. An introduction to the European Hydrological System—Système Hydrologique Européen, “SHE”, 1: History and Philosophy of a physically-based, distributed modelling system. J. Hydrol. 1986, 87, 45–59. [Google Scholar] [CrossRef]
  24. Wendling, J. Théorie de TOPMODEL. Extrait de thèse de Doctorat, Université de Grenoble, Grenoble, France, 1992. [Google Scholar]
  25. Feldman, A.D. Hydrologic Modeling System HEC-HMS; Technical Reference Manual; U.S. Army Corps of Engineers, Hydrologic Engineering Center (HEC): Davis, CA, USA, 2000. [Google Scholar]
  26. Liang, X.; Lettenmaier, D.P.; Wood, E.F.; Burges, J. A simple hydrologically based model of land surface water and energy fluxes for general circulation models. J. Geophys. Res. 1994, 99, 14415–14428. [Google Scholar] [CrossRef]
  27. Beven, K.; Calver, A.; Morris, E.M. Institute of Hydrology Distributed Model, Report No. 8; Institute of Hydrology: Wallingford, UK, 1987. [Google Scholar]
  28. Kouwen, N.; Soulis, E.D.; Pietroniro, A.; Donald, J.; Harrington, R.A. Grouping Response Units for Distributed Hydrologic Modelling. ASCE J. Water Resour. Plan. Manag. 1993, 119, 289–305. [Google Scholar] [CrossRef]
  29. Lin, B.; Chen, X.; Yao, H.; Chen, Y.; Liu, M.; Gao, L.; James, A. Analyses of land use change impacts on catchment runoff using different time indicators based on SWAT model. Ecol. Indic. 2015, 58, 55–63. [Google Scholar] [CrossRef]
  30. Arnold, J.G.; Srinivasan, R.; Muttiah, R.S.; Williams, J.R. Large-area hydrologic modeling and assessment: Part, I. Model development. J. Am. Water Res. Assoc. 1998, 34, 73–89. [Google Scholar] [CrossRef]
  31. Moriasi, D.N.; Steiner, J.L.; Arnold, J.G. Sediment measurement and transport modeling: Impact of riparian and filter strip buffers. J. Environ. Qual. 2011, 40, 807–814. [Google Scholar] [CrossRef] [PubMed]
  32. Boithias, L.; Sauvage, S.; Taghavi, L.; Merlina, G.; Probst, J.L.; Sanchez Perez, J.M. Occurrence of metolachlor and trifluralin losses in the Save river agricultural catchment during floods. J. Hazard. Mater. 2011, 196, 210–219. [Google Scholar] [CrossRef] [PubMed] [Green Version]
  33. Oeurng, C.; Sauvage, S.; Sánchez-Pérez, J.M. Temporal variability of nitrate transport through hydrological response during flood events within a large agricultural catchment in south-west France. Sci. Total Environ. 2010, 409, 140–149. [Google Scholar] [CrossRef] [PubMed] [Green Version]
  34. Singh, A.; Gosain, A.K. Climate-change impact assessment using GIS based hydrological modelling. Water Int. 2011, 36, 386–397. [Google Scholar] [CrossRef]
  35. Arnold, J.G.; Moriasi, D.N.; Gassman, P.W.; Abbaspour, K.C.; White, M.J.; Srinivasan, R.; Santhi, C.; Harmel, R.D.; Van Griensven, A.; Van Liew, M.W.; et al. SWAT: Model use, calibration, and validation. Trans. ASABE 2012, 55, 1491–1508. [Google Scholar] [CrossRef]
  36. Gassman, P.W.; Sadeghi, A.M.; Srinivasan, R. Applications of the SWAT Model Special Section: Overview and Insights. J. Environ. Qual. 2014, 43, 1–8. [Google Scholar] [CrossRef] [PubMed]
  37. Baker, T.J.; Miller, S.N. Using the Soil and Water Assessment Tool (SWAT) to assess land use impact on water resources in an East African watershed. J. Hydrol. 2013, 486, 100–111. [Google Scholar] [CrossRef]
  38. Shrestha, M.K.; Recknagela, F.; Frizenschafb, J.; Meyer, W. Assessing SWAT models based on single and multi-site calibration for the simulation of flow and nutrient loads in the semi-arid Onkaparinga catchment in South Australia. Agric. Water Manag. 2017, in press. [Google Scholar] [CrossRef]
  39. Molina-Navarro, E.; Trolle, D.; Martínez-Pérez, S.; Sastre-Merlín, A.; Jeppesen, E. Hydrological and water quality impact assessment of a Mediterranean limno-reservoir under climate change and land use management scenarios. J. Hydrol. 2014, 509, 354–366. [Google Scholar] [CrossRef]
  40. Bouraoui, F.; Benabdallah, S.; Jrad, A.; Bidoglio, G. Application of the SWAT model on the Medjerda river basin (Tunisia). Phys. Chem. Earth 2005, 30, 497–507. [Google Scholar] [CrossRef]
  41. Sellami, H.; Benabdallah, S.; La Jeunesse, I.; Vanclooster, M. Quantifying hydrological responses of small Mediterranean catchments under climate change projections. Sci. Total Environ. 2016, 543, 924–936. [Google Scholar] [CrossRef] [PubMed]
  42. Neitsch, S.L.; Arnold, J.G.; Kiniry, J.R.; Srinivasan, R.; Williams, J.R. Soil and Water Assessment Tool User’s Manual, Version 2000; Texas Water Resources Institute: College Station, TX, USA, 2002; p. 412. [Google Scholar]
  43. Neitsch, S.L.; Arnold, J.G.; Kiniry, J.R.; Williams, J.R.; King, K.W. Soil and Water Assessment Tool Theoretical Documentation, Version 2000; Texas Water Resources Institute: College Station, TX, USA, 2002; p. 458. [Google Scholar]
  44. Wang, G.; Xia, J. Improvement of SWAT 2000 modelling to assess the impact of dams and sluices on streamflow in the Huai River basin of China. Hydrol. Process. 2010, 24, 1455–1471. [Google Scholar] [CrossRef]
  45. Ghoraba, S.M. Hydrological modeling of the Simly Dam watershed (Pakistan) using GIS and SWAT model. Alex. Eng. J. 2015, 54, 583–594. [Google Scholar] [CrossRef]
  46. National Agency of Hydrologic Resources (ANRH). Map of Potential Evapotranspiration in the North of Algeria; ANRH: Alger, Algeria, 2003. [Google Scholar]
  47. National Agency of Hydrologic Resources (ANRH). Map of Average Annual Runoff in the North of Algeria; ANRH: Alger, Algeria, 2003. [Google Scholar]
  48. National Agency of Hydrologic Resources (ANRH). Map of Groundwater Resources in the North of Algeria; ANRH: Alger, Algeria, 2003. [Google Scholar]
  49. Guardia, P. Géodynamique de la Marge Alpine du Continent Africain. D’après l’Etude de l’Oranie Nord Occidentale. Relations Structurales et Paléogéographiques Entre le tell Extrème et L’avant Pays Atlassique+ Carte au 1/100 000. Thèse 3 ème cycle, Université de Nice, Nice, France, 1975; p. 285. [Google Scholar]
  50. National Agency of Hydrologic Resources (ANRH). Map of Annual Rainfall in the North of Algeria; ANRH: Alger, Algeria, 2003. [Google Scholar]
  51. National Agency of Hydrologic Resources (ANRH). Daily Data Flow in the Outlet of Tafna Catchment from 2000 to 2011; ANRH: Alger, Algeria, 2012. [Google Scholar]
  52. Taleb, A.; Belaidi, N.; Gagneur, J. Water Quality before and after AAM building on a heavily polluted river in semi-arid Algeria. River Res. Appl. 2004, 20, 943–956. [Google Scholar] [CrossRef]
  53. Ministère Algérien de l’agriculture. Type et Superficie de l'Agriculture de la Wilaya de Tlemcen et Ain Temouchent; Ministère Algérien de l'agriculture: Alger, Algérie, 2011. (In French) [Google Scholar]
  54. Laurent, F.; Ruelland, D. Assessing impacts of alternative land use and agricultural practices on nitrate pollution at the catchment scale. J. Hydrol. 2011, 409, 440–450. [Google Scholar] [CrossRef]
  55. Chow, V.; Maidment, D.; Mays, L. Applied Hydrology; Chow, V., Maidment, D., Eds.; McGraw Hill: New York, NY, USA, 1988. [Google Scholar]
  56. Williams, J.R. Flood routing with variable travel time or variable storage coefficients. Trans. ASAE 1969, 12, 100–103. [Google Scholar] [CrossRef]
  57. Cunge, J.A. On the subject of a flood propagation method (Muskingum method). J. Hydraul. Res. 1969, 7, 205–230. [Google Scholar] [CrossRef]
  58. Williams, J.R. Sediment routing for agricultural watersheds. J. Am. Water Resour. Assoc. 1975, 11, 965–974. [Google Scholar] [CrossRef]
  59. Neitsch, S.L.; Arnold, J.G.; Kiniry, J.R.; Williams, J.R.; King, K.W. Soil and Water Assessment Tools: Theoretical Documentation Version; Grassland, Soil and Water Reasearch Laboratory, ARS: Temple, TX, USA, 2005; p. 494. [Google Scholar]
  60. Bagnold, R.A. Bed load transport by natural rivers. Water Resour. Res. 1977, 13, 303–312. [Google Scholar] [CrossRef]
  61. Barbut, M.M.; Durand, M.J.-H. Carte des Sols d'Algérie. Oran. Feuille N.I. 30-N.E; Service Géographique de l’Armée: Alger, France, 1952. [Google Scholar]
  62. Land-Use Map, the European Space Agency. Available online: http://due.esrin.esa.int/page_globcover.php (accessed on 13 March 2017).
  63. Aouissi, J.; Benabdallah, S.; Chabaâne, Z.; Cudennec, C. Evaluation of potential evapotranspiration assessment methods for hydrological modelling with SWAT—Application in data-scarce rural Tunisia. Agr. Water Manag. 2016, 174, 39–51. [Google Scholar] [CrossRef]
  64. Abbaspour, K.C. User Manual for SWAT-CUP SWAT Calibration and Uncertainty Analysis Programs; Swiss Federal Institute of Aquatic Science and Technology: Dübendorf, Switzerland, 2007. [Google Scholar]
  65. Nash, J.E.; Sutcliffe, V. River flow forecasting through conceptual models: Part I. A discussion of principles. J. Hydrol. 1970, 10, 282–290. [Google Scholar] [CrossRef]
  66. Moriasi, D.N.; Arnold, J.G.; Van Liew, M.W.; Bingner, R.L.; Harmel, R.D.; Veith, T.L. Model evaluation guidelines for systematic quantification of accuracy in watershed simulation. Am. Soc. Agric. Biol. Eng. 2007, 50, 885–900. [Google Scholar]
  67. Khaldi, A. Impacts de la Sécheresse sur le Régime des Ecoulements Souterrains Dans les Massifs Calcaires de l’Ouest Algérien “Monts de Tlemcen-Saida”. Thèse de doctorat d’état, Université d’Oran, Oran, Algérie, 2005; p. 239. [Google Scholar]
  68. Nerantzaki, S.D.; Giannakis, G.V.; Efstathiou, D.; Nikolaidis, N.P.; Sibetheros, I.Α.; Karatzas, G.P.; Zacharia, I. Modeling suspended sediment transport and assessing the impacts of climate change in a karstic Mediterranean watershed. Sci. Total Environ. 2015, 538, 288–297. [Google Scholar] [CrossRef] [PubMed]
  69. Bouanani, A. Hydrologie, Transport Solide et Modélisation étude de Quelques Sous Bassins de la Tafna (NW–Algérie). Ph.D. Thèse, Université Tlemcen, Tlemcen, Algérie, 2000; p. 250. [Google Scholar]
  70. Chaâbane Ben Salah, N.; Abida, H. Modélisation des écoulements et de Transport Solide du Bassin d’Oued Hathab en Tunisie Centrale: Couplage d’un SIG avec le Modèle Agro Hydrologique SWAT. In Proceedings of the Actes du Séminaire sur les Systèmes d’Information Géographique pour l’Etude de l’Environnement, Djerba, Tunisia, 21–23 Mai 2012; Revue des Régions Arides—Numéro Spécial—n° 33. Institue des Régions Arides: Médenine, Tunisia, 2014; pp. 87–92. (In French)[Google Scholar]
  71. Akhavan, S.; Abedi-Koupaia, J.; Mousavia, S.; Afyunib, M.; Eslamiana, S.; Abbaspour, K. Application of SWAT model to investigate nitrate leaching in Hamadan–Bahar Watershed, Iran. Agric. Ecosyst. Environ. 2010, 139, 675–688. [Google Scholar] [CrossRef]
  72. Lin, K.; Lv, F.; Chen, L.; Singh, V.P.; Zhang, Q.; Chen, X. Xinanjiang model combined with Curve Number to simulate the effect of land use change on environmental flow. J. Hydrol. 2014, 519, 3142–3152. [Google Scholar] [CrossRef]
  73. Niraula, R.; Norman, L.M.; Meixner, T. and Callegary, J.B. Multi-gauge Calibration for modeling the Semi-Arid Santa Cruz Watershed in Arizona-Mexico Border Area Using SWAT. Air Soil Water Res. 2012, 5, 41–57. [Google Scholar] [CrossRef]
  74. Nie, W.; Yuan, Y.; Kepner, W.; Nash, M.; Jackson, M.; Erickson, C. Assessing impacts of land use and land cover changes on hydrology for the upper San Pedro watershed. J. Hydrol. 2011, 407, 105–114. [Google Scholar] [CrossRef]
  75. Rostamian, R.; Jaleh, A.; Afyuni, M.; Farhad, M.; Heidarpour, M.; Jalalian, A.; Abbaspour, K.C. Application of a SWAT model for estimating runoff and sediment in two mountainous basins in central Iran. Hydrol. Sci. J. 2008, 53, 977–988. [Google Scholar] [CrossRef]
  76. Ghorbal, A.; Claude, J. Mesure de l’Envasement Dans les Retenues de Sept Barrages en Tunisie: Estimation des Transports Solides; IAHS Publication: Wallingford, UK, 1977; Volume 122, pp. 219–232. (In French) [Google Scholar]
  77. Kassoul, M.; Abdelgader, A.; Belorgey, M. Caractérisation de la sédimentation des barrages en Algérie. Rev. Sci. Eau 1997, 3, 339–358. [Google Scholar] [CrossRef]
  78. Probst, J.L.; Amiotte-Suchet, P. Fluvial suspended sediment transport and mechanical erosion in the Maghreb (North Africa). Hydrol. Sci. J. 1992, 37, 621–637. [Google Scholar] [CrossRef]
Figure 1. Location of the Tafna River catchment and its dams and gauging stations (A: located in tributaries; T: located in the main watercourse).
Water 09 00216 g001
Figure 2. (a) 30 m digital elevation model; (b) main soils; (c) main land uses; and (d) SWAT DEM delineated sub-basins of the Tafna catchment
Water 09 00216 g002
Figure 3. Monthly simulated and observed discharge (m3·s−1) at the gauging stations (calibration period: January 2003–August 2011).
Water 09 00216 g003
Figure 4. Hygrogram of the Tafna at the outlet modelled by SWAT (SURQ: surface runoff/LATQ: lateral flow/GWQ: groundwater flow/PREC: rainfall).
Water 09 00216 g004
Figure 5. Daily simulated and observed sediment (t·day−1) at the gauging sediment stations. (There is no observed data after 2006).
Water 09 00216 g005
Figure 6. Inter-annual averages for each sub-catchment between 2000 and 2013. (A) rainfall (mm·yr−1); (B) Hargreaves potential evapotranspiration (mm·yr−1); (C) simulated surface runoff loads (mm·yr−1); (D) simulated sediment yield (t·ha−1·yr−1).
Water 09 00216 g006
Figure 7. Impact of dams on average annual water balance as a relative percentage to precipitation.
Water 09 00216 g007
Figure 8. Impact of dams on flow at the outlet of the basin.
Water 09 00216 g008
Figure 9. Cumulative annual sediment load at the outlet of the basin between 2003 and 2013.
Water 09 00216 g009
Table 1. Characteristics of the dams built in the Tafna catchment.
DamsCapacity (Mm3)Construction DateUsed for
Beni Bahdel65.51952Drinking water/irrigation
Hammame Boughrara1771998Drinking water/irrigation
Mefrouche151963Drinking water
Sikkak302005Drinking water/irrigation
Al Izdahar (Sidi Abdeli)1101988Drinking water/irrigation
Table 2. Calibrated parameter values with a ranking of the most sensitive parameters (Rank 1 = most sensitive).
ParameterDefinitionUnitsInitial RangeCalibrated RangeRank
Parameters related to flowCN2.mgtSCS runoff curve number for moisture condition II [35; 98][38.5; 94]3
SOL_Z.solDepth from soil surface to bottom of layer(mm)[0; 4500][1500; 3500]16
SOL_AWC.solSoil available water storage capacity(mm H2O/mm soil)[0; 1][0.116; 0.169]7
SOL_K.solSoil conductivity(mm·h−1)[0; 2000][4.71; 180]14
ALPHA_BF.gwBase flow alpha factor characterizes the groundwater recession curve(days)[0; 1][0.055; 0.975]4
GW_DELAY.gwGroundwater delay: time required for water leaving the bottom of the root zone to reach the shallow aquifer(days)[0; 500][89.223; 176.363]13
GW_REVAP.gwGroundwater ‘‘revap’’ coefficient: controls the amount of water which evaporates from the shallow aquifer [0.02; 0.2][0.069; 0.191]9
REVAPMN.gwThreshold depth of water in the shallow aquifer for ‘‘revap’’ to occur(mm)[0; 1000][185; 892.294]12
RCHRG_DP.gwDeep aquifer percolation fraction [0; 1][0.176; 0.673]2
ESCO.hruSoil evaporation compensation coefficient [0; 1][0.50; 0.86]5
OV_N.hruManning's "n" value for overland flow [0.01; 30][0.177; 0.823]11
CH_N2.rteManning’s ‘‘n’’ value for the main channel [−0.01; 0.3][0.01; 0.2]10
CH_K2.rteEffective hydraulic conductivity of main channel(mm·h−1)[−0.01; 500][58; 406]8
EVRCH.bsnReach evaporation adjustment factor [0.5; 1]0.6696
TRNSRCH.bsnFraction of transmission losses from main channel that enter deep aquifer [0; 1]0.2111
SURLAG.bsnSurface runoff lag coefficient [0; 1]2.1515
Parameters related to sedimentUSLE-K.solUSLE soil erodibility factor0.013 (t·m2·hr)/(m3·t·cm))[0; 0.65]0.0051
USLE-P.mgtUSLE equation support practice factor [0; 1][0.003; 0.8]2
PRF.bsnPeak rate adjustment factor for sediment routing in the main channel [0; 1]0.183
Table 3. Model performance for the simulation of runoff.
StationsNSER2
A10.670.7
A20.670.7
A30.530.58
A40.420.25
A50.590.62
A60.50.49
T30.750.84
T40.660.73
T80.510.53

