
The Human Threat to River Ecosystems at the Watershed Scale: An Ecological Security Assessment of the Songhua River Basin, Northeast China

Abstract
:1. Introduction
2. Data and Methods
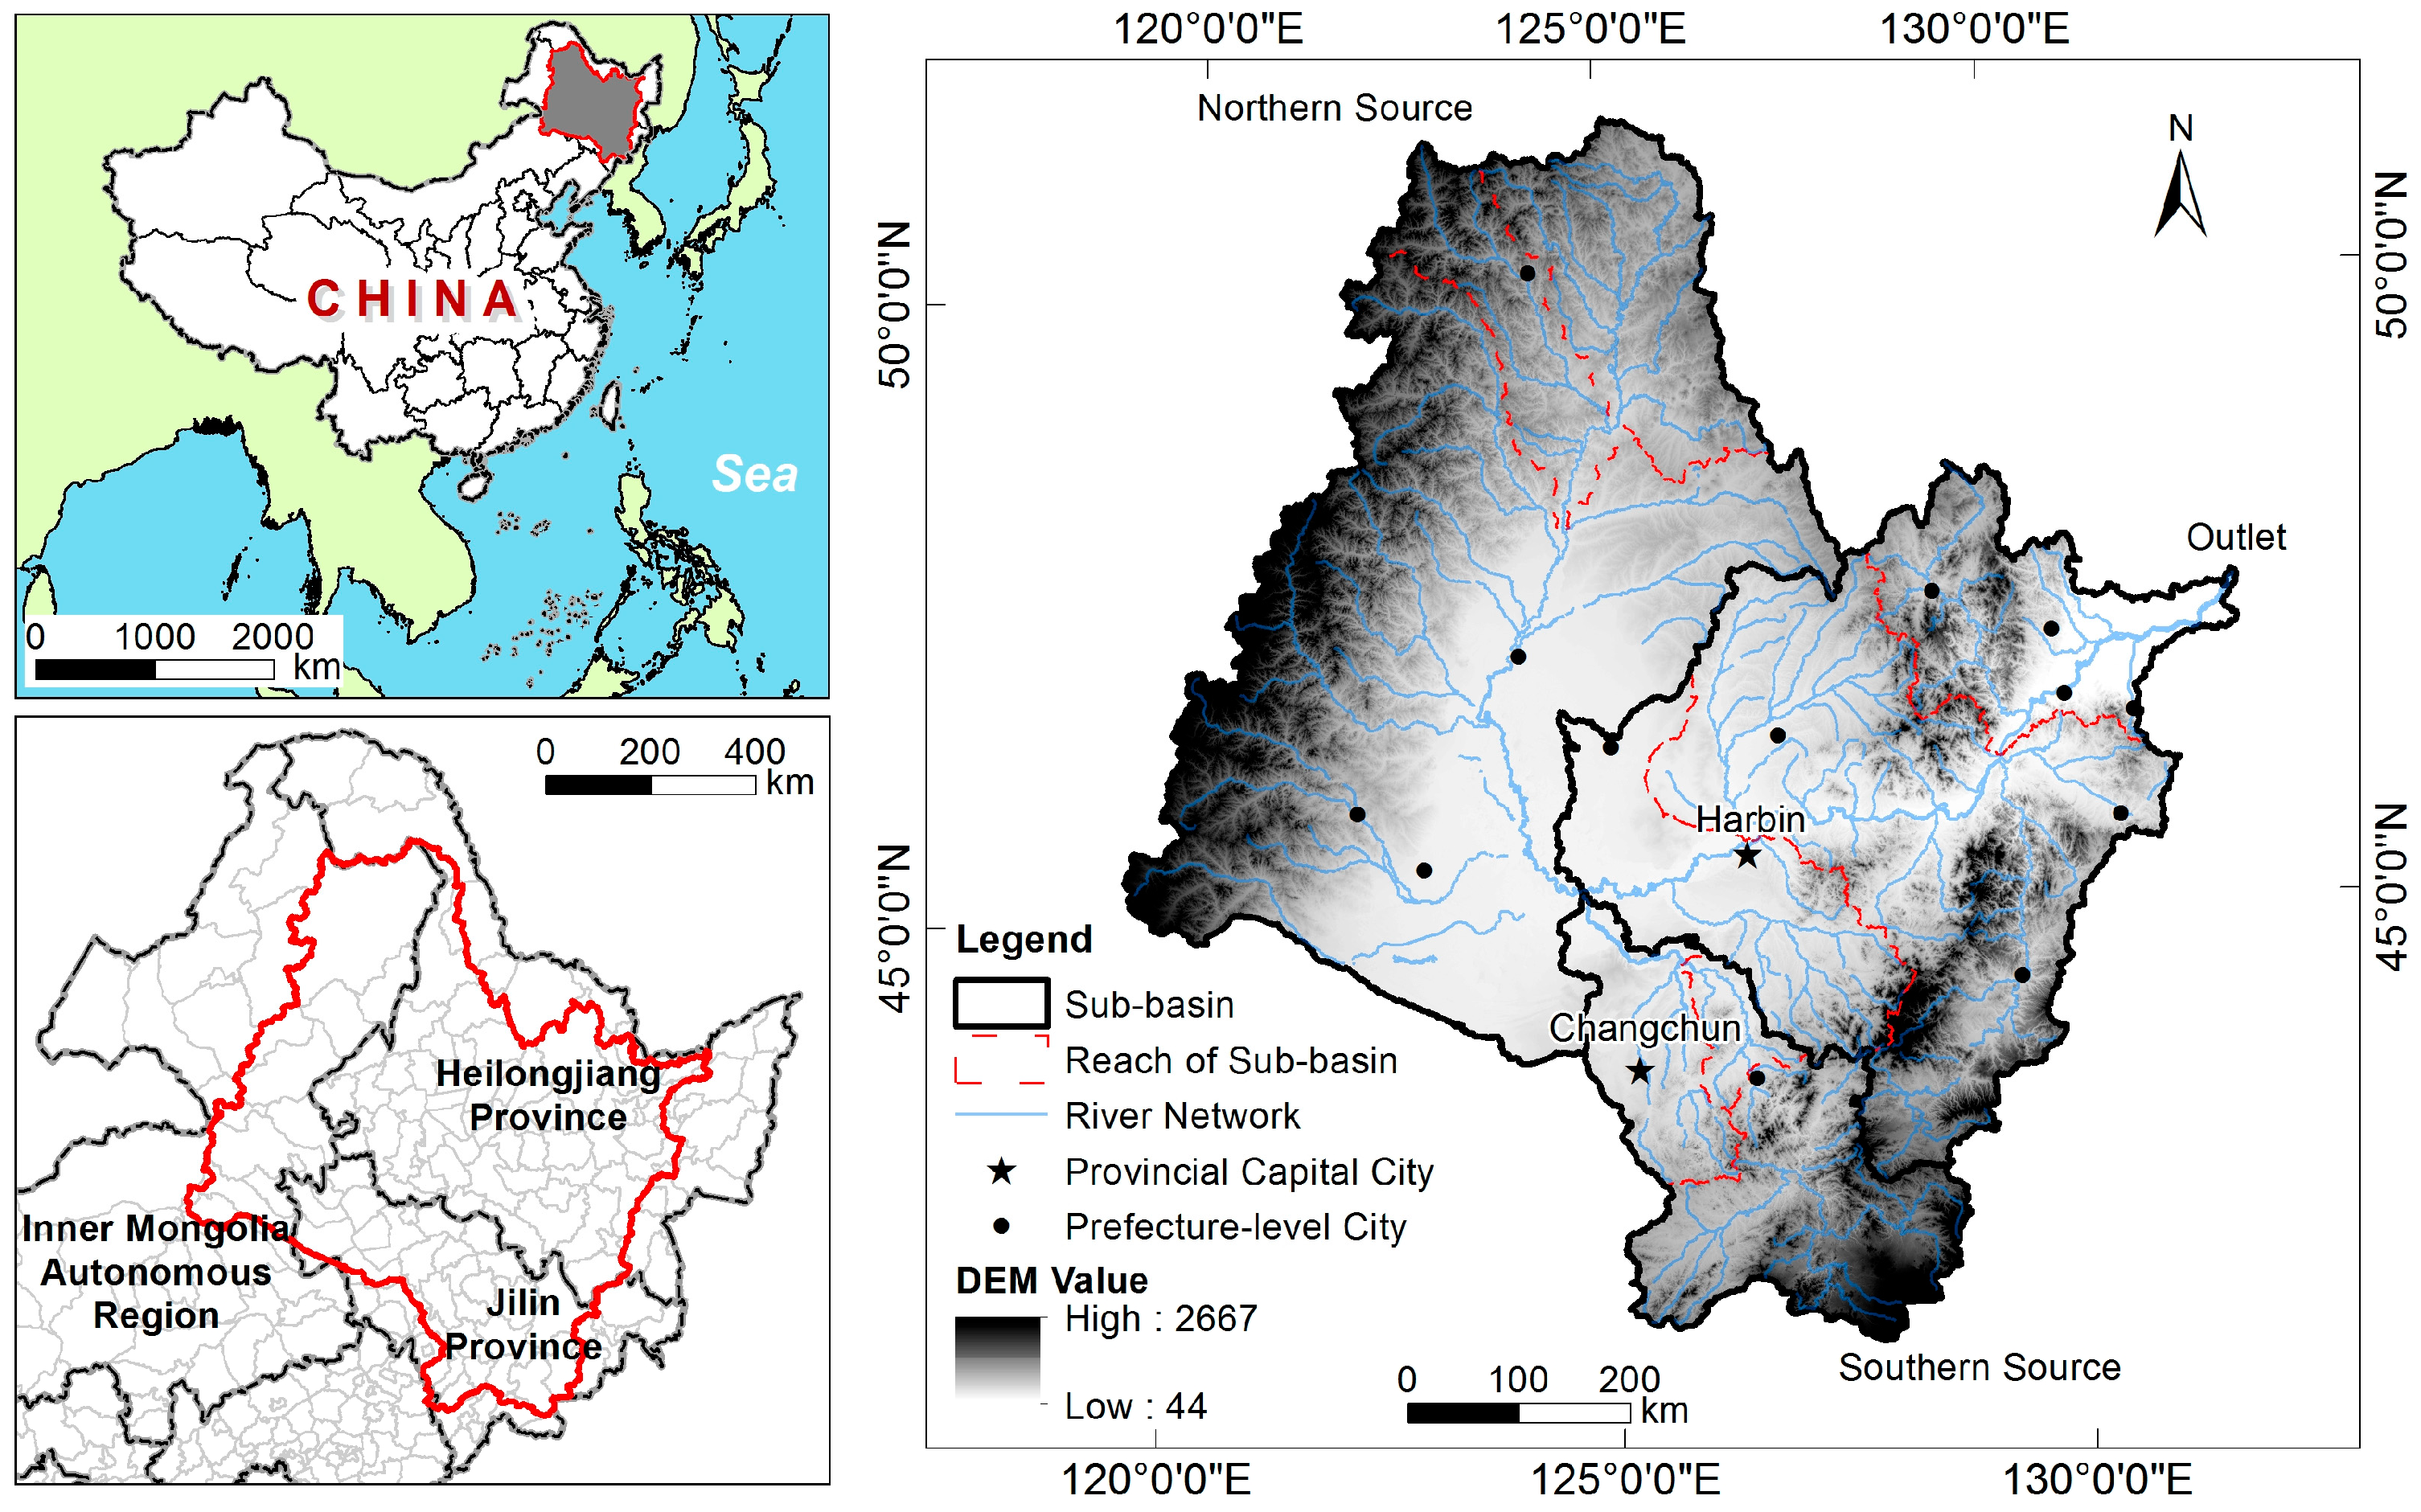
2.1. Study Area
2.2. Human Threat Factors
2.3. Threat Frequency and Severity
2.4. Calculation and Analysis Methods
3. Results
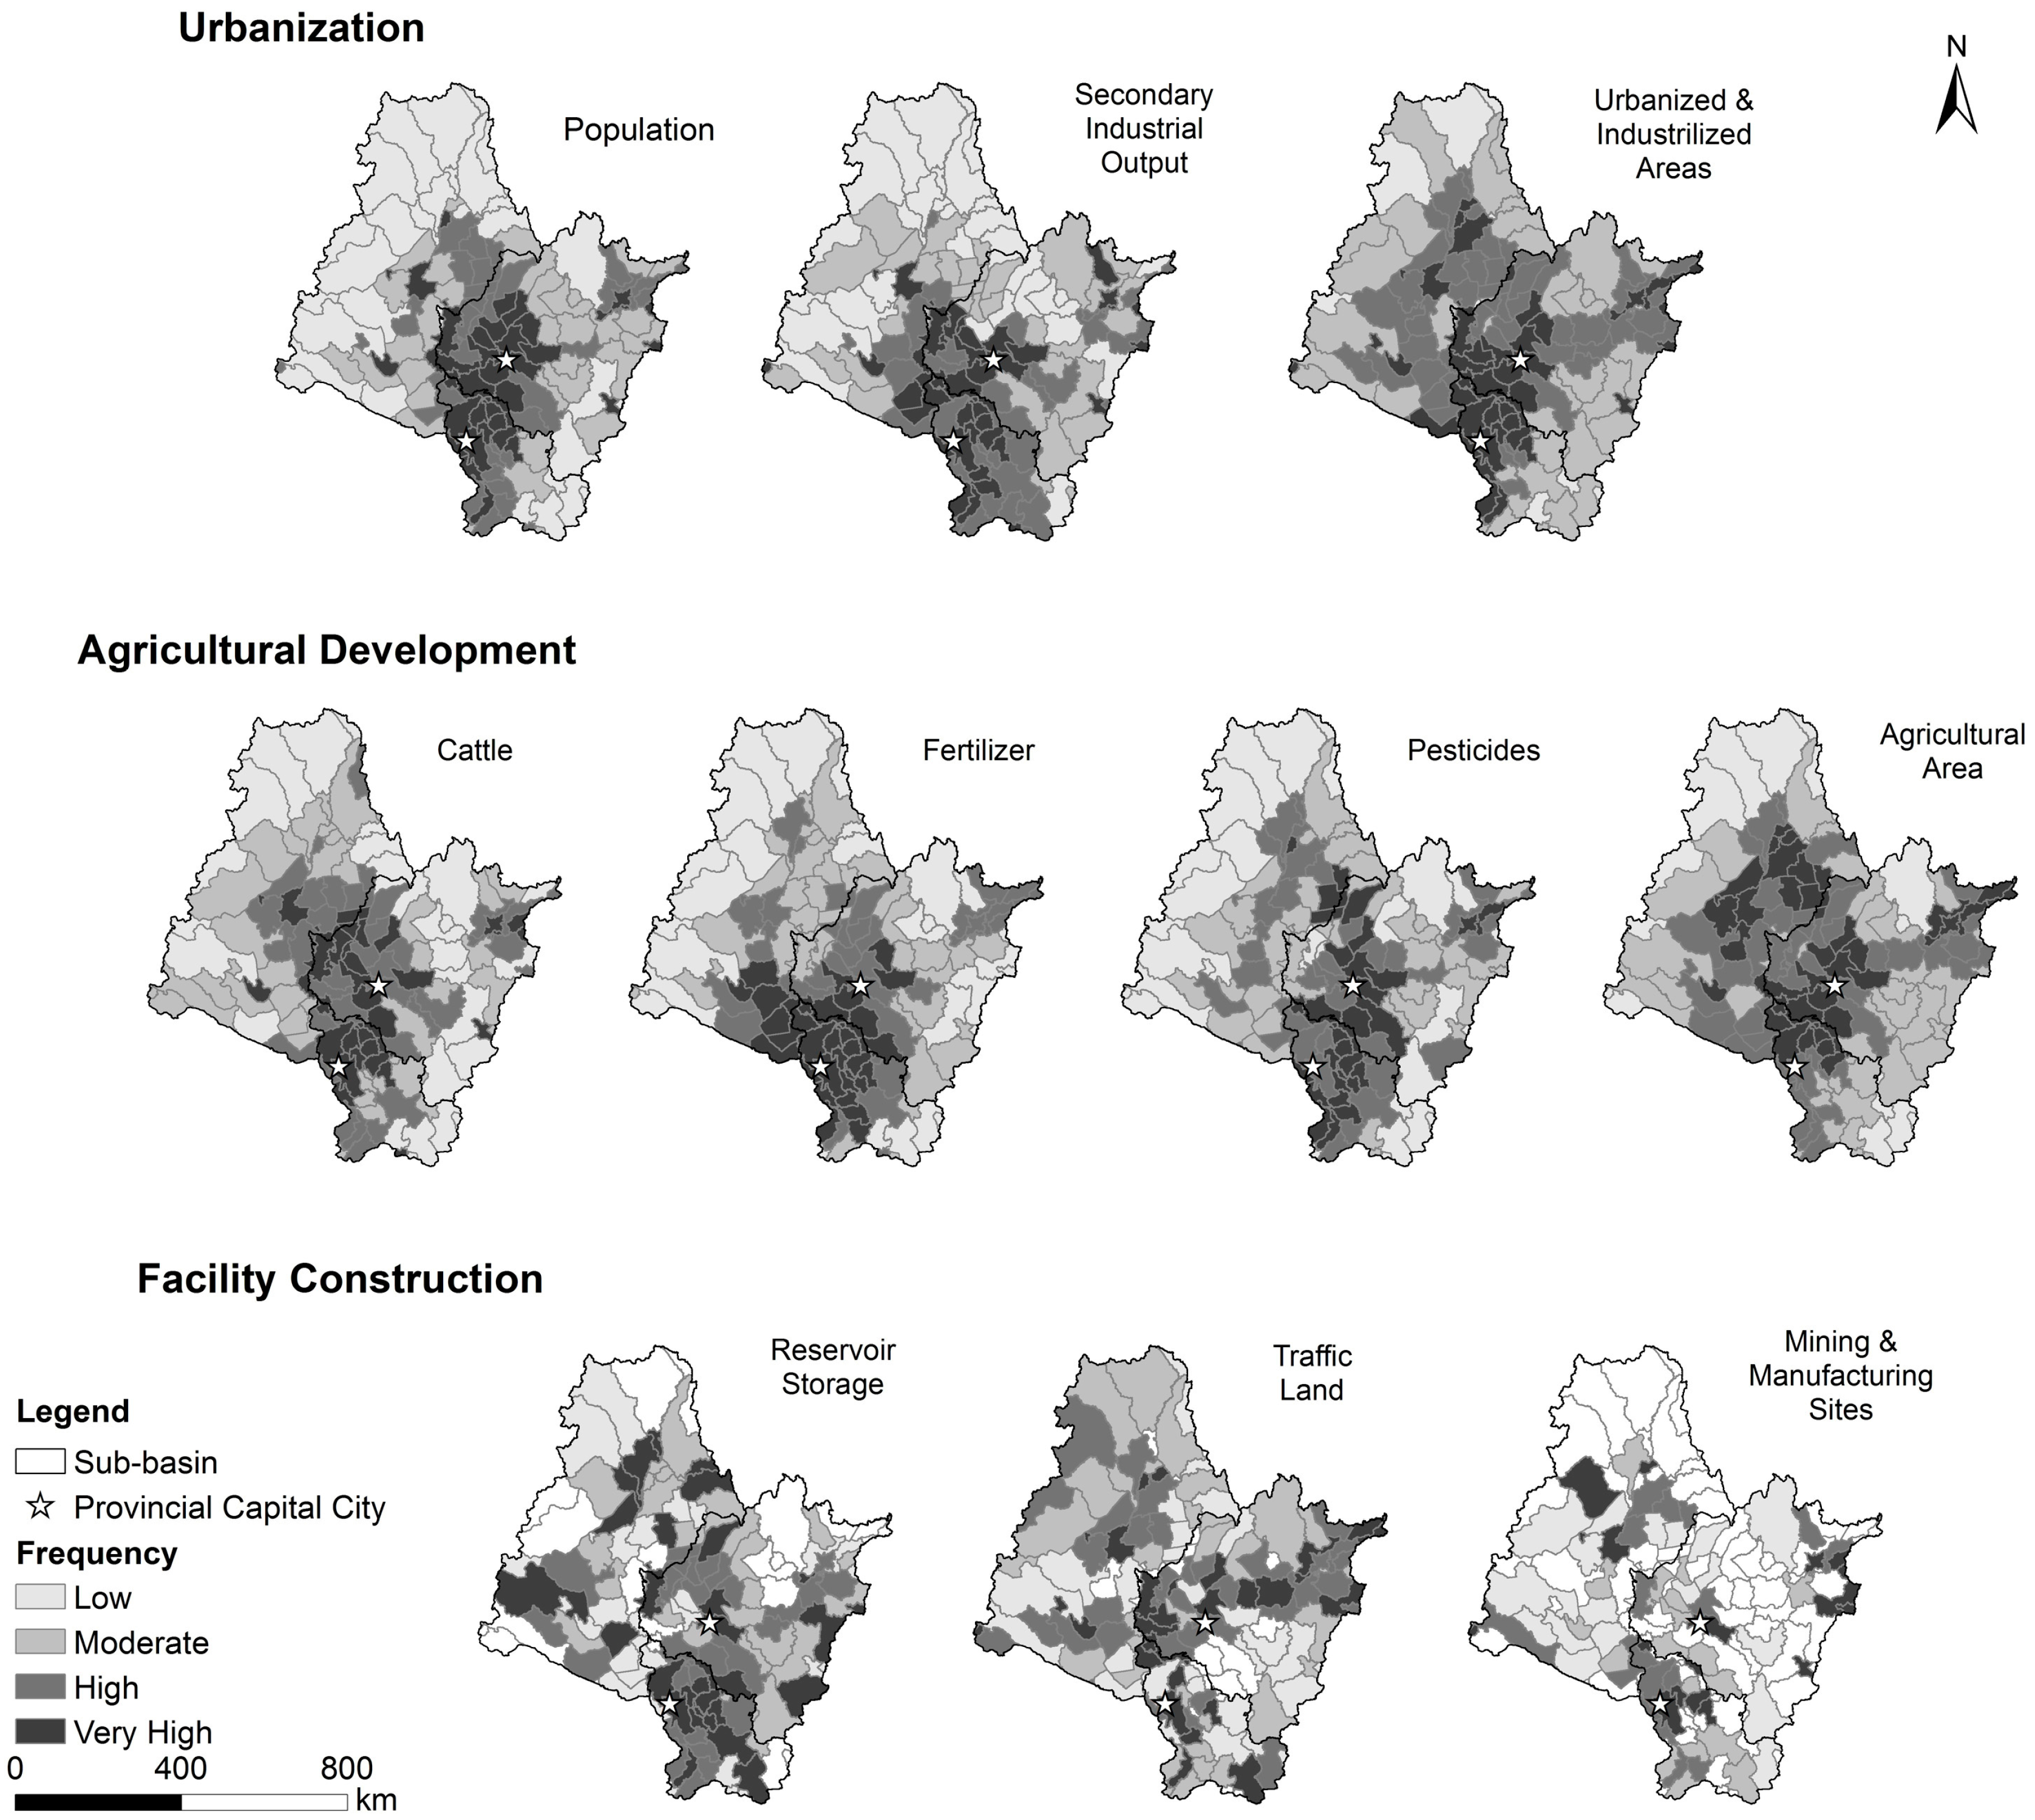
3.1. Frequency for Individual Factors
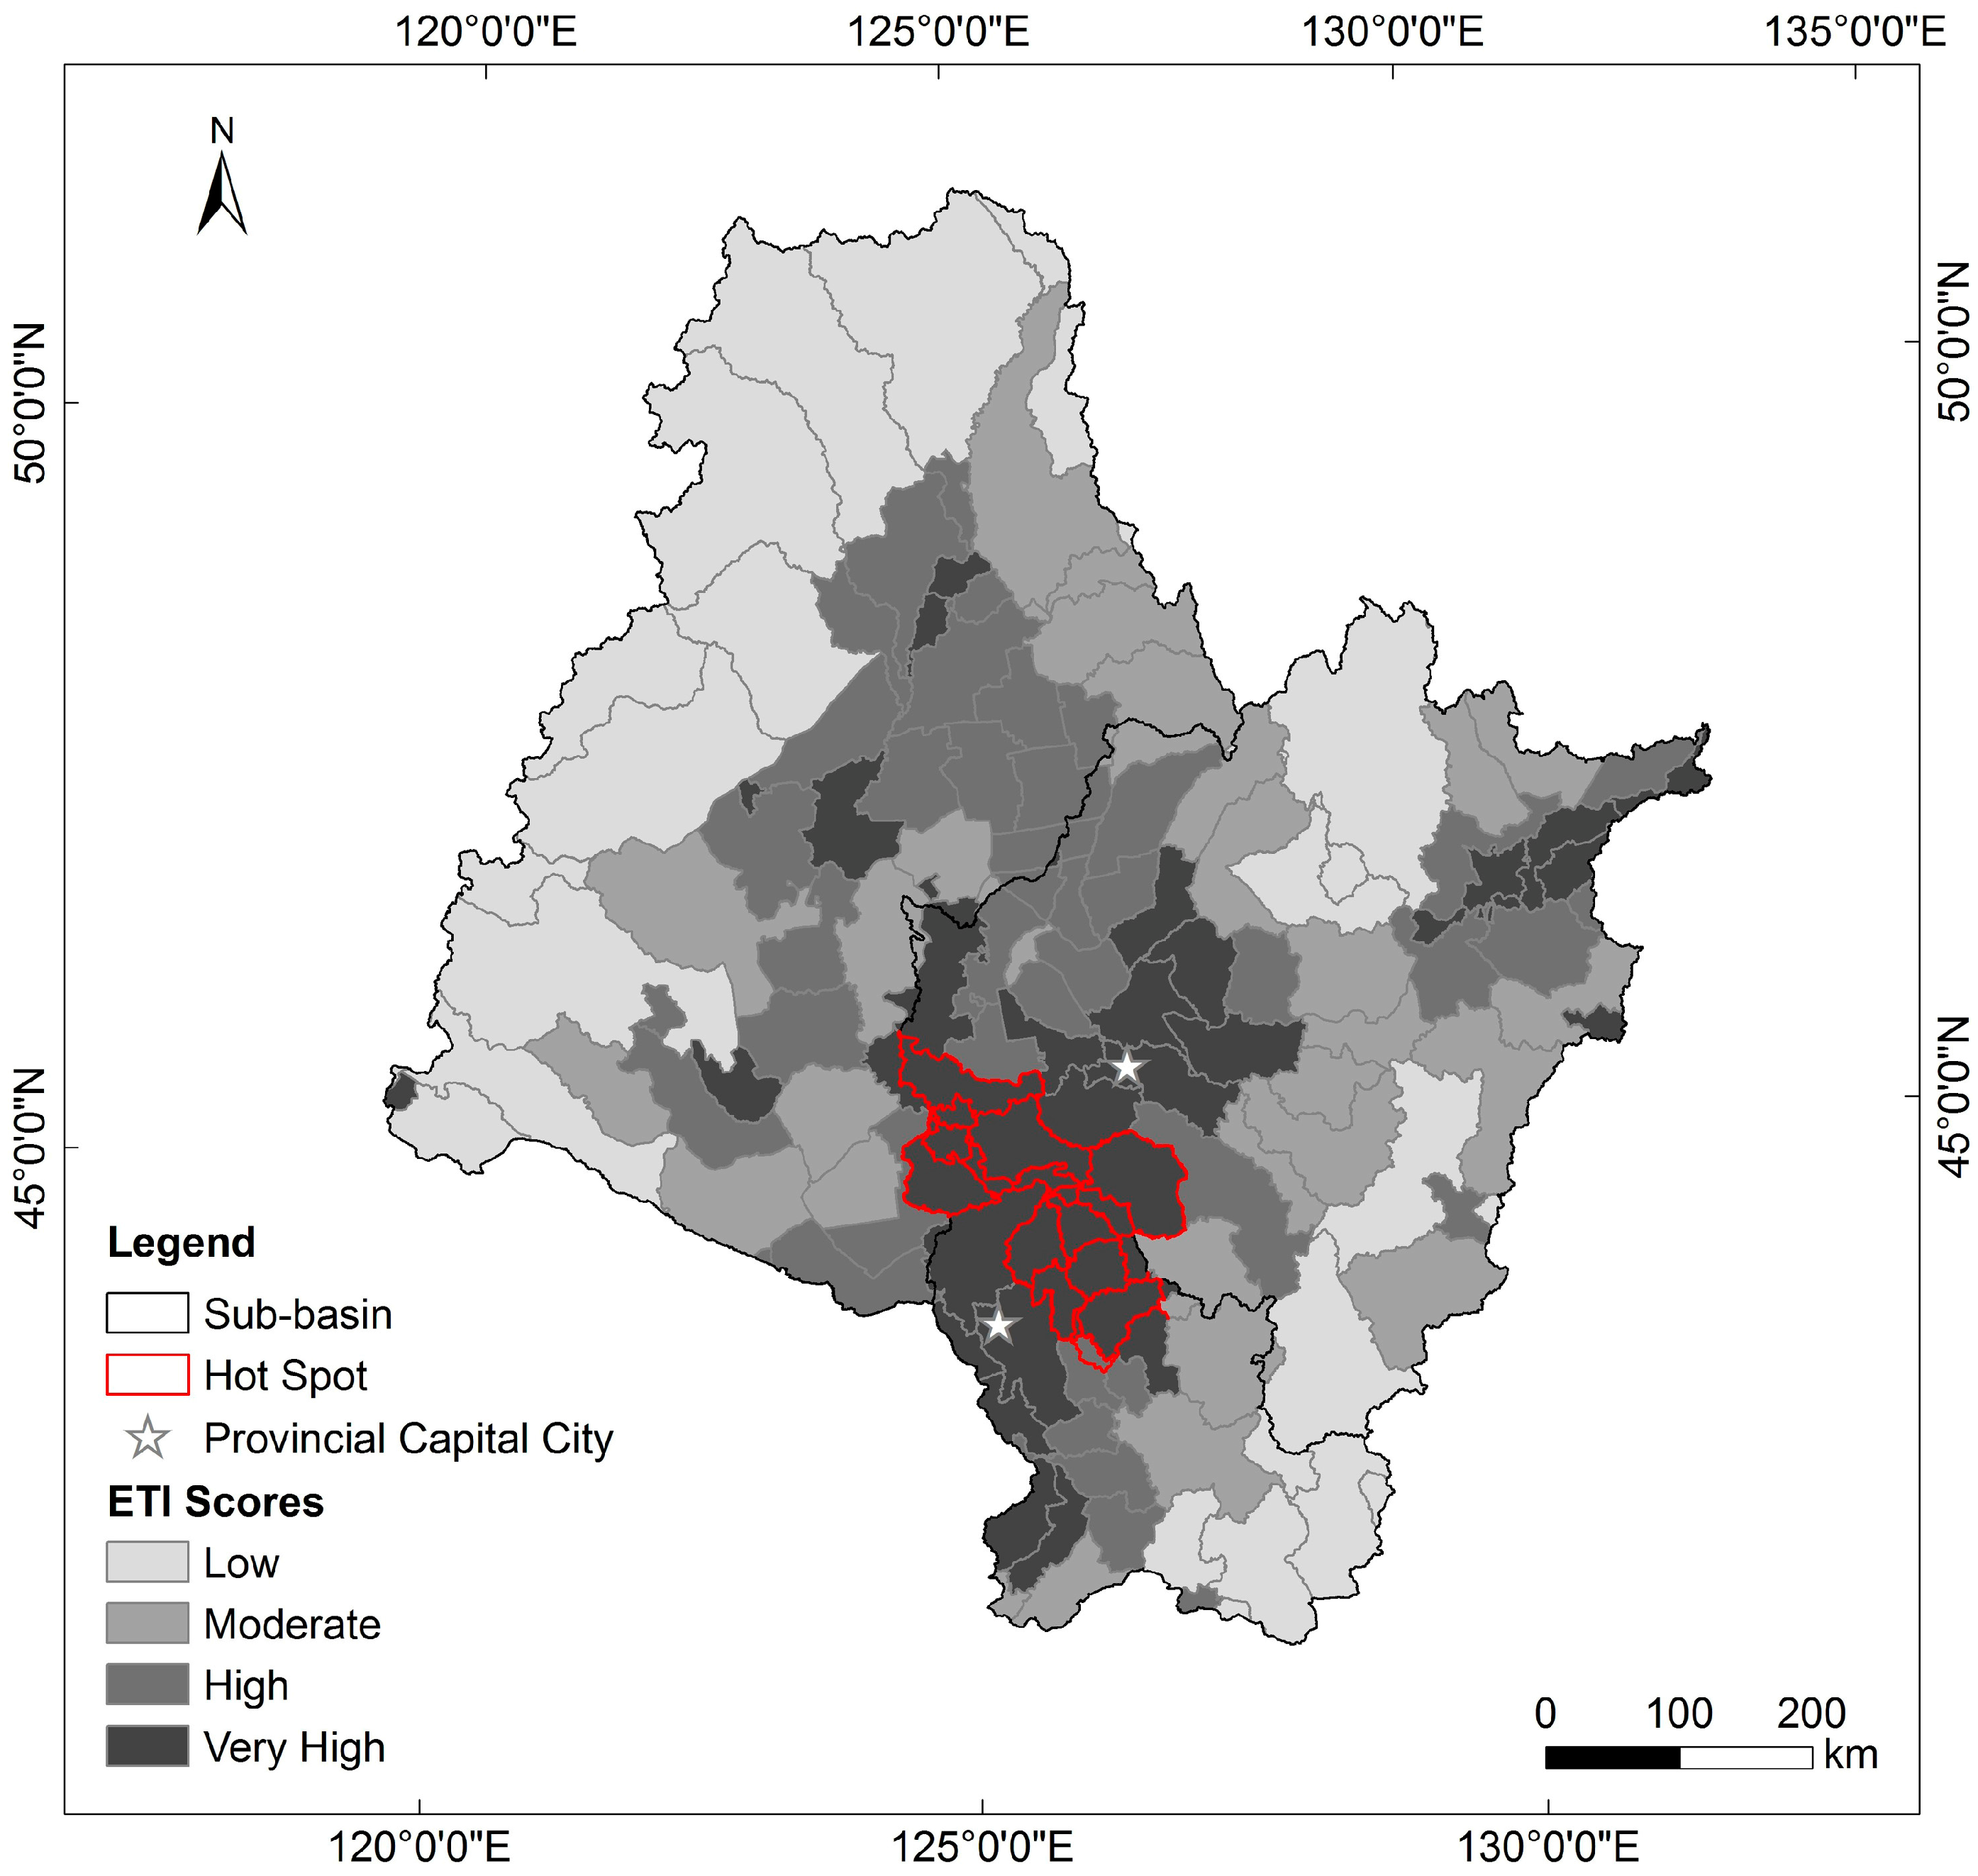
3.2. Integrated ETI of the SRB
3.3. Impact of Individual Factors on the ETI
4. Conclusions and Discussion
Acknowledgments
Author Contributions
Conflicts of Interest
References
- Xiao, D.; Chen, W.; Guo, F. On the basic concepts and contents of ecological security. Chin. J. Appl. Ecol. 2002, 13, 354–358. [Google Scholar]
- Gao, J. Ecological security is a vital part of national security. Qiu Shi 2015, 24, 43–44. [Google Scholar]
- Karr, J.R.; Fausch, K.D.; Angermeier, P.L.; Yant, P.R.; Schlosser, I.J. Assessing Biological Integrity in Running Waters: A Method and Its Rationale; Illinois Natural History Survey Special Publication 5; Illinois Natural History Survey: Champaign, IL, USA, 1986; pp. 2–4. Available online: http://www.nrem.iastate.edu/class/assets/aecl518/Discussion%20Readings/Karr_et_al._1986.pdf (accessed on 21 June 2016).
- Poff, N.L.; Olden, J.D.; Merritt, D.M.; Pepin, D.M. Homogenization of regional river dynamics by dams and global biodiversity implications. Proc. Natl. Acad. Sci. USA 2007, 104, 5732–5737. [Google Scholar] [CrossRef] [PubMed]
- Stein, J.L.; Stein, J.A.; Nix, H.A. Spatial analysis of anthropogenic river disturbance at regional and continental scales: Identifying the wild rivers of Australia. Landsc. Urban Plan. 2002, 60, 1–25. [Google Scholar] [CrossRef]
- Nel, J.L.; Roux, D.J.; Abell, R.; Ashton, P.J.; Cowling, R.M.; Higgins, J.V.; Thieme, M.; Viers, J.H. Progress and challenges in freshwater conservation planning. Aquat. Conserv. 2009, 19, 474–485. [Google Scholar] [CrossRef]
- Li, F.; Shah, D.N.; Pauls, S.; Qu, X.; Cai, Q.; Shah, R.D.T. Elevational shifts of freshwater communities cannot catch up climate warming in the Himalaya. Water 2016, 8, 327. [Google Scholar] [CrossRef]
- Vörösmarty, C.J.; McIntyre, P.B.; Gessner, M.O.; Dudgeon, D.; Prusevich, A.; Green, P.; Glidden, S.; Bunn, S.E.; Sullivan, C.A.; Liermann, C.R.; et al. Global threats to human water security and river biodiversity. Nature 2010, 467, 555–561. [Google Scholar] [CrossRef] [PubMed]
- Baral, H.; Keenan, R.J.; Sharma, S.K.; Stork, N.E.; Kasel, S. Spatial assessment and mapping of biodiversity and conservation priorities in a heavily modified and fragmented production landscape in north-central Victoria, Australia. Ecol. Indic. 2014, 36, 552–562. [Google Scholar] [CrossRef]
- Danz, N.P.; Niemi, G.J.; Regal, R.; Hollenhorst, T.; Johnson, L.B.; Hanowski, J.M.; Axler, R.P.; Ciborowski, J.J.H.; Hrabik, T.; Brady, V.J.; et al. Integrated measures of anthropogenic stress in the U.S. Great Lakes Basin. Environ. Manag. 2007, 39, 631–647. [Google Scholar] [CrossRef] [PubMed]
- Wang, G.; Cheng, G.; Qian, J. Several problems in ecological security assessment research. Chin. J. Appl. Ecol. 2003, 14, 1551–1556. [Google Scholar]
- Graham, R.L.; Hunsaker, C.T.; O’Neill, R.V.; Jackson, B.L. Ecological risk assessment at the regional scale. Ecol. Appl. 1991, 1, 196–206. [Google Scholar] [CrossRef] [PubMed]
- Fore, J.D.; Sowa, S.P.; Galat, D.L.; Annis, G.M.; Diamond, D.D.; Rewa, C. Riverine threat indices to assess watershed condition and identify primary management capacity of agriculture natural resource management agencies. Environ. Manag. 2014, 53, 567–582. [Google Scholar] [CrossRef] [PubMed]
- Mattson, K.M.; Angermeier, P.L. Integrating human impacts and ecological integrity into a risk-based protocol for conservation planning. Environ. Manag. 2007, 39, 125–138. [Google Scholar] [CrossRef] [PubMed]
- Falcone, J.A.; Carlisle, D.M.; Weber, L.C. Quantifying human disturbance in watersheds: Variable selection and performance of a GIS-based disturbance index for predicting the biological condition of perennial streams. Ecol. Indic. 2010, 10, 264–273. [Google Scholar] [CrossRef]
- Kapo, K.E.; Burton, G.A. A Geographic Information Systems-based, weights-of-evidence approach for diagnosing aquatic ecosystem impairment. Environ. Toxicol. Chem. 2006, 25, 2237–2249. [Google Scholar] [CrossRef] [PubMed]
- Meixler, M.S.; Bain, M.B. Landscape scale assessment of stream channel and riparian habitat restoration needs. Landsc. Ecol. Eng. 2010, 6, 235–245. [Google Scholar] [CrossRef]
- Sterling, S.M.; Garroway, K.; Guan, Y.; Ambrose, S.M.; Horne, P.; Kennedy, G.W. A new watershed assessment framework for Nova Scotia: A high-level, integrated approach for regions without a dense network of monitoring stations. J. Hydrol. 2014, 519, 2596–2612. [Google Scholar] [CrossRef]
- Paukert, C.P.; Pitts, K.L.; Whittier, J.B.; Olden, J.D. Development and assessment of a landscape-scale ecological threat index for the Lower Colorado River Basin. Ecol. Indic. 2011, 11, 304–310. [Google Scholar] [CrossRef]
- Zhang, H.; Chen, L. Using the ecological risk index based on combined watershed and administrative boundaries to assess human disturbances on river ecosystems. Hum. Ecol. Risk. Assess. 2014, 20, 1590–1607. [Google Scholar] [CrossRef]
- Gao, Y. Research on Water Resources Management Mode of Songhua River Basin. Master’s Thesis, Dalian University of Technology, Dalian, China, 22 June 2011. [Google Scholar]
- Several Opinions of the CPC Central Committee and the State Council on Revitalizing the Old Industrial Bases in Northeast China. Available online: http://news.xinhuanet.com/2016-04/26/c_1118744344.htm (accessed on 26 August 2016).
- Dang, L. Summary of Songhua River Basin Integrated Water Resources Plan. Chin. Water Resour. 2011, 23, 97–100. [Google Scholar]
- Song-Liao Water Resources Commission; Ministry of Water Resources. Annals of the Songhua River; Jilin People’s Publishing House: Changchun, China, 2004; Volume 1, pp. 250–305.
- Guan, Z.; Li, M.; Liu, Z.; Pang, Z.; Cui, A.; Guo, N. Local Chronicles of Songhuajiang Region; China Statistics Press: Beijing, China, 1995; Volume 1, pp. 59–62. [Google Scholar]
- Johnson, L.B.; Host, G.E. Recent developments in landscape approaches for the study of aquatic ecosystems. J. N. Am. Benthol. Soc. 2010, 29, 41–66. [Google Scholar] [CrossRef]
- Mitchell, A. The ESRI Guide to GIS Analysis; ESRI Press: Redlands, CA, USA, 2005; Volume 2, pp. 112–187. [Google Scholar]
- Ding, Y.; Shan, B.; Zhao, Y. Assessment of River Habitat Quality in the Hai River Basin, Northern China. Int. J. Environ. Res. Public Health 2015, 12, 11699–11717. [Google Scholar] [CrossRef] [PubMed]
- Xue, J.; Yun, W.; Du, G.; Zhang, F. Difference analysis of land use patterns in modern and traditional agricultural region based on remote sensing. Trans. Chin. Soc. Agric. Eng. 2012, 28, 245–251. [Google Scholar]
- Shuster, W.D.; Bonta, J.; Thurston, H.; Warnemuende, E.; Smith, D.R. Impacts of impervious surface on watershed hydrology: A review. Urban Water J. 2005, 2, 263–275. [Google Scholar] [CrossRef]
- Giller, P.S. River restoration: Seeking ecological standards. Editor’s introduction. J. Appl. Ecol. 2005, 42, 201–207. [Google Scholar] [CrossRef]
- Brown, T.C.; Froemke, P. Nationwide assessment of nonpoint source threats to water quality. Bioscience 2012, 62, 136–146. [Google Scholar]
- Bureau of Statistics in Heilongjiang Province. Heilongjiang Statistical Yearbook 2011; China Statistics Press: Beijing, China, 2011; pp. 683–712.
- Bureau of Statistics in Jilin Province. Jilin Statistical Yearbook 2011; China Statistics Press: Beijing, China, 2011; pp. 423–456.
- Bureau of Statistics in Inner Mongolia Region. Inner Mongolia Statistical Yearbook 2011; China Statistics Press: Beijing, China, 2011; pp. 768–823.
- Song-Liao Water Resources Commission; Ministry of Water Resources. The Water Resources Bulletin of Song-Liao Basin. 2011. Available online: http://www.slwr.gov.cn/szy2011/ (accessed on 25 May 2016). [Google Scholar]
- Wang, S.; Xie, Y. China Species Red List; Higher Education Press: Beijing, China, 2004. [Google Scholar]
- Tran, C.P.; Bode, R.W.; Smith, A.J.; Kleppel, G.S. Land-use proximity as a basis for assessing stream water quality in New York State (USA). Ecol. Indic. 2010, 10, 727–733. [Google Scholar] [CrossRef]
- Sowa, S.P.; Annis, G.; Morey, M.E.; Diamond, D.D. A GAP analysis and comprehensive conservation strategy for riverine ecosystems of Missouri. Ecol. Monogr. 2007, 77, 301–334. [Google Scholar] [CrossRef]
- Getis, A.; Ord, J.K. The analysis of spatial association by use of distance statistics. Geogr. Anal. 1992, 24, 189–206. [Google Scholar] [CrossRef]
- Ord, J.K.; Getis, A. Local spatial autocorrelation statistics: Distributional issues and an application. Geogr. Anal. 1995, 27, 286–306. [Google Scholar] [CrossRef]
- Zhang, J. Coastal Ecosystem Security and Empirical Research of Jiaozhou Bay. Ph.D. Thesis, Ocean University of China, Qingdao, China, 10 June 2009. [Google Scholar]
- Lichtfouse, E.; Navarrete, M.; Debaeke, P.; Véronique, S.; Alberola, C. Sustainable Agriculture; Springer: Dordrecht, The Netherlands, 2009; pp. 845–894. [Google Scholar]
- Roni, P.; Hanson, K.; Beechie, T. Global review of the physical and biological effectiveness of stream habitat rehabilitation techniques. N. Am. J. Fish. Manag. 2008, 28, 856–890. [Google Scholar] [CrossRef]
- Groves, C.R. Drafting a Conservation Blueprint: A Practitioner’s Guide to Planning for Biodiversity; Island Press: Washington, DC, USA, 2003; pp. 203–355. [Google Scholar]


| Threat Factors | Classification | Unit | Water Quality | Physical Habitat | Biotic Interactions | Flow Regime | Energy Source | Total |
|---|---|---|---|---|---|---|---|---|
| Population | Urbanization | No./km2 | 3 | 3 | 3 | 3 | 2 | 14 |
| Secondary industrial output | Urbanization | CNY (104)/km2 | 3 | 3 | 3 | 2 | 1 | 12 |
| Urbanized & industrialized areas | Urbanization | % | 3 | 3 | 2 | 2 | 3 | 13 |
| Large animals | Agricultural development | No./km2 | 1 | 1 | 1 | 1 | 3 | 7 |
| Fertilizer | Agricultural development | kg/km2 | 3 | 0 | 1 | 0 | 2 | 6 |
| Pesticides | Agricultural development | kg/km2 | 2 | 0 | 3 | 0 | 1 | 6 |
| Agricultural area | Agricultural development | % | 2 | 3 | 2 | 2 | 3 | 12 |
| Reservoir storage | Facility construction | m3/km2 | 3 | 3 | 3 | 3 | 3 | 15 |
| Traffic land | Facility construction | % | 2 | 2 | 1 | 1 | 2 | 8 |
| Mining & manufacturing sites | Facility construction | No./km2 | 3 | 3 | 2 | 2 | 1 | 9 |
| Threat Factor | z-Score | p-Value | Hot Spot Location |
|---|---|---|---|
| Population | 6.436 | 0.000 |  |
| Secondary industrial output | 4.157 | 0.000 |  |
| Urbanized & industrialized areas | 4.736 | 0.000 |  |
| Large animals | 3.362 | 0.001 |  |
| Fertilizer | 13.239 | 0.000 |  |
| Pesticides | 9.084 | 0.000 |  |
| Agricultural area | 9.075 | 0.000 |  |
| Reservoir storage | 7.775 | 0.000 |  |
| Traffic land | 4.445 | 0.000 |  |
| Mining & manufacturing sites | 0.208 | 0.835 | Random |
| Threat Factor | Sensitivity (%) | Condition | Sensitivity (%) |
|---|---|---|---|
| Agricultural area | 2.91 | Agricultural development | 5.14 |
| Population | 2.32 | ||
| Pesticides | 1.40 | ||
| Urbanized & industrialized areas | 1.10 | Urbanization | 4.06 |
| Secondary industrial output | 0.63 | ||
| Traffic land | 0.57 | ||
| Fertilizer | 0.47 | ||
| Large animals | 0.37 | Facility construction | 0.84 |
| Reservoir storage | 0.22 | ||
| Mining & manufacturing sites | 0.05 |
© 2017 by the authors. Licensee MDPI, Basel, Switzerland. This article is an open access article distributed under the terms and conditions of the Creative Commons Attribution (CC BY) license ( http://creativecommons.org/licenses/by/4.0/).
Share and Cite
Shen, Y.; Cao, H.; Tang, M.; Deng, H. The Human Threat to River Ecosystems at the Watershed Scale: An Ecological Security Assessment of the Songhua River Basin, Northeast China. Water 2017, 9, 219. https://doi.org/10.3390/w9030219
Shen Y, Cao H, Tang M, Deng H. The Human Threat to River Ecosystems at the Watershed Scale: An Ecological Security Assessment of the Songhua River Basin, Northeast China. Water. 2017; 9(3):219. https://doi.org/10.3390/w9030219
Chicago/Turabian StyleShen, Yuan, Huiming Cao, Mingfang Tang, and Hongbing Deng. 2017. "The Human Threat to River Ecosystems at the Watershed Scale: An Ecological Security Assessment of the Songhua River Basin, Northeast China" Water 9, no. 3: 219. https://doi.org/10.3390/w9030219