1. Introduction
The World Health Organization (WHO) defined “domestic water” as water used for all domestic purposes including consumption, bathing and food preparation [
1,
2]. The basic requirement of domestic water differs widely in different climatic conditions, lifestyle, culture, tradition, diet, technology, wealth and development [
3]. However, the quantity of domestic water influences hygiene, which consequently affects public health [
4]. Based on the recommendations of Howard and Batram [
4], with access to less than 20 L of water per capita per day (LPCD) (basic access), consumption, hand washing, and basic food hygiene is possible, but laundry and bathing are difficult to ensure and so the health concerns are high. Apart from the obvious health consequences, the quantity of domestic water consumption is one of the most important proxies of economic development [
5]. Hence, ensuring the adequacy of domestic water is an important issue and is a serious challenge in water scarce areas.
Water scarcity affects 40% of the global population and is projected to rise [
6]. The Kathmandu Valley, the largest urban core in Nepal with a population of 2.51 million [
7], had a demand of 370 million liters per day (MLD) but the utility, Kathmandu Upatyaka Khanepani Limited (KUKL), produces only 69 MLD during the dry season and 115 MLD during the wet season [
8]. The leakage percentage is 40%, as reported by the utility company [
8]. With unacceptably low performances by the utility, residents are compelled to use multiple sources such as private wells, stone spouts, springs, and rain to self-supply [
9,
10]. Furthermore, a water market has been well established in the valley since the 1990s [
11]; however, household data on the use of such sources are often excluded from the official statistics and often go unnoticed. The Asian Development Bank (ADB) in 2009 [
9] conducted a wide scale water use survey where the main aims were to establish the baseline of the KUKL services and to propose indicators for future performance monitoring. In addition, within a span of five years, household KUKL connections have increased by the thousands, but supply is stagnant [
8]. Hence, we strongly believe that the current scenario has changed significantly from what was presented by the ADB [
9].
The lack of reliable per capita water consumption (water consumption hereafter) data for the valley has always been a topic of debate. Previous research has estimated water consumption to be between 60 and 73 LPCD [
12,
13,
14]. With urbanization and a change in lifestyle, water consumption is bound to increase to more than that reported a decade ago. In a recent study [
15], water consumption was estimated to be 37 LPCD, which is arguably less than previous estimates. Studies focused on estimating the water demand for the valley used the per capita consumption value provided by Bureau of Indian Standards [
16]. Such an assumption is unsuitable for the valley, considering that water consumption could be location specific.
Within a city, there are several factors that can lead to the uneven distribution of water consumption. KUKL provides water to its water supply service areas through 10 branch offices in the valley (KUKL branches hereafter) and these branches have different volumes of water production and supply [
8]. The ADB [
9] examined differing consumer satisfaction ratings based on their opinion of the KUKL performance across municipal areas, which could be indicative of the differences in performance across these branches. Furthermore, the wealth status of the residents could be a vital factor in determining water consumption. In the valley, the coping cost of water varied with different wealth statuses [
17]. Hence, it would be interesting to conduct empirical study that reflects the variations in water consumption based on social factors. Water demand estimation is a core element for water resource planning at a policy level and the availability of location specific water consumption data could be more reliable. Despite the importance of information on water consumption, there is a lack of quantitative evidence.
Nepal is vulnerable to a wide range of disasters due to its unique geo-physical setting and socio-economic conditions. Of these, earthquakes are the most likely natural disaster in Nepal, where the country is ranked as 11th worst in terms of relative vulnerability [
18], and the World Bank identified it as a hotspot [
19]. Based on recent evidence from the 2015 Gorkha earthquake (GEQ) with a magnitude of 7.8 M, which hit Nepal on 25 April 2015, Kathmandu Valley was considered one of the hardest-hit areas [
20]. As natural disasters threatened advances made in the coverage and quality of the water supply, in the valley, the water mains and distribution lines were damaged, taps were broken, storage tanks were cracked or destroyed, and wells were destroyed. A drastic decline in the piped water supply was projected from the extent of the damage to the water infrastructure by GEQ [
21]. However, to our knowledge, the impact of GEQ on domestic water consumption was not further explored. It is essential to understand the way domestic consumption from multiple sources has changed post-GEQ, where such study could contribute in the preparedness planning and in building resilience for water security in the aftermath of a disaster for susceptible, water-poor urban cities.
In this study, we investigated the dynamics of domestic water consumption in the urban area of the Kathmandu Valley, pre- and post-GEQ. The different aspects of domestic water consumption included the consumption of piped water and other alternative sources, the distribution of consumption across the KUKL branches and wealth status, and the household expenditure on water. In addition, we examined the impact of the GEQ on the consumption of water from different water sources and on the estimated water consumption (LPCD), and identified factors affecting water consumption. Empirical evidence on these different aspects of domestic water consumption and their determinants could have several important implications.
2. Materials and Methods
2.1. Study Settings
This study forms part of the “Hydro-microbiological approach for water security in Kathmandu Valley” project of the University of Yamanashi under the “Science and Technology Research Partnership for Sustainable Development” program, jointly funded by the Japan Science and Technology Agency and the Japan International Cooperation Agency. The study area is the Kathmandu Valley that consists of 85% of the Kathmandu district, the entire Bhaktapur district, and 50% of the Lalitpur district. A baseline survey was conducted from January to March 2015 in municipal areas of the valley: the Kathmandu metropolitan city (KMC), the Lalitpur Sub-metropolitan city (LSMC), the Kritipur municipality (KrM), and the Thimi municipality (TM). Post-GEQ, we conducted a follow-up survey from December 2015 to February 2016 (8–11 months after the GEQ).
2.2. Study Design
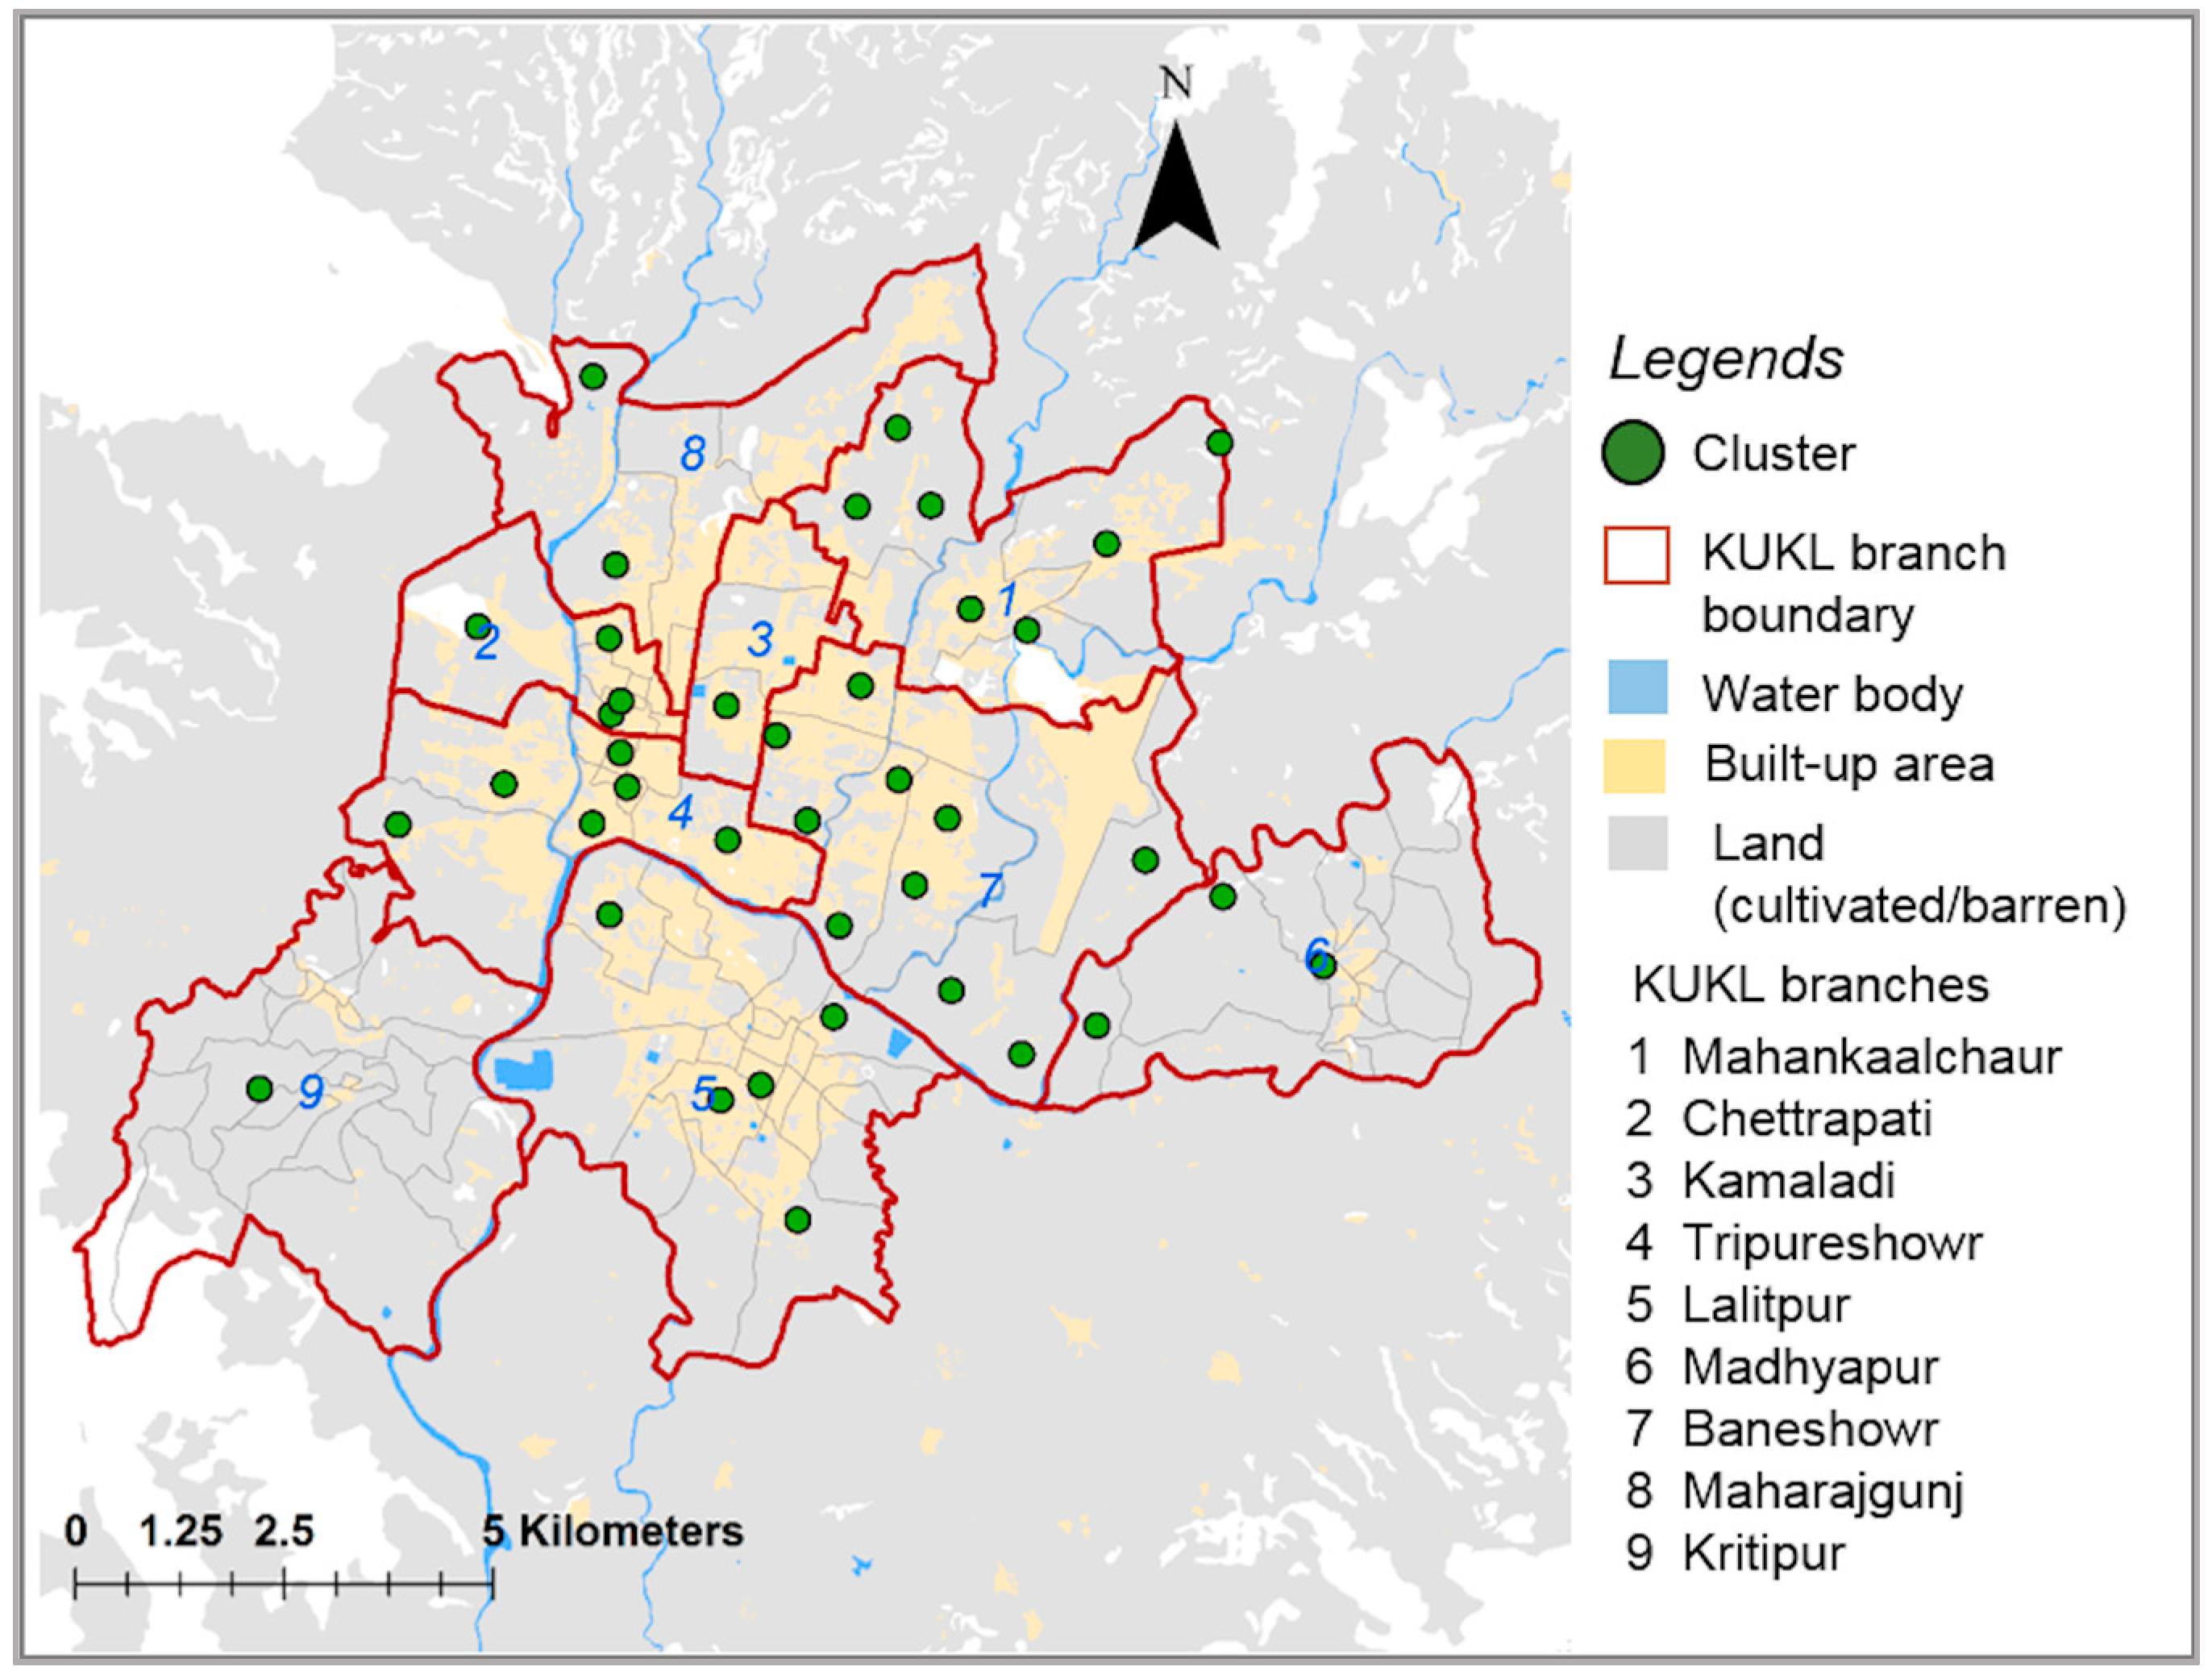
Our sampling unit is one household, and our target area consisted of more than 40,000 households. A multi-stage cluster survey eliminated the need for a complete list of all units in the population. In addition, our approach ensured that the selected population units will be closer together, which further reduced the cost and simplified field work. The multi-stage cluster survey included two steps for sample selection. First, 50 clusters were selected using the probability proportional to household size (PPS) sampling technique; however, due to the GEQ, the survey was possible only in 39 clusters. Hence, the total number of clusters pre- and post-GEQ was only 39 (
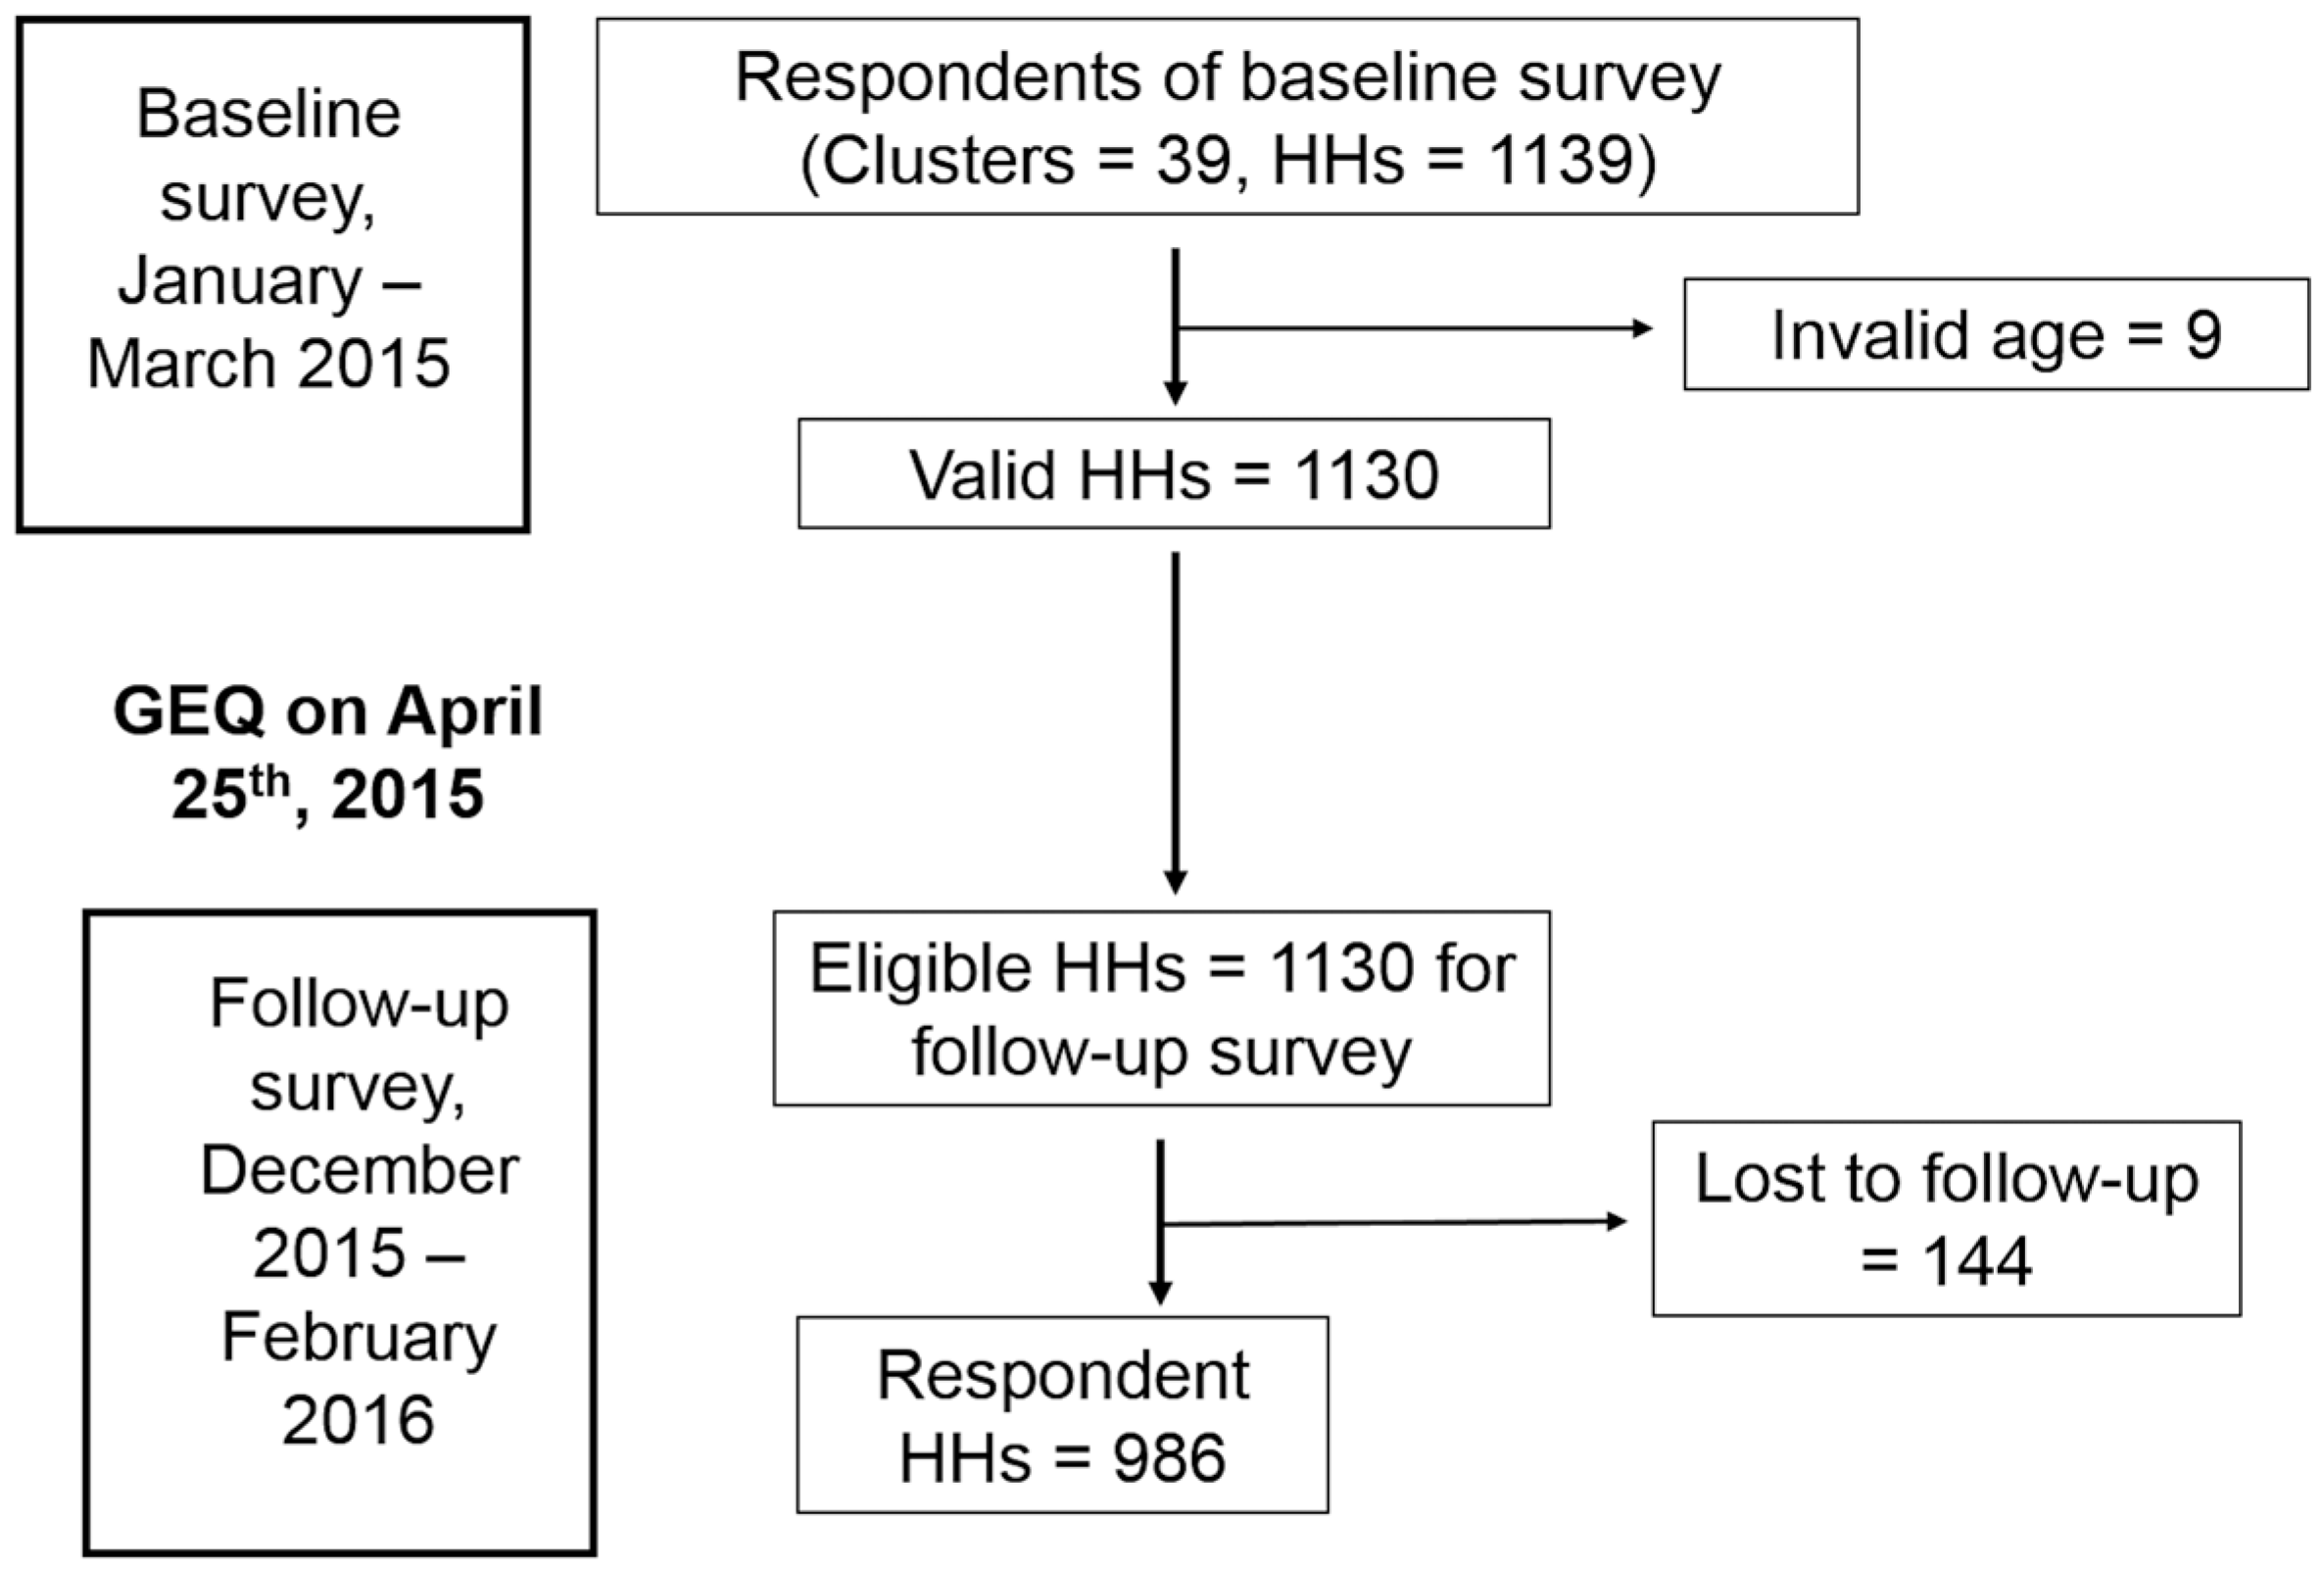
Figure 1). Here, household sizes in wards in KMC, LSMC, KrM and TM were considered for selecting clusters. For the second stage of selection, a random geographical location was chosen and the 30 households closest to the location were selected. Next, only one household per house was surveyed, although more than one households could have been living in a single house. A detailed flow chart of the study households is shown in
Figure 2. Out of 1139 households in the baseline, nine were excluded due to the respondents’ age not meeting the inclusion criteria. The inclusion criteria for a respondent were as follows: a member of a household, age between 15 and 60 years, and the capability to understanding and answer the questions. One hundred forty-four households were lost to follow-up, and 986 completed the study. The completion rate from baseline to follow-up was 87%.
2.3. Measurements
A structured questionnaire was used and data collected by trained interviewers through a face-to-face interview. The questionnaire included socio-demographic characteristics, domestic water use behavior, water collection, and buying. The term “water use” is defined in this manuscript as utilization by household. The questions on domestic water use behavior included water source (i.e., piped water, groundwater, jar water, tanker water and others), the purpose of use, the amount of water used, and the monthly household expenditure on water. Piped water is defined as municipal water supply provided by the utility, groundwater is defined as water tapped from underground through tube-wells and dug-wells, jar water is defined as water marketed in 20 L jar, and tanker water is defined as sources marketed by private vendors carrying water in truck/tanker. Household water consumption was calculated by summarizing the amount of water used from the different sources per day, and water consumption was calculated by dividing the daily household consumption by the size of the family. “Consumption” in this manuscript is defined as water quantity being used for domestic purposes, such as drinking, cooking, bathing, laundry, cleaning, and gardening. “Household water consumption” is the total water amount used by the family, and “water consumption” is the water amount used by a person. Moreover, the unit is per day. Monthly household expenditure on water was defined as the cumulative cost for using different water sources per month. The expenditure on the installation and maintenance of groundwater wells, the electricity bill for pumping water, and the cost required for water treatment were not included.
Socio-demographic characteristics included age, gender, literacy, the occupations of all the members of the household, ethnicity, family size, and socio-economic status. Ethnicity (Brahmin/Chettri/Janajati/Dalit) was based on the caste of the participants, as it also indicates social hierarchy, where low class groups such as Dalit are often disadvantaged [
22]. Socio-economic status was determined by constructing a wealth index based on household asset possession, such as a mobile phone, refrigerator, motorbike, vehicle, and invertor [
23]. The questionnaire for household assets possession was adapted from Rutstein and Kiersten, 2004 [
24]. The wealth index represented the household’s economic status in the long run. A principal component analysis (PCA) was used for identifying the weighting of each asset prior to constructing a wealth index. Based on the wealth index, households were categorized into five wealth quintiles: very poor, poor, medium, rich, and very rich. The four threshold wealth index values were −2.27, −0.11, 0.94, and 2.33 for the pre-GEQ period and −1.81, −0.49, 0.81, and 2.60 for the post-GEQ period. In addition, the total monthly household expenditure was also included in the questionnaire.
The questionnaire was developed in English language and then translated into Nepali and again back translated into English language. Separate groups of Nepalese researchers in the water research field were involved in translation and back-translation. After revising Nepali questionnaire, it was pretested in 30 households in the study area and made additional modifications based on the results.
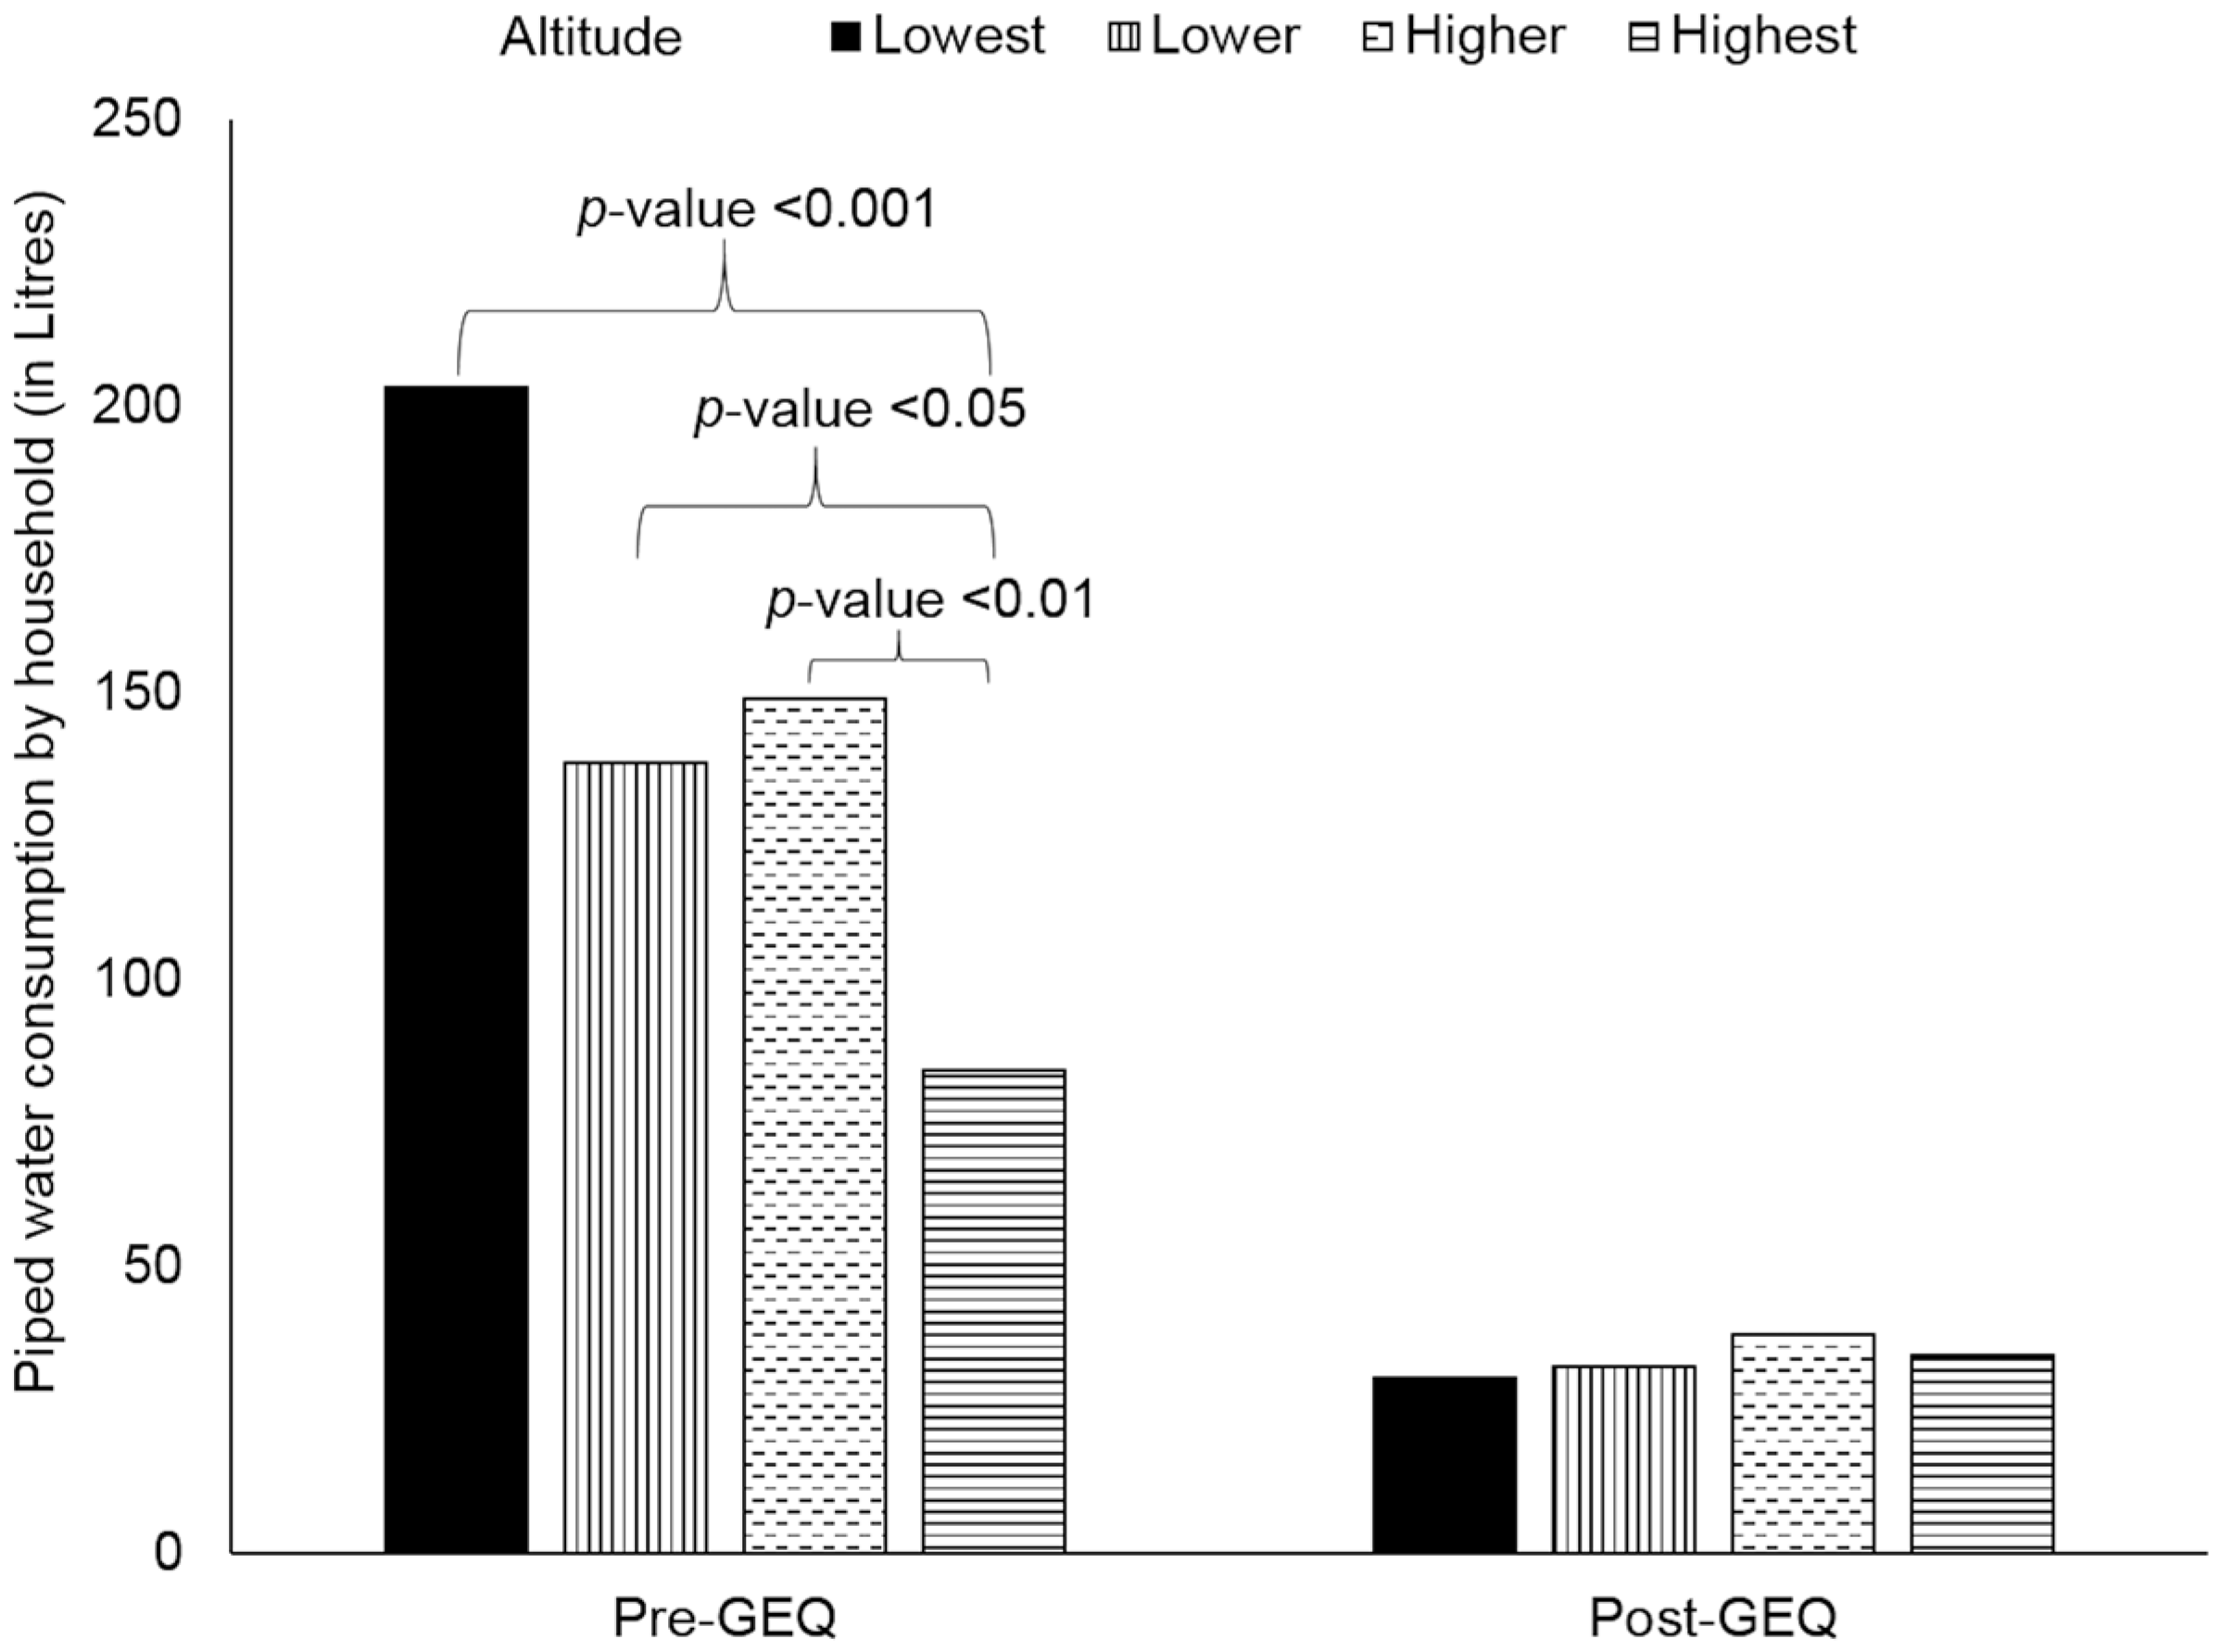
Poor water pressure was a common problem of piped water [
9], and water supply was assumed to be low in higher altitude areas. In this study, the altitude of the survey location was categorized into four levels: the lowest (1233–1296 m), lower (1297–1308 m), higher (1308–1324 m), and the highest (1324–1386 m). In order to have a plausible number of samples in all four categories for statistical analysis, three altitude thresholds (1296 m, 1308 m and 1324 m) were set based on quartiles values instead of setting four equal intervals of altitude. All categories had an almost equal number of households.
2.4. Statistical Analysis
Descriptive statistics were used to summarize the results of coverage and the use of different water sources for domestic purposes. We used a paired t-test to examine the difference between pre- and post-GEQ in household water consumption, in water consumption, and in household expenditure on water. A one-way analysis of variance (ANOVA) test was used to examine the difference in piped water consumption across different altitude categories and across different KUKL branches. The Pearson correlation coefficient was measured to examine the correlation of the piped water amount with groundwater, the tanker water, and the jar water amounts, and to examine the correlation of water consumption with the total household water expenditure.
We used a multilevel mixed linear regression model (Equation (1)) to identify whether the occurrence of the GEQ (factor/predictor) had affected household water consumption from different sources, separately. Piped water, groundwater, tanker water and jar water were used as dependent variables of separate models. The models were adjusted for wealth status given that wealth status was expected to change after the disaster and is connected with water use [
25]. Similarly, a multilevel mixed linear regression model (Equation (1)) was used to identify different factors affecting water consumption (dependent variables). In this model, piped water connection, groundwater use, jar water use, and tanker water use were the water related factors/predictors. Other factors/predictors included were the occurrence of the GEQ, the wealth status of households, and the KUKL branches. These factors were fixed effect variables.
In both multilevel linear regression models, cluster was a random effect variable, the estimation method used was the maximum likelihood method with the time variable (pre- and post-earthquake) as a repeated variable, and compound symmetry as the repeated covariance type.
where
yij = dependent variable for particular case ij;
β1 to
βn = fixed effect coefficients;
x1ij to
xnij = predictor variable for observation
j in cluster
i;
bi1 to
bin = random effect coefficient;
z1ij to
znij = random effect variable (predictor);
εij = error for case
j in cluster
i.
In addition to the estimate (β), the standard error, the p-value, the 95% confidence interval of the estimate, the F statistic, and the associated p-value are also mentioned. The statistical program IBM SPSS Statistics Version 20.0 (IBM Corporation, Armonk, NY, USA) was used for all statistical analyses. The significance level was set at <0.05 for all analytical procedures.
2.5. Ethical Consideration
The ethical review board of the University of Yamanashi and the Nepal Health Research Council reviewed and approved the study protocol, with application number 1 (28 November 2014) and 262/2014 (18 January 2015), respectively. The participants were informed about the study objectives and procedures at the start and was assured of their anonymity and confidentiality, and were requested to voluntarily participate in the study. Those who agreed to the terms and conditions signed the informed consent form. Skipping questions, as well as withdrawing from the study, was allowed at any time during the interview.
3. Results
The socio-economic and demographic profile of households were as follows: out of 986 households, 87% were from Kathmandu, 9% from Lalitpur, and 4% from Bhaktapur district; 62% were of Janajati ethnicity, 24% of Brahmin, 14% of Chettri, and 0.1% of Dalit; 59% were owners of the house; and the average monthly expenditure was USD $294 (±165) pre- and USD $322 (±178) post-GEQ (see
Supplementary Materials, Table S1; 1 USD = 109 Nepalese Rupees (NR), as of 5 January 2017).
Here, we present our major results under five different sub-headings. First, the coverage and use purpose of different water sources is described. Second, we estimated the household consumption of different water sources and analyzed the impact of the GEQ on the consumption. Third, we estimated the water consumption (LPCD), both general and stratified by the KUKL branches and wealth status. Fourth, we reported the household expenditure on water, both general and stratified by wealth status, and its relationship with water consumption. Finally, we identified the effect of the GEQ on water consumption (LPCD), including the association between other factors and water consumption.
3.1. Water Sources Coverage and Purpose of Use
In this study, all households used more than one or multiple sources (see
Supplementary Materials, Table S4).
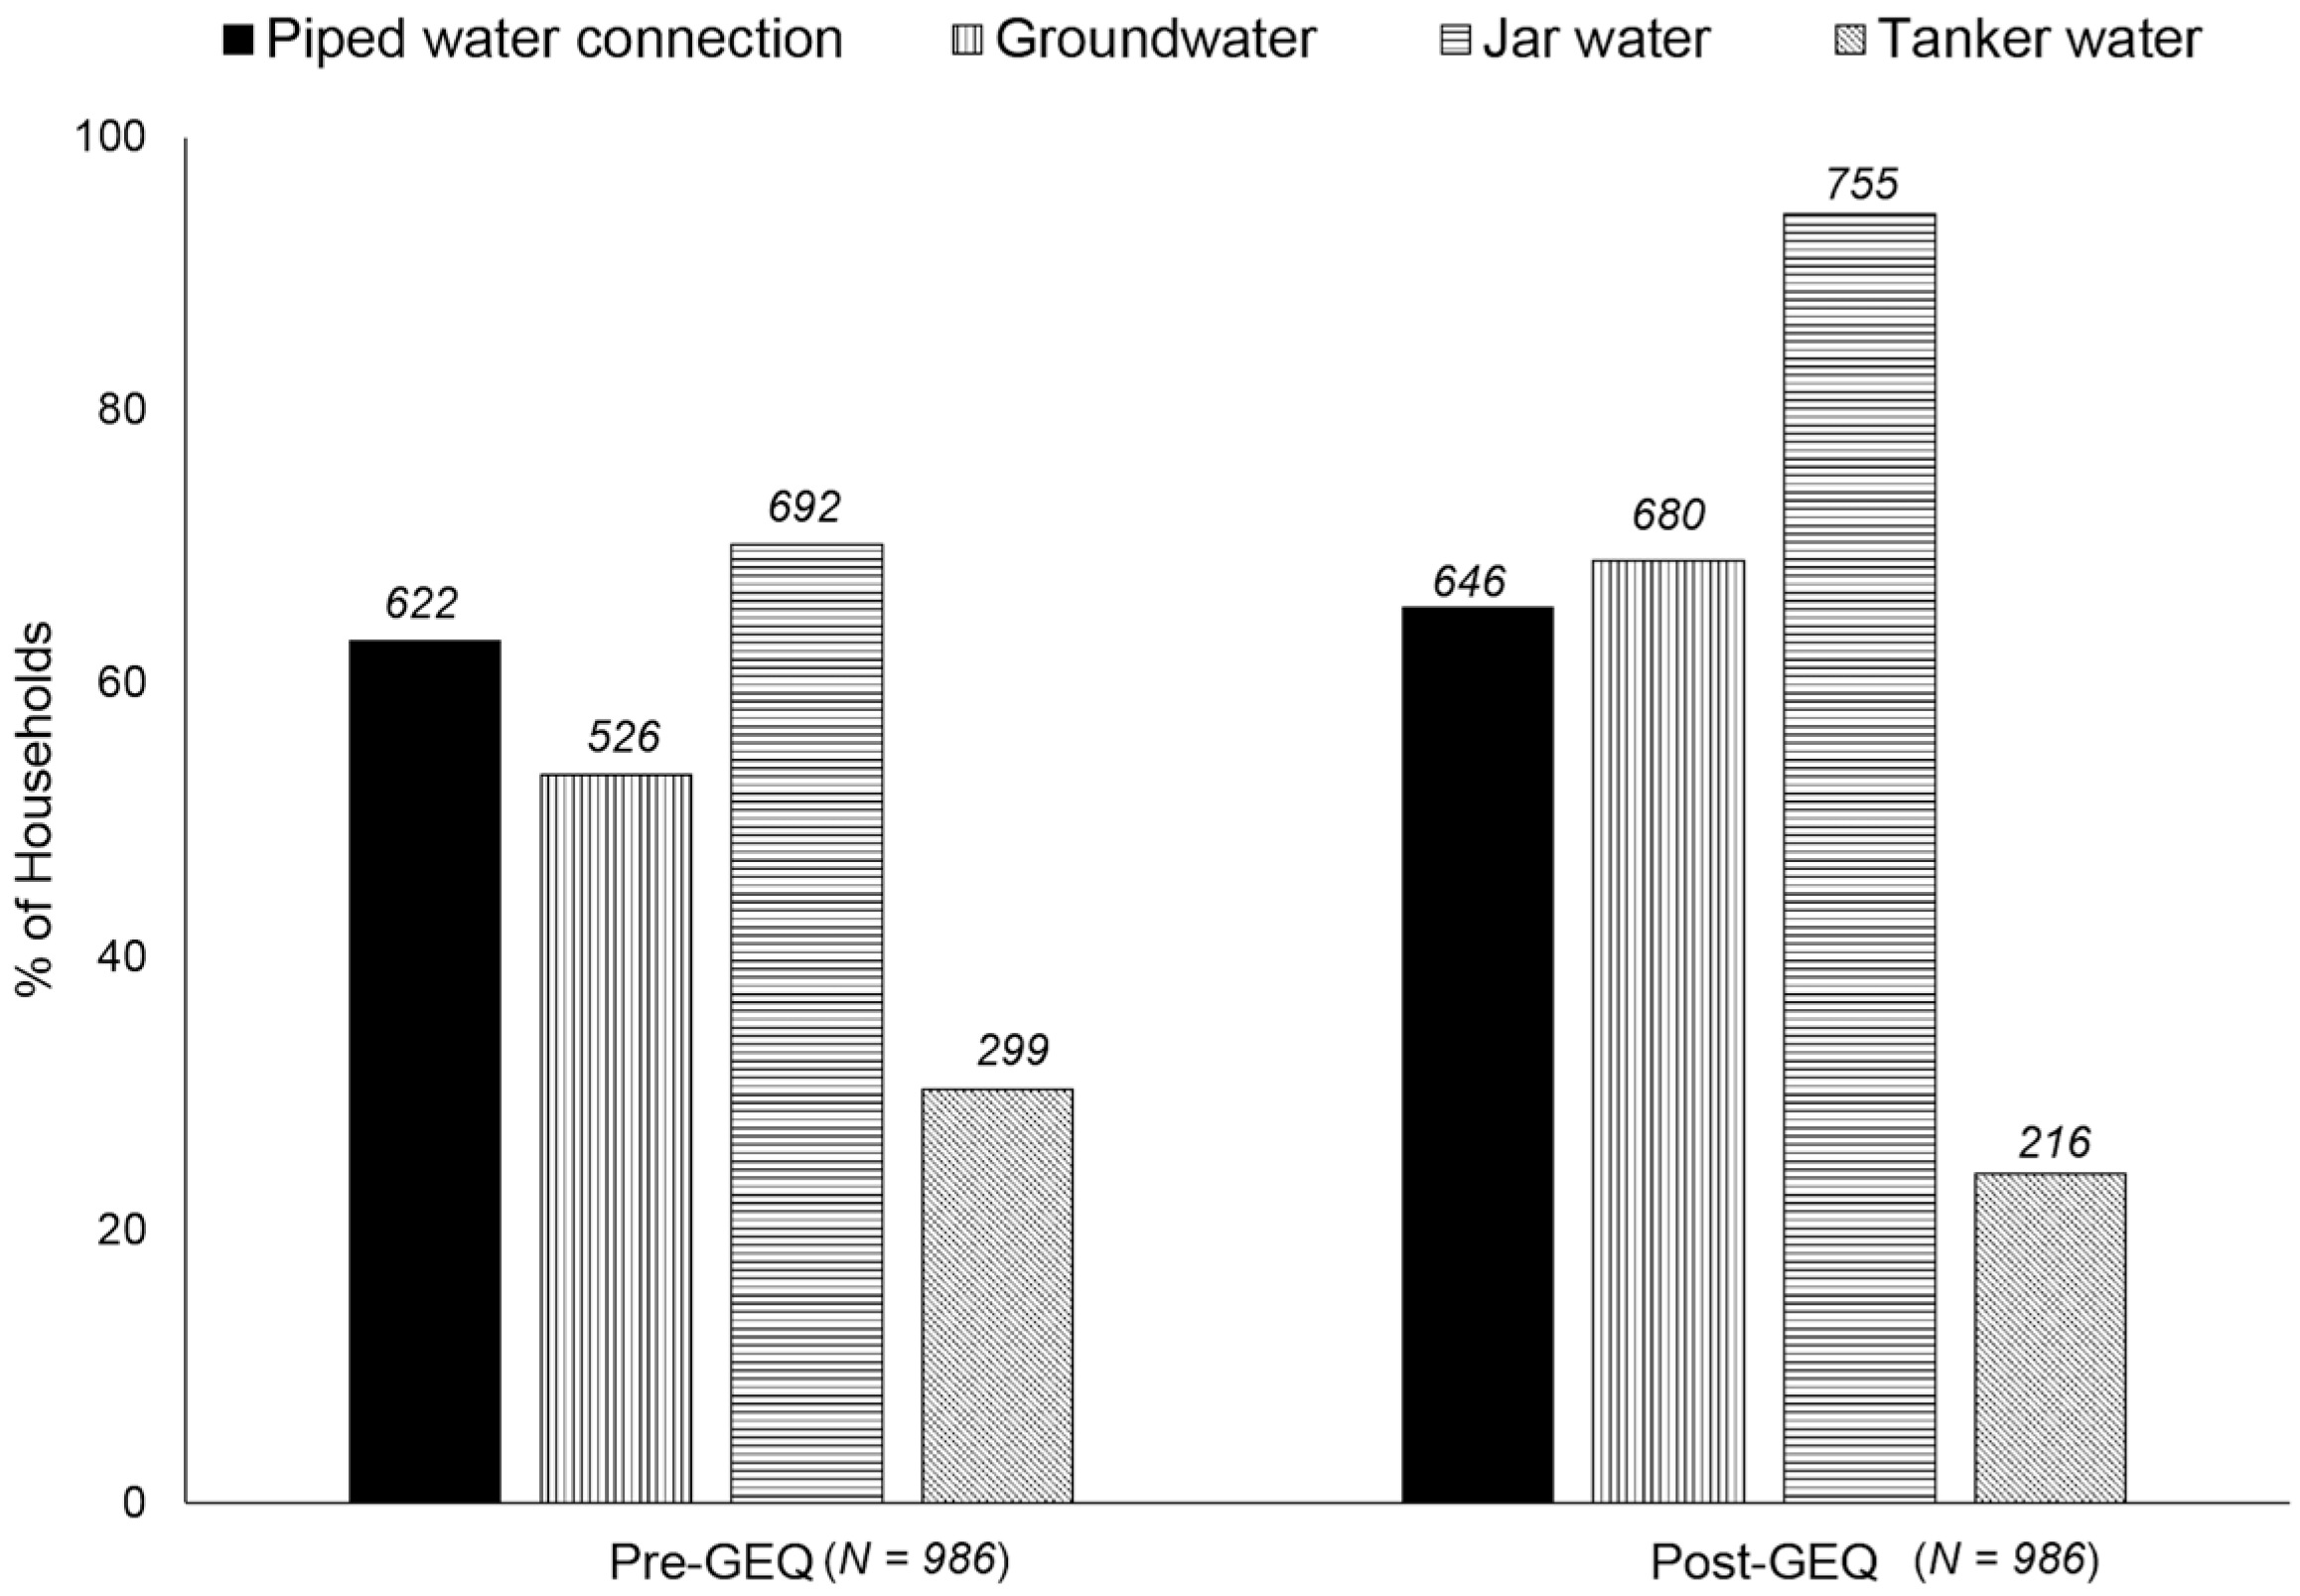
Figure 3 illustrates the coverage of different water sources, and
Table 1 shows the number of households using these sources for different purposes. Two thirds of the proportion of households in the valley had piped water connection and nearly the same proportion used groundwater. The percentage of households using jar water changed from 70% to 94% post-GEQ. A third of households were using tanker water. Almost all tanker water users used it for laundry and bathing; however, the number of households for drinking and cooking were also considerable. Sixty-two out of 524 groundwater users used it for drinking, and 118 for cooking, which left the majority using it for bathing and laundry (
Table 1). Surprisingly, around half of the jar water users used it for cooking as well.
3.2. Household Consumption from Different Water Sources and the Impact of the GEQ
3.2.1. Piped Water Consumption
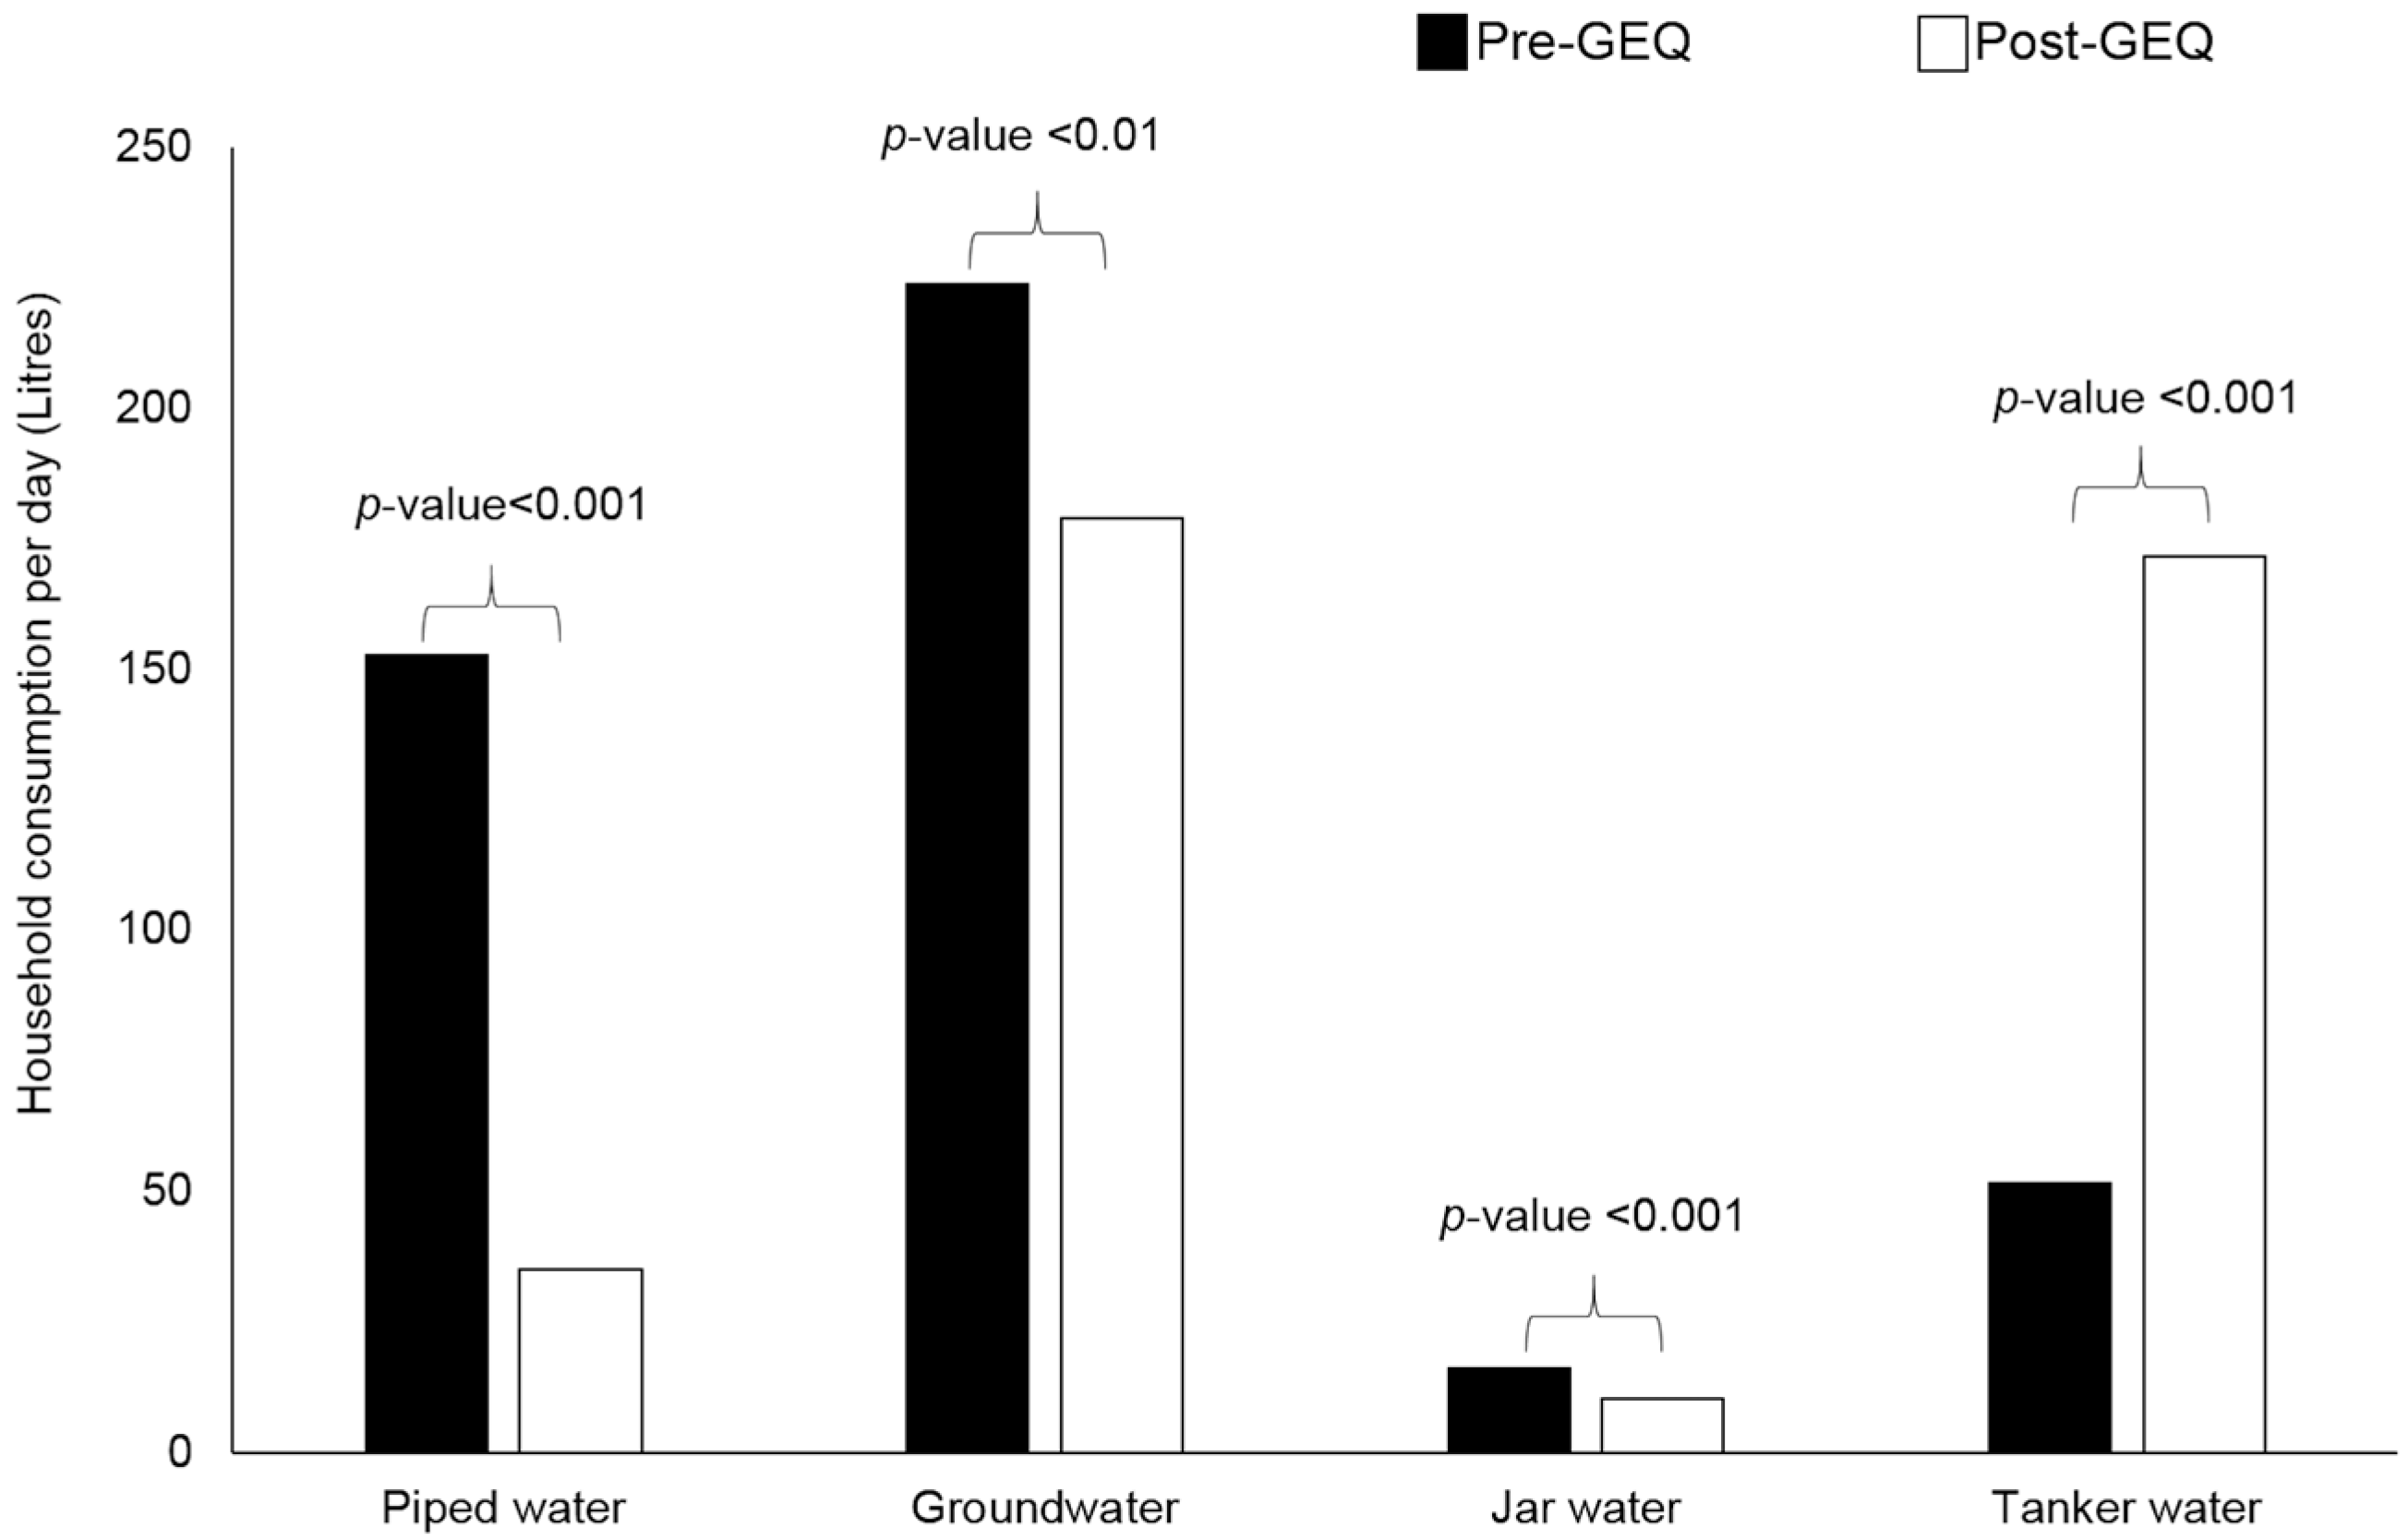
Pre-GEQ, the average piped water consumption by a household in a day was 153 L, post-GEQ it was 35 L (
Figure 4) and was supplied at an average of 4 and 2.3 h per week pre- and post-GEQ, respectively. More than 75% of households were receiving ≤4 h of weekly supply. Pre-GEQ, piped water consumption was significantly lower in households at the highest altitude rather than in the lowest, lower and higher altitude categories (
Figure 5). Piped water consumption at the lowest altitude was significantly higher than in the lower and higher altitudes categories as well (
Figure 5). However, post-GEQ, such discrepancies were not observed.
Table 2 provides the household piped water consumption at different KUKL branches. It varied widely across the KUKL branches from 70 L to 298 L pre-GEQ, where the highest amount was observed to be consumed at the Maharajgunj branch, and the least at the Lalitpur branch. There were no piped water connections in the areas we surveyed at the Kritipur branch. Post-GEQ, piped water consumption varied from 25 L to 51 L across the KUKL branches. The highest consumption was at the Mahankalchaur branch, and the lowest again was at the Lalitpur branch. Piped water consumption was significantly different between the KUKL branches in both pre- and post-GEQ periods.
3.2.2. Alternative Water Consumption
Groundwater consumption was on average 224 L per day and 179 L pre- and post-GEQ, respectively. Likewise, jar water consumption was 16 L and 11 L pre- and post-GEQ, respectively. Tanker water consumption was 52 L and 171 L pre- and post-GEQ, respectively. As piped water consumption varied across the different KUKL branches, this study examined its correlation with the consumption of water from other sources separately for the branches. Piped water consumption was negatively and weakly correlated (
p-value < 0.05) with groundwater, jar water and tanker water consumption in some branches pre-GEQ, whereas, in several branches post-GEQ (see
Supplementary Materials, Table S2).
3.2.3. Impact of the GEQ on Household Water Consumption from Different Sources
As shown in
Figure 4, piped water, groundwater, and jar water consumption significantly reduced post-GEQ; however, tanker water consumption significantly increased. Piped water consumption was drastically and significantly reduced at all branches post-GEQ (
Table 2). Regarding alternative water sources, groundwater consumption was significantly reduced at three branches, jar water was reduced at six branches, and tanker water consumption was reduced at one branch. However, tanker water consumption significantly increased in four of the KUKL branches (see
Supplementary Materials, Table S3).
Multilevel analyses were performed to identify the association of the GEQ occurrence with piped water, groundwater, jar water and tanker water consumption, separately, while controlling for wealth status. The occurrence of the GEQ was observed to affect water consumption from all of these water sources. Post-GEQ, piped water consumption (Intercept = 165; β = −111; p-value < 0.001); groundwater consumption (Intercept = 258; β = −50; p-value < 0.01); and jar water consumption (Intercept = 19; β = −6; p-value < 0.001) were reduced; however, tanker water consumption (Intercept = 78; β = 113; p-value < 0.001) increased.
3.3. Water Consumption (LPCD)
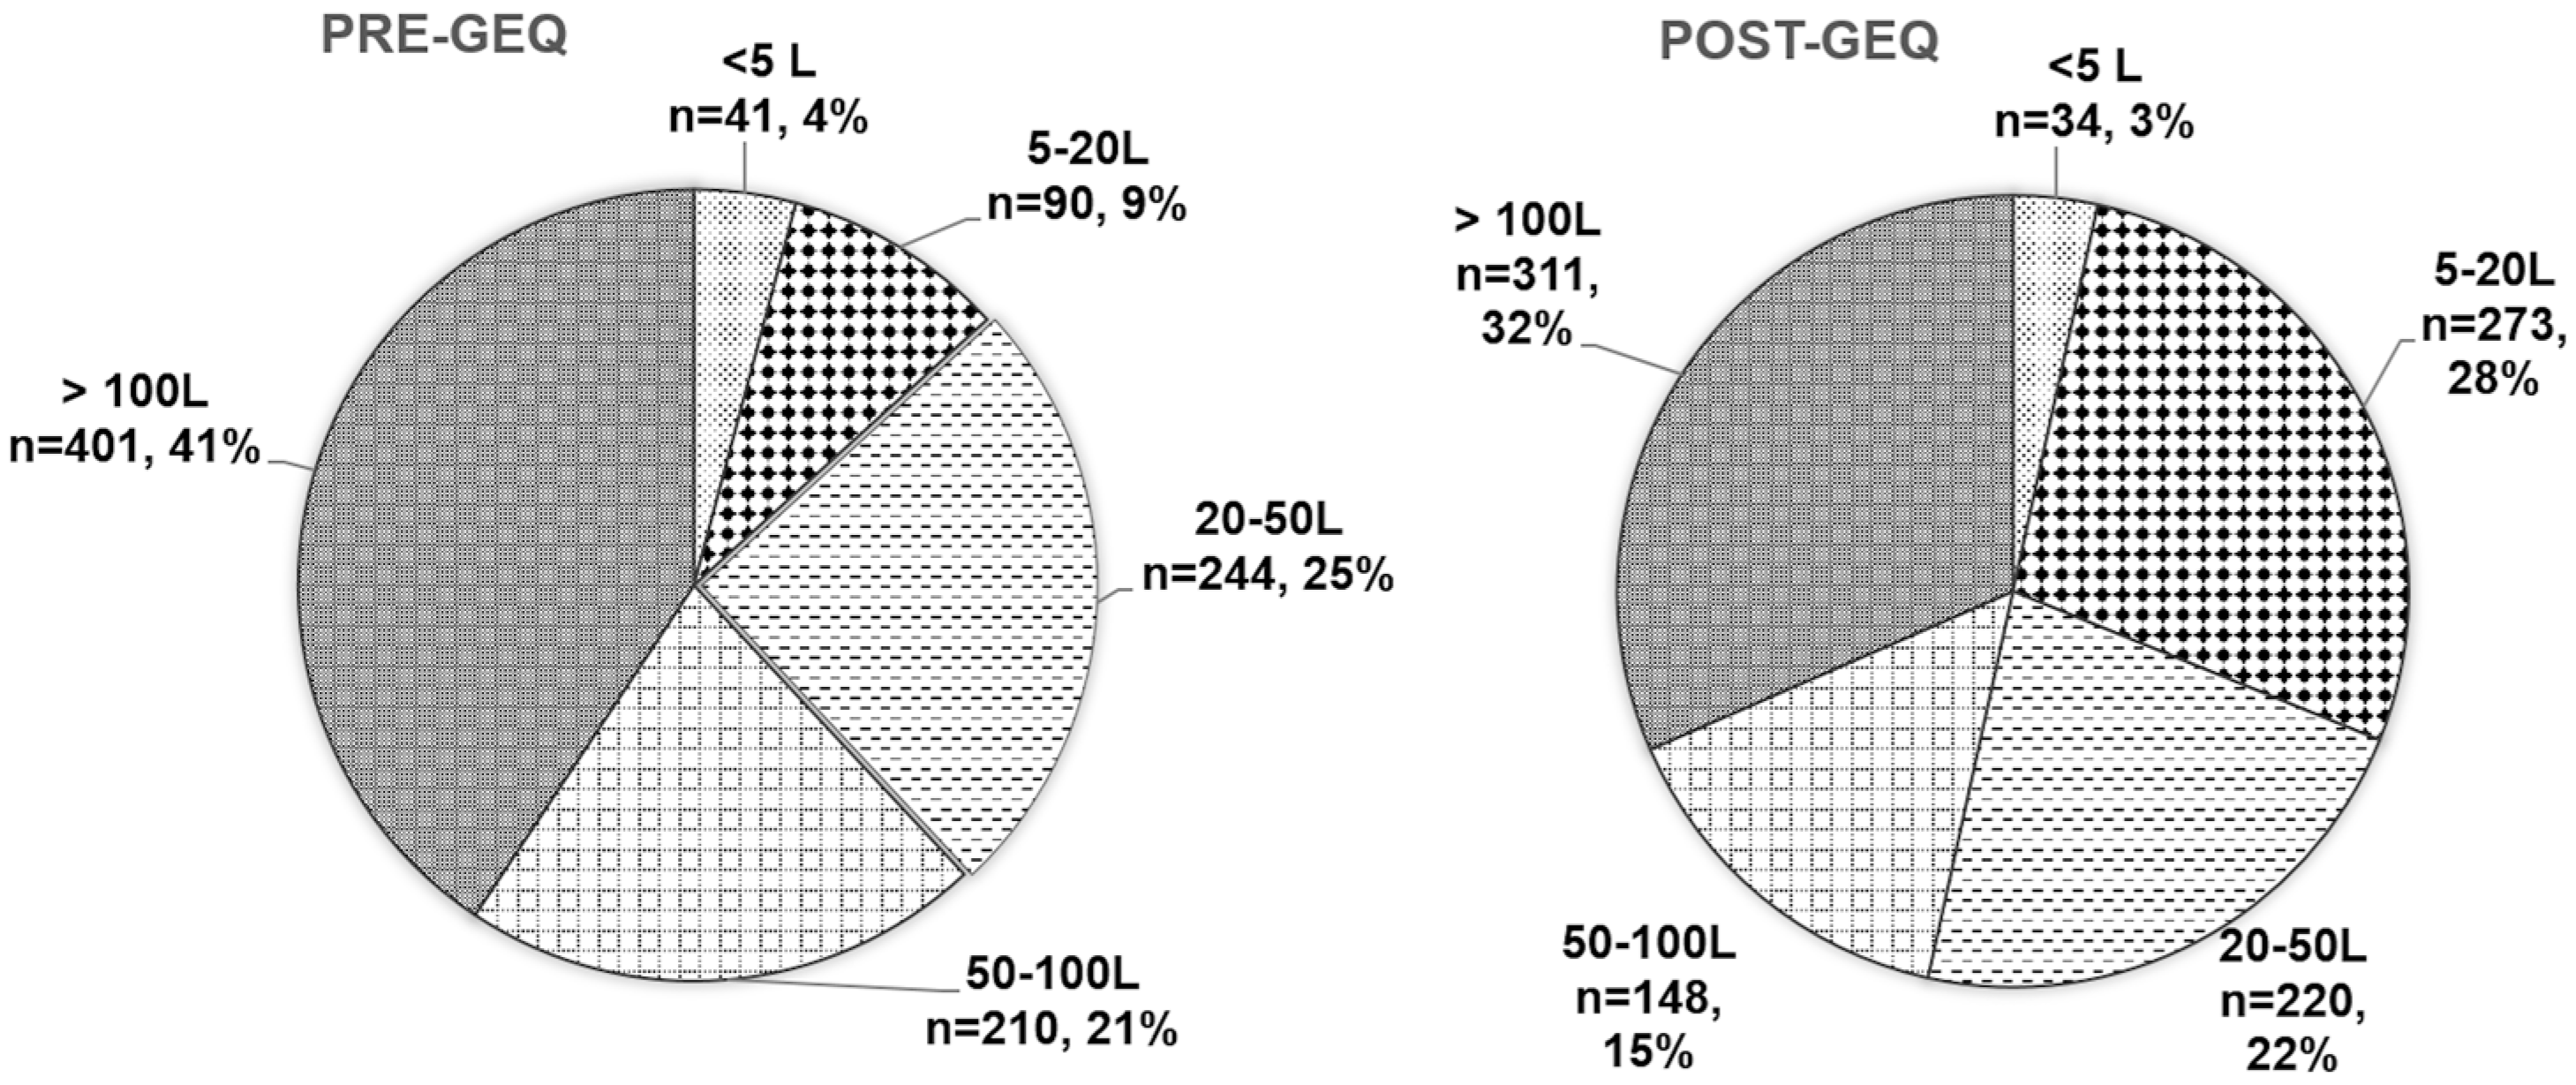
The average water consumption was 117 LPCD pre-GEQ, which was significantly reduced (
p-value < 0.05) to 99 LPCD post-GEQ. Based on a previous survey [
4], we categorized water consumption into 5 levels: <5 (no access); 5–20 L (basic access); 20–50 L (intermediate access); 50–100 L (between intermediate and optimal access); 100 and >100 L (optimal access) (
Figure 6). It is remarkable that, despite palpable water scarcity, 41% of households during pre-GEQ period and 32% during post-GEQ period had optimal access. However, post-GEQ, there was huge percentage shift in the proportion of households that had basic access; pre-GEQ, only 9% were at the basic access level, whereas, that value was 28% post-GEQ.
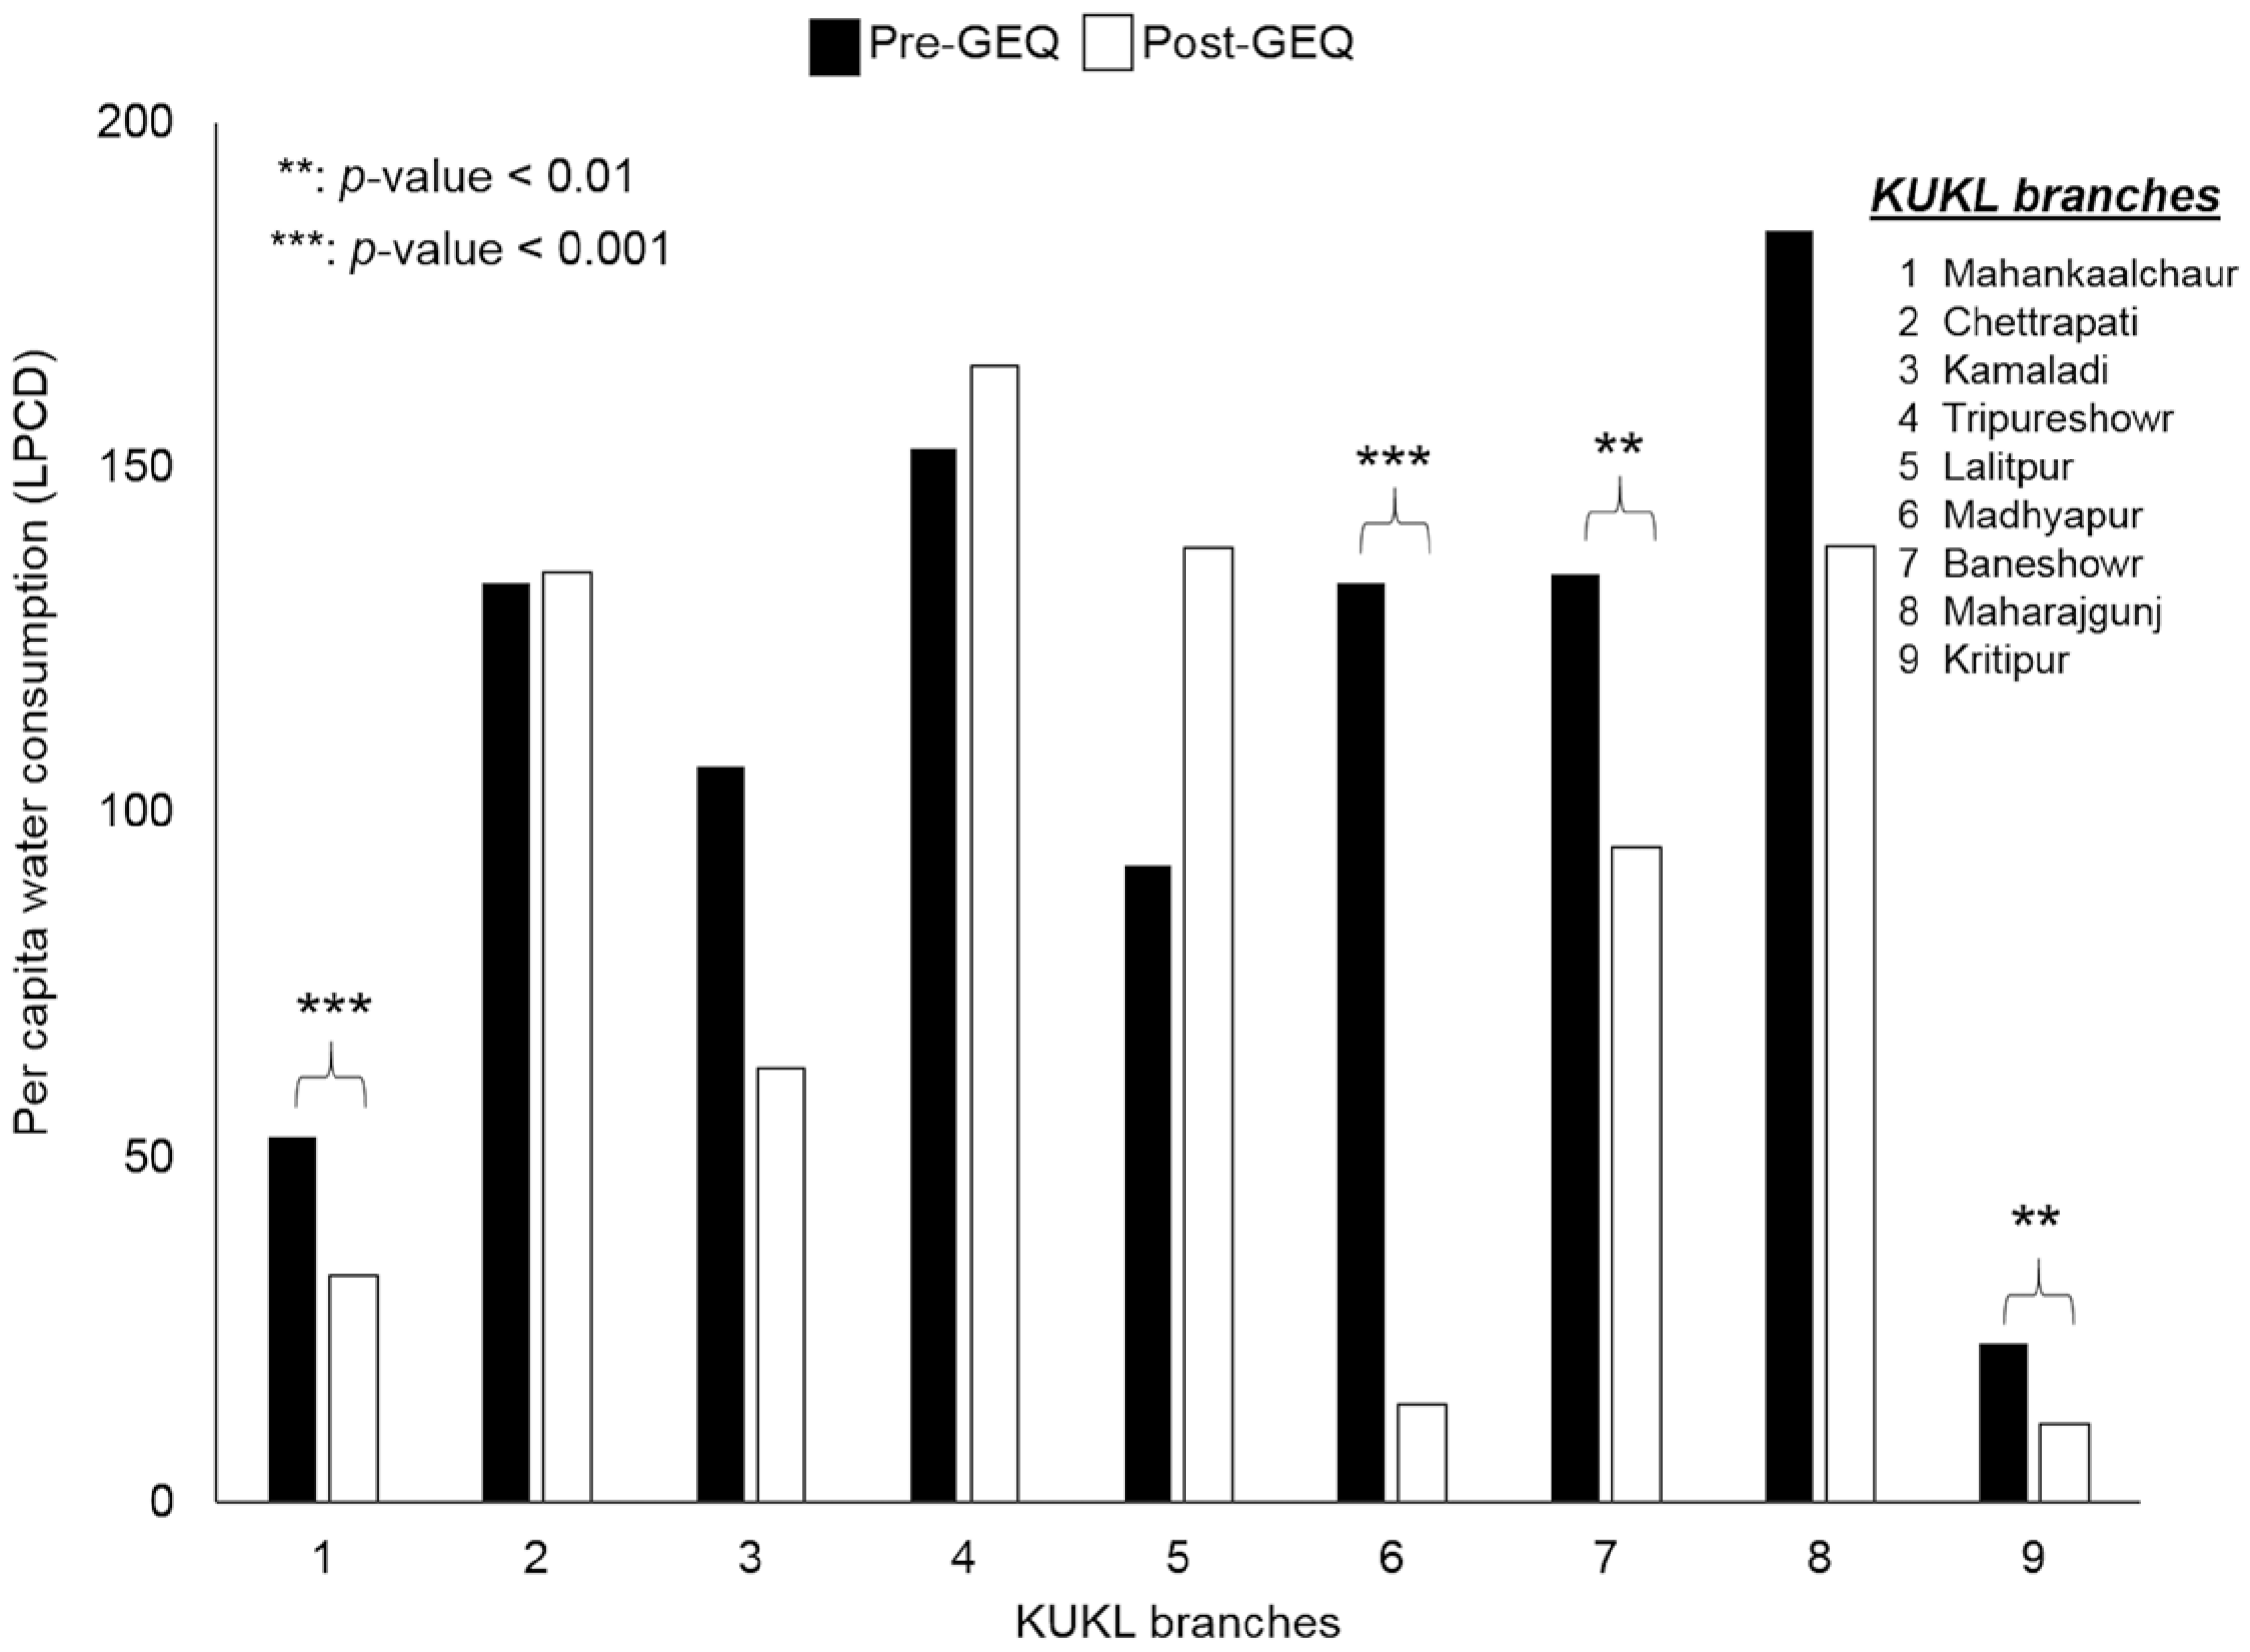
Figure 7 shows the water consumption across nine KUKL branches in the pre- and post-GEQ period, as well as a comparison between these two periods, and shows that it varied widely both in the pre- and post-GEQ period. Among the nine KUKL branches, water consumption was reduced in six branches post-GEQ, and a significant reduction was observed at four branches. Water consumption increased at the remaining three KUKL branches, but the increments were not statistically significant. While stratifying water consumption by wealth quintiles, during the pre-GEQ period, households in the rich category had the highest water consumption (
Table 3). The “very poor” category saw significantly lower water consumption than the “rich” and “medium” categories. During the post-GEQ period, water consumption was the highest in the “medium category” (
Table 3), where it was significantly higher in the “poor” and “medium” categories than in the “rich” category.
3.4. Household Water Expenditure
The monthly household water expenditure was calculated by combining the monthly cost for piped water, jar water, and tanker water. Pre-GEQ, the average (minimum [min]–maximum [max]) expenditure was USD $15 (0.5–96). The average (min-max) expenditure for jar water and tanker was USD $10 (0.4–36) and USD $18 (6–66), respectively. Post-GEQ, the average (min-max) expenditure was USD $18 (0.7–191). The average (min-max) expenditure for jar and tanker water was USD $9 (0.7–42) and USD $44 (6–169), respectively. The average household water expenditure was significantly increased in the post-GEQ period (p-value < 0.01). On average, 7.7% and 6.6% of the total household expenditure was spent on water pre-GEQ and post-GEQ, respectively.
The water expenditure for the very poor, poor, medium, rich, and very rich categories pre- and post-GEQ are shown in
Table 3. Pre-GEQ, expenditure was statistically similar between these categories, but post-GEQ, the very poor category were paying significantly less than that paid by the poor, and the medium category was paying significantly more than that paid by the very poor and rich categories. The percentage of total expenditure spent on water per month was the least in the very rich category during pre- and post-GEQ. It was 8.6%, 8.2%, 7.6%, 7.5%, and 6.9% during pre-GEQ and 5.7%, 8.8%, 8.6%, 5.0%, and 4.0% during post-GEQ in the very poor, poor, medium, rich, and very rich categories, respectively.
Table 3 shows the correlation between water consumption and monthly household water expenditure in different wealth status categories pre- and post-GEQ. In the pre-GEQ period, the very poor and medium categories had weak correlation; however, post-GEQ, although the very poor and poor categories had significant weak correlation, the medium, rich, and very rich categories had strong correlation. The correlation went stronger from the very poor to the very rich categories.
3.5. Factors Affecting Water Consumption (LPCD)
The GEQ occurrence, piped water connection, groundwater use, jar water use, tanker water use, wealth status, and the KUKL branches were tested for their relationship with water consumption (LPCD) (
Table 4). In this model, the GEQ was considered as an important determinant. The direction of the relationship between the GEQ and water consumption was negative, which indicated that the occurrence of the GEQ was associated with decreased water consumption. However, this association did not achieve statistical significance. Similarly, when compared to the very rich wealth status, the rich, poor, and very poor saw lower water consumptions. Compared to the Kritipur branch, all branches saw higher water consumptions, but the Mahankalchaur branch consumed a lower amount. However, the association of water consumption with wealth status and the KUKL branches did not achieve statistical significance.
The water related factors—piped water connection, groundwater use, and tanker water use—were associated with increased water consumption, whereas jar water use was associated with decreased water consumption. Water consumption was 38 L less in households that did not have piped water connection (95% Confidence Interval = −54 to −22, p-value < 0.001) compared to the households that had a connection. Likewise, water consumption was 72 L and 107 L less in households that did not use groundwater (95% Confidence Interval = −88 to −56, p-value < 0.001) and tanker water (95% Confidence Interval = −118 to −80, p-value < 0.001), respectively, than the households that used them. Conversely, water consumption was 29 L more in households that did not use jar water (95% Confidence Interval = 10 to 50, p-value = 0.004) than the households that used it.
4. Discussion
This study showed that piped water, groundwater, jar water and tanker water are the major domestic water sources in the municipal areas of the valley. The current coverage (post-GEQ) of piped water (66%) and groundwater (69%) are quite similar to the coverage in 2009 [
9]. However, the use of jar water increased profusely from 24% [
9] to 94% within a span of six years. This increasing dependency on jar water could be due, in part, to the public perception of jar water as fit for drinking [
26] and on the degrading quality of piped water [
27]. Although less than 50% of households used tanker water in this study, we observed its growth (from 10% to 24%) when comparing these results with those of the ADB [
9]. These results indicated that the water market was well established in the valley within a period of six years and that water buying has been a widely practiced coping strategy as reported by Pasakhala et al. [
15]. In contrast to 26% of households in 2009 [
28], our study observed that none of the households (see
Supplementary Materials, Table S4) relied on piped water alone. These wide differences between the studies, conducted within a short time span, suggests that households’ dependency on different water sources changes swiftly in water scarce incessantly populating areas, and that real situations should be scanned properly before planning any related projects or policies.
The performance of the utility was poor and has always been criticized [
9]. Our study was similar to other reports [
9,
17], which showed that the duration of the piped water supply pre-GEQ was very short (four hours weekly), and which further shrank to 2.3 h post-GEQ. Piped water consumption varied depending upon the altitude of the location and the KUKL branches. Despite the achievement of the United Nations Millennium Development Goals that targeted an increase in households using safe drinking water sources [
29], the disparity in piped water consumption by locations, and the inevitable critically short hours of supply hindered the resolution of the water problem in the urban center of the valley. Our results clearly indicated that there were performance differences between the KUKL branches and this study is the first of its kind to prove such uneven consumption distribution. These results provide the KUKL with the priority areas where performance need to be improved to ensure equality across water supply areas. This information is even more meaningful and vital since we are on the brink of Melamchi Water Supply Project (MWSP) Phase I implementation. MWSP was designed to end the chronic water shortage of the valley through inter-basin water transfer; moreover, during Phase I, 170 MLD of fresh water will be diverted from Melamchi River in the Sindhupalchowk district [
8].
The occurrence of the GEQ was a determinant in the reduction in piped water consumption, which corresponded to a recent study that projected post-GEQ reductions of 28%, 30%, and 18% in the capacity of water distribution pipe networks of Lalitpur, Kathmandu, and Bhaktapur districts, respectively [
21]. Our study observed a drop in the number of households that used piped water for laundry and bathing (
Table 1), which could be attributed to the decline in its use for water consuming purposes because the amount being supplied was scanty. It is true that the impact of natural disasters is larger on developing regions due to the fragility of infrastructures when compared to developed regions. However, the delay in resuming the KUKL’s performance, as indicated by the reduced number of hours of supply and consumption amount, even nearly a year post-GEQ, put the residents into avoidable water scarcity and economic burden. These results recommend the construction of robust water infrastructure in earthquake prone areas, as well as quick performance resumption to avoid preventable burdens on their residents.
Household piped water consumption was negatively correlated with groundwater, tanker water and jar water consumption at a few of the KUKL branches pre-GEQ (see
Supplementary Materials, Table S2); however, post-GEQ almost all branches showed negative correlation. This could be attributed to the drastic reduction in piped water consumption post-GEQ because use of alternative water sources is a coping strategy [
15,
17] to supplement the inadequate piped water amount. Similar to the impact on piped water consumption, the occurrence of the GEQ affected groundwater and jar water consumption reduction. Furthermore, the occurrence of the GEQ was a determinant of increase in tanker water consumption, which was relatively expensive compared to the monthly utility bill [
17]. These results indicated an increase in burden from an alternative water source management and economic load perspective when the already inadequate piped water supply was further stressed owing to unlikely events such as earthquakes.
Our results showed that the average water consumption (LPCD) was 117 L pre-GEQ and 99 L post-GEQ. This figure was higher than reported by several previous studies [
12,
13,
14,
15]. Urbanization, which is inevitable with time, can also have attributed to this rise in water consumption. With urbanization, housing is not only growing but diversifying, with the majority of houses incorporating plumbing systems in bathrooms and kitchens. Households equipped with a higher level of plumbing system consume more water [
9] and housing type is another determinant of residential water consumption [
30]. Household income is also another factor [
30,
31] that is supposed to increase with time.
The ADB [
9] reported higher water consumption in households with private wells in the compound. Aside from this study, the determinants of water consumption have to our knowledge not been discussed in previous research. In our study, piped water connection, groundwater use, and tanker water use were associated with an increase and jar water use with a decrease in water consumption. The main purposes of the groundwater and tanker water were for bathing and laundry (
Table 1), which needed large volumes of water. In contrast, households that could not use these sources might have reduced the frequency since such reduction was a coping measure in the valley [
15]. Household that used piped water had additional water surplus, which could be attributable to a small increase in water consumption among the users. However, a decrease in water consumption among households using jar water could be linked to cost. Jar water is the most expensive out of the different water sources and consumers possibly reduce or minimize the quantity used (mainly for cooking) for saving costs. The GEQ occurrence was not observed as a determinant of water consumption in this study, despite its significant association with household water consumption from individual water sources. Similarly, despite the wide variation in water consumption across the KUKL branches, it was not a significant factor. This could be because households struggle to maintain their daily water supply as intact as possible by accessing multiple sources.
Pattanayak et al. [
17] identified five coping behaviors of the valley residents against water scarcity: collecting, pumping, treating, storing, and purchasing, and the coping cost, which arose from these behaviors, was 1% of residents’ total income. In our study, the percentage of total expenditures on water per month was 7.7% pre-GEQ and 6.6% post-GEQ. If we consider household expenditure to be equivalent to income, then our results are higher than those reported by Pattanayak et al. [
17]. The total household water expenditure reported in our study excludes other coping costs such as collecting water, pumping, treating and storing, which indicated that the current coping cost must be a large figure. While the water market is an inevitable coping strategy in the valley, the higher water expenditure and higher water consumption in wealthier groups indicated that wealth could help sustain water scarcity. The proportion of water expenditure to total monthly expenditure was the least for the very rich category and higher in less wealthy categories pre- and post-GEQ. In this study, the “very poor” category had significantly lower consumption compared to the “poor” and “medium” categories pre-GEQ as realized by Jha [
12]. Post-GEQ, we observed positive moderate to strong correlation between the monthly water cost and water consumption (
Table 3). All these situations reveal existing inequality in water consumption and inequitable affordability between socio-economic groups. The tariff design is in the modification phase for MWSP Phase I implementation and these results may be helpful in aiding equity and equality.
5. Conclusions
Domestic water consumption in the urban area of the Kathmandu Valley is a complex phenomenon both pre- and post-GEQ. Multiple water sources are being used with increasing reliance on the water market (jar water and tanker water). Despite the unexpectedly low performance of the utility in terms of supply duration and a disparity in the quantity consumed at different altitudes and at the KUKL branches, the households had a high preference for piped water. Post-GEQ, domestic water consumption faced a reduction in quantity in piped water, groundwater or jar water consumption, but faced expansion in tanker water consumption and in the monthly expenditure on water. Even during palpable water scarcity, households managed to maintain the level of optimal access in terms of average water consumption (~100 LPCD). However, similar to many other developing countries, inequity in affordability exists, as wealthier groups pay less and poorer groups pay more, regardless of the occurrence of the GEQ.
The utilization of piped water, groundwater or tanker water were factors in incremental water consumption (LPCD) with a larger effect from groundwater and tanker water usage; however, the utilization of jar water was associated with a decrease in water consumption. The KUKL branch and wealth status did not account for contribution in water consumption. The occurrence of the GEQ was associated with a decrease in the consumption of piped water, groundwater and jar water, but had an increase with that of tanker water. We are on the brink of completing and implementing the MWSP Phase I, which has the main aim of meeting the soaring domestic water demand. Hence, these different aspects of domestic water consumption, including the effect of earthquake and the identification of contributing factors for water consumption (LPCD), might prove beneficial for planning effective water quantity allocations in the valley. Future studies investigating the contribution of water saving technologies or water conserving behavior on water consumption (LPCD) will also assist in developing specific water reduction strategies and consequently advocate for them.


 ,
, 


