Article

Size Distribution, Surface Coverage, Water, Carbon, and Metal Storage of Thermokarst Lakes in the Permafrost Zone of the Western Siberia Lowland

by
Yury M. Polishchuk
1,2,
Alexander N. Bogdanov
1,
Vladimir Yu. Polishchuk
3,4,
Rinat M. Manasypov
5,6,
Liudmila S. Shirokova
6,7,
Sergey N. Kirpotin
5 and
Oleg S. Pokrovsky
7,*
1
Ugra Research Institute of Information Technologies, Mira str., 151, Khanty-Mansiysk 628011, Russia
2
Institute of Petroleum Chemistry SB RAS, 4 Akademichesky av., Tomsk 634021, Russia
3
Institute of Monitoring of Climate and Ecological Systems SB RAS, 10/3 Akademichesky av., Tomsk 634021, Russia
4
Tomsk Polytechnic University, Lenina av., 30, Tomsk 634004, Russia
5
BIO-GEO-CLIM Laboratory, Tomsk State University, Lenina av., 36, Tomsk 634004, Russia
6
Federal Center for Integrated Arctic research, Institute of Ecological Problem of the North, 23 Nab Severnoi Dviny, Arkhangelsk 163000, Russia
7
GET UMR 5563 CNRS University of Toulouse (France), 14 Avenue Edouard Belin, 31400 Toulouse, France
*
Author to whom correspondence should be addressed.
Water 2017, 9(3), 228; https://doi.org/10.3390/w9030228
Submission received: 13 January 2017 / Revised: 12 March 2017 / Accepted: 14 March 2017 / Published: 21 March 2017
(This article belongs to the Special Issue The Use of Remote Sensing in Hydrology)

Abstract

:
Despite the importance of thermokarst (thaw) lakes of the subarctic zone in regulating greenhouse gas exchange with the atmosphere and the flux of metal pollutants and micro-nutrients to the ocean, the inventory of lake distribution and stock of solutes for the permafrost-affected zone are not available. We quantified the abundance of thermokarst lakes in the continuous, discontinuous, and sporadic permafrost zones of the western Siberian Lowland (WSL) using Landsat-8 scenes collected over the summers of 2013 and 2014. In a territory of 105 million ha, the total number of lakes >0.5 ha is 727,700, with a total surface area of 5.97 million ha, yielding an average lake coverage of 5.69% of the territory. Small lakes (0.5–1.0 ha) constitute about one third of the total number of lakes in the permafrost-bearing zone of WSL, yet their surface area does not exceed 2.9% of the total area of lakes in WSL. The latitudinal pattern of lake number and surface coverage follows the local topography and dominant landscape zones. The role of thermokarst lakes in dissolved organic carbon (DOC) and most trace element storage in the territory of WSL is non-negligible compared to that of rivers. The annual lake storage across the WSL of DOC, Cd, Pb, Cr, and Al constitutes 16%, 34%, 37%, 57%, and 73%, respectively, of their annual delivery by WSL rivers to the Arctic Ocean from the same territory. However, given that the concentrations of DOC and metals in the smallest lakes (<0.5 ha) are much higher than those in the medium and large lakes, the contribution of small lakes to the overall carbon and metal budget may be comparable to, or greater than, their contribution to the water storage. As such, observations at high spatial resolution (<0.5 ha) are needed to constrain the reservoirs and the mobility of carbon and metals in aquatic systems. To upscale the DOC and metal storage in lakes of the whole subarctic, the remote sensing should be coupled with hydrochemical measurements in aquatic systems of boreal plains.

1. Introduction

The quantification of the abundance, size distribution, and water storage of lakes and reservoirs has critical importance for the evaluation of carbon and nutrient storage, and the potential of greenhouse gas (GHG) exchange between the Earth’s surface and the atmosphere. For these reasons, several detailed studies have documented the lake number and size distribution on the scale of our planet [1,2,3]. Thus, the use of medium resolution Landsat-7 images has allowed the creation of a global database of lakes and water reservoirs, including all lakes larger than 0.2 ha or 45 m × 45 m [3,4]. The total number of lakes was estimated as being 117 million, with an overall surface area of 5 × 10⁶ km2 (500 × 106 ha), which corresponds to 3.7% of the non-glaciated land area. The number of small lakes (0.2–1 ha) is around 90 million, whereas their overall area is equal to 25 × 106 ha, which is only 5% of the overall lake surface coverage. The small lakes exhibited a deviation from the general power dependence between the lake size and the lake number [4,5]; as a result, the extrapolation of power law to smaller lakes may overestimate the lake number [3]. At the same time, the small lakes subjected to full freezing in winter or evaporation in summer, with a short residence time of water, play a crucial role in the integration of the carbon and other elements transported from the watershed [6,7,8], which is particularly important in high latitude regions, which are the most vulnerable to climate change [9,10].
The Arctic and subarctic permafrost-bearing regions exhibit the maximal changes in the terrestrial freshwater budget, although the hydrological responses to environmental changes strongly differ across the boreal and subarctic regions of the subarctic [11]. In particular, in the tundra, continuous permafrost development strongly influences water fluxes and storage, whereas in boreal plains, slow surface and subsurface water movement produces extensive wetlands [11]. Once the permafrost becomes discontinuous to sporadic in the south, this allows significant groundwater feeding of rivers [12] and, presumably, lakes [13].
In this regard, the boreal and tundra plains are extremely important for a lake inventory study because of the high coverage of the watershed area by these lakes (up to 70% in some western Siberian river watersheds [14,15]), and fast temporal dynamics of thermokarst lake landscapes, reflecting on-going climate change in their watersheds [16,17,18,19,20]. The latter brings about a shorter residence time of lakes, whose size changes, especially at southern latitudes, due to the disappearance of sporadic and isolated permafrost. It is also worth noting the primary role of lakes in controlling greenhouse gas exchange with the atmosphere, both in permafrost-free [21,22] and permafrost-bearing regions [9,23,24,25,26].
Over the past decades, the formation of thermokarst lakes and thaw ponds due to permafrost degradation was documented in Alaska, Canada, Europe, and Siberia [27,28,29,30,31]. The majority of available studies had a rather limited geographic coverage (<10,000 km2, [16,32,33]), or described relatively small regions within larger territories [29]. The high resolution studies, down to 0.1 ha lake size, dealt with even smaller territories (700 km2 in ref. [34]; 4 km2 in ref. [35]; 1.4 km2 in ref. [36]), whereas the large geographic coverages, on the scale of one hundred thousand to million km2, were limited to large lakes (>5 ha in North American Arctic, ref. [37,38] and 10–40 ha in western Siberia, ref. [39,40]).
Several studies of thermokarst lakes in Alaska, Yukon, Scandinavia, and Siberia, were focused on monitoring the change in the lake area over the past 30–40 years, within relatively small regions [18,29,41,42,43,44,45]. Remote sensing studies of the permafrost zone of western Siberia demonstrated that the number of newly formed small thermokarst lakes (0.5–5 ha) over the past three decades exceeds, by a factor of 20, the number of large lakes which tend to disappear during the same period [46]. Recently, the dynamics of the number and surface area of thermokarst lakes in the discontinuous permafrost zone of western Siberia, over the period of 1973 to 2009, has been studied within the watersheds of the Nadym and Pur rivers [47]. According to these authors, the temporal evolution of large size (>10 ha) lakes, whose number constituted 78%–85% of all lakes, exhibited a variation within 10%. The size distribution of thermokarst lakes followed the power law, both in eastern [30] and western [47,48] Siberia. In particular, Polishchuk et al. [48] presented the results of the number of appearing and disappearing lakes in western Siberia between the 1970s and the present time, and the laws of statistical distribution of very small lakes (<0.5 ha) on several test sites of the western Siberian Lowland (WSL). In contrast, the present study encompasses a much larger territory of western Siberia and provides, for the first time, a full inventory of large to small lakes (>0.5 ha).
The main goal of the present study was to establish the law of the lake number and area distribution for the whole WSL territory and to bring together the hydrology and hydrochemistry using available data on lake depth and carbon and metal concentration in the lake water. Towards this goal, we classified and analyzed medium resolution Landsat-8 scenes, which provided complete coverage of the WSL (105 × 106 ha or 1.05 million km2). The first specific objective of this study was to increase the resolution of the lake size to 0.5 ha for the whole territory of permafrost-affected WSL, in order to compare the results with the global database [3]. Indeed, in view of the disproportionally high importance of small thermokarst water bodies relative to medium and large lakes in GHG emission and C storage [49,50,51], a rigorous quantification of the number and area of thermokarst lakes is very timely. The second objective of this work was to assess the water, carbon, and metal storage in thermokarst lakes. Recent progress in the quantification of depth, and area and lake size-averaged concentrations of major and trace elements in western Siberian thermokarst lakes [49,50,52,53,54], allows a first-order evaluation of the water and element stocks in lakes and a characterization of the role of lakes in element storage, relative to rivers draining the same territory.

2. Materials and Methods

2.1. Study Area

The studied region is located within a tundra and forest-tundra zone of the northern part of the western Siberia lowland (1.05 × 10⁶ km2). In the northern part of the WSL, the sporadic, discontinuous, and continuous permafrost zones share 31.7%, 29.1%, and 39.2% of the overall territory, respectively (Figure 1). The mean annual temperature (MAT) ranges from −0.5 °C in the permafrost-free region (Tomskaya region) to −9.5 °C in the north (Yamburg), and the annual precipitation ranges from 400 to 460 mm. For the period of the end of July–August in the central part of the studied zone (Novuy Urengoy), the average low daily temperature was 17.4 °C and 10.9 °C in 2013 and 2014, respectively. The average high temperature was 23.4 and 14.9, respectively. A detailed physico-geographical description, hydrology, lithology, and list of the soils can be found in earlier works [55,56] and in our recent limnological and pedological studies [50,53,54,57]. The WSL has rather homogenous landscape conditions (palsa peat bogs, forest-tundra, and polygonal tundra), lithology (Pliocene sands and silts), soil cover (1–1.5 m thick peat, half of soil profile is frozen), and runoff (200–250 mm·year−1), across a large gradient of permafrost coverage [58,59,60].
The bioclimatic sub-zones of permafrost-affected WSL regions gradually change northward, from the northern taiga zone (38 × 106 ha) to forest tundra (13 × 106 ha), southern tundra (30 × 106 ha), and northern tundra (24 × 106 ha). A detailed GIS survey of the WSL allowed the quantification of the regional distribution of major wetland types and complexes [56]. According to those authors, the sporadic permafrost zone, north of the Ob River (61°–63° N), is dominated by sphagnum bogs with pools and an open stand of trees with abundant forested (treed) shrubs- and moss-dominated mires. The discontinuous permafrost zone (63° to 67° N) of the forested tundra and southern tundra essentially comprises high palsa and flat palsa mires, mixed with palsa-hollow and pool-hollow patterned mires. Flat-palsa and hollow-pool flat-palsa bogs are also abundant in this region. Finally, further to the north, within the continuous permafrost zone of the southern and northern tundra (67°–73° N), the landscape is dominated by patterned (hollow and hollow-pool) flat-palsa bogs, polygonal mires combined with grass and moss-dominated mires [56]. Thermokarst lakes are highly specific water bodies of the permafrost zone of the WSL: they have a shallow depth and are rarely connected to the hydrological network [61]. Most lakes of the northern part of the WSL freeze solid in winter and have frozen sediments at their bottom throughout the year [54]. The region is dominated by the presence of thermokarst lakes having a <100 ha surface area [42,62,63].
The lakes are located within peat flat-mound bogs (ridge-hollow complex, palsas, and polygonal tundra); the bottom sediments of the lakes are dominated by peat detritus. An active thermokarst occurs due to the thawing of syngenetic and epigenetic segregation ice, ice wedges, and ice layers in the deep (>2 m) horizons, and is primarily due to the ice thawing of the active layer (<2 m). The thermokarst activity produces depressions, subsidences, and ponds, which are usually separated by flat mound peat bogs up to 2 m in height [64]. The largest thermokarst lakes that are located within the peat bog are km-size, with a depth of 0.5–1.5 m [64,65]. The overwhelming majority of lakes in all three permafrost-bearing zones of the WSL (sporadic, discontinuous, and continuous) have a thermokarst origin, i.e., thawing of frozen peat and clay surface horizons [42,53,61,66]. As a result, most thermokarst lakes of the WSL exhibit quite a shallow depth, ≤1 m, in contrast to the deeper lakes of other Arctic regions, originating from surface disturbance, the melting of ground ice, and ice wedges (e.g., ref. [67]).

2.2. Remote Sensing Analysis

Satellite imagery from a Landsat-8 Operational Land Imager (OLI, with 30 m resolution), available at USGS Global Visualization Viewer [68], were used to map the lake distribution. We used medium-resolution Landsat-8 images collected at the end of July–August 2013–2014. This period corresponds to the minimal coverage of the territory by lakes and minimal seasonal variation of the lake water level. Besides, this is the period of total disappearance of ice coverage throughout all of the studied area. The sampling of the lake water and lake depth measurements was also performed during this period of the year. Note that, from the view point of optical remote sensing, there is no difference between thermokarst and non-thermokarst lakes, because their reflection yield for Landsat-8 OLI is similar. However, according to published expert estimations of several zones of the WSL [42], the majority of lakes on the WSL are of thermokarst origin.
For the total territory of 1.05 million km2, we superposed 134 images (Figure 1). We used not only the images with <10% of cloud, but all of the images that were useful to fill the gaps in the coverage. Nevertheless, for the mosaic, only the cloudless parts of the images were used. In the case where several images were available for the same territory, the one which had the lowest cloud coverage in the middle of the summer was used. The mosaic consisted of images taken in 2013 and 2014, which were combined because the single year data could not provide full coverage of the territory.
The river waters were excluded from the analyses via the creation of the river mask. The data of the river location were taken from national river water cadasters and open street maps. The open ocean and marine coastal zones were also excluded from the analyses. The treatment of satellite images was performed using standard tools of ArcGIS 10.3 software [69], which included classification, vectorization, and surface area quantification. The automatic identification of lakes employed the Fmask algorithm developed for Landsat images, which allows resolving the lakes under some cloud coverage [70]. First, for the mosaic of Landsat 8 imagery, the cloud masks were defined for individual images. Then, the cloud masks were removed from the images and replaced by cloud-free fragments taken from other adjacent images. The minimal lake size was chosen as 0.5 ha, based on following. The space resolution of Landsat-8 images is 30 m. Because the pixel size of the image is equal to 30 m × 30 m (900 m2), in the area of 0.5 ha, one can distinguish 5.55 pixels in size. This number of pixels is sufficient for the reliable identification of lakes from the background digital noise of the image. According to the works of our group and Bryksina [18,31,41,46,48], the uncertainty of the lake area measurement using remote sensing is a few percent. Note that the thermokarst lakes and thaw ponds of western Siberia are different from the glacial lakes of other boreal and subarctic regions. The latter are often developed on the moraine till and crystalline rocks, and present highly irregular shapes (skinny or elongated along the glacier direction). In contrast, due to the homogeneity of the soil substrate in western Siberia (1–3 m thick frozen peat), the thermokarst processes in the peat bog of this region always produce the isomeric (round, and much less common, oval) isolated water bodies [14,31,50,61]. According to our field and topographical map-based measurements across a sizeable latitudinal gradient of western Siberia, the share of lakes having an irregular shape is less than 10% [49,53,54].
To assess the latitudinal dependence of thermokarst lake properties, the studied territory was divided into latitudinal zones of 0.5° wide. Such a division of the territory was consistent with the latitudinal gradient of the permafrost and landscape features of the WSL [56,71]. Using ArcGIS 10.3 software [69], we first measured the area and number of lakes on each 0.5°-zone of mosaic of the Landsat 8 imagery. First, we conducted the vectorization and then we determined the area of lakes using the standard procedure of all GIS software. This allowed the quantification of the number, surface area, and volume of lakes, the density of lakes, and the degree of land surface coverage by lakes, as described below. The total lake area (Stot) in each 0.5-degree zone was computed from Equation (1):
S t o t = i n S i
where Si is the surface of the i-th lake and n is the number of lakes. The lake fraction is calculated as the ratio of S t o t / S o , where So is the area of each 0.5-degree zone. The lake density was computed as the number of lakes (n) per unit of area, n / S o . In order to estimate the stock of carbon and related elements in lakes, the lake volume (V) was computed following Equation (2):
V = i n h i × S i
where hi is the averaged depth of the i-th lake, which primarily depends on the lake size (see Section 2.3).
We used a power dependence between the number and the surface area of lakes in the WSL (correlation coefficient r = 0.99, p < 0.001), in accordance with global distribution law [2]:
k = A × s B
where k is the relative number of lakes in the histogram intervals, s is the lake surface area, and A and B are the empirical constants that depend on permafrost and landscape context, respectively.

2.3. Lake Depth and Hydrochemistry

The depth of thermokarst lakes in the WSL depends on their size. The detailed depth mapping of ~50 lakes larger than 2 ha having a solid bottom (frozen sand or silt) was performed via a Humminbird GPS-echosounder from a PVC boat, along several transects of the lake. The minimal depth of probing was 20 cm. The depth of the PVC boat submersion was between 5 and 10 cm, and necessary corrections for the sensor position were made. In lakes shallower than 50 cm, a manual depth measurement with a calibrated stick was performed. The small lakes (0.5–2 ha), having essentially frozen peat at the bottom with a high amount of porous organic detritus, were monitored via the manual probing of the water depth, across the lake transect or in the middle of the lake. Based on available field measurements of the depth and surface areas of ~150 thermokarst lakes from the sporadic to continuous permafrost zone [14,31,49,50,52,53,54,61,72,73,74,75,76,77], the depth was approximated to be equal to 0.54 ± 0.25 m (2 s.d.) for lakes smaller than 2 ha, and 0.85 ± 0.25 m (2 s.d.) for lakes ≥2 ha. The average uncertainty of these values of hi is 20% for n = 150. One has to note that the two discrete numbers of lake depth used in this study for a survey of 727,700 lakes is a first-order approximation. However, all ~150 thermokarst lakes studied by our group over the last nine years in the WSL, across three permafrost zones, were extremely similar and exhibited an average depth of 1.0 ± 0.5 m. This is a particular feature of the WSL thermokarst lakes located within the polygonal tundra, the peat palsa bog, and the ridge-lake-bog complexes.
The total stock of dissolved organic carbon, and major and trace elements in the lakes of the permafrost zone of the WSL, was evaluated based on the available dependencies between the lake surface area and the dissolved components of the lake water, obtained during extensive sampling campaigns in July 2010, 2012, and July–August 2013–2014 [50,52,53,54,75,76]. For this, water samples were collected from the lake surface (0.3 to 0.5 m) in pre-cleaned polypropylene containers and filtered on-site or within 4 h after sampling through disposable acetate cellulose filter units (0.45 µm poresize, 33 mm diameter), using sterile plastic syringes and vinyl gloves. An ultraclean sampling procedure was used [78]. The filtered samples were stored at 4–5 °C in the dark, before analysis. The concentrations of dissolved organic and inorganic carbon (DOC and DIC, respectively), cations, and trace elements (TEs), were measured using routine methods for analyzing boreal water samples in the GET laboratory (Toulouse) [79,80]. The DOC and DIC were measured using a Shimadzu Total Organic Carbon Analyzer TOC 6000 with an uncertainty of 5%. The trace metals were measured using inductively coupled plasma-mass spectrometry (ICP-MS, Agilent 7500 CE and Element XR), with indium and rhenium as the internal standards and a precision better than ±5%.
For an estimation of the stock of DOC and metals in lakes, the area-averaged values of element concentration in the lake water of discontinuous to continuous permafrost zones [53], complemented with data from discontinuous [49,54,74] and discontinuous to sporadic permafrost regions [50,52], were used. The available databases included a sufficient number of lakes of different sizes, so that the lake size-element concentration dependencies could be obtained for each latitudinal range. Specifically, we sampled ~100 lakes in the discontinuous permafrost zone, ~50 lakes in the continuous permafrost zone, and 30 lakes in the sporadic permafrost zone. For most elements, the concentrations were weakly sensitive (p > 0.05) to the lake size for lakes >0.5 ha. The exception was dissolved organic carbon (DOC), whose concentration was approximated by the power dependence [DOC, mg/L] = 190 × S(m2)−0.26 for lakes of 0.5 to 50 ha and is assumed equal to 10 mg/L for lakes >50 ha. Some elements exhibited a clear latitudinal trend in the thermokarst lakes of the WSL, from south to north (e.g., Ca, ref. [53]). This trend has been taken into account via an equation of polynomial dependence between the element concentration (Ci) and the latitude (° N), applied to each latitudinal range in which the stock of water was evaluated:
Ci = a + b × N + c × N2
where a, b, and c are the empirical coefficients, specific for each element.

3. Results

The number and surface area of lakes as a function of latitude are shown in Figure 2A,B, and the lake density and relative coverage of the surface area are illustrated in Figure 3A,B respectively. Presented in these plots are the average values of the territory of each 0.5°-wide latitudinal zones. In the region of 61°–65° N (sporadic to discontinuous permafrost), there are large (a factor of two to three) non-systematic variations of all physical parameters of the lakes. In the zone of 65° to 69° N (discontinuous to continuous permafrost), the lake number and the relative coverage decrease with the latitude, whereas north of 69°–70° N, the lake number and surface area decrease with the latitude increase.
Note that the irregular oscillations of lake density and area coverage, visible in the 0.5°-wide latitudinal zones, are linked to the spatial non-homogeneity of the thermokarst lake distribution. They disappear after a smoothing procedure in wider (2°) latitudinal zones (red dashed line in Figure 3). The results of measured lake parameters within the full WSL permafrost-affected territory (1.05 million km2) are listed in Table 1 and the map of the WSL coverage by lakes is given in Figure 4. There are 0.73 million lakes larger than 0.5 ha, with a total lake surface area of 5.97 million ha. It can be seen from Table 1 that the lake density and lake relative coverage increase by 19.3% and 13.8% from sporadic to continuous permafrost, respectively. The increase in the total lake number and their overall surface area from sporadic to continuous permafrost is equal to 42% and 48%, respectively.
The partitioning of the lake number and surface area among different size ranges is listed in Table 2. The main contribution to the overall area and volume (about 85% and 87%, respectively) is provided by medium and large lakes (>5 ha), with the largest share of the total area and volume (15.5% and 16%, respectively) being kept by lakes whose size is between 20 and 50 ha. The number of lakes increases with a decrease in the size, but the overall surface area and water stock decrease for lakes <20 ha. Thus, the small lakes (0.5–1.0 ha) provide only 3% of the overall area, with less than 2% of the total water volume. It is therefore expected that the overall area of numerous lakes smaller than 0.5 ha will be lower than 3%, although high-resolution images are necessary to confirm this trend. Empirical dependencies of lake number as a function of lake size for the three permafrost zones of western Siberia are illustrated in Figure 5. The empirical coefficients of Equation (3) (A and B) for each permafrost zone of the WSL territory are listed in Table 3.
Taking into account the volume of the lake water in each lake size range and across the WSL territory (Table 3), the total amount of each dissolved (<0.45 µm fraction) element in all of the thermokarst lakes (>0.5 ha) of the WSL were estimated (Table 4). The typical uncertainty of these values ranges from ±20% to ±30%, with the exception of some elements (Zn, Cr, Ni, and Ba) exhibiting ±50% of the average value, due to a significant latitudinal trend and lake size dependence of element concentration in the lake water.

4. Discussion

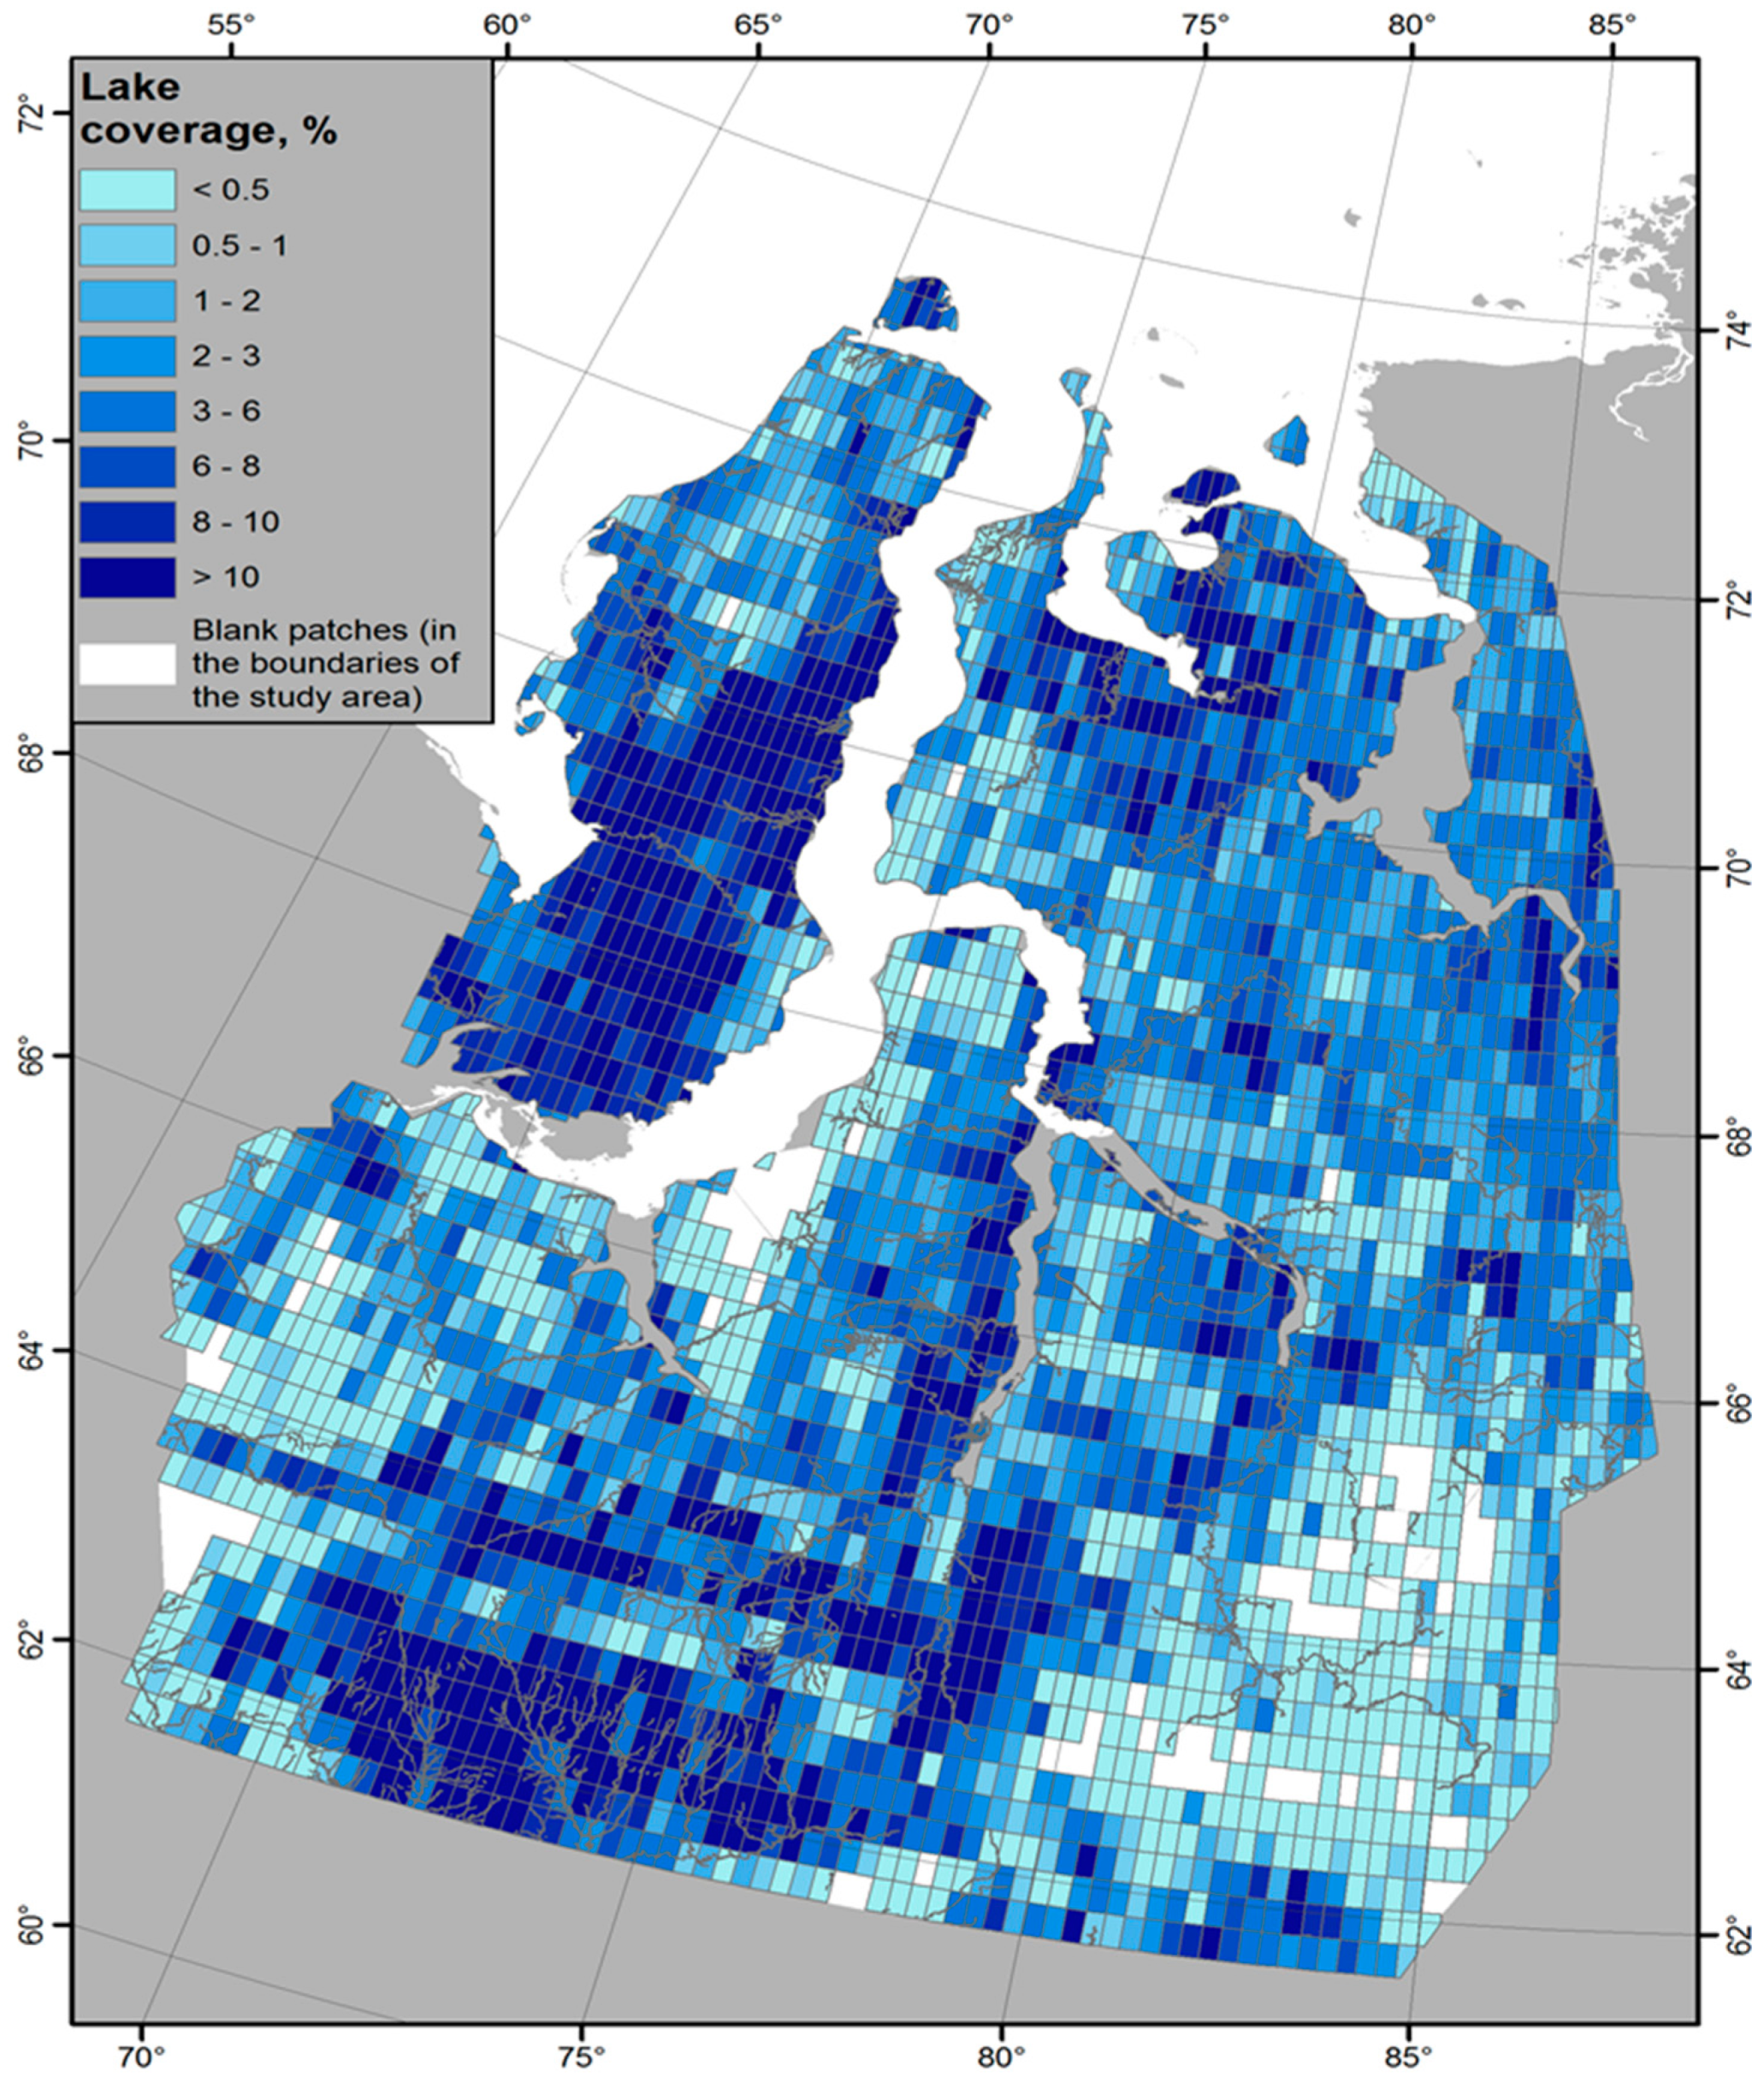
4.1. Thermokarst Lake Area and Land Surface Coverage

Overall, the inventory of medium and large thermokarst lakes of the WSL demonstrates an agreement of size distribution and surface coverage of the lakes in this region, compared to the rest of the world. The latitudinal pattern of the number of lakes and their surface area is tightly linked to the topography and landscape conditions of the northern part of the WSL, located within the sporadic to continuous permafrost zone. Between 61° and 64° N, the northern taiga is represented by sphagnum-dominated bogs, with pools and an open stand of trees [56]. The maximal latitudinal variability of lake coverage is observed within the watershed divide Sibirskie Uvaly (around 63° N), where the number and proportion of lakes are strongly controlled by minor variations of local topography, such as the alternation of ridge-mire-lake complexes and taiga zones. Further to the north, the lake coverage remains fairly constant between 64.5° and 71° N, corresponding to the development of the peat palsa plateau with palsa-hollow patterned mires. The landscape here is highly homogeneous with a dominance of watershed divides of small and medium rivers, offering large flat surfaces suitable for the development of a thermokarst. Finally, a strong decrease in the lake number and area northward of 71° N may be linked to the dominance of polygonal-roller and polygonal-fissure mires, combined with grass and moss-dominated mires [56]. Presumably, the thermokarst processes in the polygonal mires of continuous permafrost zone are less developed than those in the peat palsas plateau, dominating the discontinuous permafrost zone.
Unlike the database that comprises all lakes of the Earth’s surface [3], the present study addresses the distribution of thermokarst lakes (>0.5 ha) of the full WSL permafrost-affected territory. A consideration of very small thaw ponds (0.005 to 0.02 ha) in thermokarst-affected regions of the WSL increases the relative surface coverage by lakes to 10%–40%, with an average value of 20%, as shown using Canopus-V data on 18 test sites from 400 to 4000 ha each [82]. However, the decreasing of the minimum lake size to less than 0.1 ha over the whole area of the WSL goes beyond the goals of the present study. It is important to note that the distribution of these very small thaw ponds may deviate from the power dependence (Equation (3)), as reported in global databases [3,5]. The similarity of the B value (Equation (3)) among all three permafrost zones suggests a relatively weak variation of thermokarst lake size distribution patterns across the permafrost gradient in the WSL.
Noteworthy is the dramatic difference between the lake coverage of the WSL permafrost-affected territory estimated in this study (5% to 6% of the area) and the proportion of wet zones in the WSL river watersheds, assessed by ENVISAT radar altimetry (40% to 60% of the watershed area during open water period of the year [15]). These authors defined wet zones as various objects that are either constant in time (rivers, lakes, wetlands) or have seasonal variability (floodplains). It follows that the actual coverage of the WSL river watersheds by shallow (<0.1–0.5 m depth) surface water may be significantly higher than the “net” lake area. However, the estimations of the effect of flooding on land coverage by water and the lake abundance (i.e., see ref. [83] for review), or the water level fluctuation in lakes induced by evapotranspiration variation [84], were beyond the scope of this study.

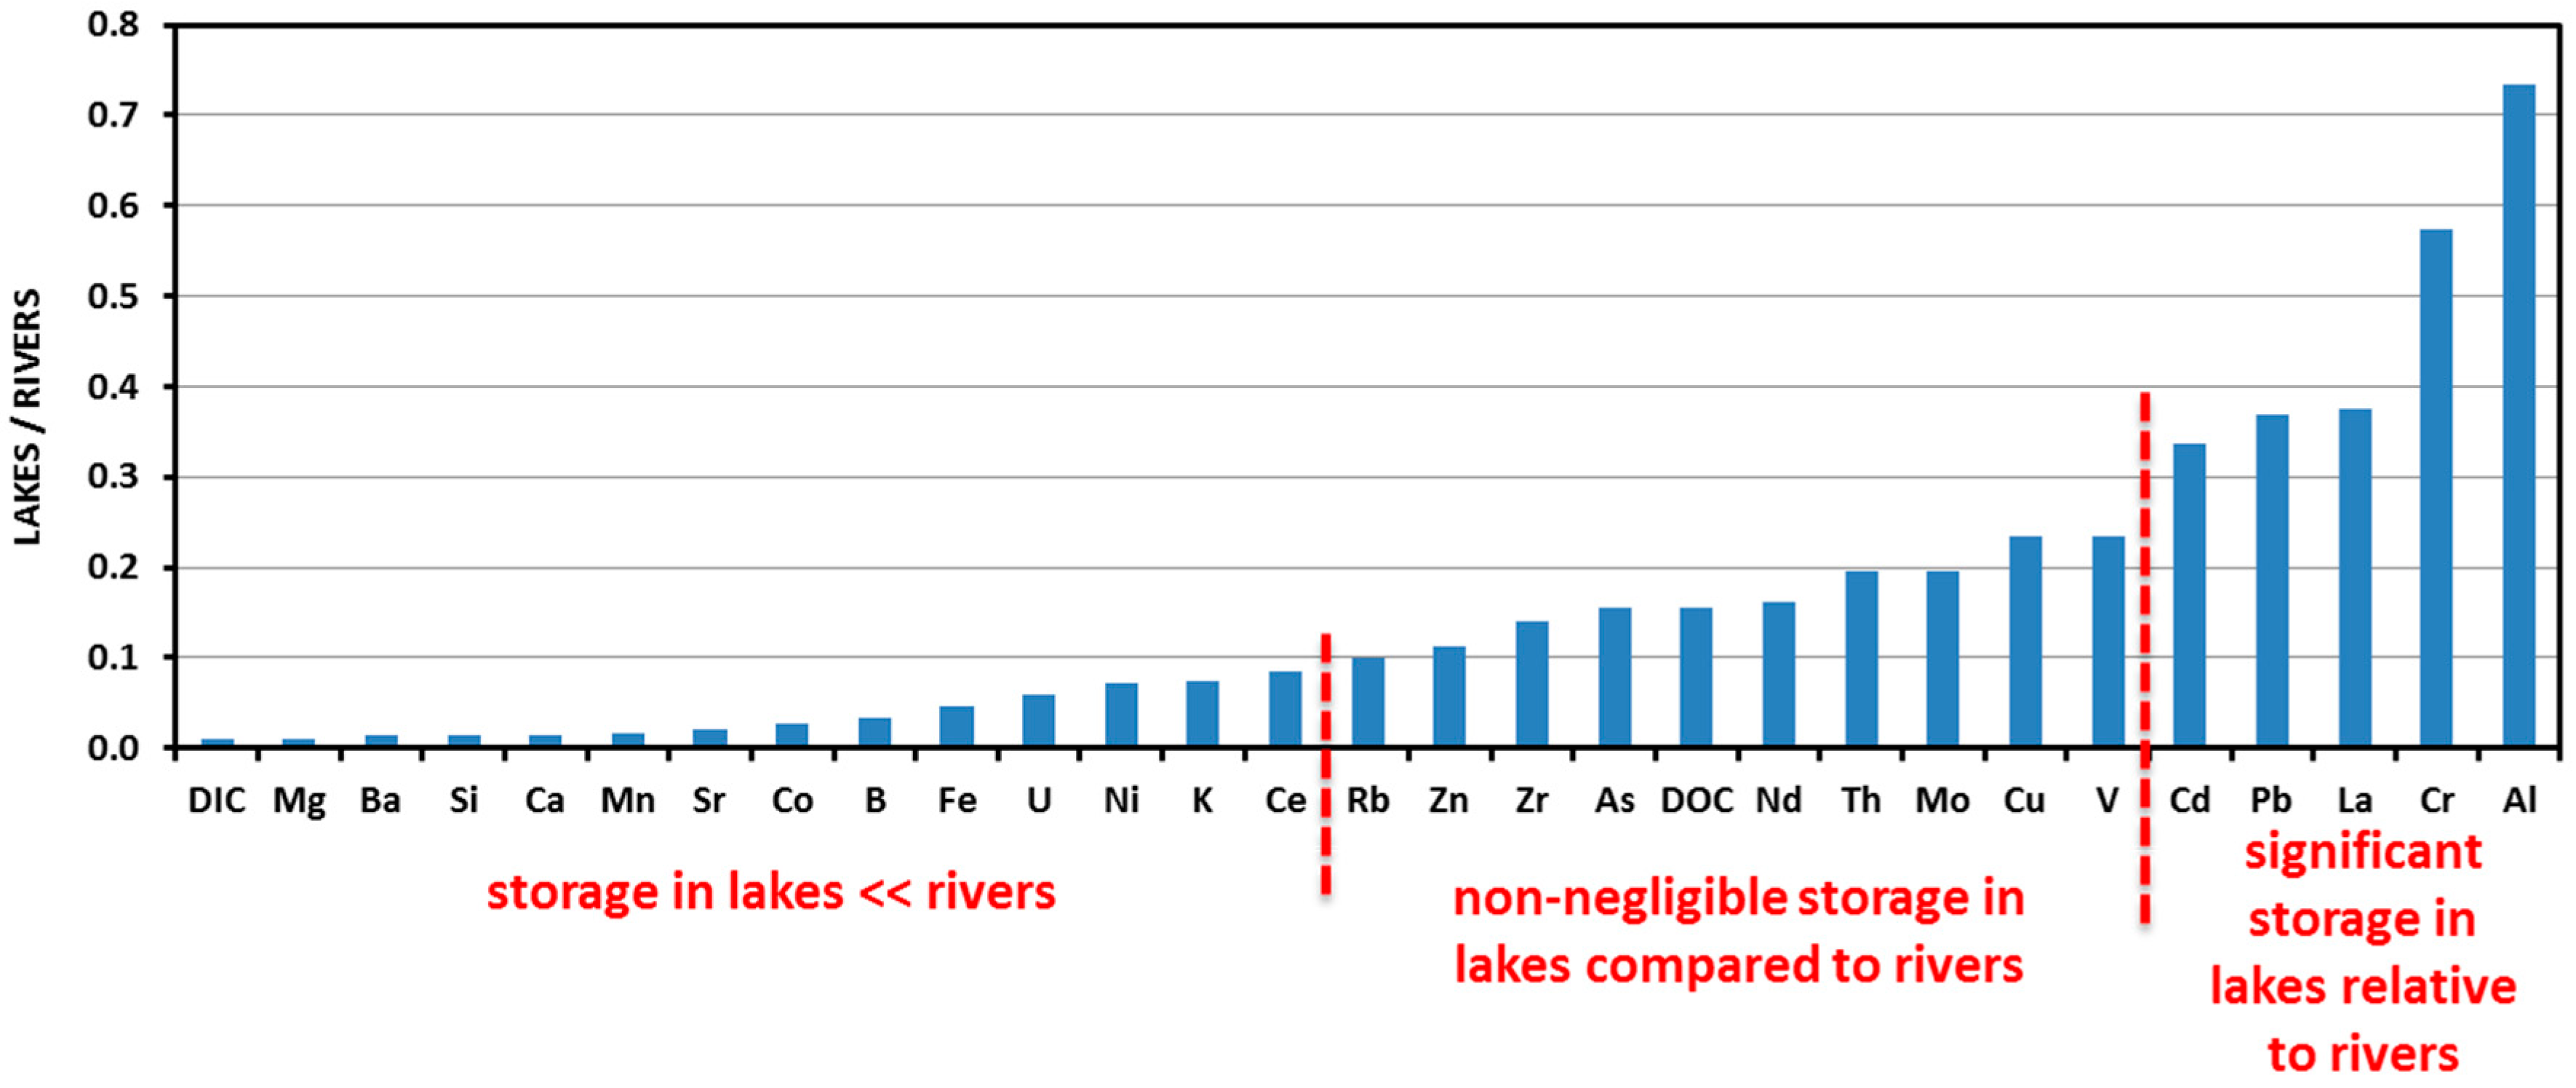
4.2. Stock of DOC and Metals in Thermokarst Lakes of the WSL

The specificity of thermokarst lakes of the WSL is their low depth (≤1 m), which allowed, for the first time, a reasonable inventory of the water volume and thus an evaluation of the stocks of dissolved components (Table 4). The typical range of water residence time in the thermokarst lakes of western Siberia is between 0.5 and 1.5 years [54]. The overwhelming majority of these lakes are not connected to the rivers, being isolated water bodies, protected by an impermeable permafrost layer both from the bottom (frozen sand and silt), and from the border (frozen peat). Probably for these reasons, the on-going dynamics of thermokarst lake abundances and surface areas are not yet reflected in the hydrological balance of large rivers in Western Siberia [40,47]. The stock of dissolved components in lakes on the permafrost-affected WSL territory can be compared to that delivered by all rivers of the WSL from the same territory to the Arctic Ocean. For this, watershed size-averaged, year-round fluxes of carbon, and major and trace elements assessed in previous works [79,80], can be used. A diagram of element stock in thermokarst lakes, relative to that in rivers of the WSL, is presented in Figure 6. Three groups of elements can be distinguished: (i) major and trace elements, whose storage in lakes is less than 10% of that in rivers (DIC, Mg, Ca, Sr, Ba, K, Si, B, Fe, Co, Ni, Mn, and Ce); (ii) elements presenting non-negligible storage in lakes (20% ± 10% of that in rivers): DOC, Rb, Zn, Cu, V, Mo, Zr, As, Nd, and Th; and finally (iii) elements having significant, 30 to 70% storage in lakes, relative to rivers: Cd, Pb, La, Cr, and Al. It can be seen from this classification that major cations, DIC, B, Si, and metals subjected to significant redox transformations (Mn, Fe, and Ce), are essentially present in the rivers because they are delivered by groundwater feeding or shallow subsurface flux [79,80]. The groundwater and subsoil feeding are very low in lakes which have frozen peat on the border and frozen sediments at the bottom, throughout the year [54]. The elements exhibiting strong affinity to organic matter (Al, Cr, and rare earth elements (REEs)) and metal toxicants (Cd and Pb) enriched in moss, exhibit sizeable storage in lakes of the WSL territory. This is consistent with the surface and suprapermafrost flow that deliver the solutes to the lakes.
The thermokarst lakes are typically 1–2 pH units more acidic than the surrounding rivers [50,80], and this may enhance the solubility and mobility of many low-soluble trivalent hydrolysates (Al, Fe3+, rare earth elements), from the lake sediment to the water column. Another important source of solutes to the lakes is surface flow from surrounding peat bogs covered by mosses and lichens, consistent with the essentially allochthonous source of DOM in thermokarst lakes [10,50]. A high concentration of DOC, combined with an enrichment in Pb and Cd of the surrounding moss cover [57], may be responsible for the sizeable proportion of metal toxicants in lakes compared to rivers. Given that the DOC, Fe, and Al concentrations in the smallest (<100–1000 m2) thermokarst depressions and permafrost subsidences are 3–10 times higher than that in lakes >0.5 ha inventoried in this work [50], and that most trace elements including metal micronutrients are present in the form of organic and organo-mineral colloids [61], the role of small thermokarst water bodies in element stock in surface waters and potential delivery to the hydrological network, may be particularly important and are currently strongly underestimated. For this, coupled land/water observations at a very high spatial resolution [85] may help to constrain the reservoirs and the mobility of carbon, metals, and greenhouse gases in adjacent aquatic and terrestrial biomes.
The role of small (<1000 m2) thermokarst lakes is especially important for the regulation of DOC and greenhouse gas exchanges with surrounding reservoirs (hydrological network and atmosphere). According to available observations of the discontinuous to sporadic permafrost zone of western Siberia, the smallest thaw ponds (10 m × 10 m to 33 m × 33 m) and depressions (1–100 m2) exhibit an order of magnitude higher concentration of CO2, up to two orders of magnitude higher methane concentration, and a factor of three to ten higher concentrations of DOC and related metals [49,50,52]. As such, even with their contribution to the total lake surface area of 1%, these small bodies of water may display carbon storage and GHG flux to the atmosphere, which will be comparable to those of large and medium lakes. This hypothesis is verified in the non-permafrost European wetlands: the peatland open water pools are known to act as a net source of CO2 to the atmosphere [86,87]. The importance of small (100–200 m2) water bodies for CO2 emission has recently been reported in the polygonal tundra of the Lena Delta observatory [51].
The upscaling of our estimation of the DOC and metal storage in lakes, relative to the river input, requires detailed knowledge of other lakes of the subarctic, since the riverine fluxes DOC, DIC, and most major elements of the circumpolar region, are fairly well defined [88,89,90]. The extrapolation of results from well-studied lakes of the Mackenzie Delta region of Canada [9,91,92,93,94], the Yakutia alasses and yedoma lakes [20,95,96], to much larger territories of boreal plains such as the WSL peatlands, and North-Siberia and Yana-Indigirka lowlands, remains unwarranted. The lakes of these lowlands may stand apart from other studied lakes of the subarctic, in view of their high peat context, low pH, shallow depth, and very low salt content. At present, a large-scale comparison of carbon and metal storage in thermokarst lakes and riverine fluxes of elements in the subarctic can only be provided for the western Siberia lowland.

5. Conclusions

A remote sensing analysis of thermokarst lakes (>0.5 ha) in the sporadic, discontinuous, and continuous permafrost zone of the western Siberia lowland demonstrated that the number of lakes smaller than 1 ha exceeds 33% of the total lake number, whereas their total surface area is only 2.9% of the total surface of WSL lakes. Within the full range of studied lake sizes and areas, a power dependence between the number of lakes and their surface area, consistent with the world-wide trend, is observed. The dependence of the lake number and surface coverage on the latitude exhibits: (i) a highly variable pattern (strong oscillations) between 61° and 63° N, within the watershed divide Sibirskie Uvaly, due to the variable topography of ridge-lake-bog complexes within the sporadic permafrost zone; (ii) stable values of lake fraction between 64° and 71° N of the peat palsa plateau and the discontinuous permafrost context; and finally (iii) abruptly decreasing the lake fraction northward, north of 71° N, within the continuous permafrost zone of the polygonal tundra. The obtained laws of lake number and surface area distribution allow the calculation of the total surface area and volume of water. This yielded the dissolved metal and carbon stocks in surface aquatic systems of the permafrost-affected zone of the WSL.
The stock of C and most metals in thermokarst lakes of the WSL does not exceed 10%–20% of the riverine flux of the territory. However, the role of lakes in the storage of Al, Cr, Cd, and Pb is comparable to, or even higher than, the transport of these elements by rivers. A low pH and high DOC in WSL thermokarst lakes compared to other regions of the subarctic may be responsible for such an important role of the WSL lakes in toxic metal storage. A high-resolution (0.01–0.1 ha) inventory of small thermokarst lakes, most susceptible to permafrost thaw in key representative zones of the WSL, will aid in accounting for short-term changes in water, carbon, and metal stocks, under climate warming scenarios. The extrapolation of obtained results to the whole circumpolar region is hampered by the lack of information on other thermokarst lakes from large (million km2-scale) territories, notably the boreal plains.

Acknowledgments

Support from the RSF (RNF) grant No. 15-17-10009 “Evolution of thermokarst lake ecosystems in the context of climate change” (50%, hydrochemistry), the BIO-GEO-CLIM grant No. 14.В25.31.0001 of Russian Ministry of Science and Education and Tomsk State University, FCP “Kolmogorov” No. 14.587.21.0036, and RFBR grant No. 15-45-00075 and No. 16-35-60085 mol_a_dk, are acknowledged.

Author Contributions

Yury M. Polishchuk, Alexander N. Bogdanov and Vladimir Yu. Polishchuk conceived and designed the measurements of lake area; Alexander N. Bogdanov and Vladimir Yu. Polishchuk performed the lake area assessment; Yury M. Polishchuk, Alexander N. Bogdanov, Vladimir Yu. Polishchuk and Oleg S. Pokrovsky analyzed the data; Rinat M. Manasypov and Liudmila S. Shirokova contributed the data on lakes and river chemistry; Sergey N. Kirpotin provided the landscape-based assessment; Yury M. Polishchuk and Oleg S. Pokrovsky wrote the paper.

Conflicts of Interest

The authors declare no conflict of interest.

References

  1. Lehner, B.; Doll, P. Development and validation of a global database of lakes, reservoirs and wetlands. J. Hydrol. 2004, 296, 1–22. [Google Scholar] [CrossRef]
  2. Downing, J.A.; Prairie, Y.T. The global abundance and size distribution of lakes, ponds, and impoundments. Limnol. Oceanogr. 2006, 51, 2388–2397. [Google Scholar] [CrossRef]
  3. Verpoorter, C.; Kutser, T.; Seekel, D.A.; Tranvik, L.J. A global inventory of lakes based on high resolution satellite imagery. Geophys. Res. Lett. 2014, 41, 1–7. [Google Scholar] [CrossRef]
  4. Verpoorter, C.; Kutser, T.; Tranvik, L.J. Automated mapping of water bodies using Landsat multispectral data. Limnol. Oceanogr. Meth. 2012, 10, 1037–1050. [Google Scholar] [CrossRef]
  5. Seekell, D.A.; Carpenter, S.R.; Pace, M.L. Conditional heteroscedasticity as a leading indicator of ecological regime shifts. Am. Nat. 2011, 178, 442–451. [Google Scholar] [CrossRef] [PubMed]
  6. Schindler, D.W.; Bayley, S.E.; Parker, B.R.; Beaty, K.G.; Cruikshank, D.R.; Schindler, E.U.; Stainton, M.P. The effects of climatic warming on the properties of boreal lakes and streams at the Experimental Lakes Area, northwestern Ontario. Limnol. Oceanogr. 1996, 41, 1004–1017. [Google Scholar] [CrossRef]
  7. Jankowski, T.; Livingstone, D.M.; Buhler, H.; Forster, R.; Niederhauser, P. Consequences of the 2003 European heat wave for lake temperature profiles, thermal stability, and hypolimnetic oxygen depletion: Implications for a warmer world. Limnol. Oceanogr. 2006, 51, 815–819. [Google Scholar] [CrossRef]
  8. Graham, M.D.; Vinebrooke, R.D. Extreme weather events alter planktonic communities in boreal lakes. Limnol. Oceanogr. 2009, 54, 2481–2492. [Google Scholar] [CrossRef]
  9. Tank, S.E.; Lesack, L.F.W.; Hesslein, R.H. Northern delta lakes as summertime CO2 absorbers within the Arctic landscape. Ecosystems 2009, 12, 144–157. [Google Scholar] [CrossRef]
  10. Tank, S.E.; Lesack, L.F.W.; Gareis, J.A.L.; Osburn, C.L.; Hesslein, R.H. Multiple tracers demonstrate distinct sources of dissolved organic matter to lakes of the Mackenzie Delta, western Canadian Arctic. Limnol. Oceanogr. 2011, 56, 1297–1309. [Google Scholar] [CrossRef]
  11. Bring, A.; Fedorova, I.; Dibike, Y.; Hinzman, L.; Mård, J.; Mernild, S.H.; Prowse, T.; Semenova, O.; Stuefer, S.L.; Woo, M.-K. Arctic terrestrial hydrology: A synthesis of processes, regional effects, and research challenges. J. Geophys. Res. Biogeosci. 2016, 121, 621–649. [Google Scholar] [CrossRef]
  12. Frey, K.E.; Siegel, D.I.; Smith, L.C. Geochemistry of west Siberian streams and their potential response to permafrost degradation. Water Resour. Res. 2007, 43, W03406. [Google Scholar] [CrossRef]
  13. Roach, J.; Griffith, B.; Verbyla, D.; Jones, J. Mechanisms influencing changes in lake area in Alaskan boreal forest. Glob. Chang. Biol. 2011, 17, 2567–2583. [Google Scholar] [CrossRef]
  14. Kirpotin, S.; Polishchuk, Y.; Bryksina, N.; Sugaipova, A.; Kouraev, A.; Zakharova, E.; Pokrovsky, O.S.; Shirokova, L.; Kolmakova, M.; Manassypov, R.; et al. West Siberian palsa peatlands: Distribution, typology, cyclic development, present day climate-driven changes, seasonal hydrology and impact on CO2 cycle. Int. J. Environ. Stud. 2011, 68, 603–623. [Google Scholar] [CrossRef]
  15. Zakharova, E.A.; Kouraev, A.V.; Rémy, F.; Zemtsov, V.A.; Kirpotin, S.N. Seasonal variability of the Western Siberia wetlands from satellite radar altimetry. J. Hydrol. 2014, 512, 366–378. [Google Scholar] [CrossRef]
  16. Marsh, P.; Russell, M.; Pohl, S.; Haywood, H.; Onclin, C. Changes in thaw lake drainage in the Western Canadian Arctic from 1950 to 2000. Hydrol. Process. 2009, 23, 145–158. [Google Scholar] [CrossRef]
  17. MacDonald, L.A.; Turner, K.W.; Balasubramaniam, A.M.; Wolfe, B.B.; Hall, R.I.; Sweetman, J.N. Tracking hydrological responses of a thermokarst lake in the Old Crow Flats (Yukon Territory, Canada) to recent climate variability using aerial photographs and paleolimnological methods. Hydrol. Process. 2012, 26, 117–129. [Google Scholar] [CrossRef]
  18. Polishchuk, Y.; Kirpotin, S.; Bryksina, N. Remote study of thermokarst lakes dynamics in West-Siberian permafrost. In Permafrost: Distribution, Composition and Impacts on Infrastructure and Ecosystems; Pokrovsky, O.S., Ed.; Nova Science Publishers: Hauppauge, NY, USA, 2014; pp. 173–204. [Google Scholar]
  19. Coleman, K.A.; Palmer, M.J.; Korosi, J.B.; Kokelj, S.V.; Jackson, K.; Hargan, K.E.; Mustaphi, C.J.C.; Thienpont, J.R.; Kimpe, L.E.; Blais, J.M.; et al. Tracking the impacts of recent warming and thaw of permafrost peatlands on aquatic ecosystems: A multi-proxy approach using remote sensing and lake sediments. Boreal Environ. Res. 2015, 20, 363–377. [Google Scholar]
  20. Boike, J.; Grau, T.; Heim, B.; Günther, F.; Langer, M.; Muster, S.; Gouttevin, I.; Lange, S. Satellite-derived changes in the permafrost landscapes of Central Yakutia, 2000–2011: Wetting, drying, and fires. Glob. Planet. Chang. 2016, 139, 116–127. [Google Scholar] [CrossRef] [Green Version]
  21. Tranvik, L.J.; Downing, J.A.; Cotner, J.B.; Loiselle, S.A.; Striegl, R.G.; Ballatore, T.J.; Dillon, P.; Finlay, K.; Fortino, K.; Knoll, L.B.; et al. Lakes and reservoirs as regulators of carbon cycling and climate. Limnol. Oceanogr. 2009, 54, 2298–2314. [Google Scholar] [CrossRef]
  22. Catalán, N.; Marcé, R.; Kothawala, D.N.; Tranvik, L.J. Organic carbon decomposition rates controlled by water retention time across inland waters. Nat. Geosci. 2016, 9, 501–504. [Google Scholar] [CrossRef]
  23. Walter, K.M.; Smith, L.C.; Chapin, F.S. Methane bubbling from northern lakes: Present and future contributions to the global methane budget. Philos. Trans. R. Soc. A 2007, 365, 1657–1676. [Google Scholar] [CrossRef] [PubMed]
  24. Laurion, I.; Vincent, W.F.; MacIntyre, S.; Retamal, L.; Dupont, C.; Francus, P.; Pienitz, R. Variability in greenhouse gas emissions from permafrost thaw ponds. Limnol. Oceanogr. 2010, 55, 115–133. [Google Scholar] [CrossRef]
  25. Walter Anthony, K.M.; Anthony, P. Constraining spatial variability of methane ebullition in thermokarst lakes using point-process models. J. Geophys. Res. 2013, 118, 1015–1034. [Google Scholar] [CrossRef]
  26. Walter Anthony, K.M.; Zimov, S.A.; Grosse, G.; Jones, M.C.; Anthony, P.M.; Chapin, F.S., III; Finlay, J.C.; Mack, M.C.; Davydov, S.; Frenzel, P.; et al. A shift of thermokarst lakes from carbon sources to sinks during the Holocene epoch. Nature 2014, 511, 452–456. [Google Scholar] [CrossRef] [PubMed]
  27. Zuidhoff, F.S.; Kolstrup, E. Changes in palsa distribution in relation to climate change in Laivadalen, Northern Sweden, especially 1960–1997. Permafr. Periglac. 2000, 11, 55–69. [Google Scholar] [CrossRef]
  28. Luoto, M.; Seppala, M. Thermokarst ponds as indicator of the former distribution of palsas in Finnish Lapland. Permafr. Periglac. 2003, 14, 19–27. [Google Scholar] [CrossRef]
  29. Riordan, B.; Verbyla, D.; McGuire, A.D. Shrinking ponds in subarctic Alaska based on 1950–2002 remotely sensed images. J. Geophys. Res. Biogeosci. 2006, 111, G04002. [Google Scholar] [CrossRef]
  30. Grosse, G.; Romanovsky, V.; Walter, K.; Morgenstern, A.; Lantuit, H.; Zimov, S. Distribution of Thermokarst Lakes and Ponds at Three Yedoma Sites in Siberia. In Proceedings of the 9th Intern Conference on Permafrost, Fairbanks, Alaska, 29 June–3 July 2008; pp. 551–556.
  31. Kirpotin, S.; Polishchuk, Y.; Bryksina, N. Abrupt changes of thermokarst lakes in Western Siberia: Impacts of climatic warming on permafrost melting. Int. J. Environ. Stud. 2009, 66, 423–431. [Google Scholar] [CrossRef]
  32. Plug, L.J.; Walls, C.; Scott, B.M. Tundra lake changes from 1978 to 2001 on the Tuktoyaktuk Peninsula, western Canadian Arctic. Geophys. Res. Lett. 2008, 35, L03502. [Google Scholar] [CrossRef]
  33. Jepsen, S.M.; Voss, C.I.; Walvoord, M.A.; Minsley, B.J.; Rover, J. Linkages between lake shrinkage/expansion and sublacustrine permafrost distribution determined from remote sensing of interior Alaska, USA. Geophys. Res. Lett. 2013, 40, 882–887. [Google Scholar] [CrossRef]
  34. Jones, B.M.; Grosse, G.; Arp, C.D.; Jones, M.C.; Walter Anthony, K.M.; Romanovsky, V.E. Modern thermokarst lake dynamics in the continuous permafrost zone, northern Seward Peninsula, Alaska. J. Geophys. Res. 2011, 116, G00M03. [Google Scholar] [CrossRef]
  35. Sannel, A.B.K.; Kuhry, P. Warming-induced destabilization of peat plateau/thermokarst lake complexes. J. Geophys. Res. 2011, 116, G03035. [Google Scholar] [CrossRef]
  36. Necsoiu, M.; Dinwiddie, C.L.; Walter, G.R.; Larsen, A.; Stothoff, S.A.; Necsoiu, M. Multi-temporal image analysis of historical aerial photographs and recent satellite imagery reveals evolution of water body surface area and polygonal terrain morphology in Kobuk Valley National Park, Alaska. Environ. Res. Lett. 2013, 8, 025007. [Google Scholar] [CrossRef]
  37. Carroll, M.L.; Townshend, J.R.; DiMiceli, C.M.; Noojipady, P.; Sohlberg, R.A. A new global raster water mask at 250 m resolution. Int. J. Digital Earth 2009, 2, 291–308. [Google Scholar] [CrossRef]
  38. Carroll, M.L.; Townshend, J.R.G.; DiMiceli, C.M.; Loboda, T.; Sohlberg, R.A. Shrinking lakes of the Arctic: Spatial relationships and trajectory of change. Geophys. Res. Lett. 2011, 38, L20406. [Google Scholar] [CrossRef]
  39. Smith, L.; Sheng, Y.; Macdonald, G.; Hinzman, L. Disappearing Arctic Lakes. Science 2005, 308, 1429. [Google Scholar] [CrossRef] [PubMed]
  40. Karlsson, J.M.; Lyon, S.W.; Destouni, G. Thermokarst lake, hydrological flow and water balance indicators of permafrost change in Western Siberia. J. Hydrol. 2012, 464–465, 459–466. [Google Scholar] [CrossRef]
  41. Dneprovskaya, V.P.; Bryksina, N.A.; Polishchuk, Y.M. Study of thermokarst change in discontinuous permafrost zone of western Siberia using satellite images. Study Earth Space 2009, 4, 88–96. (In Russian) [Google Scholar]
  42. Kravtzova, V.I.; Bystrova, A.G. Study of thermokarst lake size in different regions of Russia over last 30 years. Earth Cryosphere 2009, 13, 12–26. (In Russian) [Google Scholar]
  43. Turner, K.W.; Turner, K.W.; Wolfe, B.B.; Edwards, T.W.D. Characterizing the role of hydrological processes on lake water balances in the Old Crow Flats, Yukon Territory, Canada, using water isotope tracers. J. Hydrol. 2010, 386, 103–107. [Google Scholar] [CrossRef]
  44. Anderson, L.; Birks, J.; Rover, J.; Guldager, N. Controls on recent Alaskan lake changes identified from water isotopes and remote sensing. Geophys. Res. Lett. 2013, 40, 3413–3418. [Google Scholar] [CrossRef]
  45. Lantz, T.C.; Turner, K.W. Changes in lake area in response to thermokarst processes and climate in Old Crow Flats, Yukon. J. Geophys. Res. Biogeosci. 2015, 120, 513–524. [Google Scholar] [CrossRef]
  46. Bryksina, N.A.; Polishchuk, Y.M. Analysis of changes in the number of thermokarst lakes in permafrost of Western Siberia on the basis of satellite images. Earth Cryosphere 2015, 19, 100–105. (In Russian) [Google Scholar]
  47. Karlsson, J.M.; Lyon, S.W.; Destouni, G. Temporal Behavior of lake size-distribution in a thawing permafrost landscape in Nothwestern Siberia. Remote Sens. 2014, 6, 621–636. [Google Scholar] [CrossRef]
  48. Polishchuk, Y.M.; Bryksina, N.A.; Polishchuk, V.Y. Remote analysis of changes in the number and distribution of small thermokarst lakes by sizes in cryolithozone of Western Siberia. Izv. Atmos. Ocean. Phys. 2015, 51, 999–1006. [Google Scholar] [CrossRef]
  49. Pokrovsky, O.S.; Shirokova, L.S.; Kirpotin, S.N.; Audry, S.; Viers, J.; Dupre, B. Effect of permafrost thawing on the organic carbon and metal speciation in thermokarst lakes of Western Siberia. Biogeosciences 2011, 8, 565–583. [Google Scholar] [CrossRef] [Green Version]
  50. Shirokova, L.S.; Pokrovsky, O.S.; Kirpotin, S.N.; Desmukh, C.; Pokrovsky, B.G.; Audry, S.; Viers, J. Biogeochemistry of organic carbon, CO2, CH4, and trace elements in thermokarst water bodies in discontinuous permafrost zones of Western Siberia. Biogeochemistry 2013, 113, 573–593. [Google Scholar] [CrossRef]
  51. Abnizova, A.; Siemens, J.; Langer, M.J.; Boike, J. Small ponds with major impact: The relevance of ponds and lakes in permafrost landscapes to carbon dioxide emissions. Glob. Biogeochem. Cycles 2012, 26, GB2041. [Google Scholar] [CrossRef]
  52. Pokrovsky, O.S.; Shirokova, L.S.; Kirpotin, S.N.; Kulizhsky, S.P.; Vorobiev, S.N. Impact of western Siberia heat wave 2012 on greenhouse gases and trace metal concentration in thaw lakes of discontinuous permafrost zone. Biogeosciences 2013, 10, 5349–5365. [Google Scholar] [CrossRef]
  53. Manasypov, R.M.; Pokrovsky, O.S.; Kirpotin, S.N.; Shirokova, L.S. Thermokarst lake waters across permafrost zones of Western Siberia. Cryosphere 2014, 8, 1177–1193. [Google Scholar] [CrossRef] [Green Version]
  54. Manasypov, R.M.; Vorobyev, S.N.; Loiko, S.V.; Kritzkov, I.V.; Shirokova, L.S.; Shevchenko, V.P.; Kirpotin, S.N.; Kulizhsky, S.P.; Kolesnichenko, L.G.; Zemtzov, V.A.; et al. Seasonal dynamics of organic carbon and metals in thermokarst lakes from the discontinuous permafrost zone of western Siberia. Biogeosciences 2015, 12, 3009–3028. [Google Scholar] [CrossRef]
  55. Kremenetski, K.V.; Velichko, A.A.; Borisova, O.K.; MacDonald, G.M.; Smith, L.C.; Frey, K.E.; Orlova, L.A. Peatlands of the West Siberian Lowlands: Current knowledge on zonation, carbon content, and Late Quaternary history. Quat. Sci. Rev. 2003, 22, 703–723. [Google Scholar] [CrossRef]
  56. Peregon, A.; Maksyutov, S.; Yamagata, Y. An image-based inventory of the spatial structure of West Siberian wetlands. Environ. Res. Lett. 2009, 4, 045014. [Google Scholar] [CrossRef]
  57. Stepanova, V.M.; Pokrovsky, O.S.; Viers, J.; Mironycheva-Tokareva, N.P.; Kosykh, N.P.; Vishnyakova, E.K. Major and trace elements in peat profiles in Western Siberia: Impact of the landscape context, latitude and permafrost coverage. Appl. Geochem. 2015, 53, 53–70. [Google Scholar] [CrossRef]
  58. Nikitin, S.P.; Zemtsov, V.A. The Variability of Hydrological Parameters of Western Siberia; Nauka: Novosibirsk, Russia, 1986; 204p. (In Russian) [Google Scholar]
  59. Liss, O.L.; Abramova, L.I.; Avetov, N.A.; Berezina, N.A.; Inisheva, L.I.; Kurnishnikova, T.V.; Sluka, Z.A.; Tolpysheva, T.Yu.; Shvedchikova, N.K. Wetland Systems of West Siberia and their Importance for Nature Conservation; Grif, i K: Tula, Russia, 2001; 584p. (In Russian) [Google Scholar]
  60. Khrenov, V.Y. Soils of Cryolithozone of Western Siberia: Morphology, Physico-Chemical Properties and Geochemistry; Nauka: Moscow, Russia, 2011; 214p. (In Russian) [Google Scholar]
  61. Pokrovsky, O.S.; Shirokova, L.S.; Kirpotin, S.N. Biogeochemistry of Thermokarst Lakes of Western Siberia; Nova Science Publishers: Hauppauge, NY, USA, 2014; 163p. [Google Scholar]
  62. Rikhter, G.D. Western Siberia; AS USSR Press: Moscow, Russia, 1963; 188p. (In Russian) [Google Scholar]
  63. Ivanov, K.E.; Novikov, S.M. Mires of Western Siberia: Their Structure and Hydrological Regime; Hydrometeoizdat: Leningrad, Russia, 1976; 448p. (In Russian) [Google Scholar]
  64. Kozlov, S.A. Evaluation of stability of the geological environment at offshore fields hydrocarbons in the Arctic. Elektron. Nauchnii Zhurnal Neftegazov. 2005, 3, 15–24. (In Russian) [Google Scholar]
  65. Savchenko, N.V. Nature of lakes in subarctic of West Siberia. Geogr. Prir. Resur. 1992, 1, 85–92. (In Russian) [Google Scholar]
  66. Viktorov, A.S. Main Problems of Mathematic Morphology of Landscape; Nauka: Moscow, Russia, 2006; 252p. (In Russian) [Google Scholar]
  67. Grosse, G.; Jones, B.; Arp, C. Thermokarst lakes, drainage, and drained basins. In Treatise on Geomorphology, 3rd ed.; Shroder, J., Giardino, R., Harbor, J., Eds.; Academic Press: San Diego, CA, USA, 2013; Volume 8, pp. 325–353. [Google Scholar]
  68. USGS Global Visualization Viewer. Available online: http://glovis.usgs.gov/ (accessed on 20 March 2017).
  69. Kennedy, M.D.; Goodchild, M.F.; Dangermond, J. Introducing Geographic Information Systems with ArcGIS: A Workbook Approach to Learning GIS; John Wiley & Sons, Inc.: Hoboken, NJ, USA, 2013; 672p. [Google Scholar]
  70. Zhu, Z.; Wang, S.; Woodcock, C.E. Improvement and expansion of the Fmask algorithm: Cloud, cloud shadow, and snow detection for Landsats 4–7, 8, and Sentinel 2 images. Remote Sens. Environ. 2015, 159, 269–277. [Google Scholar] [CrossRef]
  71. Frey, K.E.; Smith, L.C. How well do we know northern land cover? Comparison of four global vegetation and wetland products with a new ground-truth database for West Siberia. Glob. Biogeochem. Cycles 2007, 21, GB1016. [Google Scholar] [CrossRef]
  72. Shirokova, L.S.; Pokrovsky, O.S.; Kirpotin, S.N.; Dupré, B. Heterotrophic bacterio-plankton in thawed lakes of northern part of Western Siberia controls the CO2 flux to the atmosphere. Int. J. Environ. Stud. 2009, 66, 433–445. [Google Scholar] [CrossRef]
  73. Kirpotin, S.N.; Polishchuk, Y.M.; Zakharova, E.; Shirokova, L.; Pokrovsky, O.; Kolmakova, M.; Dupré, B. One of possible mechanisms of thermokarst lakes drainage in West-Siberian North. Int. J. Environ. Stud. 2008, 65, 631–635. [Google Scholar] [CrossRef]
  74. Audry, S.; Pokrovsky, O.S.; Shirokova, L.S.; Kirpotin, S.N.; Dupré, B. Organic matter mineralization and trace element post-depositional redistribution in Western Siberia thermokarst lake sediments. Biogeosciences 2011, 8, 565–583. [Google Scholar] [CrossRef]
  75. Halicki, W.; Kochanska, M.; Pokrovsky, O.S.; Kirpotin, S.N. Assessment of physical properties and pH of selected surface waters in the northern part of Western Siberia. Int. J. Environ. Stud. 2015, 72, 557–566. [Google Scholar] [CrossRef]
  76. Kochanska, M.; Halicki, W.; Pokrovsky, O.S.; Kirpotin, S.N. Organic compounds in typical surface waters of the northern part of Western Siberia. Int. J. Environ. Stud. 2015, 72, 547–556. [Google Scholar] [CrossRef]
  77. Pavlova, O.A.; Pokrovsky, O.S.; Manasypov, R.M.; Shirokova, L.S.; Vorobyev, S.N. Seasonal dynamics of phytoplankton in acidic and humic environment in shallow thaw ponds of western Siberia, discontinuous permafrost zone. Ann. Limnol. Int. J. Limnol. 2016, 52, 47–60. [Google Scholar] [CrossRef]
  78. Shirokova, L.S.; Pokrovsky, O.S.; Viers, J.; Klimov, S.I.; Moreva, O.Y.; Zabelina, S.A.; Vorobieva, T.Y.; Dupré, B. Diurnal variations of trace elements and heterotrophic bacterioplankton concentration in a small boreal lake of the White Sea basin. Ann. Limnol. Int. J. Limnol. 2010, 46, 67–75. [Google Scholar] [CrossRef]
  79. Pokrovsky, O.S.; Manasypov, R.M.; Loiko, S.; Shirokova, L.S.; Krickov, I.A.; Pokrovsky, B.G.; Kolesnichenko, L.G.; Kopysov, S.G.; Zemtzov, V.A.; Kulizhsky, S.P.; et al. Permafrost coverage, watershed area and season control of dissolved carbon and major elements in western Siberia rivers. Biogeosciences 2015, 12, 6301–6320. [Google Scholar] [CrossRef]
  80. Pokrovsky, O.S.; Manasypov, R.M.; Loiko, S.; Krickov, I.A.; Kopysov, S.G.; Kolesnichenko, L.G.; Vorovyev, S.N.; Kirpotin, S.N. Trace element transport in western Siberia rivers across a permafrost gradient. Biogeosciences 2016, 13, 1877–1900. [Google Scholar] [CrossRef]
  81. Cael, B.B.; Seekell, D.A. The size-distribution of Earth’s lakes. Sci. Rep. 2016, 6, 29633. [Google Scholar] [CrossRef] [PubMed]
  82. Baisalyamova, O.A.; Bogdanov, A.N.; Muratov, I.N.; Polishchuk, Y.M.; Snigireva, M.S. Spatial distribution of small thermokarst lakes in western Siberia using KH-7 and GeoEye-1 images. Vestnik Ugra State Univ. 2015, 3, 69–73. (In Russian) [Google Scholar]
  83. Wang, Y. Advances in Remote Sensing of Flooding. Water 2015, 7, 6404–6410. [Google Scholar] [CrossRef]
  84. Zhao, X.; Liu, Y. Lake Fluctuation Effectively Regulates Wetland Evapotranspiration: A Case Study of the Largest Freshwater Lake in China. Water 2014, 6, 2482–2500. [Google Scholar] [CrossRef]
  85. Siewert, M.B.; Hanisch, J.; Weiss, N.; Kuhry, P.; Maximov, T.C.; Hugelius, G. Comparing carbon storage of Siberian tundra and taiga permafrost ecosystems at very high spatial resolution. J. Geophys. Res. Biogeosci. 2015, 120, 1973–1994. [Google Scholar] [CrossRef]
  86. Pelletier, L.; Strachan, I.B.; Roulet, N.T.; Garneau, M. Can boreal peatlands with pools be net sinks for CO2? Environ. Res. Lett. 2015, 10, 035002. [Google Scholar] [CrossRef]
  87. Pelletier, L.; Strachan, I.B.; Roulet, N.T.; Garneau, M.; Wischnewski, K. Effect of open water pools on ecosystem scale surface-atmosphere carbon dioxide exchange in a boreal peatland. Biogeochemistry 2015, 124, 291–304. [Google Scholar] [CrossRef]
  88. Tank, S.E.; Frey, K.E.; Striegl, R.G.; Raymond, P.A.; Holmes, R.M.; McClelland, J.W.; Peterson, B.J. Landscape-level controls on dissolved carbon flux from diverse catchments of the circumboreal. Glob. Biogeochem. Cycles 2012, 26, GB0E02. [Google Scholar] [CrossRef]
  89. Tank, S.E.; Raymond, P.A.; Striegl, R.G.; McClelland, J.W.; Holmes, R.M.; Fiske, G.; Peterson, B.J. A land-to-ocean perspective on the magnitude, source and implication of DIC flux from major Arctic rivers to the Arctic Ocean. Glob. Biogeochem. Cycles 2012, 26, GB4018. [Google Scholar] [CrossRef]
  90. Tank, S.E.; Striegl, R.G.; McClelland, J.W.; Kokelj, S.V. Multi-decadal increases in dissolved organic carbon and alkalinity flux from the Mackenzie drainage basin to the Arctic Ocean. Environ. Res. Lett. 2016, 11, 054015. [Google Scholar] [CrossRef]
  91. Tank, S.E.; Lesack, L.F.W.; McQueen, D.J. Elevated pH regulates bacterial carbon cycling in lakes with high photosynthetic activity. Ecology 2009, 90, 1910–1922. [Google Scholar] [CrossRef] [PubMed]
  92. Kokelj, S.V.; Burn, C.R. Geochemistry of the active layer and near-surface permafrost, Mackenzie delta region, Northwest Territories, Canada. Can. J. Earth Sci. 2005, 42, 37–48. [Google Scholar] [CrossRef]
  93. Kokelj, S.V.; Jenkins, R.E.; Milburn, D.; Burn, C.R.; Snow, N. The influence of thermokarst disturbance on the water quality of small upland lakes, Mackenzie Delta Region, Northwest Territories, Canada. Permafr. Periglac. 2005, 16, 343–353. [Google Scholar] [CrossRef]
  94. Kokelj, S.V.; Zajdlik, B.; Thompson, M.S. The impacts of thawing permafrost on the chemistry of lakes across the subarctic boreal-tundra transition, Mackenzie Delta region, Canada. Permafr. Periglac. 2009, 20, 185–199. [Google Scholar] [CrossRef]
  95. Morgenstern, A.; Grosse, G.; Günther, F.; Fedorova, I.; Schirrmeister, L. Spatial analyses of thermokarst lakes and basins in Yedoma landscapes of the Lena Delta. Cryosphere 2011, 5, 849–867. [Google Scholar] [CrossRef] [Green Version]
  96. Ulrich, M.; Matthes, H.; Schirrmeister, L.; Schütze, J.; Park, H.; Iijma, Y.; Fedorov, A.N. Differences in behavior and distribution of permafrost-related lakes in Central Yakutia and their response to climatic drivers. Water Resour. Res. 2017. [Google Scholar] [CrossRef]
Figure 1. Location of three permafrost zones in the study territory of western Siberia. The position of the permafrost provenances in the western Siberian Lowland (WSL) is based on extensive geocryological work in this region [59].
Water 09 00228 g001
Figure 2. The total number of lakes (A) and their surface area (B) along the latitude. The dashed lines mark sporadic (S), discontinuous (D), and continuous (C) permafrost zones.
Water 09 00228 g002
Figure 3. Dependence of the lake density (A) and relative coverage of the surface (B) on the latitude. The dashed black lines mark sporadic (S), discontinuous (D), and continuous (C) permafrost zones. The dashed red lines represent the smoothing of lake number and coverage using a 2-degree grid.
Water 09 00228 g003
Figure 4. Synthetic map of the WSL coverage by lakes based on Landsat-8 scenes. The cell size is 0.25 degree in latitude and longitude.
Water 09 00228 g004
Figure 5. Relationship between the cumulative frequency (the number of lakes versus lake area) of lakes and the lake surface area for the whole territory of WSL (this study, red line), in comparison with lake distribution in the world (Global, dark blue line, [81]) and in Sweden (light blue line, [81]).
Water 09 00228 g005
Figure 6. The mass ratio of element stocks in all thermokarst lakes covering the territory of 105 million ha to annual element delivery to the Arctic ocean by WSL rivers from the same territory.
Water 09 00228 g006
Table 1. Thermokarst field parameters in different permafrost zones.
PermafrostTotal Number of Lakes, ThousandTotal Area of Lakes, Million haLake Coverage of the Area, %Lake Density, Number of Lake per km2
All territory727.75.975.690.69
Continuous305.02.596.280.74
Discontinuous207.71.655.410.68
Sporadic215.01.755.260.65
Table 2. Lake number, lake area, and volume for different size ranges.
Size Range, haNumber of LakesTheir Surface AreaWater Stock
Lakes%ha%km3%
0.5–1240,58233.056173,7682.90.9381.9
1–2171,30923.540247,3034.11.3352.7
2–5152,24020.920481,6518.14.0948.3
5–1072,0919.910507,4888.64.3148.7
10–2043,4435.970609,71310.25.18310.5
20–5030,0814.130926,36415.57.87415.9
50–10010,3541.420717,57112.06.09912.3
100–20046360.640638,17510.75.42511.0
200–50022270.310666,24511.25.66311.5
500–10005110.070352,4995.92.9966.1
1000–20001690.020233,8033.91.9874.0
2000–5000570.010162,6802.71.3842.8
5000–10,000190.003125,6712.11.0682.2
10,000–20,00090.001123,0662.11.0462.1
Total:727,728100.0005965,997100.049.40100.0
Table 3. Parameters of Equation (3) for three permafrost zones of the WSL.
ZoneAВ
continuous15.96 × 109−2.224
discontinuous6.82 × 109−2.154
sporadic1.68 × 109−2.065
Table 4. Dissolved organic and inorganic carbon (DOC and DIC, respectively), and major and trace element stocks in the thermokarst lakes of the Western Siberia Lowland (105 million ha). The major and trace elements are listed in the order of increasing atomic number (periodic table).
ElementC, µg/LStock, TonElementC, µg/LStock, Ton
DOC20,000 ± 10,000500,000 ± 150,000Zn10 ± 5500 ± 250
DIC430 ± 10022,200 ± 5000As0.63 ± 1331 ± 6
B3 ± 1150 ± 50Rb0.3 ± 0.115 ± 5
Mg190 ± 409400 ± 2000Sr6 ± 2300 ± 100
Al120 ± 206000 ± 1000Zr0.10 ± 0.034.9 ± 0.5
Si300 ± 10015,000 ± 5000Mo0.05 ± 0.022.5 ± 0.5
K235 ± 6012,000 ± 3000Ba3.0 ± 1.5150 ± 75
Ca700 ± 50030,000 ± 20,000Cd0.02 ± 0.0050.99 ± 0.25
V0.6 ± 0.230 ± 10La0.20 ± 0.069.9 ± 3.0
Cr1.0 ± 0.550 ± 25Ce0.10 ± 0.034.9 ± 0.5
Mn20 ± 3900 ± 150Nd0.10 ± 0.034.9 ± 0.5
Fe200 ± 5010,000 ± 4000Pb0.26 ± 0.0512.8 ± 2.5
Co0.10 ± 0.0254.9 ± 1.2Th0.015 ± 0.0050.74 ± 0.24
Ni0.4 ± 0.220 ± 10
Cu0.55 ± 0.1527 ± 7

