Article

Human Exposure Risk Assessment Due to Heavy Metals in Groundwater by Pollution Index and Multivariate Statistical Methods: A Case Study from South Africa

by
Vetrimurugan Elumalai
1,*,
K. Brindha
2 and
Elango Lakshmanan
3
1
Department of Hydrology, University of Zululand, Kwa Dlangezwa 3886, South Africa
2
Department of Civil and Environmental Engineering, National University of Singapore, Singapore 117576, Singapore
3
Department of Geology, Anna University, Chennai 600025, India
*
Author to whom correspondence should be addressed.
Water 2017, 9(4), 234; https://doi.org/10.3390/w9040234
Submission received: 13 December 2016 / Revised: 25 February 2017 / Accepted: 19 March 2017 / Published: 11 April 2017

Abstract

:
Heavy metals in surface and groundwater were analysed and their sources were identified using multivariate statistical tools for two towns in South Africa. Human exposure risk through the drinking water pathway was also assessed. Electrical conductivity values showed that groundwater is desirable to permissible for drinking except for six locations. Concentration of aluminium, lead and nickel were above the permissible limit for drinking at all locations. Boron, cadmium, iron and manganese exceeded the limit at few locations. Heavy metal pollution index based on ten heavy metals indicated that 85% of the area had good quality water, but 15% was unsuitable. Human exposure dose through the drinking water pathway indicated no risk due to boron, nickel and zinc, moderate risk due to cadmium and lithium and high risk due to silver, copper, manganese and lead. Hazard quotients were high in all sampling locations for humans of all age groups, indicating that groundwater is unsuitable for drinking purposes. Highly polluted areas were located near the coast, close to industrial operations and at a landfill site representing human-induced pollution. Factor analysis identified the four major pollution sources as: (1) industries; (2) mining and related activities; (3) mixed sources- geogenic and anthropogenic and (4) fertilizer application.

1. Introduction

Human habitation and disposal of wastes affect the water supply sources and leads to new environmental issues. Metals enter into surface water and groundwater through weathering of rocks [1,2,3] or from human activities including mining, industrial wastes or airborne particulate matter [4,5]. Groundwater pollution due to heavy metals where it is used as a source of drinking water [6,7,8] and the possible risk to human health has been studied widely [9,10]. This is because certain heavy metals are required for normal functioning of the human body, but exposure to excess concentration of heavy metals may lead to health risks. World Health Organisation (WHO) lists four heavy metals (arsenic, lead, mercury and cadmium) in its list of ten chemicals as a major public health concern [11]. Arsenic is a much studied heavy metal in groundwater affecting larger parts of Asia [12,13,14,15] and is mainly geogenic in origin.
Many industrial practices like combustion, extraction and processing use heavy metals for production. Wastewater from these industries will contain heavy metals that pollute soil, surface water and groundwater if proper care is not taken in the disposal [16,17]. Tanneries causing chromium pollution due to use of chromium sulphate during the tanning process is a major concern in Bangladesh and India [18,19,20]. Due to poor management, landfills [21,22] and municipal wastewater [23] have been the source of groundwater and soil pollution especially in developing countries. Occurrence of metals in groundwater in areas possessing mineral deposits and associated mining activities are common [24,25,26,27]. Potential risk of heavy metal contamination due to application of fertilisers was reported by many others [28,29,30].
South Africa is experiencing a water crisis and the problem is more aligned towards water quality than the quantity. Challenges to water shortage and access to water of desirable quality include population increase, economic growth and climate change. Agricultural practices mostly depend on groundwater in many parts of the country apart from public water supply. Almost two-thirds of the country’s population rely on groundwater for domestic needs [31]. Hence, there is increasing stress to maintain the quality of water so that it does not have any negative impact on human health or flora and fauna. Deterioration of water quality will have wider economic implications on various sectors including agriculture, industry and recreation [32]. The Department of Water Affairs and Forestry (DWAF) of the Republic of South Africa has reported that effluent discharge from industries had led to salinisation and contamination due to heavy metals in groundwater, but the exact contaminant levels are not available [32]. There are several studies on heavy metals in groundwater in several parts of the world including some urban areas in South Africa. More studies on regional water quality based on heavy metals are essential to quantify the extent of pollution and plan for possible measures of mitigation. Thus, in this study, water quality assessment was carried out in Richards Bay and Empangeni towns of South Africa. The demand for water in these areas is increasing to satisfy the needs of industries, mining, agriculture and urban water supply. Being a highly industrialised and commercial region of South Africa, there is ample scope to study and improve the groundwater quality of this region, which is considered a highly vulnerable area to pollution [32].
Studies that involve large datasets or involve assessment of many parameters rely on statistical techniques to interpret and group the common or independent source of the parameters [33]. Such techniques serve as a rapid and powerful tool for scientists and decision-makers to arrive at a management solution [34]. This study was carried out with an aim to quantify the heavy metals in groundwater and to evaluate the impact of human-induced activities on groundwater in South Africa using multivariate statistical analysis and human exposure risk analysis through the drinking water pathway.

2. Materials and Methods

2.1. Description of Study Area

The study area forms part of the Mhlathuze Catchment, which is centred around the two major towns- Empangeni and Richards Bay. These two towns are located 160 km north of Durban, the capital of the KwaZulu-Natal Province, South Africa. It covers an area of approximately 792 km2 (Figure 1). This region experiences a humid and wet climate, which is unique compared to the other African regions [35]. The average daily temperature varies between 21 °C and 29 °C during January–March and from 12 °C to 23 °C during June–August. Located in one of the highest rainfall regions in South Africa [36], this catchment receives an annual rainfall ranging from 850 mm in the west to over 1200 mm along the coastal belt [31]. Most of the rainfall occurs from October to March and winter rain is most often associated with frontal weather from the south. The Mhlathuze River is one of the largest rivers that originates from the Babanago hills and flows through Empangeni and Richards Bay where it drains into the Indian Ocean. The study area is characterized by a fairly flat to undulating landform with low hills and flat bottomed drainage features. Surface water flows in both natural and artificial drainage channels. Soil in this area is highly permeable and a large portion of rainfall infiltrates into the subsurface. The Zululand coastal plain was formed in recent Cenozoic time (post Cretaceous) through sedimentary erosion and deposition [37]. Holocene aeolian, alluvial, estuarine dune and beach deposits are expected to be encountered on the surface [38,39] in the form of grey-brown fine grained sand to clayey sand in places, as well as calcareous and non-calcareous sands [37]. Primary aquifers occur in the unconsolidated geological formations [37]. Rainfall recharge is the main source of water replenishment and evaporation is the sink. Land use is of commercial forest plantations that include wattle, pine and eucalyptus in addition to agricultural irrigation like sugar cane, citrus, vegetables, maize and other crops. Grassland is used for grazing livestock. Richards Bay hosts a range of industries like aluminium smelters, fertilizer plants, and mining of ores of iron, titanium and zircon. It also has the largest coal export facility in Africa [40].

2.2. Methods

Groundwater samples were collected in September 2015 from thirty-five wells. Three surface water samples from the Mhlathuze River and one sample from the Redding Dam (that stores water for irrigation needs) were also collected. Care was taken to distribute the sample collection throughout the study area. These locations were chosen based on several electrical conductivity (EC) measurements along the river. A YSI multiprobe digital meter (YSI Inc., Yellow Springs, OH, USA) was used to measure the EC of samples. Samples were collected in 500 mL high-density polyethylene bottles that were rinsed in distilled water prior to sample collection. At the sampling site, the bottles were rinsed again with the water to be sampled. Samples were filtered using 0.45 µm membrane, filled up to the brim of the bottle, preserved with 0.5 mL concentrated HNO3 solution, sealed immediately to avoid exposure to air and were labelled. The EC meter was pre-calibrated with 84 µS/cm and 1413 µS/cm conductivity solutions before use. From the EC values, total dissolved solids (TDS) were calculated by TDS (mg/L) = EC (µS/cm) × 0.64 [41]. Acidified aliquots were analysed for heavy metals and trace elements by inductively coupled plasma mass spectrometry (ICPMS). Analytical precession was checked by frequently analysing the standards as well as blanks.
Heavy metal pollution index (HPI) was calculated using the formula below [42,43,44],
HPI =   i = 1 n W i Q i i = 1 n W i ,
where Wi and Qi are the unit weightage and sub-index of the i-th parameter, respectively, and n is number of parameters considered:
Wi = K/Si,
K = 1 i = 1 n 1 S i ,
where K and Si are the proportionality constant and the standard permissible limit in water for the i-th parameter, respectively,
Qi = i = 1 n | M i I i | ( S i I i )   × 100 ,
where Mi, Ii and Si are the monitored value, ideal value and standard value of i-th parameter.
Human exposure to heavy metals is through several pathways including oral, inhalation and dermal. Due to the risk of using groundwater for drinking use, the human exposure risk through the drinking water pathway is calculated using the modified equation from the United States Environmental Protection Agency (US EPA) [45]:
HEDW = (C × IR)/(BW),
where HEDW, C, IR and BW are the human exposure risk through drinking water pathway (mg/kg/day), concentration of the heavy metal in water (mg/L), ingestion rate of water (L/day) and body weight (kg), respectively.
Hazard quotient (HQ) for non-carcinogenic risk for each heavy metal is calculated by
HQ = HEDW/RfD,
where RfD is the oral toxicity reference dose for a heavy metal that an individual can be exposed to (mg/kg/day). HQ is calculated for each heavy metal and the sum of HQ of all metals is used to determine the non-carcinogenic risk. HQ < 1 is considered safe for human health.
IBM SPSS Statistics 22.0 (IBM, Armonk, NY, USA) was used for correlation and factor analysis. Correlation matrix helps to identify the positive and negative relationship among the heavy metals. Factor analysis to group the samples based on similarity can be expressed as,
x j = r = 1 n a j r f r + e j ,
where xj is the measured variable, ajr is the factor loading for j-th variable on the r-th factor, fr is the r-th common factor, n is the number of factors and ej is the random variation unique to the measured variable, xj [46].

3. Results

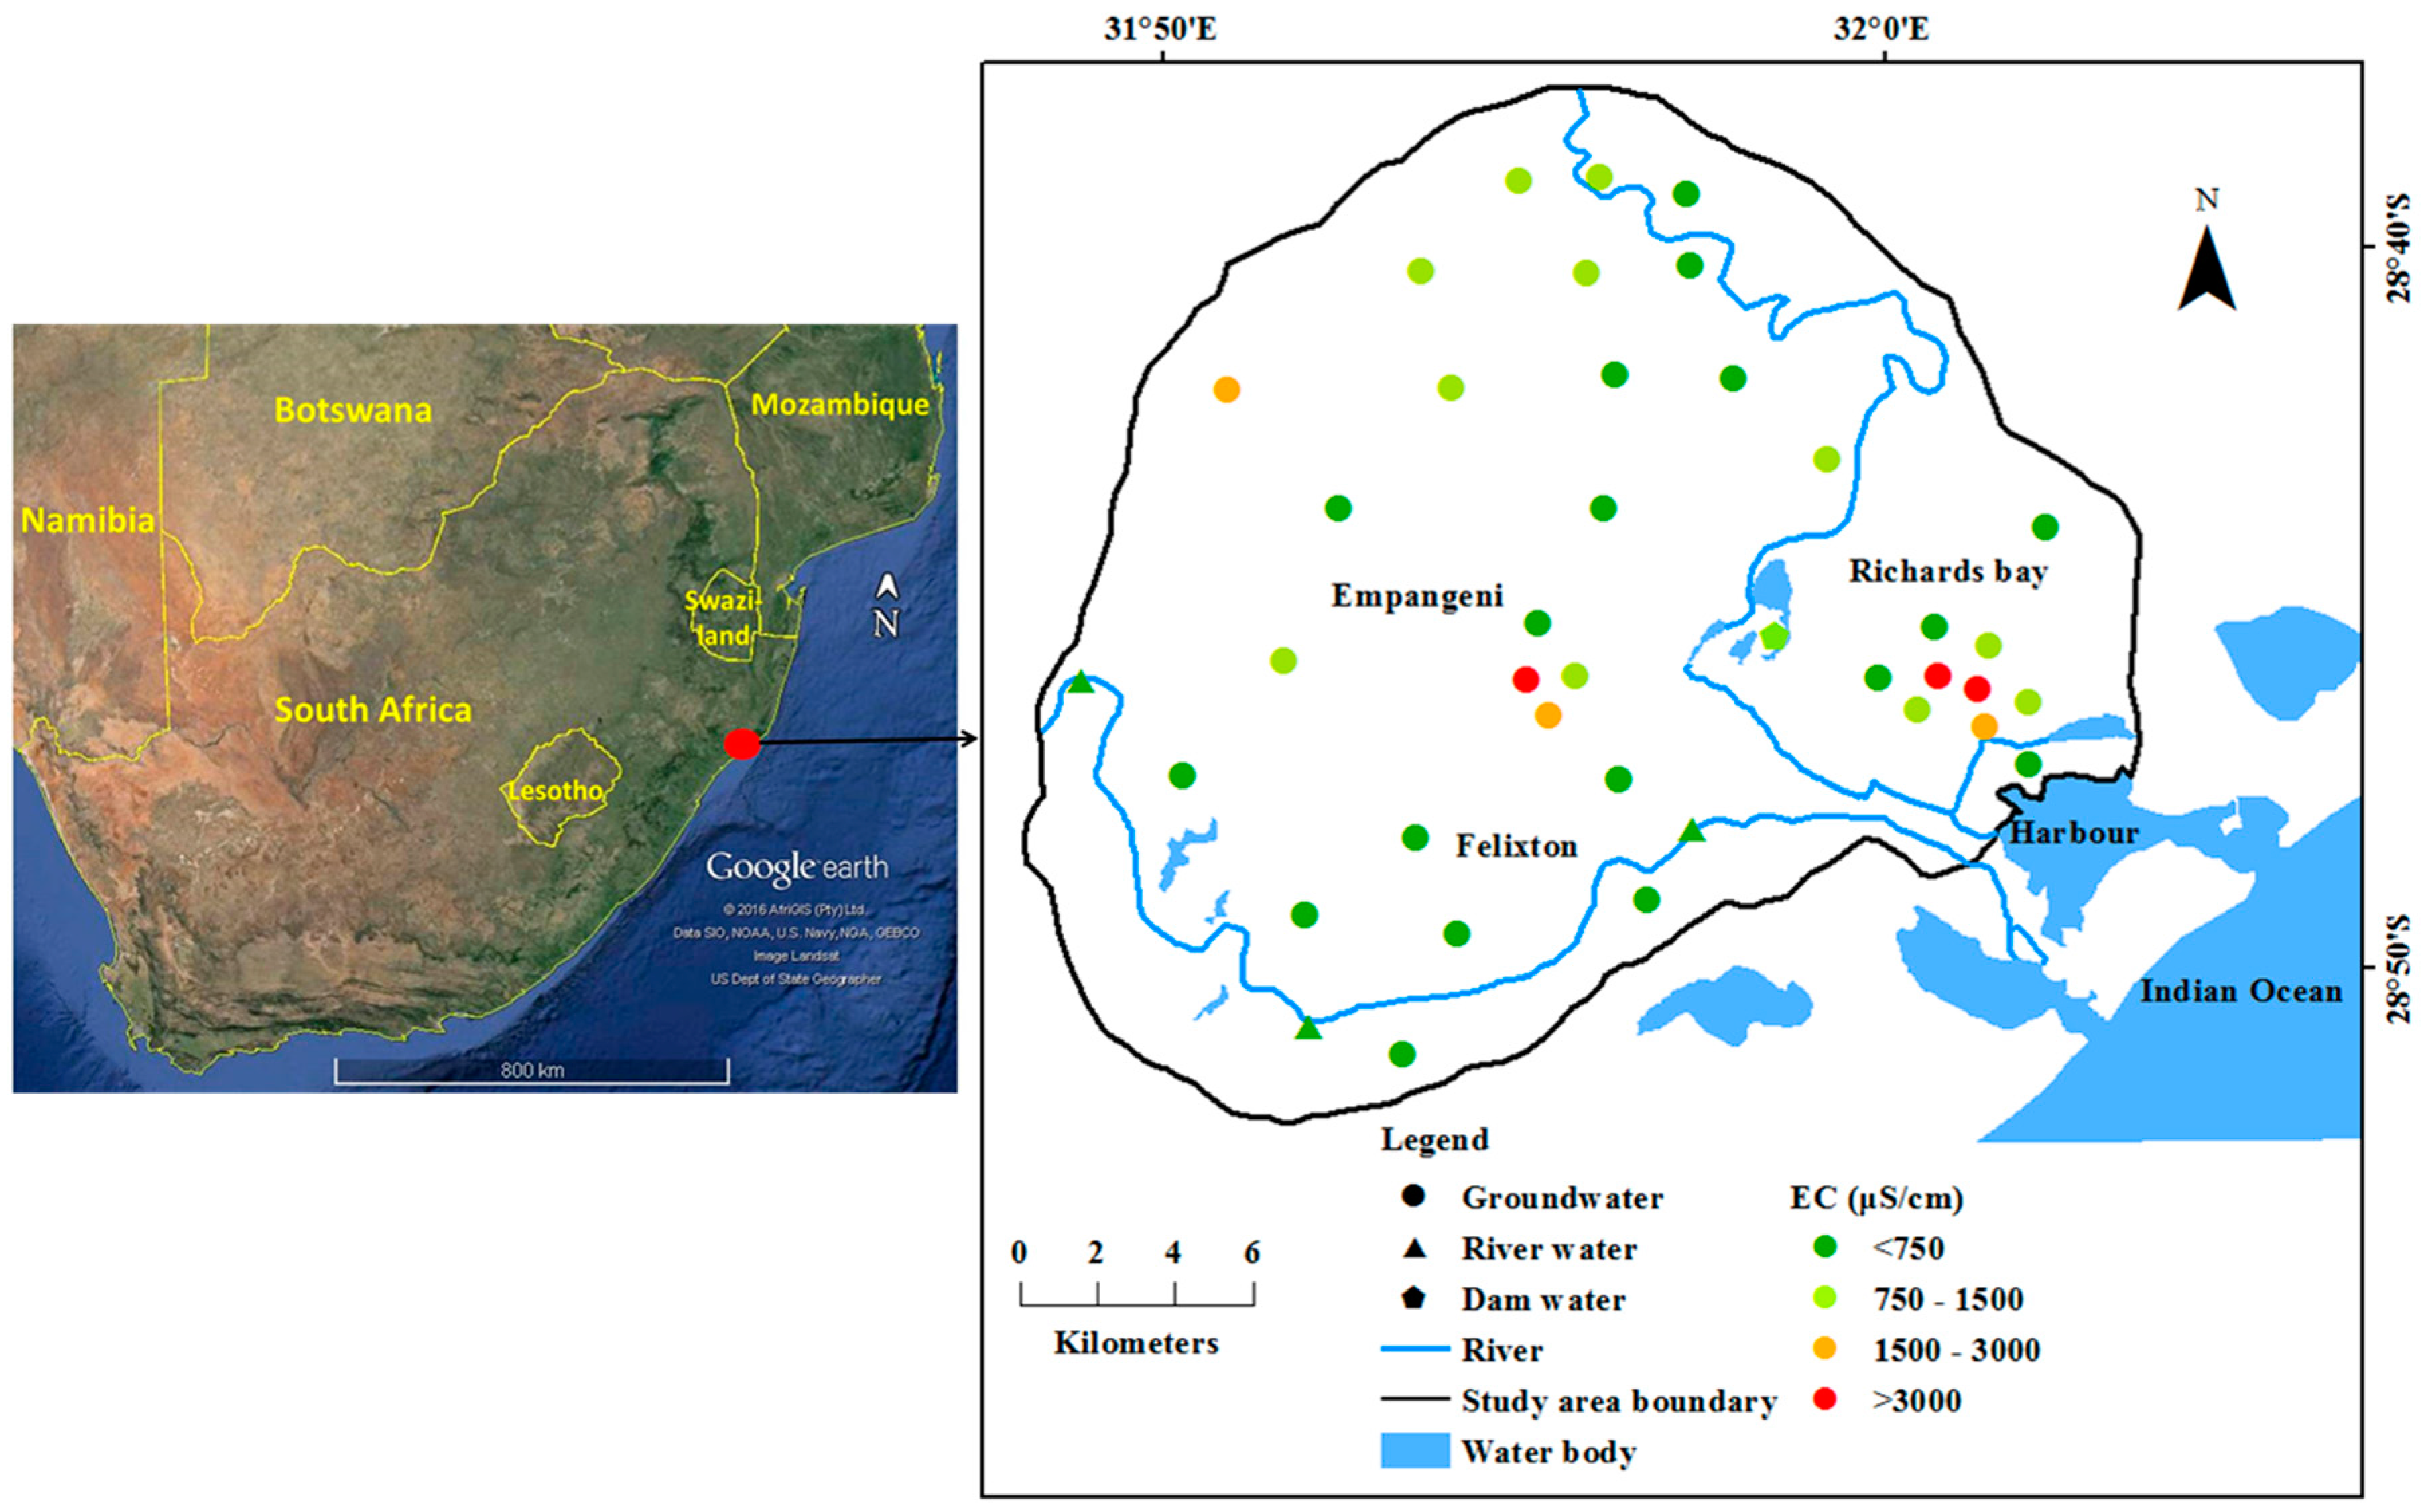
EC is a good indicator of total salinity or total amount of dissolved solids in water. Though it does not provide detailed information about the ionic composition in water, this can be used to determine the suitability of water for drinking and irrigation use. Desirable EC in drinking water is <750 μS/cm and the range between 750 and 1500 μS/cm is permissible. Groundwater quality at eighteen locations was desirable and eleven locations was permissible for drinking (Figure 1). Three groundwater samples were not permissible i.e., ranging from 1500 to 3000 μS/cm and three samples were hazardous with high EC exceeding above 3000 μS/cm. Surface water samples from the Mhlathuze River have EC < 750 μS/cm. Though this is suitable for drinking, it is not used for a domestic purpose in this area. Water stored in the dam for irrigation use had permissible EC.
TDS also helps to determine the suitability of water for drinking and irrigation. Groundwater at twenty-nine locations was either desirable or permissible for drinking, whereas, at four locations, the water could be used only for irrigation. As a worst case, at two locations, the TDS was higher than 3000 mg/L (same locations as EC because TDS is calculated from EC) and unfit for any intended use [47]. Groundwater will require treatment if it has to be used for domestic water supply. If this water was used for irrigation, it will increase the salinity of the soil. Prolonged use of high TDS water will turn the soil unsuitable for plant growth and irrigation will have to shift to more salt-resistant crops.
The unsuitable groundwater samples based on TDS were located near the Richards Bay harbour and in the central part near Empangeni. River water samples were within 500 mg/L of TDS and do not pose threat to human health due to consumption. Dam water was also permissible for drinking and not harmful for irrigation (Table 1). TDS indicates that surface water from the river and the dam are fresh [48]. Twenty-nine groundwater samples were fresh while five locations with TDS between 1000 and 10,000 mg/L were brackish. One groundwater sample having TDS of 16,806 mg/L is classified as saline (Table 1). This sample is located close to the active landfill and the dumping of wastes from the Empangeni town have increased the groundwater salinity.
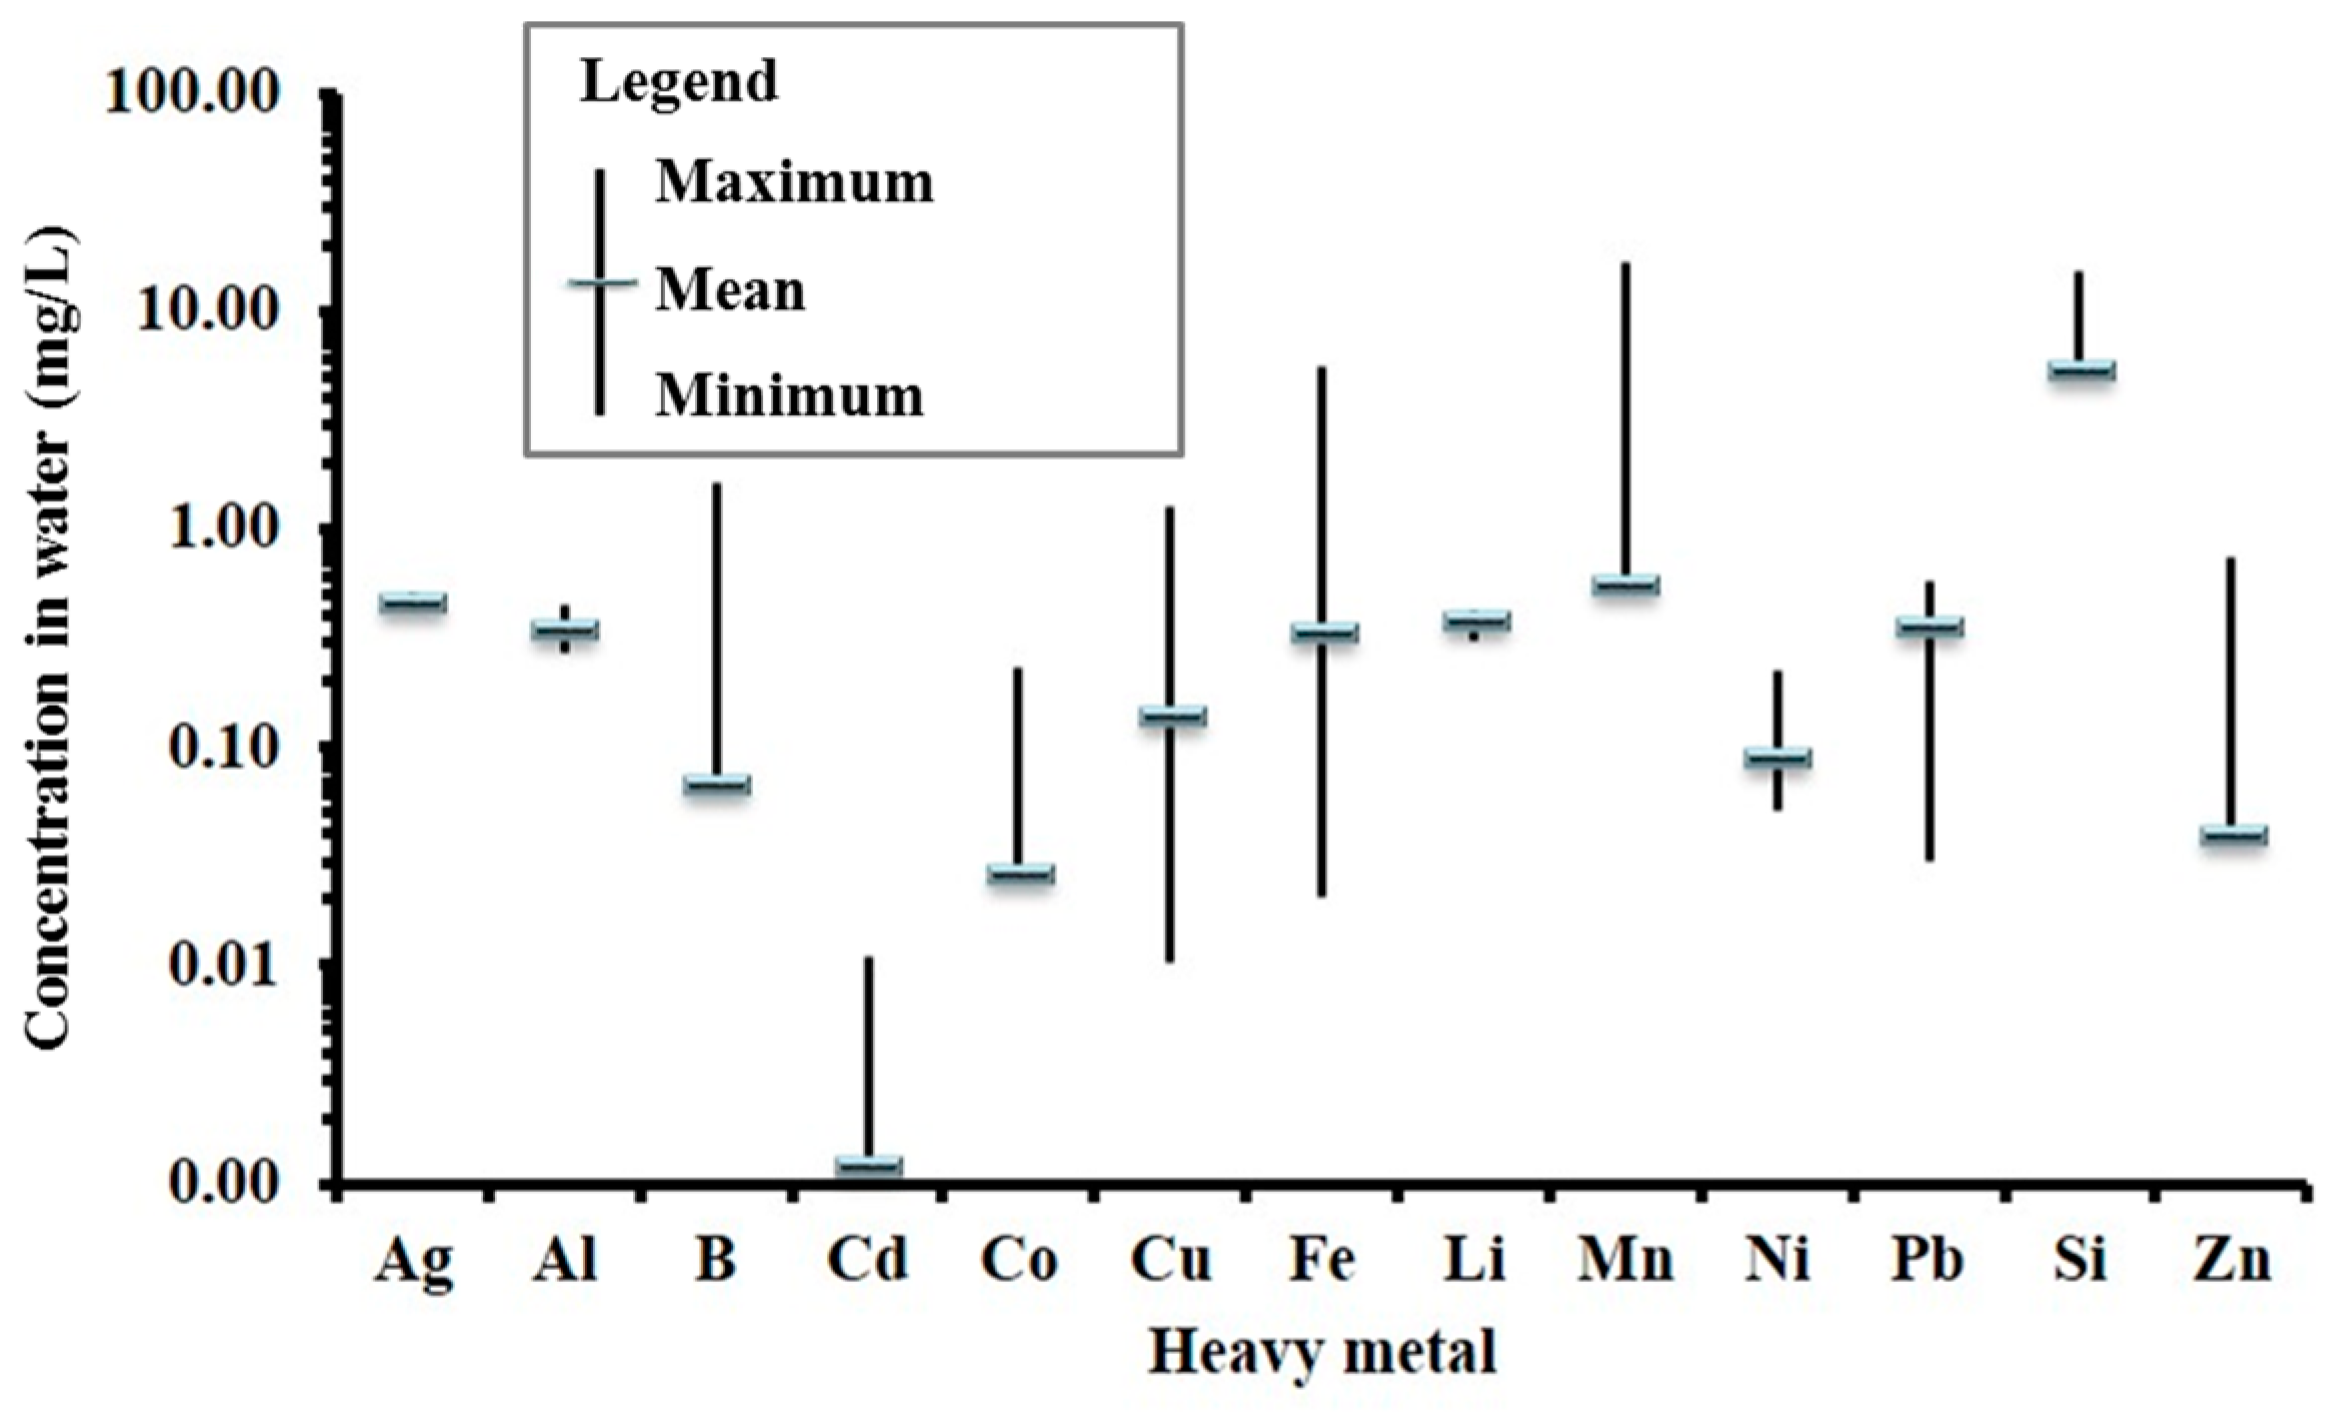
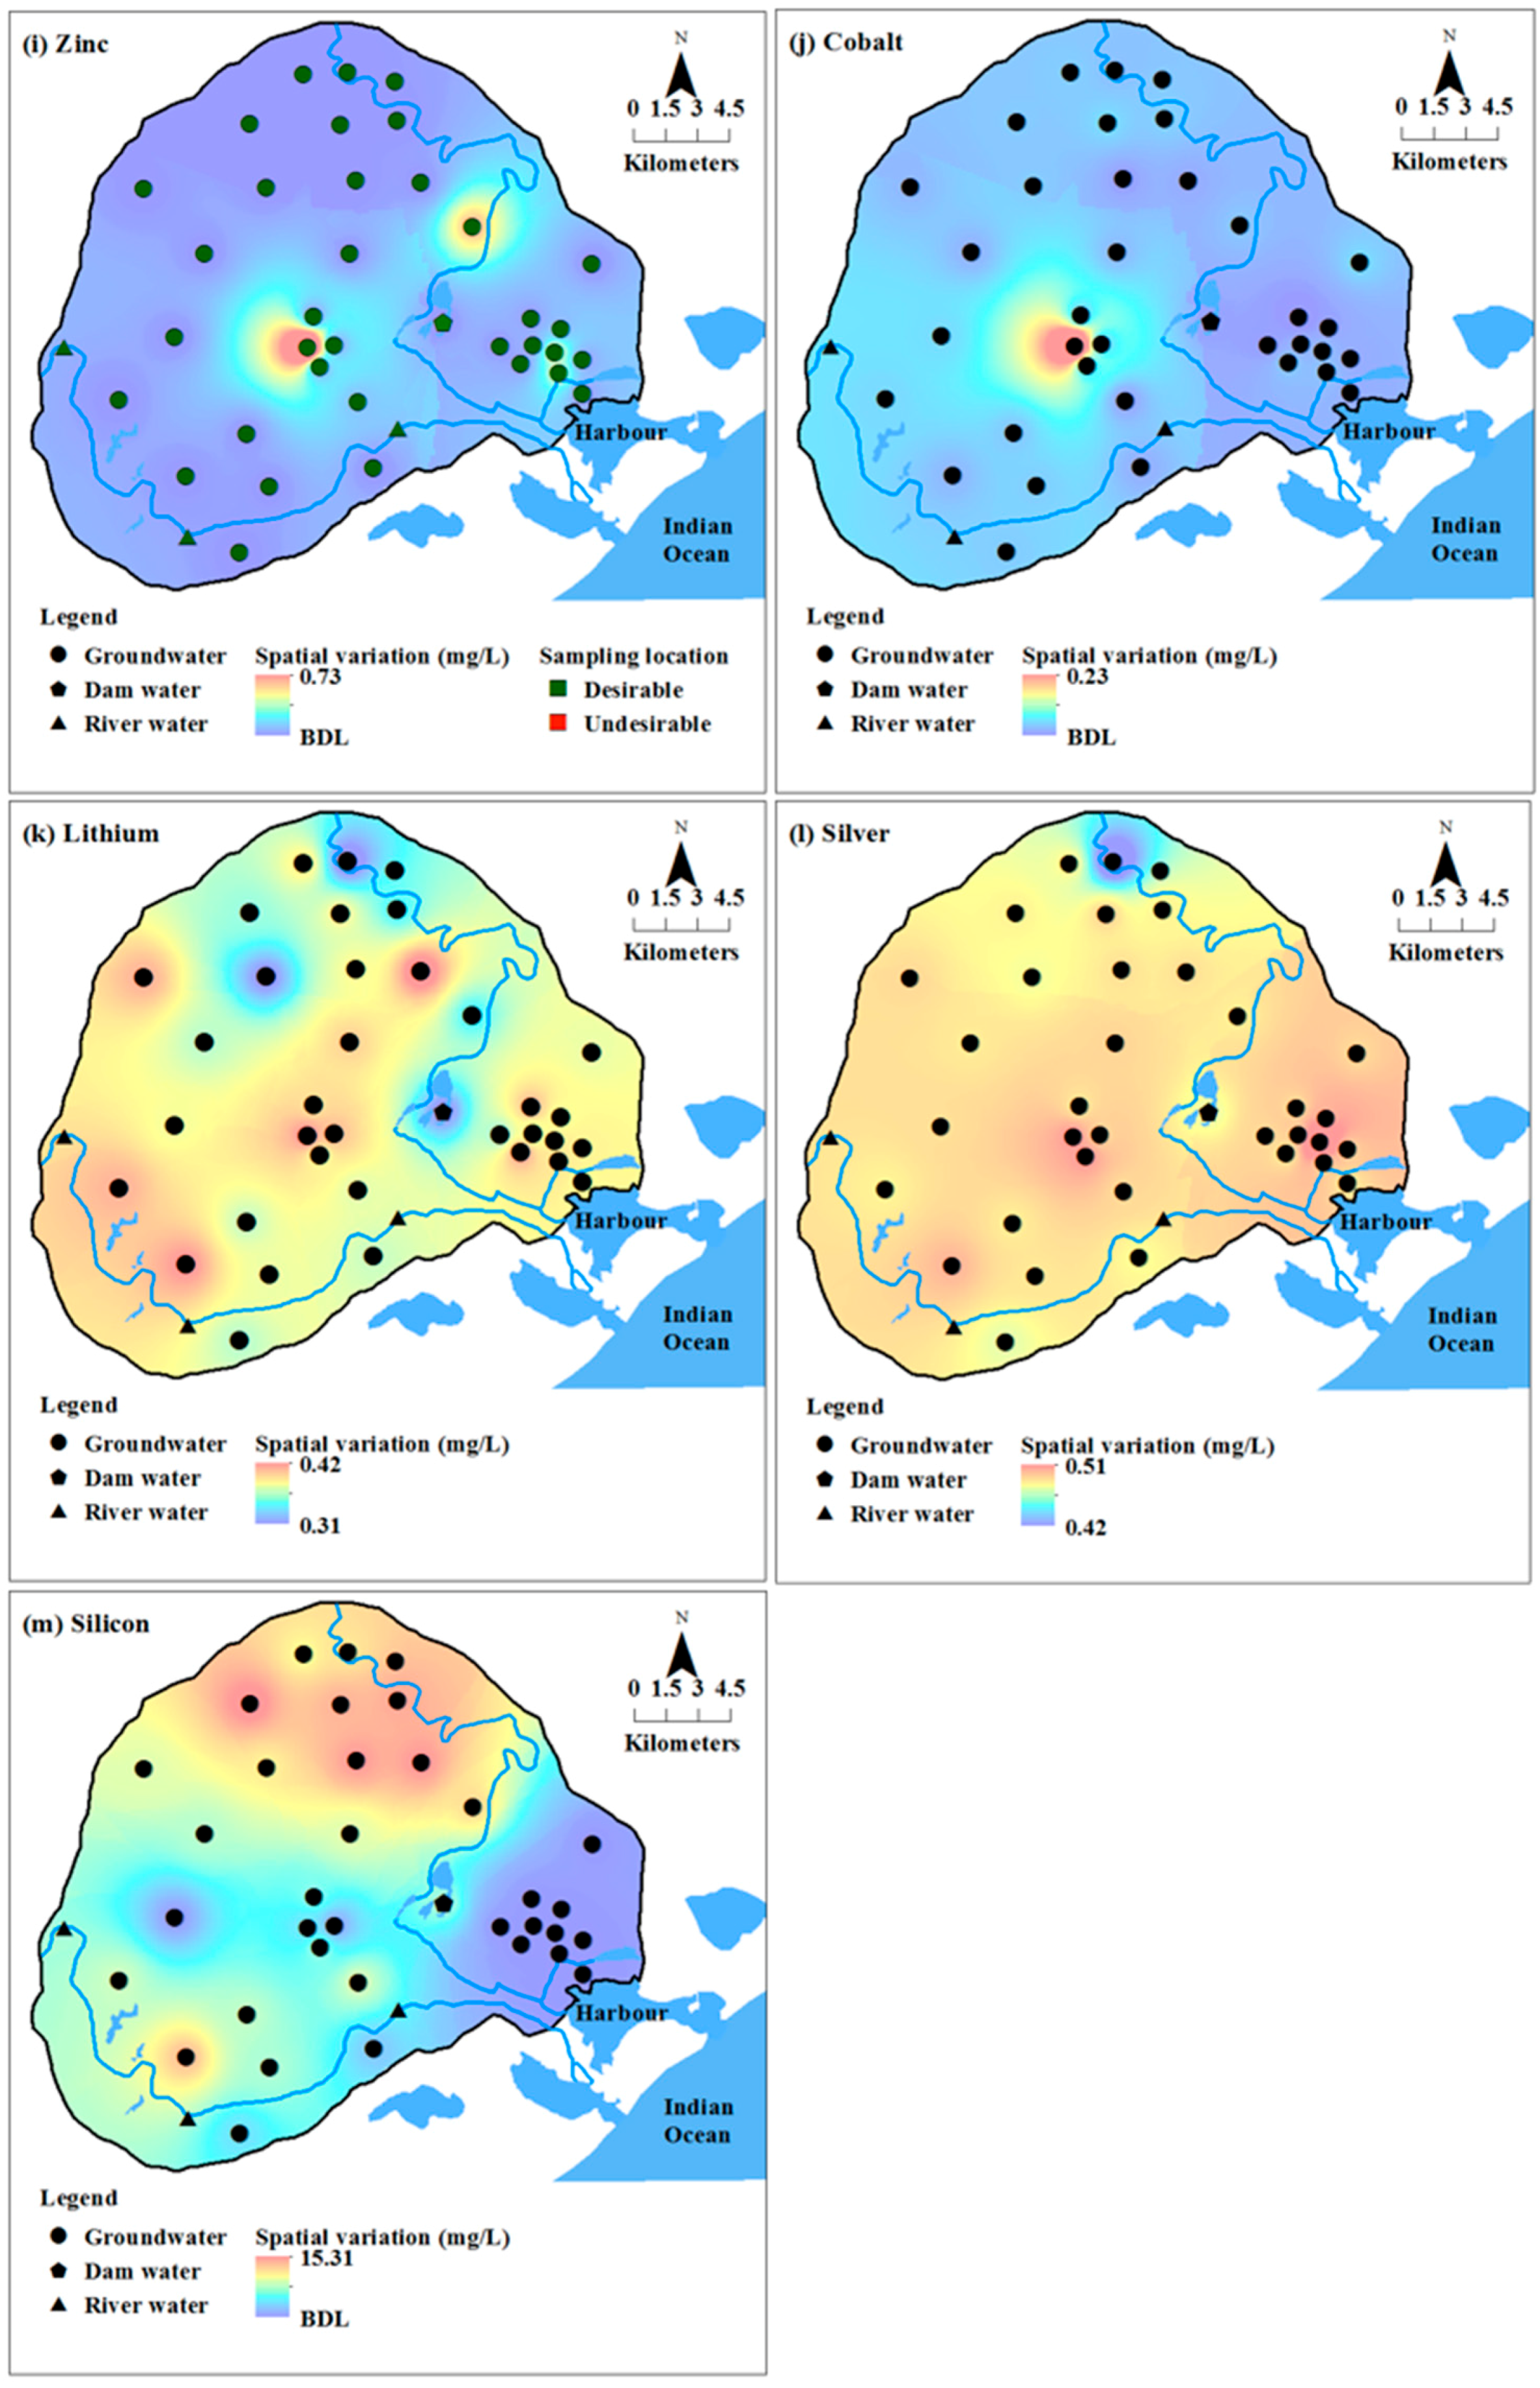
Range of heavy metals measured in the water samples is given in Figure 2. Concentration of metals in water was compared against the water quality standards for drinking and domestic use. South African water quality guidelines for domestic use proposes a target water quality range, which is described as ‘what is considered good or ideal water quality’. Water quality outside of this range may, under certain circumstances, still be acceptable [49]. These ranges are available only for eight of the heavy metals studied and, of these, aluminium, cadmium and chromium (VI) have no standard range, but has a no-effect range as the target guideline (Table 2). Comparison of the target water quality range of South Africa with the health based guidelines by the WHO [50] are given in Table 2.
Concentration of chromium, titanium and zirconium were below detection limits (BDL) in all the groundwater samples. In addition to these metals, silicon was also BDL in surface water. Cobalt, lithium, silicon, titanium and zirconium do not have any health-based guidelines or standard limits proposed by various organisations [49,51,52,53]. Copper and zinc were within WHO limits [50] in all samples. Aluminium, nickel and lead were above the limits in all the surface and groundwater samples. In groundwater, boron and cadmium exceeded WHO health guidelines in two groundwater sampling locations. Iron exceeds DWAF limits [
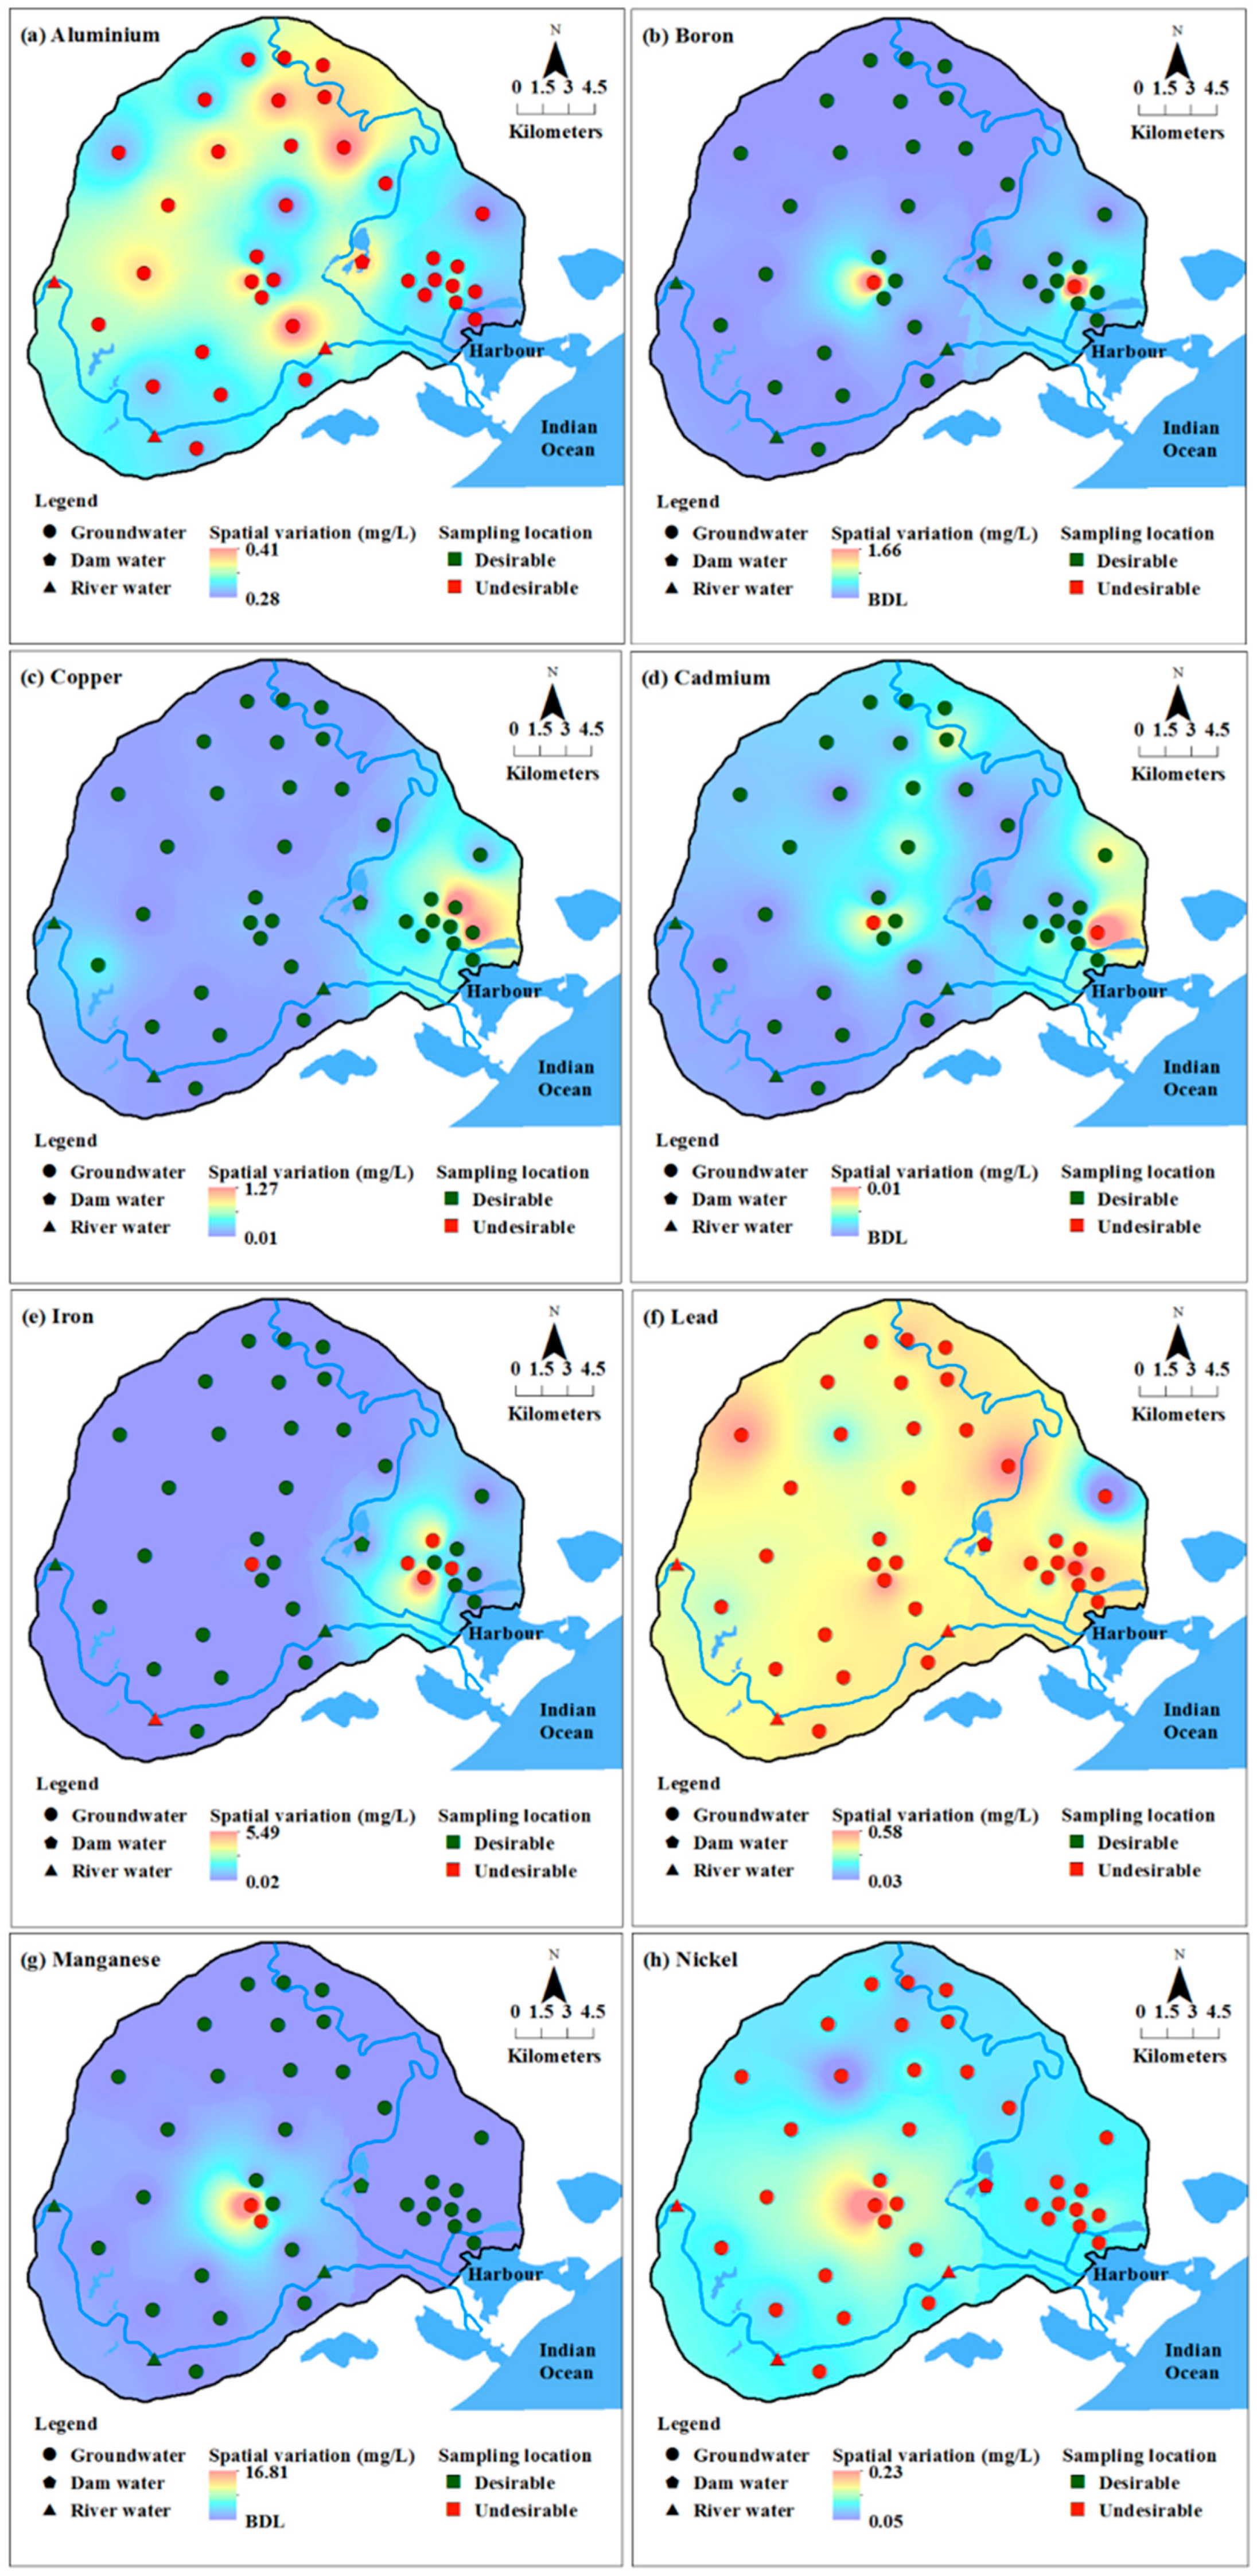
49] of 0.1 mg/L in five groundwater and one surface water sample collected (Figure 3). Manganese was above WHO limits i.e., 0.5 mg/L in two groundwater samples and above DWAF limits i.e., 0.05 in eight groundwater locations. Though limits are not proposed for silver, concentrations <0.05 mg/L normally occurs in fresh water [50] (Table 2) and concentrations above this can be indicative of pollution. All the samples of this area had above 0.05 mg/L of silver in groundwater as well as surface water. Spatial distribution of these heavy metals in groundwater (Figure 3) showed a high concentration of most heavy metals in the eastern and central parts of the study area.
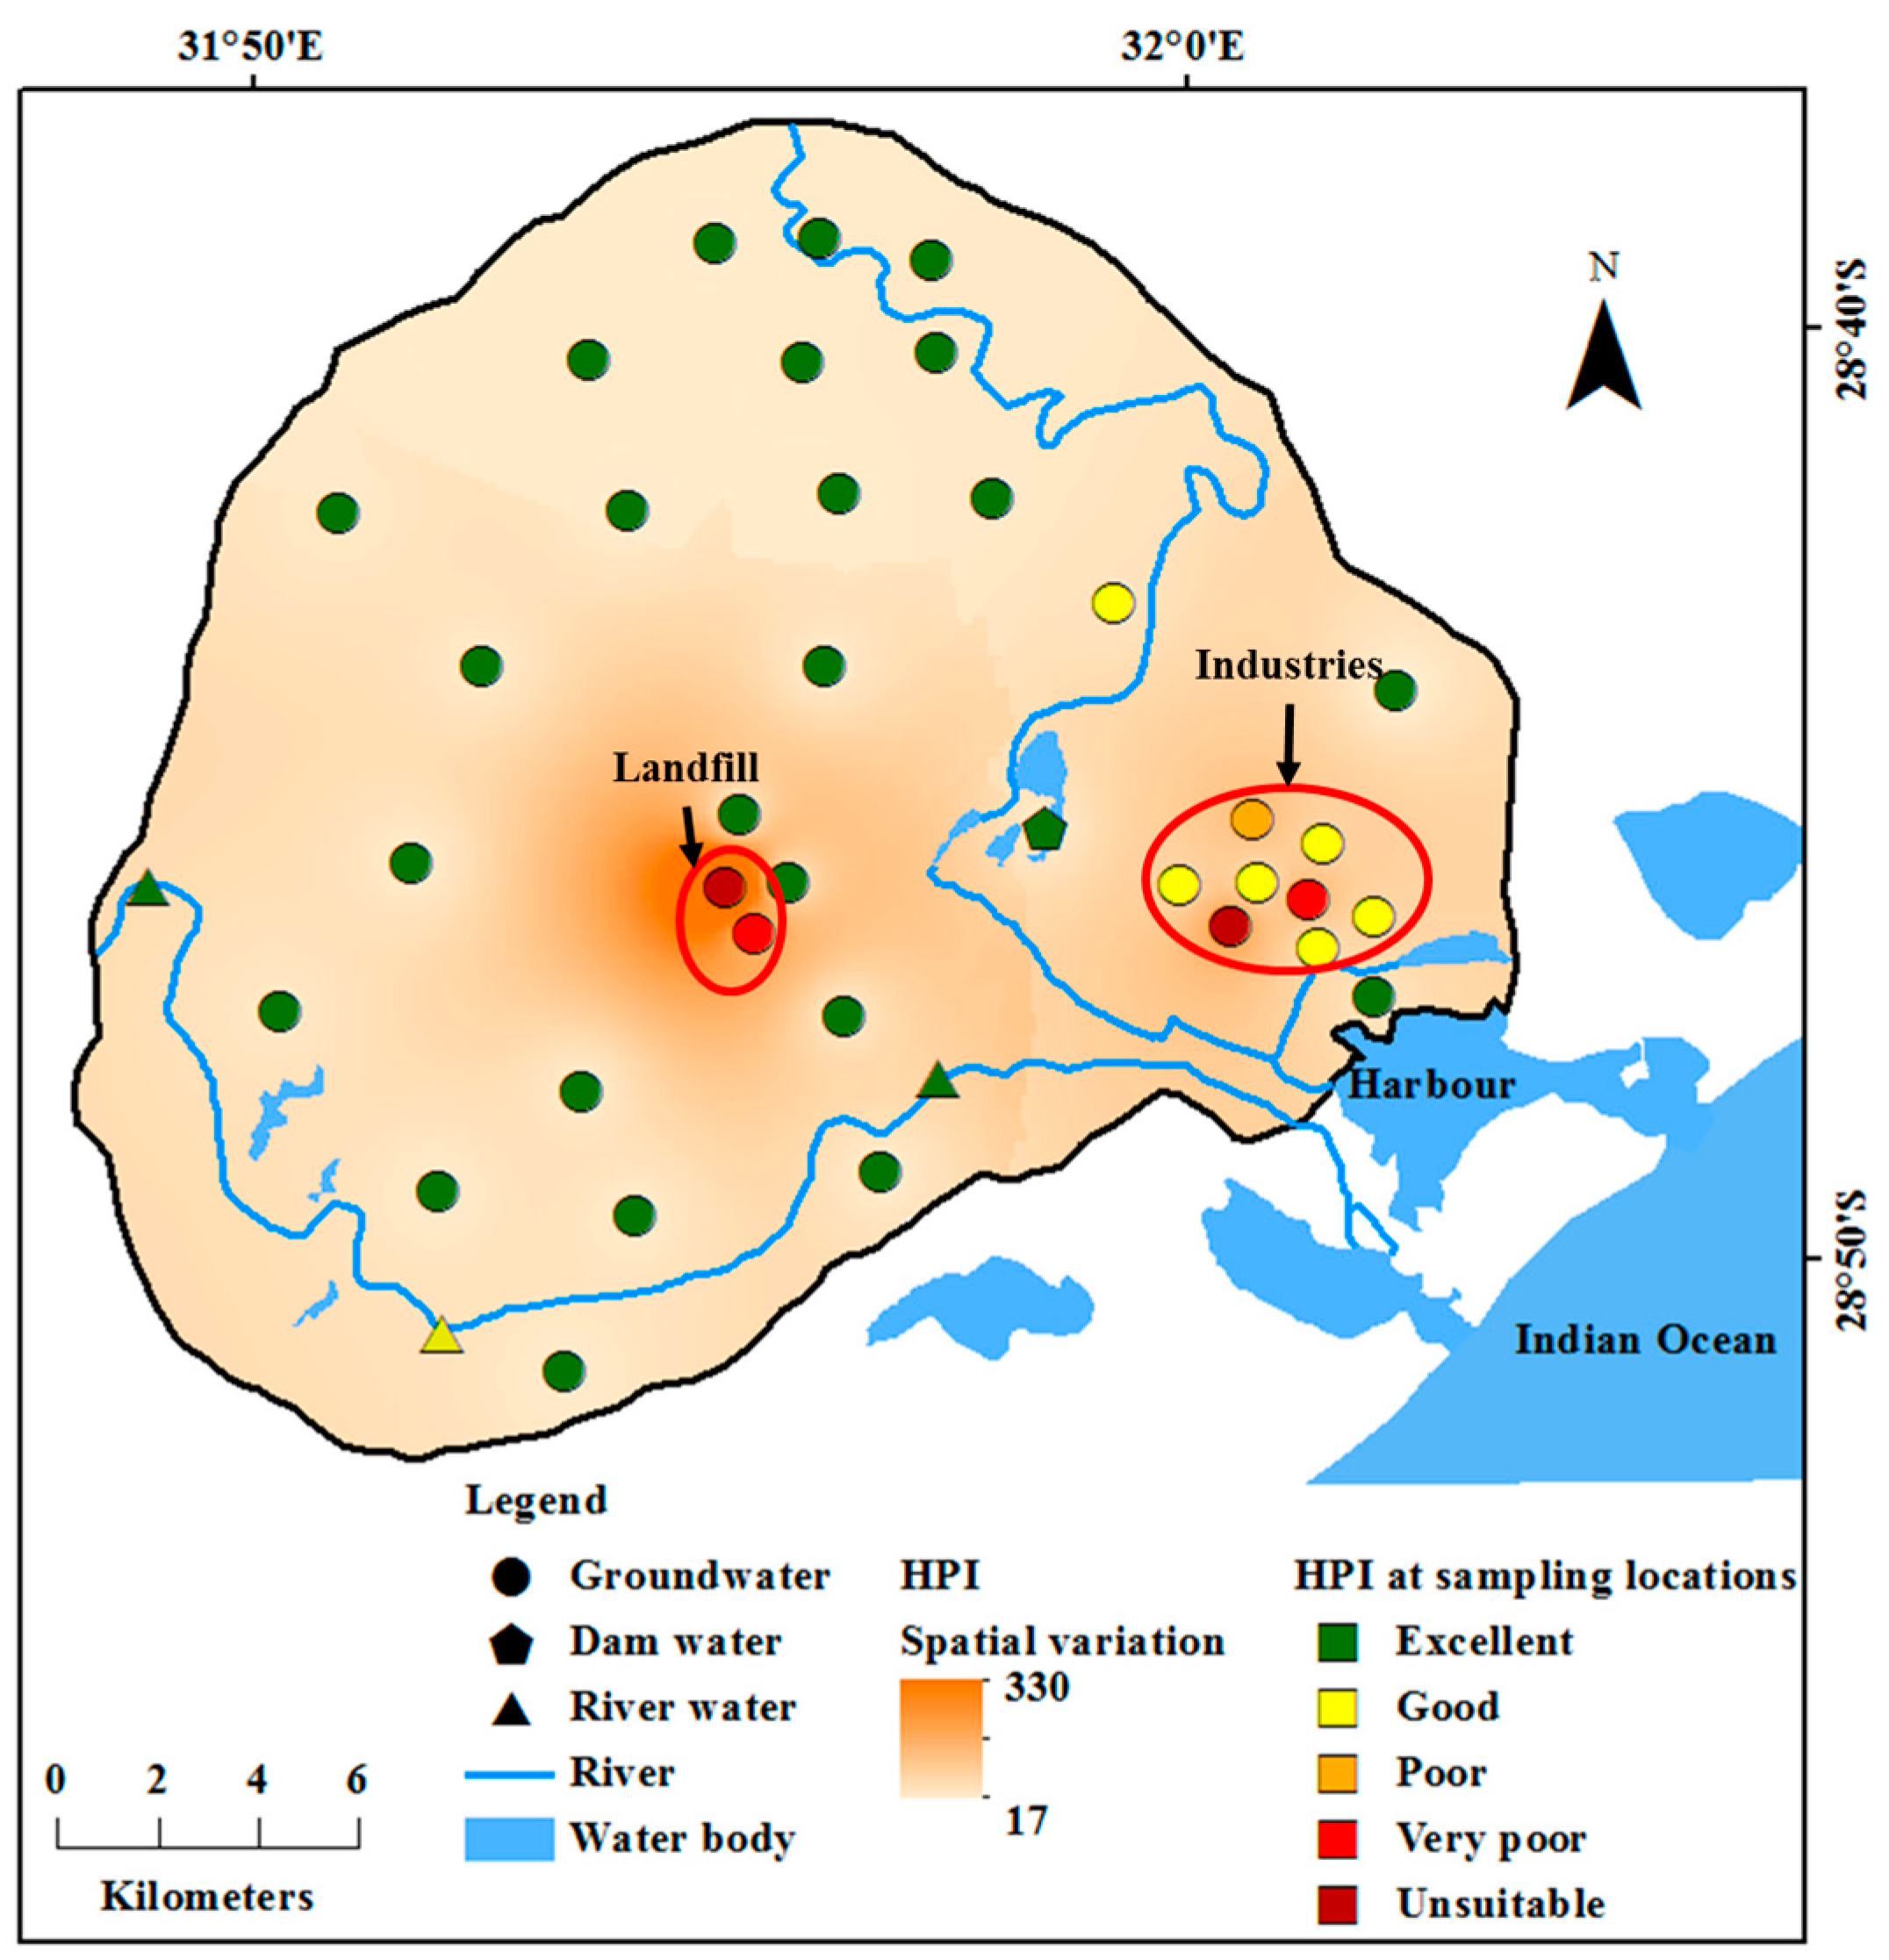
HPI was calculated for ten trace metals. Since chromium was BDL and five metals (cobalt, lithium, silicon, titanium and zirconium) do not have standard limits, they were not included in the HPI calculation. Standard values in Equations (2) to (4) are based on the maximum permissible limits of WHO prescribed in Table 2 for all heavy metals except for iron and silver. Concentration of 0.05 mg/L was considered as the standard limit for silver. DWAF [49] limit for iron (0.1 mg/L) was considered, as WHO has not suggested any guideline value for iron. Since the presence of these ions in drinking water is not desired, the ideal values for these ions is considered as 0 mg/L. HPI in groundwater varied from 17 to 330, river water was from 21 to 26 and dam water had the least HPI of 17. Classification of water samples based on HPI is given in Table 3. Groundwater is suitable in 68% of the area and the spatial variation in HPI shown in Figure 4.
Human exposure risk due to heavy metals was calculated separately for infants (0 to 6 months), children and adults as the intake of water differs among different age range. IR was 250 mL/day for infants, 1.5 L/day for children and 3 L/day for adults and body weight was 6 kg, 20 kg [54] and 60.7 kg [55] for infants, children and adults, respectively. Exposure risk (HEDW) was above 1 for manganese in children with the rest of the heavy metals being <1 for all human age groups. Statistical summary of HEDW for different metals are given in Table 4. The sum of HEDW also does not exceed 1 for all metals except for manganese under the children age group. The results do not provide conclusive evidence for determining the potential risk due to exposure of these metals through the drinking water pathway.
HQ takes into consideration the RfD specific to each metal and, based on the concentration level of the metal to cause acute or chronic disorders in humans, it can help to ascertain the risk in a better way. RfD values were available for most heavy metals (Table 5) except for aluminium, cobalt, iron, silver, titanium, zirconium and zinc. Though chromium has an RfD proposed by Integrated Risk Information System (IRIS) from US EPA [56], due to the low concentration (BDL) in the water samples, it was not included in the assessment of non-carcinogenic risk. Statistical details of the HQ for different metals are given in Table 6.
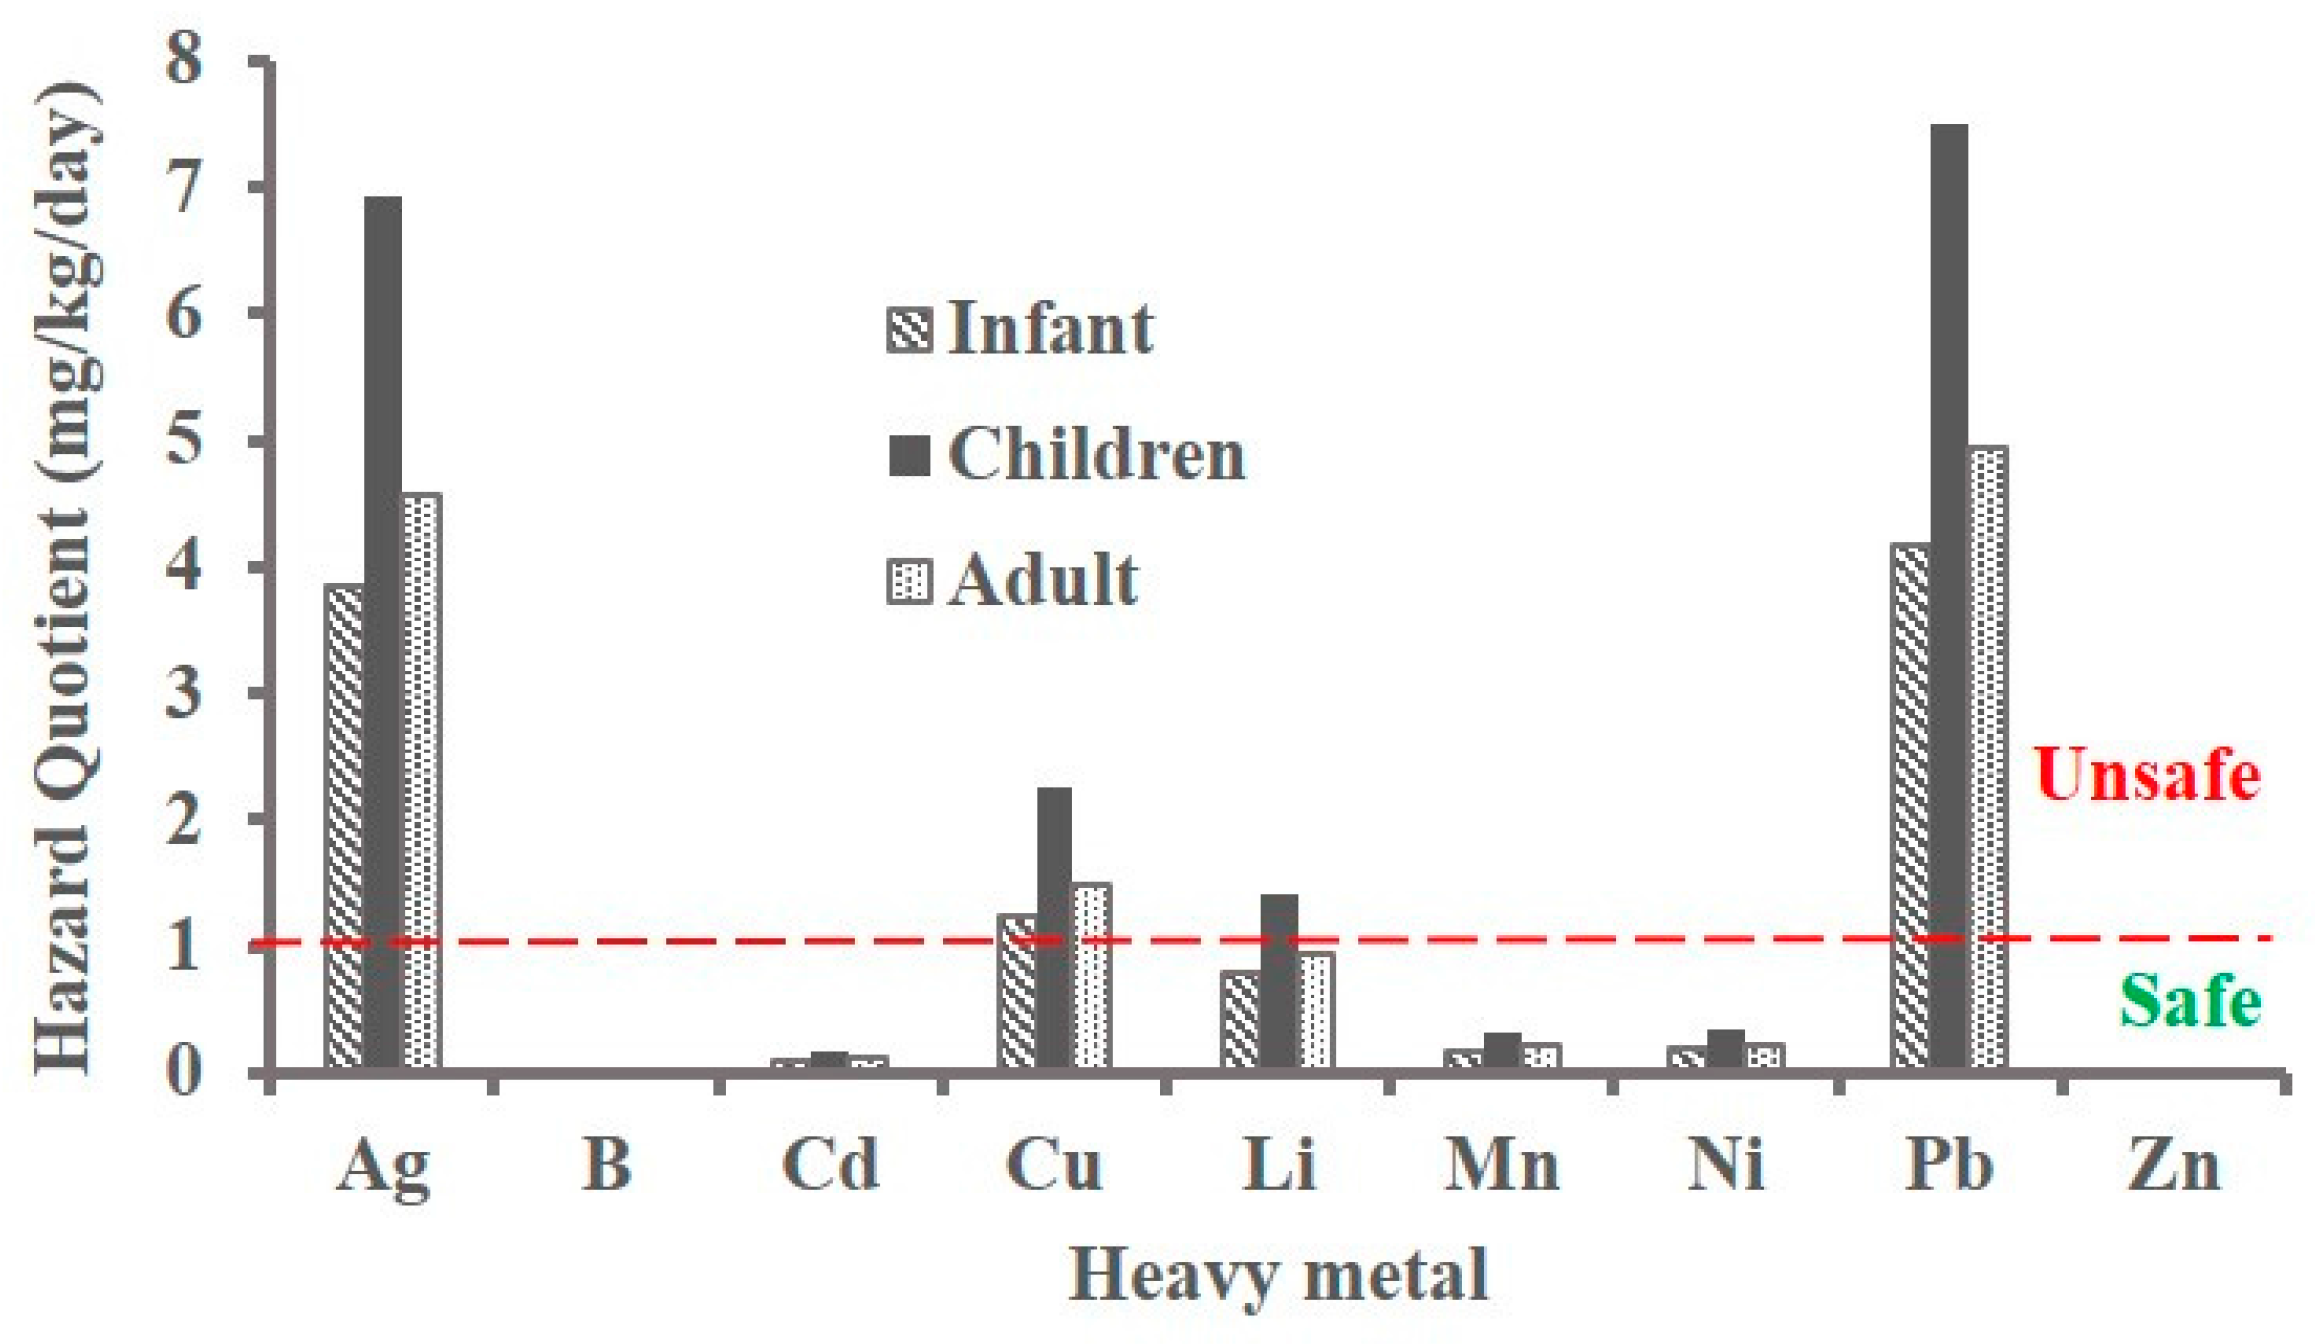
Considering the HQ of each heavy metal individually, boron, nickel and zinc do not pose any potential risk to human health. Concentrations of silver, copper, manganese and lead imply a major threat with HQ above 1 (Table 6). Cadmium and lithium are at the border of high risk level (based on maximum value in Table 6) for infants, but are potential risks to children and adults. Mean HQ of heavy metals (Figure 5) indicate the low risk due to boron, cadmium, manganese, nickel and zinc. Figure 5 shows that greater health risk from heavy metals is for children than infants and adults. Due to high exposure risk from silver, copper and lead, the cumulative HQ in all locations sampled exceeds 1 with even the minimum values being 6.2, 11.2 and 7.4 mg/kg/day for infants, children and adults, respectively (Table 6). Surface water also shows a high potential risk if consumed following similar variation in the presence of heavy metals as in groundwater (Table 7).
Inter-metal relationship can help to identify the source and the pathway of these metals to the environment. Correlation and factor analysis were performed to recognise independent and multiple sources. Cobalt had significant positive correlation (r2 > 0.8) with manganese and nickel (Table 8). Zinc also showed significant correlation with cobalt, manganese and nickel. Though strong correlation was not observed i.e., r2 > 0.8, zinc and boron as well as silver and boron exhibit moderate association. Weak positive correlations were found between lithium–silver, boron–cobalt, boron–manganese, boron–nickel and cadmium–copper. To further support the co-existence of metals from similar sources, factor analysis was performed. Four significant factors with eigenvalues above 1 and cumulative variance of 72% (Table 9) were attained, which are discussed in the next section.

4. Discussion

Abundance of metals in groundwater was in the following order: silicon > manganese > silver > lithium > iron > lead > aluminium > copper > nickel > boron > zinc > cobalt > cadmium > chromium = titanium = zirconium. In surface water, concentrations were: silver > lithium > aluminium > lead > iron > nickel > copper > cobalt > manganese > zinc > cadmium > silicon = boron = chromium = titanium = zirconium. Spatial variation of HPI in Figure 4 shows two distinct areas with a high concentration in groundwater. These are the industrial areas located near the harbour on the eastern side of the study area and the landfill in the central part. Spatial distribution in HPI also closely follows the distribution of EC (Figure 1) and heavy metals (Figure 3) in groundwater, indicating the possibility of occurrence of high concentrations of major and minor ions due to these activities.
Statistical analysis had the highest variance of 34% for factor 1 and show strong positive loadings between cobalt, manganese, nickel and zinc with moderate positive loading from boron. These metals do not occur normally in fresh water (Table 2, [50]) and so their origin is from external sources and not geogenic. Most of these metals are used widely in different industrial processes like electroplating smelting etc., and wastewater from these industries contain some concentration of these metals [64]. Hence, factor 1 is largely influenced by industrial activities. Negative loadings of silica in factor 2 with positive correlation of lithium, iron and silver specify that they are not derived directly from soil. Silicon, the chemical element in silica contributes to 60% of the earth crust composition [65,66], and it is also present in seawater (2.9 mg/L) [67]. Thus, a negative relation with silica rules out the possibility of geogenic sources as the source for factor 2. Iron ores are mined and processed in this area and related human processes may contribute to iron in groundwater. Due to the positive affinity, lithium and silver may also have been contributed from similar source i.e., mining and associated activities.
Factor 3 has a total variance of 12.3% with positive loadings for lead, silver and boron. Lead is a common pollutant from paint industries, apart from combustion of fossil fuels, industrial smelting operations and fertilizers [68]. Lead can also be found in groundwater through dissolution of minerals from soil. Boron could be derived from earth crust as well as due to seawater intrusion in the coastal areas [60]. Occurrence of silver in groundwater could not be ascertained clearly, but co-existence with lead and boron imply that they have a common source(s). Lead and silver occurring at high concentrations than that in natural fresh water (Table 2) clearly indicates an external pollution source. This factor is from multiple sources associated with geogenic processes as well as anthropogenic activities including industrial operations and seawater intrusion due to over-pumping in the coastal areas. Fertilizers used for agriculture are a well-known source for cadmium and copper, which show positive loadings in factor 4 and exhibit the lowest variance of 9.5%. Presence of fertilizer plants in this area could also have contributed to these metals apart from their application to irrigation fields [29,30]. Factor analysis has helped as a useful tool for identifying the multiple sources of these metals in groundwater, which is grouped in Table 9. Pollution due to heavy metals is significant in these areas, and it is important to continuously monitor the water quality to prevent further deterioration of water resources. More detailed analysis of the occurrence and sources of silver in water is needed.

5. Conclusions

Water issues in South Africa focus more on water quality than quantity and more studies are needed to identify the causes and extent of pollution. This study was carried out with an aim of determining the heavy metal contamination in water and assess the impact of human activities on groundwater in and around two major towns, Empangeni and Richards Bay. Based on EC and TDS, the water is suitable for drinking purposes in most parts of the area except for a few locations. Order of dominance of heavy metals were silicon > manganese > silver > lithium > iron > lead > aluminium > copper > nickel > boron > zinc > cobalt > cadmium, while chromium, titanium and zirconium were BDL in water. Contamination due to aluminium, lead and nickel was prevalent in the entire area and boron, cadmium, iron and manganese exceeded the limit at a few locations. HPI varied from 17 to 330 indicating high contamination in two zones within the study area. HQ indicated potential risk to human health through the drinking water pathway due to consumption of groundwater for all age groups i.e., infants, children and adults.
Statistical examination indicated four factors both as independent and a combination of multiple sources for the presence of these heavy metals in groundwater. The inter-metal relationship between cobalt, manganese, nickel, zinc and boron were indicative of industrial activities. Lithium, iron and silver in groundwater were related to mining influenced operations and processes. Application of fertilizers is likely to have contributed to the presence of cadmium and copper in groundwater. Multiple sources including geogenic industries and seawater intrusion have contributed to lead, silver and boron. This study located the two zones of pollution: (1) the industrial site near the coast in the eastern part and (2) a landfill site at the central part of the study area. It is important to prevent further pollution from these sites by adopting proper management measures that include treatment of wastes from industries and should comply with wastewater disposal standards before dumping. Landfill site should be monitored for leachate percolation, and measures to reduce this must be implemented. Consumption of groundwater by the public may result in health issues and hence proper treatment of water is necessary to make it suitable for public water supply.

Acknowledgments

The first author thanks the University of Zululand’s Department of Research and Innovation for the financial assistance (Grant S721/15), the Department of Agriculture for assistance in chemical analysis and the Department of Hydrology for their extended support in successful completion of this work.

Author Contributions

Vetrimurugan Elumalai designed the study, carried out the field investigation, collected and analysed the samples, interpreted the data and brought out the water quality issues. K. Brindha performed the statistical analysis, prepared the figures and drafted the manuscript with inputs from Elango Lakshmanan. All authors read and approved the final manuscript.

Conflicts of Interest

The authors declare no conflicts of interest.

References

  1. Leung, C.M.; Jiao, J.J. Heavy metal and trace element distributions in groundwater in natural slopes and highly urbanized spaces in Mid-Levels area, Hong Kong. Water Res. 2006, 40, 753–767. [Google Scholar] [CrossRef] [PubMed]
  2. Buschmann, J.; Berg, M.; Stengel, C.; Winkel, L.; Sampson, M.L.; Trang, P.T.K.; Viet, P.H. Contamination of drinking water resources in the Mekong delta floodplains: Arsenic and other trace metals pose serious health risks to population. Environ. Int. 2008, 34, 756–764. [Google Scholar] [CrossRef] [PubMed]
  3. He, J.; Charlet, L. A review of arsenic presence in China drinking water. J. Hydrol. 2013, 492, 79–88. [Google Scholar] [CrossRef]
  4. Mohanraj, R.; Azeez, P.A.; Priscilla, T. Heavy metals in airborne particulate matter of urban Coimbatore. Arch. Environ. Contam. Toxicol. 2004, 47, 162–167. [Google Scholar] [CrossRef] [PubMed]
  5. Zereini, F.; Alt, F.; Messerschmidt, J.; Wiseman, C.; Feldmann, I.; von Bohlen, A.; Müller, J.; Liebl, K.; Püttmann, W. Concentration and distribution of heavy metals in urban airborne particulate matter in Frankfurt am Main, Germany. Environ. Sci. Technol. 2005, 39, 2983–2989. [Google Scholar] [CrossRef] [PubMed]
  6. Xu, P.; Huang, S.; Wang, Z.A.; Lagos, G. Daily intakes of copper, zinc and arsenic in drinking water by population of Shanghai, China. Sci. Total Environ. 2006, 362, 50–55. [Google Scholar] [CrossRef] [PubMed]
  7. Razak, N.H.A.; Praveena, S.M.; Aris, A.Z.; Hashim, Z. Drinking water studies: A review on heavy metal, application of biomarker and health risk assessment (a special focus in Malaysia). J. Epidemiol. Glob. Health 2015, 5, 297–310. [Google Scholar] [CrossRef] [PubMed]
  8. Li, P.; Qian, H. Human Health Risk Assessment for Chemical Pollutants in Drinking Water Source in Shizuishan City, Northwest China. Iran. J. Environ. Health Sci. Eng. 2011, 8, 41–48. [Google Scholar]
  9. Badr, E.A.E.; Agrama, A.A.E.; Badr, S.A.E. Heavy metals in drinking water and human health, Egypt. Nutr. Food Sci. 2011, 41, 210–217. [Google Scholar] [CrossRef]
  10. Demir, V.; Dere, T.; Ergin, S.; Cakιr, Y.; Celik, F. Determination and Health Risk Assessment of Heavy Metals in Drinking Water of Tunceli, Turkey. Water Resour. 2015, 42, 508–516. [Google Scholar] [CrossRef]
  11. World Health Organization (WHO). Ten Chemicals of Major Public Health Concern. Available online: http://www.who.int/ipcs/assessment/public_health/chemicals_phc/en/ (assessed on 21 June 2016).
  12. Berg, M.; Tran, H.C.; Nguyen, T.C.; Pham, H.V.; Schertenleib, R.; Giger, W. Arsenic contamination of groundwater and drinking water in Vietnam: A human health threat. Environ. Sci. Technol. 2001, 35, 2621–2626. [Google Scholar] [CrossRef] [PubMed]
  13. Ahmed, K.M.; Bhattacharya, P.; Hasan, M.A.; Akhter, S.H.; Alam, S.M.M.; Bhuyian, M.A.H.; Imam, M.B.; Khan, A.A.; Sracek, O. Arsenic enrichment in groundwater of the alluvial aquifers in Bangladesh: An overview. Appl. Geochem. 2004, 19, 181–200. [Google Scholar] [CrossRef]
  14. Saha, D.; Sarangam, S.S.; Dwivedi, S.N.; Bhartariya, K.G. Evaluation of hydrogeochemical processes in arsenic-contaminated alluvial aquifers in parts of Mid-Ganga Basin, Bihar, Eastern India. Environ. Earth Sci. 2010, 61, 799–811. [Google Scholar] [CrossRef]
  15. Chanpiwat, P.; Sthiannopkao, S.; Cho, K.H.; Kim, K.-W.; San, V.; Suvanthong, B.; Vongthavady, C. Contamination by arsenic and other trace elements of tube-well water along the Mekong River in Lao PDR. Environ. Pollut. 2011, 159, 567–576. [Google Scholar] [CrossRef] [PubMed]
  16. Krishna, A.K.; Satyanarayanan, M.; Govil, P.K. Assessment of heavy metal pollution in water using multivariate statistical techniques in an industrial area: A case study from Patancheru, Medak District, Andhra Pradesh, India. J. Hazard. Mater. 2009, 167, 366–373. [Google Scholar] [CrossRef] [PubMed]
  17. Li, P.; Qian, H.; Wu, J. Origin and assessment of groundwater pollution and associated health risk: A case study in an industrial park, northwest China. Environ. Geochem. Health 2014, 36, 693–712. [Google Scholar] [CrossRef] [PubMed]
  18. Zahid, A.; Balke, A.D.; Hassan, M.Q.; Flegr, M. Evaluation of aquifer environment under Hazaribagh leather processing zone of Dhaka city. Environ. Geol. 2006, 50, 495–504. [Google Scholar] [CrossRef]
  19. Soyaslan, I.I.; Karagüzel, R. Investigation of water pollution in the Yalvac basin into Egirdir Lake, Turkey. Environ. Geol. 2008, 55, 1263–1268. [Google Scholar] [CrossRef]
  20. Brindha, K.; Elango, L. Impact of tanning industries on groundwater quality near a metropolitan city in India. Water Resour. Manag. 2012, 26, 1747–1761. [Google Scholar] [CrossRef]
  21. Bakis, R.; Tuncan, A. An investigation of heavy metal and migration through groundwater from the landfill area of Eskisehir in Turkey. Environ. Monit. Assess. 2011, 176, 87–98. [Google Scholar] [CrossRef] [PubMed]
  22. El-Salam, M.M.A.; Abu-Zuid, G.I. Impact of landfill leachate on the groundwater quality: A case study in Egypt. J. Adv. Res. 2015, 6, 579–586. [Google Scholar] [CrossRef] [PubMed]
  23. El Khatib, R.; Lartiges, B.S.; El Samrani, A.; Faure, P.; Houhou, J.; Ghanbaja, J. Speciation of Organic Matter and Heavy Metals in Urban Wastewaters from an Emerging Country. Water Air Soil Pollut. 2012, 223, 4695–4708. [Google Scholar] [CrossRef]
  24. Carrillo-Chávez, A.; González-Partida, E.; Morton-Bermea, O.; Hernandez, E.; Levresse, G.; Soto, P.; Tritlla, J.; Camprubi, A. Heavy Metal Distributionin Rocks, Sediments, Mine Tailings, Leaching Experiments, and Groundwater from the Mineralde Pozos Historical Mining Site, North-Central Mexico. Int. Geol. Rev. 2006, 48, 466–478. [Google Scholar] [CrossRef]
  25. Brindha, K.; Elango, L.; Nair, R.N. Spatial and temporal variation of uranium in a shallow weathered rock aquifer in southern India. J. Earth Syst. Sci. 2011, 120, 911–920. [Google Scholar] [CrossRef]
  26. Mahato, M.K.; Singh, P.K.; Tiwari, A.K.; Singh, A.K. Risk Assessment Due to Intake of Metals in Groundwater of East Bokaro Coalfield, Jharkhand, India. Expo. Health 2016, 8, 265–275. [Google Scholar]
  27. Naz, A.; Mishra, B.K.; Gupta, S.K. Human Health Risk Assessment of Chromium in Drinking Water: A Case Study of Sukinda Chromite Mine, Odisha, India. Expo Health 2016, 8, 253–264. [Google Scholar] [CrossRef]
  28. Nouri, J.; Mahvi, A.H.; Jahed, G.R.; Babaei, A.A. Regional distribution pattern of groundwater heavy metals resulting from agricultural activities. Environ. Geol. 2008, 55, 1337–1343. [Google Scholar] [CrossRef]
  29. Wu, J.; Sun, Z. Evaluation of Shallow Groundwater Contamination and Associated Human Health Risk in an Alluvial Plain Impacted by Agricultural and Industrial Activities, Mid-west China. Expo. Health 2016, 8, 311–329. [Google Scholar] [CrossRef]
  30. Brindha, K.; Elango, L. Occurrence of uranium in groundwater of a shallow granitic aquifer and its suitability for domestic use in southern India. J. Radioanal. Nuclear Chem. 2013, 295, 357–367. [Google Scholar] [CrossRef]
  31. Department of Water Affairs and Forestry (DWAF). Strategic Environmental Assessment for Water Use Mhlathuze Catchment—KZN; Report No. SEA-01/2000; DWAF: Pretoria, South Africa, 2000.
  32. Department of Water Affairs and Forestry (DWAF). Water Quality Issues in the Usutu-Mhlathuze: Review of Water Quality Status and Issues in the WMA; DWAF: Pretoria, South Africa, 2002; p. 27.
  33. Muhammad, S.; Shah, M.T.; Khan, S. Health Risk Assessment of Heavy Metals and Their Source Apportionment in Drinking Water of Kohistan Region, Northern Pakistan. Microchem. J. 2011, 98, 334–343. [Google Scholar] [CrossRef]
  34. Alberto, W.D.; Pilar, D.M.D.; Valeria, A.M.; Fabiana, P.S.; Cecilia, H.A.; de Los Angeles, B.M. Pattern recognition techniques for the evaluation of spatial and temporal variations in water quality. A case study: Suquía River Basin (Cordoba-Argentina). Water Res. 2001, 35, 81–94. [Google Scholar] [CrossRef]
  35. Money, D.C. Climate and Environmental Systems; Unwin Hyman: London, UK, 1988. [Google Scholar]
  36. Schulze, R.E. Agrohydrology and Climatology of Natal; Water Research Commission: Pretoria, South Africa, 1982. [Google Scholar]
  37. Kelbe, B.; Germishuyse, T.; Snyman, N.; Fourie, I. Geohydrological Studies of the Primary Coastal Aquifer in Zululand; WRC Report No. 720/1/01; Water Research Commission: Pretoria, South Africa, 2001. [Google Scholar]
  38. Hobday, D.K. Geological Evolution and Geomorphology of the Zululand Coastal Plain in Lake Sibaya Monographae Biologica; Allanson: East York, ON, Canada, 1976. [Google Scholar]
  39. Tinley, K.L. Coastal Dunes of South Africa; Council for Scientific and Industrial Research; Foundation for Research Development: Pretoria, South Africa, 1985. [Google Scholar]
  40. Germishuyse, T.A. Geohydrological Study of the Richards Bay Area. Master’s Thesis, University of Zululand, Mhlathuze, South Africa, 1999; p. 119. [Google Scholar]
  41. Lloyd, J.W.; Heathcote, J.A. Natural Inorganic Hydrochemistry in Relation to Groundwater; Clarendon Press: Oxford, UK, 1985. [Google Scholar]
  42. Horton, R.K. An index number system for rating water quality. J. Water Pollut. Control Fed. 1965, 37, 300–306. [Google Scholar]
  43. Brown, R.M.; McClelland, N.I.; Deininger, R.A.; Tozer, R.G. A water quality index—Do we dare? Water Sew. Works 1960, 117, 339–343. [Google Scholar]
  44. Mohan, S.V.; Nithila, P.; Reddy, S.J. Estimation of heavy metal in drinking water and development of heavy metal pollution index. J. Environ. Sci. Health A 1996, 31, 283–289. [Google Scholar] [CrossRef]
  45. United States Environmental Protection Agency (US EPA). Risk Assessment Guidance for Superfund, Volume 1: Human Health Evaluation Manual (Part A); EPA/540/1-89/002: Interim Final; Office of Emergency and Remedial Response: Washington, DC, USA, 1989.
  46. Davis, J.C. Statistics and Data Analysis in Geology, 3rd ed.; Wiley: Hoboken, NJ, USA, 2002. [Google Scholar]
  47. Davis, S.N.; DeWiest, R.J.M. Hydrogeology; John Wiley and Sons Inc.: Hoboken, NJ, USA, 1966. [Google Scholar]
  48. Freeze, R.A.; Cherry, J.A. Groundwater; Prentice Hall Inc.: Upper Saddle River, NJ, USA, 1979. [Google Scholar]
  49. Department of Water Affairs and Forestry (DWAF). South African Water Quality Guidelines, Domestic Use, 2nd ed.; DWAF: Pretoria, South Africa, 1996; Volume 1, p. 214.
  50. World Health Organisation (WHO). WHO’s Guidelines for Drinking-Water Quality; WHO: Geneva, Switzerland, 1993. [Google Scholar]
  51. World Health Organisation (WHO). Guidelines for Drinking Water Quality, 4th ed.; WHO: Geneva, Switzerland, 2011. [Google Scholar]
  52. United States Environmental Protection Agency (US EPA). Drinking Water Contaminants. 2014. Available online: https://www.epa.gov/ground-water-and-drinking-water/table-regulated-drinking-water-contaminants (accessed on 1 July 2016).
  53. Health Canada. Guidelines for Canadian Drinking Water Quality—Summary Table; Water and Air Quality Bureau, Healthy Environments and Consumer Safety Branch, Health Canada: Ottawa, ON, Canada, 2017; Available online: http://www.hc-sc.gc.ca/ewh-semt/alt_formats/pdf/pubs/water-eau/sum_guide-res_recom/sum_guide-res_recom-eng.pdf (accessed on 22 March 2017).
  54. Brindha, K.; Jagadeshan, G.; Kalpana, L.; Elango, L. Fluoride in weathered rock aquifers of southern India: Managed Aquifer recharge for mitigation. Environ. Sci. Pollut. Res. 2016, 23, 8302–8316. [Google Scholar] [CrossRef] [PubMed]
  55. Walpole, S.C.; Prieto-Merino, D.; Edwards, P.; Cleland, J.; Stevens, G.; Roberts, I. The weight of nations: An estimation of adult human biomass. BMC Public Health 2012, 12, 439. [Google Scholar] [PubMed]
  56. IRIS from US EPA (US Environmental Protection Agency). Drinking Water Standards and Health Advisories Table. 2009. Available online: https://www3.epa.gov/region9/water/drinking/files/dwshat-v09.pdf (assessed on 27 July 2016).
  57. Integrated Risk Information System (IRIS). Boron and Compounds (CASRN 7440-42-8). 2011. Available online: https://cfpub.epa.gov/ncea/iris/iris_documents/documents/subst/0410_summary.pdf (accessed on 22 March 2017).
  58. US EPA from CHMP (Committee for Human Medicinal Products). Guidelines on the Specification Limits for Residues of Metal Catalysts. 2007. Available online: http://www.ema.europa.eu/docs/en_GB/document_library/Scientific_guideline/2009/09/WC500003587.pdf (assessed on 27 July 2016).
  59. Integrated Risk Information System (IRIS). Manganese (CASRN 7439-96-5). 1995. Available online: https://cfpub.epa.gov/ncea/iris/iris_documents/documents/subst/0373_summary.pdf (accessed on 22 March 2016).
  60. Kim, K.W.; Chanpiwat, P.; Hoang, T.H.; Phan, K.; Sthiannopkao, S. Arsenic geochemistry of groundwater in Southeast Asia. Front. Med. 2011, 5, 420–433. [Google Scholar] [CrossRef] [PubMed]
  61. Viridor Waste Ltd. Viridor New England Energy from Waste Project: Technical Data for HHRA Generic Assessment Criteria (402-0036-00350). 2009. Available online: http://www.devon.gov.uk/plandoc259_4975.pdf (accessed on 1 July 2016).
  62. Virginia Department of Health (VDH). Lithium. Available online: http://www.vdh.virginia.gov/environmental-epidemiology/fact-sheets-for-public-health/lithium/ (accessed on 22 March 2017).
  63. Integrated Risk Information System (IRIS). Zinc and Compounds (CASRN 7440-66-6). 2005. Available online: https://cfpub.epa.gov/ncea/iris/iris_documents/documents/subst/0426_summary.pdf#nameddest=rfd (accessed on 1 July 2016).
  64. Kumar, P.J.S.; Delson, P.D.; Babu, P.T. Appraisal of Heavy Metals in Groundwater in Chennai City Using a HPI Model. Bull. Environ. Contam. Toxicol. 2012, 89, 793–798. [Google Scholar] [CrossRef] [PubMed]
  65. Iler, R.K. The Colloidal Chemistry of Silica and Silicates; Cornell University Press: Ithaca, NY, USA, 1955; p. 324. [Google Scholar]
  66. Nebergall, W.H.; Schmidt, F.C.; Holtzclaw, H.F. College Chemistry; DC Health and Company: Boston, MA, USA, 1963; p. 861. [Google Scholar]
  67. Turekian, K.K. Oceans; Prentice-Hall: Englewood Cliffs, NJ, USA, 1968. [Google Scholar]
  68. Gowd, S.S.; Govil, P.K. Distribution of heavy metals in surface water of Ranipet industrial area in Tamil Nadu, India. Environ. Monit. Assess. 2008, 136, 197–207. [Google Scholar] [CrossRef] [PubMed]
Figure 1. Location of study area and spatial variation in electrical conductivity (EC) of water at monitoring locations.
Water 09 00234 g001
Figure 2. Concentration of heavy metals in water.
Water 09 00234 g002
Figure 3. Spatial variation in heavy metal concentration in groundwater, (a) aluminium, (b) boron, (c) copper, (d) cadmium, (e) iron, (f) lead, (g) manganese, (h) nickel, (i) zinc, (j) cobalt, (k) lithium, (l) silver, and (m) silicon.
Water 09 00234 g003aWater 09 00234 g003b
Figure 4. Spatial variation in HPI of water.
Water 09 00234 g004
Figure 5. Non-carcinogenic risk (mean values) from drinking groundwater.
Water 09 00234 g005
Table 1. Water type classification based on total dissolved solids (TDS).
ParameterRangeClassificationNumber of Samples
Surface Water (N = 4)Groundwater (N = 35)
TDS (mg/L) [47]<500Desirable for drinking319
500–1000Permissible for drinking110
1000–3000Useful for irrigation04
>3000Unfit for drinking and irrigation02
TDS (mg/L) [48]<1000Fresh329
1000–10,000Brackish15
10,000–100,000Saline01
>100,000Brine00
Table 2. Drinking water guidelines of South Africa and World Health Organization (WHO).
Heavy MetalTarget Water Quality Range (No Effect Range) of DWAF (mg/L) [49]Health Based Guidelines of WHO (mg/L) [50]Normally Found in Fresh/Ground/Surface Water (mg/L) [50]
Aluminium0 to 0.15 *0.2-
BoronNo guideline0.3<1
Cadmium0 to 0.005 *0.003<0.001
Chromium (total)0 to 0.05 *,#0.05<0.001
Copper0 to 12-
Iron0 to 0.1No guideline0.5 to 50
Lead0 to 0.010.01-
Manganese0 to 0.050.5-
NickelNo guideline0.02<0.02
SilverNo guidelineNo guideline0.005 to 0.05
Zinc0 to 33-
Notes: * tentative guideline; # for chromium (VI). DWAF: Department of Water Affairs and Forestry of the Republic of South Africa.
Table 3. Classification of water based on heavy metal pollution index (HPI).
HPI RangeQualityNumber of Samples
Groundwater (N = 35)Surface Water (N = 3)Dam Water (N = 1)
<25Excellent2421
26 to 50Good61-
51 to 75Poor1--
76 to 100Very poor2--
>100Unsuitable2--
Table 4. Human exposure risk (mg/kg/day) due to heavy metals through the drinking water pathway.
Human Exposure CategoryStatistical ParameterHeavy Metal in Groundwater (N = 35) Total
AgBCdCuLiMnNiPbZn
InfantMin1.8 × 10−20.00.04.6 × 10−41.3 × 10−20.02.1 × 10−31.3 × 10−30.04.5 × 10−2
Max2.1 × 10−26.9 × 10−24.6 × 10−45.3 × 10−21.8 × 10−27.0 × 10−19.4 × 10−32.4 × 10−23.0 × 10−28.4 × 10⁻¹
Mean1.9 × 10−23.1 × 10−34.9 × 10−56.2 × 10−31.6 × 10−22.5 × 10−23.7 × 10−31.5 × 10−21.8 × 10−39.0 × 10⁻²
SD4.5 × 10−41.3 × 10−28.5 × 10−51.1 × 10−21.1 × 10−31.2 × 10−11.0 × 10−33.7 × 10−35.6 × 10−31.3 × 10⁻¹
ChildrenMin3.2 × 10−20.00.08.3 × 10−42.3 × 10−20.03.8 × 10−32.3 × 10−30.08.1 × 10−2
Max3.8 × 10−21.2 × 10−18.3 × 10−49.5 × 10−23.2 × 10−21.31.7 × 10−24.4 × 10−25.5 × 10−21.5
Mean3.5 × 10−25.7 × 10−38.8 × 10−51.1 × 10−22.8 × 10−24.6 × 10−26.7 × 10−32.7 × 10−23.2 × 10−31.6 × 10⁻¹
SD8.1 × 10−42.3 × 10−21.5 × 10−42.1 × 10−21.9 × 10−32.1 × 10−11.9 × 10−36.6 × 10−31.0 × 10−22.4 × 10⁻¹
AdultMin2.1 × 10−20.00.05.4 × 10−41.5 × 10−20.02.5 × 10−31.5 × 10−30.05.4 × 10−2
Max2.5 × 10−28.2 × 10−25.4 × 10−46.3 × 10−22.1 × 10−28.3 × 10−11.1 × 10−22.9 × 10−23.6 × 10−29.9 × 10⁻¹
Mean2.3 × 10−23.7 × 10−35.8 × 10−57.4 × 10−31.9 × 10−23.0 × 10−24.4 × 10−31.8 × 10−22.1 × 10−31.1 × 10⁻¹
SD5.3 × 10−41.5 × 10−21.0 × 10−41.4 × 10−21.3 × 10−31.4 × 10−11.2 × 10−34.3 × 10−36.7 × 10−31.6 × 10⁻¹
Table 5. Oral reference dose for heavy metals.
Heavy MetalReference Dose (RfD in mg/kg/day)References
Silver5 × 10−3[56]
Boron2 × 10−1[57]
Cadmium5 × 10−4[56]
Chromium (total)3 × 10⁻³[56]
Copper5 × 10−3[58]
Manganese1.4 × 10−1[59]
Nickel2 × 10−2[60]
Lead3.6 × 10−3[61]
Lithium2 × 10−2[62]
Zinc3 × 10−1[63]
Table 6. Non-carcinogenic risk (mg/kg/day) due to heavy metals through the drinking water pathway.
Human Exposure CategoryStatistical ParameterHeavy Metal in Groundwater (N = 35)
AgBCdCuLiMnNiPbZn
InfantMin3.50.00.00.10.60.00.10.40.0
Max4.20.30.910.50.95.00.56.70.1
Mean3.90.00.11.20.80.20.24.20.0
SD0.10.10.22.30.10.80.11.00.0
ChildrenMin6.30.00.00.21.20.00.20.60.0
Max7.60.61.719.01.69.00.812.10.2
Mean6.90.00.22.21.40.30.37.50.0
SD0.20.10.34.10.11.50.11.80.0
AdultMin4.20.00.00.10.80.00.10.40.0
Max5.00.41.112.51.05.90.68.00.1
Mean4.60.00.11.50.90.20.24.90.0
SD0.10.10.22.70.11.00.11.20.0
Table 7. Cumulative hazard quotient (mg/kg/day) in groundwater and surface water.
Statistical ParameterGroundwater (N = 35)Surface Water (N = 4)
InfantChildrenAdultInfantChildrenAdult
Min6.211.27.46.211.27.4
Max19.835.623.510.318.612.2
Mean10.519.012.58.815.810.4
Median9.517.011.29.216.611.0
SD2.85.13.31.52.81.8
Table 8. Correlation among metals in groundwater.
AgAlBCdCoCuFeLiMnNiPbSiZn
Ag1
Al0.081
B0.69 *0.221
Cd0.03−0.170.051
Co0.140.270.470.231
Cu0.07−0.17−0.020.43−0.071
Fe0.12−0.090.150.07−0.030.041
Li0.48−0.070.170.180.230.050.271
Mn0.190.250.470.240.960.00−0.010.231
Ni0.340.200.590.330.900.040.000.330.911
Pb0.210.090.31−0.14−0.100.04−0.12−0.150.000.001
Si−0.220.21−0.18−0.18−0.04−0.35−0.29−0.25−0.06−0.140.131
Zn0.330.250.660.130.860.000.020.170.850.840.15−0.081
Note: * Significant correlation is marked in bold.
Table 9. Factor analysis of heavy metals in groundwater.
Heavy MetalsFactor 1Factor 2Factor 3Factor 4
Ag0.190.510.69−0.01
Al0.33−0.190.17−0.45
B0.520.260.69−0.06
Cd0.290.04−0.160.73
Co0.980.04−0.06−0.03
Cu−0.04−0.030.150.84
Fe−0.070.69−0.040.01
Li0.210.730.020.05
Mn0.960.030.020.03
Ni0.940.140.120.11
Pb−0.07−0.340.78−0.01
Si−0.01−0.54−0.09−0.48
Zn0.890.040.27−0.02
Eigenvalue4.492.041.601.24
Total variance (%)34.5215.7012.339.50
Cumulative variance (%)34.5250.2262.5472.04
SourceIndustrial activitiesMining and associated activitiesGeogenic and human-inducedFertilizers
Note: Significant correlation is marked in bold.

