
Characterizing Precipitation Variability and Trends in the World’s Mediterranean-Climate Areas

1
Soil and Water Sciences Department, University of Florida, IFAS West Florida Research and Education Center, Milton, FL 32583, USA
2
University of Florida, IFAS West Florida Research and Education Center, Milton, FL 32583, USA
3
University of California ANR Informatics and GIS Statewide Program, Hopland, CA 95445, USA
*
Author to whom correspondence should be addressed.
Water 2017, 9(4), 259; https://doi.org/10.3390/w9040259
Submission received: 1 November 2016
/
Revised: 9 March 2017
/
Accepted: 29 March 2017
/
Published: 6 April 2017
(This article belongs to the Special Issue Variability in Mediterranean-Climate Waters: Space, Time, and Intensity)
Abstract
:The Mediterranean climate is principally characterized by warm, dry summers and cool, wet winters. However, there are large variations in precipitation dynamics in regions with this climate type. We examined the variability of precipitation within and among Mediterranean-climate areas, and classified the Mediterranean climate as wet, moderate, or dry based on annual precipitation; and strongly, moderately, or weakly seasonal based on percentage of precipitation during summer. Mediterranean biomes are mostly dry (<700 mm annually) but some areas are wet (>1300 mm annually); and many areas are weakly seasonal (>12% of annual precipitation during summer). We also used NOAA NCDC climate records to characterize interannual variability of annual and dry-season precipitation, as well as trends in annual, winter, and dry-season precipitation for 337 sites that met the data quality criteria from 1975 to 2015. Most significantly, sites in many Mediterranean-climate regions show downward trends in annual precipitation (southern California, Spain, Australia, Chile, and Northern Italy); and most of North America, the Mediterranean basin, and Chile showed downward trends in summer precipitation. Variations in annual and summer precipitation likely contribute to the high biodiversity and endemism characteristic of Mediterranean-climate biomes; the data indicate trends toward harsher conditions over the past 40 years.
1. Introduction
Climate is among the most fundamental features that define the human–natural system [1]. Patterns of temperature and precipitation influence biotic community composition and structure [2,3,4,5], as well as the extent of feasible human development and the water resource development necessary to meet human needs [6,7,8]. Precipitation variability is also important for defining human–natural systems: differences in annual precipitation and seasonal variability from one year to the next characterize the capacity to sustain ecosystems and associated provisioning, regulating, and supporting services across the years and in the long term [6]. Further, changes in these patterns can cause fundamental shifts in the capacity for ecosystems to re-organize to preexisting steady states (resilience) [9], and can also influence water resource planning for human development [10].
Precipitation and temperature are factors commonly utilized to define climate zones [11,12]. For example, ecosystems of the Mediterranean biome commonly experience cool wet winters and warm dry summers, meaning that precipitation is distributed during the cooler half of the year, with generally mild rather than cold winter temperatures; summers are typically dry [13]. These regions also typically receive more than 12 inches (300 mm) of precipitation annually, distinguishing them from arid regions [14]. The Mediterranean biome and its associated temperate dry-summer climate type is located on every inhabited continent, including the portions of Europe, Africa, and Asia surrounding the Mediterranean Sea (and extending eastward through southern Turkey and northern Syria); central coastal Chile (on the west side of South America); the west coast of North America (stretching from northern Mexico into Canada); the west-facing southern coast of Australia; and the southwestern end of South Africa [15]. These regions are typically located at latitudes between 30 and 40 degrees, on the western edge of the continent [16]. Precipitation is strongly influenced by orographic effects through most areas [17,18,19]
The seasonality of precipitation is considered the main factor influencing terrestrial and aquatic ecosystems of the Mediterranean biome [16]. This distinct climate pattern tends to result in high species richness and endemism [20,21]. Terrestrial plants have adapted to the long summer dry season by developing sclerophyllous foliage and drought-adapted root growth [22]. In aquatic ecosystems, the prolonged dry season leads to reduced summer streamflow, which causes a shift in ecosystem composition from organisms that are well-suited to lotic (i.e., flowing) environments to those well suited to lentic (non-flowing) ones [23,24]. Interannual variability of climate can produce varying flow conditions by the conclusion of the dry season (either flowing or intermittent), which can also cause differences in community composition and structure from one year to the next [25,26]. Spatial analyses have suggested that the distribution of areas having Mediterranean climate characteristics will change with changing global climate dynamics [15], and the persistence of Mediterranean-climate ecosystems are at risk from the increased variability and shifts in precipitation and temperature patterns expected with climate change [27,28].
Seasonality of precipitation also influences the patterns of human development. Because of the seasonal divergence between when water is most needed and when it is most available (especially related to agricultural water needs), Mediterranean-climate areas often need high levels of water infrastructure to meet human water demand. Spain has more water stored in large dams per volume runoff than any other country in Europe [29]. Large dams are also common among the rivers of the west coast of the United States, especially among the Sacramento–San Joaquin and the Columbia River drainage networks [30,31] (though both of these river systems obtain much of their discharge from mountainous areas that receive heavy winter snowfall). Large reservoirs are also found in the Murray–Darling basin, with its outlet on the southern coast of Australia southeast of Adelaide [32]. In some cases, small reservoirs are ubiquitous across the landscape [33].
Conceptually, the characteristics of the dry-summer climate and the Mediterranean biome are similar. The temperate dry-summer climate (Koppen type Cs) is characterized by a combination of moderate temperature and a dry summer season (e.g., the amount in the wettest month compared to amount in the driest month [11,12]); plants and animals in the Mediterranean biome have developed physiological, morphological, or behavioral adaptations to withstand dry-season conditions [23]. However, despite this relatively well-accepted concept of the Mediterranean climate and its effects on biota, there is a discrepancy between regions with dry summers and the Mediterranean biome. For example, on some continents, the Cs (moderately dry summer) climate type extends far beyond areas demarcated as the Mediterranean biome; and on others, the Mediterranean biome extends beyond the Cs climate type. Researchers may use the term “Mediterranean climate” interchangeably with the Koppen type Cs [10,13], but differences in biome classification across the Cs climate type suggest that hydrologic variations within the Cs climate type may lead to dissimilar ecological communities. Further, high biodiversity and endemism within and among Mediterranean biomes suggest that climatic conditions may also be highly variable within and among these regions. Additional analysis to articulate the specific climatic characteristics of the Mediterranean biome can help researchers to better characterize the extent of dry summer faced by terrestrial and aquatic organisms adapted to these regions, as well as the water management challenges necessary to support urban and agricultural development.
Changes in climate conditions through the 21st Century are expected to alter the amount and distribution of Mediterranean-type ecosystems. Research has indicated that climate and associated hydrologic processes (such as streamflow production) have already begun to change in some parts of the world, including significant downward trends in precipitation in parts of India [34] and New Zealand [35], as well as downward trends in dry-season streamflow and upward trends in peak streamflow in parts of the United States [36,37,38,39,40]. If temperate dry-summer climate zones are undergoing changes in climate variables—such as increased or decreased annual precipitation—these changes could already be causing shifts in ecological community composition and structure.
The purpose of this paper is to examine in more detail the temperate dry climate relative to the Mediterranean biome to address two broad questions: (1) can we better describe the climate characteristics of places with Mediterranean biome beyond the temperate dry-summer Cs classification, through patterns of annual precipitation, seasonal precipitation, and variability; and (2) are temperate dry-summer regions (including, but not exclusively, the Mediterranean biome) shifting toward wetter or drier conditions? These questions are fundamentally interrelated because articulation of the Mediterranean biome climate characteristics (as well as surrounding areas with dry summer climate) coupled with analysis of trends in annual and dry-season precipitation can help predict those regions where ecological changes may be underway, causing deviations from (or outside of the biome, deviations toward) the adaptations of organisms in the Mediterranean biome. These analyses may also be useful for water managers looking to understand whether recent multi-decadal precipitation trends resemble expected near-term climate predictions.
2. Methods
2.1. Climate of the Mediterranean Biome
To more clearly identify the climate characteristics of the Mediterranean biome (and identify differences in biomes within places with a temperate dry-summer climate), we first identified places with temperate dry-summer climate that meet an annual precipitation threshold using the WorldClim dataset. The WorldClim dataset is a high-resolution spatial climate dataset with detailed information characterizing the precipitation and temperature at monthly intervals for the globe at the 30 arc-second (approximately 1 km2) scale, based on 30 years of data (1960–1990) from climate stations across the globe [41]. Using average monthly precipitation and temperature data from the 30-year WorldClim dataset, we identified regions with temperate dry-summer characteristics as those having:
- Mean annual precipitation greater than 300 mm (suggesting at least semiarid conditions) [14].
- More than 50% of the mean annual precipitation occurring during the cool half of the year, from mid-fall through winter to mid-spring (which we abbreviate FWS). For dry-summer climate areas, we defined the FWS period as the wetter of either October–March or November–April in the northern hemisphere; and either April–September or May–October in the southern hemisphere.
- Less than 20% of the mean annual precipitation occurring during the summer three months. For each of the five Mediterranean-climate areas, we defined the summer period as the drier of either June–August or July–September in the northern hemisphere; and either December–February or January–March in the southern hemisphere.
- Mean coldest-month temperature is greater than 0° Celsius (indicating a likelihood of precipitation predominantly occurring as rainfall rather than snowfall).
These criteria identify those areas that are not arid, have mild winter temperatures, receive the majority of their annual precipitation during FWS, and have at least slightly dry summers. The criteria were designed to be generous in identifying areas as having a dry-summer climate: the two conditions of seasonality (50% of the average annual precipitation occurring during FWS and less than 20% of precipitation during summer) are not particularly strong, and we did not identify a maximum annual precipitation. This allowed us to examine similarities and differences over a broader range of areas than may typically be considered as having a dry-summer climate (for example, the area including Barcelona, which is in the Mediterranean biome but does not fit the Koppen Cs criteria). For those regions that meet the four climate criteria listed above, we mapped differences in three characteristics: (1) mean annual precipitation; (2) the percentage of precipitation occurring during the FWS half of the year; and (3) the percentage of precipitation occurring during the (three-month) dry-summer season. (Maps of these features for the five temperate dry-summer regions appear in the Supplementary Materials, Figures S1–S5.)
To describe climate characteristics associated with the Mediterranean biome, we classified two variables—mean annual precipitation and percentage of annual precipitation during summer—into three categories (Table 1). This resulted in nine regions identified as either wet, moderate, or dry in terms of mean annual precipitation, and either strong, moderate, or weak seasonality with respect to the percentage of annual precipitation during summer. We overlaid the Mediterranean and surrounding biome boundaries as defined by the World Wildlife Federation and the Nature Conservancy [42,43] onto moderate dry-summer areas identified as one of nine categories in Table 1; and using spatial analytical tools in ArcMap, we quantified the percentage of the Mediterranean biome falling into each climate category. We also quantified those areas within the Mediterranean biome identified as not meeting the threshold of annual precipitation (i.e., less than 300 mm), and not meeting the threshold of seasonality (i.e., greater than 20% during the dry summer or less than 50% during FWS).
2.2. Interannual Precipitation Variability and Trends
We used site-specific historical precipitation records measured at locations within our moderate dry-summer areas (based on the WorldClim data calculations described above) to evaluate variability and trends of precipitation characteristics. The majority of precipitation data were obtained through NOAA’s National Climatic Data Center (NCDC, either through its Global Historical Climatology Network or Climate Data Online), which has historical precipitation data available for approximately 29,000 sites across the globe [44,45]. All sites within our defined climate criteria were reviewed for duration of gauge operation; those sites with more than 20 years of record were further reviewed to evaluate the quality of the data. (Sites were further divided by duration of more or less than 30 years in analytical procedures as described below.) NCDC precipitation datasets frequently have periods when data are omitted; these omission periods may be as brief as one or a few days, or as long as several years (or even decades). Additionally, datasets commonly have days when the data are erroneous (entered as 99.99 in NCDC datasets). Precipitation values other than 99.99 were assumed to be accurate. Among those sites with more than 20 years of record, we evaluated the sum of these two data errors (i.e., omitted and erroneous) and selected those datasets with no more than 5% combined error over at least 20 continuous years of operation between 1975 and 2015 (Tables S1–S5). Because this resulted in a low number of sites among locations in the southern hemisphere, we supplemented the NCDC data with data available online from the Australian Bureau of Meteorology (indicated in Table S1) and the Dirección Meteorológica de Chile (indicated in Table S5). Precipitation data from these sources were selected for further analysis if they met the same quality control criteria as the NCDC data.
2.2.1. Interannual Variability
We used site-specific data to compare the interannual variability of mean annual precipitation and summer precipitation percentage relative to our nine climate regions. For each site, we calculated the annual precipitation and precipitation during the dry-summer season for each year; and then the percentage of precipitation occurring during the dry summer. We then calculated the coefficient of variation (often described as the relative standard deviation) of annual precipitation and annual percentage of summer discharge for each site. The coefficient of variation (CV), defined as the ratio of the standard deviation of the dataset to its mean, is particularly informative because it depicts the distribution of data relative to its magnitude, thus making it a useful tool to compare distributions among datasets with different magnitudes [46]. We mapped the CV of annual precipitation and percentage of summer precipitation onto our maps of nine climate regions (from Section 2.1) to examine whether the magnitude of annual or summer precipitation CV corresponded with characteristics of annual precipitation or strength of summer precipitation seasonality.
2.2.2. Interannual Trends in Annual Precipitation, Winter Precipitation, and Summer Precipitation; and Variability
We used the Mann–Kendall non-parametric trends test to determine whether annual precipitation, percentage of winter precipitation, and percentage of summer precipitation have been undergoing a statistically significant upward or downward trend at each site over recent decades. The Mann–Kendall trends test is particularly advantageous for hydrologic datasets because it is not dependent on normally distributed data; it tests whether data show an upward trend as well as a downward trend through a sequential dataset (e.g., over a period of years [47,48]. An upward or downward trend in mean annual precipitation indicates that the site is receiving more or less precipitation, respectively, over time. An upward trend in percentage of precipitation in summer indicates weaker seasonality (with summer becoming more wet) over time; and a downward trend in summer percentage indicates stronger seasonality. An upward trend in percentage of FWS precipitation is another indicator of stronger seasonality, whereas a downward trend indicates weaker seasonality (this variable has implications for aquatic ecosystem persistence discussed further below). Additionally, we conducted a Mann–Kendall analysis of variability in annual, percentage FWS, and percentage summer precipitation as the absolute value of the difference of each year’s value from the overall mean. An upward trend in variability indicates a greater difference between the variable and the mean over time.
Trends were identified as significant either at α = 0.05 or α = 0.1. Because multiannual cycles (e.g., ENSO) and events (e.g., long-term drought) have the potential to influence precipitation over periods greater than a decade [38,49], we distinguished those sites with between 30 and 40 years of quality-checked record from those with between 20 and 30 years of quality-checked record.
3. Results
3.1. Climate of the Mediterranean Biome
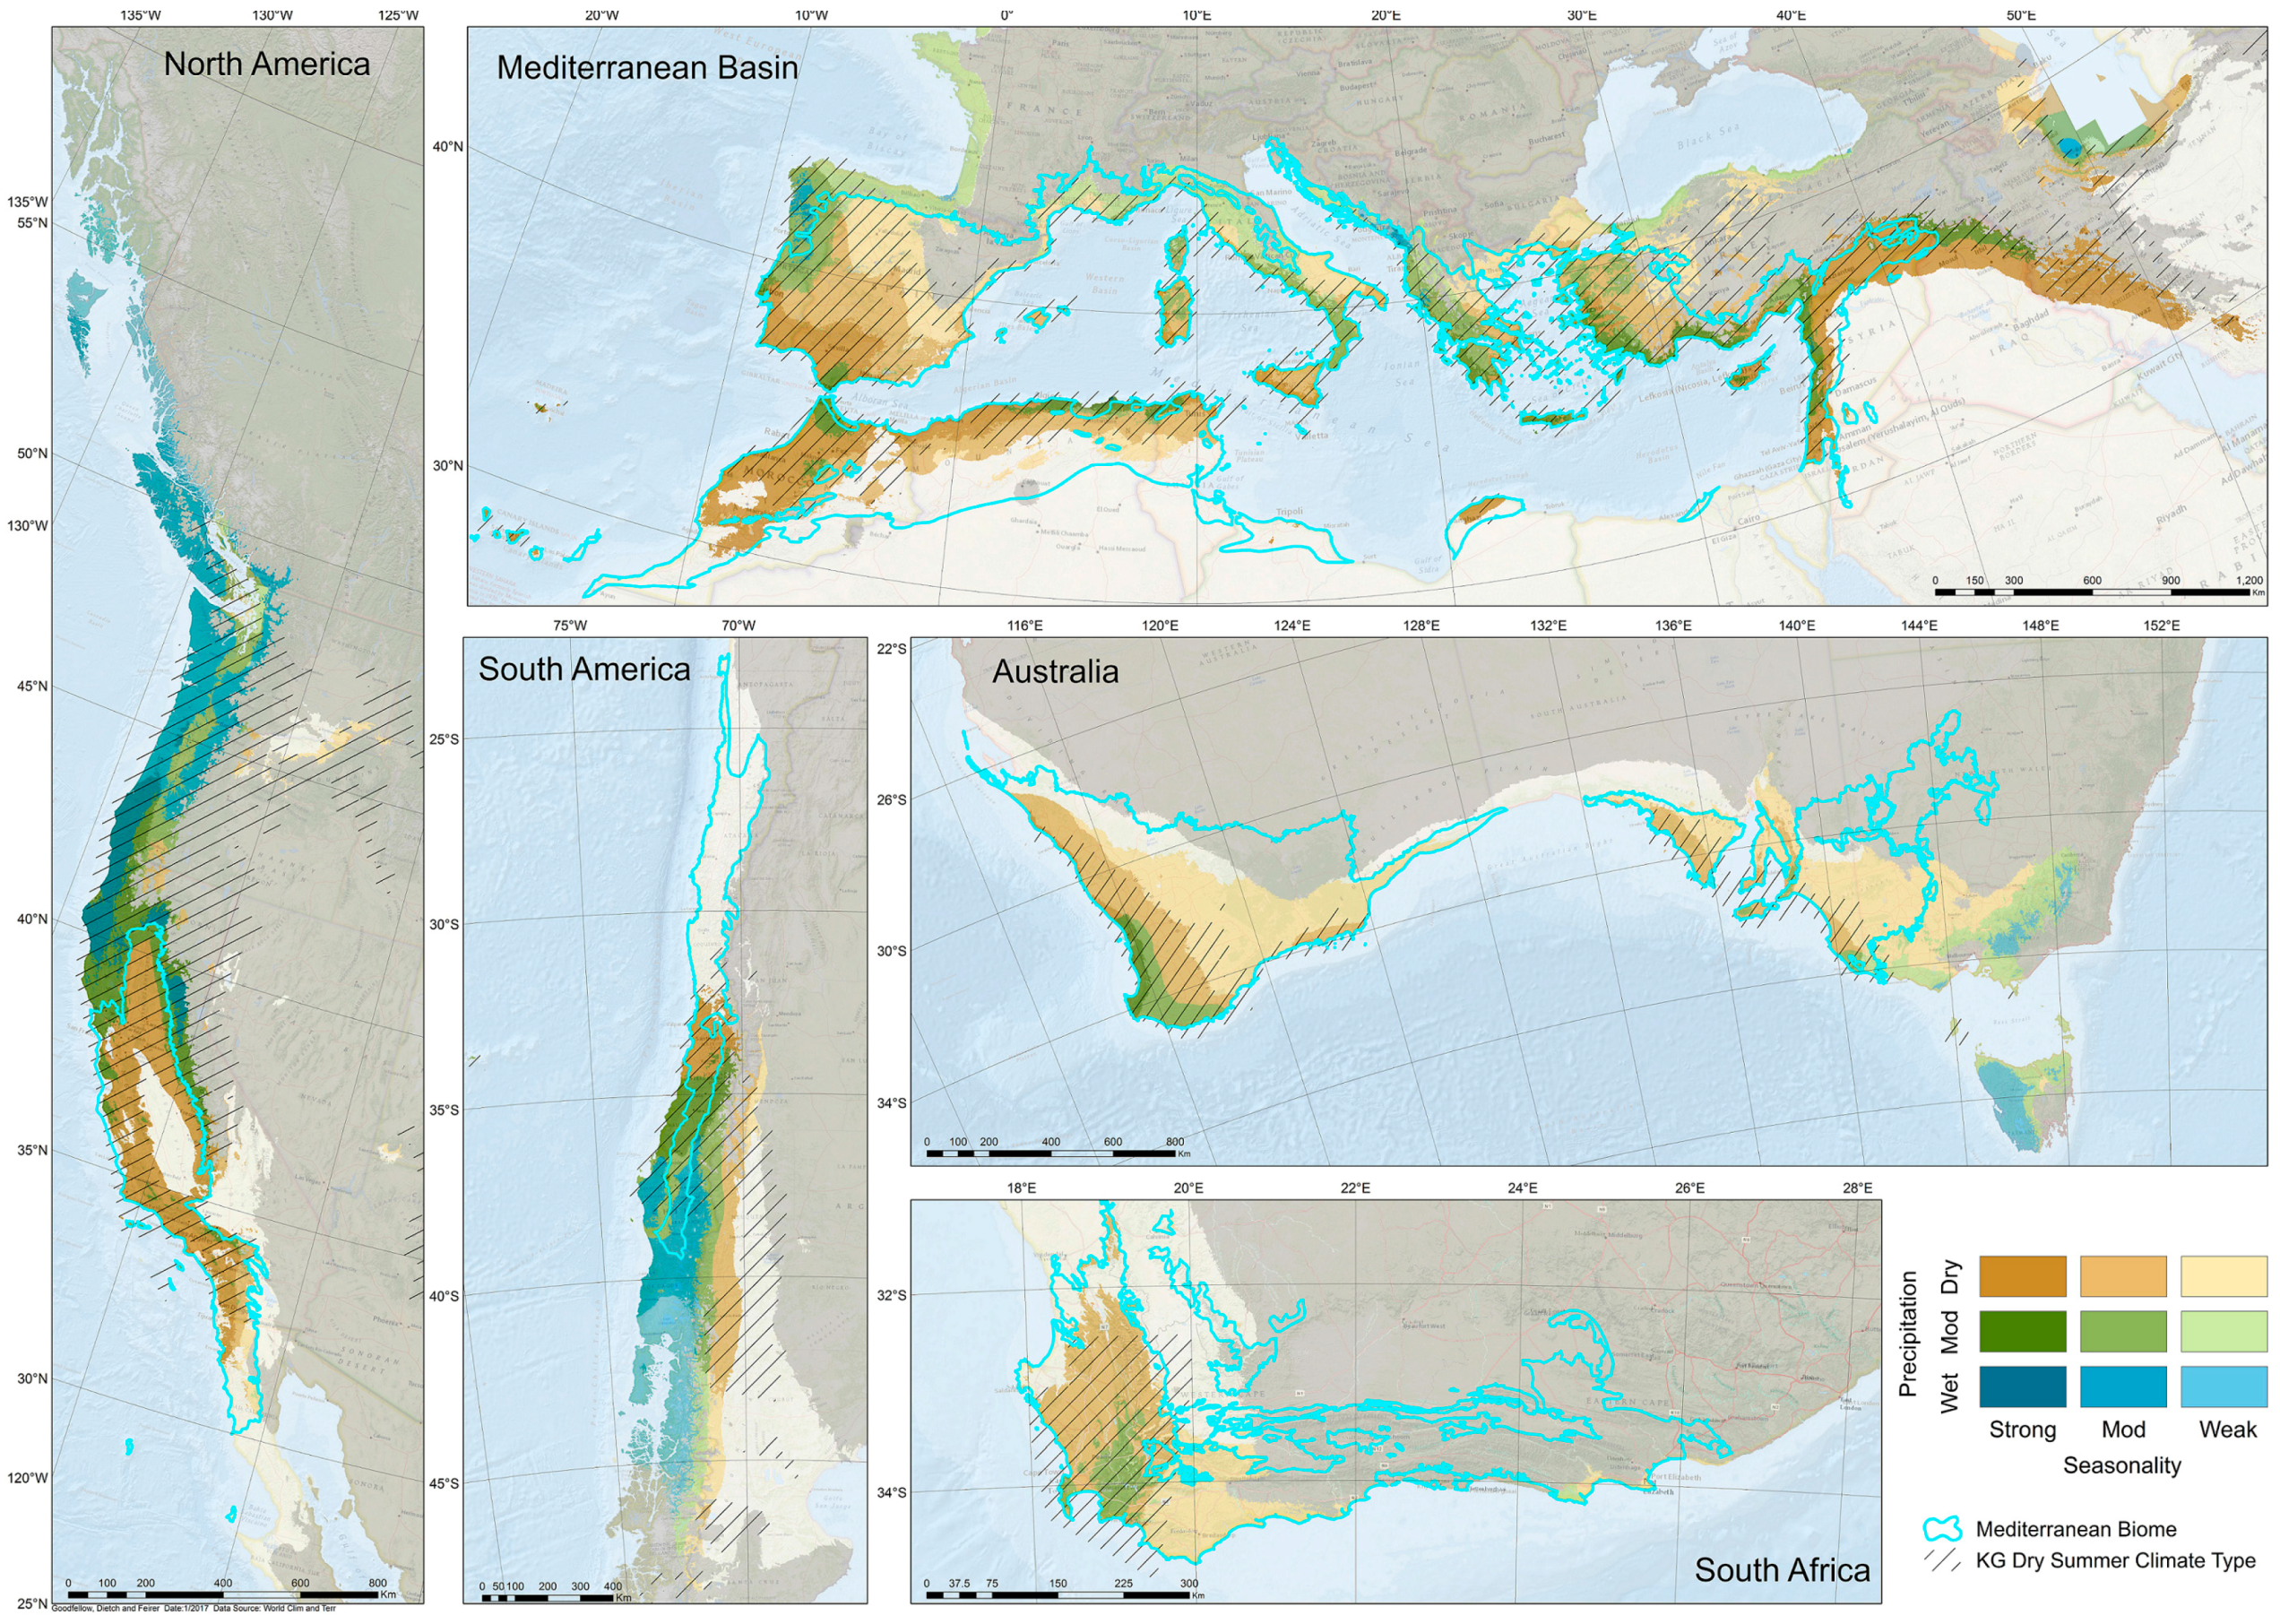
The Mediterranean biome generally fits within the climate characteristics described above (precipitation more than 300 mm annually, less than 20% during the summer dry season, less more than 50% during the winter half of the year), though portions of each region do not fit these criteria (Figure 1). Many of the areas that do not meet our criteria are arid, receiving less than 300 mm annually, including the Regiòn de Atacama in northern Chile, the Central Valley of California and Mexico’s Baja Peninsula, and the Saharan Atlas Range (as well as parts of Australia and South Africa; Figure 1). Other portions of the Mediterranean biome are not adequately seasonal to meet our criteria (i.e., more than 20% of precipitation during the three summer months), including parts of South Africa (the eastern part of West Cape and western part of East Cape), Australia (southern New South Wales), and Europe (Northeastern Spain and Italy). The Mediterranean biome also does not always match the Koppen–Geiger dry-summer Cs climate type.
Areas with a Mediterranean biome vary with respect to mean annual precipitation and percentage of precipitation during summer. In North America, the Mediterranean biome is almost entirely within our dry category (less than 700 mm), mostly with strong seasonality (Figure 1, Table 2). The Mediterranean biome of North America also includes smaller areas that receive more precipitation (more than 700 mm annually) around the San Francisco and Monterey Bays and the foothills of the Sierra Nevada Range; as well as areas that are dry and moderately seasonal (the mountains east of Los Angeles and San Diego) and, farther south, dry and weakly seasonal. In South America, most of the Mediterranean biome (63%) receives less than 300 mm annually (Table 2). Those areas within the biome that receive more than 300 mm vary with latitude, including drier and more strongly seasonal areas to the north and wetter moderately seasonal areas to the south (Figure 1).
The majority of the Mediterranean biome in Australia is dry and either weakly or moderately seasonal (Table 2); only a small portion of the biome in Australia along the southwestern coast is strongly seasonal (Figure 1). A large portion of the South African Mediterranean biome does not meet our criteria for seasonality (indicating that more than 20% of mean annual precipitation occurs during the summer season); no parts of South Africa are strongly seasonal. The majority of the Mediterranean biome around the Mediterranean Sea is dry (300–700 mm annually; Table 2); 17% is moderate with respect to precipitation (700–1300 mm) and a small portion (0.5%) is wet (along the Adriatic Sea). Those areas that are strongly seasonal tend to be north-facing (parts of coastal northern Africa) or west-facing (southern Spain, Greece, Turkey, southwest Asia; Figure 1). Based on the WorldClim spatial dataset, the Mediterranean biome around the Mediterranean Sea is the most diverse with respect to annual precipitation and seasonality, compared to other regions: including small areas on the east coast of the Adriatic Sea that are wet (where precipitation exceeds 1800 mm annually), it includes all nine categories of annual precipitation and seasonality we define in this study.
On most continents, large portions of the dry-summer climate areas extend beyond the Mediterranean biome. Portions of the west coast of North America that receive less than 5% of the annual precipitation during the summer extend north into Oregon; western Washington and Vancouver Island receive less than 12% of annual precipitation during summer (Figure 1). Spatial patterns of annual precipitation and seasonality are similar in Chile, where areas farther from the equator and beyond the Mediterranean biome are relatively dry in summer and receive more precipitation annually than closer to the equator. Parts of Tasmania also are dry in summer and receive more precipitation than in the Mediterranean biome of Australia. In the region surrounding the Mediterranean Sea, areas with a dry summer and more than 300 mm precipitation annually extend east into northern Iraq and western Iran; and around the southern and southeastern Caspian Sea.
3.2. Interannual Variability
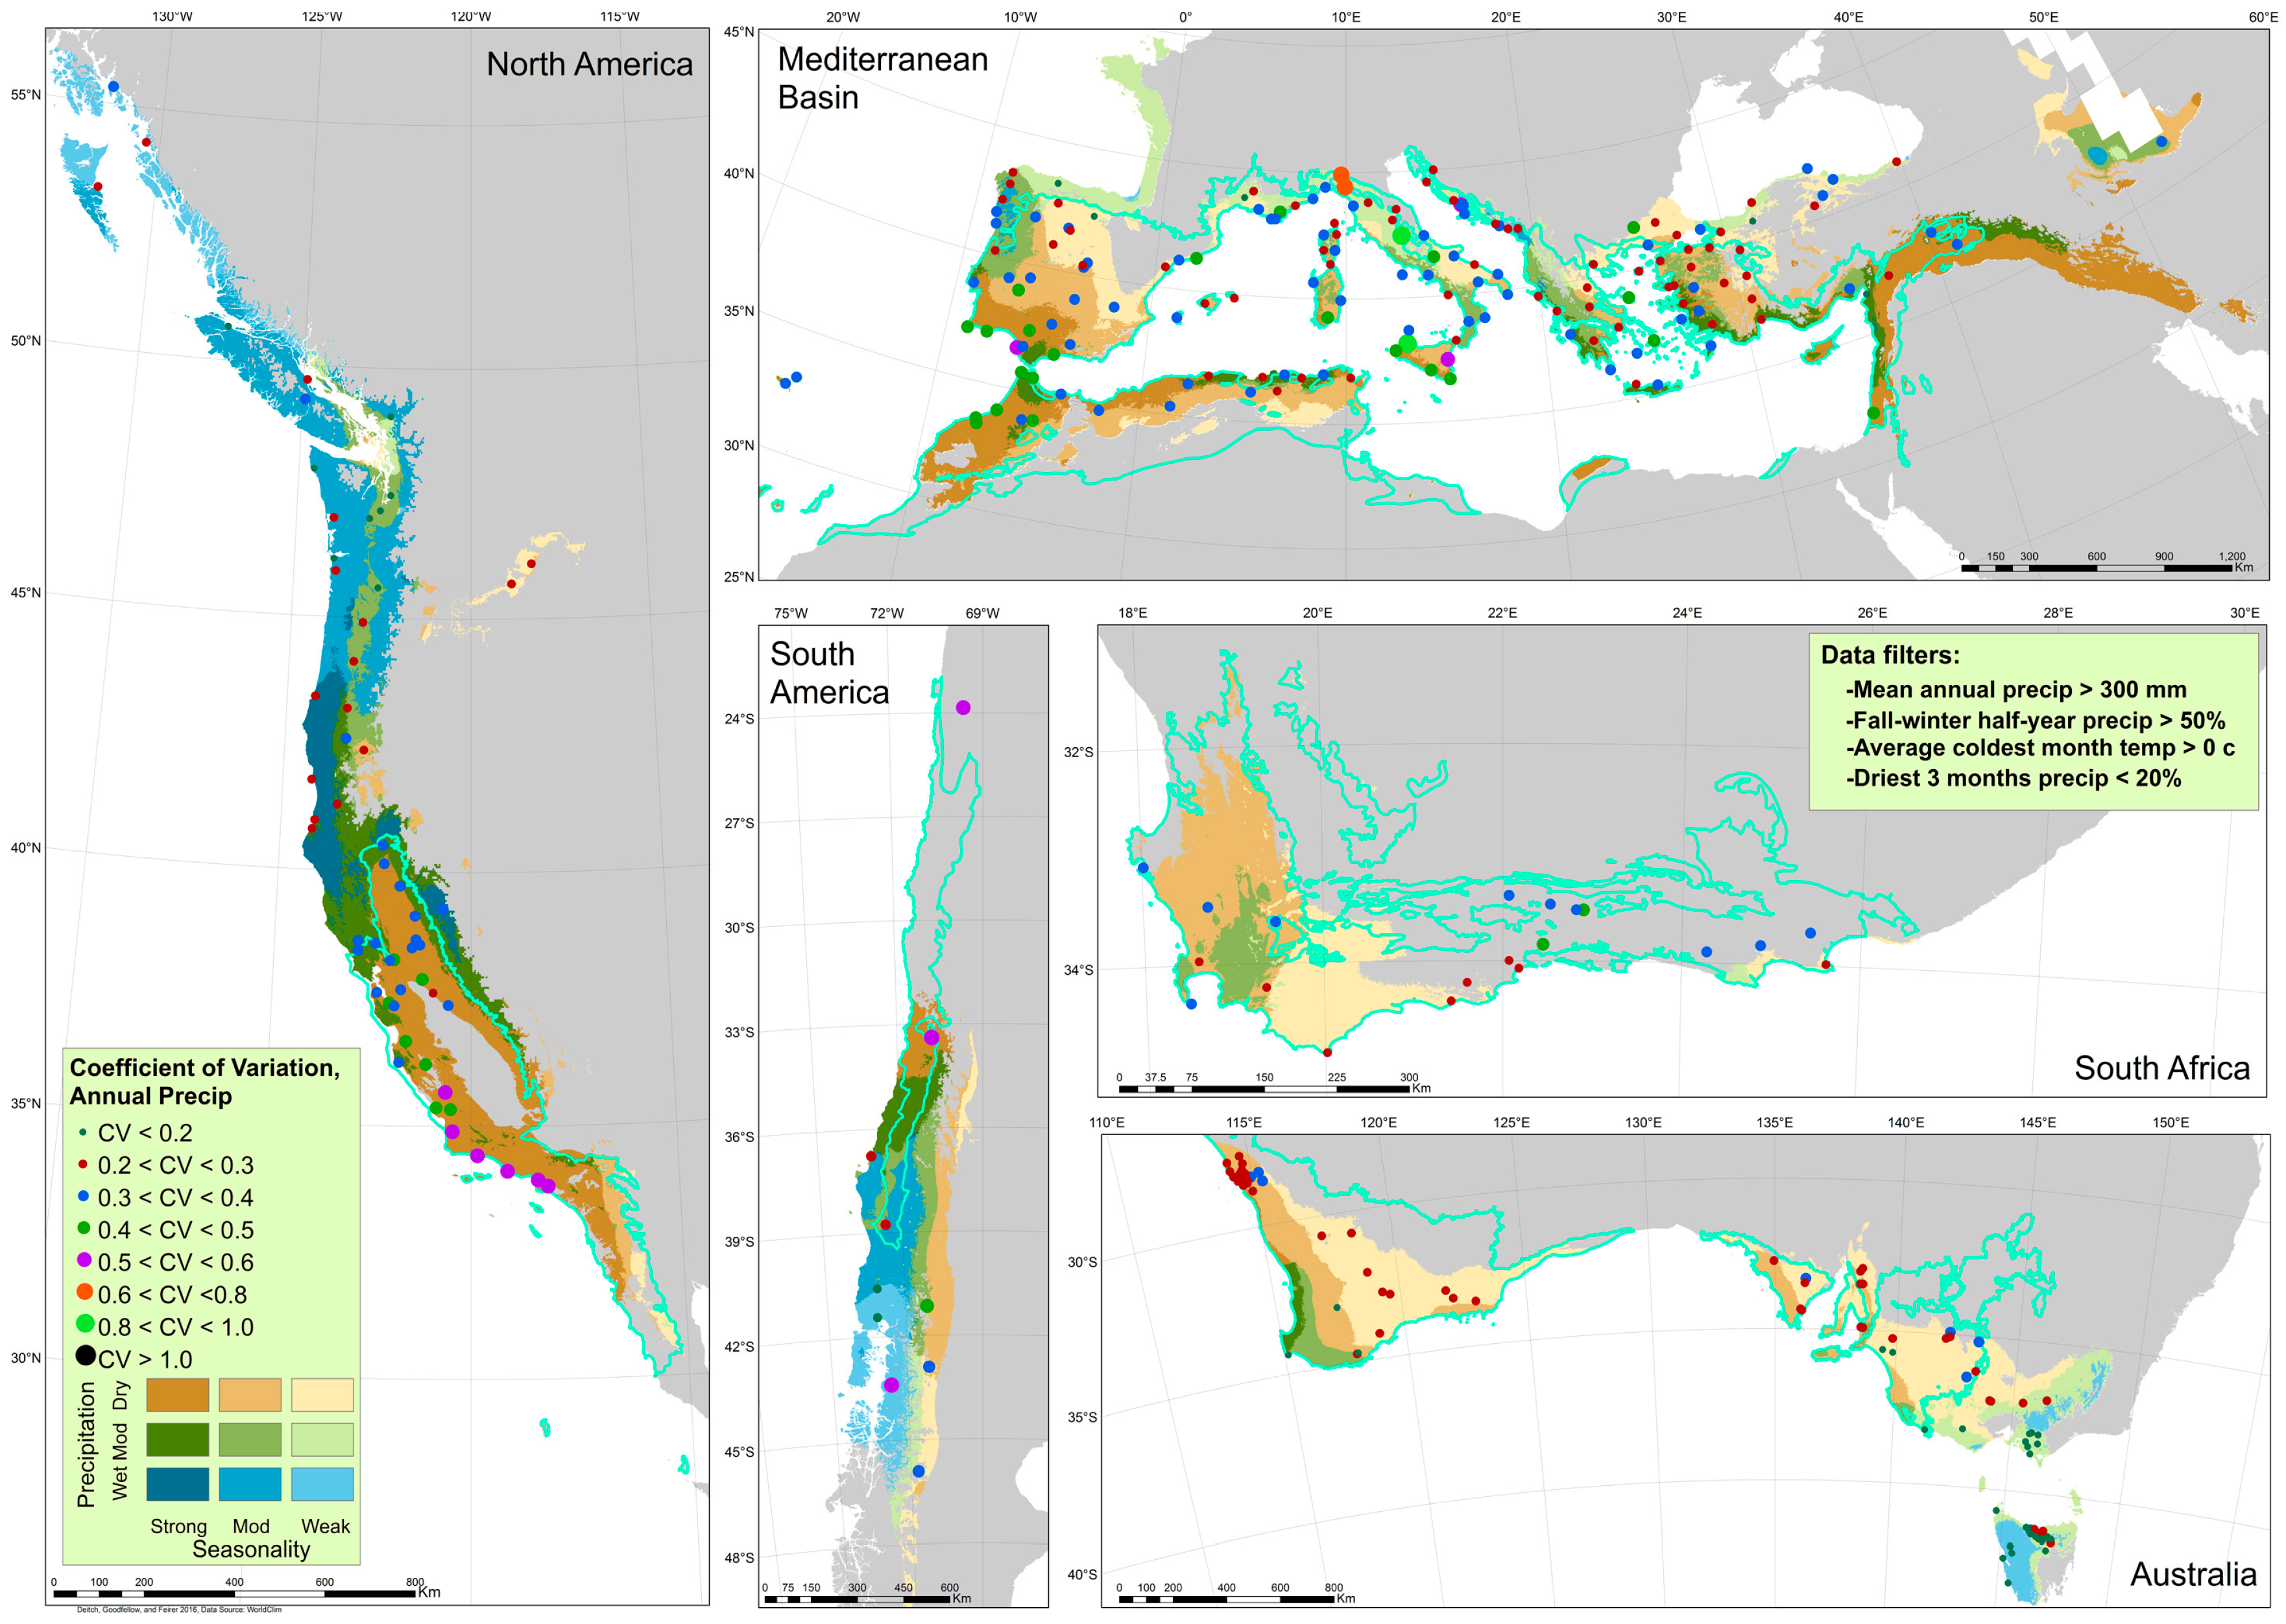
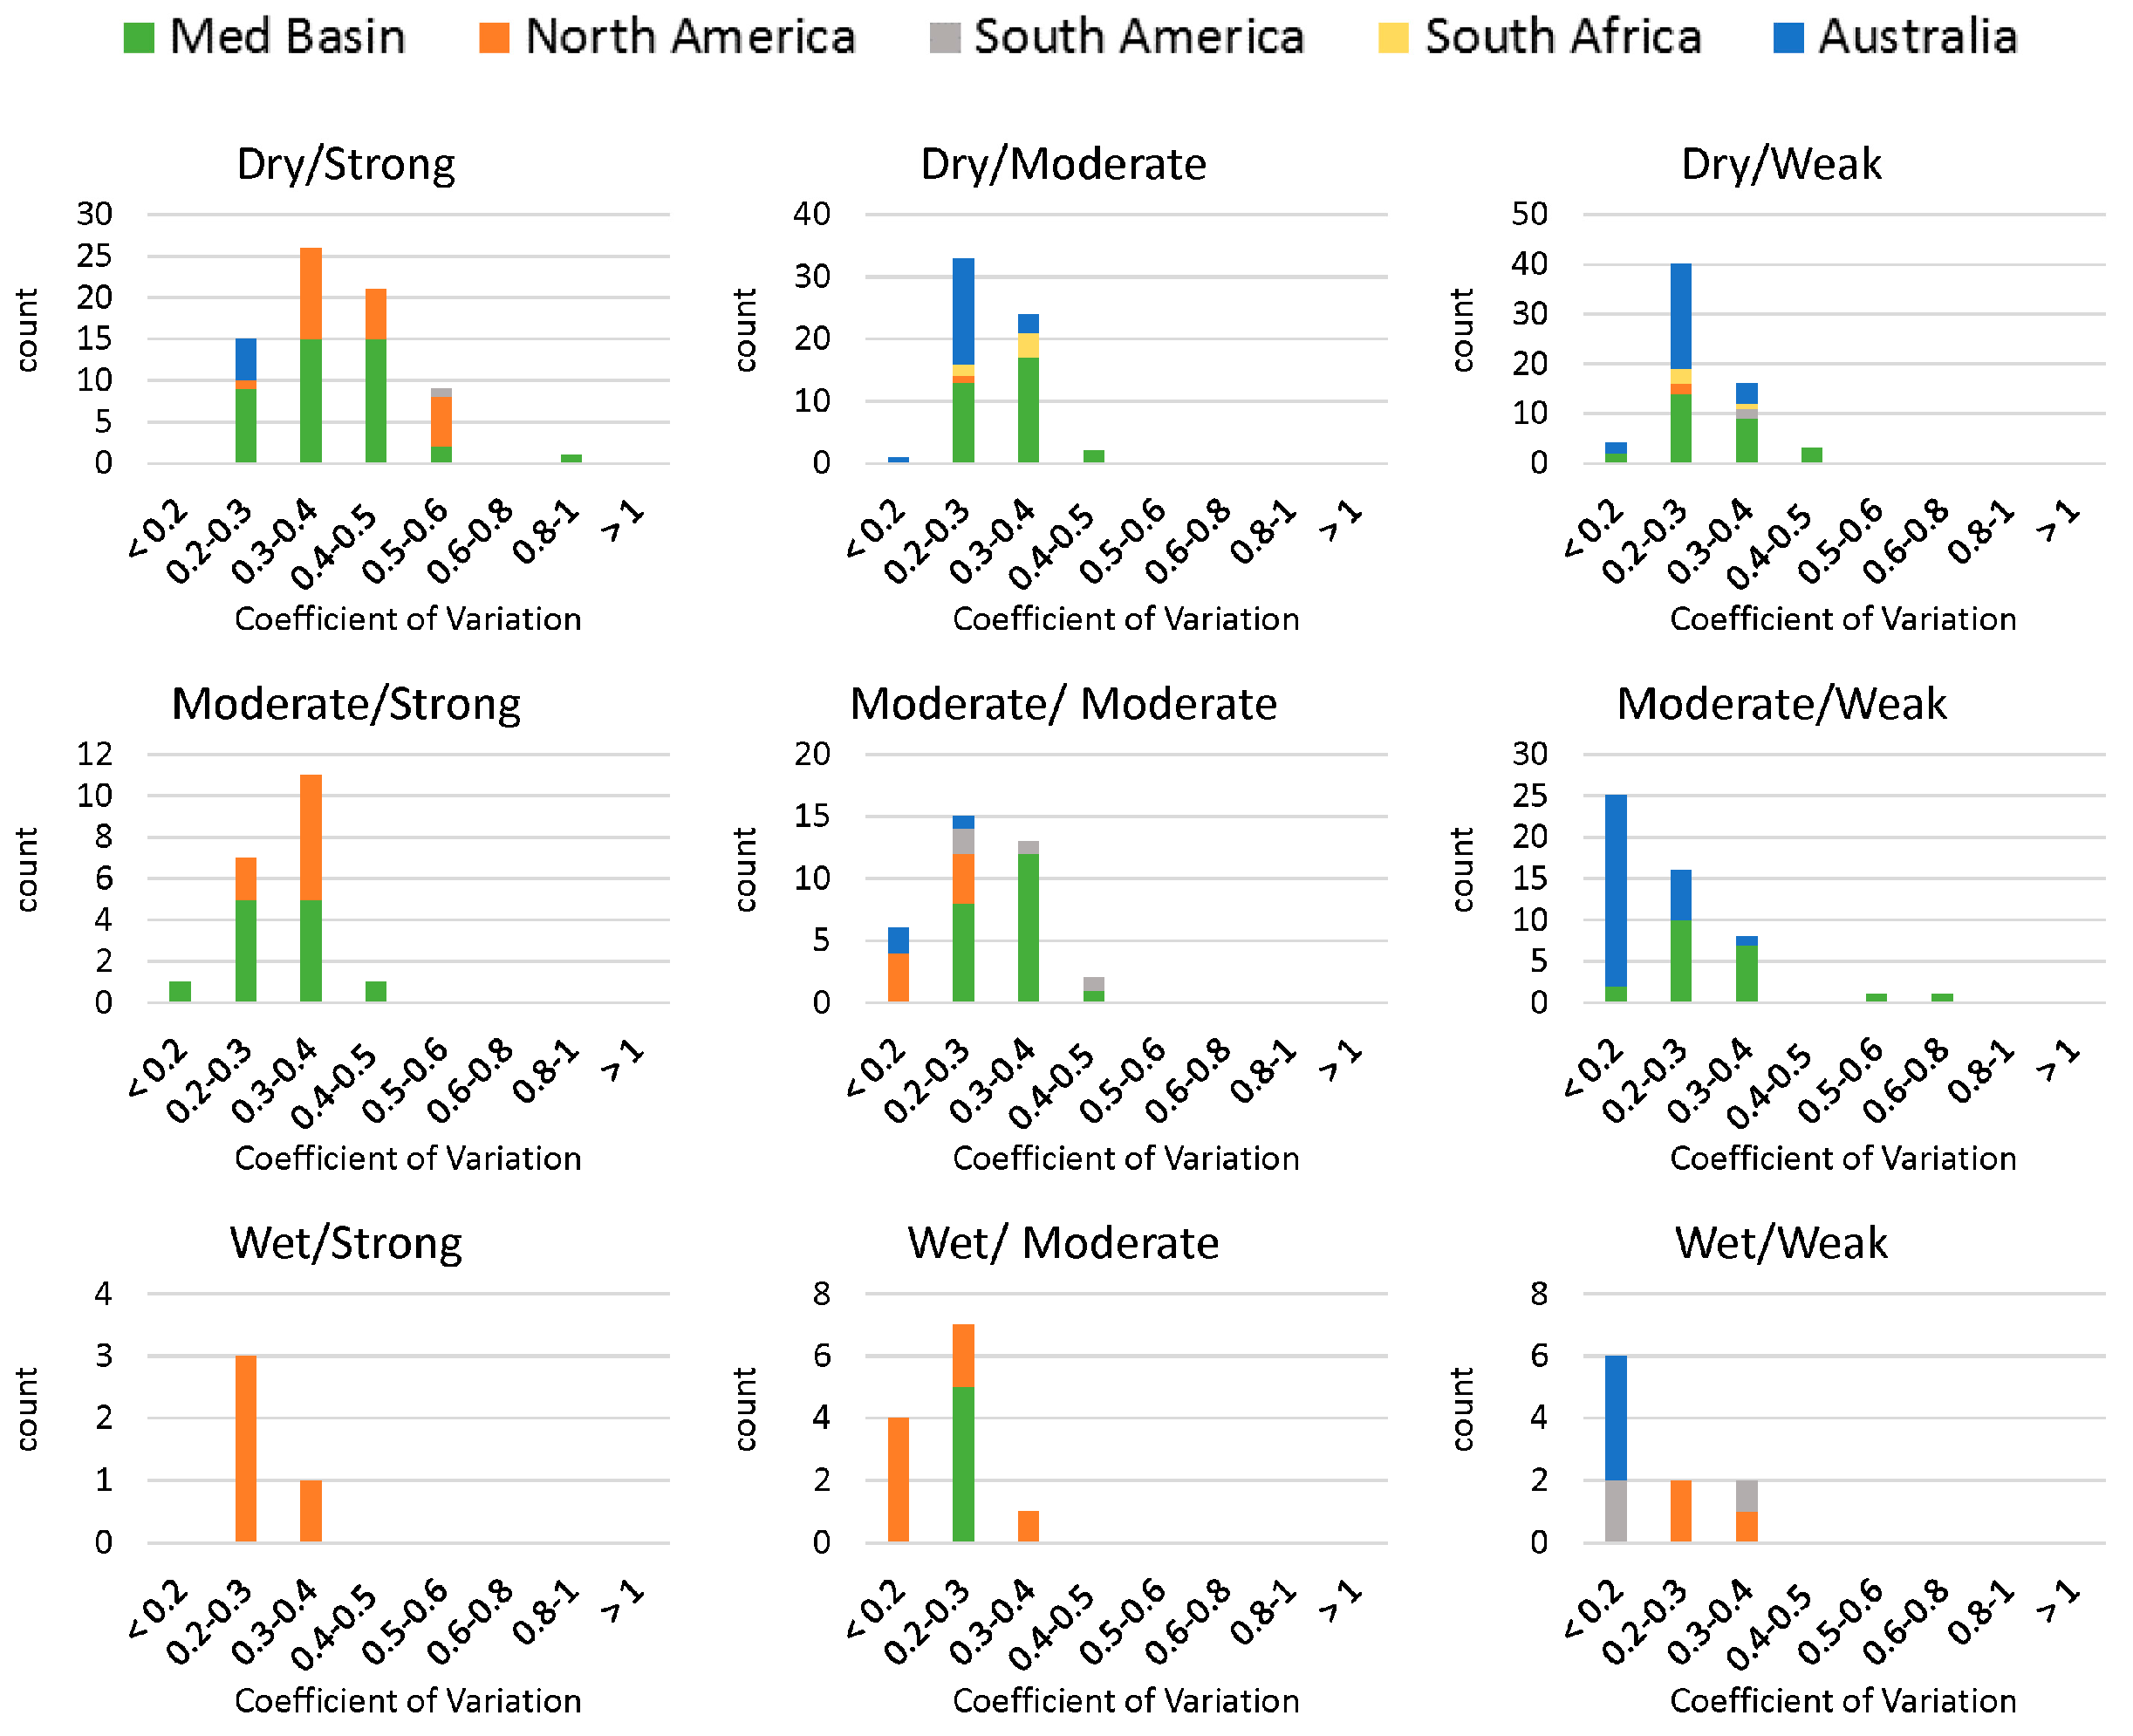
The Coefficient of Variation (CV) for annual precipitation, which characterizes variability of total precipitation over a defined period, is also different within and among Mediterranean-climate areas. Within the greater Mediterranean region, areas with stronger seasonality (southern Spain and Portugal, Morocco, Gibraltar, Crete, southwest Asia) tend to have higher annual precipitation CV than areas with weaker seasonality (though northern Italy and Sicily have high CV and weak or moderate seasonality; Figure 2). Annual precipitation CV in North America is generally greater in the south than the north, even within areas of similar climate category—for example, annual precipitation CV is greater in the dry strongly seasonal southern California coast than the dry strongly seasonal central coast or Sacramento Valley. CV is less in areas that are wet or moderately wet. CV of annual precipitation is consistently lower in Australia and South Africa compared to other regions; and lower among sites along the coast of South Africa than inland. Among the few sites in South America, annual precipitation CV is variable and shows no distinct relationship with precipitation category or other geographical gradients (e.g., coastal/inland, north/south). In all regions, annual precipitation variability is greatest among sites that are dry and strongly seasonal, and are low in places that are wet and in places that are weakly seasonal (Figure 3). (CV data also appear in Tables S1–S5.)
The interannual variability of summer season precipitation is also highly variable within and among Mediterranean-climate areas. Summer precipitation CV is low among all sites in South Africa and Australia, compared to North America and the Mediterranean region; and low among most of the South America sites (Figure 4). In the greater Mediterranean region, summer precipitation variability is greatest through the southern portion, from Morocco and Spain, to Sardinia and Sicily, to western Turkey. Within North America, summer CV is higher to the south than to the north. Among all regions, strongly seasonal areas (indicating very low summer precipitation on average) have greater summer precipitation CV than areas with weaker seasonality (Figure 5).
3.3. Trends
3.3.1. Annual Trends
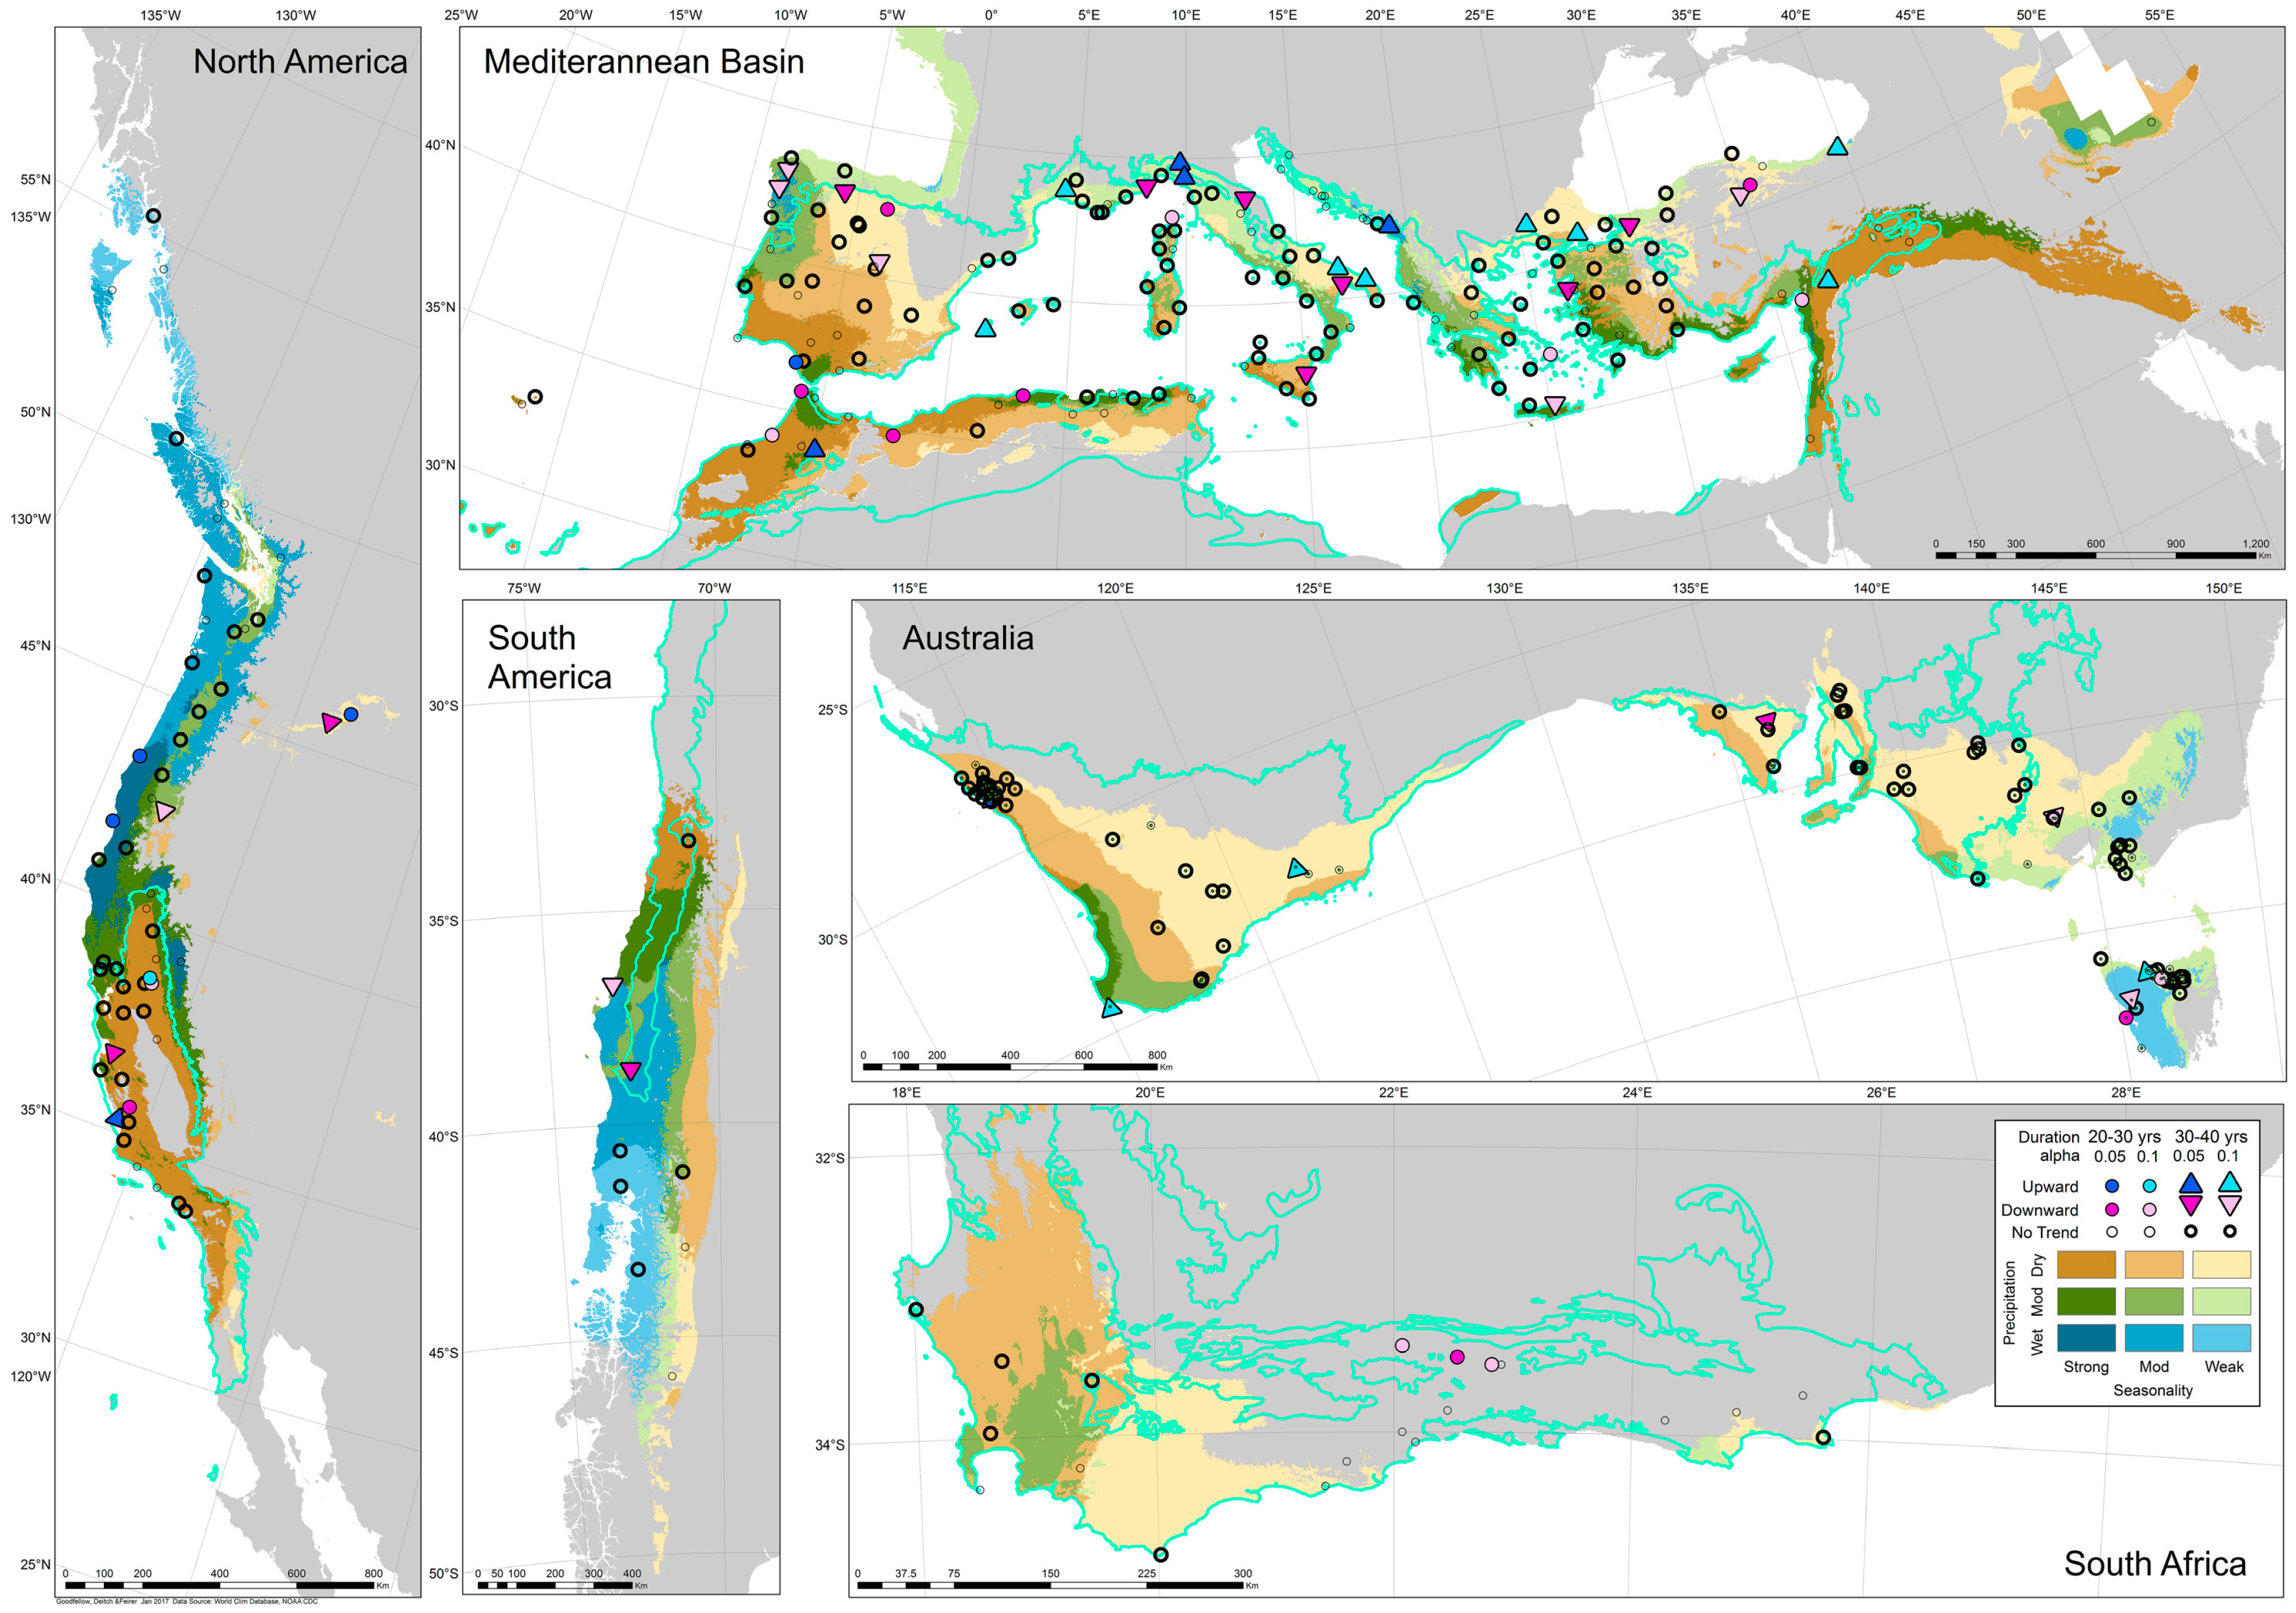
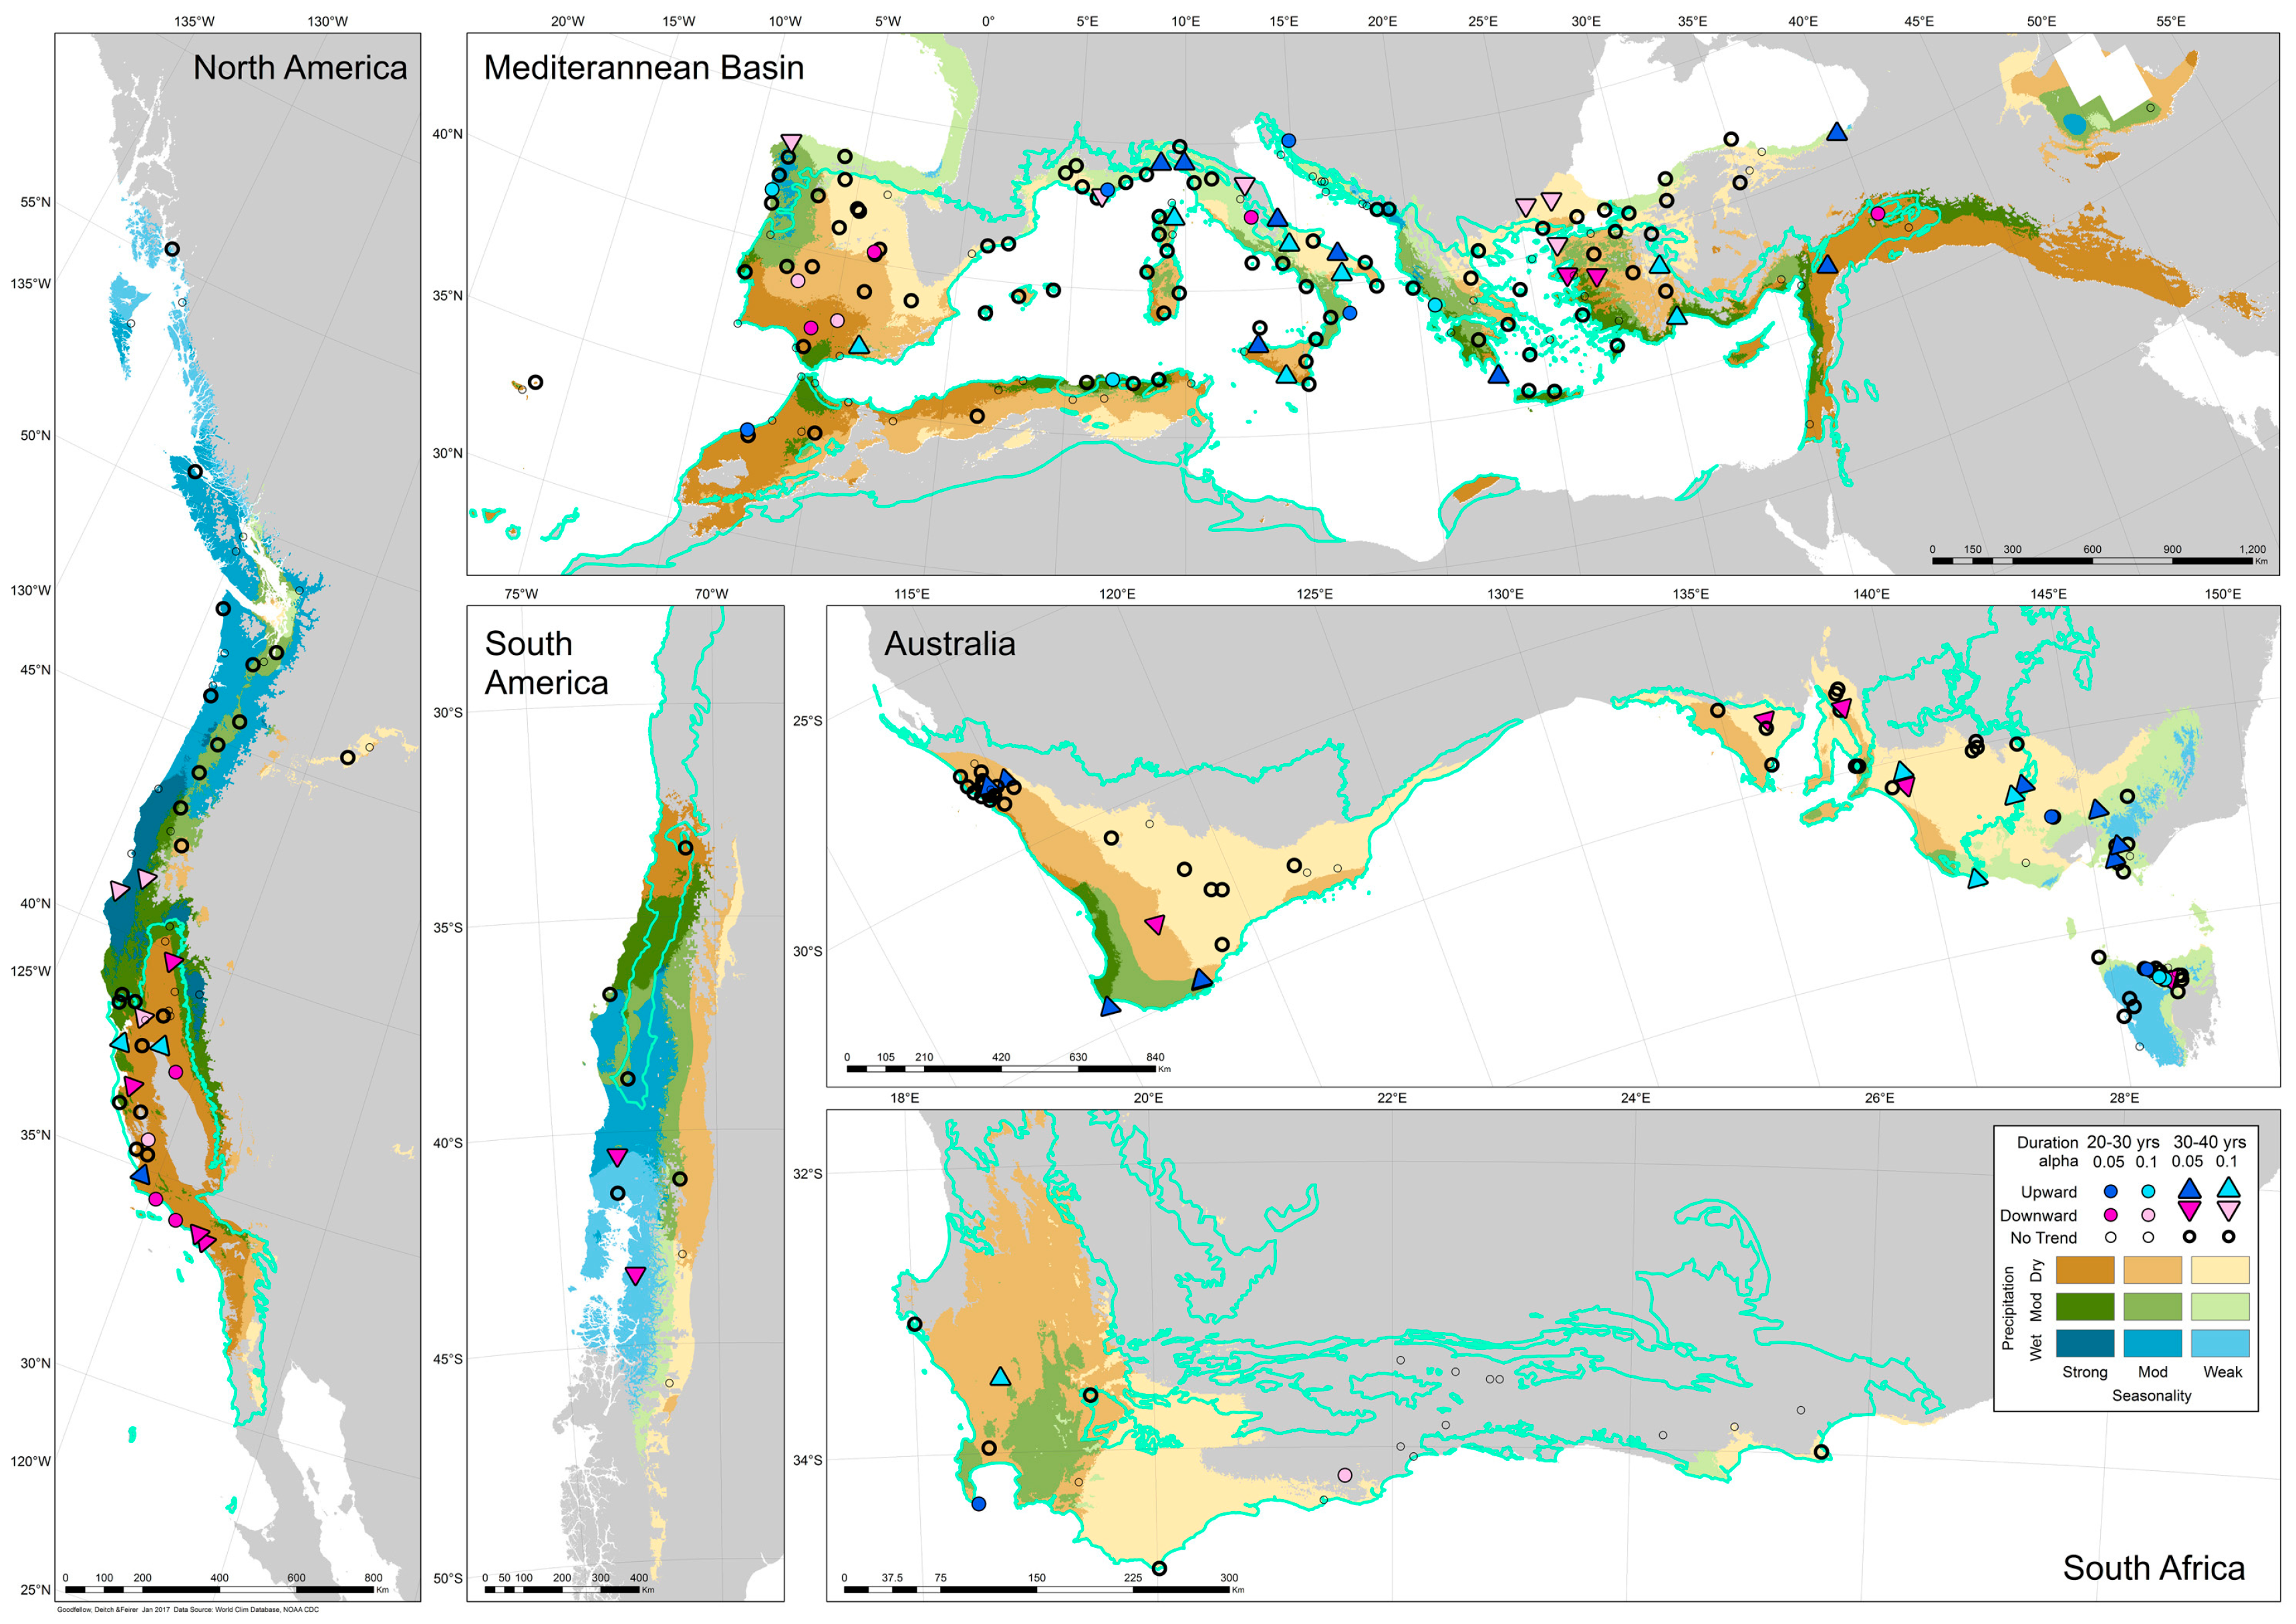
Trends in annual precipitation since 1975 vary between areas with dry summer climates. Most Australia sites show declining precipitation trends, although two sites in South Australia west of Spencer Gulf are anomalous indicating upward trends (Figure 6). Annual precipitation trends are also spatially variable in North America and South America. Among sites showing trends, precipitation has declined in recent decades in the southern portion of dry strongly seasonal North America (central and southern California); and in South America, sites closer to the coast show downward trends compared to those inland. Among sites in South Africa, most that show trends in annual precipitation indicate less precipitation over time (especially inland). Trends in annual precipitation in the Mediterranean region are also spatially variable. Sites in general show downward trends in Spain, southern France, and northern Italy; and increasing trends in northern Africa. Sites showing trends in central and southern Italy and east of the Aegean Sea are less spatially sorted, with sites indicating upward trends near sites indicating downward trends. Almost all sites in moderately wet and wet areas (those with more than 700 mm annually), with more than 30 years of recent data, show downward trends (with exceptions in North Africa and Crete). Most sites with upward trends in annual precipitation are located in dry areas (300–700 mm annually).
Trends in annual variability, indicated by change in the magnitude of deviation from the mean over the period of record, are also generally sorted spatially. Among those sites that indicated trends in Australia, variability in Western Australia, New South Wales, and Victoria is increasing; and decreasing among sites in South Australia (Figure 7). Trends in annual variability among sites in North and South America were also spatially sorted but less consistent. Two sites in wet weakly seasonal South America indicated a downward trend in annual precipitation variability, while other sites showed no trend. In North America, only those sites in California show trends in annual precipitation variability at α = 0.05 or 0.1; most (but not all) trends are downward, indicating less variation from the mean over time. Most Mediterranean region sites show no trends in annual precipitation variability; significant upward trends in annual variability are located in Italy, while most showing downward trends in annual variability are east of the Aegean Sea. (All trends results also appear in Tables S1–S5.)
3.3.2. FWS Trends
Trends in FWS precipitation in Australia mirror annual precipitation: sites with statistically significant trends show decreasing trends since 1975 (Figure 8). However, a few sites that indicate no trends in annual precipitation (such as those in inland Western Australia) indicate downward trends in FWS precipitation. FWS precipitation trends in North America and South America also mostly follow trends in annual precipitation. FWS precipitation in central and southern California is generally decreasing (with two sites in the Sacramento Valley showing upward trends); sites with trends north of California vary (though most show no trends). FWS precipitation trends among sites in South America are also similar to annual trends, although two sites that indicate downward trends in annual precipitation indicate no trend in FWS precipitation. FWS precipitation trends in the Mediterranean region also vary over space. Similar to annual trends, FWS precipitation trends in northern Africa are generally upward; and trends in Italy and east of the Aegean Sea differ by location. Overall, fewer sites across the region indicate a downward trend in FWS precipitation compared to annual precipitation trends; more show no trend.
Trends in FWS precipitation variability were similar to trends in annual precipitation variability in some regions, but different in other regions: most notably, those sites in Victoria and New South Wales that showed increasing annual precipitation variability showed no trends in FWS precipitation variability (Figure 9). Trends in FWS variability among sites in North America and South America were almost all downward (though many sites showed no trends). Like North America and South America, trends in FWS precipitation and FWS variability among sites in South Africa are similar to annual trends, with precipitation among inland sites decreasing and coastal sites increasing. More sites show a decreasing trend in FWS precipitation variability; only one in North America with more than 30 years of record shows an increasing trend in FWS variability. FWS precipitation variability is similar to annual variability trends: increasing through most of Italy and Mediterranean islands (Sicily, Corsica, Crete), and decreasing through western Turkey.
3.3.3. Summer Trends
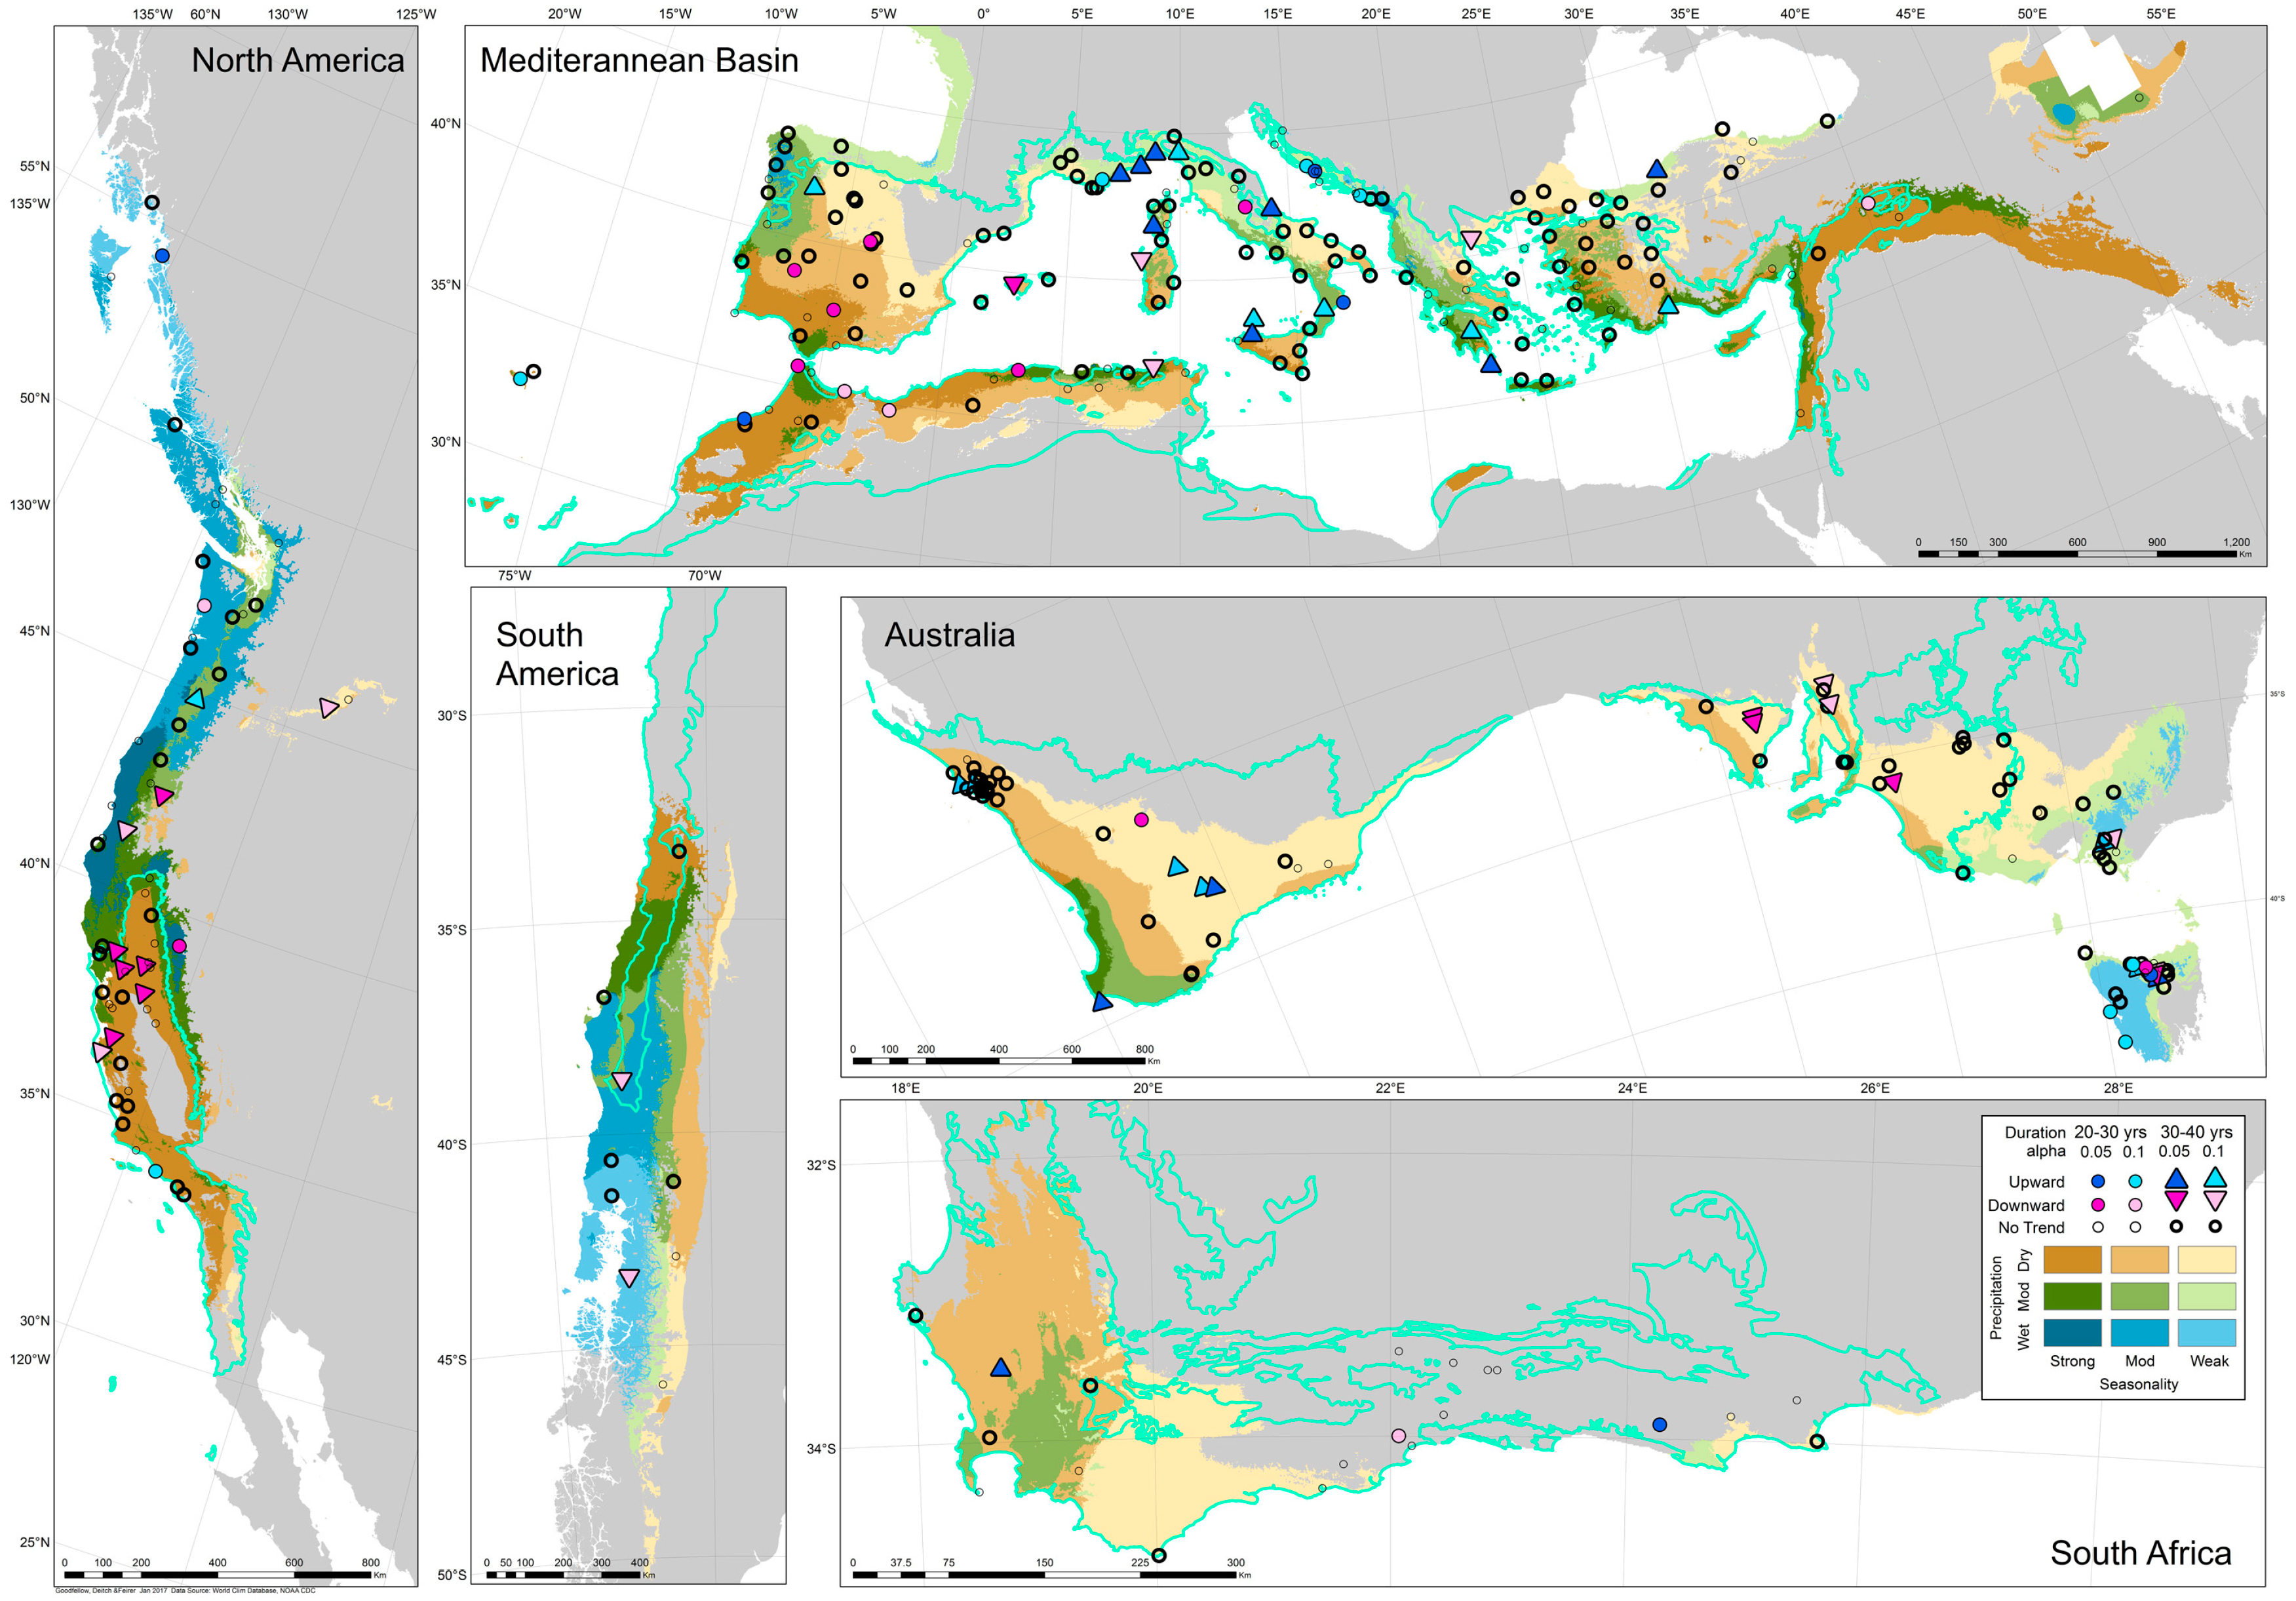
Trends in summer precipitation vary among the five regions. In Australia, summer precipitation shows an upward trend among most sites in South Australia; almost all sites in Western Australia, New South Wales, and Victoria show no trends (Figure 10). Summer precipitation trends in North America are almost all downward, from southern California through Washington. All trends in summer precipitation in South America are downward. Trends in summer precipitation through the Mediterranean region are also mostly downward, especially in Spain, Italy, and the islands south of the Aegean Sea. Sites in places including northern Africa, Sicily, Crete, and the Balkans, as well as South Africa, do not show the same declining trends in summer precipitation as elsewhere in the region.
Sites with trends in summer precipitation variability are not as common as those with trends in summer precipitation. In Australia, only a few sites in Western Australia (increasing) and two sites in South Australia and Victoria (decreasing) show trends in summer precipitation variability (Figure 11). In South America and South Africa, only a few sites in each region show summer variability trends. In North America and the Mediterranean region, several sites show trends in summer precipitation variability; but those trends do not show the same geographic distribution of trend direction as summer precipitation patterns.
4. Discussion
4.1. The Mediterranean Climate as a Function of Annual Precipitation and Seasonality
The results presented above indicate a wide range of annual and seasonal precipitation conditions among the five locations associated with a Mediterranean biome. Though the majority of the Mediterranean biome in the Mediterranean region falls into our category of dry (between 300 and 700 mm precipitation annually), parts are moderate and a small fraction (the east coast of the Adriatic Sea) is wet. The Mediterranean biome of Chile is the only other area to have this diversity of annual precipitation; the Mediterranean biomes of North America, Australia, and South Africa receive less than 1300 mm annually throughout. The Mediterranean region also has the most even distribution of seasonality, with at least 10% strongly, moderately, and weakly seasonal. Most of the Mediterranean biomes of North America and South America are either strongly or moderately seasonal; in Australia and South Africa, most are moderately and weakly seasonal. While many features have been proposed as attributing to the high species diversity in Mediterranean biomes, including landscape heterogeneity, general trends in seasonality, juxtaposition relative to other climate types, and geological history [16], the wide range of climate conditions within the biome likely also plays a role in biodiversity. Areas within the Mediterranean biomes of the Mediterranean region and Chile exhibit the greatest range of annual precipitation, from as little as 100 mm (including the Atlas Mountains and Atacama region within in the Mediterranean biome) to more than 1800 mm. Further, our results indicate that some parts of Mediterranean biome areas are weakly seasonal; others even receive more precipitation in summer than in other seasons.
Attempts to characterize Mediterranean biomes by climatic or geophysical features are few, typically having been either very complex (e.g., agro-bioclimatic classifications including several variables and subcategories) [50] or simplistic with respect to geography (e.g., dividing the Mediterranean region into four quadrants) [51] or climate (e.g., as Koppen-based subcategories on warm, moderate, or cool summer temperatures) [12]. Others have classified ecosystems within subregions [52]. Homogenization of the Mediterranean biome as one climate type may overlook the opportunity to identify potential region-wide, climate-driven causes of observed variations in aquatic or terrestrial ecosystems among Mediterranean biomes. Terrestrial ecosystems are generally adapted to a warm dry season [20] and aquatic ecosystems adapt to the flooding and drying characteristic of streams that have a storm-driven rainy season and then a long dry season [24]; but differences in ecological communities within and among Mediterranean biomes may be driven by nuanced differences in climate and topography [53]. Equally important, the threats to conservation within the ecosystems of the Mediterranean biome [54,55] may be oversimplified if the biome is assumed to be uniform. Climate differences influence the magnitude of stress placed on ecosystems by human development [56]; for example, conflicts between human water demands and aquatic ecosystems will likely be different in places that receive over 1000 mm of precipitation annually than in places that receive less than 500 mm.
Our results indicate that the climate of the Mediterranean biome (and thus the Mediterranean climate) can be any combination of our annual precipitation and seasonality categories, as well as two additional categories we did not initially classify: very dry conditions (less than 300 mm annually) and non-seasonal (more than 20% of annual precipitation during summer). Based on climatic variables of average annual precipitation and summer seasonality, we propose a classification of the Mediterranean climate according to the nine categories outlined in Table 1, plus the additional categories of very dry and non-seasonal. These two additional categories comprise large portions of some Mediterranean biomes, including Chile’s Region de Atacama, the southern Central Valley of California and southern Atlas Mountains (very dry), and western part of East Cape, South Africa, and northeastern Spain (non-seasonal). The areas within Mediterranean biomes identified as “non-seasonal” fit into our dry category (300–700 mm annually): despite receiving more than one-quarter of the annual precipitation in summer, they may have Mediterranean-type ecosystems because annual precipitation is low.
This classification system may help to explain differences in biodiversity among regions with a Mediterranean biome: for example, despite being much smaller in area, Chile may have higher biodiversity than Australia because average annual precipitation ranges from 100 mm in the north, to more than 2000 mm in the south. Seasonality may also have biodiversity implications: biota in areas with moderate precipitation and strong seasonality may be better adapted to very dry summer conditions than areas with moderate precipitation and weak seasonality. This classification system may also be useful in applying to other areas with similar climatic characteristics beyond the Mediterranean biome. For example, the valleys of Oregon and coastal California north of the Mediterranean biome receive similar precipitation annually as the wet portions of Chile and the Mediterranean region; and have stronger seasonality (receiving less precipitation in summer) than Chile. These areas have a wet/strongly seasonal or moderate/strongly seasonal Mediterranean climate type; other factors such as latitude, topography, and geology may deter the presence of Mediterranean-type ecosystems.
4.2. Interannual Variability
The interannual variability of annual precipitation indicates that some areas have more consistent precipitation than others. Among areas oriented east–west, annual precipitation in Eastern Australia and the eastern portion of the Mediterranean region is more consistent from one year to the next (i.e., lower CV) than in western parts of each area. Annual precipitation is especially variable in the coastal areas of southern Spain, southern France, and western Italy, where infrequent torrential rainfall likely plays a role in long-term annual precipitation patterns [57]. Among areas oriented north–south, variability in North America is especially high in southern California and is generally greater along the coast than inland; while in Chile, sites with high annual variability are located throughout the area. This variability in North America may be a result of el Niño/Summer Oscillation cycles, which can result in either very heavy winter precipitation or very low winter precipitation [58]; occasional high precipitation in southern California may disproportionally affect the temporal distribution of annual precipitation. Low variability in Australia and South Africa suggests that these areas are not subject to the climate patterns that create occasional very wet years in other Mediterranean-climate regions. Lower variability among Mediterranean biomes in the southern hemisphere may lead to a different composition of flora with respect to species traits compared to areas with higher variability [59].
Patterns of summer precipitation variability mirror those of annual variability. Mediterranean biomes of the southern hemisphere generally have low variability compared to those in North America and the Mediterranean region, indicating that the climate patterns that cause occasional summer precipitation in northern hemisphere Mediterranean biomes do not have similar effects in the southern hemisphere. Summer precipitation variability is especially high in northwestern Africa, southern Europe, and coastal Israel; and in central and southern California (and a site at Santiago, in north-central Chile). Most of these areas are strongly seasonal, typically having very little summer precipitation (less than 5% of annual precipitation); summer precipitation in these regions is typically very close to zero in most years, but on occasion is relatively high. These rare events may be due to migration of tropical moisture from monsoons in Asia and Africa [60].
Interannual precipitation variability has important implications for water management to meet human demands. Lower variability over time indicates a more consistent supply than higher variability: even if average precipitation is less, less variability translates to increased certainty in available water from one year to the next [61], which can affect ecosystem services such as irrigation for agriculture [62]. Long-term precipitation records (mostly over the period 1975–2015) indicate a wide range of variability in Mediterranean-climate areas: overall, the Mediterranean region and North America have many locations with very high variation, including some sites with coefficients of variation greater than 0.5. By definition, a CV of 0.5 indicates a distribution of annual precipitation such that one standard deviation is equal to 50% of the mean. For example, if mean annual precipitation is 500 mm and the CV is 0.5, then 68% of the values (one standard deviation greater and one smaller than the mean) are within 250 mm of the 500 mm average. Said another way, approximately 68% of the values are between 250 and 750 mm. If the CV for a site with similar mean annual precipitation (500 mm) is 0.3, then the range of approximately 68% of the values is 350 to 650 mm. Water managers in places with higher variability of mean annual precipitation have to incorporate a greater occurrence frequency of low-precipitation conditions into management frameworks. Incorporation of likely drought conditions into water policies is critical for maintaining human well-being during periods of water scarcity [63]; this is especially important in places where annual precipitation CV is high because of the greater frequency of low-precipitation conditions.
4.3. Trends
The results above indicate varying trends in annual precipitation and proportion of summer and FWS precipitation among and within Mediterranean-climate regions. Data from many areas indicate a downward trend in annual precipitation. In Australia, this could be expected: the period beginning the latter half of the study period (1995–2005, years 20–30 of the past 40 years) comprised Australia’s Millennium Drought, the longest period of consecutive dry years in recorded history [64]. Based on our results, the effect of this drought on 30- to 40-year precipitation trends did not lead to a significant downward trend everywhere; parts of South Australia with more than 30 years of data recorded an increasing trend in annual precipitation. The Australia results also highlight the limitations of trends analysis with limited data: some sites with less than 30 years of record indicate increasing trends over time because data from several of those sites began during the Millennium Drought. Long-term climate variations can lead to different hydrologic trends when data are evaluated over different periods of record [37].
Beyond Australia, some portions of Mediterranean-climate areas indicate trends in mean annual precipitation while others do not. All sites with trends in California indicate downward trends, similar to most sites with trends in Spain, South America, South Africa. Northern Africa is the only identified region where annual precipitation trends are mostly upward. In other areas, such as central and southern Italy and Turkey, some sites indicate upward trends while others indicate downward trends. In such areas where trends results are mixed, direction of trends is not associated with our proposed climate categories: for example, the mixed upward and downward trends in eastern Italy and western Turkey occur within similar conditions of dry or moderate annual precipitation coupled with weak or moderate seasonality. These variations may be attributed to microclimatic conditions, which can be influenced by atmospheric circulation patterns, orographic variations, and proximity to coastal moisture [65].
Summer precipitation patterns over the past 30–40 years also indicate a downward trend in many locations, suggesting that summers in many areas including Spain and Italy, California, and South Africa are becoming drier. Some areas beyond the Mediterranean biome are also becoming drier in summer. Oregon and Washington in North America, and Chile south of Santiago, all are mostly wet-strongly seasonal; with the summers becoming drier, ecosystems in these regions may shift toward more closely resembling nearby Mediterranean biomes. Research has suggested that the Mediterranean biomes of some regions could expand through the 21st century [15]; our results indicate that changes in climatic drivers may already be underway. These results also have important implications for understanding the limitations of spatial datasets such as WorldClim version 1 (used here and elsewhere), which are based on modeled 30-year precipitation datasets ending in 1990. These datasets are now almost 30 years old, and our results suggest that average annual and seasonal precipitation in many locations may not be the same today as they were 30 years ago. Funding to support the development of datasets such as WorldClim version 2 (which would incorporate data from 1970 to 2000) is critical for understanding how human and ecological demands for water can be met in the coming century.
The majority of sites show no trends at alpha 0.05 or 0.01 among annual, FWS, and summer precipitation. A finding of no significant trend is a common result among studies that use the Mann–Kendall test to identify trends among several sites [39,40], and is more common among precipitation than discharge [36]. This may be due to a break in classification. We chose to show trends at alpha values and not outside of those thresholds; as a result, we conclude a significant trend at α = 0.09 but not at 0.11. Some studies report the Z score calculated by the Mann–Kendall test [39,40], which describes the magnitude of the trend and is thus continuous from very strong trend to very little or no trend; but we focused on statistical significance rather than a graduated scale for a less nuanced classification. Additionally, our study uses easily obtained data over large areas—areas with a dry summer climate across the globe—and coverage over these areas is not comprehensive. Where precipitation data can be obtained and verified, focused temporal trends evaluations may provide additional important insights to more thoroughly confirm and better characterize the spatial variability of climate trends; and explore the influence of topographic features at higher resolution [65].
Trends that indicate declining precipitation have important implications for aquatic and terrestrial ecosystems. For example, declining summer precipitation indicates a trend toward increased seasonality: many places that were moderately or weakly seasonal showed downward trends in summer precipitation, with less precipitation today than in previous decades. This suggests that summers are becoming more harsh, which may cause a shift toward aquatic and terrestrial ecosystems better suited to strongly seasonal conditions [66,67]. Equally significant, downward trends in annual precipitation but not FWS precipitation suggest that precipitation is not declining during the rainy season, but rather during other times of year—possibly during early fall and late spring. A reduction in precipitation during late spring as the rainy season ends can have major implications for terrestrial and aquatic ecosystems. In terrestrial ecosystems, less rain during spring can lead to reduced vegetation productivity [68] and different composition [69]. In stream ecosystems, less precipitation in spring can lead to less streamflow in summer [70], which can deplete habitat for fish communities [71].
5. Conclusions
The analyses above present two important findings regarding status and trends of precipitation in Mediterranean biomes. First, climate characteristics of annual precipitation and seasonality are remarkably variable in areas categorized as within a Mediterranean biome. In South America and the Mediterranean region, average annual precipitation in the Mediterranean biome varies from less than 100 to more than 1800 mm. The percentage of precipitation during summer also is highly variable, from less than 5% in parts of North America, South America, the Mediterranean region, and Australia, to more than 20% in parts of Australia, South Africa, and the Mediterranean region. These variations are likely major drivers contributing to the high biodiversity of Mediterranean-climate regions: some areas are very dry while others are very wet, and some areas have a very dry summer season while others do not. Our proposed method of categorizing areas with a Mediterranean climate according to precipitation characteristics can help scientists and resource managers to better understand the varying degrees of pressure placed by precipitation patterns on ecosystems and water management institutions.
The second finding is regarding trends in precipitation within Mediterranean-climate regions. Though not uniform throughout all regions, precipitation data have followed general downward trends in annual precipitation (indicating less annual precipitation over time) and downward trends in summer precipitation (indicating a declining proportion of precipitation during summer). These shifts are likely to have consequences for aquatic and ecosystems, as well as for water management institutions responsible for maintaining adequate water supplies to meet human demands while protecting environmental resources. Reduced summer precipitation can lead to increased stress on ecosystems and greater water demand for agriculture and municipalities; reduced annual precipitation suggests that overall availability is less than in the recent past. Water conservation, through practices such as more efficient use and reduced demand, is likely to become even more important to water management in Mediterranean-climate regions through the twenty-first century.
Supplementary Materials
The supplementary materials are available online at www.mdpi.com/2073-4441/9/4/259/s1.
Acknowledgments
We thank the University of Florida IFAS Research and the West Florida Research and Education Center for support of this project. Publication of this article was funded in part by the University of Florida Open Access Publishing Fund. We also thank three anonymous reviewers whose feedback on earlier manuscript drafts greatly improved the quality of this manuscript.
Author Contributions
Matthew J. Deitch conceived and designed the experiments; Matthew J. Deitch and Michele J. Sapundjieff performed the experiments; Matthew J. Deitch, Michele J. Sapundjieff and Shane T. Feirer analyzed the data; Shane T. Feirer contributed reagents/materials/analysis tools; Matthew J. Deitch wrote the paper. Authorship must be limited to those who have contributed substantially to the work reported.
Conflicts of Interest
The authors have no interest or relationship, financial or otherwise, that might be perceived as influencing an author’s objectivity or any other conflict of interest.
References
- Carpenter, S.R.; Mooney, H.A.; Agard, J.; Capistrano, D.; DeFries, R.S.; Díaz, S.; Dietz, T.; Duraiappah, A.K.; Oteng-Yeboah, A.; Pereira, H.M.; et al. Science for managing ecosystem services: Beyond the Millennium Ecosystem Assessment. Proc. Natl. Acad. Sci. USA 2009, 106, 1305–1312. [Google Scholar] [CrossRef] [PubMed]
- Parmesan, C. Ecological and evolutionary responses to recent climate change. Annu. Rev. Ecol. Evol. Syst. 2006, 37, 637–669. [Google Scholar] [CrossRef]
- Westerling, A.L.; Hidalgo, H.G.; Cayan, D.R.; Swetnam, T.W. Warming and earlier spring increase western US forest wildfire activity. Science 2006, 313, 940–943. [Google Scholar] [CrossRef] [PubMed]
- Breshears, D.D.; Cobb, N.S.; Rich, P.M.; Price, K.P.; Allen, C.D.; Balice, R.G.; Romme, W.H.; Kastens, J.H.; Floyd, M.L.; Belnap, J.; et al. Regional vegetation die-off in response to global-change-type drought. Proc. Natl. Acad. Sci. USA 2005, 102, 15144–15148. [Google Scholar] [CrossRef] [PubMed]
- Prentice, I.C.; Cramer, W.; Harrison, S.P.; Leemans, R.; Monserud, R.A.; Solomon, A.M. Special paper: A global biome model based on plant physiology and dominance, soil properties and climate. J. Biogeogr. 1992, 19, 117–134. [Google Scholar] [CrossRef]
- Millennium Ecosystem Assessment. Ecosystems and Human Well-Being: Synthesis; Island Press: Washington, DC, USA, 2005. [Google Scholar]
- Piao, S.; Ciais, P.; Huang, Y.; Shen, Z.; Peng, S.; Li, J.; Zhou, L.; Liu, H.; Ma, Y.; Ding, Y.; et al. The impacts of climate change on water resources and agriculture in China. Nature 2010, 467, 43–51. [Google Scholar] [CrossRef] [PubMed]
- Patz, J.A.; Campbell-Lendrum, D.; Holloway, T.; Foley, J.A. Impact of regional climate change on human health. Nature 2005, 438, 310–317. [Google Scholar] [CrossRef] [PubMed]
- Ruhí, A.; Holmes, E.E.; Rinne, J.N.; Sabo, J.L. Anomalous droughts, not invasion, decrease persistence of native fishes in a desert river. Glob. Chang. Biol. 2015, 21, 1482–1496. [Google Scholar] [CrossRef] [PubMed]
- Deitch, M.J.; Dolman, B. Restoring Summer Base Flow under a Decentralized Water Management Regime: Constraints, Opportunities, and Outcomes in Mediterranean-Climate California. Water 2017, 9, 29. [Google Scholar] [CrossRef]
- Kottek, M.; Grieser, J.; Beck, C.; Rudolf, B.; Rubel, F. World map of the Köppen-Geiger climate classification updated. Meteorol. Z. 2006, 15, 259–263. [Google Scholar]
- Peel, M.C.; Finlayson, B.L.; McMahon, T.A. Updated world map of the Köppen-Geiger climate classification. Hydrol. Earth Syst. Sci. Discuss. 2007, 4, 439–473. [Google Scholar] [CrossRef]
- Conacher, A.J.; Conacher, J. Introduction. In Land Degradation in Mediterranean Environments of the World; Conacher, A.J., Sala, M., Eds.; Wiley: New York, NY, USA, 1998. [Google Scholar]
- Grove, A.T.; Miles, M.R.; Worthington, E.B.; Doggett, H.; Dasgupta, B.; Farmer, B.H. The geography of semi-arid lands [and discussion]. Philos. Trans. R. Soc. Lond. B Biol. Sci. 1977, 278, 457–475. [Google Scholar] [CrossRef]
- Klausmeyer, K.R.; Shaw, M.R. Climate change, habitat loss, protected areas and the climate adaptation potential of species in Mediterranean ecosystems worldwide. PLoS ONE 2009, 4, e6392. [Google Scholar] [CrossRef] [PubMed]
- Bonada, N.; Resh, V.H. Mediterranean-climate streams and rivers: Geographically separated but ecologically comparable freshwater systems. Hydrobiologia 2013, 719, 1–29. [Google Scholar] [CrossRef]
- Montecinos, S.; Gutiérrez, J.R.; López-Cortés, F.; López, D. Climatic characteristics of the semi-arid Coquimbo Region in Chile. J. Arid Environ. 2016, 126, 7–11. [Google Scholar] [CrossRef]
- Abatzoglou, J.T.; Redmond, K.T.; Edwards, L.M. Classification of regional climate variability in the state of California. J. Appl. Meteorol. Climatol. 2009, 48, 1527–1541. [Google Scholar] [CrossRef]
- Ducić, V.; Luković, J.; Burić, D.; Stanojević, G.; Mustafić, S. Precipitation extremes in the wettest Mediterranean region (Krivošije) and associated atmospheric circulation types. Nat. Hazards Earth Syst. Sci. 2012, 12, 687–697. [Google Scholar] [CrossRef]
- Cowling, R.M.; Rundel, P.W.; Lamont, B.B.; Arroyo, M.K.; Arianoutsou, M. Plant diversity in Mediterranean-climate regions. Trends Ecol. Evolut. 1996, 11, 362–366. [Google Scholar] [CrossRef]
- Olson, D.M.; Dinerstein, E. The Global 200: Priority biomes for global conservation. Ann. Mo. Bot. Gard. 2002, 89, 199–224. [Google Scholar] [CrossRef]
- Dallman, P.R. Plant Life in the World’s Mediterranean Climates: California, Chile, South Africa, Australia, and the Mediterranean Basin; Univ of California Press: Berkeley, CA, USA, 1998. [Google Scholar]
- Gasith, A.; Resh, V.H. Streams in mediterranean climate regions: Abiotic influences and biotic responses to predictable seasonal events. Annu. Rev. Ecol. Syst. 1999, 30, 51–81. [Google Scholar] [CrossRef]
- Beche, L.A.; Mcelravy, E.P.; Resh, V.H. Long-term seasonal variation in the biological traits of benthic-macroinvertebrates in two Mediterranean-climate streams in California, USA. Freshw. Biol. 2006, 51, 56–75. [Google Scholar] [CrossRef]
- Resh, V.H.; Bêche, L.A.; Lawrence, J.E.; Mazor, R.D.; McElravy, E.P.; O’Dowd, A.P.; Rudnick, D.; Carlson, S.M. Long-term population and community patterns of benthic macroinvertebrates and fishes in Northern California Mediterranean-climate streams. Hydrobiologia 2013, 719, 93–118. [Google Scholar] [CrossRef]
- García-Roger, E.M.; del Mar Sánchez-Montoya, M.; Gómez, R.; Suárez, M.L.; Vidal-Abarca, M.R.; Latron, J.; Rieradevall, M.; Prat, N. Do seasonal changes in habitat features influence aquatic macroinvertebrate assemblages in perennial versus temporary Mediterranean streams? Aquat. Sci. 2011, 73, 567–579. [Google Scholar] [CrossRef]
- Gritti, E.S.; Smith, B.; Sykes, M.T. Vulnerability of Mediterranean Basin ecosystems to climate change and invasion by exotic plant species. J. Biogeogr. 2006, 33, 145–157. [Google Scholar] [CrossRef]
- Filipe, A.F.; Lawrence, J.E.; Bonada, N. Vulnerability of stream biota to climate change in mediterranean climate regions: A synthesis of ecological responses and conservation challenges. Hydrobiologia 2013, 719, 331–351. [Google Scholar] [CrossRef]
- Batalla, R.J.; Gomez, C.M.; Kondolf, G.M. Reservoir-induced hydrological changes in the Ebro River basin (NE Spain). J. Hydrol. 2004, 290, 117–136. [Google Scholar] [CrossRef]
- Kondolf, G.M.; Batalla, R.J. Hydrological effects of dams and water diversions on rivers of Mediterranean-climate regions: Examples from California. Dev. Earth Surf. Process. 2005, 7, 197–211. [Google Scholar]
- Deitch, M.J.; Kondolf, G.M. Salmon in a Mediterranean Climate: California’s Incendiary Mix. In Sustainable Water: Challenges and Solutions from California; Lassiter, A., Ed.; University of California Press: Berkeley, CA, USA, 2015. [Google Scholar]
- McClure, M.M.; Holmes, E.E.; Sanderson, B.L.; Jordan, C.E. A large-scale, multispecies status assessment: Anadromous salmonids in the Columbia River basin. Ecol. Appl. 2003, 13, 964–989. [Google Scholar] [CrossRef]
- Deitch, M.J.; Merenlender, A.M.; Feirer, S. Cumulative effects of small reservoirs on streamflow in Northern Coastal California catchments. Water Resour. Manag. 2013, 27, 5101–5118. [Google Scholar] [CrossRef]
- Mondal, A.; Khare, D.; Kundu, S. Spatial and temporal analysis of rainfall and temperature trend of India. Theor. Appl. Climatol. 2015, 122, 143–158. [Google Scholar] [CrossRef]
- Caloiero, T. Analysis of rainfall trend in New Zealand. Environ. Earth Sci. 2015, 73, 6297–6310. [Google Scholar] [CrossRef]
- Asarian, J.E.; Walker, J.D. Long-Term Trends in Streamflow and Precipitation in Northwest California and Southwest Oregon, 1953-2012. JAWRA J. Am. Water Resour. Assoc. 2016, 52, 241–261. [Google Scholar] [CrossRef]
- Poshtiri, M.P.; Pal, I. Patterns of hydrological drought indicators in major US River basins. Clim. Chang. 2016, 134, 549–563. [Google Scholar] [CrossRef]
- Feng, D.; Beighley, E.; Hughes, R.; Kimbro, D. Spatial and Temporal Variations in Eastern US Hydrology: Responses to Global Climate Variability. JAWRA J. Am. Water Resour. Assoc. 2016, 52, 1089–1108. [Google Scholar] [CrossRef]
- Rice, J.S.; Emanuel, R.E.; Vose, J.M. The influence of watershed characteristics on spatial patterns of trends in annual scale streamflow variability in the continental US. J. Hydrol. 2016, 540, 850–860. [Google Scholar] [CrossRef]
- Ficklin, D.L.; Robeson, S.M.; Knouft, J.H. Impacts of recent climate change on trends in baseflow and stormflow in United States watersheds. Geophys. Res. Lett. 2016, 43, 5079–5088. [Google Scholar] [CrossRef]
- Hijmans, R.J.; Cameron, S.E.; Parra, J.L.; Jones, P.G.; Jarvis, A. Very high resolution interpolated climate surfaces for global land areas. Int. J. Climatol. 2005, 25, 1965–1978. [Google Scholar] [CrossRef]
- Olson, D.M.; Dinerstein, E.; Wikramanayake, E.D.; Burgess, N.D.; Powell, G.V.; Underwood, E.C.; D’amico, J.A.; Itoua, I.; Strand, H.E.; Morrison, J.C.V.; et al. Terrestrial Ecoregions of the World: A New Map of Life on Earth: A new global map of terrestrial ecoregions provides an innovative tool for conserving biodiversity. BioScience 2001, 51, 933–938. [Google Scholar] [CrossRef]
- World Wildlife Fund and Nature Conservancy Terrestrial Ecoregion Layer, 2011. Source Data Obtained on 1 February 2017. Available online: http://maps.tnc.org/gis_data.html (accessed on 20 January 2017).
- Climate Data Online Data Portal. Available online: http://www7.ncdc.noaa.gov/CDO/country (accessed on 17 October 2016).
- Global Climatology Data Network Data Portal. Available online: https://www.ncdc.noaa.gov/cdo-web/search?datasetid=GHCND (accessed on 1 November 2016).
- Zar, J.H. Biostatistical Analysis, 4th ed.; Prentice Hall: Saddle River, NJ, USA, 1999. [Google Scholar]
- Esterby, S.R. Review of methods for the detection and estimation of trends with emphasis on water quality applications. Hydrol. Process. 1996, 10, 127–149. [Google Scholar] [CrossRef]
- Helsel, D.R.; Hirsch, R.M. Statistical Methods in Water Resources; US Geological Survey: Reston, VA, USA, 2002; Volume 323.
- Mochizuki, T.; Ishii, M.; Kimoto, M.; Chikamoto, Y.; Watanabe, M.; Nozawa, T.; Sakamoto, T.T.; Shiogama, H.; Awaji, T.; Sugiura, N.; et al. Pacific decadal oscillation hindcasts relevant to near-term climate prediction. Proc. Natl. Acad. Sci. USA 2010, 107, 1833–1837. [Google Scholar] [CrossRef] [PubMed]
- Le Houerou, H. An Agro-Bioclimatic Classification of Arid and Semiarid Lands in the Isoclimatic Mediterranean Zones. Arid Land Res. Manag. 2004, 18, 301–346. [Google Scholar] [CrossRef]
- De Figueroa, J.M.T.; López-Rodríguez, M.J.; Fenoglio, S.; Sánchez-Castillo, P.; Fochetti, R. Freshwater biodiversity in the rivers of the Mediterranean Basin. Hydrobiologia 2013, 719, 137–186. [Google Scholar] [CrossRef]
- Fernández, N.; Paruelo, J.M.; Delibes, M. Ecosystem functioning of protected and altered Mediterranean environments: A remote sensing classification in Doñana, Spain. Remote Sens. Environ. 2010, 114, 211–220. [Google Scholar] [CrossRef]
- Cid, N.; Bonada, N.; Carlson, S.M.; Grantham, T.E.; Gasith, A.; Resh, V.H. High Variability Is a Defining Component of Mediterranean-Climate Rivers and Their Biota. Water 2017, 9, 52. [Google Scholar] [CrossRef]
- Underwood, E.C.; Viers, J.H.; Klausmeyer, K.R.; Cox, R.L.; Shaw, M.R. Threats and biodiversity in the mediterranean biome. Divers. Distrib. 2009, 15, 188–197. [Google Scholar] [CrossRef]
- Cox, R.L.; Underwood, E.C. The importance of conserving biodiversity outside of protected areas in Mediterranean ecosystems. PLoS ONE 2011, 6, e14508. [Google Scholar] [CrossRef] [PubMed]
- Kløve, B.; Ala-Aho, P.; Bertrand, G.; Gurdak, J.J.; Kupfersberger, H.; Kværner, J.; Muotka, T.; Mykrä, H.; Preda, E.; Rossi, P.; et al. Climate change impacts on groundwater and dependent ecosystems. J. Hydrol. 2014, 518, 250–266. [Google Scholar] [CrossRef]
- Romero, R.; Sumner, G.; Ramis, C.; Genovés, A. A classification of the atmospheric circulation patterns producing significant daily rainfall in the Spanish Mediterranean area. Int. J. Climatol. 1999, 19, 765–785. [Google Scholar] [CrossRef]
- Piechota, T.C.; Dracup, J.A.; Fovell, R.G. Western US streamflow and atmospheric circulation patterns during El Niño-Southern Oscillation. J. Hydrol. 1997, 201, 249–271. [Google Scholar] [CrossRef]
- Cowling, R.M.; Ojeda, F.; Lamont, B.B.; Rundel, P.W.; Lechmere-Oertel, R. Rainfall reliability, a neglected factor in explaining convergence and divergence of plant traits in fire-prone mediterranean-climate ecosystems. Glob. Ecol. Biogeogr. 2005, 14, 509–519. [Google Scholar] [CrossRef]
- Alpert, P.; Baldi, M.; Ilani, R.; Krichak, S.; Price, C.; Rodo, X.; Saaroni, H.; Ziv, B.; Kishcha, P.; Barkan, J.; et al. Relations between climate variability in the Mediterranean region and the tropics: ENSO, South Asian and African monsoons, hurricanes and Saharan dust. Dev. Earth Environ. Sci. 2006, 4, 149–177. [Google Scholar]
- Padowski, J.C.; Jawitz, J.W. Water availability and vulnerability of 225 large cities in the United States. Water Resour. Res. 2012, 48. [Google Scholar] [CrossRef]
- Ramos, M.C. Rainfall distribution patterns and their change over time in a Mediterranean area. Theor. Appl. Climatol. 2001, 69, 163–170. [Google Scholar] [CrossRef]
- Wilhite, D.A. Preparing for drought: A methodology. In Drought: A Global Assessment; Wilhite, D.A., Ed.; Routledge: London, UK, 2000; Volume II, Chapture 35; pp. 89–104. [Google Scholar]
- Dijk, A.I.; Beck, H.E.; Crosbie, R.S.; Jeu, R.A.; Liu, Y.Y.; Podger, G.M.; Timbal, B.; Viney, N.R. The Millennium Drought in southeast Australia (2001–2009): Natural and human causes and implications for water resources, ecosystems, economy, and society. Water Resour. Res. 2013, 49, 1040–1057. [Google Scholar] [CrossRef]
- Lana, X.; Martínez, M.D.; Serra, C.; Burgueno, A. Spatial and temporal variability of the daily rainfall regime in Catalonia (northeastern Spain), 1950–2000. Int. J. Climatol. 2004, 24, 613–641. [Google Scholar] [CrossRef]
- Henne, P.D.; Elkin, C.; Colombaroli, D.; Samartin, S.; Bugmann, H.; Heiri, O.; Tinner, W. Impacts of changing climate and land use on vegetation dynamics in a Mediterranean ecosystem: Insights from paleoecology and dynamic modeling. Landsc. Ecol. 2013, 28, 819–833. [Google Scholar] [CrossRef]
- Hershkovitz, Y.; Gasith, A. Resistance, resilience, and community dynamics in mediterranean-climate streams. Hydrobiologia 2013, 719, 59–75. [Google Scholar] [CrossRef]
- Chelli, S.; Canullo, R.; Campetella, G.; Schmitt, A.O.; Bartha, S.; Cervellini, M.; Wellstein, C. The response of sub-Mediterranean grasslands to rainfall variation is influenced by early season precipitation. Appl. Veg Sci. 2016, 19, 611–619. [Google Scholar] [CrossRef]
- Zwicke, M.; Picon-Cochard, C.; Morvan-Bertrand, A.; Prud’homme, M.P.; Volaire, F. What functional strategies drive drought survival and recovery of perennial species from upland grassland? Ann. Bot. 2015, 116, 1001–1015. [Google Scholar] [CrossRef] [PubMed]
- Deitch, M.J.; Kondolf, G.M.; Merenlender, A.M. Hydrologic impacts of small-scale instream diversions for frost and heat protection in the California wine country. River Res. Appl. 2009, 25, 118–134. [Google Scholar] [CrossRef]
- Hwan, J.L.; Carlson, S.M. Fragmentation of an Intermittent Stream during Seasonal Drought: Intra-annual and Interannual Patterns and Biological Consequences. River Res. Appl. 2015, 32, 856–870. [Google Scholar] [CrossRef]
Figure 1.
Areas with a dry-summer climate characterized as either dry, moderate, or wet with respect to mean annual precipitation and either weakly, moderately, or strongly seasonal in terms of percentage of summer precipitation; along with the Mediterranean biome and Koppen–Geiger (KG) dry-summer climate type Cs. (Areas without color receive less than 300 mm annually.)

Figure 2.
Annual precipitation Coefficient of Variation (CV) based on site-specific data in regions with a moderate dry-summer climate (where climate records met the standards described in Section 2.2, above).
Figure 2.
Annual precipitation Coefficient of Variation (CV) based on site-specific data in regions with a moderate dry-summer climate (where climate records met the standards described in Section 2.2, above).

Figure 3.
Magnitude of annual precipitation Coefficient of Variation among sites sorted by climate category (dry, moderate, or wet with respect to annual precipitation; strongly, moderately, or weakly seasonal with respect to percentage of summer rainfall) and region.
Figure 3.
Magnitude of annual precipitation Coefficient of Variation among sites sorted by climate category (dry, moderate, or wet with respect to annual precipitation; strongly, moderately, or weakly seasonal with respect to percentage of summer rainfall) and region.

Figure 4.
Percentage of annual precipitation during summer Coefficient of Variation (CV) based on site-specific data in regions with a moderate dry-summer climate (where climate records met the standards described in Section 2.2, above).
Figure 4.
Percentage of annual precipitation during summer Coefficient of Variation (CV) based on site-specific data in regions with a moderate dry-summer climate (where climate records met the standards described in Section 2.2, above).
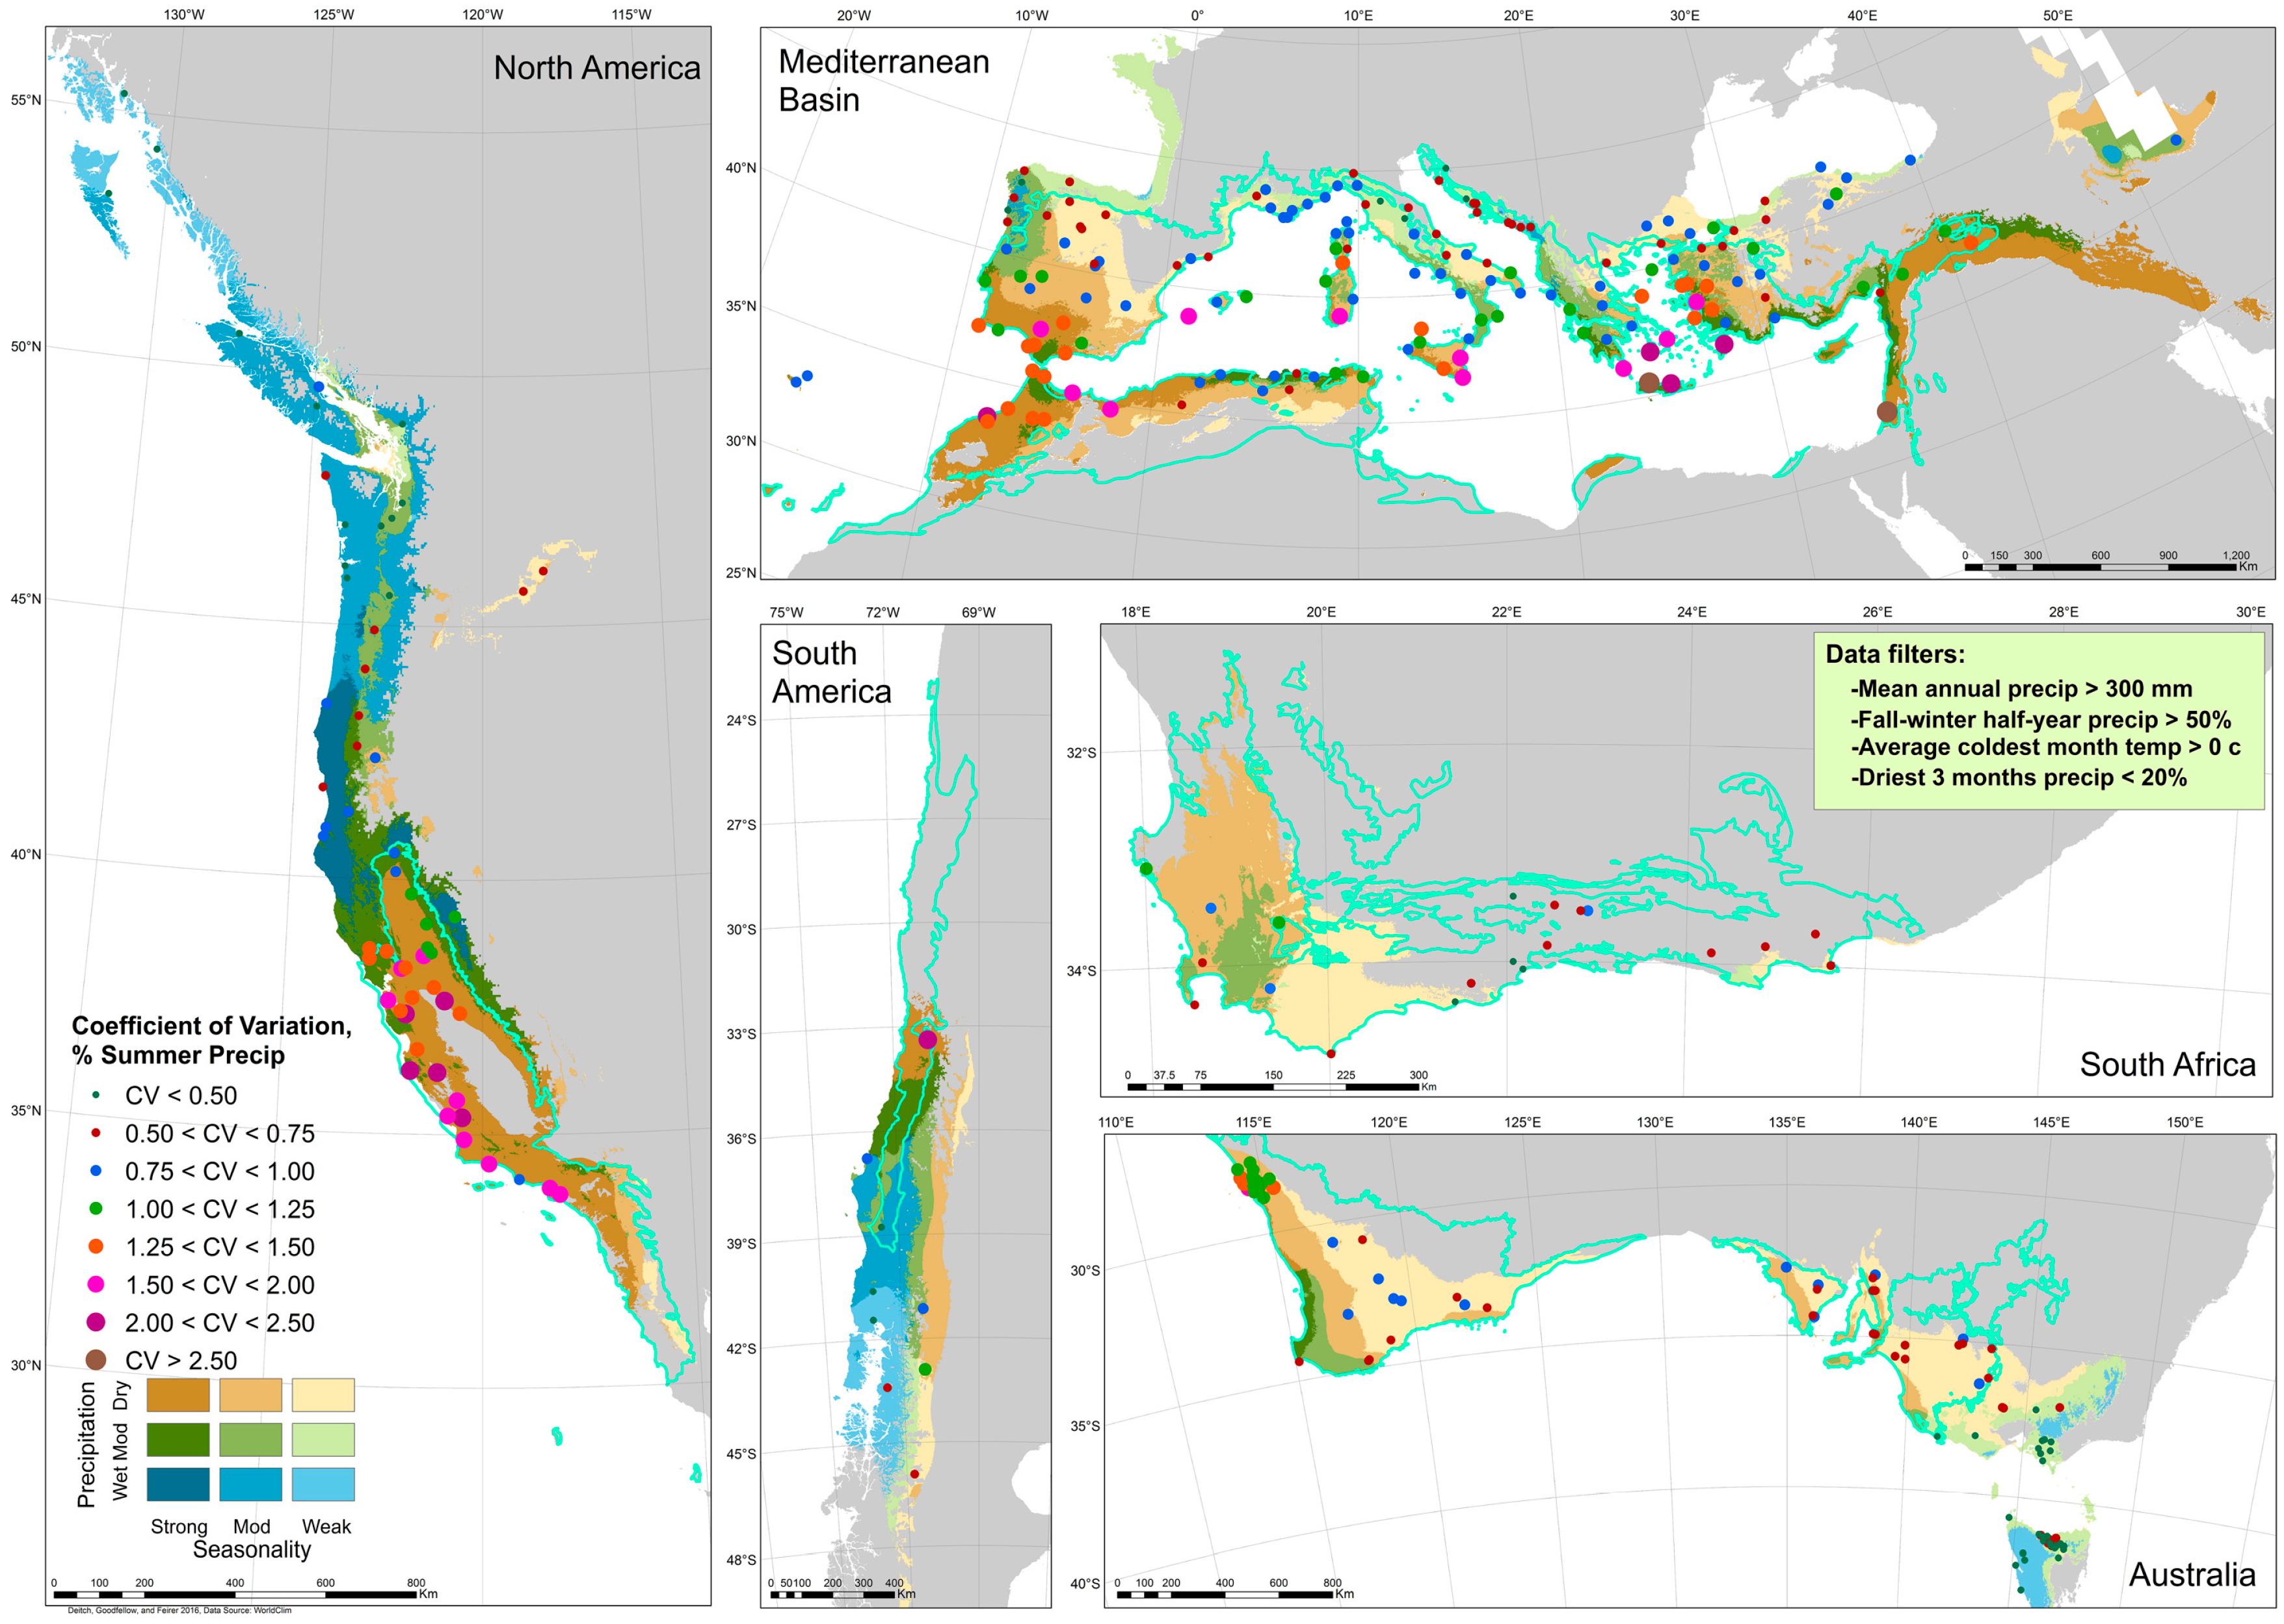
Figure 5.
Magnitude of summer precipitation percentage Coefficient of Variation among sites sorted by climate category (dry, moderate, or wet with respect to annual precipitation; strongly, moderately, or weakly seasonal with respect to percentage of summer rainfall) and region.
Figure 5.
Magnitude of summer precipitation percentage Coefficient of Variation among sites sorted by climate category (dry, moderate, or wet with respect to annual precipitation; strongly, moderately, or weakly seasonal with respect to percentage of summer rainfall) and region.
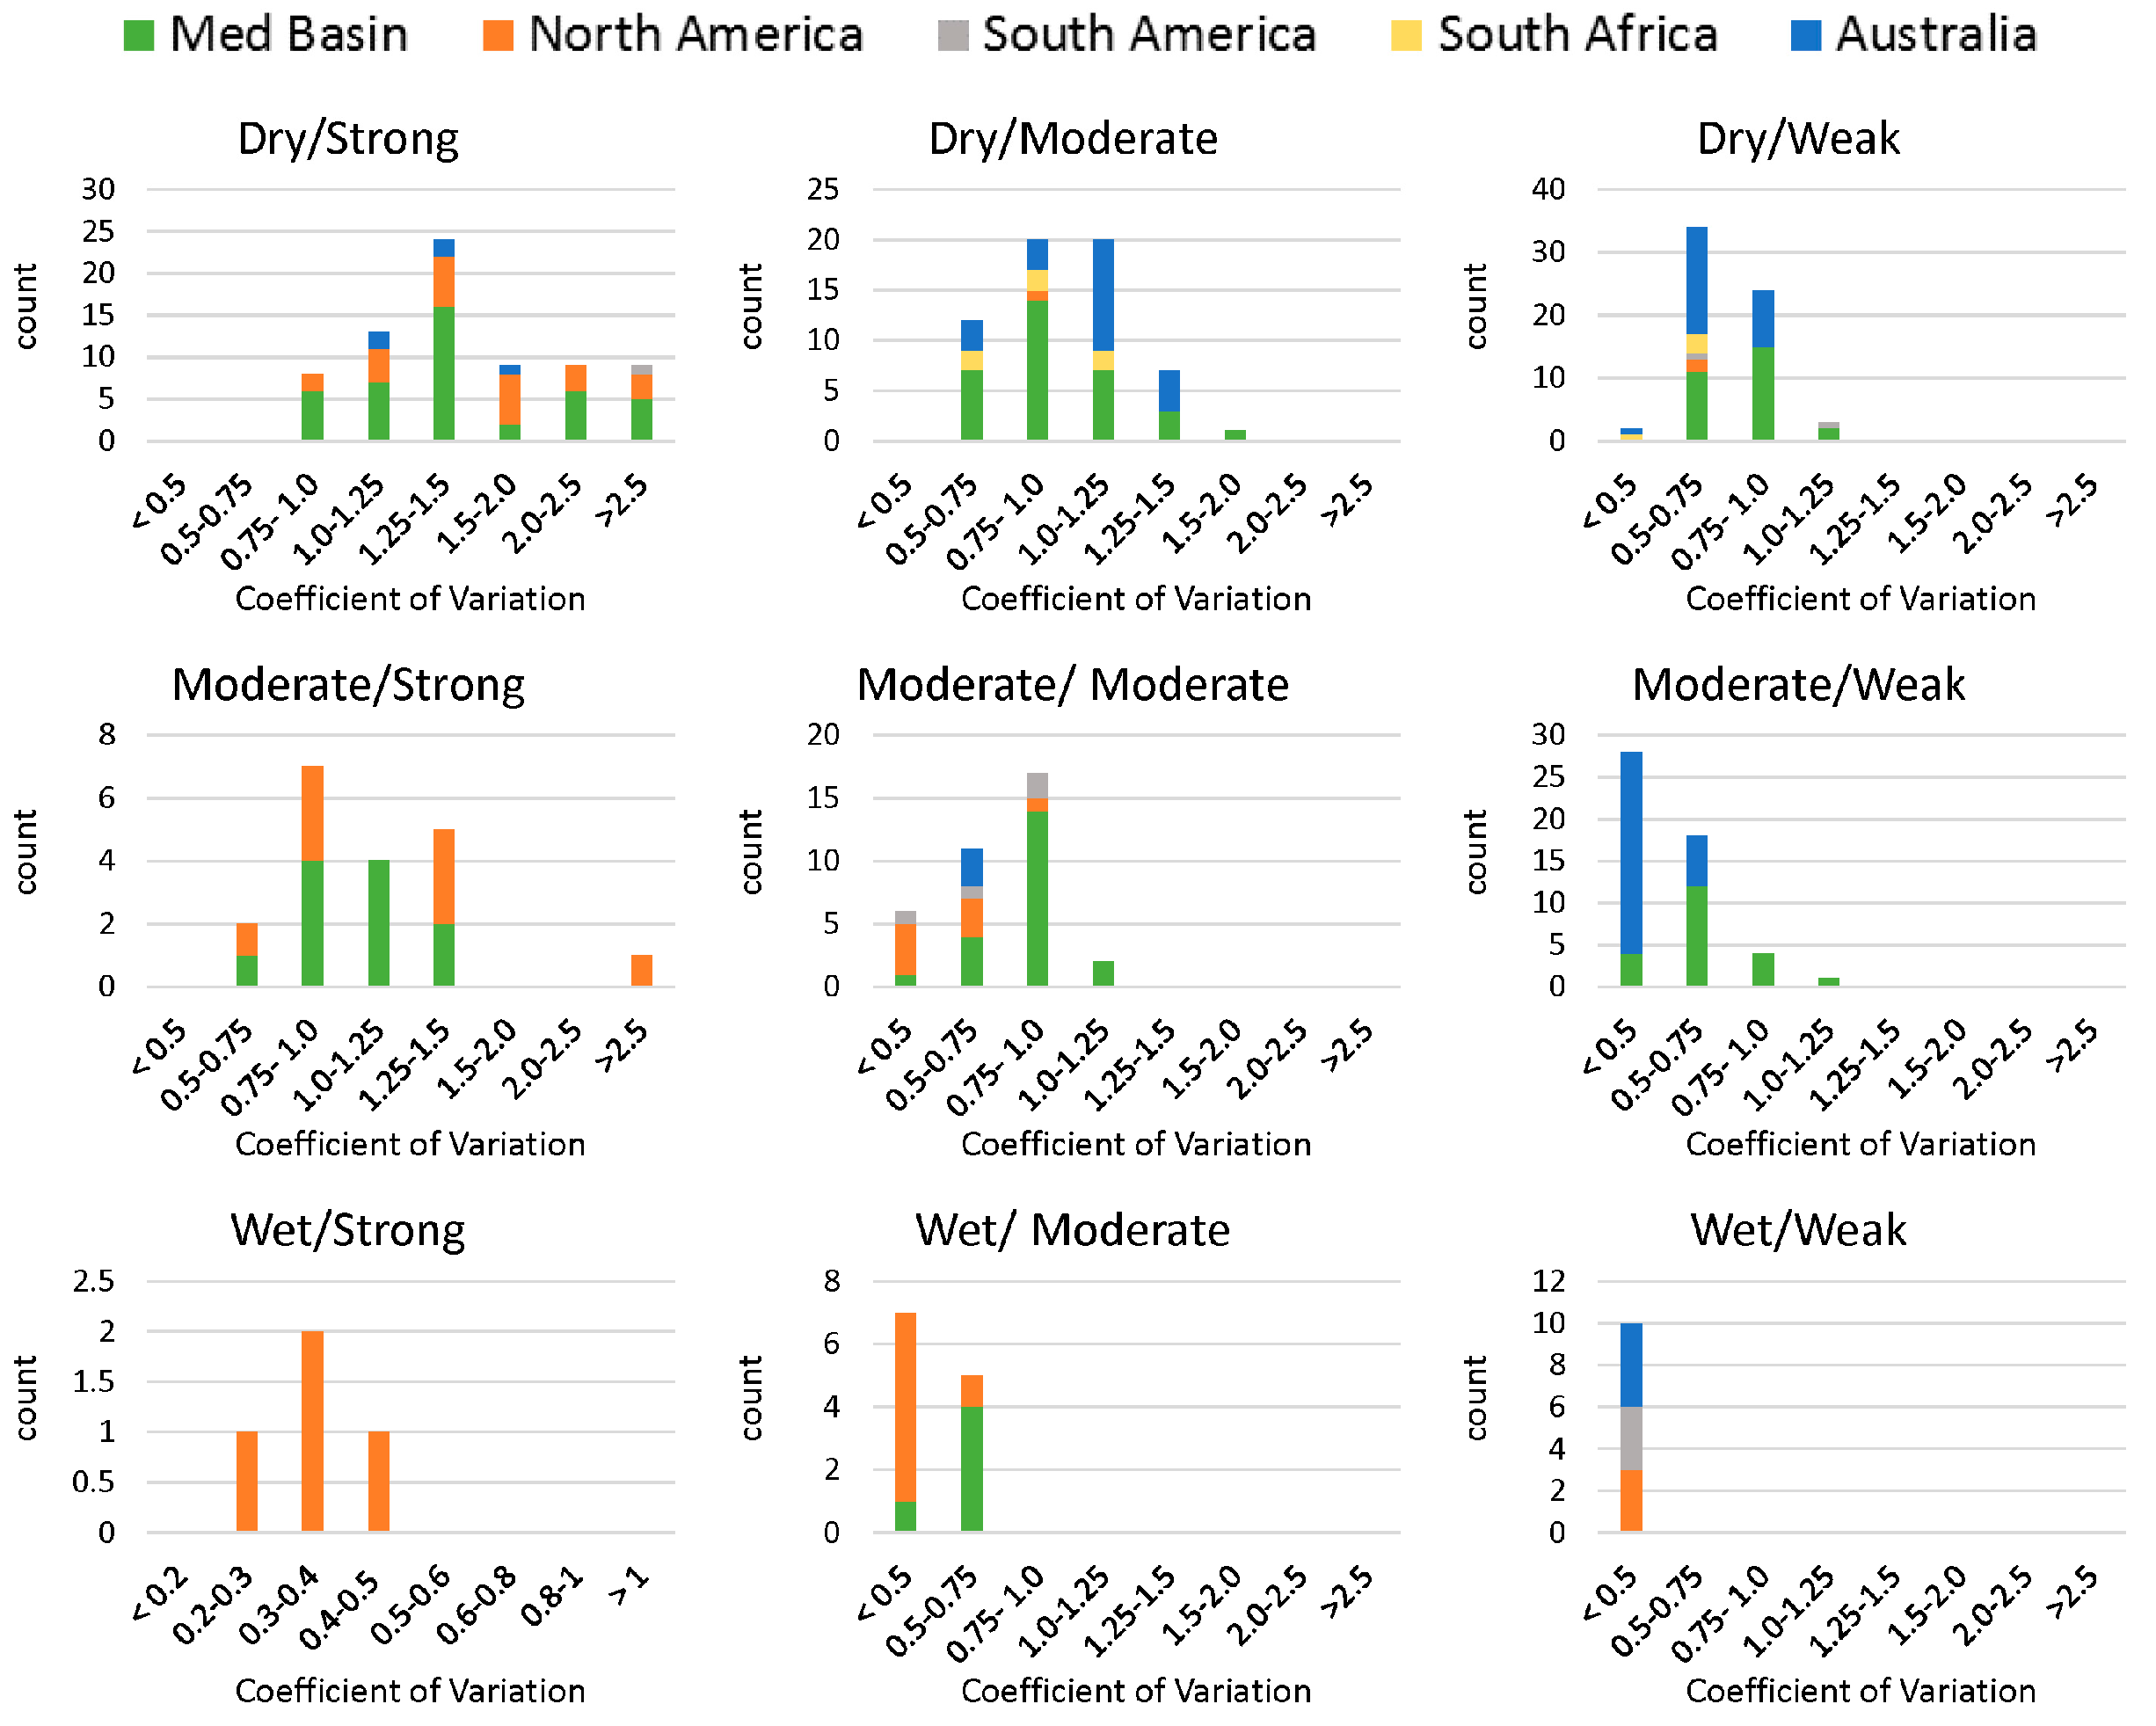
Figure 6.
Annual precipitation trends, 1975–2015 (sites distinguished between those with 20–30 and 30–40 years of record), in areas with a dry summer climate; significance at α 0.05 and 0.1.
Figure 6.
Annual precipitation trends, 1975–2015 (sites distinguished between those with 20–30 and 30–40 years of record), in areas with a dry summer climate; significance at α 0.05 and 0.1.
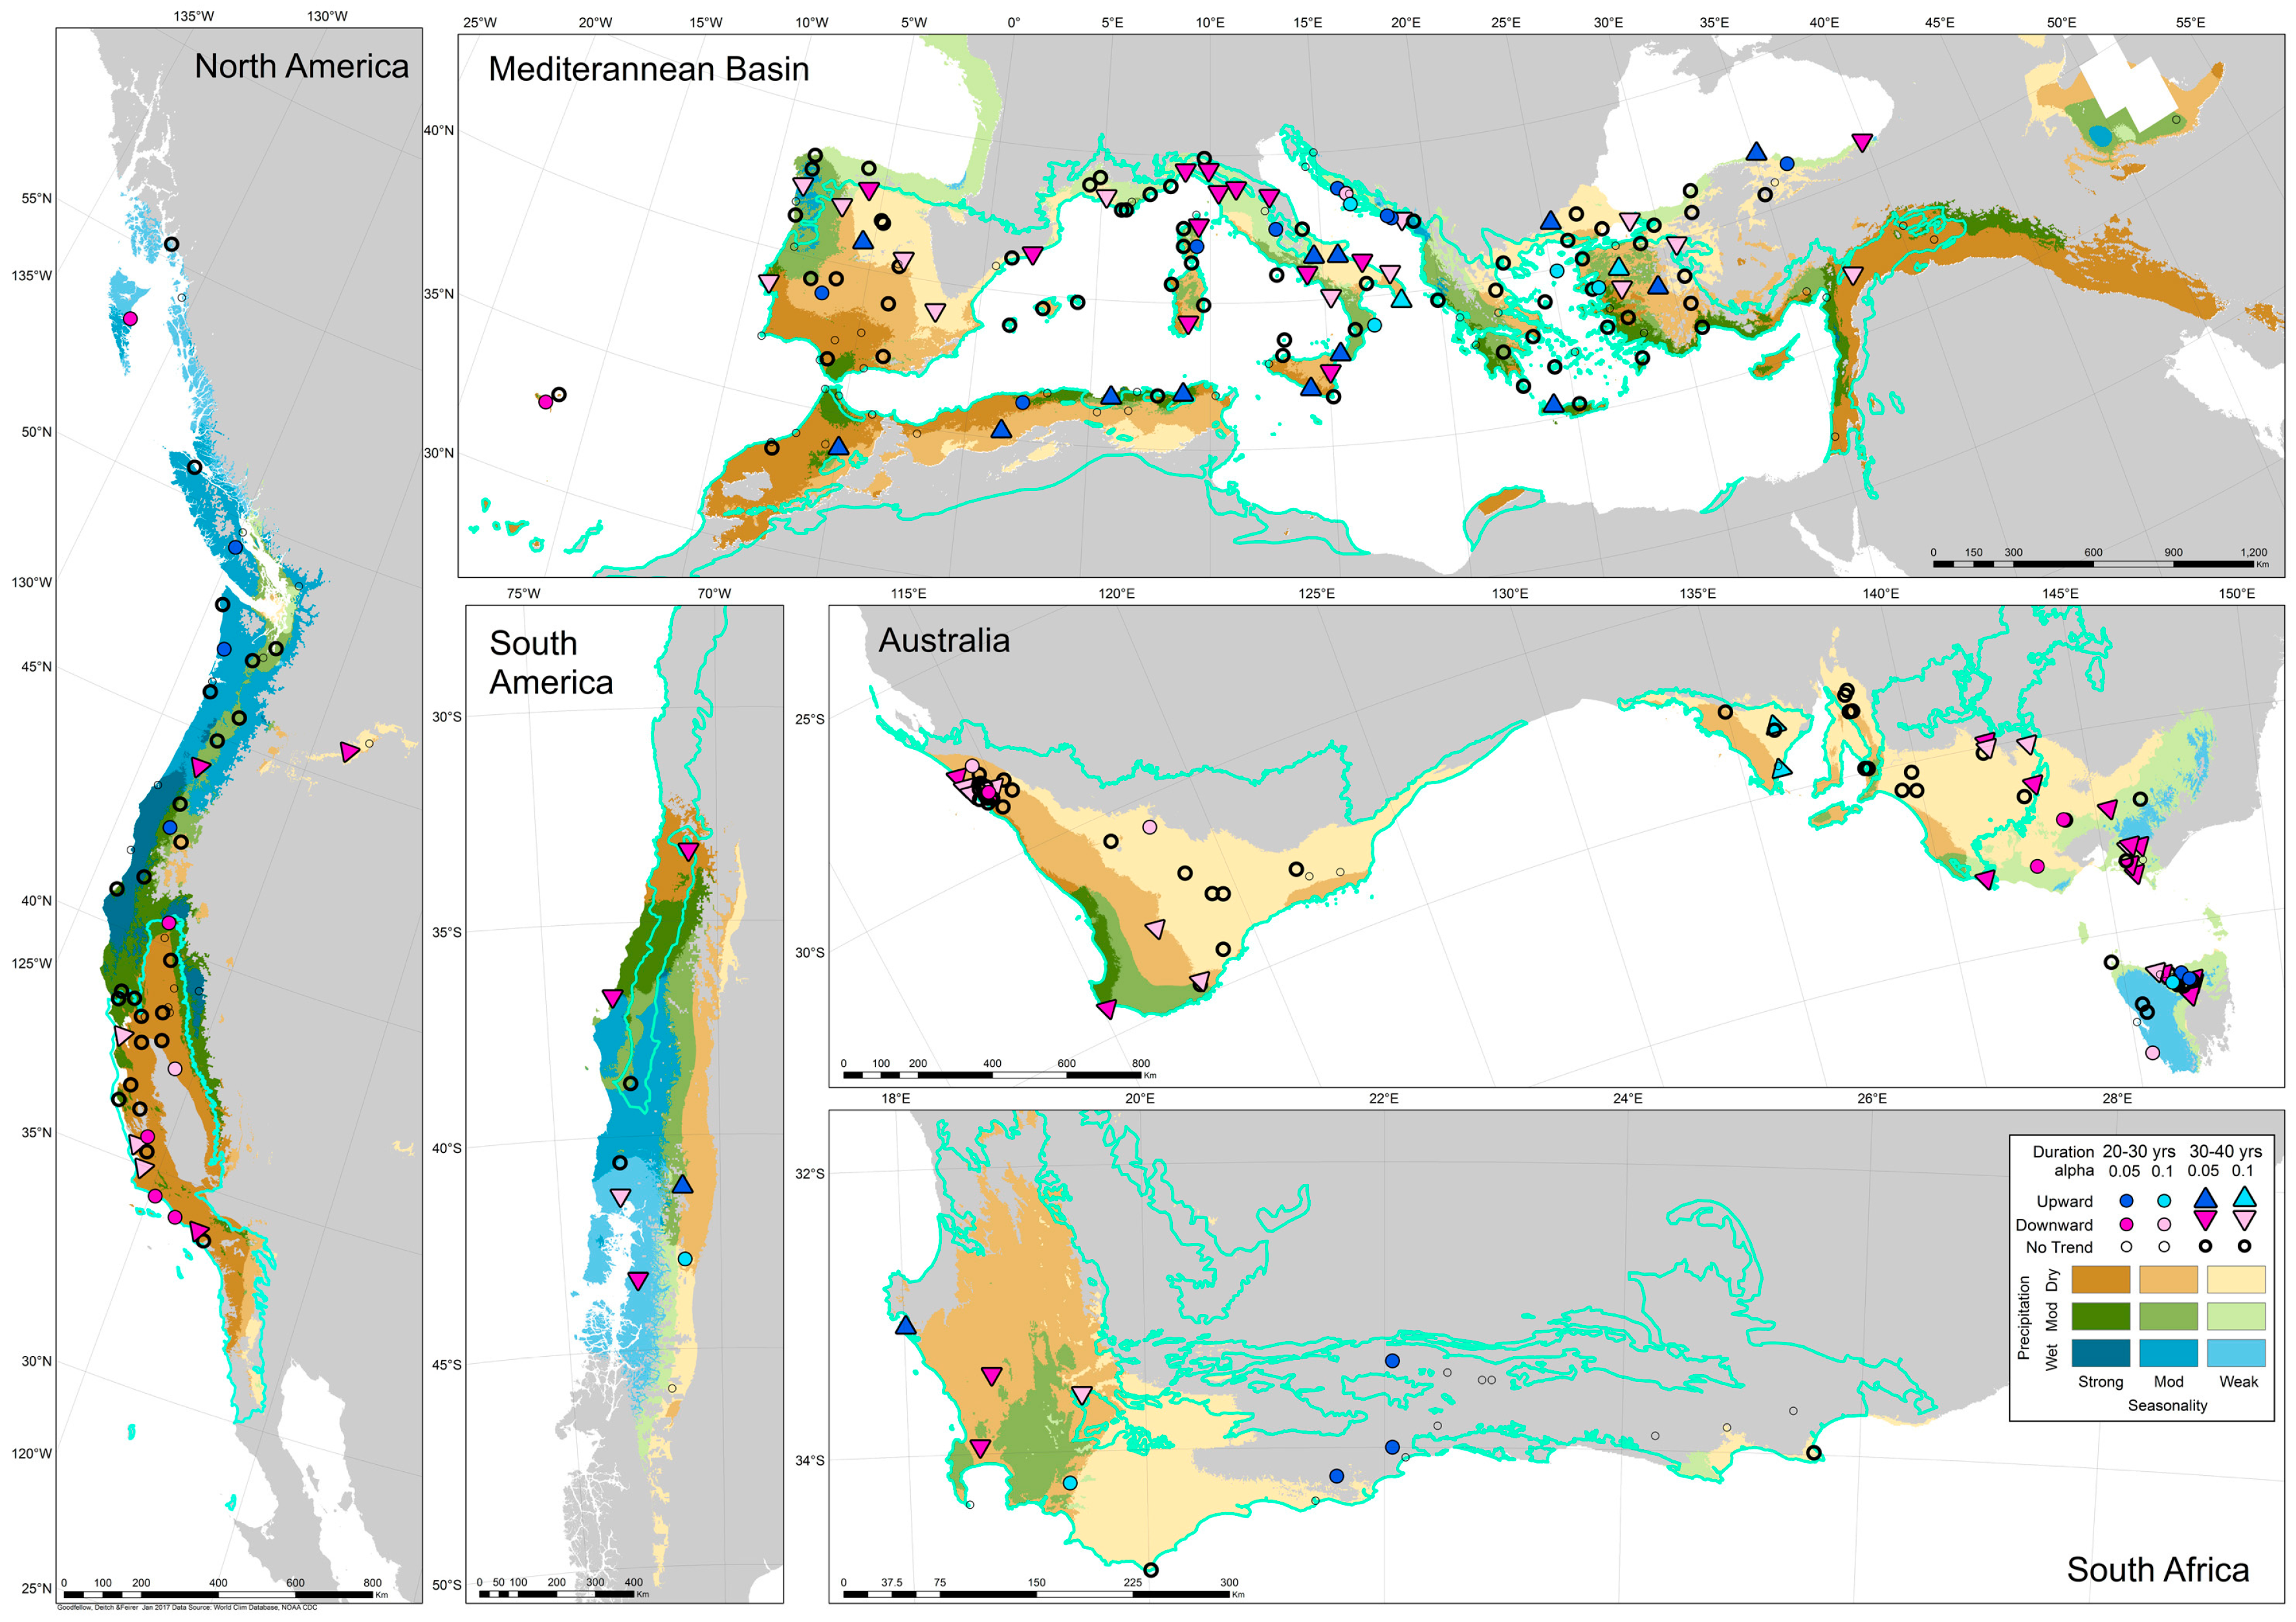
Figure 7.
Annual variability trends, 1975–2015 (sites distinguished between those with 20–30 and 30–40 years of record), in areas with a dry summer climate; significance at α 0.05 and 0.1.
Figure 7.
Annual variability trends, 1975–2015 (sites distinguished between those with 20–30 and 30–40 years of record), in areas with a dry summer climate; significance at α 0.05 and 0.1.

Figure 8.
FWS precipitation trends, 1975–2015 (sites distinguished between those with 20–30 and 30–40 years of record), in areas with a dry summer climate; significance at α 0.05 and 0.1.
Figure 8.
FWS precipitation trends, 1975–2015 (sites distinguished between those with 20–30 and 30–40 years of record), in areas with a dry summer climate; significance at α 0.05 and 0.1.
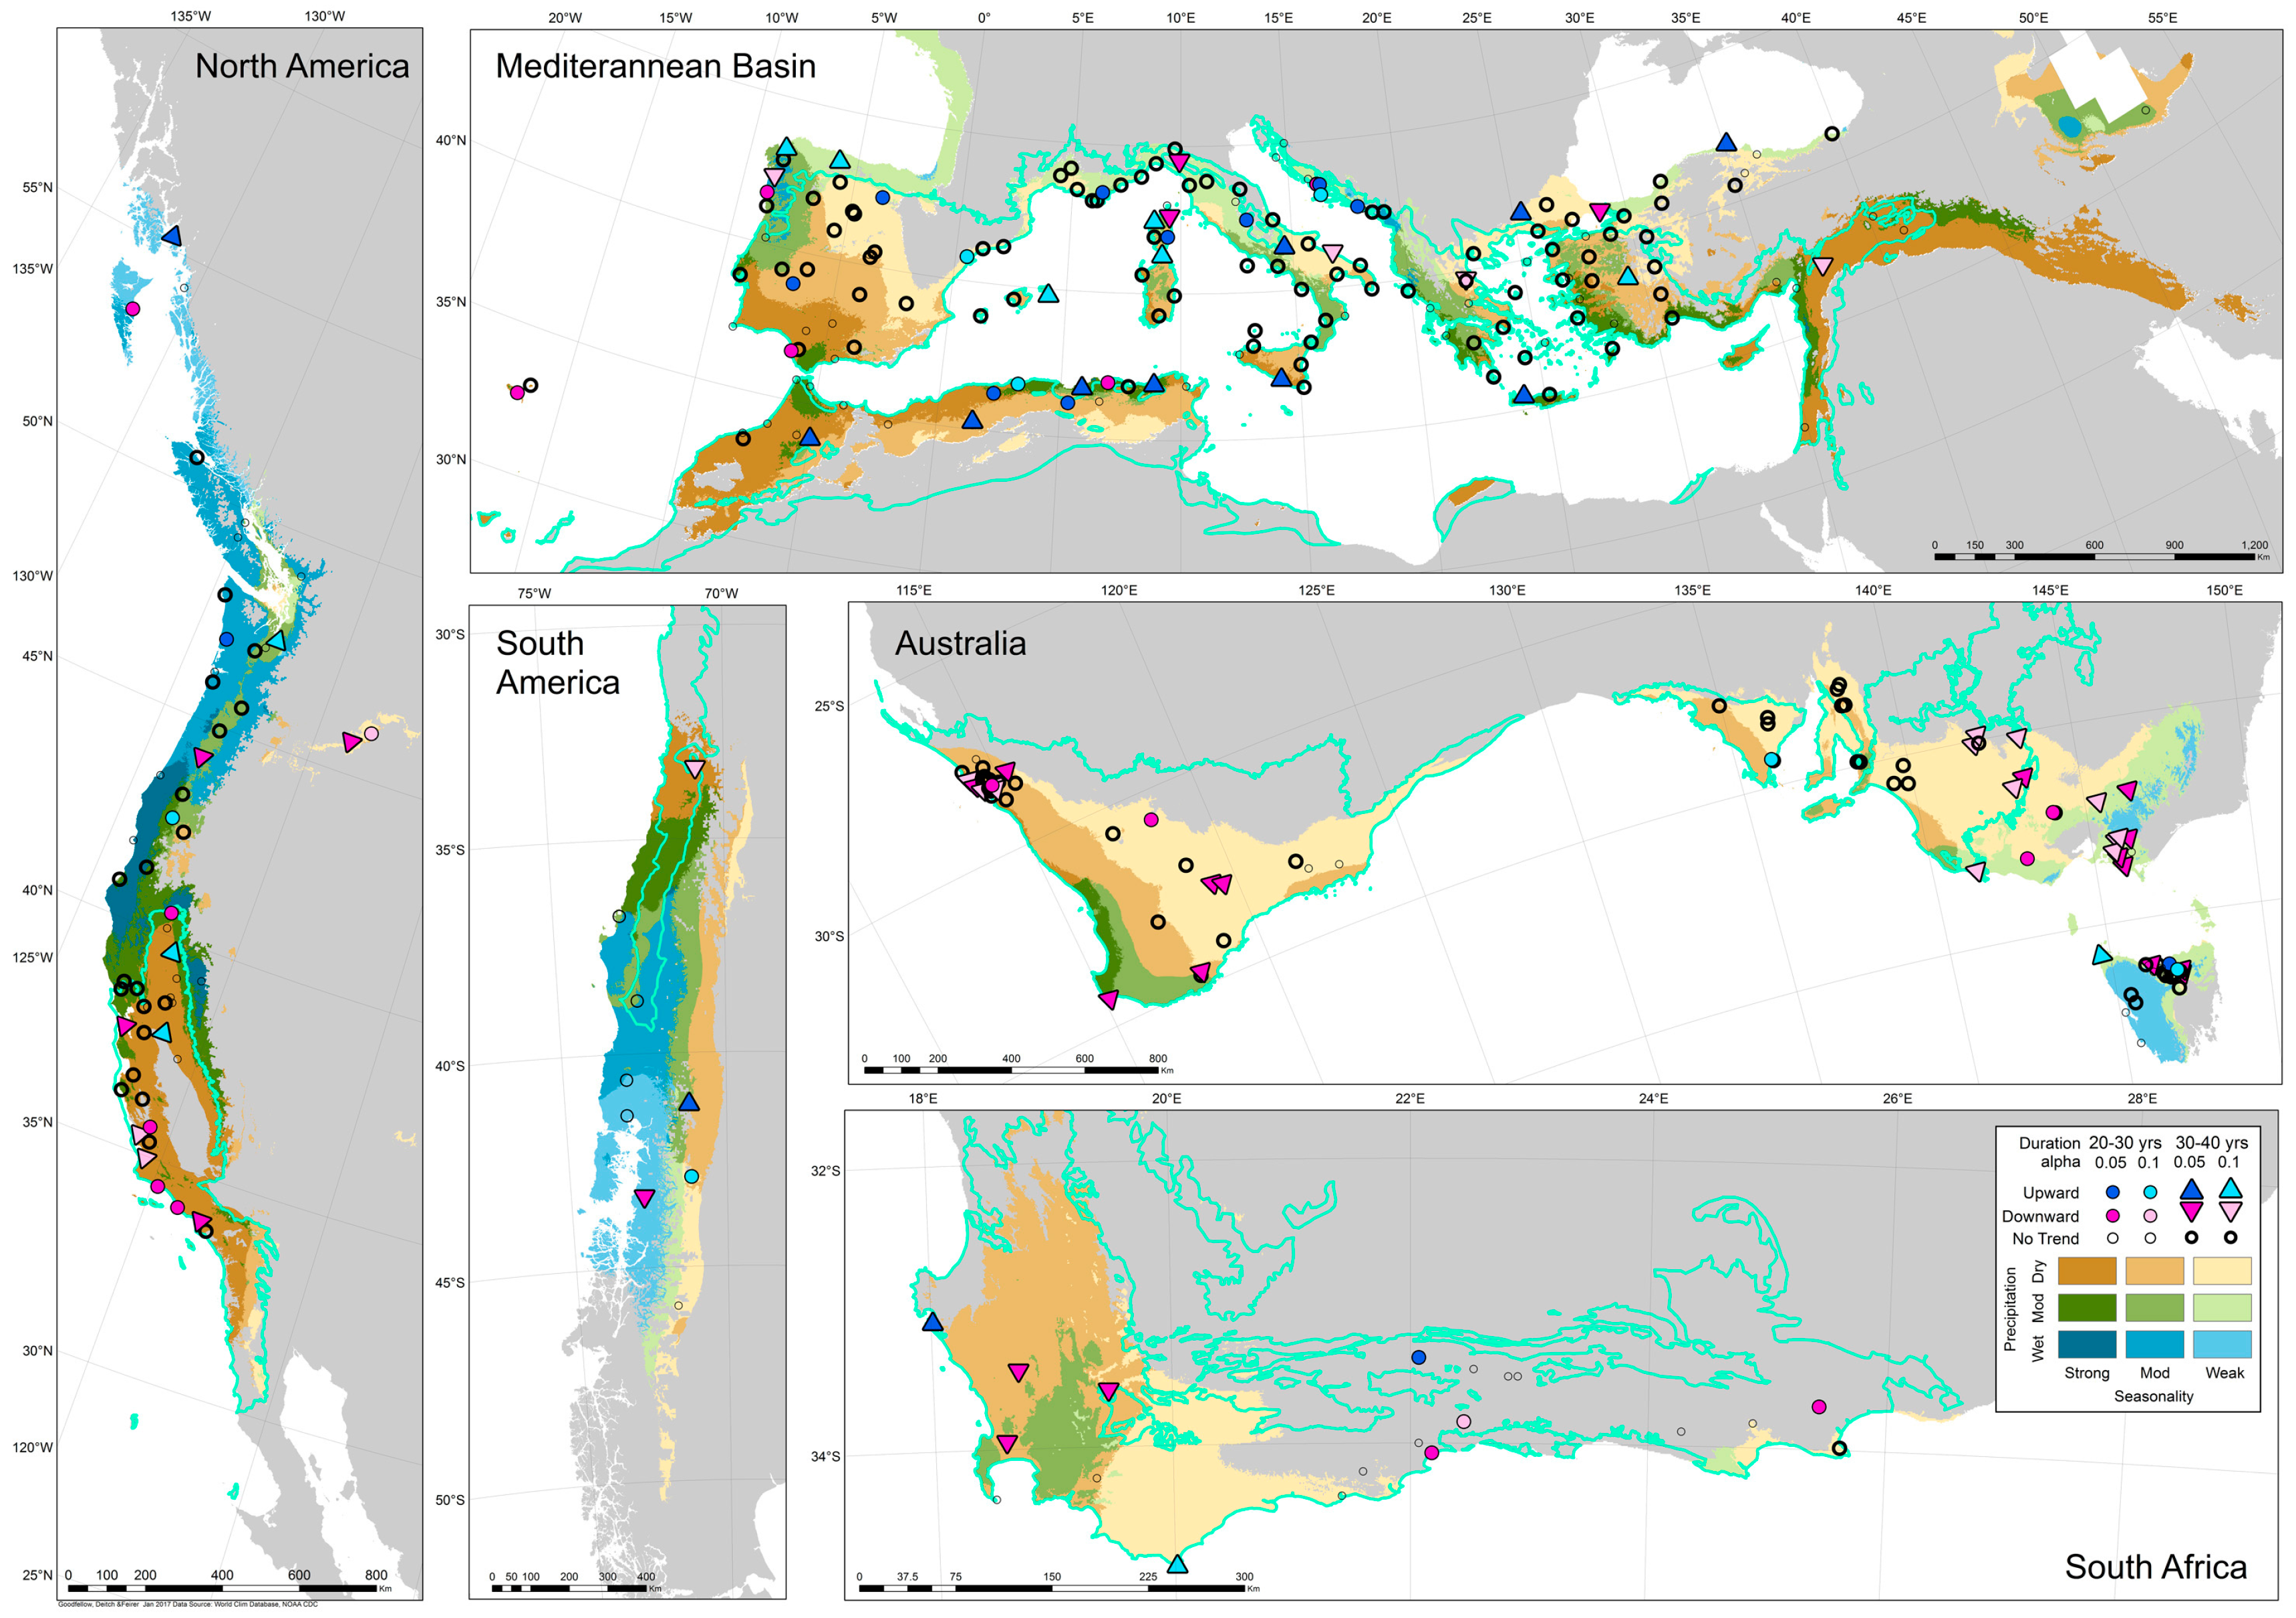
Figure 9.
FWS variability trends, 1975–2015 (sites distinguished between those with 20–30 and 30–40 years of record), in areas with a dry summer climate; significance at α 0.05 and 0.1.
Figure 9.
FWS variability trends, 1975–2015 (sites distinguished between those with 20–30 and 30–40 years of record), in areas with a dry summer climate; significance at α 0.05 and 0.1.

Figure 10.
Summer precipitation trends, 1975–2015 (sites distinguished between those with 20–30 and 30–40 years of record), in areas with a dry summer climate; significance at α 0.05 and 0.1.
Figure 10.
Summer precipitation trends, 1975–2015 (sites distinguished between those with 20–30 and 30–40 years of record), in areas with a dry summer climate; significance at α 0.05 and 0.1.
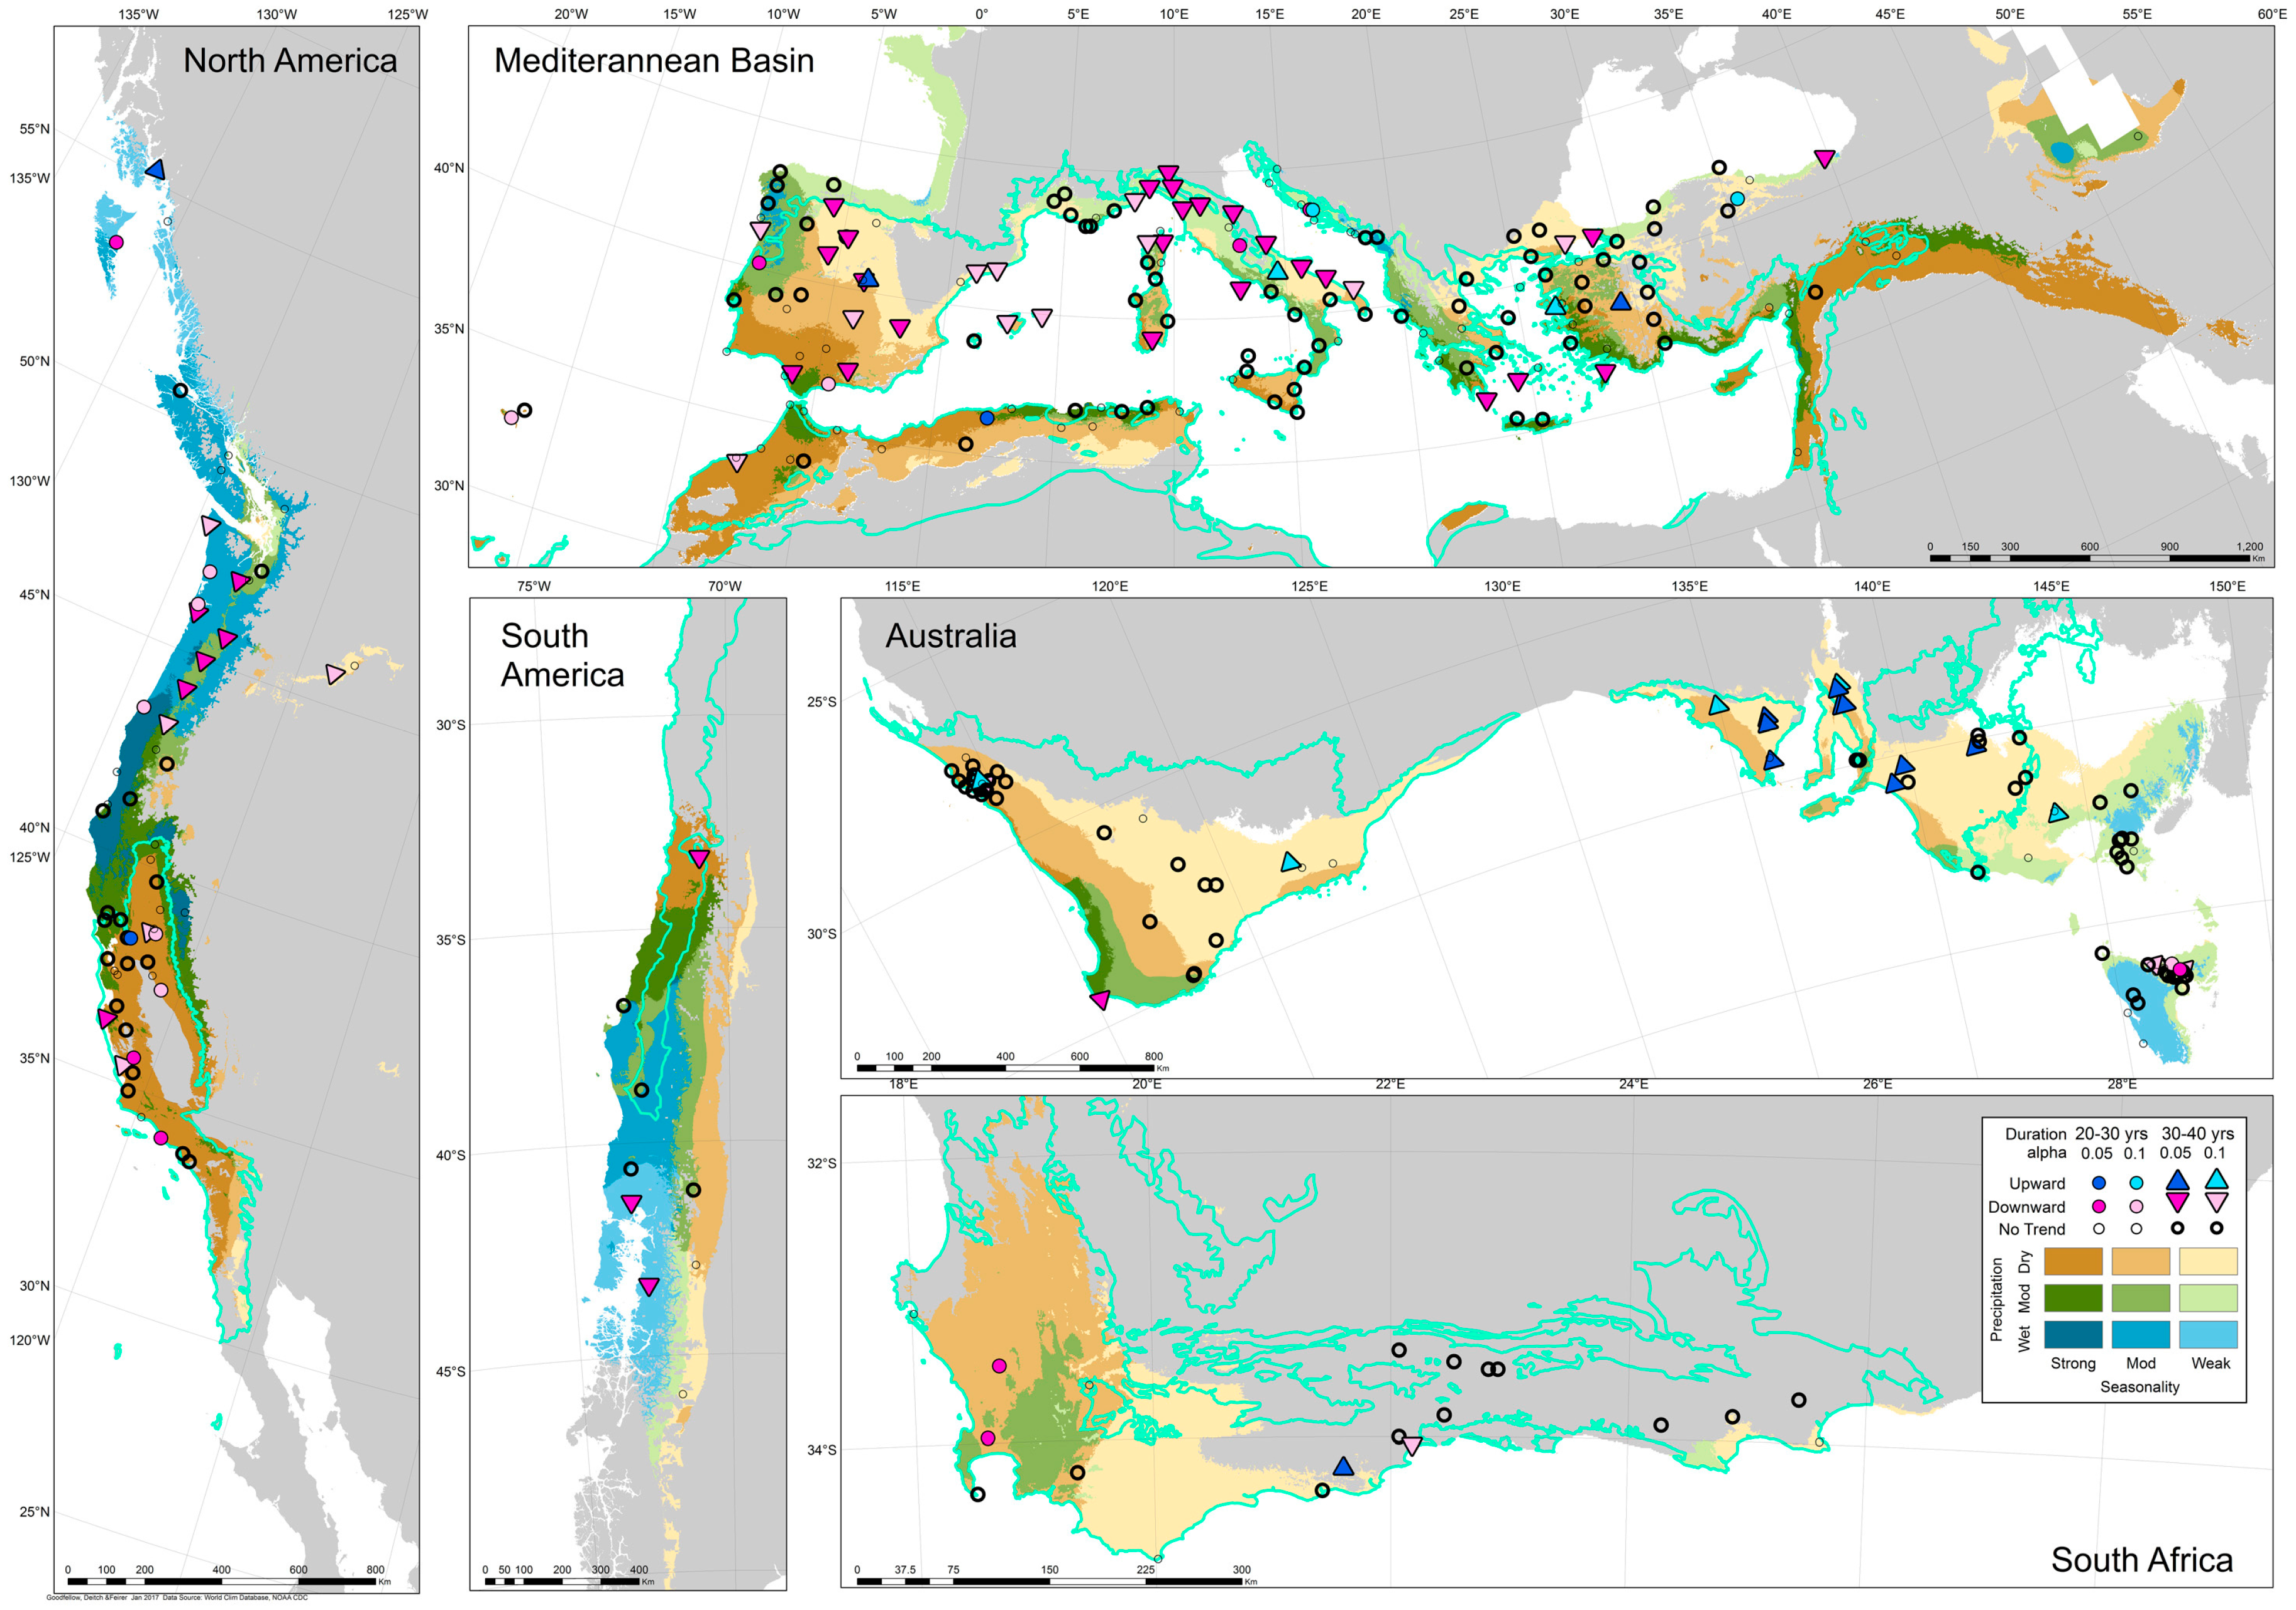
Figure 11.
Summer variability trends, 1975–2015 (sites distinguished between those with 20–30 and 30–40 years of record), in areas with a dry summer climate; significance at α 0.05 and 0.1.
Figure 11.
Summer variability trends, 1975–2015 (sites distinguished between those with 20–30 and 30–40 years of record), in areas with a dry summer climate; significance at α 0.05 and 0.1.

Table 1.
Division of average annual precipitation and percentage of annual precipitation in summer (seasonality) into three groups, giving nine categories of precipitation and seasonality. (Color codes in Table 1 correspond to combination of annual precipitation and summer seasonality in Figures 1,2,4,6–11.)
| Precipitation: | Seasonality: Percentage of Precipitation in Summer | ||
|---|---|---|---|
| Mean Annual Rainfall | Strong: <5% | Moderate: 5%–12% | Weak: 12%–20% |
| Dry climate: <700 mm | Dry climate/Strong seasonality | Dry climate/Moderate seasonality | Dry climate/Weak seasonality |
| Moderate climate: 700–1300 mm | Moderate climate/Strong seasonality | Moderate climate/moderate seasonality | Moderate climate/weak seasonality |
| Wet climate: >1300 mm | Wet climate/Strong seasonality | Wet climate/Moderate seasonality | Wet climate/Weak seasonality |
Table 2.
Percentage of biome in each region categorized as dry, moderate, or wet with respect to average annual precipitation; and weakly, moderately, or strongly seasonal with respect to percentage of annual precipitation in summer; along with percentage that is very dry (less than 300 mm annually) and percentage that is not seasonal (more than 20% or annual precipitation during summer).
| Climate Category (Precip, Seasonality) | Australia | Med Region | North America | South America | South Africa |
|---|---|---|---|---|---|
| Biome area, km2 | 779.600 | 2,051,900 | 192,800 | 148,000 | 96,600 |
| Dry, weak, % | 38.6% | 11.1% | 2.4% | none | 14.9% |
| Dry, moderate, % | 17.4% | 20.3% | 4.4% | 0.2% | 19.4% |
| Dry, strong, % | 0.8% | 19.4% | 52.4% | 13.2% | 0.0% |
| Moderate, weak, % | 0.5% | 2.3% | 0.1% | none | 0.7% |
| Moderate, moderate, % | 4.3% | 8.2% | 0.2% | 5.3% | 5.6% |
| Moderate, strong, % | 1.7% | 6.1% | 10.5% | 10.9% | 0.0% |
| Wet, weak, % | None | 0.1% | None | None | None |
| Wet, moderate, % | None | 0.3% | None | 7.9% | None |
| Wet, strong, % | None | 0.05% | None | None | None |
| Very dry (<300 mm), % | 29% | 19% | 26% | 63% | 21% |
| Not seasonal, % | 8% | 13% | 4% | 0% | 38% |
© 2017 by the authors. Licensee MDPI, Basel, Switzerland. This article is an open access article distributed under the terms and conditions of the Creative Commons Attribution (CC BY) license (http://creativecommons.org/licenses/by/4.0/).
Share and Cite
MDPI and ACS Style
Deitch, M.J.; Sapundjieff, M.J.; Feirer, S.T. Characterizing Precipitation Variability and Trends in the World’s Mediterranean-Climate Areas. Water 2017, 9, 259. https://doi.org/10.3390/w9040259
AMA Style
Deitch MJ, Sapundjieff MJ, Feirer ST. Characterizing Precipitation Variability and Trends in the World’s Mediterranean-Climate Areas. Water. 2017; 9(4):259. https://doi.org/10.3390/w9040259
Chicago/Turabian StyleDeitch, Matthew J., Michele J. Sapundjieff, and Shane T. Feirer. 2017. "Characterizing Precipitation Variability and Trends in the World’s Mediterranean-Climate Areas" Water 9, no. 4: 259. https://doi.org/10.3390/w9040259
Note that from the first issue of 2016, this journal uses article numbers instead of page numbers. See further details here.