Article

Characterization of Dissolved Organic Matter in Deep Geothermal Water from Different Burial Depths Based on Three-Dimensional Fluorescence Spectra

1
Institute of Resources& Environment, Henan Polytechnic University, Jiaozuo 454000, China
2
School of Surveying and Land Information Engineering, Henan Polytechnic University, Jiaozuo 454000, China
3
China PingmeiShenma Group, Institute of Energy and Chemical Industry, Pingdingshan 467000, China
4
Collaborative Innovation Center of Coalbed Methane and Shale Gas for Central Plains Economic Region, Jiaozuo 454000, China
5
Xi’an Research Institute of coal science and Industry Group, Xi’an 710054, China
6
Office of Water Conservation in Kaifeng, Kaifeng 475002, China
*
Author to whom correspondence should be addressed.
Water 2017, 9(4), 266; https://doi.org/10.3390/w9040266
Submission received: 30 December 2016 / Revised: 21 March 2017 / Accepted: 31 March 2017 / Published: 17 April 2017

Abstract

:
Dissolved organic matter (DOM) plays an important role in the chemical evolution of groundwater. Thus, in order to understand the composition and characteristics of DOM in groundwater, analyzed 31geothermal water samples from five aquifers (i.e., between 600 m and 1600 m) in the city of Kaifeng were analyzed and the results were compared in order to clarify their spatial distribution, characteristics, sources, and environmental influences. Results show that as the depth of a thermal reservoir increases, the ultraviolet absorption (UV254) of geothermal water does not change significantly, the concentration of dissolved organic carbon (DOC) gradually increases with depth, and the fluorescence intensity of DOM remains weak. Some differences are also evident with regard to the location and intensity of geothermal water sample DOM fluorescence peaks depending on thermal reservoir. The results of this study show that the main source of DOM in geothermal water is endogenous, derived from high stability organic matter derived from sedimentary processes and associated microbial activity. Within the three geothermal reservoir depth ranges, 600 m to 800 m, 800 m to 1000 m, and 1000 m to 1200 m, DOM components were mainly protein-like as well as soluble microbial metabolites. However, at deeper depths, within the 1200 m to 1400 m and 1400 m to 1600 m thermal reservoirs, the proportion of protein-like components in DOM decreased, while the ratio fulvic-like and humic-like components increased, leading to changes in the positions of fluorescence peaks. Finally, our results demonstrate a close relationship between the intensity of fluorescence peaks, suggesting that a number of fluorescent components may share a common source.

1. Introduction

Dissolved organic matter (DOM) plays an important role in aquatic ecosystems and is widely distributed in various aqueous environments [1,2,3]. Understanding the distribution and composition of DOM across a range of environments is a key theme in environmental science research [4,5,6]. DOM is generally defined as soluble organic matter through filtration. The size limit, which is used to differentiate DOM from particulate organic matter is somewhat arbitrary, is between 0.2 μm and 0.7 μm [7], but there is an almost universal consensus that it is around 0.45 μm. DOM is comprised of a complex mixture of humic and fulvic acids, as well as a variety of hydrophilic organic acids, amino acids, and other components [8]. DOM is very important to the chemical evolution of groundwater [9], and is a sensitive indicator of burial conditions, movement, chemical characteristics, and the geochemical environment of groundwater [10,11,12].
Dissolved organic carbon (DOC) is an important constituent of groundwater DOM [13,14]. As an important electron donor in biological metabolism, DOC plays a very important role in biogeochemical groundwater reactions and its concentration is commonly used to quantitatively characterize DOM [15,16]. However, because DOM is more complex than DOC in terms of chemical composition and structure [17], it has proved very difficult to completely separate and quantify all of its components using traditional methods of analysis. One commonly used technique, three-dimensional (3D) fluorescence spectroscopy, can provide qualitative information, and has the advantages that it is both highly sensitive and simple to operate [18,19,20]. Thus, this method has been widely applied to characterize both the chemical composition and sources of aqueous DOM, including in oceans [21], rivers [22,23,24], and lakes [25,26]. To achieve this, a fluorescence intensity spectrum is projected onto plane such that excitation and emission wavelengths are converted to vertical and horizontal coordinates in the form of contour lines. Thus, via analysis of fluorescence spectra, the distribution, composition, and origin of DOM can be determined based on peak positions, number, and fluorescence intensity [27,28,29,30]. However, to our knowledge, just a handful of reports [31,32] have applied this approach to the study of DOM in groundwater, and most of the groundwater samples come from shallow groundwater, almost no deep groundwater, and especially no deep geothermal water.
The deep geothermal water found within the city of Kaifeng, Henan province, China, contains a variety of microelements that are beneficial to human health, and is thus an ideal natural mineral water for drinking, bathing, and medical care [33,34]. In recent years, however, due to the excessive exploitation of these deep geothermal water resources in central urban areas, there has been a reduction in both water quality and production volume [35,36]. Thus, it is important to understand the composition of DOM in geothermal water at different depths, not just because this will allow us to characterize different geothermal environments on the basis of the chemical characteristics of different reservoirs, but also to inform the future rational development and utilization of this resource. The aim of this study was therefore to determine distributional characteristics of DOM in the vertical gradient, as well as the factors that influence the accumulation and concentrations of DOC using 3D fluorescence spectra.

2. Materials and Methods
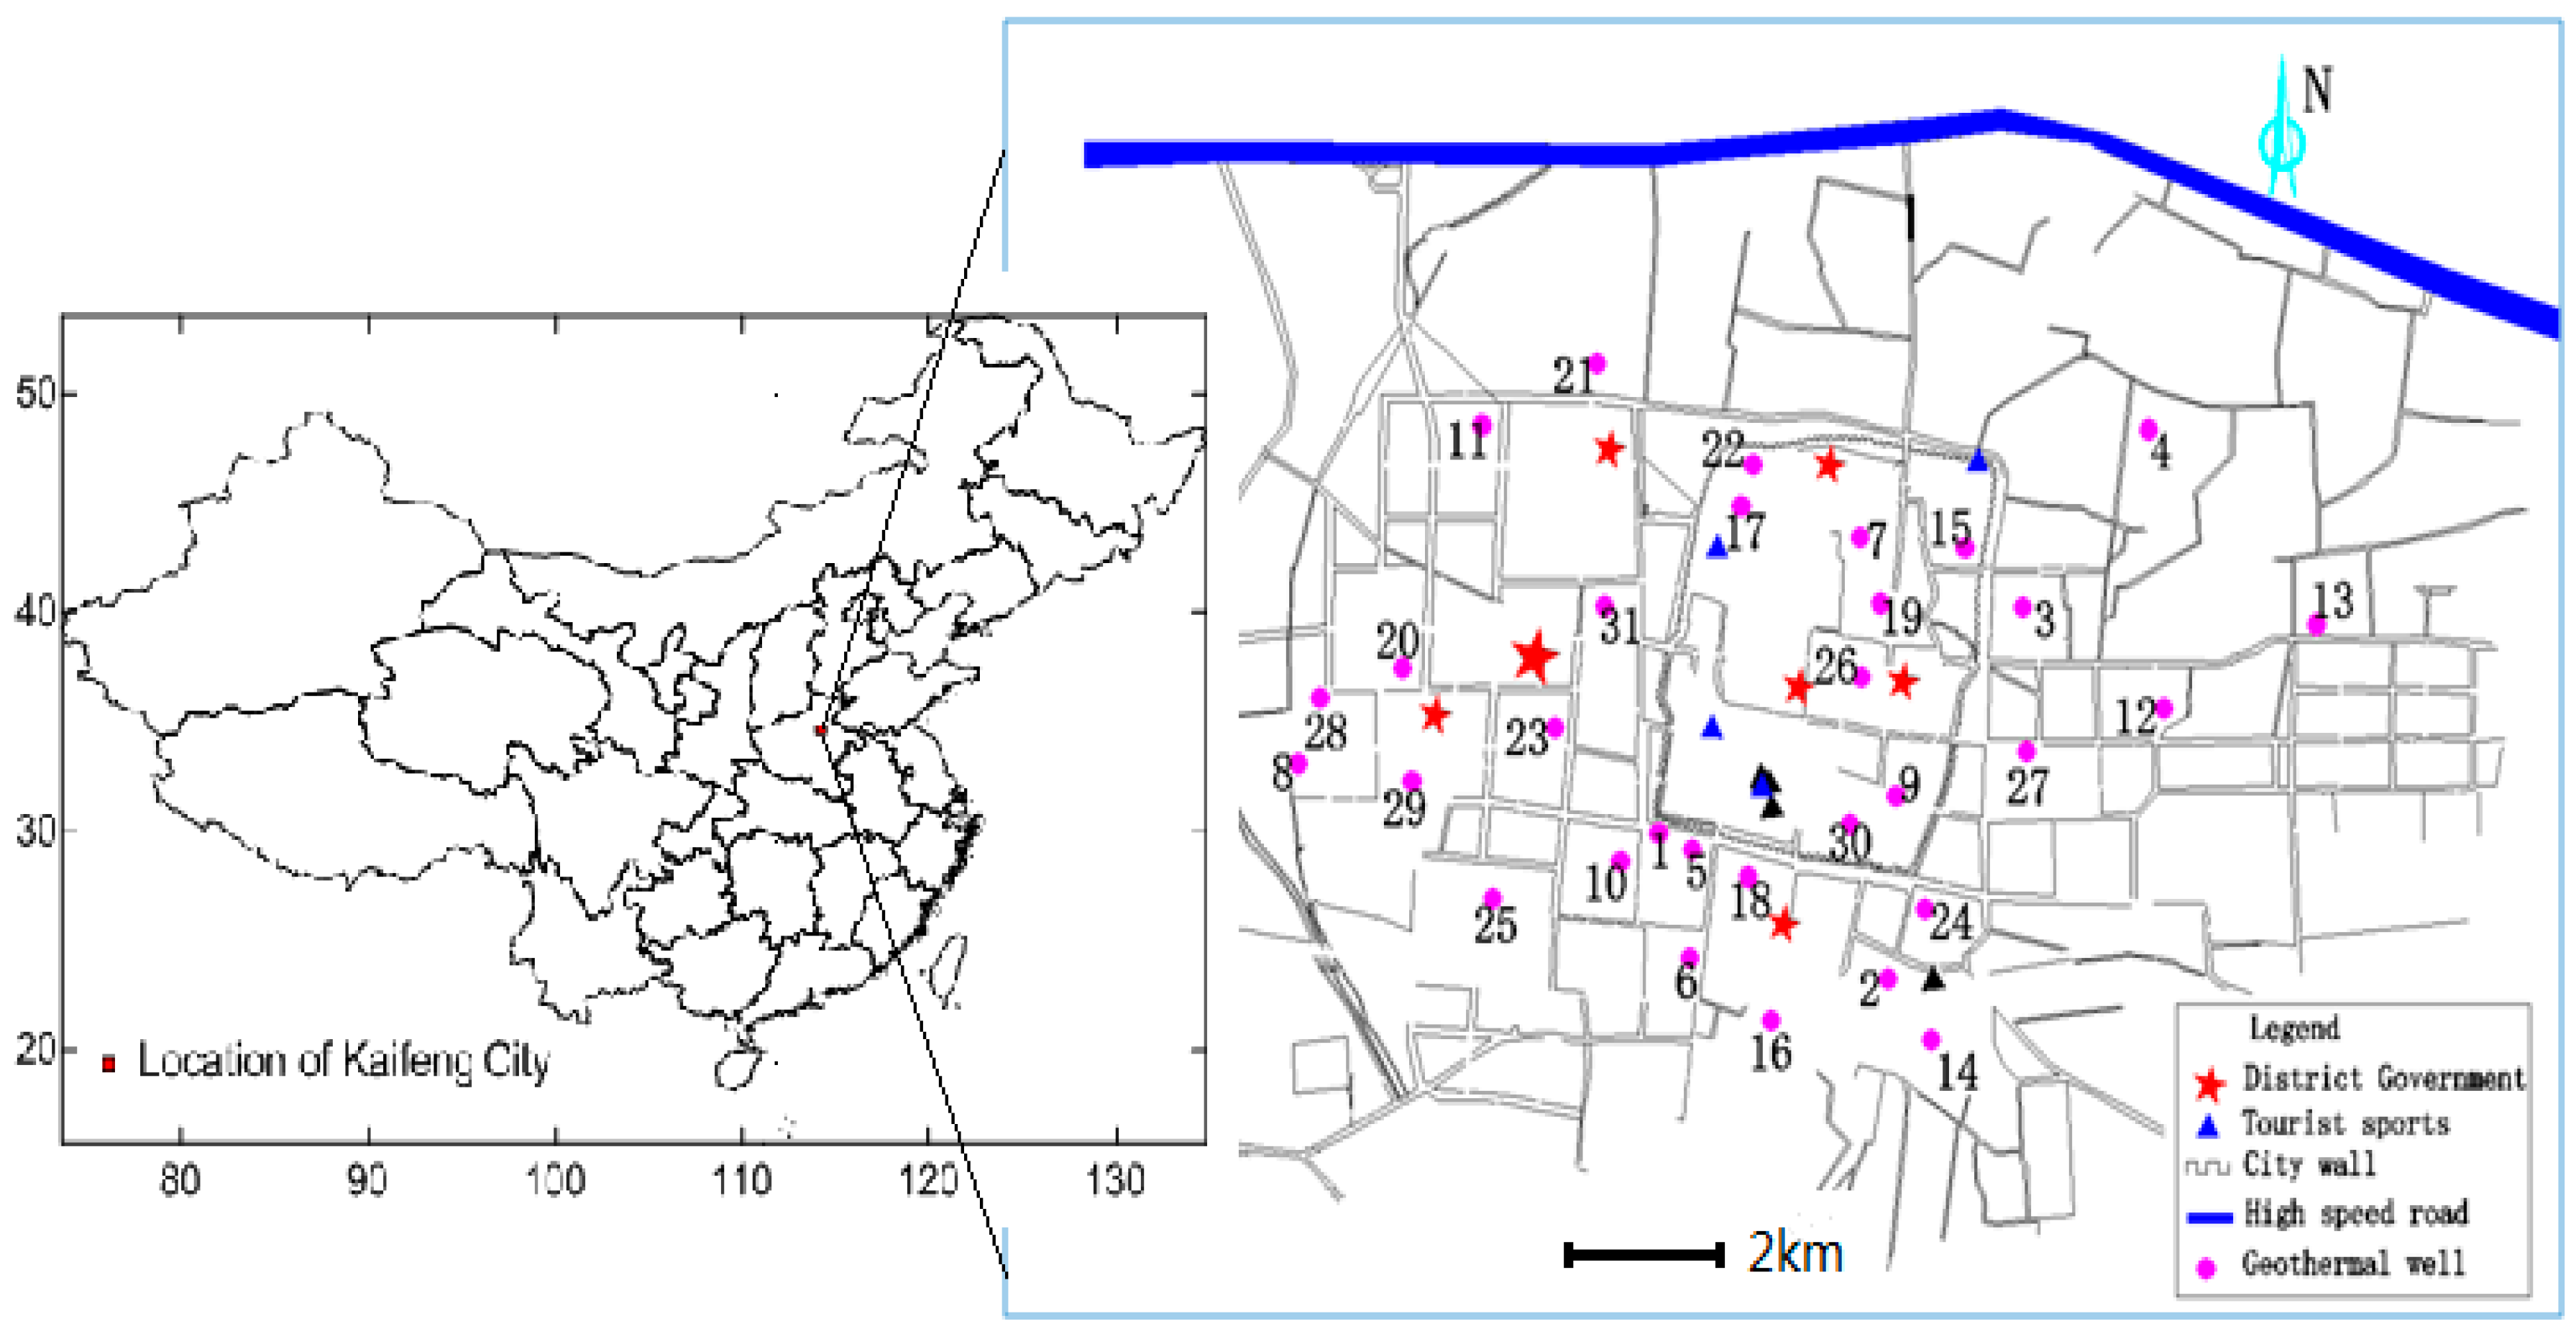
2.1. Study Area

The city of Kaifeng in Henan Province is located in the center of the east Henan plain, an area that encompasses about 362 km2. Existing geothermal columnar borehole data show that the lithologies in this region are predominantly Quaternary and Neogene in age and are comprised of fine and medium-fine sands and clays that have thicknesses up to about 2000 m [37]. These lithological units overlap one another across this region and form a range of rock formations that contain both aquifers and aquicludes. In particular, the Neogene Minghuazhen (Nm) and Guantao (Ng) formation contain abundant geothermal water [38,39]. As this region is also characterized by high temperature anomalies, the geothermal gradient is generally in the range 3.20 °C/100 m to 3.60 °C/100 m (average: 3.39 °C/100 m) [40], while on the basis of the burial conditions of geothermal water, hydraulic characteristics, and exploitation, geothermal reservoirs below 600 m within the city of Kaifeng can be subdivided into seven distinct reservoir ranges, between 600 m and 800 m, 800 m and 1000 m, 1000 m and 1200 m, 1200 m and 1400 m, 1400 m and 1600 m, 1600 m and 1800 m, and 1800 m and 2000 m. These reservoirs are usually separated from one another by a layer or more than 20 m of clay or shale layer; however, these Kaifeng features are unusual because while there tends to be a close hydraulic connection to geothermal water within the same structure, there is no significant connection to different reservoirs.

2.2. Sample Collection and Treatment

Because the main depth range of geothermal water that is currently exploited in Kaifeng is between 600 m and 1600 m, 31 samples from five geothermal reservoirs (i.e., between 600 m and 800 m, 800 m and 1000 m, 1000 m and 1200 m, 1200 m and 1400 m, and 1400 m and 1600 m), were collected for this study, all from different wells. Sampling was carried out between 12 March 2015 and 14 March 2015. The locations of sampling wells are shown in Figure 1.
As geothermal water samples were collected, a number of physical and chemical indicators were also measured, including temperature (T), pH, electrical conductivity (EC), and total dissolved solids (TDS) (see Table 1). All samples were sealed immediately and sent to the laboratory as soon as possible for further analysis. Later, samples were filtered through a 0.45 µm membrane, and the resultant filtrate was preserved in a refrigerator at low temperature. Ultraviolet absorption (UV254) measurements at the 254 nm wavelength were determined using a 2600UV/VIS spectrophotometer (Shimadzu, Kyoto, Japan), and DOC was measured using Vario TOC (Elementar, Hanau, Germany). The results of this analysis are presented in Table 1.

2.3. Determination and Analysis of Fluorescence Spectra

All three-dimensional excitation-emission matrix spectroscopy(3DEEMs) of DOM were determined using a fluorescence spectrophotometer (HITACHI F-7000, Tokyo, Japan) equipped with a 150 W Xenon arc lamp light source, set at a scanning speed of 1200 nm/min at laboratory temperature (22.0 ± 2°C). The slit widths for excitation and emission were set at 5 nm, while the excitation wavelength was increased from 200 nm to 450 nm in 5 nm steps, and the emission wavelength was increased from 240 nm to 500 nm in 2 nm steps. During determination, the spectra of each sample were subtracted from the fluorescence response of a blank solution (distilled water) to minimize the influence of Rayleigh and Raman scattering. Fluorescence spectrum data were then processed using the Origin software (Electronic Arts, Redwood City, CA, USA), and a contour map was produced. The fluorescence regional integration method [41,42,43] was then applied for the further quantitative analysis of 3D spectra; to do this, the 3D fluorescence area was divided into five parts (i.e., excitation/emission set to 220 nm to 250 nm/280 nm to 330 nm, 220 nm to 250 nm/330 nm to 380 nm, 220 nm to 250 nm/380 nm to 500 nm, 250 nm to 280 nm/280 nm to 380 nm, and 250 nm to 400 nm/380 nm to 500 nm). The integral volumes of the five fluorescence regions (Фi), the total fluorescence intensity integral volume (TOT), and the proportion of the total integral volume in each fluorescence region (Pi) were then calculated, while the DOM source was analyzed and characterized using the fluorescence emission spectra index, f450/500. In other words, when the excitation wavelength is 370 nm, the intensity ratio of fluorescence emission spectrum is 450 nm and 500 nm. Previous research [44,45] has shown that f450/500 can be used to characterize DOM source and is usually negatively correlated with the volume of aromatic fulvic acid.

3. Results and Discussion

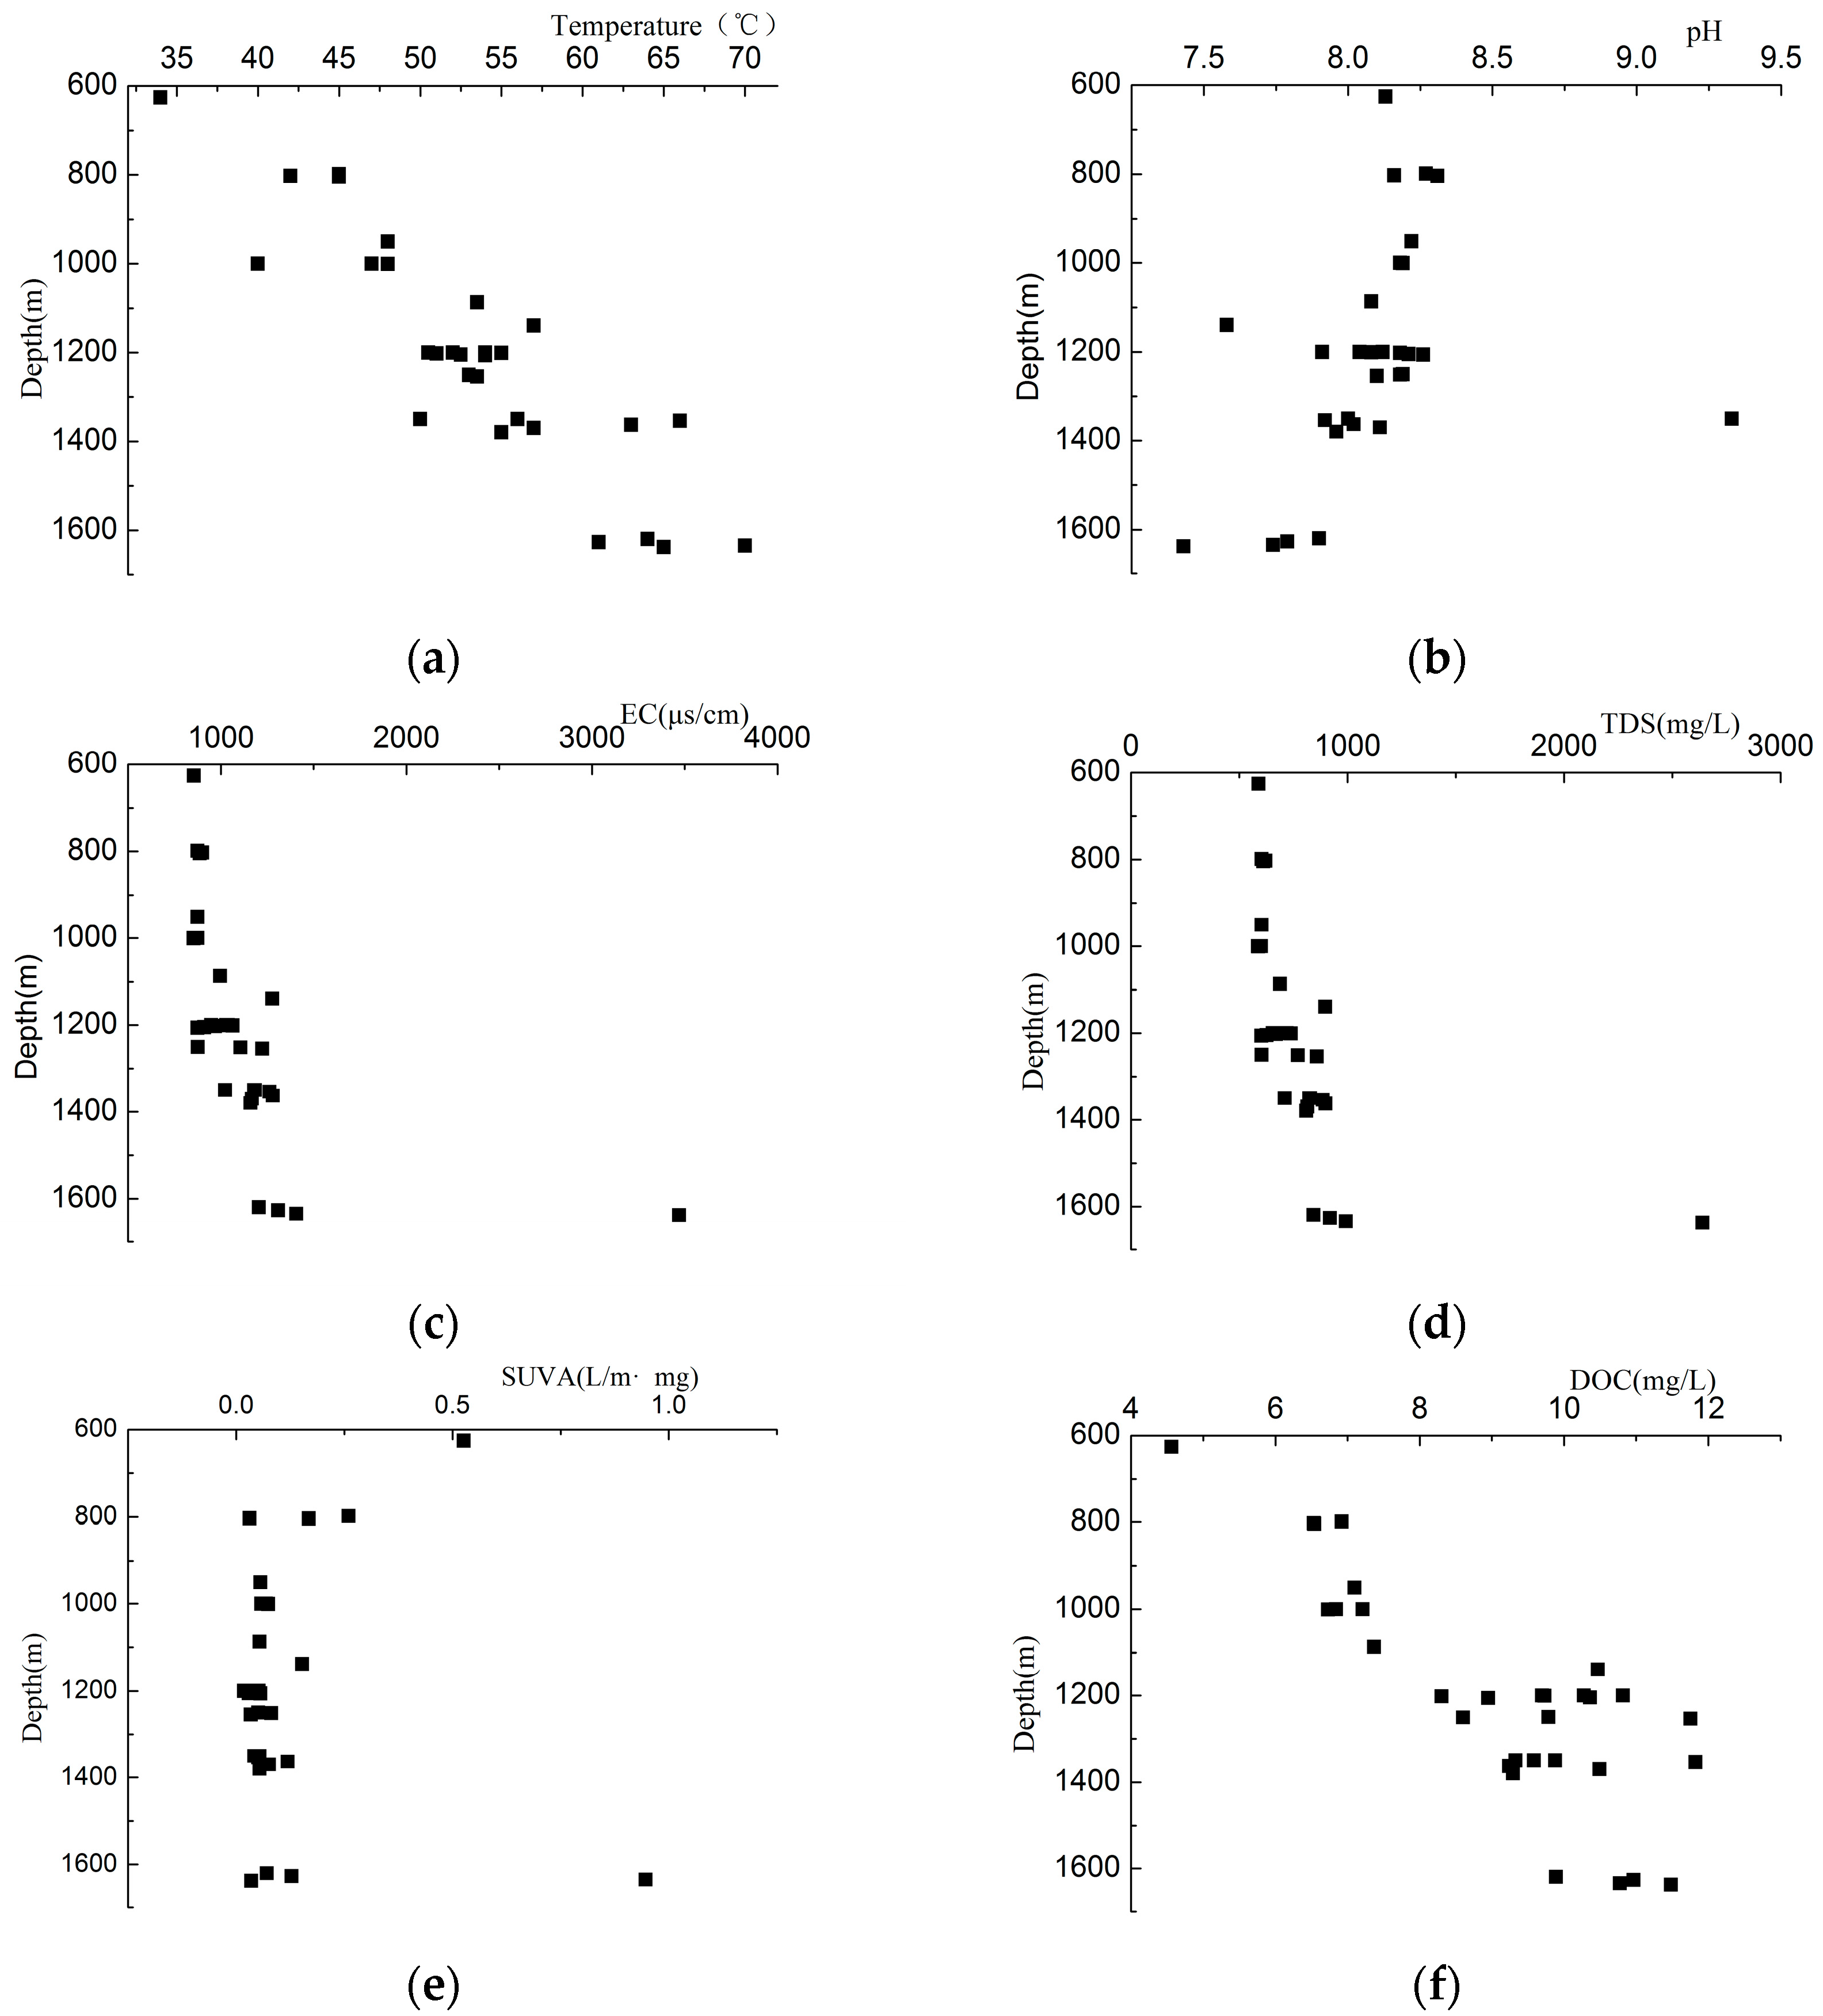
3.1. Detection Index

The resultant changes in a number of indicators (i.e., T, pH, EC, TDS, DOC, and UV254) from geothermal water samples relative to well depth are shown in Figure 2. These results show that, as depth increases, so do T, EC, and TDS, and the latter two significantly correlated (correlation coefficient: 0.9997). At the same time, pH changes in the range 7.43 to 9.33, indicating that all geothermal water samples are alkaline, and that as depth increases, pH decreases (Figure 2). Results show that the concentrations of DOC in water samples from the 1200 m to 1400 m depth geothermal reservoir exhibit the largest variations; this is because this structure encompasses a change in lithology as it is located at the boundary between the Neogene Nm and Ng formations. DOC concentrations in geothermal water from other reservoirs do not show such marked changes because they are comprised from consistent lithologies.
In general, this data show that UV254 values from all geothermal water samples do not vary significantly even though they come from different reservoirs. This result indicates that the UV absorbance of geothermal water in each thermal reservoir is quite similar. In addition, specific UV absorbance (i.e., SUVA = UV254 × 100/DOC), which influences DOM type, can be reflected to a certain extent by the content of aromatic and unsaturated organic compounds [46,47]. Calculations show that SUVA values for all of the geothermal water samples are below 1.0 L/ (mg m); these generally low values suggest that the DOM in Kaifeng deep geothermal water is mainly hydrophilic and of smaller molecular weight, with low aromaticity. This should be related to microbial activity.

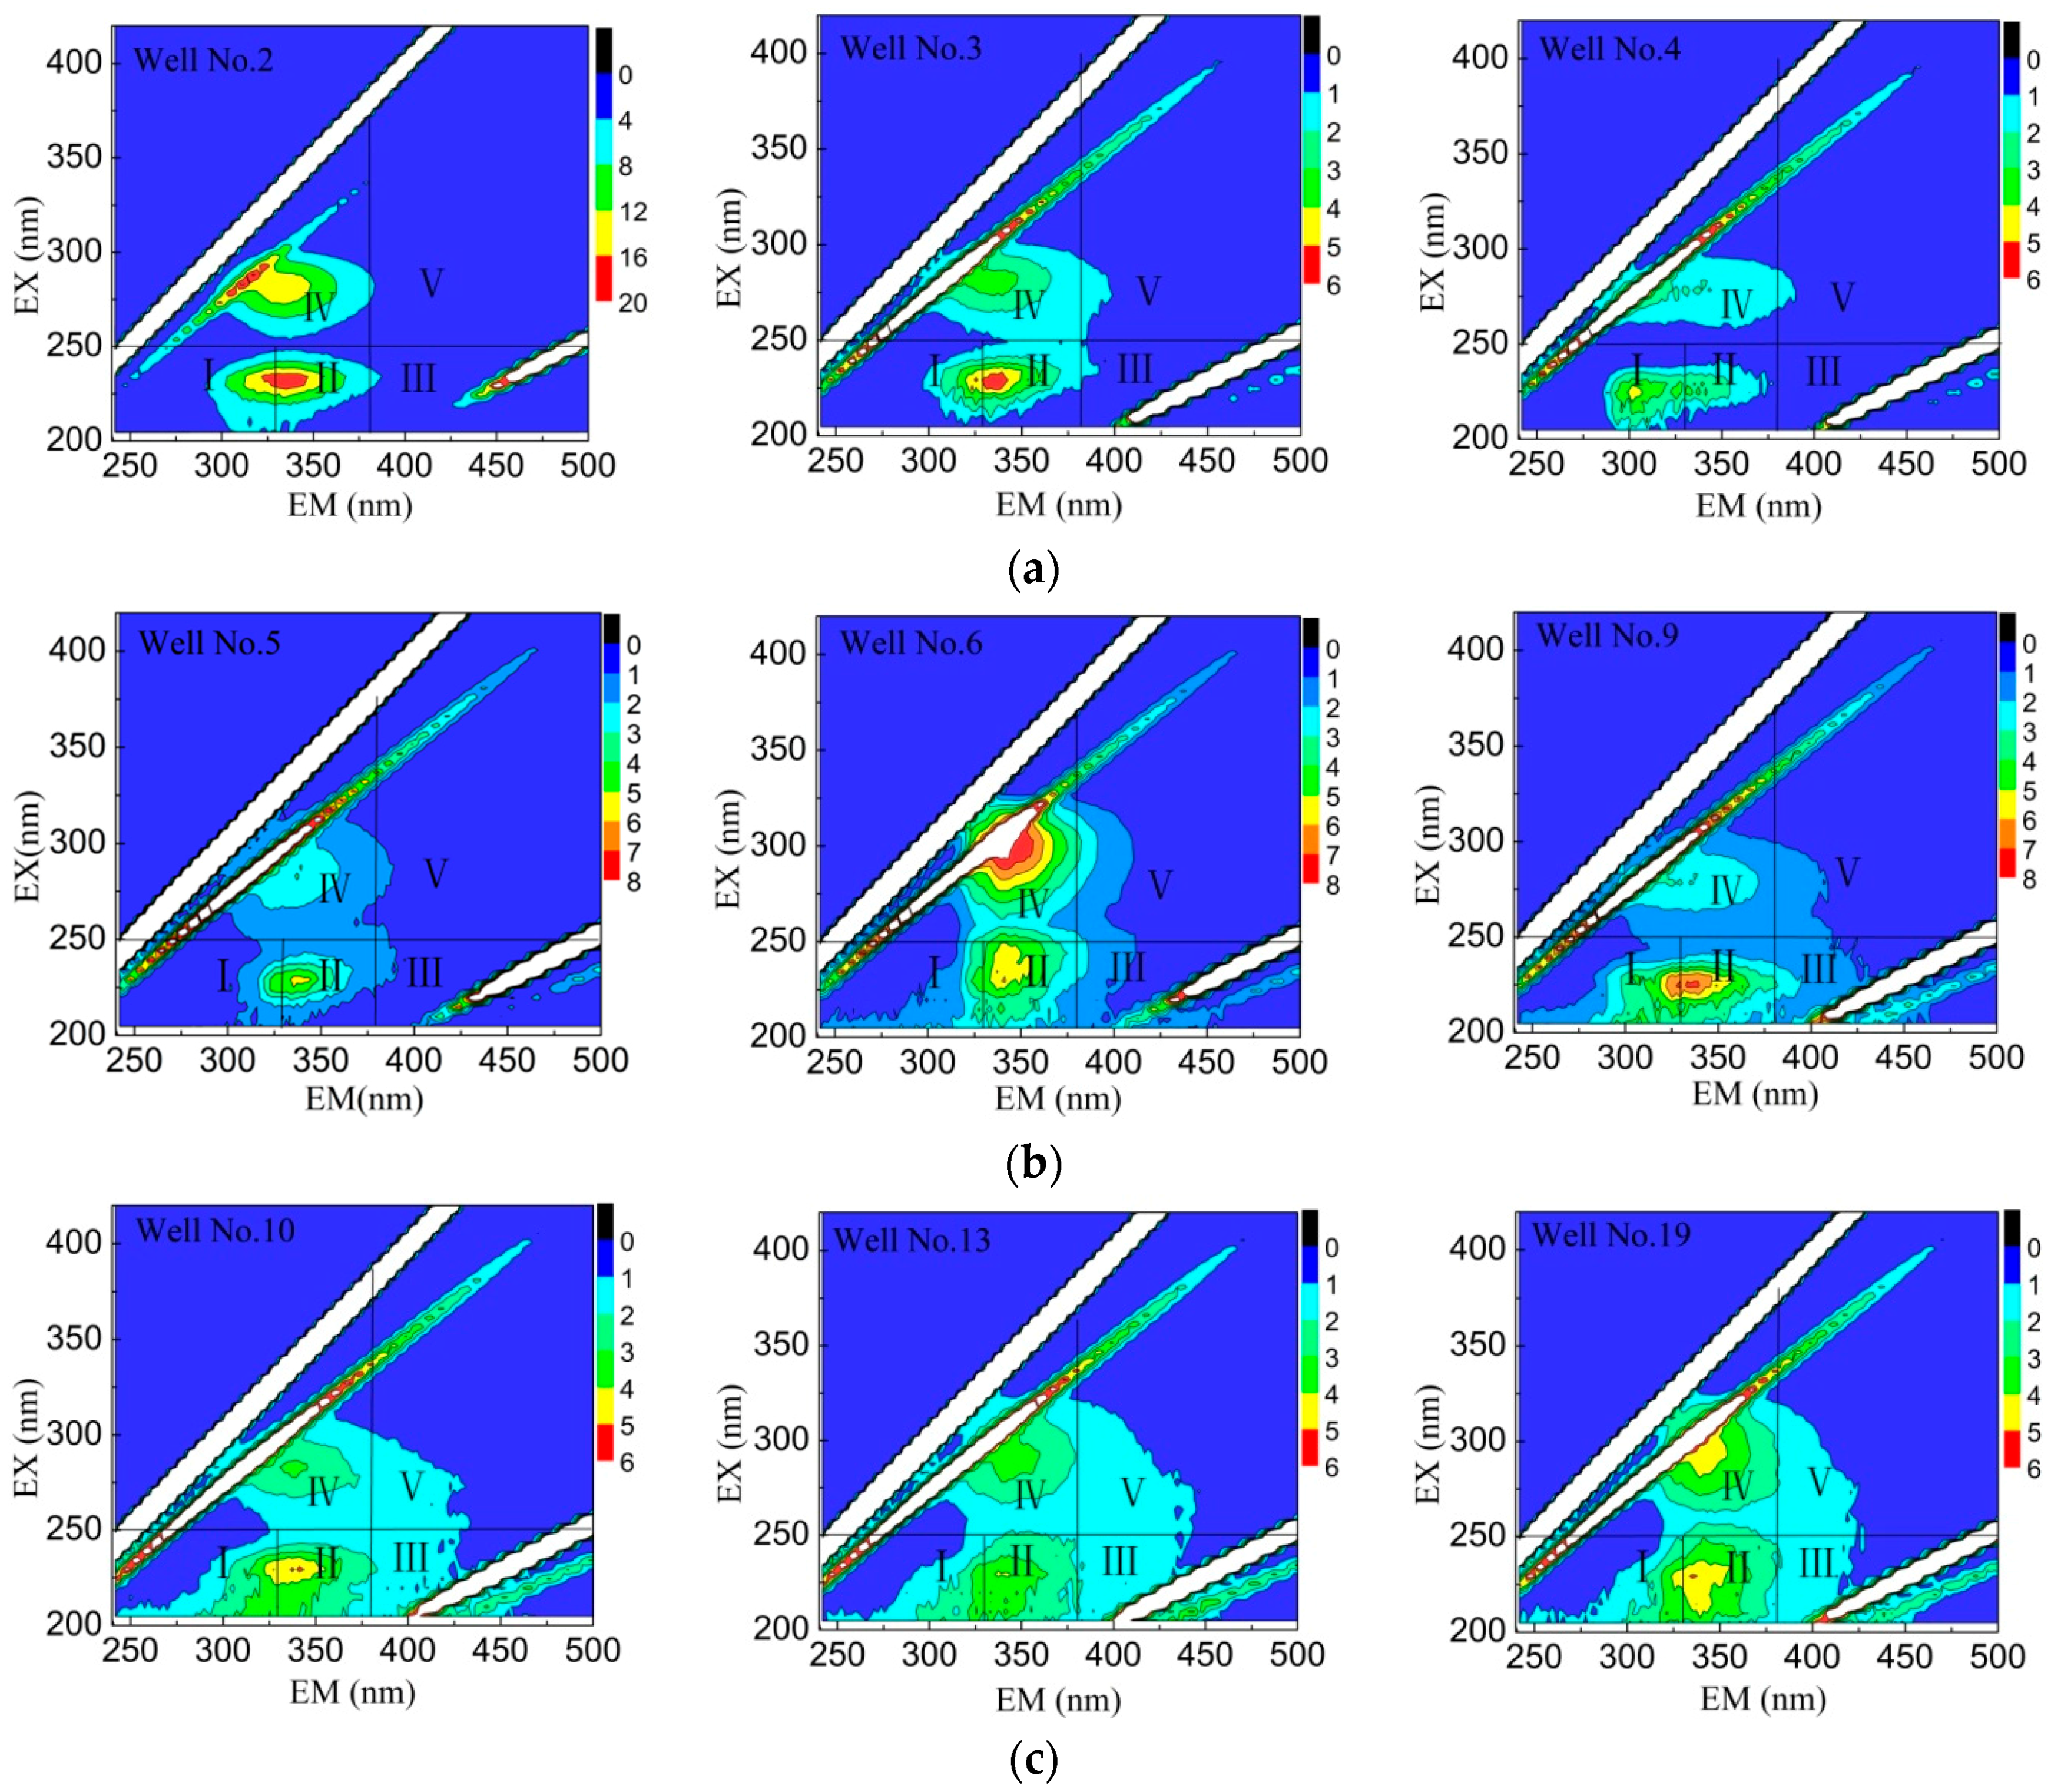
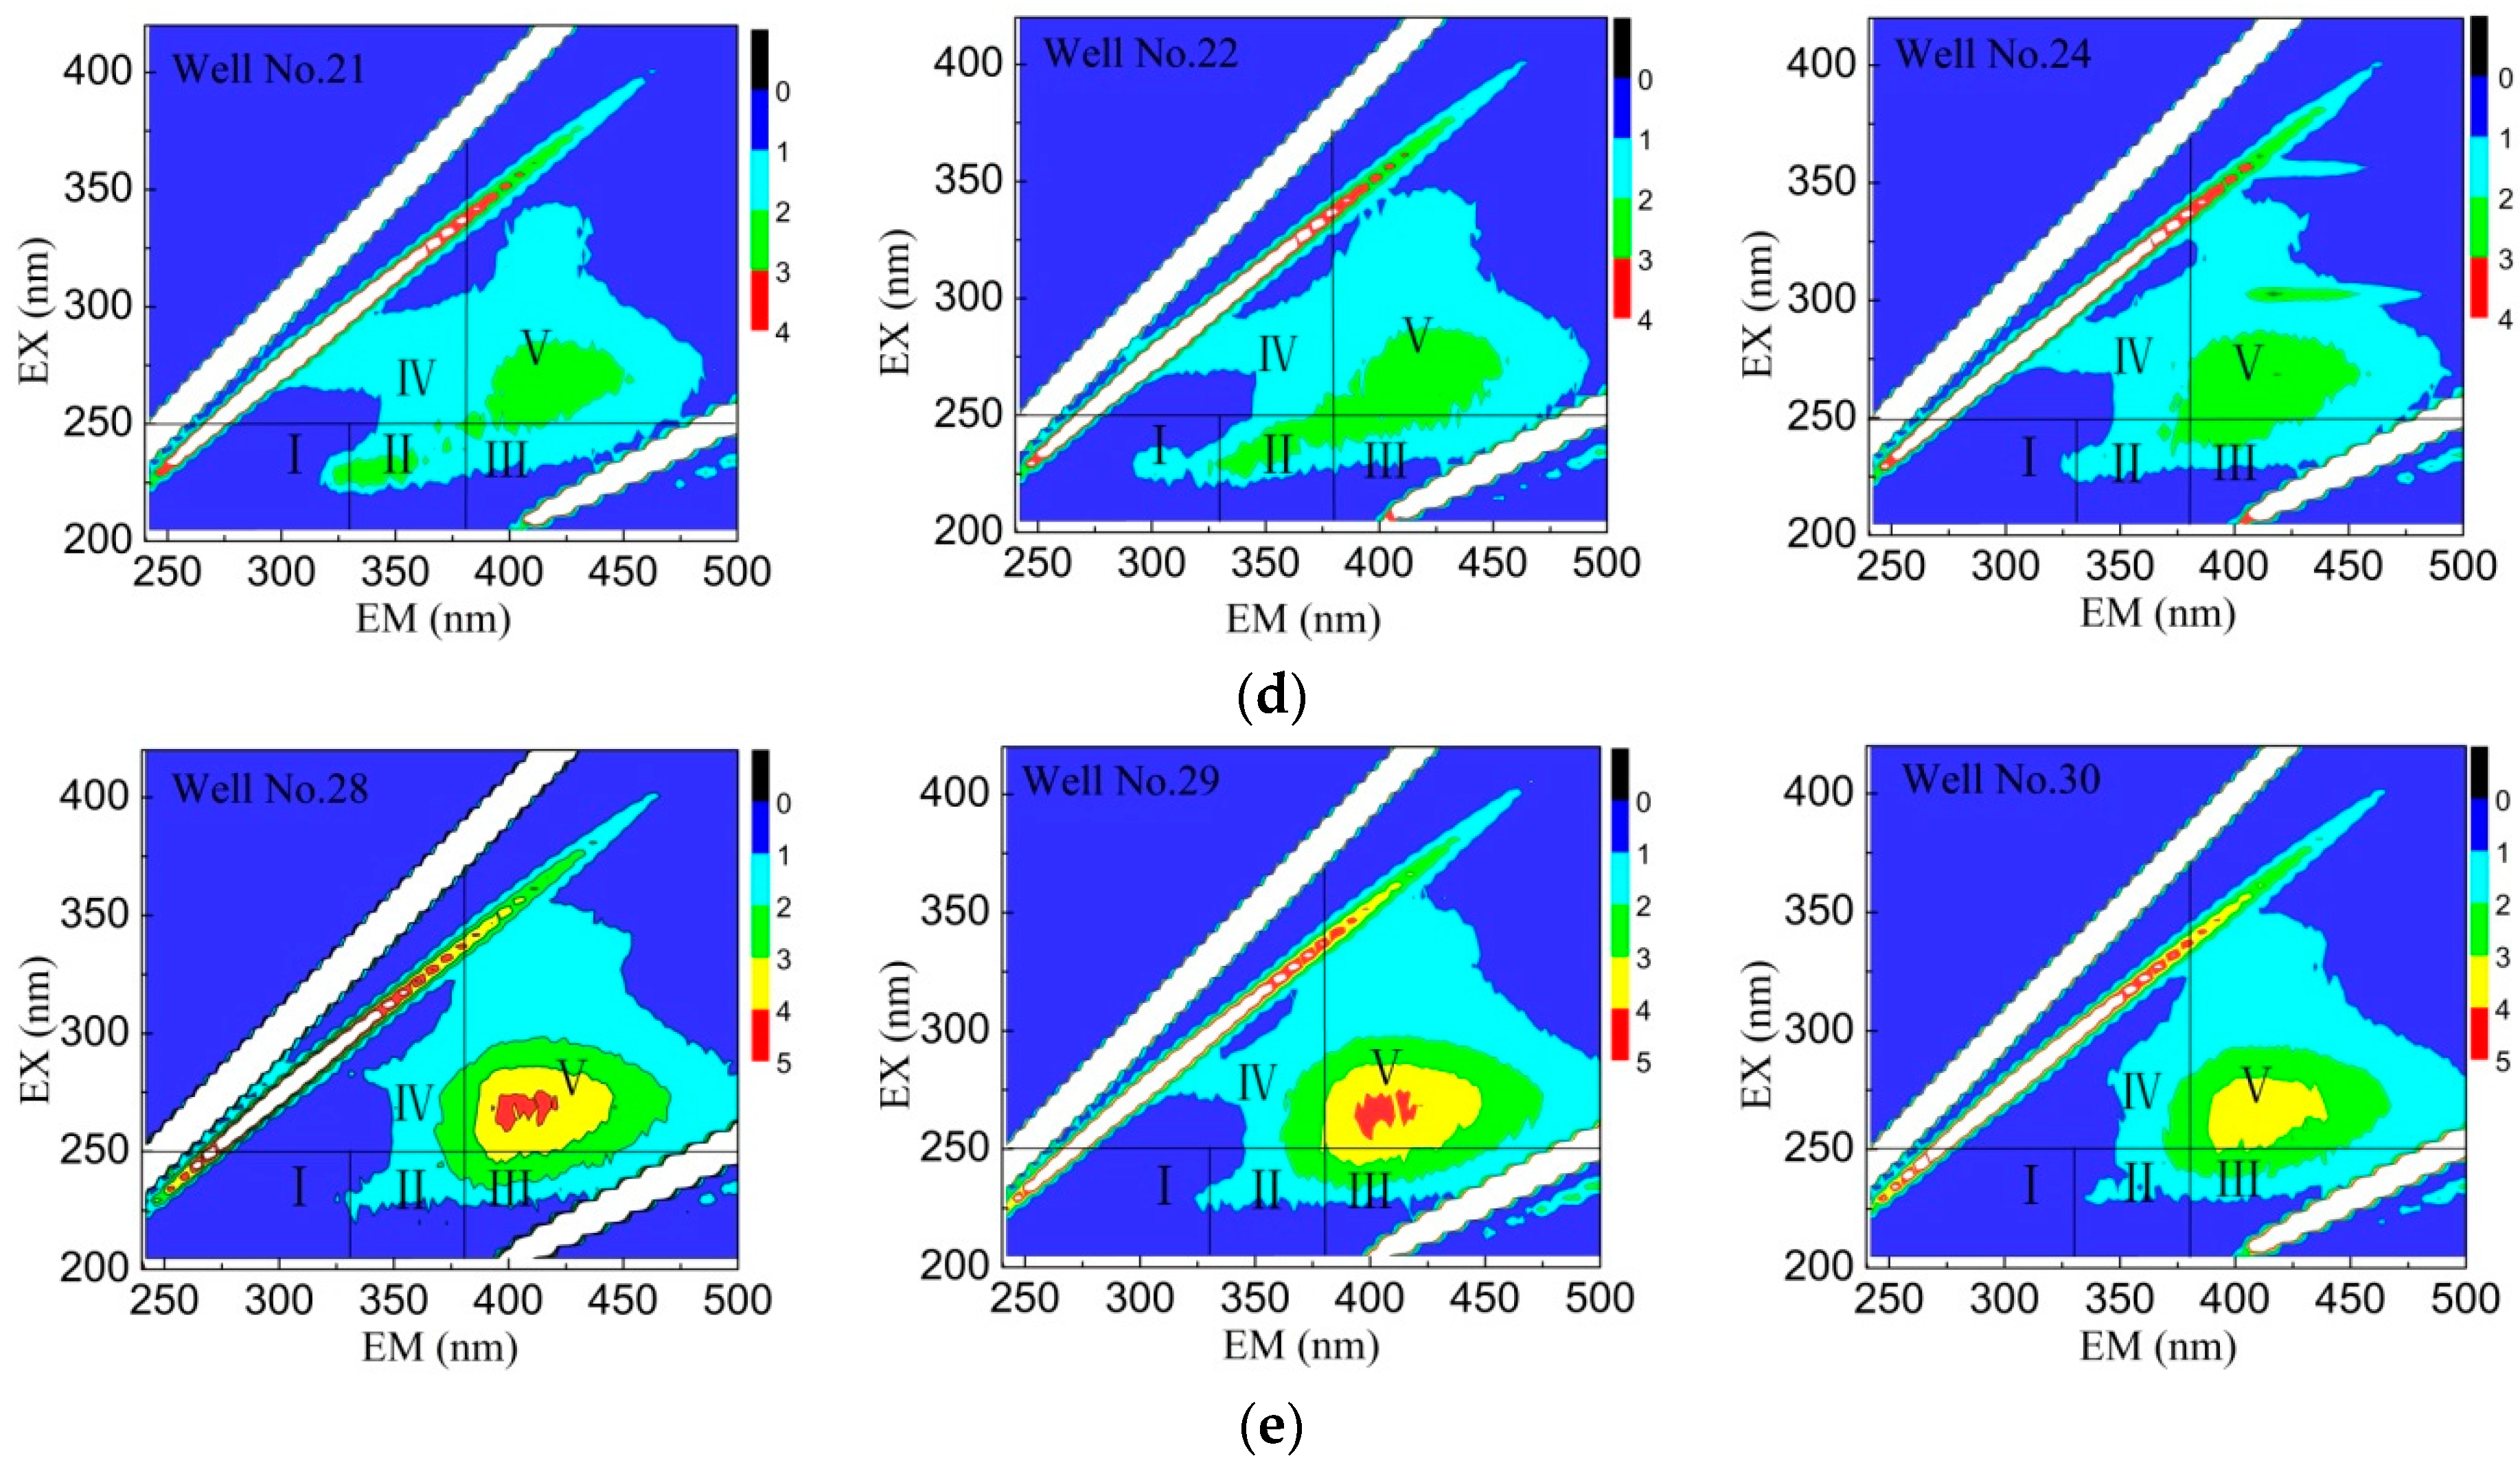
3.2. Fluorescence Peak Position

Three-dimensional fluorescence spectra for DOM from some typical Kaifeng geothermal water samples are shown in Figure 3. These results highlight some key differences in DOM fluorescence peak positions. For example, DOM fluorescence peaks for samples from depths between 600 m and 800 m and 800 m and 1000 m are mainly distributed in three regions, І (i.e., tryptophan-based aromatic proteins; EX (Excitation Wavelength)/EM (Emission Wavelength) = 220 nm to 250 nm/280 nm to 330 nm); ІІ (i.e., tyrosine-based aromatic proteins; EX/EM = 220 nm to 250 nm/330 nm to 380 nm); and ІѴ (i.e., soluble microbial metabolites; EX/EM = 250 nm to 280 nm/280 nm to 380 nm) (See Figure 3a,b). In addition, DOM fluorescence peak center positions for two of the thermal reservoirs are located near EX/EM = 230 nm/340 nm and near EX/EM = 280 nm/340 nm. These fluorescence peaks correspond to proteins and soluble microbial metabolites.
DOM fluorescence peak results for the three thermal reservoirs at depths between 1000 m and 1200 m, 1200 m and 1400 m, and 1400 m and 1600 m are mainly distributed in a total of five regions (see Figure 3c–e). In addition to the three discussed above, there are III (i.e., hydrophobic fulvic acids; EX/EM = 220 nm to 250 nm/380 nm to 500 nm), and V (i.e., humic acids; EX/EM = 250 nm to 400 nm/380 nm to 500 nm). These results also show that DOM fluorescence peak center positions for these three thermal reservoirs are different. For example, the DOM of geothermal water from the 1000 m to 1200 m deep reservoir exhibits two fluorescence centers, located in the vicinities of EX/EM = 230 nm/340 nm and EX/EM = 280 nm/340 nm, respectively. These correspond to fluorescence peaks for proteins and soluble microbial metabolites. At the same time, DOM of geothermal water from the 1200 m to 1400 m reservoir also exhibits two fluorescence centers, located in the vicinity of EX/EM = 230 nm/340 nm and EX/EM = 270 nm/400 nm, respectively. These correspond to fluorescence peaks for proteins and humic acid. Finally, compared with the two thermal reservoirs discussed above, the DOM of geothermal water from the 1400 m to 1600 m reservoir exhibits just one fluorescence center, located near EX/EM = 270 nm/400 nm, corresponding to humic acid.

3.3. Fluorescence Peak Intensity

These results show that the fluorescence intensity (FI) of DOM is not generally high (Figure 3). Indeed, comparisons of DOM fluorescence peak intensities from each thermal reservoir show that these have undergone some changes as depth increases.
The fluorescence spectra for the thermal reservoirs between 600 m and 800 m and 800 m and 1000 m depth were compared. The results clearly show that, although the peak FI of the latter is slightly higher than that of the former, the position of the fluorescence peaks is substantially the same as the previous analysis, suggesting that the composition and sources of DOM are basically the same in the depth range 600 m to 1000 m. However, as depth increases, so does the concentration of DOM, consistent with the earlier results that DOC concentration increases with depth. Comparing the fluorescence spectra from reservoirs in the depth ranges 800 m to 1000 m and 1000 m to 1200 m shows that while FI has weakened somewhat, the scope of the fluorescent region has increased, but the position of the fluorescence peaks remains consistent, indicating that the main source of DOM in these two geothermal reservoirs is substantially the same. In addition, as depth increases, the composition of DOM also changes and several new trace elements are seen for the first time. Thus, by comparing the spectra of samples from reservoirs in the 1000 m to 1200 m and 1200 m to 1400 m depth ranges, it is clear that fluorescence centers are located in different positions, indicating significant changes in DOM components. Finally, sample spectra from reservoirs in the 1200 m and 1400 m and 1400 m and 1600 m depth ranges reveal fluorescence centers in the same positions that are only enhanced slightly as depth increases.
To further explore the composition and origin of DOM in Kaifeng geothermal water, the fluorescence peak intensities of 31 samples across the five fluorescence regions were subjected to correlation analysis. In this paper, the Pearson correlation coefficient was used. First of all, the maximum fluorescence detection signals of the above five regions (i.e., FI(I), FI(II), FI(III), FI(IV), FI(IV)) were identified from the fluorescence spectra of 31 geothermal water samples respectively, constituting a set of data, including 31 rows and 5 columns. Then the Pearson correlation coefficient for any two columns in this set of data were calculated, the results of which are shown in Table 2. The results of this analysis demonstrate the presence of significant correlations between peak FI in the five regions, especially the two protein-like fluorescence peaks located in regions I and II, as well as the peaks in regions III and V. The correlation coefficient of FI(I) and FI(II) reached 0.9197, while the correlation coefficient of FI(III) and FI(V) was 0.9726. These results indicate homology in DOM components, mainly derived from higher stability organisms that remain intact in rocks following the processes of geological deposition and microbiological activity. In addition, values for f450/500 can also be used to characterize DOM sources. On the basis of previous research, f450/500 values of DOM derived from terrestrial versus and biological sources are 1.4 and 1.9, respectively. Calculations show that f450/500 values of DOM for Kaifeng geothermal water range between 1.803 and 2.841. Because these values are close to 1.9, these data also suggest that the DOM in these geothermal reservoirs is derived from biological sources.

3.4. FI Characteristics of Fluorescent Clusters

The regional integration of FI is another effective method for the quantitative analysis of 3D fluorescence spectra. Total FI and partition intensity for each group can be obtained by integrating different fluorescence regions, and can explain changes in material composition and DOM more specifically. Thus, across the five excitation and emission wavelength range regions considered in this study, we integrated 3D fluorescence spectral data for all samples to obtain the integral standard volume (Фi) of each integral region, as well as the total FI integral (TOT), and the proportion (Pi). In this context, Pi can be expressed as the ratio of Фi to TOT (Table 3).
The results of this analysis (Figure 4 and Table 3) show that as burial depth increases, integration of fluorescence spectra in the five regions also changes. Indeed, as the depth of a geothermal reservoir increases, ФI, the FI of region I (tryptophan) obviously decreased, while its proportional contribution to TOT decreased from 25% to 2.72%. At the same time, ФII, the FI of region II (tyrosine) and ФIV, the FI of region IV (soluble microbial metabolites) also decreased slightly, and the proportional contribution of both to TOT decreased from 33.89% and 28.13% to 25.65% and 17.88%, respectively. In addition, ФIII, the FI of region III (fulvic acid) and ФV, the FI of region V (humic acid) increased significantly, and the proportional contribution of both to TOT increased from 6.83% and 6.16% to 25.75% and 28.01%, respectively. These results show that, as depth of a geothermal reservoir increases, the proportion of fluorescent components that contribute to DOM, including proteins, fulvic and humic acids, also changed markedly.

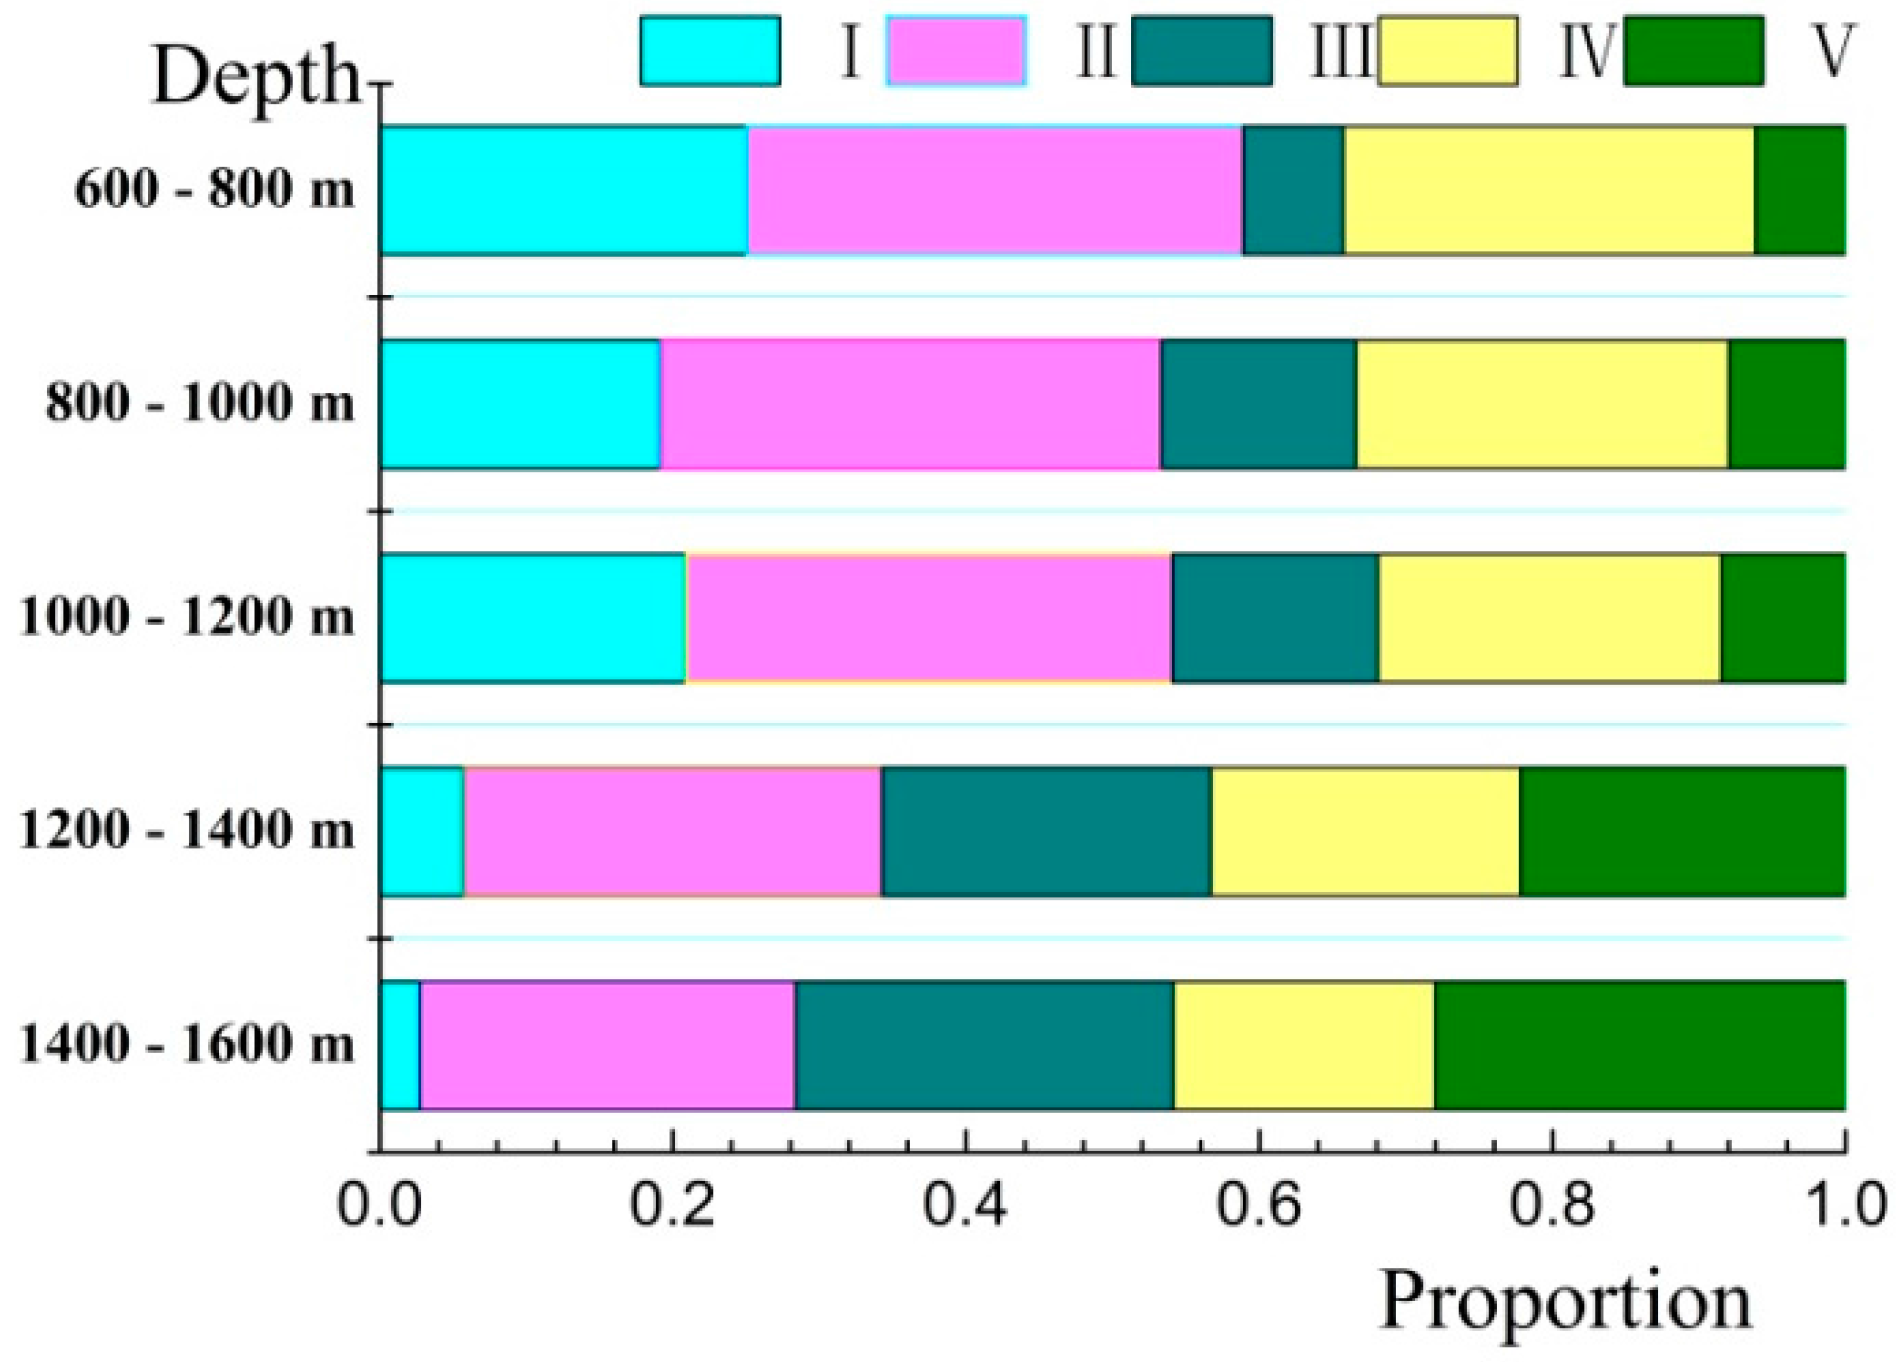
3.5. DOM Composition

The analysis discussed above shows that fluorescence peak position, peak intensity, and the total FI of geothermal waters from different reservoirs are different. In addition, the concentration of DOC in the geothermal water has changed with the increase of thermal reservoir depth, which indicates that the concentration and composition of DOM also varies.
The central position of the DOM fluorescent peak remained unchanged in the case of samples from the reservoir located between 600 m and 1200 m in depth. However, the central position of this fluorescence peak varied significantly in the cases of thermal reservoirs located between 1200 m and 1400 m and between 1400 m and 1600 m in depth, mainly due to the microbial activity, but it should also be related to changes in lithology, since this variation can be explained by the fact that the thermal reservoir between 1200 m and 1400 m in depth is located exactly at the boundary of the Nm and Ng formations. This means changes in formation lithology may lead to differences in DOM composition of DOM, and then cause the different positions of fluorescence peaks. However, this inference also needs to be further verified by subsequent experiments.
In the case of the thermal reservoir located between 600 m and 1000 m, as burial depth increased, temperature rose and FI was enhanced. These changes demonstrate that there was no change in the composition of DOM, although the concentration of DOC increased in the reservoir at this depth range. This was not the case, however, for the reservoir located between 1000 m and 1600 m; in this example, as burial depth increased, the intensity of fluorescence peaks first decreased and then increased. This suggests that the regional environment of fluorescence changed, and also indicates a change in DOM composition as the content of each component is different. Again, this variation may be the result of an underlying change in formation lithology and temperature.
The fluorescent components of DOM, including proteins, soluble microbial metabolites, and humic and fulvic acids, are often present in the geothermal waters of different thermal reservoirs. Based on fluorescence integration, the II region (tyrosine) and IV region (soluble microbial metabolites) varied slightly across samples, while the fluorescence integration of other regions changed significantly. In the thermal reservoir between 600 m and 1200 m depth, DOM comprises mainly tryptophans, tyrosine-based aromatic proteins, and soluble microbial metabolites, while in the thermal reservoir between 1200 m and 1600 m depth, DOM mainly consists of tyrosine aromatic proteins, humic and fulvic acids, and soluble microbial metabolites. Compared with compositions in geothermal water samples from five reservoirs, it is clear that, in these examples, tyrosine aromatic proteins and soluble microbial metabolites are the main components of DOM.
Analysis of f450/500 values and correlation of fluorescence peak intensities for each region show that both DOM and its components share a common source in geothermal water; both are derived from endogenous microbial metabolic activity and high stability organic compounds released during rock deposition and subsequently dissolved into geothermal water as the result of water-rock interactions. Indeed, in particular temperature environments, proteins contained in OM can be hydrolyzed into amino acids in geothermal water, causing the DOM of geothermal water in deep-pore geothermal reservoirs to display protein-like patterns of fluorescence. However, as the depth of thermal reservoirs increases, the concomitant rise in temperature means that microbial metabolic activity is weakened, its effect on DOM degradation is reduced, and the proportion of protein and microbial metabolites in DOM is decreased. At the same time, the proportion of fulvic and humic acid-like components increases, eventually becoming the dominant constituents of DOM in deep geothermal waters.

4. Conclusions

The results of this study show that as the depth of thermal reservoirs increases, so do DOC concentrations in deep geothermal waters in the city of Kaifeng. Overall, these concentrations exhibit an overall increasing trend in the reservoir located at depths between 1200 m and 1400 m, at the boundary between the Neogene Nm and Ng formations. In this reservoir, the DOC mass concentration in geothermal water exhibits great variability, while in others, where lithologies remain unchanged, DOC concentrations and UV absorbance change only slightly.
These results demonstrate a significant difference in fluorescence peak center positions of DOM in geothermal waters from different reservoirs. For example, in samples from the reservoir at depths between 1000 m and 1200 m, DOM fluorescence mainly exhibits protein-like peaks and soluble microbial metabolite-like peaks, while in samples from the reservoir located at depths between 1200 m and 1400 m, fluorescence mainly reflects protein-like and humic acid-like fluorescence peaks. Similarly, the DOM fluorescence peaks of samples from the reservoir located at depths between 1400 m and 1600 m mainly correspond to humic acid-like peaks. These differences are mainly the result of changes in underlying formation lithologies.
FI values of DOM in geothermal water are not generally high. Indeed, in the case of samples from depths between 600 m and 1000 m, FI values for DOM increase in concert with depth, which may be related to an increase in temperature. However, at depths between 1000 m and 1600 m, FI decreases before increasing again, while the range of the fluorescent region becomes larger. This may also be the result of an interaction between formation lithology change and an increase in temperature.
The results show changes in the proportions of DOM fluorescence components in geothermal from different reservoirs. These components include proteins and fulvic and humic acids. At the same time, however, tyrosine aromatic proteins and dissolved microbial metabolites remain the dominant components of geothermal water DOM.
This study demonstrates that both DOM and its components in geothermal water share a common origin, derived from microbial activity and decomposition of humus retained throughout the processes of geological deposition. Subsequent to an increase in thermal reservoir depth, temperature increases and microbial metabolic activity decreases. This means that the proportion of protein components in DOM decreases, while fulvic and humic acid components correspondingly increase.

Supplementary Materials

The following are available online at www.mdpi.com/2073-4441/9/4/266/s1. Supplementary File 1: Spectrophotometer measurements.

Acknowledgments

This work was financially supported by the National Natural Science Foundation of China (Grant41672240), the Construction of Innovative Talents in Henan Province (Grant CXTD2016053), and Henan Province’s Technological Innovation Team of Colleges and Universities (Grant 15IRTSTHN027).

Author Contributions

Weifang Qiao and Xinyi Wang conceived and designed the experiments; Weifang Qiao and Xiaoge Zhen performed the experiments; Weifang Qiao and Xiaoman Liu analyzed the data; Jianwei Guo, Guosheng Chen and Bo Zhang contributed materials; Shidong Wang and Fang Yang collected water samples; Weifang Qiao wrote the paper; Xiaoge Zhen, Xinyi Wang, Jianwei Guo and Guosheng Chen reviewed and edited the manuscript. All authors read and approved the manuscript.

Conflicts of Interest

The authors declare no conflicts of interest.

References

  1. Coble, P.G.; Green, S.A.; Blough, N.V.; Gagosian, R.B. Characterization of dissolved organic matter in the black sea by fluorescence spectroscopy. Nature 1990, 348, 432–435. [Google Scholar] [CrossRef]
  2. Parlanti, E.; Wörz, K.; Geoffroy, L.; Lamotte, M. Dissolved organic matter fluorescence spectroscopy as a tool to estimate biological activity in a coastal zone submitted to anthropogenic inputs. Org. Geochem. 2000, 31, 1765–1781. [Google Scholar] [CrossRef]
  3. Kim, T.-H.; Kwon, E.; Kim, I.; Lee, S.-A.; Kim, G. Dissolved organic matter in the subterranean estuary of a volcanic island, jeju: Importance of dissolved organic nitrogen fluxes to the ocean. J. Sea Res. 2013, 78, 18–24. [Google Scholar] [CrossRef]
  4. Ritson, J.; Graham, N.; Templeton, M.; Clark, J.; Gough, R.; Freeman, C. The impact of climate change on the treatability of dissolved organic matter (dom) in upland water supplies: A UK perspective. Sci. Total Environ. 2014, 473, 714–730. [Google Scholar] [CrossRef] [PubMed]
  5. Huang, S.-B.; Wang, Y.-X.; Ma, T.; Tong, L.; Wang, Y.-Y.; Liu, C.-R.; Zhao, L. Linking groundwater dissolved organic matter to sedimentary organic matter from a fluvio-lacustrine aquifer at jianghan plain, China by eem-parafac and hydrochemical analyses. Sci. Total Environ. 2015, 529, 131–139. [Google Scholar] [CrossRef] [PubMed]
  6. Li, S.; Zhang, J.; Mu, G.; Ju, H.; Wang, R.; Li, D.; Shabbir, A.H. Spatiotemporal characterization of chromophoric dissolved organic matter (cdom) and cdom-doc relationships for highly polluted rivers. Water 2016, 8, 399. [Google Scholar] [CrossRef]
  7. Dittmar, T.; Stubbins, A. 12.6–dissolved organic matter in aquatic systems. In Treatise on Geochemistry, 2nd ed.; Elsevier: Oxford, UK, 2014; pp. 125–156. [Google Scholar]
  8. Zsolnay, A. Dissolved organic matter: Artefacts, definitions, and functions. Geoderma 2003, 113, 187–209. [Google Scholar] [CrossRef]
  9. Wallis, P.; Hynes, H.; Telang, S. The importance of groundwater in the transportation of allochthonous dissolved organic matter to the streams draining a small mountain basin. Hydrobiologia 1981, 79, 77–90. [Google Scholar] [CrossRef]
  10. Linlin, W.; Xuan, Z.; Meng, Z. Removal of dissolved organic matter in municipal effluent with ozonation, slow sand filtration and nanofiltration as high quality pre-treatment option for artificial groundwater recharge. Chemosphere 2011, 83, 693–699. [Google Scholar] [CrossRef] [PubMed]
  11. Wolthoorn, A.; Temminghoff, E.J.; Weng, L.; van Riemsdijk, W.H. Colloid formation in groundwater: Effect of phosphate, manganese, silicate and dissolved organic matter on the dynamic heterogeneous oxidation of ferrous iron. Appl. Geochem. 2004, 19, 611–622. [Google Scholar] [CrossRef]
  12. Dilling, J.; Kaiser, K. Estimation of the hydrophobic fraction of dissolved organic matter in water samples using uv photometry. Water Res. 2002, 36, 5037–5044. [Google Scholar] [CrossRef]
  13. Weishaar, J.L.; Aiken, G.R.; Bergamaschi, B.A.; Fram, M.S.; Fujii, R.; Mopper, K. Evaluation of specific ultraviolet absorbance as an indicator of the chemical composition and reactivity of dissolved organic carbon. Environ. Sci. Technol. 2003, 37, 4702–4708. [Google Scholar] [CrossRef] [PubMed]
  14. Jones, D.; Willett, V. Experimental evaluation of methods to quantify dissolved organic nitrogen (don) and dissolved organic carbon (doc) in soil. Soil Biol. Biochem. 2006, 38, 991–999. [Google Scholar] [CrossRef]
  15. Deflandre, B.; Gagné, J.-P. Estimation of dissolved organic carbon (doc) concentrations in nanoliter samples using uv spectroscopy. Water Res. 2001, 35, 3057–3062. [Google Scholar] [CrossRef]
  16. Zmora-Nahum, S.; Markovitch, O.; Tarchitzky, J.; Chen, Y. Dissolved organic carbon (doc) as a parameter of compost maturity. Soil Biol. Biochem. 2005, 37, 2109–2116. [Google Scholar] [CrossRef]
  17. Monteith, D.T.; Stoddard, J.L.; Evans, C.D.; de Wit, H.A.; Forsius, M.; Høgåsen, T.; Wilander, A.; Skjelkvåle, B.L.; Jeffries, D.S.; Vuorenmaa, J. Dissolved organic carbon trends resulting from changes in atmospheric deposition chemistry. Nature 2007, 450, 537–540. [Google Scholar] [CrossRef] [PubMed]
  18. Fellman, J.B.; Hood, E.; Spencer, R.G. Fluorescence spectroscopy opens new windows into dissolved organic matter dynamics in freshwater ecosystems: A review. Limnol. Oceanogr. 2010, 55, 2452–2462. [Google Scholar] [CrossRef]
  19. Yao, Y.; Li, Y.-Z.; Guo, X.-J.; Huang, T.; Gao, P.-P.; Zhang, Y.-P.; Yuan, F. Changes and characteristics of dissolved organic matter in a constructed wetland system using fluorescence spectroscopy. Environ. Sci. Pollut. Res. 2016, 23, 12237–12245. [Google Scholar] [CrossRef] [PubMed]
  20. Hambly, A.; Arvin, E.; Pedersen, L.-F.; Pedersen, P.B.; Seredyńska-Sobecka, B.; Stedmon, C. Characterising organic matter in recirculating aquaculture systems with fluorescence eem spectroscopy. Water Res. 2015, 83, 112–120. [Google Scholar] [CrossRef] [PubMed]
  21. Coble, P.G. Characterization of marine and terrestrial dom in seawater using excitation-emission matrix spectroscopy. Mar.Chem. 1996, 51, 325–346. [Google Scholar] [CrossRef]
  22. Al Lawati, W.M.; Rizoulis, A.; Eiche, E.; Boothman, C.; Polya, D.A.; Lloyd, J.R.; Berg, M.; Vasquez-Aguilar, P.; van Dongen, B.E. Characterisation of organic matter and microbial communities in contrasting arsenic-rich holocene and arsenic-poor pleistocene aquifers, red river delta, vietnam. Appl. Geochem. 2012, 27, 315–325. [Google Scholar] [CrossRef]
  23. Kolic, P.E.; Roy, E.D.; White, J.R.; Cook, R.L. Spectroscopic measurements of estuarine dissolved organic matter dynamics during a large-scale mississippi river flood diversion. Sci. Total Environ. 2014, 485, 518–527. [Google Scholar] [CrossRef] [PubMed]
  24. Yang, L.; Guo, W.; Chen, N.; Hong, H.; Huang, J.; Xu, J.; Huang, S. Influence of a summer storm event on the flux and composition of dissolved organic matter in a subtropical river, china. Appl. Geochem. 2013, 28, 164–171. [Google Scholar] [CrossRef]
  25. Zhou, Z.; Guo, L.; Minor, E.C. Characterization of bulk and chromophoric dissolved organic matter in the laurentian great lakes during summer 2013. J. Gt. Lakes Res. 2016, 42, 789–801. [Google Scholar] [CrossRef]
  26. Cui, J.; Yuan, D.H.; Guo, X.J.; He, L.S.; He, J.W.; Li, H.Y.; Li, J.Q. Characterization of dissolved organic matter in lake baiyangdian using spectroscopic techniques and multivariate statistical analysis. Clean Soil Air Water 2016, 44, 1444–1452. [Google Scholar] [CrossRef]
  27. He, X.-S.; Xi, B.-D.; Gao, R.-T.; Wang, L.; Ma, Y.; Cui, D.-Y.; Tan, W.-B. Using fluorescence spectroscopy coupled with chemometric analysis to investigate the origin, composition, and dynamics of dissolved organic matter in leachate-polluted groundwater. Environ. Sci. Pollut. Res. 2015, 22, 8499–8506. [Google Scholar] [CrossRef] [PubMed]
  28. Zhu, G.; Yin, J.; Zhang, P.; Wang, X.; Fan, G.; Hua, B.; Ren, B.; Zheng, H.; Deng, B. Dom removal by flocculation process: Fluorescence excitation–emission matrix spectroscopy (eems) characterization. Desalination 2014, 346, 38–45. [Google Scholar] [CrossRef]
  29. Henderson, R.; Baker, A.; Murphy, K.; Hambly, A.; Stuetz, R.; Khan, S. Fluorescence as a potential monitoring tool for recycled water systems: A review. Water Res. 2009, 43, 863–881. [Google Scholar] [CrossRef] [PubMed]
  30. Tedetti, M.; Cuet, P.; Guigue, C.; Goutx, M. Characterization of dissolved organic matter in a coral reef ecosystem subjected to anthropogenic pressures (la réunion island, indian ocean) using multi-dimensional fluorescence spectroscopy. Sci. Total Environ. 2011, 409, 2198–2210. [Google Scholar] [CrossRef] [PubMed]
  31. Chen, M.; Price, R.M.; Yamashita, Y.; Jaffé, R. Comparative study of dissolved organic matter from groundwater and surface water in the florida coastal everglades using multi-dimensional spectrofluorometry combined with multivariate statistics. Appl. Geochem. 2010, 25, 872–880. [Google Scholar] [CrossRef]
  32. Wang, C.; Wei, J.; Zhang, B. Characterization of dissolved organic matter in groundwater from the coastal dagu river watershed, china using fluorescence excitation-emission matrix spectroscopy. Spectrosc. Spectr. Anal. 2013, 33, 2460–2465. [Google Scholar]
  33. Liu, X.-M.; Wang, X.-Y. Evaluation of exploitable yield for geothermal water in kaifeng urban district. West China Explor. Eng. 2005, 17, 80–82. [Google Scholar]
  34. Wang, X.-G.; Zhang, H.; Zhang, J.-J. Analysis on the hydrochemical characteristics and isotope of geothermal water in kaifeng depression. Saf. Environ. Eng. 2012, 6, 019. [Google Scholar]
  35. Zhu, H.; Liu, X.; Yang, F.; Yang, H.; Wang, X. Analysis and study on geothermal reinjection test of deep groundwater in kaifeng. J. Henan Polytech. Univ. (Nat. Sci.) 2011, 30, 215–219. [Google Scholar]
  36. Qi, Y.-F.; Wang, X.-G.; Wang, G.-J.; Ge, Y. Development and protection of geothermal resources in kaifeng depression. Ground Water 2007, 4, 027. [Google Scholar]
  37. Wang, X.; Zhao, L.; Liu, X.; Lili, A.; Zhang, Y. Temperature effect on the transport of nitrate and ammonium ions in a loose-pore geothermal reservoir. J. Geochem. Explor. 2013, 124, 59–66. [Google Scholar] [CrossRef]
  38. Huang, S.; Tian, T. Sustainable development of geothermal resource in china and future projects. In Proceedings of the World Geothermal Congress 2005, Antalya, Turkey, 24–29 April 2005. [Google Scholar]
  39. Yu-feng, Q. Analysis on geothermal resources in kaifeng depression geothermal field of henan province. J. Southwest Univ. Sci. Technol. 2009, 3, 014. [Google Scholar]
  40. Wang, X.-Y.; Li, J.-H.; Lin, X.-Y.; Han, P.-F.; Liao, Z.-S. Geothermal field characteristics in the kaifeng city. Adv. Water Sci. 2002, 13, 196–199. [Google Scholar]
  41. Chen, W.; Westerhoff, P.; Leenheer, J.A.; Booksh, K. Fluorescence excitation-emission matrix regional integration to quantify spectra for dissolved organic matter. Environ. Sci. Technol. 2003, 37, 5701–5710. [Google Scholar] [CrossRef] [PubMed]
  42. Marhuenda-Egea, F.; Martínez-Sabater, E.; Jordá, J.; Moral, R.; Bustamante, M.; Paredes, C.; Pérez-Murcia, M. Dissolved organic matter fractions formed during composting of winery and distillery residues: Evaluation of the process by fluorescence excitation–emission matrix. Chemosphere 2007, 68, 301–309. [Google Scholar] [CrossRef] [PubMed]
  43. Bieroza, M.; Baker, A.; Bridgeman, J. Classification and calibration of organic matter fluorescence data with multiway analysis methods and artificial neural networks: An operational tool for improved drinking water treatment. Environmetrics 2011, 22, 256–270. [Google Scholar] [CrossRef]
  44. Bagdonas, S.; Zurauskas, E.; Streckyte, G.; Rotomskis, R. Spectroscopic studies of the human heart conduction system ex vivo: Implication for optical visualization. J. Photochem. Photobiol. B Biol. 2008, 92, 128–134. [Google Scholar] [CrossRef] [PubMed]
  45. Zsolnay, A.; Baigar, E.; Jimenez, M.; Steinweg, B.; Saccomandi, F. Differentiating with fluorescence spectroscopy the sources of dissolved organic matter in soils subjected to drying. Chemosphere 1999, 38, 45–50. [Google Scholar] [CrossRef]
  46. Swietlik, J.; Sikorska, E. Characterization of natural organic matter fractions by high pressure size-exclusion chromatography, specific uv absorbance and total luminescence spectroscopy. Pol. J. Environ. Stud. 2006, 15, 145. [Google Scholar]
  47. Aitken, A.; Learmonth, M.P. Protein determination by UV absorption. In The Protein Protocols Handbook; Walker, J.M., Ed.; Humana Press: New York, NY, USA, 2002; pp. 3–6. [Google Scholar]
Figure 1. Location of geothermal well in study area.
Water 09 00266 g001
Figure 2. Changes of several parameters with well depth. (a) Changes of temperature with well depth; (b) Changes of pH value with well depth; (c) Changes of electrical conductivity (EC) with well depth; (d) Changes of total dissolved solids (TDS) with well depth; (e) Changes of specific UV absorbance (SUVA) with well depth; (f) Changes of dissolved organic carbon (DOC) with well depth.
Water 09 00266 g002
Figure 3. Three-dimensional excitation-emission matrix (EX, EM) fluorescence spectroscopy of dissolved organic matter (DOM) in typical water samples from each geothermal reservoir in Kaifeng. (a) Three-dimensional excitation-emission matrix fluorescence spectroscopy of DOM in water samples from depths between 600 m and 800 m; (b) Three-dimensional excitation-emission matrix fluorescence spectroscopy of DOM in water samples from depths between 800 m and 1000 m; (c) Three-dimensional excitation-emission matrix fluorescence spectroscopy of DOM in water samples from depths between 1000 m and 1200 m; (d) Three-dimensional excitation-emission matrix fluorescence spectroscopy of DOM in water samples from depths between 1200 m and 1400 m; (e) Three-dimensional excitation-emission matrix fluorescence spectroscopy of DOM in water samples from depths between 1400 m and 1600 m.
Water 09 00266 g003aWater 09 00266 g003b
Figure 4. The distribution of fluorescence intensity in different thermal reservoirs.
Water 09 00266 g004
Table 1. Water quality characteristics of all geothermal water samples.
Thermal Reservoir (m)Well LocationWell Depth (m)StratumTemperature (°C)pH ValueEC (μs/cm)TDS (mg/L)UV254 (cm−1)DOC (mg/L)SUVA (L/m·mg)
600–800 mWell No. 1626Nm34.08.138555890.0244.5610.526
Well No.2799Nm45.08.278756030.0186.9190.260
Well No.3804Nm45.08.318876110.0116.5410.168
Well No.4803Nm42.08.169006210.0026.5340.031
Average value 41.58.22 879 6060.014 6.1390.228
800–1000 mWell No.5950Nm-Ng48.08.228756030.0047.0980.056
Well No.61001Nm48.08.198545880.0056.7310.074
Well No.71000Nm47.08.188746010.0046.8410.058
Well No.81087Ng53.58.089966880.0047.3690.054
Well No.91000Nm40.08.188545870.0057.2090.069
Average value 47.38.178916130.0047.0500.057
1000–1200 mWell No.101202Nm51.08.189696700.0048.3050.048
Well No.111250Ng53.08.198766030.0059.7880.051
Well No.121205Ng52.58.219116270.00310.3620.029
Well No.131254Nm53.58.1012248580.00411.7540.034
Well No.141139Nm-Ng57.07.5812788970.01610.4710.153
Well No.151201Nm55.08.0810647390.0039.7310.031
Well No.161206Ng54.08.268756020.0058.9530.056
Well No.171251Nm53.08.1811077710.0078.6020.081
Well No.181200Nm52.08.129486550.0059.6970.052
Well No.191200Nm50.58.0410387200.00410.2790.039
Well No.201200Nm54.07.9110307140.00210.8180.018
Average value 53.28.0810297140.0059.8870.051
1200–1400 mWell No.211350Ng50.09.3311848270.0059.3310.054
Well No.221380Ng55.07.9611608090.0059.2960.054
Well No.231350Ng56.08.0010247110.0059.8810.051
Well No.241363Ng63.08.0212818990.0119.2410.119
Well No.251354Ng66.07.9212638860.00611.8250.051
Well No.261350Ng56.08.0011808240.0049.5850.042
Well No.271370Ng57.08.1111688150.00810.4930.076
Average value 57.68.191180824 0.006 9.9500.060
1400–1600 mWell No.281635Ng70.07.7414079930.10210.7760.947
Well No.291627Ng61.07.7913099190.01410.9660.128
Well No.301620Ng64.07.9012058430.0079.8890.071
Well No.311638Ng65.07.43347026400.00411.4840.035
Average value 65.07.72184813490.03210.7790.297
Notes: EC: Electrical conductivity; TDS: Total dissolved solids; UV254: Ultraviolet absorption; DOC: Dissolved organic carbon; SUVA: Specific UV absorbance; Nm: Neogene Minghuazhen; Ng: Neogene Guantao.
Table 2. Correlation among different fluorescence peaks of DOM in Kaifeng geothermal water samples.
FIFI(I)FI(II)FI(III)FI(IV)FI(V)
FI(I)1.0000
FI(II)0.9197 **1.0000
FI(III)0.6084 **0.7671 **1.0000
FI(IV)0.7750 **0.8718 **0.5284 *1.0000
FI(V)0.4891 *0.6695 **0.9726 **0.4706 *1.0000
Notes: * is significantly related to the 0.01 level; ** is significantly related to the level of 0.001.
Table 3. Volume integral of different area in excitation-emission matrix (EEM) spectra of DOM in each geothermal reservoir.
Region600–800 m800–1000 m1000–1200 m1200–1400 m1400–1600 m
integral standard volume Фi (au·nm2)I215.93113.02131.1223.4411.53
II292.73204.58216.55112.11106.91
III58.9880.1290.9886.75107.16
IV243.03152.76145.6881.9274.23
V53.2246.5653.8285.72116.63
TOT863.89597.03638.15389.94416.47
Proportion Pi (%)I25.0019.2020.895.722.72
II33.8934.1033.1728.5425.65
III6.8313.2914.0222.4325.75
IV28.1325.4523.4421.1217.88
V6.167.978.4722.1828.01

