Article

Effects of Local Weather Variation on Water-Column Stratification and Hypoxia in the Western, Sandusky, and Central Basins of Lake Erie

by
Melanie M. Perello
1,*,†,
Douglas D. Kane
1,2,
Phoenix Golnick
1,‡,
Maya C. Hughes
1,§,
Matt A. Thomas
1 and
Joseph D. Conroy
3,‖
1
Franz Theodore Stone Laboratory, The Ohio State University, Put-In-Bay, OH 43456, USA
2
Natural Sciences and Mathematics Division, Defiance College, Defiance, OH 43512, USA
3
Limnology Laboratory, Department of Evolution, Ecology, and Organismal Biology, The Ohio State University, Columbus, OH 43210, USA
*
Author to whom correspondence should be addressed.
Present address: Department of Earth Sciences, Indiana University-Purdue University Indianapolis, Indianapolis, IN 46202, USA
Present address: Ohio Department of Transportation, 317 East Poe Road, Bowling Green, OH 43402, USA
§
Present address: L’Oréal USA, 7080 New Buffington Road, Florence, KY 41042, USA
Present address: Inland Fisheries Research Unit, Ohio Department of Natural Resources, Division of Wildlife, 10517 Canal Road SE, Hebron, OH 43025, USA
Water 2017, 9(4), 279; https://doi.org/10.3390/w9040279
Submission received: 8 February 2017 / Revised: 29 March 2017 / Accepted: 9 April 2017 / Published: 16 April 2017

Abstract

:
Hypoxia, low dissolved oxygen (DO) concentrations (<2 mg/L), has been a major issue in Lake Erie for decades. While much emphasis has been placed on biological factors, particularly algal blooms, contributing to hypolimnetic oxygen depletion, there has been little focus on the role of weather. For this study, we monitored water temperature and DO concentrations at sites in the western, central, and Sandusky basins in Lake Erie during June and July 2010–2012. We then compared trends in stratification and DO concentrations to weather patterns during that period. We found that during those three years, there was significant variation in weather patterns, particularly decreased ice coverage and increased storm events in 2012. These weather patterns corresponded to 2012 having the warmest water temperatures, some of the lowest DO concentrations, and a deeper and thinner hypolimnion (especially in the central basin) than the previous years. We found a relationship between weather and hypoxia, providing further evidence for why these basins are susceptible to low DO conditions during summer months. The role of weather in hypoxia is another indication that the lake is vulnerable to effects of climate change and should be considered in management strategies.

1. Introduction

Hypoxia (dissolved oxygen (DO) concentrations <2 mg/L) and subsequently, anoxia (DO = 0 mg/L), no dissolved oxygen, have a wide-range of effects on aquatic organisms and communities [1]. Most aquatic organisms are only able to tolerate environments with sufficient dissolved oxygen levels including most fish species, which are unable to tolerate DO < 4 mg/L [2]. The occurrence of hypoxia in Lake Erie, particularly in the central basin, have been observed and studied in Lake Erie since 1929 [3], but the recent increases in hypoxia incidents have led to renewed interest in the phenomenon [1,4]. Since the mid-1990s, frequency of hypoxia has increased and led to the call for further decreases in nutrient loading to the lake [5].
Lake Erie is the smallest of the Laurentian Great Lakes and is comprised of three main basins: western, central, and eastern [6]. Lake Erie, due to the high influx of nutrients from tributaries, such as the Maumee and Sandusky Rivers, is able to support high species diversity [7]. This makes Lake Erie a center for fishing and tourism with an annual revenue of over 10 billion dollars and employing over 100,000 people [8]. Its shallow depth and high nutrient influx makes Lake Erie more susceptible to oxygen depletion, particularly the central basin [9]. Hypoxia is a significant threat to the fishing and tourism industries which has prompted many studies on the causes of this condition.
Sufficient levels of dissolved oxygen are dependent on physical processes to dissolve atmospheric oxygen into the body of water and then on vertical-mixing to distribute the dissolved oxygen throughout the body of water [10]. Vertical-mixing is prevented, however, by the vertical layering or stratification of different temperatures of water during both summer and winter. Water-column stratification results in the formation of three layers of water: the epilimnion (uppermost) layer is the warmest water, the metalimnion (intermediate) layer is the region of sharp temperatures differences, and the hypolimnion (bottom) is the coldest layer [10]. The different densities of each layer prevent exchange of dissolved oxygen between the layers, making the hypolimnion vulnerable to developing hypoxia.
The causes of hypolimnetic oxygen depletion have been attributed to the combined effects of stratification and nutrient loading. The predominant hypothesis is that cultural eutrophication promoted increased algal production resulting in higher biological oxygen demand [3]. Other studies found that there is a close relationship between biological production and hypolimnetic oxygen depletion rates and that those rates, corrected for vertical-mixing and other physical factors, have been increasing overall since 1929 [11,4]. The hypothesized connection between cultural eutrophication and hypolimnetic oxygen depletion led to the Great Lakes Water Quality Agreement between the U.S. and Canada that stipulated a limit on nutrient loading (11,000 metric tons annually) into the Great Lakes [12]. More recent studies have focused on the effects of the morphometry of Lake Erie on oxygen depletion, which suggests that hypoxia is related mostly to the depth and thickness of the hypolimnion [3].
Despite the U.S. and Canada meeting its nutrients loading goals in most years, hypolimnetic oxygen depletion in Lake Erie has continued indicating that cultural eutrophication is not the only cause [1]. Recent studies have since turned their focus to environmental factors, mainly changes in local climate and weather. Weather is known to have a very strong influence on both the thermal cycle and stratification of Lake Erie [13], but the connection to oxygen depletion is not well understood. Another study analyzed the relationship between strong storm events and oxygen dynamics, expecting that storm events could promote vertical-mixing and oxygenation [14]. They found that storms promoted vertical-mixing during typical times of turnover in the spring and fall, but had little affect when the water was already stratified in summer and winter. Weather has been recognized as playing a role on the biological community, with changes in circulation impacting the intensity of harmful algal blooms (HABS) [15].
A better understanding of the impacts of weather on stratification and oxygen depletion is needed, because of climate change. Lake Erie is being affected by climate change, average temperatures in Lake Erie have been increasing on average by about 0.37 °C each year from 1983 to 2002 [16]. In order to better assess the relationship between weather variations and hypoxia, we monitored dissolved oxygen concentrations and water temperatures yearly from late-June to mid-July and compared our observations to variations in local weather, such as precipitation and average air temperatures. We expected to see that lower precipitation levels and higher air temperatures would reduce vertical-mixing, resulting in greater oxygen depletion in the hypolimnion. We also expected that higher wind speeds and numbers of storm events would also promote vertical mixing.

2. Materials and Methods
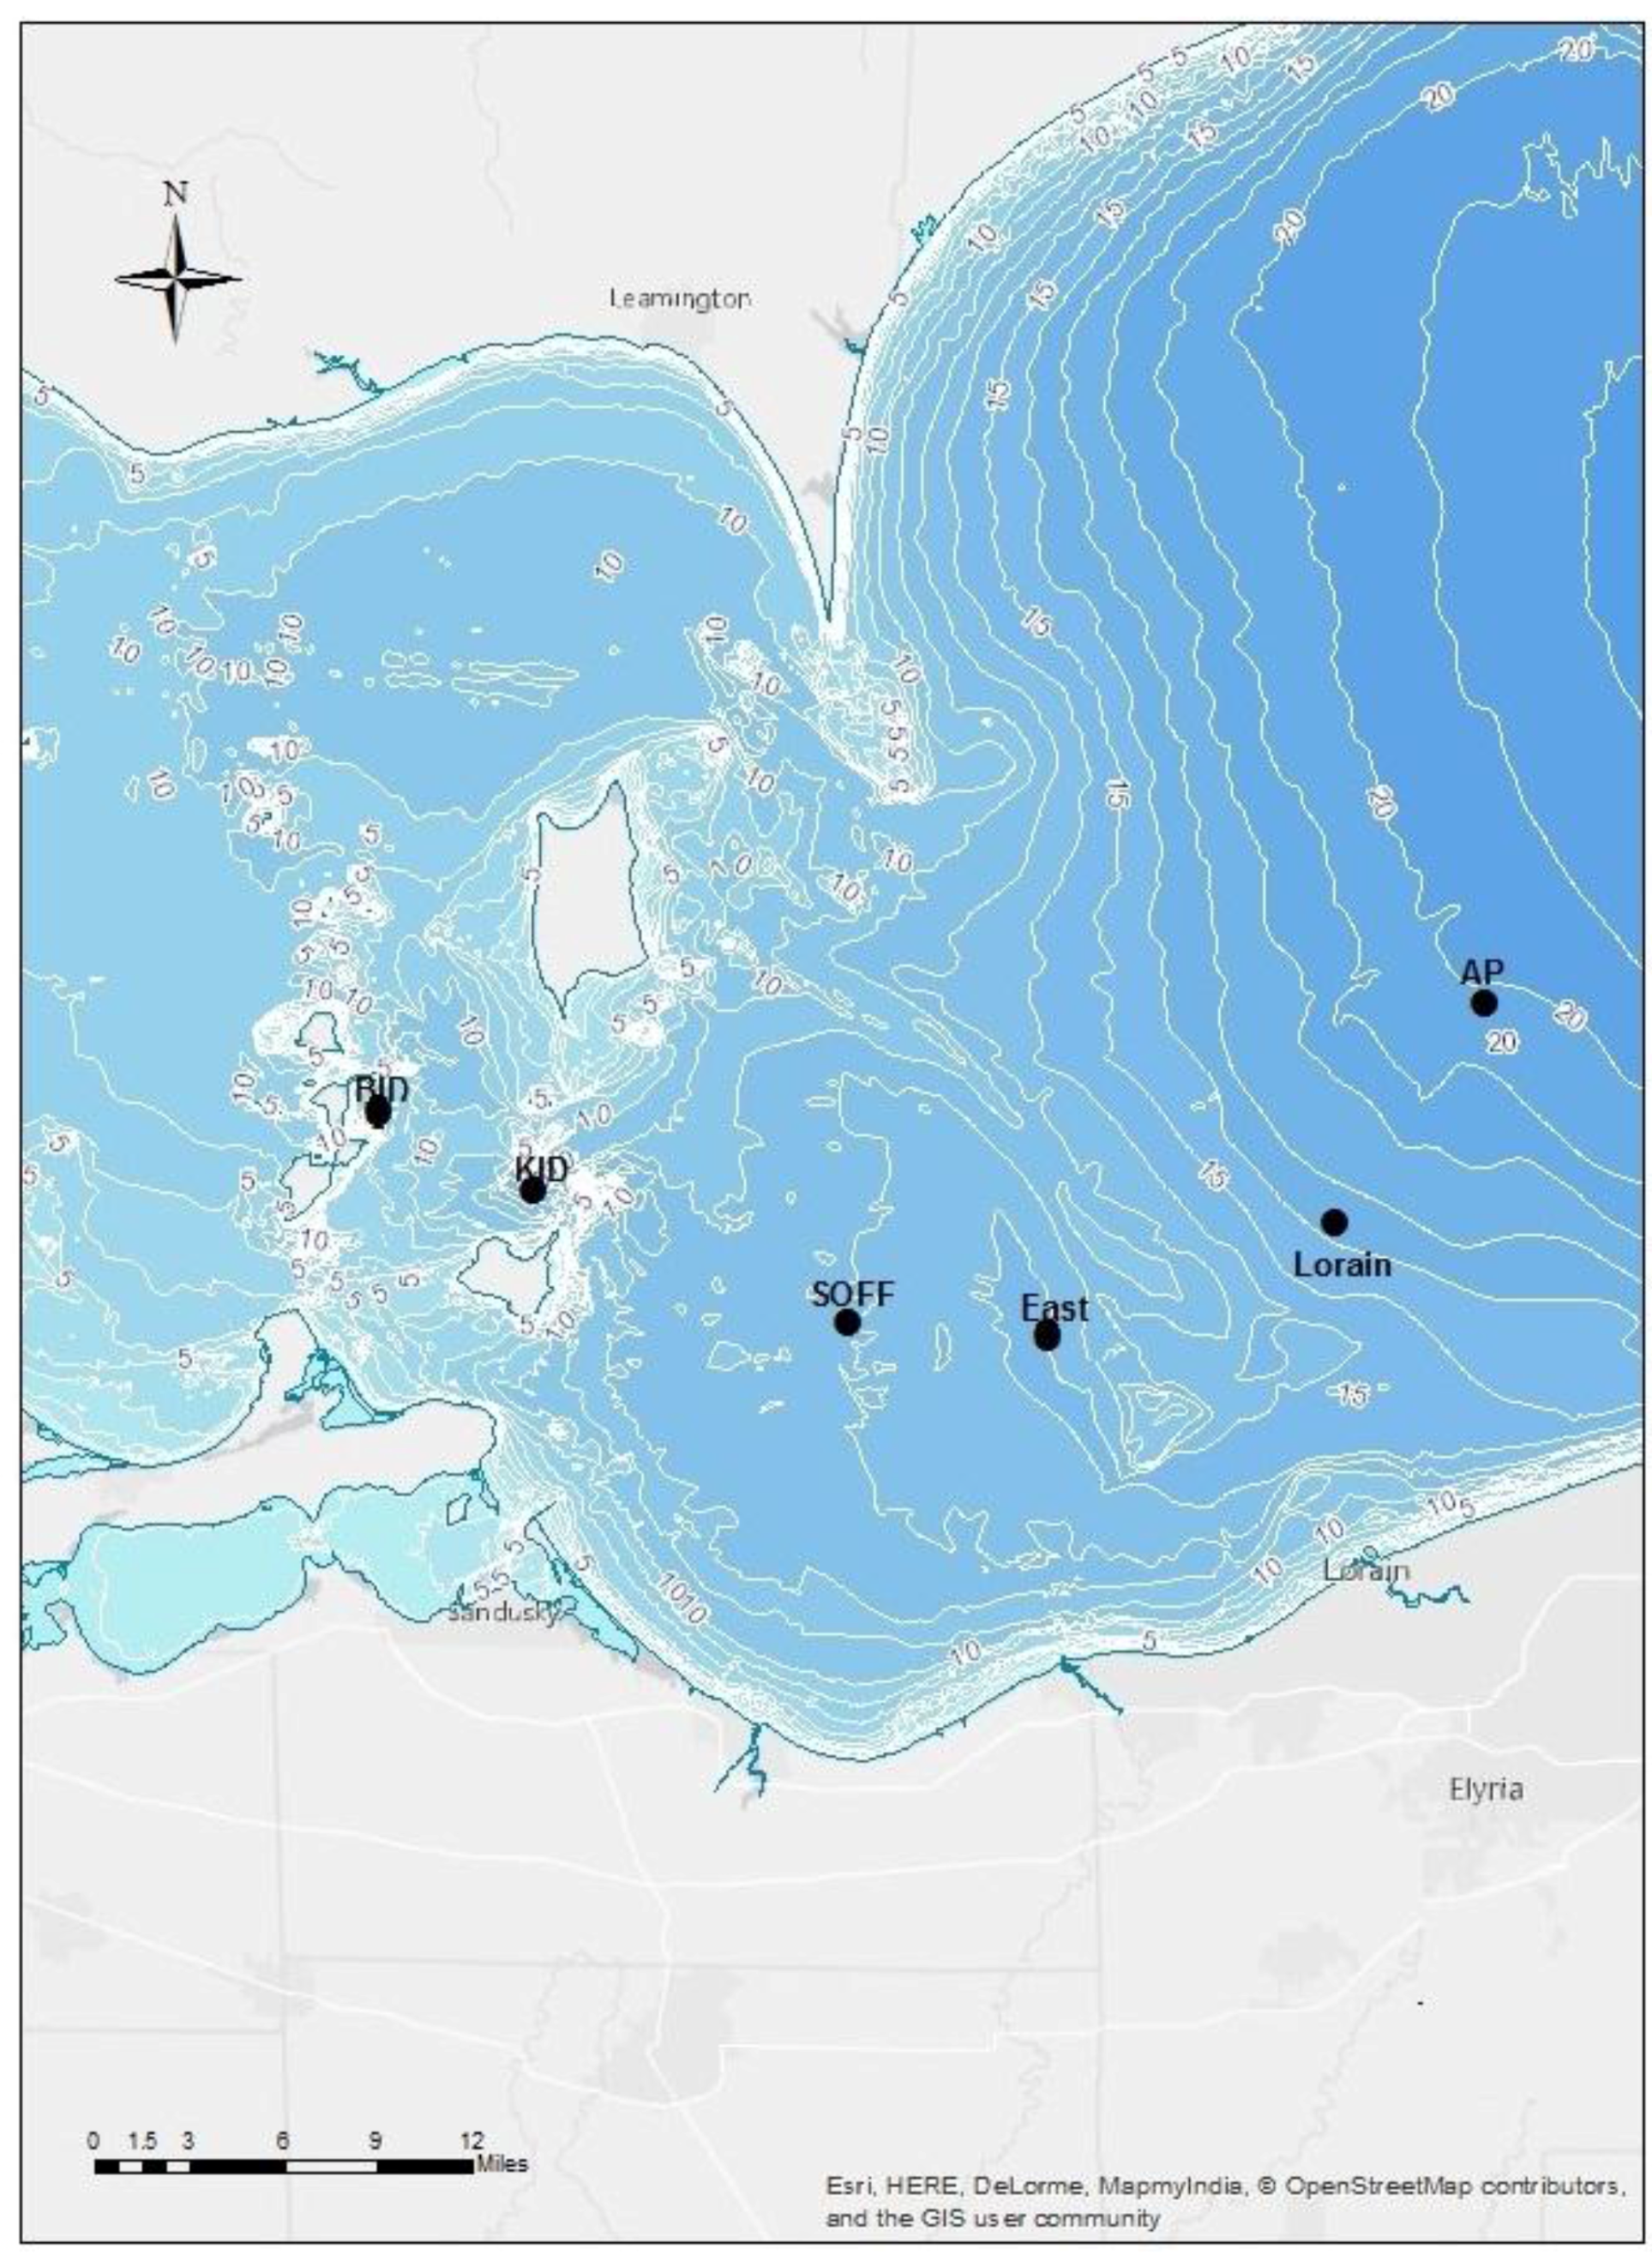
2.1. Field Study

Monitoring of stratification and hypoxia was conducted at six study sites within the western (Ballast Island Deep (BID); Kelley’s Island Deep (KID) and central basins (Lorain; Avon Point (AP)) and the Sandusky Subbasin (East Sandusky Subbasin (East); Sandusky Subbasin Offshore (SOFF); Figure 1). The western basin (mean depth = 7.4 m, [6]) is the shallowest basin in Lake Erie, which typically prevents prolonged stratification and oxygen depletion. In contrast with the western basin, the central basin (mean depth = 18.5 m [6,17]) is deeper allowing for prolonged stratification and hypolimnetic oxygen depletion. Within the central basin, the Sandusky Subbasin (mean depth = 13.3 m, [17]) comprises the shallowest region, and has become an important study area as it is subject to high nutrient loadings from the Sandusky River, with a high human impact from both agricultural and developed land use in the watershed [18]. The rationale for the selection of these sites was to represent the deeper, comparable bathymetries in each basin. However, there is always a potential for bias in the results as we were not able to extensively sample each basin due to time constraints.
At each site, a multi-parameter sonde (YSI 6600 V2) was used to record water temperature and concentrations of dissolved oxygen at every half meter of depth. We visited each site weekly between late-June and mid-July 2010–2012 (week one sampling event: 7/1/2010, 6/30/2011, 6/28/2012; week two sampling event: 7/7/2010, 7/9/2011, 07/6/2012; week three sampling event: 7/15/2010, 07/14/2011, 7/12/2012). This three-week time period allowed us to see the water already thermally stratified and to observe the first signs of hypoxia. We attempted to sample each site at the same time of day to reduce variation, but we recognize that there are daily fluctuations in stratification and hypolimnion depth which are influenced by internal currents and seiche [19]. For the purposes of this study, the site is considered stratified when a thermocline, a significant decrease in temperature over a small depth, is observed. Hypolimnion depth is defined as the depth below the hypolimnion. Please note that BID, Lorain, and Avon Point week two data are not presented here because weather prevented us from sampling these sites in all years. The temporal resolution of this project shows long-term responses to weather, with a focus on observing the first signs of hypoxia within each basin, after the establishment of stratification.

2.2. Data Analysis

Field data was analyzed graphically to determine stratification depths and the thickness of the hypolimnion. Variations in hypolimnion thickness between the years for the same site and between sites were analyzed with a two-way ANOVA. Variations in the concentrations of dissolved oxygen and water temperature between sites and years were analyzed using a two-way ANOVA.
Air temperature, wind speed, and wind gust data were collected from NOAA GLERL (Great Lakes Environmental Research Laboratory) Real-Time Meteorological Network [20] for March through June of 2010–2012. This air temperature and wind data was supplemented by the NOAA Data Buoy Center [21] to account for missing data during that time period. Water temperature data for March–June of 2010–2012 were also taken from the NOAA Data Buoy Center. Ice coverage data for the winter of 2009/2010 through the winter of 2011/2012 was compiled from Environment Canada [22]. Precipitation data for March through June of 2010–2012 was collected from the Cleveland Office of the National Weather Service [23]. We used our wind speed data to estimate the number of storm events on Lake Erie between March and June of 2010 through 2012 with a storm event defined as having wind speeds greater than 7 m/s for three or more hours for our analysis [24]. Statistical analysis of meteorological data utilized two-way ANOVA (air and water temperatures, precipitation, storm events) tests for determining whether sampling months and years were significantly different. Several datasets in this study were not complete due to the effects of inclement weather. Missing data may influence the statistical results, but was reduced by omitting those samples during analysis. Through the two-way ANOVA, both individual months and years were compared and statistical significance was met when p < 0.05.

3. Results

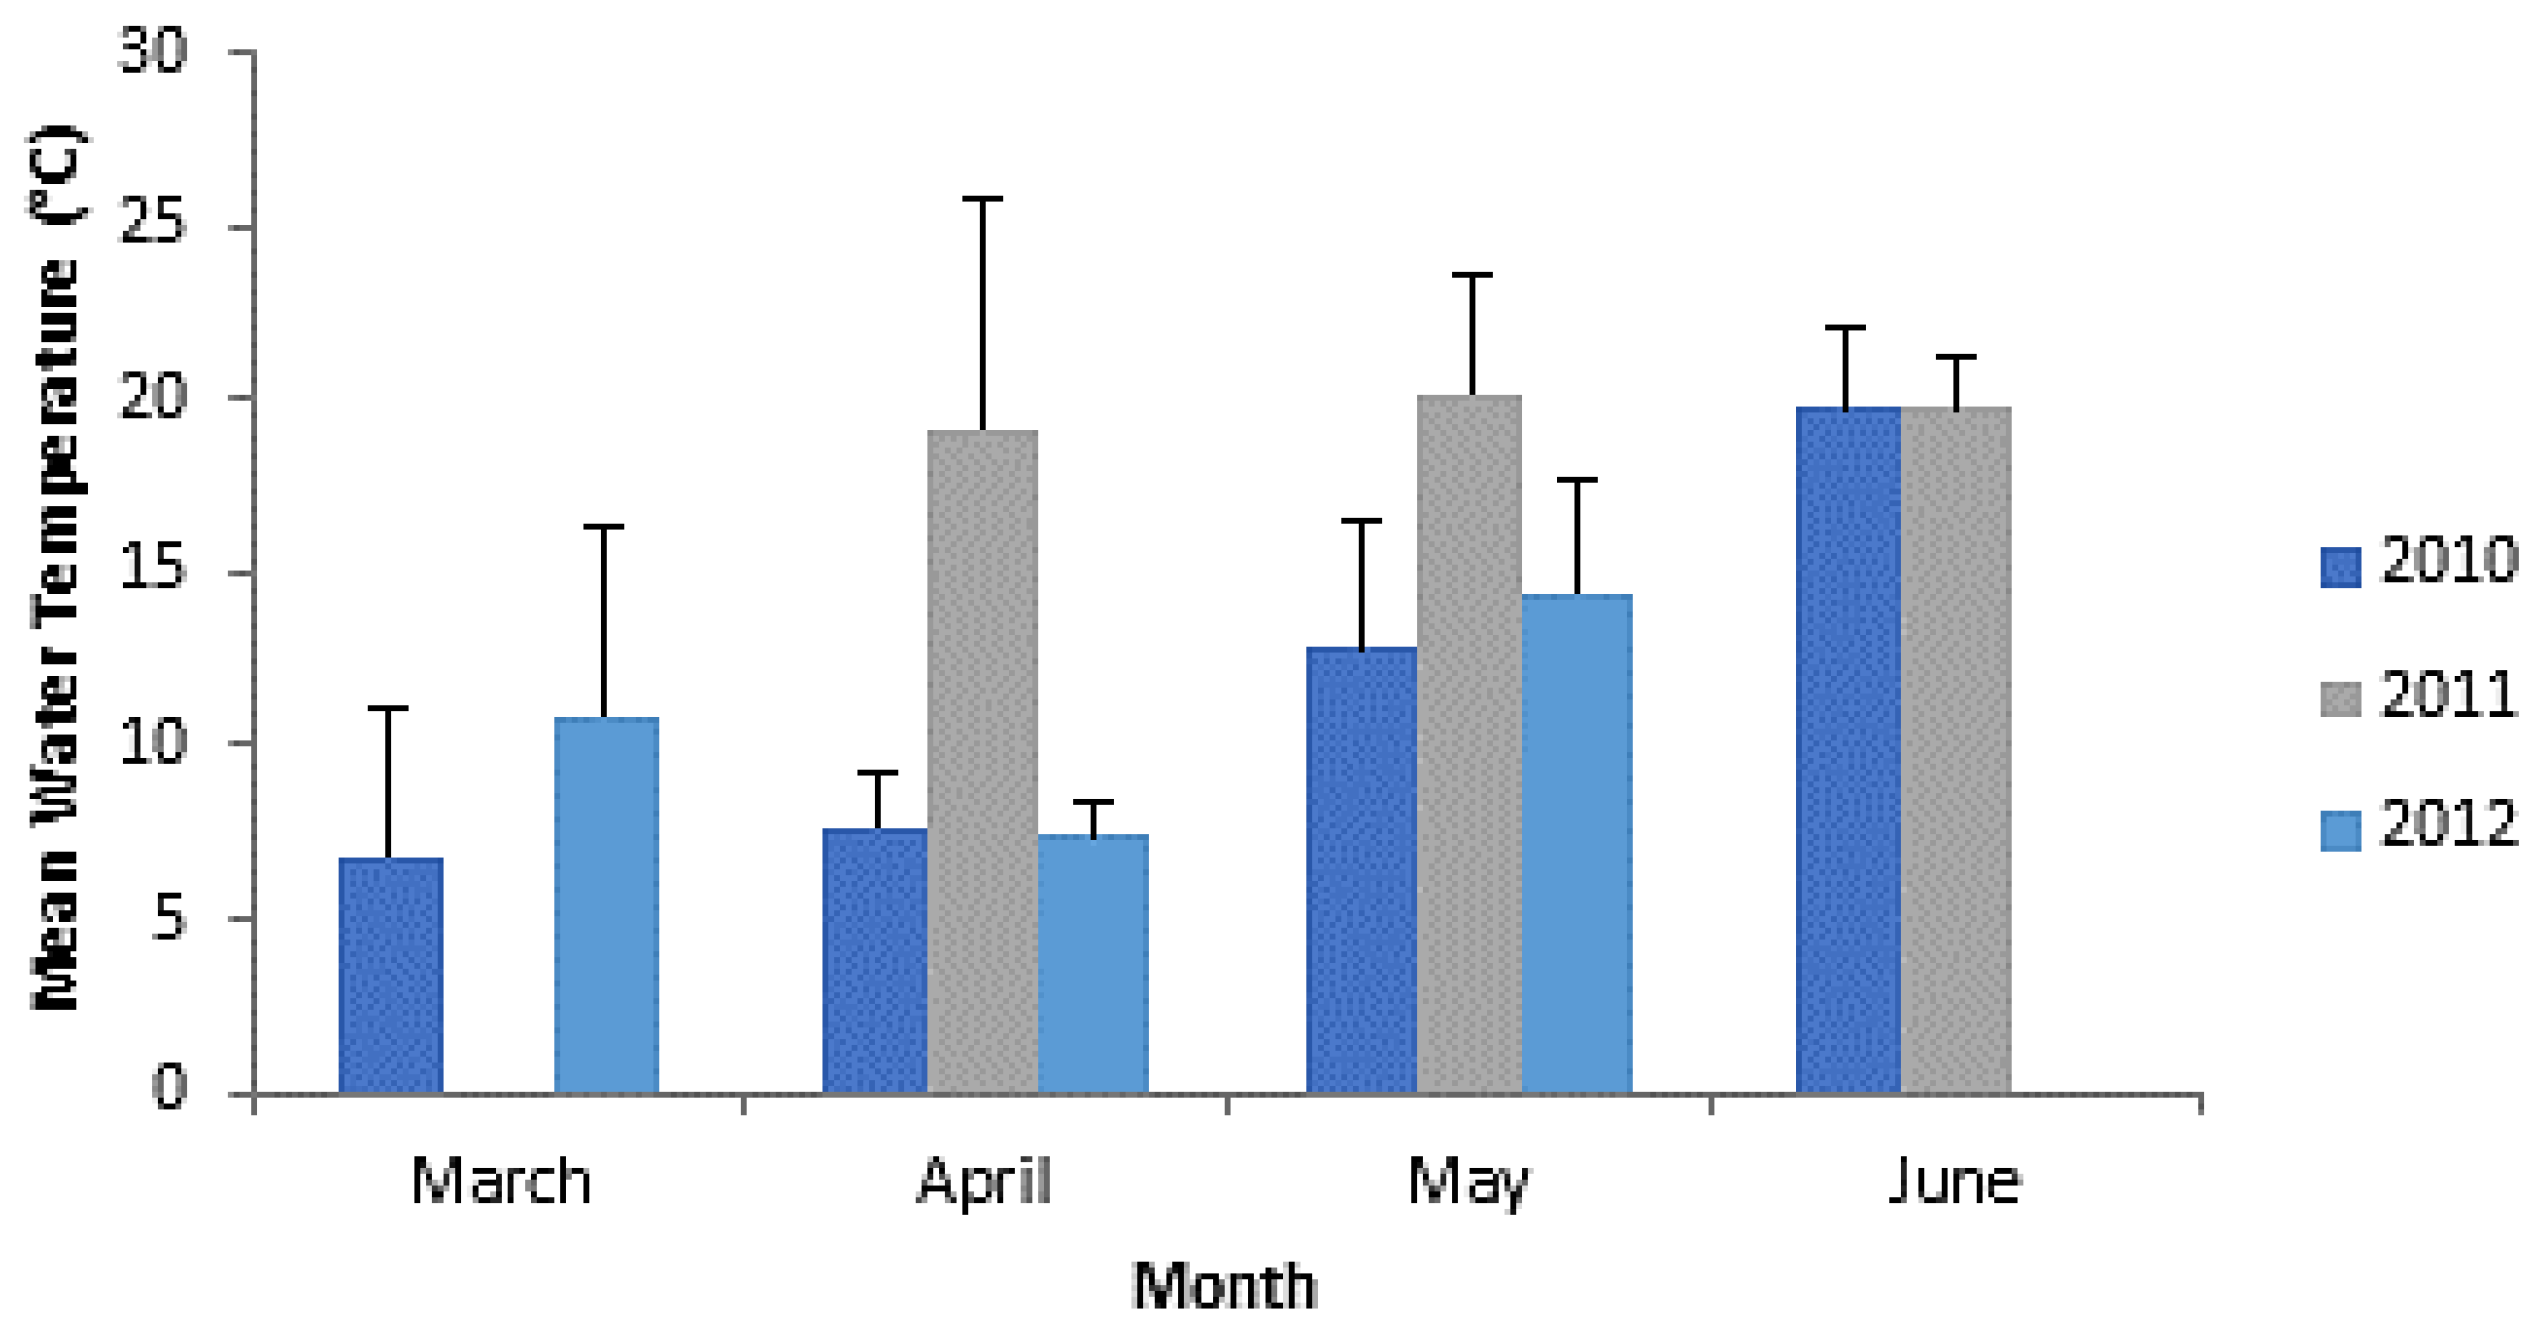
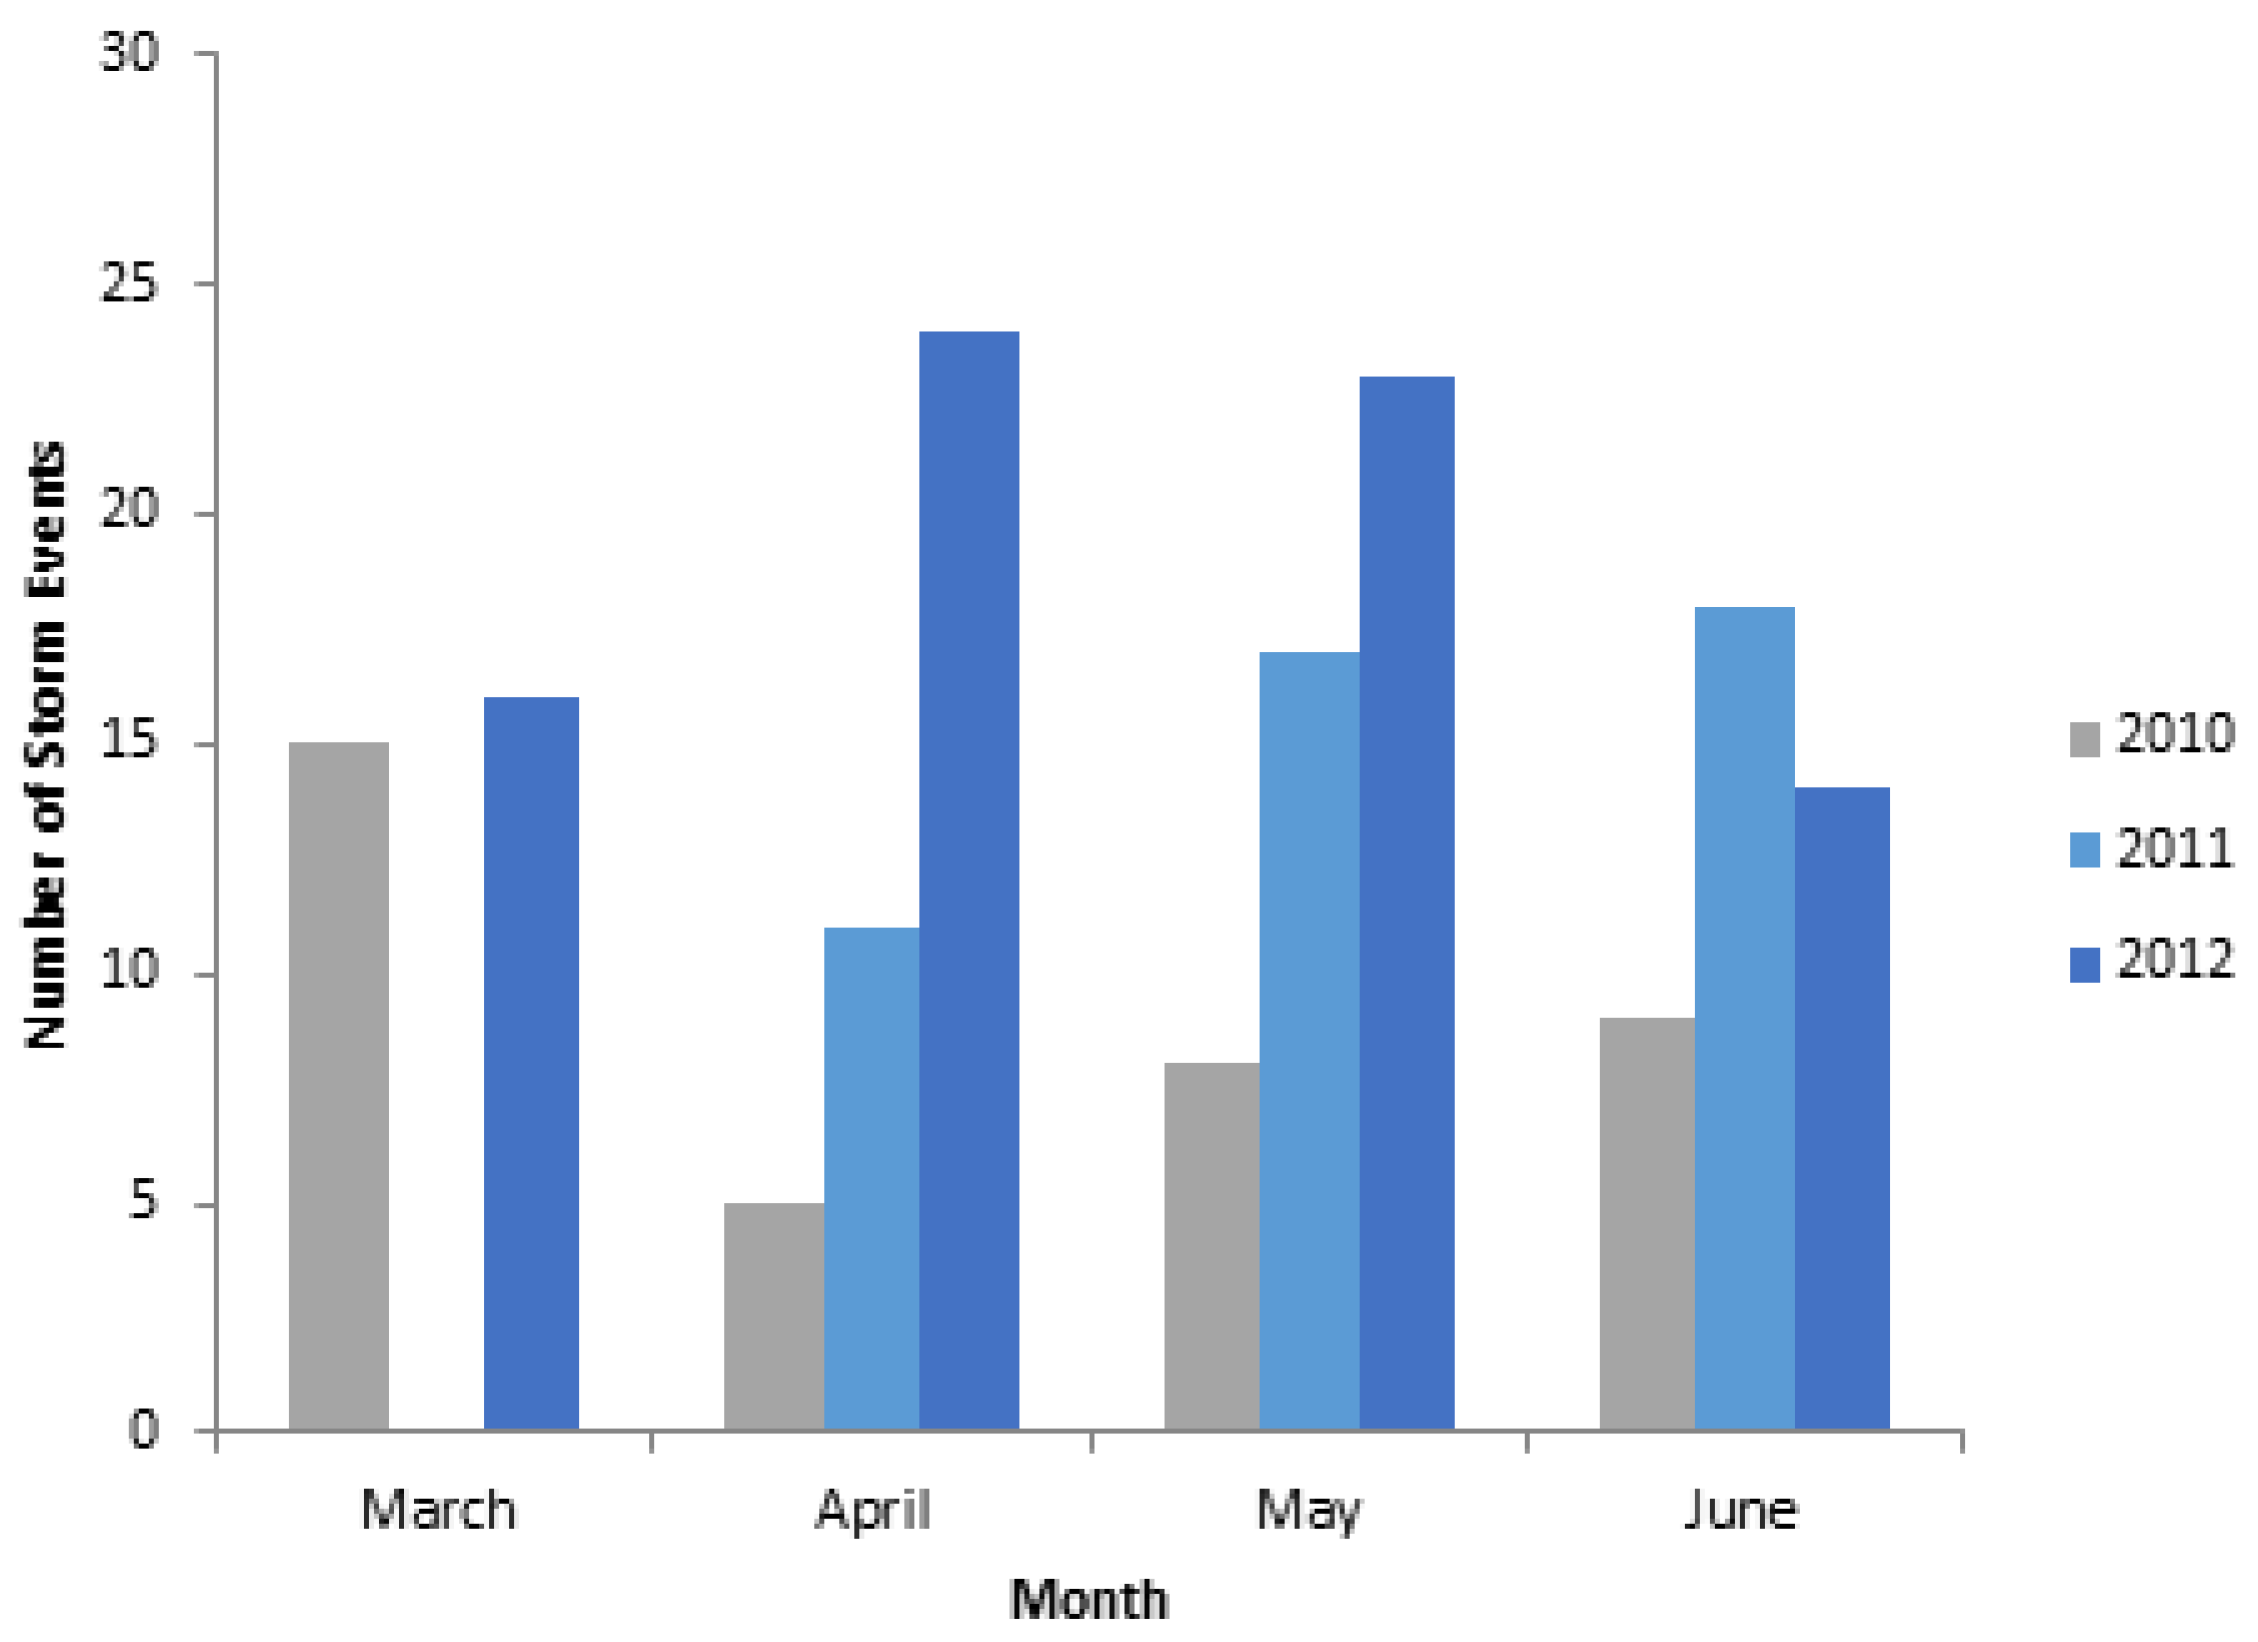
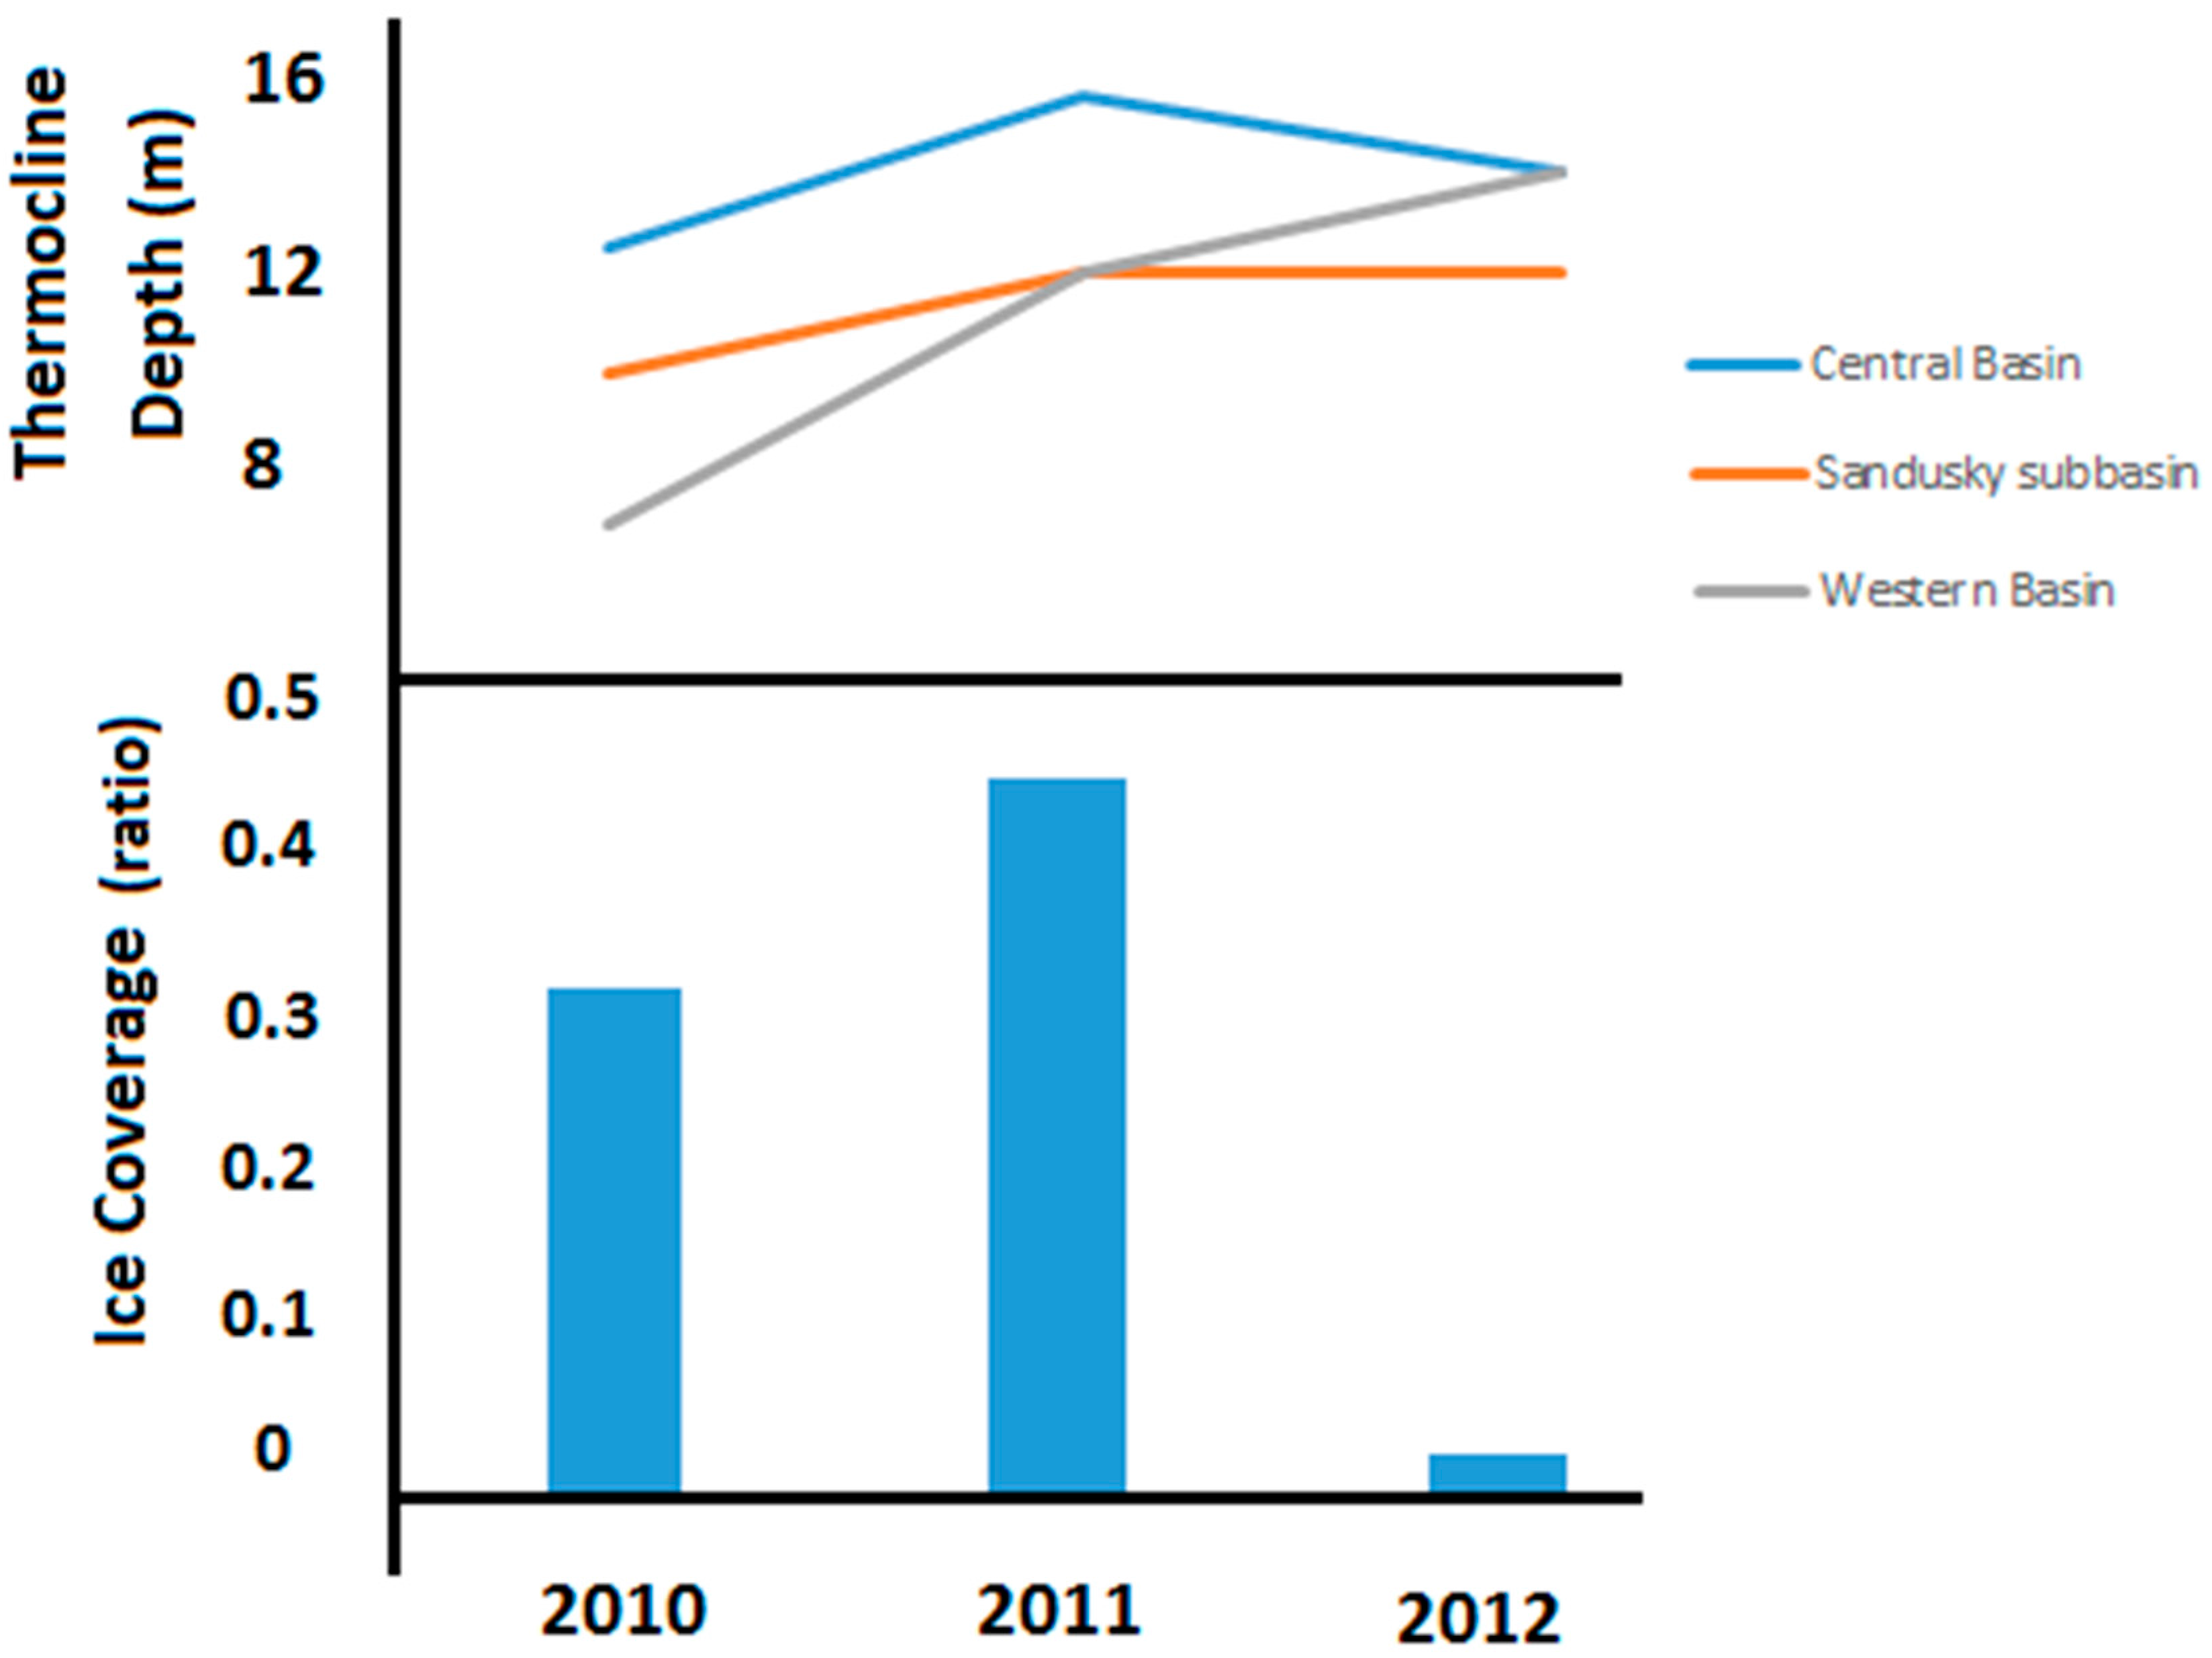
3.1. Variation in Weather

We found that mean air temperature (p = 0.07, F = 3.7, degrees of freedom (d.f.) = 2, 8) did not vary significantly between 2010 through 2012. We found that for the months of May and June, the year 2011 had lower mean air temperatures than both 2010 and 2012 which had very similar mean air temperatures for those same months. Looking at mean monthly water temperatures, we did not find significant overall variation between the three years (p = 0.34, F = 1.2, d.f. = 2, 9; Figure 2). We did find that 2011 had higher mean water temperatures than both 2010 and 2012 for April. The trend in 2011 with slightly higher water temperatures from April through May, but in June water temperatures were almost the same as the previous year. Related to both air and water temperatures, ice coverage varied between study years, with 2012 having less ice coverage (Figure 3).
Monthly precipitation showed great variation, but was not significantly different between the three years of the study (p = 0.88, F = 0.13, d.f. = 2, 9). However, there was a significant variation in number of storm events between the three study years (p = 0.04, F = 5.1, d.f. = 2, 8; Figure 4). We found that 2012 had more storms in both April and May than 2010 and 2011, but 2011 had more storms in June. No storm data were available for March 2011. We found no significant difference in daily mean wind gusts by month (p = 0.09, F = 3.2, d.f. = 2, 9) and daily mean wind speed by month (p = 0.6, F = 0.5, d.f. = 2, 9) between the study years. We found that mean wind gusts were lower in March of 2012 than in 2010 and that mean wind gusts were lower in both April and May of 2011 than in 2010 and 2012. For wind speeds, we also found that daily mean wind speeds are lower in both April and May of 2011 than in 2010 and 2012. However, we found that March of 2012 had greater daily mean wind speeds than in 2010.

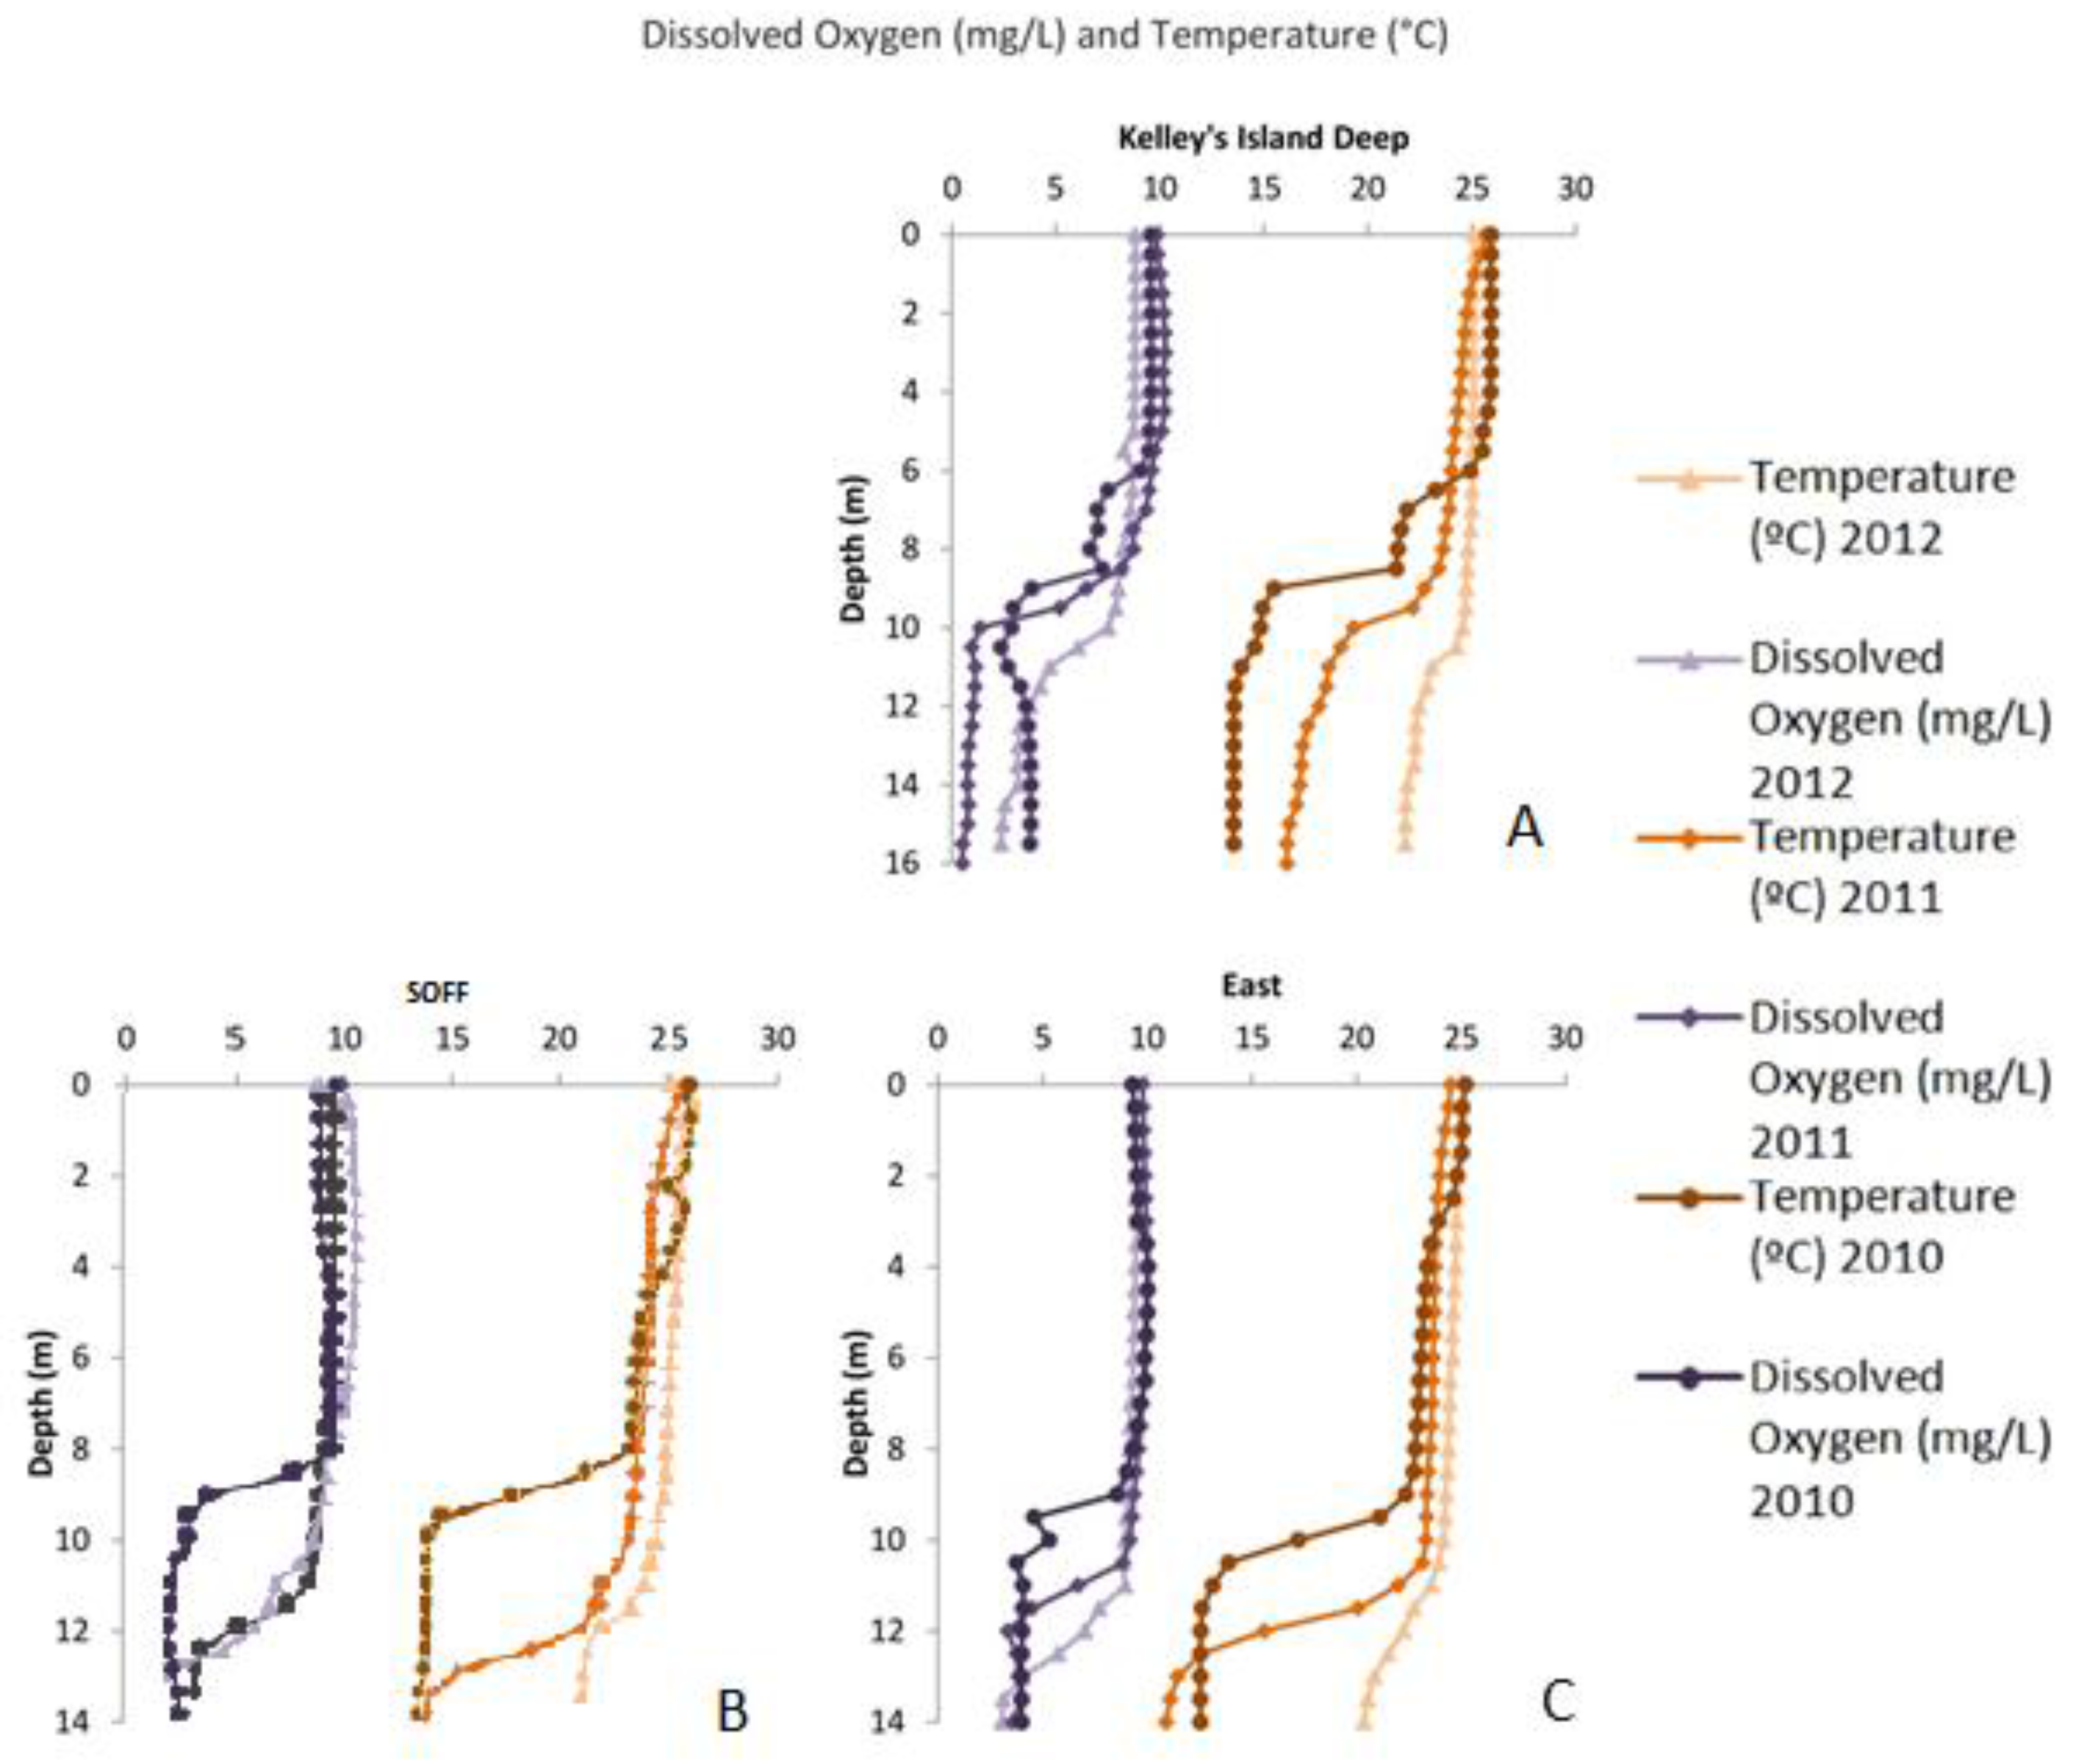
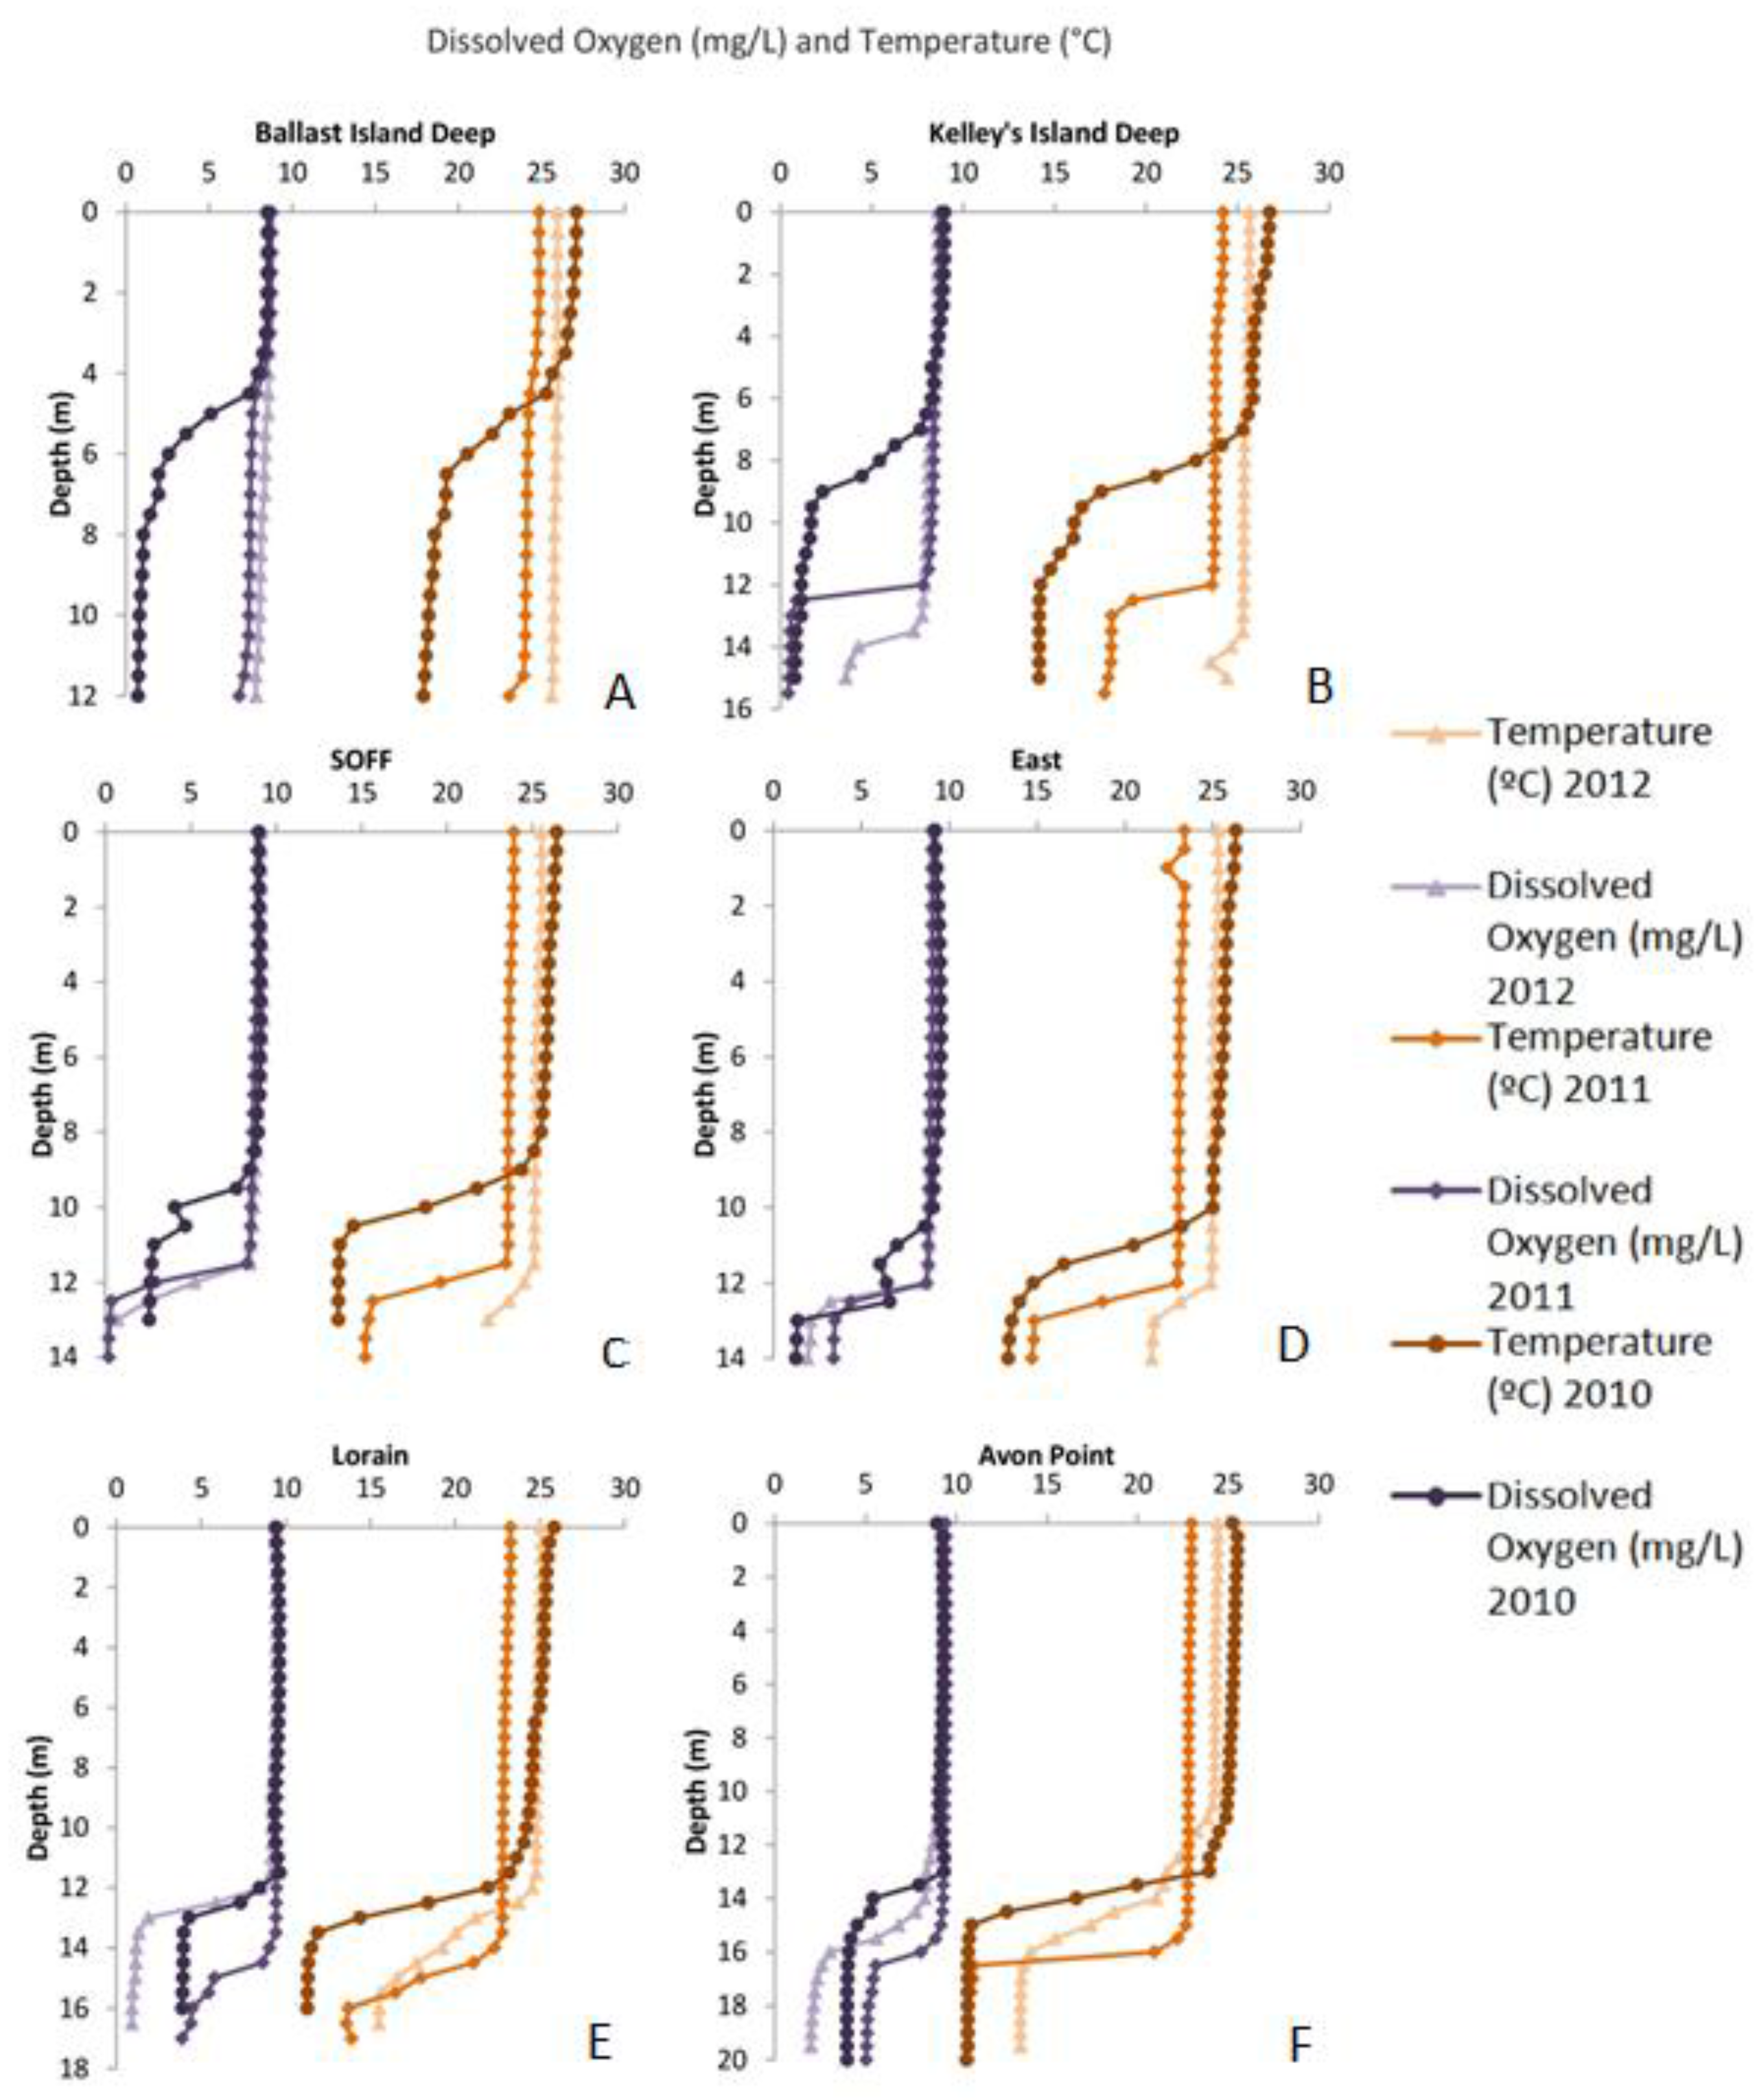
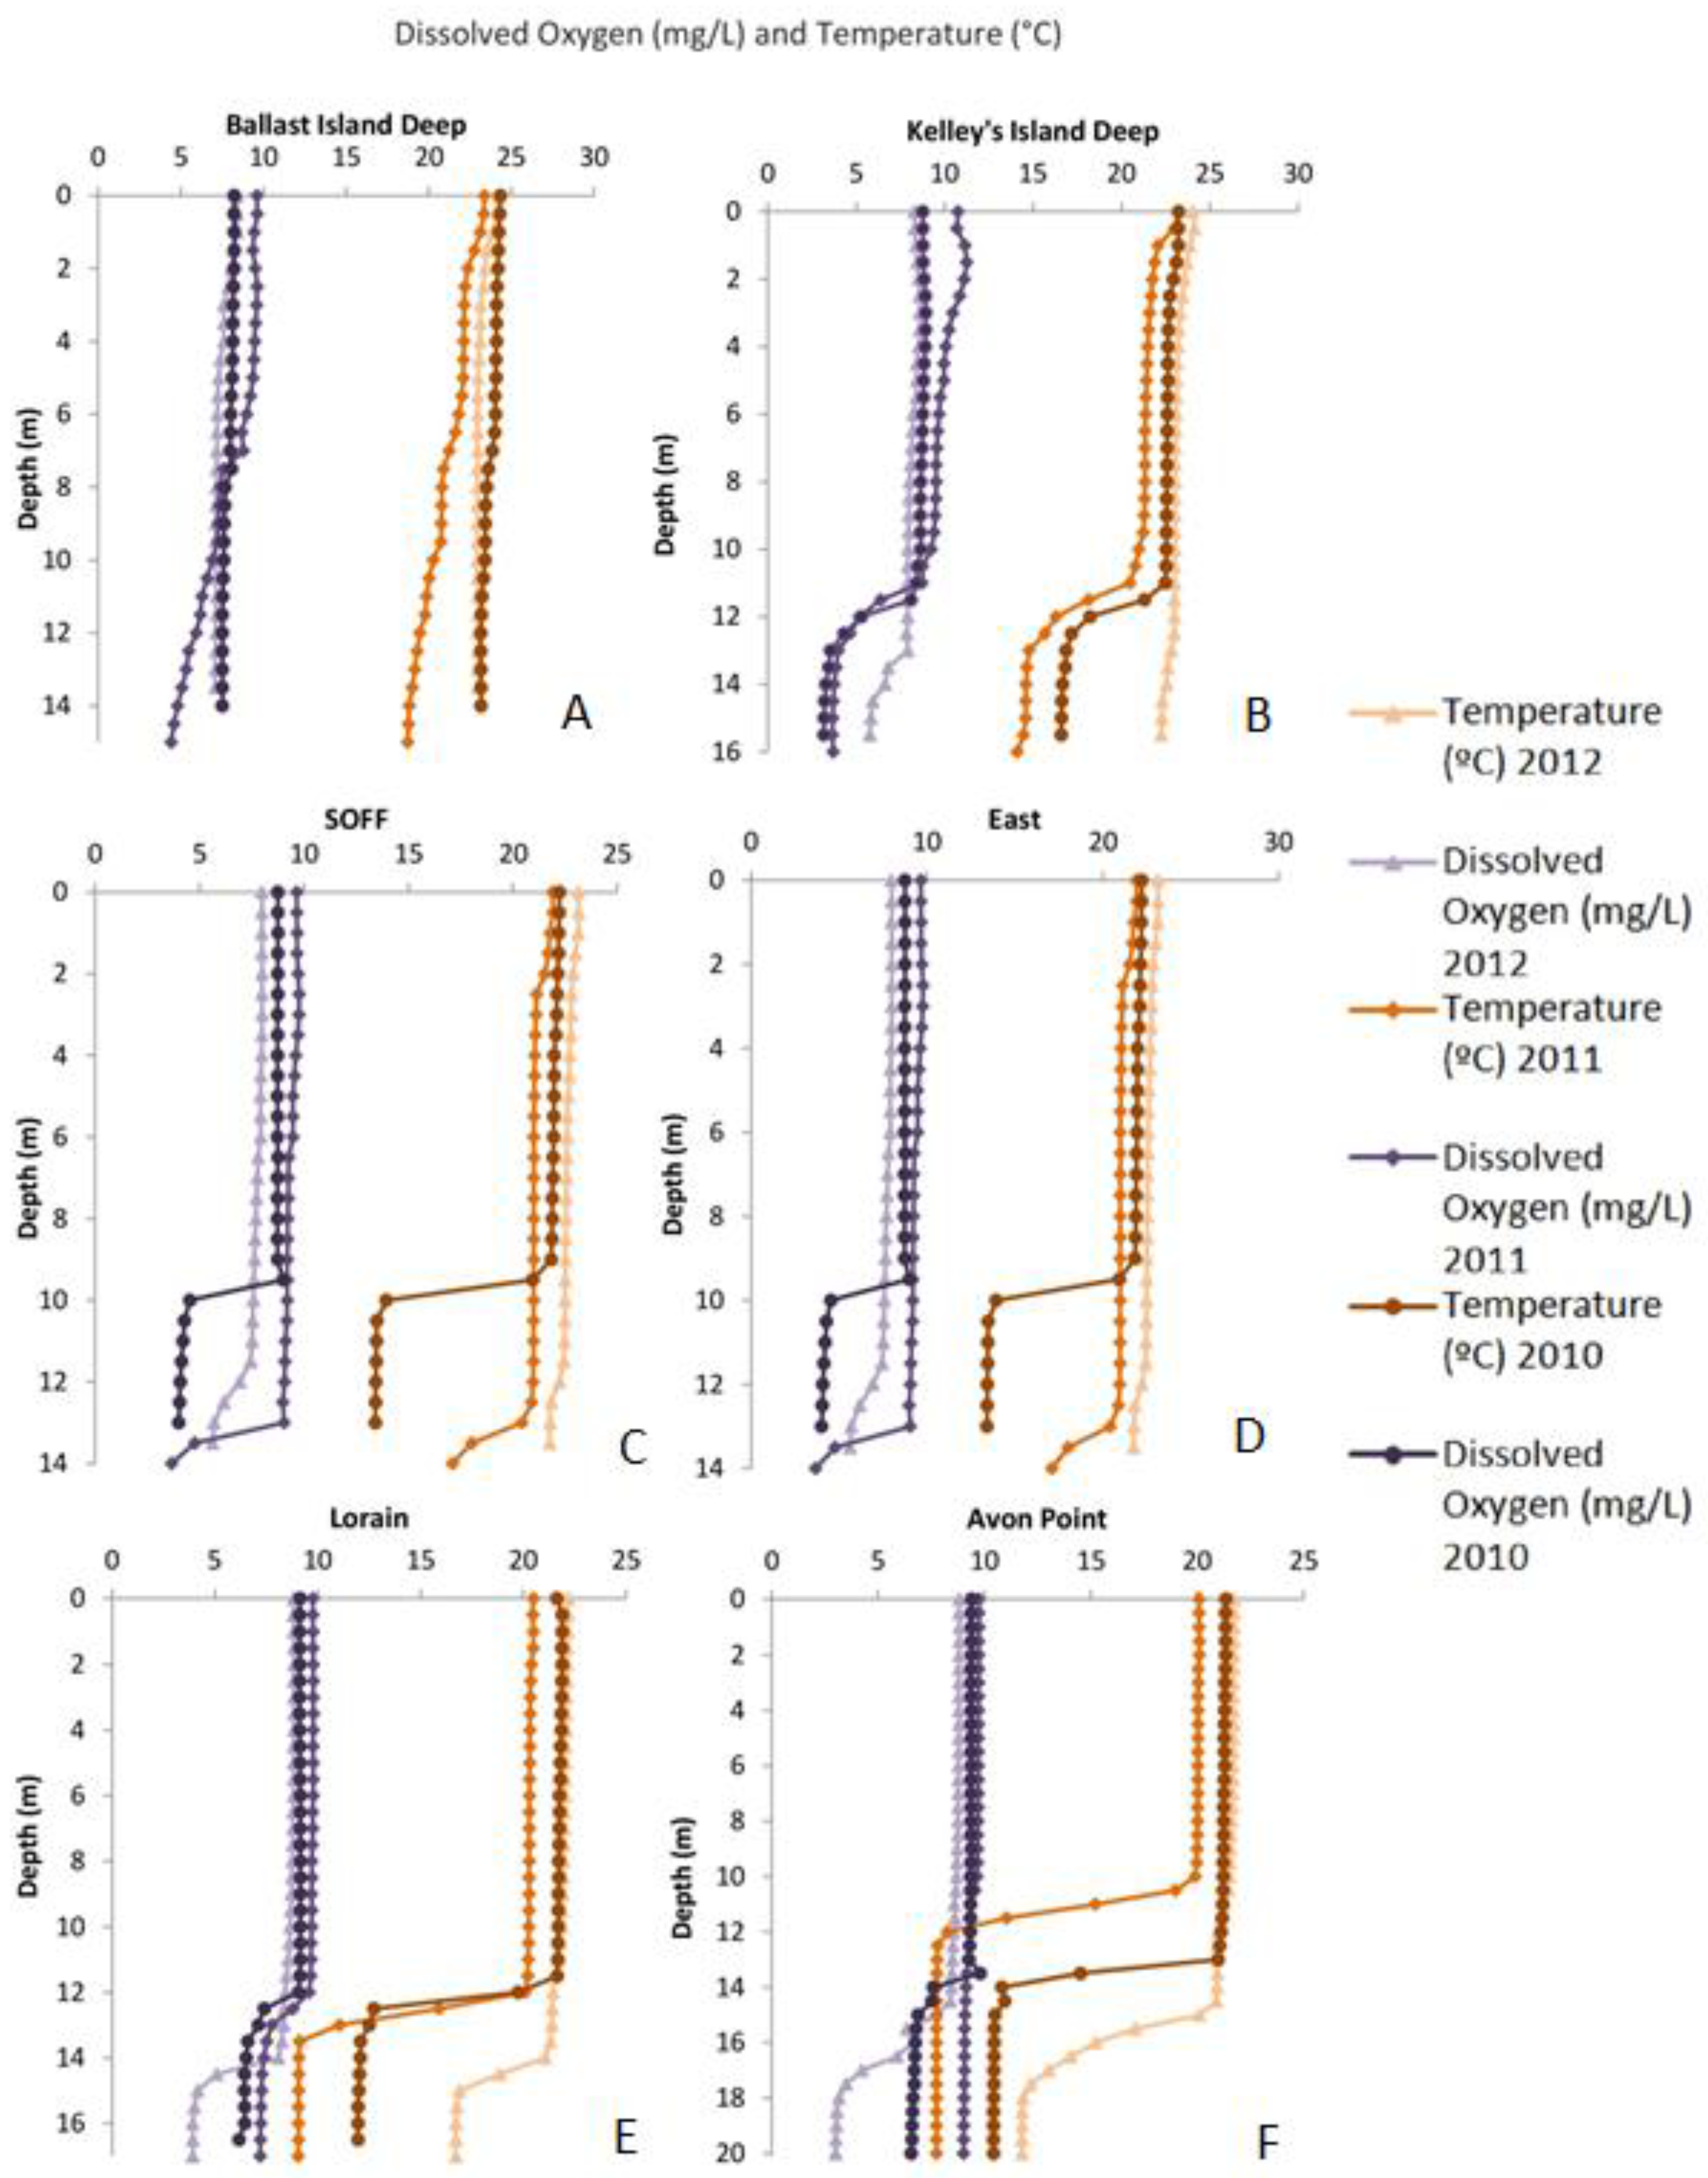
3.2. Variation within Sites and between Years

For the first week of the study, late-June/early-July, we found that there was wide variation in both dissolved oxygen levels and in water temperature between the three years of our study. Within the western basin we did not find consistent thermal stratification patterns between the study years. At BID, there was no stratification (presence of a thermocline) during our three study years due to its low water depth, but 2011 had the lowest water temperatures and dissolved oxygen concentrations in the hypolimnion (Figure 5A). At KID, we see that 2012 is the only year without a steep thermal stratification and with higher dissolved oxygen levels (Figure 5B). We obtained different patterns for thermal stratification and dissolved oxygen within the Sandusky Subbasin. At SOFF, we found that there was minimal stratification in both 2011 and 2012, but steep stratification in 2010 (Figure 5C). We also found that 2011 had lower dissolved oxygen levels than 2010 and 2012 (Figure 5C). At East, we found that both 2011 and 2012 have similar stratification patterns which have a thinner hypolimnion when compared to 2010, but 2012 has higher water temperature and hypoxia in the hypolimnion (Figure 5D). At Lorain, our first central basin site, we encountered higher water temperatures and lower dissolved oxygen concentrations in the hypolimnion than 2010 and 2011 (Figure 5E). At Avon Point, we found that the epilimnion had similar temperatures and dissolved oxygen concentrations for all three years, but that as water depth increased there was more variation between the years (Figure 5F). At greater depths, 2012 had higher water temperatures and lower dissolved oxygen concentrations than both 2010 and 2011 and had a deeper hypolimnion than both 2010 and 2011 for both Lorain and Avon Point (Figure 5E,F).
Comparing the depth of the hypolimnion for each stratified site during the first week of study, we found that the overall trend was an increased depth of the hypolimnion between the three years. We found that hypolimnion depths differed significantly over the study period (p = 0.03, F = 5.58, d.f. = 2, 4). Looking at hypolimnion thickness for each site over the years, we saw a decreasing trend from 2010 to 2012. We found that there was a significant difference in hypolimnion thickness between the three years in the study period (p = 0.02, F = 6.16, d.f. = 2, 4).
For the second week of the study, we found that our sites exhibited the same stratification patterns as seen in the first week, but that dissolved oxygen concentrations were more similar between the years. In the western basin, at KID, 2012 had higher water temperatures than previous years, but that 2011 was the only year that experienced hypoxia (Figure 6A). At SOFF, we found 2012’s warmer temperatures leading to a deeper stratification (Figure 6B). Although 2012 had deeper stratification and higher water temperatures, it had the highest levels of dissolved oxygen in the hypolimnion while 2011 had hypoxia (Figure 6B). At East, 2012 with its higher water temperatures had a much deeper stratification than both 2010 and 2011, but the dissolved oxygen levels in the hypolimnion are similar between the three years (Figure 6C). Within the central basin, 2012 had warmer water temperatures than both 2010 and 2011, but dissolved oxygen patterns were not consistent between sites (Figure 6B,C).
Unlike the first week of the study, there was less variation in hypolimnion depth and thickness between study years during the second week. We did not find any significant differences between the three years for either hypolimnion depth (p = 0.15, F = 3.25, d.f. = 2, 4) or hypolimnion thickness (p = 0.14, F = 3.28, d.f. = 2, 4).
During the third week of study, we saw similar trends in hypolimnion temperature and dissolved oxygen concentrations between the study years as seen in earlier weeks. When looking at the western basin, we found that 2012 had the greatest water temperatures with little to no stratification. For both 2011 and 2012, BID had deeper stratification and greatest dissolved oxygen levels than 2010 (Figure 7A). A similar pattern was seen at KID with 2012 having higher water temperatures than both 2010 and 2011 (Figure 7B). Both 2010 and 2011 were hypoxic during the third week of the study, but dissolved oxygen concentrations were higher in 2012 (Figure 7B). In the Sandusky Subbasin, hypoxia was seen in both 2010 and 2012 at this site with 2010 having the lowest levels of dissolved oxygen. At SOFF, 2012 had greater water temperatures and deeper stratification than previous years (Figure 7C). At East, in the Sandusky Subbasin, we found that 2012 had the greatest hypolimnetic water temperatures and a deeper stratification than 2010 and 2011 (Figure 7D). Both 2011 and 2012 had low dissolved oxygen concentrations with hypoxia conditions in the hypolimnia (Figure 7C,D). Within the central basin we see that temperature differences between the epilimnion and the hypolimnion correspond to lower dissolved oxygen concentrations. At Lorain and Avon Point, we found that 2012 had greater water temperatures and lower dissolved oxygen in the hypolimnion than both 2010 and 2011 (Figure 7E,F). At Lorain, we saw a deeper stratification pattern with 2012 having the highest hypolimnetic water temperature, but with 2011 having the lowest dissolved oxygen concentration (Figure 7E). This pattern for 2012 was consistent with our findings during the first week at Avon Point (Figure 7F).
Comparing the depth of the hypolimnion for each stratified site during the third week of study, we found that the overall trend was an increased depth of the hypolimnion between the three years. We found that hypolimnion depths differed significantly over the study period (p < 0.01, F = 33.3, d.f. = 2, 4). Looking at hypolimnion thickness for each site over the years, we saw a decreasing trend from 2010 to 2012. We found that there was a significant difference in hypolimnion thickness between the three years in the study period (p < 0.01, F = 14.8, d.f. = 2, 4). Large decreases in hypolimnion thickness were observed in several sites, including Avon Point, in the central basin, and KID, in the western basin.

4. Discussion

We found significant variation in lake ice coverage and storm events between the three study years (2010–2012). No significant variation was found in water temperature, precipitation, or wind speed. For thermal stratification, we found a trend of increasing depth for the hypolimnion with an associated decreased thickness over the three study years. Our results showed an overall significant variation in hypolimnetic water temperature and dissolved oxygen levels, with 2012 having the highest hypolimnetic water temperatures and deepest and thinnest hypolimnia. Patterns in dissolved oxygen concentrations varied greatly between the basins. In the central basin, we found that overall 2012 had the highest water temperatures, deepest hypolimnion, and lowest hypolimnetic dissolved oxygen concentrations. Within the Sandusky Subbasin, we found that 2012 had the highest water temperatures and deepest hypolimnion, but that both 2011 and 2012 had similar dissolved oxygen concentrations. In the western basin, we only saw stratification in one of our sites, KID. For that site, 2012 had the highest water temperatures producing a very deep and thin hypolimnion. Deeper stratification allows for greater vertical-mixing in the epilimnion [25] which resulted in higher dissolved oxygen concentrations than previous years.
Spatial trends in thermal stratification and hypoxia that we observed are of particular interest, because few studies focus on shallow sites in the lake. Most studies emphasize the extent of hypoxia in the central basin which is most susceptible to oxygen depletion due to its shallow depth and surrounding nutrient inputs [3]. Extensive efforts have been made by the U.S. EPA, NOAA GLERL, and the National Water Research Institute of Environment Canada to collect temperature and dissolved oxygen profiles from sites throughout the central basin, but these programs do not regularly sample regions covered by this study [4]. In a study by Zhou et al., the areal extent of hypoxia in Lake Erie is underestimated due to limited data in the western and Sandusky basins as well as shallow areas of the western-central basin [4]. In Zhou et al.’s estimate of Lake Erie hypoxia, the farthest west that hypoxia extends is east of our study sites and does not include any observations of hypoxia in the western or Sandusky basins. The earliest observations of hypoxia in the western area of the central basin are not seen until August in this work, while we observed hypoxia by early July.
The large variation in stratification and dissolved oxygen concentrations between the study years coincides with significant variation in weather patterns, particularly ice coverage and storm events (see Figure 3). This indicates that there is a likely relationship between weather and stratification and hypoxia. This differs from previous work by Conroy et al. that did not find significant effects of weather during the stratified summer [26]. In another study, modeling results suggested that the largest driver of hypoxia in Lake Erie since the mid-1990s is the phosphorus load, with meteorological conditions having a minimal influence [7]. A primary difference between this study and previous work is that this study focuses on observational data on discrete time intervals rather than a combination of both real and simulated data at a higher frequency. Therefore, this study demonstrates that weather effects have stronger influences on longer time scales (i.e., years). Since weather patterns are expected to be affected by climate change, the need is apparent to understand how climate change will affect Lake Erie. The water quality of Lake Erie is already being affected by climate change and there are many predictions of how the lake will continue to be affected [16,27,28,29].
Hypoxia patterns observed in this study were also evident in a study by Zhou et al. [26]. In that study, the authors used observational measurements and modeling to study the factors that contribute to hypoxia. Models for hypolimnetic hypoxia from 1985 to 2012 showed that 2012 had the largest hypoxic extent area during the study period. This study also observed the deepest and strongest thermal stratification and hypoxia during 2012, which as Zhou et al. demonstrated, was a year of extensive drought in the Midwest. Drought conditions reduced discharge from the tributaries of the Central and Sandusky basins including the Maumee, Cuyahoga, and Sandusky Rivers. Modeling of explanatory variables found the strongest correlation between river discharge and hypoxic lake area, accounting for 39% of hypoxia. Wind duration and stress along with phosphorus loading also contributed to hypoxia in modeling. Comparing hypoxic extent with harmful algal blooms (HABs) in Lake Erie, the relationship is more complicated as the extensive HABs in 2011 were associated with minimal hypoxia while 2012 had fewer HABs, suggesting a stronger connection with nutrient inputs than hypoxia, although hypoxia is also affected by inter-annual accumulation of nutrients. These findings have significant implications for future climate change as regional droughts are expected to increase in frequency [28].
The effects of changing weather on lake functioning and responses are not well understood. While most studies have found that temperate lakes are warming [29], few have looked at how these changes affect the functioning of the lake. Increased temperatures have been associated with a longer, shallower, thermal stratification [30,31]. Future projections of temperature increases have also led to predictions of increased evaporation and lower water levels [32].
In our study, we found that higher water temperatures were associated with lower levels of dissolved oxygen in the hypolimnion. Increased temperatures affect dissolved oxygen concentrations, because warmer water is less able to absorb and dissolve gases [10]. With temperature increases predicted in the Great Lakes as a result of climate change [32], this suggests that as climate change continues we will see lower dissolved oxygen concentrations in the hypolimnion. This agrees with Blumberg and DiToro who found that, using climate change models, higher temperatures would lead to decreased dissolved oxygen concentrations in the hypolimnion [27]. They hypothesized that the lower dissolved oxygen concentrations would be a result of increased biological oxygen demand due to the temperature increase. Changes in temperature and other weather patterns have led to decreased ice coverage on the Great Lakes [33].
Wang et al. found that overall ice coverage has been decreasing since 1973 as a result of increased climate variability [33]. In their study, they used satellite imagery to estimate the amount of ice coverage on the Great Lakes and compared that ice coverage to climate variability and major climate patterns, such as the El Niño Southern Oscillation (ENSO) and the Arctic Oscillation (AO). They found that ice coverage on the Great Lakes has cyclic trends that are affected by climate variability and ENSO and AO patterns. For Lake Erie, they found a total loss of ice coverage of about 50% during the study period (1973–2010). Sustained ice coverage results in greater oxygen depletion and delays the onset of springtime water column mixing before summertime thermal stratification [34]. Decreased ice coverage affects stratification by allowing for earlier and greater wind-mixing of the upper layer suppressing deeper layers, which we saw in our study, as the deeper and thinner hypolimnia in 2012. Future climate simulations suggest that lake ice duration will continue to decrease under future warming scenarios, resulting in earlier spring mixing and summer stratification [35]. Earlier turnover and thermal stratification will contribute to greater oxygen depletion over a longer time period and, possibly, a larger area.
The responses of organisms to the effects of warming temperatures in northern temperate lake ecosystems has been the focus on recent studies which predict that increased temperature leads to increased biological activity [27] as species with higher temperature tolerances, such as cyanobacteria, have a greater advantage over other less tolerant species [30]. Advanced thermal stratification has been found to disrupt food webs since algal blooms are occurring earlier in the spring which disconnects the populations of phytoplankton and herbivores [36]. Increased temperatures and disruptions in the food chain may significantly affect fish populations and alter the diversity of these ecosystems [36]. Longer summer stratification will result in greater oxygen depletion in stratified lakes, increasing the risks of fish kills and destabilizing aquatic communities [34]. Further research on the impacts of weather and climate on hypoxia is needed to better manage water quality in Lake Erie. Future studies of thermal stratification in Lake Erie would benefit from having higher temporal and spatial resolution, which is likely only possible with the establishment of in-situ moorings that contain high-frequency temperature and dissolved oxygen probes.

5. Conclusions

We found that there was a relationship between weather variation—particularly storm events—and ice coverage, and both stratification and hypoxia in Lake Erie. Storm events increase water-column mixing and can disturb stratification, infusing the lake with DO. Reduced ice coverage results in earlier springtime mixing and a longer summer stratification period increasing the risk of oxygen depletion in the hypolimnion. Climate studies have observed changing conditions in the Great Lakes region and project that future climate will be more varied, particularly with warmer conditions, more frequent storm events, and reduced ice coverage. These projections along with our study results show the susceptibility of hypoxia in Lake Erie to changing weather conditions. The effects of weather should be considered along with reductions in nutrient loading in management strategies to address current and future issues.

Acknowledgments

We thank F.T. Stone Laboratory for access to sampling equipment and boats. We also thank captains Art Wolf and Russ Brohl piloting the R/V Erie Monitor on many of our sampling trips. Finally, we thank the Friends of Stone Laboratory (FOSL) for supporting three of the co-authors (Melanie M. Perello, Phoenix Golnick, and Maya C. Hughes) on Stone Lab Research Experience for Undergraduate (REU) projects through the Ohio State University. We thank two anonymous reviewers for improving a previous version of this manuscript.

Author Contributions

Douglas D. Kane and Joseph D. Conroy designed and established the study. Douglas D. Kane, Maya C. Hughes, Phoenix Golnick, and Melanie M. Perello collected the data for this study. Matt A. Thomas assisted with sample collection and program support. Melanie M. Perello conducted all of the data analyses and wrote the manuscript with Douglas D. Kane.

Conflicts of Interest

The authors declare no conflict of interest.

References

  1. Hawley, N.; Johengen, T.H.; Rao, Y.R.; Ruberg, S.A.; Beletsky, D.; Ludsin, S.A.; Eadie, B.J.; Schwab, D.J.; Croley, T.E.; Brandt, S.B. Lake Erie hypoxia prompts Canada-U.S. study. Eos 2006, 87, 313–324. [Google Scholar] [CrossRef]
  2. Vanderploeg, H.A.; Ludsin, S.A.; Ruberg, S.A.; Höök, T.O.; Pothoven, S.A.; Brandt, S.B.; Lang, G.A.; Lieberg, J.R.; Cavaletto, J.F. Hypoxia affects spatial distributions and overlap of pelagic fish, zooplankton, and phytoplankton in Lake Erie. J. Exp. Mar. Biol. Ecol. 2009, 381, S92–S107. [Google Scholar] [CrossRef]
  3. Charlton, M.N. Oxygen depletion in Lake Erie: Has there been any change? Can. J. Fish. Aquat. Sci. 1980, 37, 72–81. [Google Scholar] [CrossRef]
  4. Zhou, Y.T.; Obenour, D.R.; Scavia, D.; Johengen, R.H.; Michalak, A.M. Spatial and temporal trends in Lake Erie hypoxia, 1987–2007. Environ. Sci. Technol. 2013, 47, 899–905. [Google Scholar] [CrossRef] [PubMed]
  5. Scavia, D.; Allan, J.D.; Arend, K.K.; Bartell, S.; Beletsky, D.; Bosch, N.S.; Brandt, S.B.; Briland, R.D.; Daloğlu, I.; DePinto, J.V.; et al. Assessing and addressing the re-eutrophication of Lake Erie: Central basin hypoxia. J. Great Lakes Res. 2014, 40, 226–246. [Google Scholar] [CrossRef]
  6. Bolsenga, S.J.; Herdendorf, C.E. Lake Erie and Lake Saint Clair Handbook; Wayne State University: Detroit, MI, USA, 1993. [Google Scholar]
  7. Rucinski, D.K.; Beletsky, D.; DePinto, J.V.; Schwab, D.J.; Scavia, D. A simple 1-dimensional, climate based dissolved oxygen model for the central basin of Lake Erie. J. Great Lakes Res. 2010, 36, 465–476. [Google Scholar] [CrossRef]
  8. NOAA Coastal Services Center. Sustainable Tourism: Increasing the Economic Impact While Preserving the Environment in Ohio. Available online: http://www.lakecountydevelopmentcouncil.org/april-2010/ (accessed on 12 April 2017).
  9. Edwards, W.J.; Conroy, J.D.; Culver, D.A. Hypolimnetic oxygen depletion dynamics in the central basin of Lake Erie. J. Great Lakes Res. 2005, 31, 262–271. [Google Scholar] [CrossRef]
  10. Wetzel, R.G. Limnology Lake and River Ecosystems; Elsevier Academic Press: San Diego, CA, USA, 2001. [Google Scholar]
  11. Rosa, F.; Burns, N.M. Lake Erie central basin oxygen depletion changes from 1929–1980. J. Great Lakes Res. 1987, 13, 684–696. [Google Scholar] [CrossRef]
  12. Gilbertson, M. Are causes knowable? Some consequences of successional versus toxicological interpretations of the Great Lakes Water Quality Agreement. Can. J. Fish. Aquat. Sci. 2011, 54, 483–495. [Google Scholar] [CrossRef]
  13. Schertzer, W.M.; Saylor, J.H.; Boyce, F.M.; Robertson, D.G.; Rosa, F. Seasonal thermal cycle of Lake Erie. J. Great Lakes Res. 1987, 13, 468–486. [Google Scholar] [CrossRef]
  14. Conroy, J.D.; Boegman, L.; Zhang, H.; Edwards, J.D.; Culver, D.A. “Dead zone” dynamics in Lake Erie: The importance of weather and sampling intensity for calculated hypolimnetic oxygen depletion rates. Aquat. Sci. 2011, 73, 289–304. [Google Scholar] [CrossRef]
  15. Michalak, A.M.; Anderson, E.J.; Beletsky, D.; Boland, S.; Bosch, N.S.; Bridgeman, T.B.; Chaffin, J.D.; Cho, K.; Confesor, R.; Daloğlu, I.; et al. Record-setting algal bloom in Lake Erie caused by agricultural and meteorological trends consistent with expected future conditions. PNAS 2014, 110, 6448–6452. [Google Scholar] [CrossRef] [PubMed]
  16. Burns, N.M.; Rockwell, C.D.; Bertram, P.E.; Dolan, D.M.; Ciborowski, J.J.H. Trends in temperature, Secchi depth, and dissolved oxygen depletion rates in the central basin of Lake Erie, 1983–2002. J. Great Lakes Res. 2005, 31, 35–49. [Google Scholar] [CrossRef]
  17. Conroy, J.D. Testing the Algal Loading Hypothesis: The Importance of Sandusky River Phytoplankton Inputs to Offshore Lake Erie processes. Ph.D. Thesis, The Ohio State University, Columbus, OH, USA, 2007. [Google Scholar]
  18. Daloğlu, I.; Cho, K.H.; Scavia, D. Evaluating causes of trends in long-term dissolved reactive phosphorus loads to Lake Erie. Env. Sci. Technol. 2012, 46, 10660–10666. [Google Scholar] [CrossRef] [PubMed]
  19. Beletsky, D.; Hawley, N.; Rao, Y.R.; Vanderploeg, H.A.; Beletsky, R.; Schwab, D.J.; Ruberg, S.A. Summer thermal structure and anticyclonic circulation of Lake Erie. Geophsys. Res. Lett. 2012, 39, L06605. [Google Scholar] [CrossRef]
  20. NOAA Great Lakes Environmental Research Laboratory. Real-Time Meterological Network. Toledo Light #2. Available online: https://www.glerl.noaa.gov/metdata/tol2/ (accessed on 9 July 2012).
  21. NOAA Data Buoy Center. Station 45005-W Lake Erie 16 NM Northwest of Cleveland, OH. Available online: www.ndbc.noaa.gov/station_page.php?station=45005 (accessed on 10 April 2017).
  22. Environment Canada. Lake Erie Ice Data. Available online: www.ec.gc.ca/glaces-ice/?lang=En/ (accessed on 12 April 2017).
  23. National Weather Service. Cleveland Office. Available online: www.weather.gov/cle/ (accessed on 12 April 2017).
  24. Steinhart, G.B.; Leonard, N.J.; Stein, R.A.; Marschall, E.A. Effects of storms, anglers, and predators on smallmouth bass (Micropterus dolomieu) nest success. Can. J. Fish. Aquat. Sci. 2005, 62, 2649–2660. [Google Scholar] [CrossRef]
  25. Foley, B.; Jones, I.D.; Maberly, S.C.; Rippey, B. Long-term changes in oxygen depletion in a small temperate lake: Effects of climate change and eutrophication. Freshw. Biol. 2011, 57, 278–289. [Google Scholar] [CrossRef]
  26. Zhou, Y.; Michalak, A.M.; Beletsky, D.; Rao, Y.R.; Richards, R.P. Record-breaking Lake Erie hypoxia during 2012 drought. Environ. Sci. Technol. 2015, 49, 800–807. [Google Scholar] [CrossRef] [PubMed]
  27. Blumberg, A.F.; Di Toro, D.M. Effects of climate warming on dissolved oxygen concentrations in Lake Erie. Trans. Am. Fish. Soc. 1990, 119, 210–223. [Google Scholar] [CrossRef]
  28. Bosch, N.S.; Evans, M.A.; Scavia, D.; Allan, J.D. Interacting effects of climate change and agricultural BMPs on nutrient runoff entering Lake Erie. J. Great Lakes Res. 2014, 40, 581–589. [Google Scholar] [CrossRef]
  29. Dai, A. Increasing drought under global warming in observation and models. Nat. Clim. Chang. 2012, 3, 52–58. [Google Scholar] [CrossRef]
  30. Shimoda, Y.; Azim, M.E.; Perhar, G.; Ramin, M.; Kenney, M.A.; Sadraddini, S.; Gudimov, A.; Arhonditsis, G.B. Our current understanding of lake ecosystem response to climate change: What have we really learned from north temperate deep lakes? J. Great Lakes Res. 2011, 37, 173–193. [Google Scholar] [CrossRef]
  31. Magnuson, J.J.; Webster, K.E.; Assel, R.A.; Bowser, C.J.; Dillon, P.J.; Eaton, J.G.; Evans, H.E.; Fee, E.J.; Hall, R.I.; Mortsch, L.R.; et al. Potential effects of climate changes on aquatic systems: Laurentian Great Lakes and Precambrian Shield Region. Hydrol. Process. 1997, 11, 825–871. [Google Scholar] [CrossRef]
  32. Lofgren, B.M.; Quinn, F.H.; Clites, A.H.; Assel, R.A.; Eberhardt, A.J.; Luukkonen, C.L. Evaluation of potential impacts on Great Lakes water resources based on climate scenarios of two GCMs. J. Great Lakes Res. 2002, 28, 537–554. [Google Scholar] [CrossRef]
  33. Wang, J.; Bai, H.; Hu, H.; Clites, A.; Colton, M.; Lofgren, B. Temporal and spatial variability of Great Lakes ice cover, 1973–2012. J. Clim. 2012, 25, 1318–1329. [Google Scholar] [CrossRef]
  34. Agbeti, M.D.; Smol, J.P. Winter limnology: A comparison of physical, chemical and biological characteristics in two temperate lakes during ice cover. Hydrobiologia 1994, 304, 221–234. [Google Scholar] [CrossRef]
  35. Fang, X.; Stefan, H.G. Simulations of climate effects on water temperature, dissolved oxygen, and ice and snow covers in lakes of the contiguous United States under past and future climate scenarios. Limnol. Oceanogr. 2009, 54, 2359–2370. [Google Scholar] [CrossRef]
  36. Winder, M.; Schindler, D.E. Climate change uncouples trophic interactions in an aquatic ecosystem. Ecology 2004, 85, 2100–2106. [Google Scholar] [CrossRef]
Figure 1. Location of the six monitoring stations in Lake Erie. Ballast Island Deep (BID) and Kelley’s Island Deep (KID) are both located in the western basin. Sandusky Subbasin Offshore (SOFF) and East Sandusky Subbasin (East) are in the Sandusky Subbasin. Lorain and Avon Point (AP) are both in the central basin. Bathymetric contours represent 1 m intervals. Basemap was provided by the Ohio Department of Natural Resources.
Water 09 00279 g001
Figure 2. Mean daily surface water temperature (°C) (+SD) for March through June of 2010 through 2012. Note that no data were available for March 2011 or for June 2012. Weather data is from the NOAA GLERL Real-Time Meteorological Network [18].
Water 09 00279 g002
Figure 3. Total accumulated ice coverage (Ice Cover/Total Area) for Lake Erie for 2010 through 2012 compared to thermocline depth (m) from the basins of our study. Weather data is from Environment Canada [20].
Water 09 00279 g003
Figure 4. Number of monthly storm events for the years 2010 through 2012. Data were not available for March 2011. A storm event is defined as having wind speeds greater than 7 m/s for three or more hours [22].
Water 09 00279 g004
Figure 5. Dissolved oxygen (mg/L) and temperature (°C) with depth for Ballast Island Deep (A), Kelley Island’s Deep (B), Sandusky Subbasin Offshore (C), East (D), Lorain (E), and Avon Point (F) sites from 2010 to 2012 during the first week (late June/early July) of the study each year.
Water 09 00279 g005
Figure 6. Dissolved oxygen (mg/L) and temperature (°C) with depth for Kelley’s Island Deep (A), Sandusky Subbasin Offshore (B), and East (C) from 2010 to 2012 during the second week (early-July) of the study each year. Note that only sites that were typically stratified are shown.
Water 09 00279 g006
Figure 7. Dissolved oxygen (mg/L) and temperature (°C) with depth for Ballast Island Deep (A), Kelley’s Island Deep (B), Sandusky Subbasin Offshore (C), East (D), Lorain (E), and Avon Point (F) sites in the western, central, and Sandusky basins of Lake Erie 2010–2012 during the third week (mid-July) of the study each year.
Water 09 00279 g007

