
Large Differences between Glaciers 3D Surface Extents and 2D Planar Areas in Central Tianshan


1
School of Geography and Planning, and Guangdong Key Laboratory for Urbanization and Geo-Simulation, Sun Yat-sen University, Guangzhou 510275, China
2
State Key Laboratory of Desert and Oasis Ecology, Xinjiang Institute of Ecology and Geography, Chinese Academy of Sciences, Urumqi 830011, China
*
Author to whom correspondence should be addressed.
Water 2017, 9(4), 282; https://doi.org/10.3390/w9040282
Submission received: 30 January 2017
/
Revised: 12 April 2017
/
Accepted: 14 April 2017
/
Published: 17 April 2017
(This article belongs to the Special Issue Applications of Remote Sensing/GIS in Water Resources and Flooding Risk Managements)
Abstract
:Most glaciers in China lie in high mountainous environments and have relatively large surface slopes. Common analyses consider glaciers’ projected areas (2D Area) in a two-dimensional plane, which are much smaller than glacier’s topographic surface extents (3D Area). The areal difference between 2D planar areas and 3D surface extents exceeds −5% when the glacier’s surface slope is larger than 18°. In this study, we establish a 3D model in the Muzart Glacier catchment using ASTER GDEM data. This model is used to quantify the areal difference between glaciers’ 2D planar areas and their 3D surface extents in various slope zones and elevation bands by using the second Chinese Glacier Inventory (CGI2). Finally, we analyze the 2D and 3D area shrinking rate between 2007 and 2013 in Central Tianshan using glaciers derived from Landsat images by an object-based classification approach. This approach shows an accuracy of 89% when it validates by comparison of glaciers derived from Landsat and high spatial resolution GeoEye images. The extracted glaciers in 2007 also have an agreement of 89% with CGI2 data in the Muzart Glacier catchment. The glaciers’ 3D area is 34.2% larger than their 2D area from CGI2 in the Muzart Glacier catchment and by 27.9% in the entire Central Tianshan. Most underestimation occurs in the elevation bands of 4000–5000 m above sea level (a.s.l.). The 3D glacier areas reduced by 30 and 115 km2 between 2007 and 2013 in the Muzart Glacier catchment and Central Tianshan, being 37.0% and 27.6% larger than their 2D areas reduction, respectively. The shrinking rates decrease with elevation increase.
1. Introduction
Mountain glaciers and snow are crucial water resources for the surrounding river, lake, oasis, cropland and urban life in arid Central Asia [1]. Glaciers’ ice volumes are usually estimated by Volume-Area (V-A) power law equations since there are few in situ measurements of ice volume using modern techniques, such as sounding echo, ground radar or gravity methods [2,3,4]. The V-A scaling method is based on ice dynamics imposed by the climatic and topographic conditions in different glacierized regions, and has an inherent steady-state assumption [2]. This assumption is often violated, with many glaciers being out of equilibrium [5]. The volume estimation errors can exceed 50% for individual glaciers [6]. Moreover, glaciers’ area change does not closely correspond to ice thickness changes (increase in the accumulation zone and decrease in the ablation zone), resulting in even larger errors, especially in estimating the ice volume changes by using glacier’s areas in different years [2].
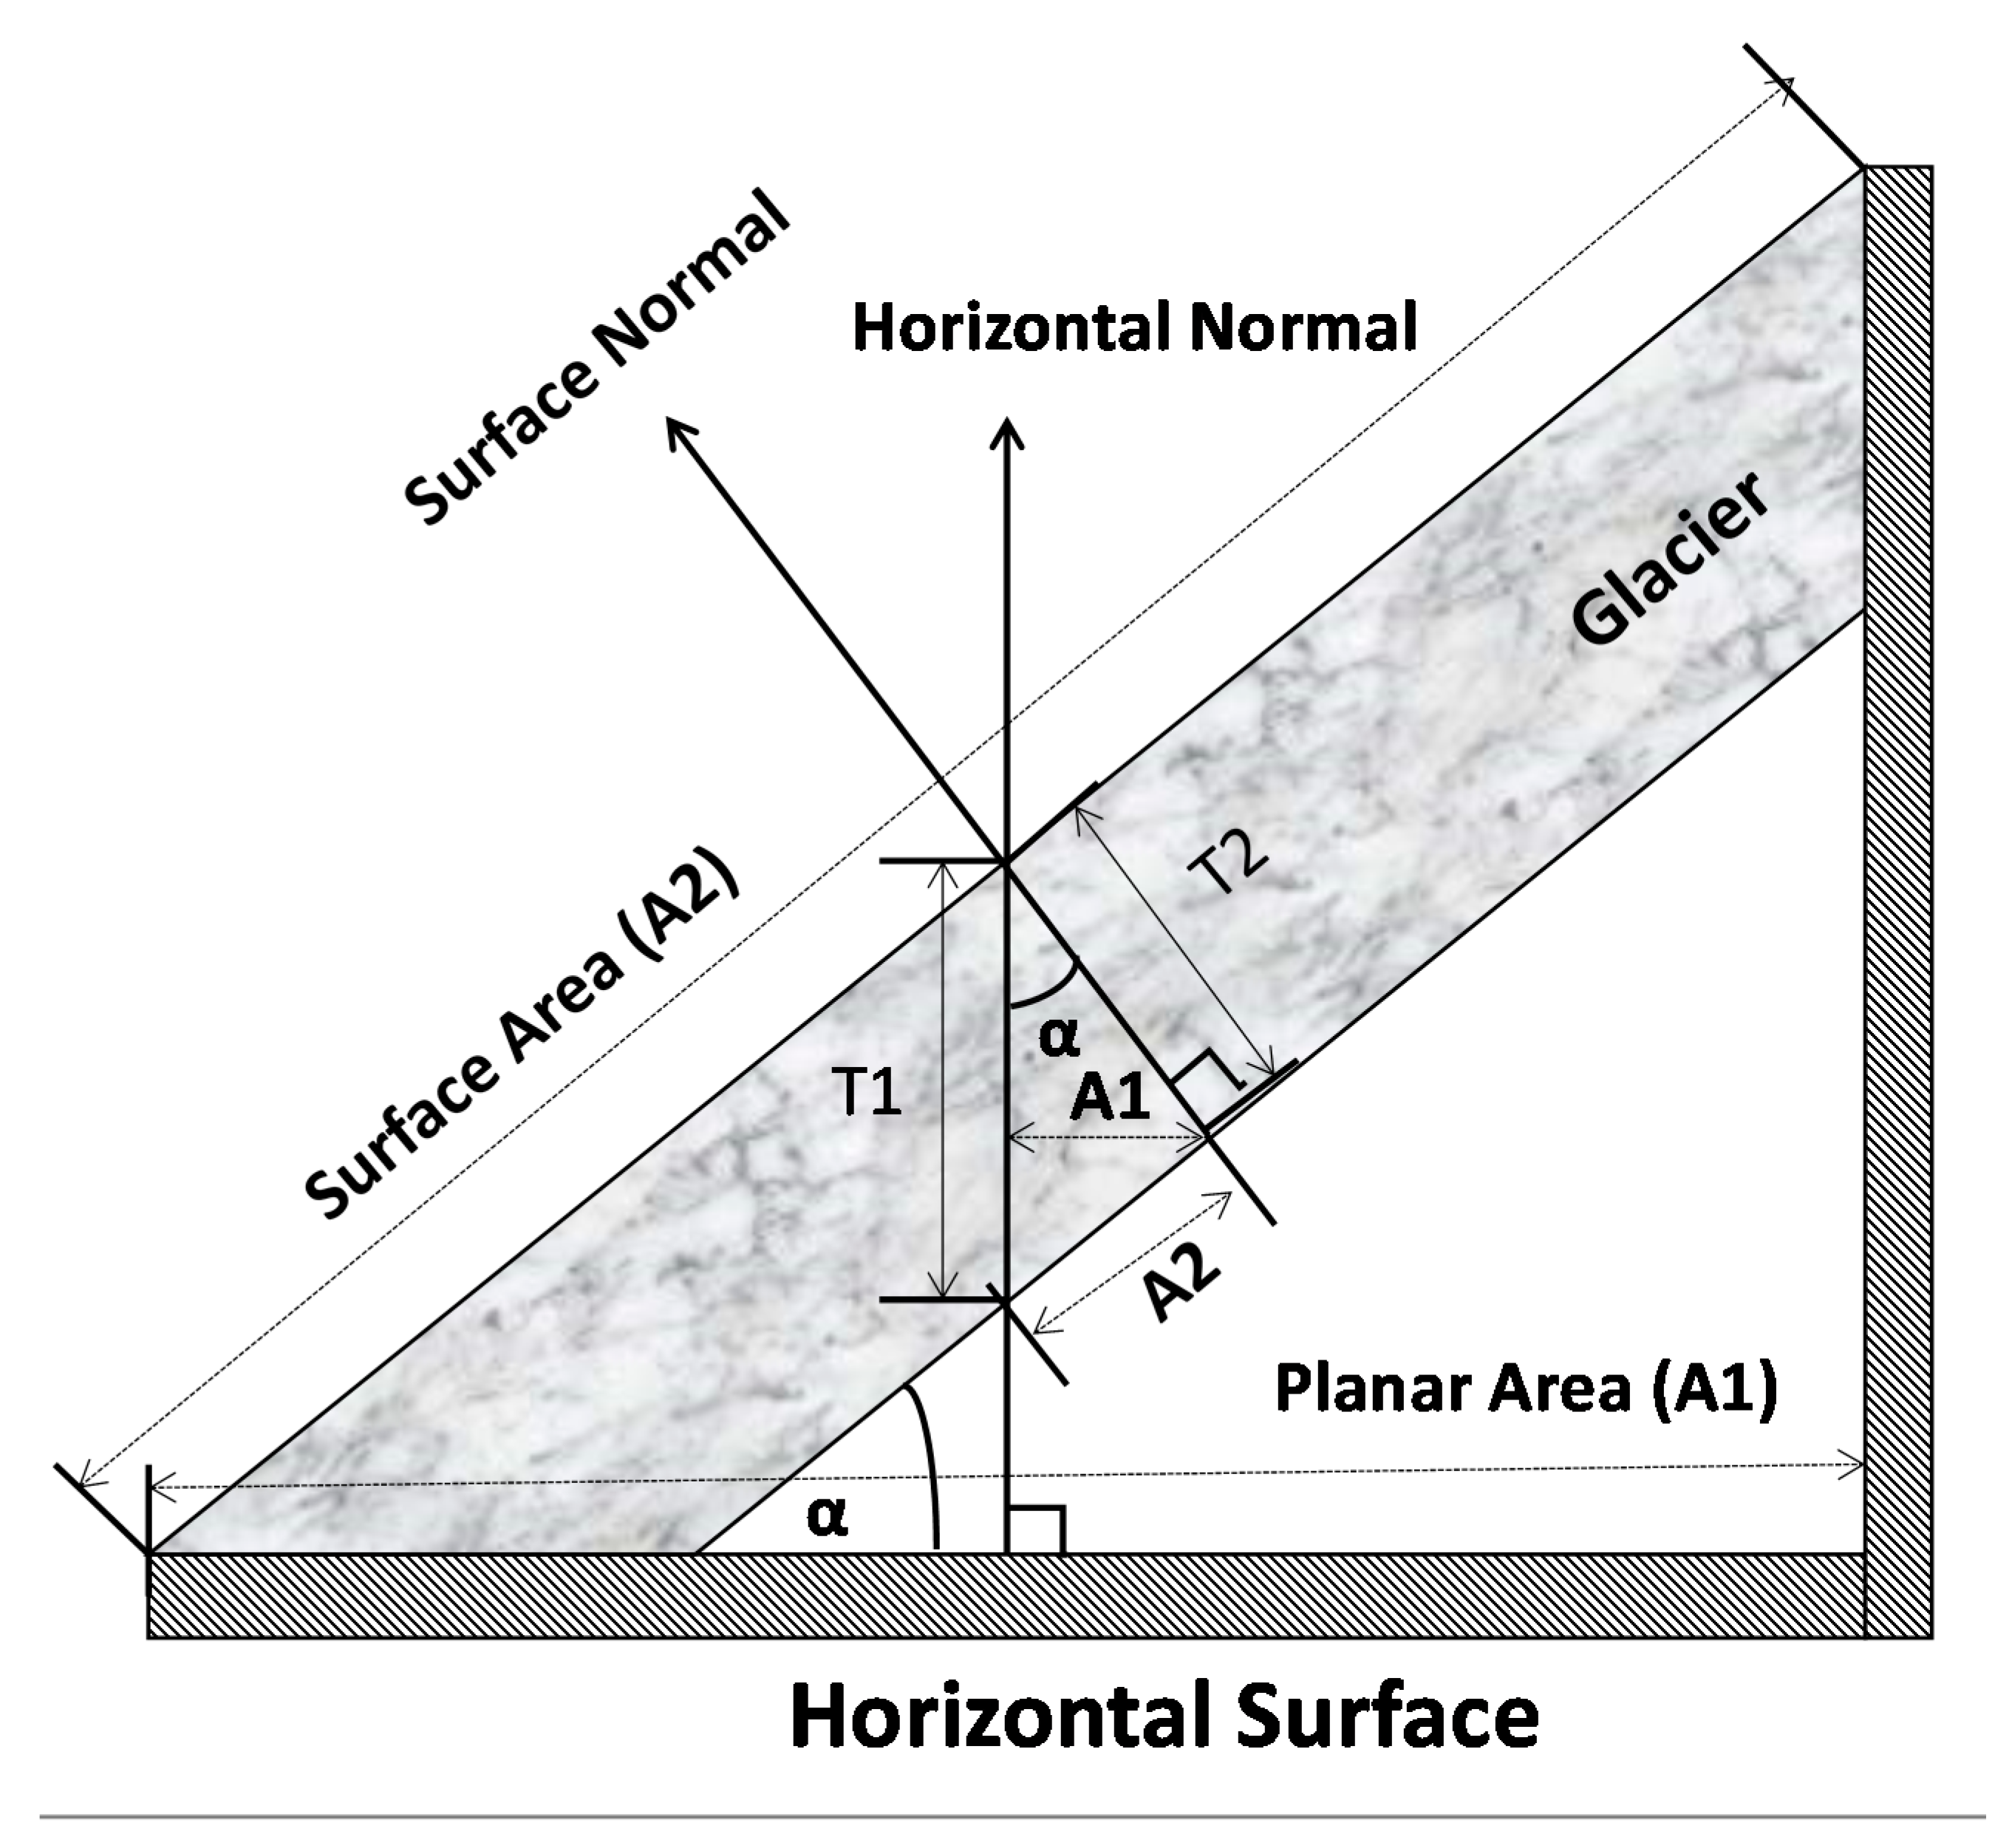
The glacier area is defined by the ice mass balance community as the extent in two horizontal dimensions (Figure 1), i.e., the extent/outline of the glacier is projected onto the surface of an ellipsoid Earth surface, rather than the real topographic surface/the slope normal [7]. The former is called 2D area (Figure 1, A1), and the latter is called 3D area (Figure 1, A2) in this study hereafter. Meanwhile, the ice/glacier thickness is defined as the vertical length (Figure 1, T1) measured parallel to the vertical axis of the ellipsoid Earth surface and not normal to the glacier surface [7]. Thus, the ice volume is the integral of the planar area and thickness. In contrast, the snow layer thickness (Figure 1, T2) is usually measured perpendicularly relative to the slope normal of the snow/land surface [8]. Both the glacier’s 2D area and thickness values are close to the true values for flat ice sheets and glaciers with gentle slope (<18°), while greater difference exists for glaciers with larger slopes, although the two pairs of definitions for area and thickness relative to horizontal normal (2D area) or slope normal (3D area) make no difference for calculating ice volume together (Figure 1). The 3D area might be a better variable in the ice volume estimate using the V-A scaling method, since it considers the slope factor and reflects ice thickness changes. Moreover, glaciers’ 3D surface extent could be a better variable in modeling their surface melting and sublimation [9].
Most glaciers in Central Tianshan lie in high mountainous areas over 3000 m a.s.l. These alpine glaciers often have complex catchments, divisions and large slopes. For example, one of the large glaciers, the Muzart Glacier near the Tumor Peak, is highly labile with fluctuating length, area, volume, and shape [1,10,11], thus violating the steady state assumption of the V-A scaling method and leading to large uncertainties in the ice volume estimation.
Numerous studies have investigated glacier area changes in Central Tianshan based on satellite and airborne images and topographic data/DEM [1,12,13,14,15,16]. Most studies analyze 2D planar areas, while few studies discuss the difference between glacier’s 2D areas and 3D areas [17], partially due to the unavailability of topographic data with relatively high spatial resolution. Therefore, the primary objective of this study is to compute glaciers’ 2D and 3D areas and evaluate how the differences between them relate to changes in surface slope and elevation bands in the Muzart Glacier catchment and Central Tianshan.
2. Study Area and Data Analysis
2.1. Study Area
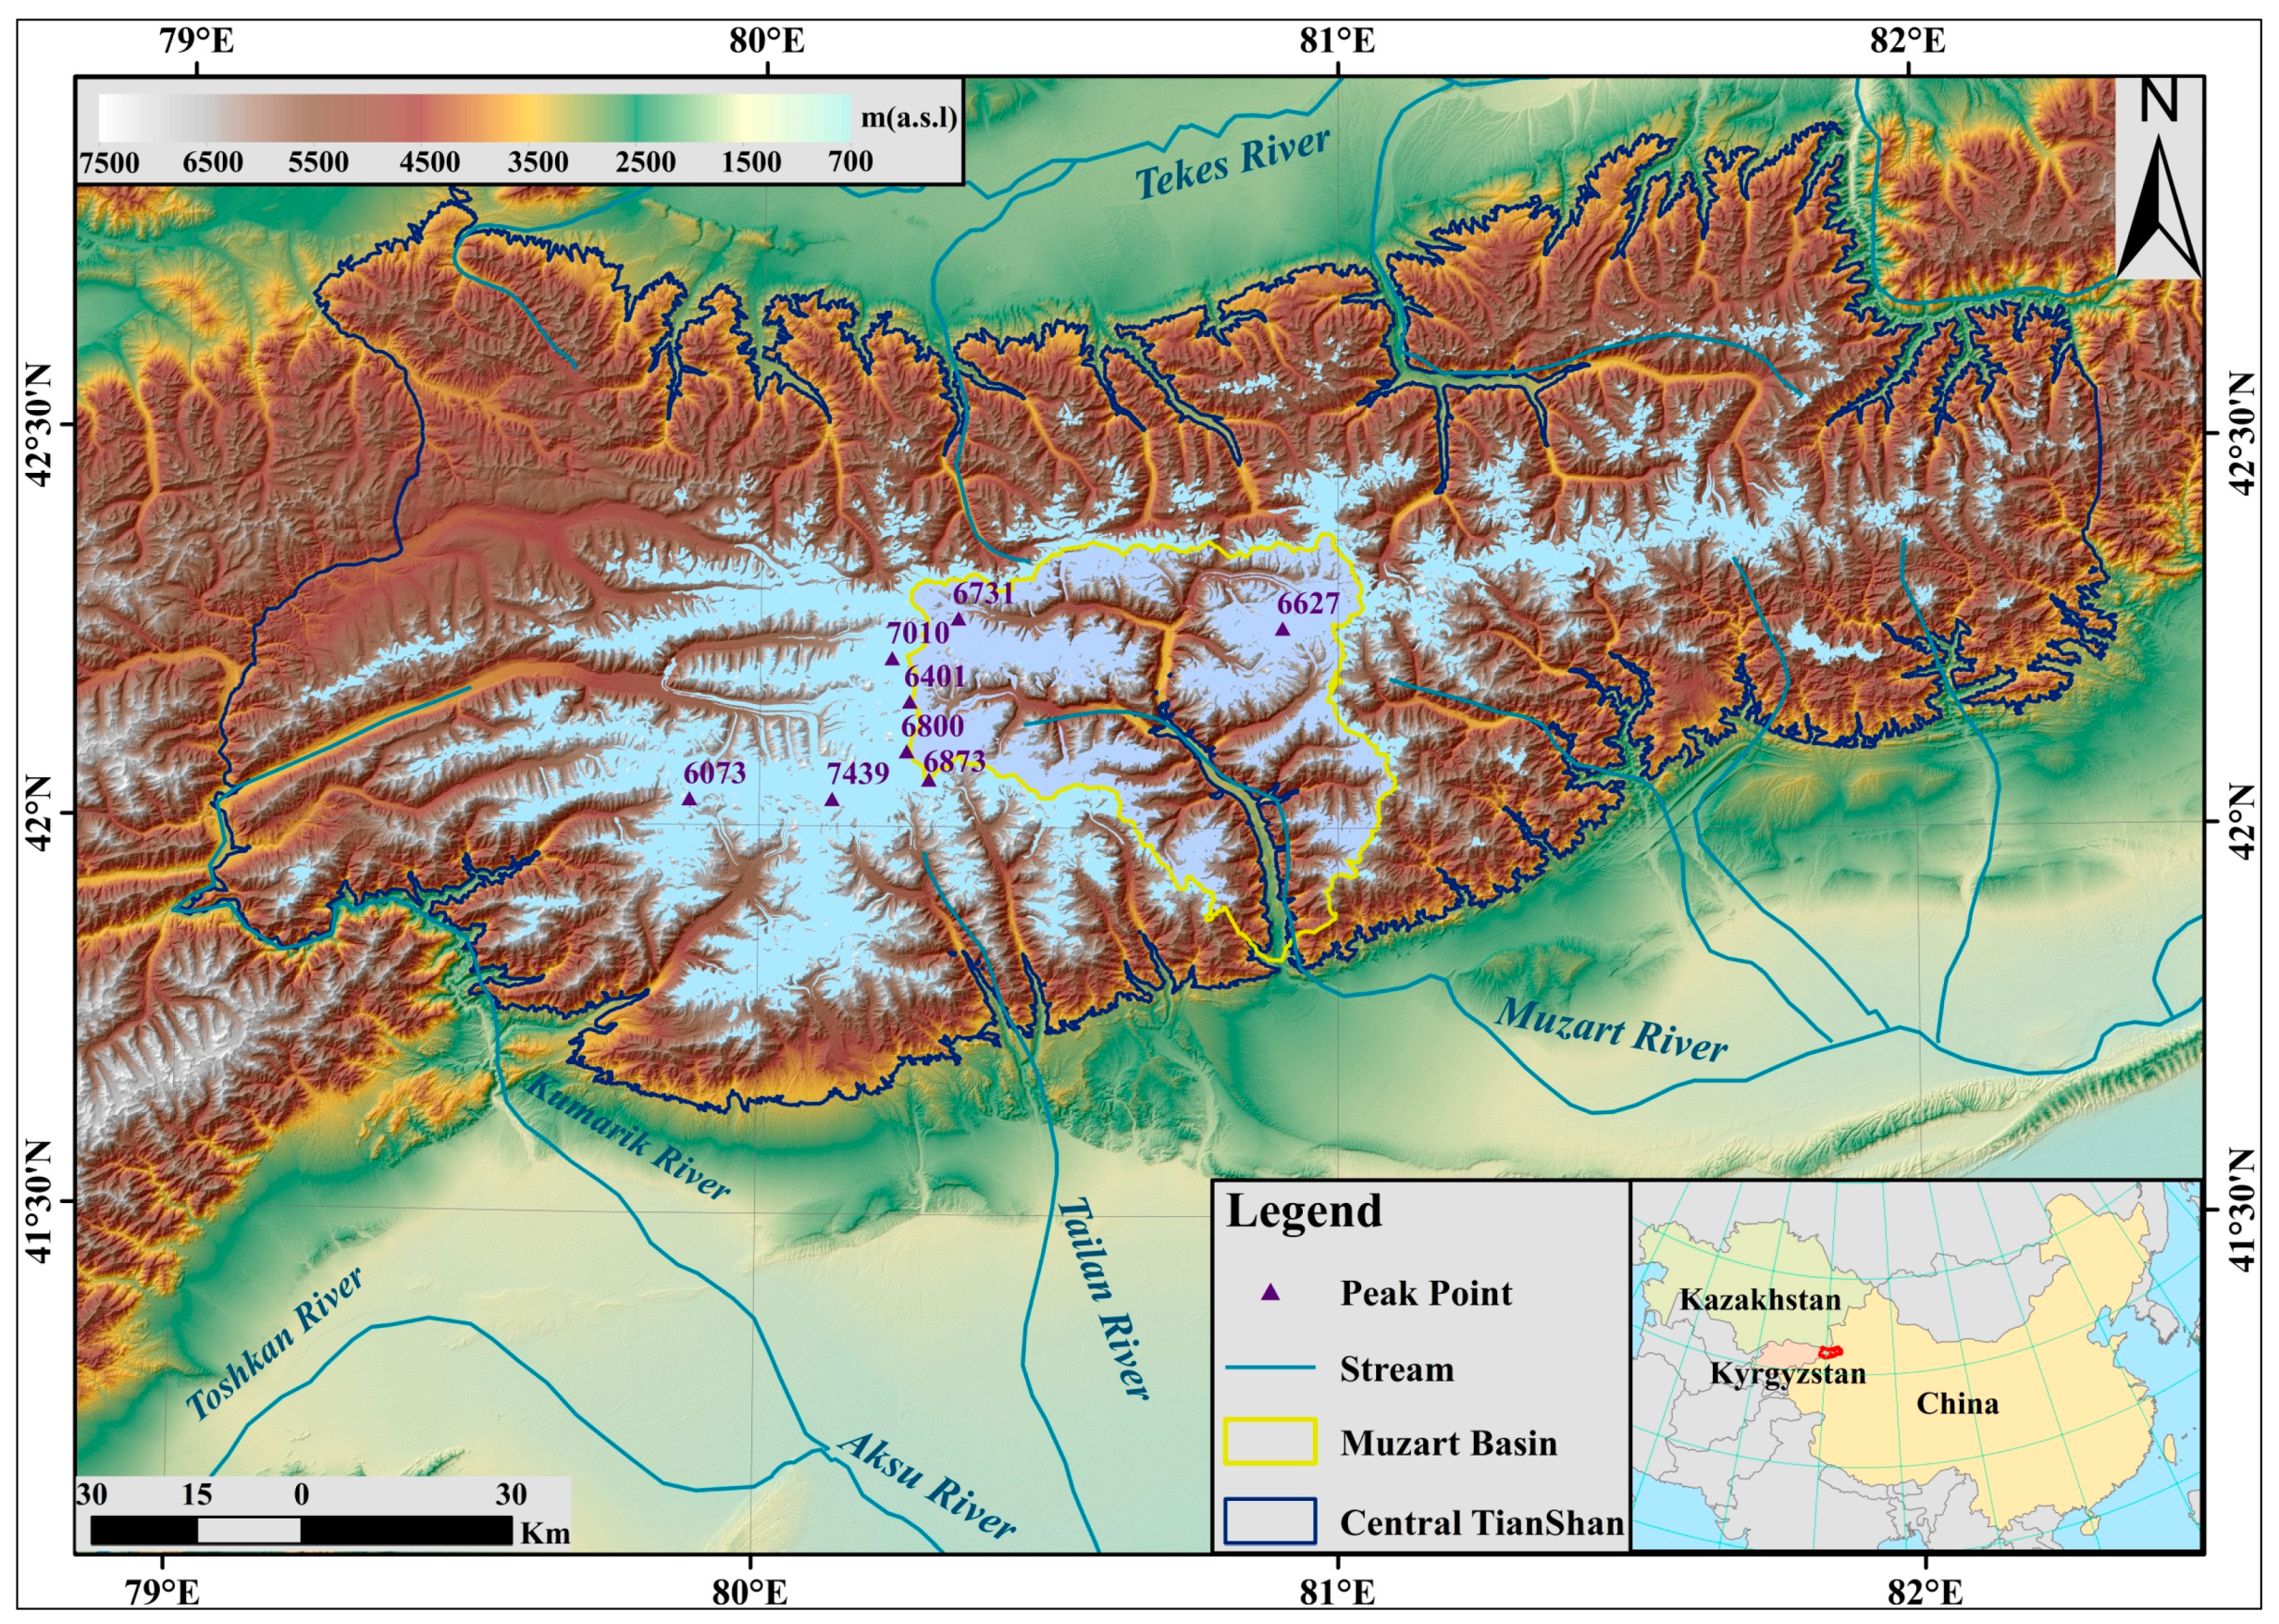
The Muzart Glacier catchment is located in the upper Muzart River Basin in Central Tianshan (also called Tien Shan in some literature) Mountains, and is the largest center of modern glaciation in the Tianshan Range (Figure 2). Locally, the Muzart Glacier also includes its northern division, or the northern Muzart Glacier catchment, which drains to the northern Muzart River, the upper tributary of the Tekes River and then Yili River. This study only focuses on the southern division of the Muzart Glacier, i.e., simplified as the Muzart Glacier catchment in this study. The (southern) Muzart River is more than 80% supported by snow/glacier melt water and is an important tributary of the Tarim River [11,18]. The snow/glacier melt water provides a critical water resource for the downstream piedmont oases. According to the Second Chinese Glacier Inventory, there are 318 glaciers with a total area of 1192 km2 in the Muzart Glacier catchment, including hanging glaciers, cirque glaciers, single valley glaciers and compound valley glaciers [11]. The average slope in the Muzart glacial catchment is 31.4° with elevation ranging from 2500 to 7400 m a.s.l. Beyond the Muzart Glacial catchment, glaciers distribute above 3000 m a.s.l. in the entire Central Tianshan, and the contour of 2500 m a.s.l. is applied to constrain the analyzing ranges of glacier areas (Figure 2).
2.2. Data and Analysis
The Second Chinese Glacier Inventory (CGI2) data provided by the West Data Center for glaciology and geocryology, at Lanzhou, China [19] are used to analyze the spatial distribution and to compare the glacier maps classified from Landsat images in this study. The outline of CGI2 was derived using the band ratio segmentation method, and had extensive manual editions based on 218 Landsat TM/ETM+ scenes (30 m of spatial resolution) acquired mainly during 2006–2010. Glaciers positioning errors were about 10 m for clean-ice outlines and 30 m for debris-covered outlines, and area errors were 3.2% [10].
Four Landsat 5 TM images acquired on 24 August 2007, which are the same images used in CGI2, and four Landsat 8 OLI images acquired on 10 September 2013, are used to extract the glacier areas in the Muzart Glacier catchment and Central Tianshan. These scenes were cloud-free over glaciers and had minimum seasonal snow cover, which is best for glacier mapping [13]. The extracted glaciers are compared to CGI2 in the Muzart Glacier catchment. Also, a suitable high-resolution GeoEye (nominal 2-m spatial resolution) acquired on 20 April 2015 is downloaded to validate the glacier outline derived from Landsat images.
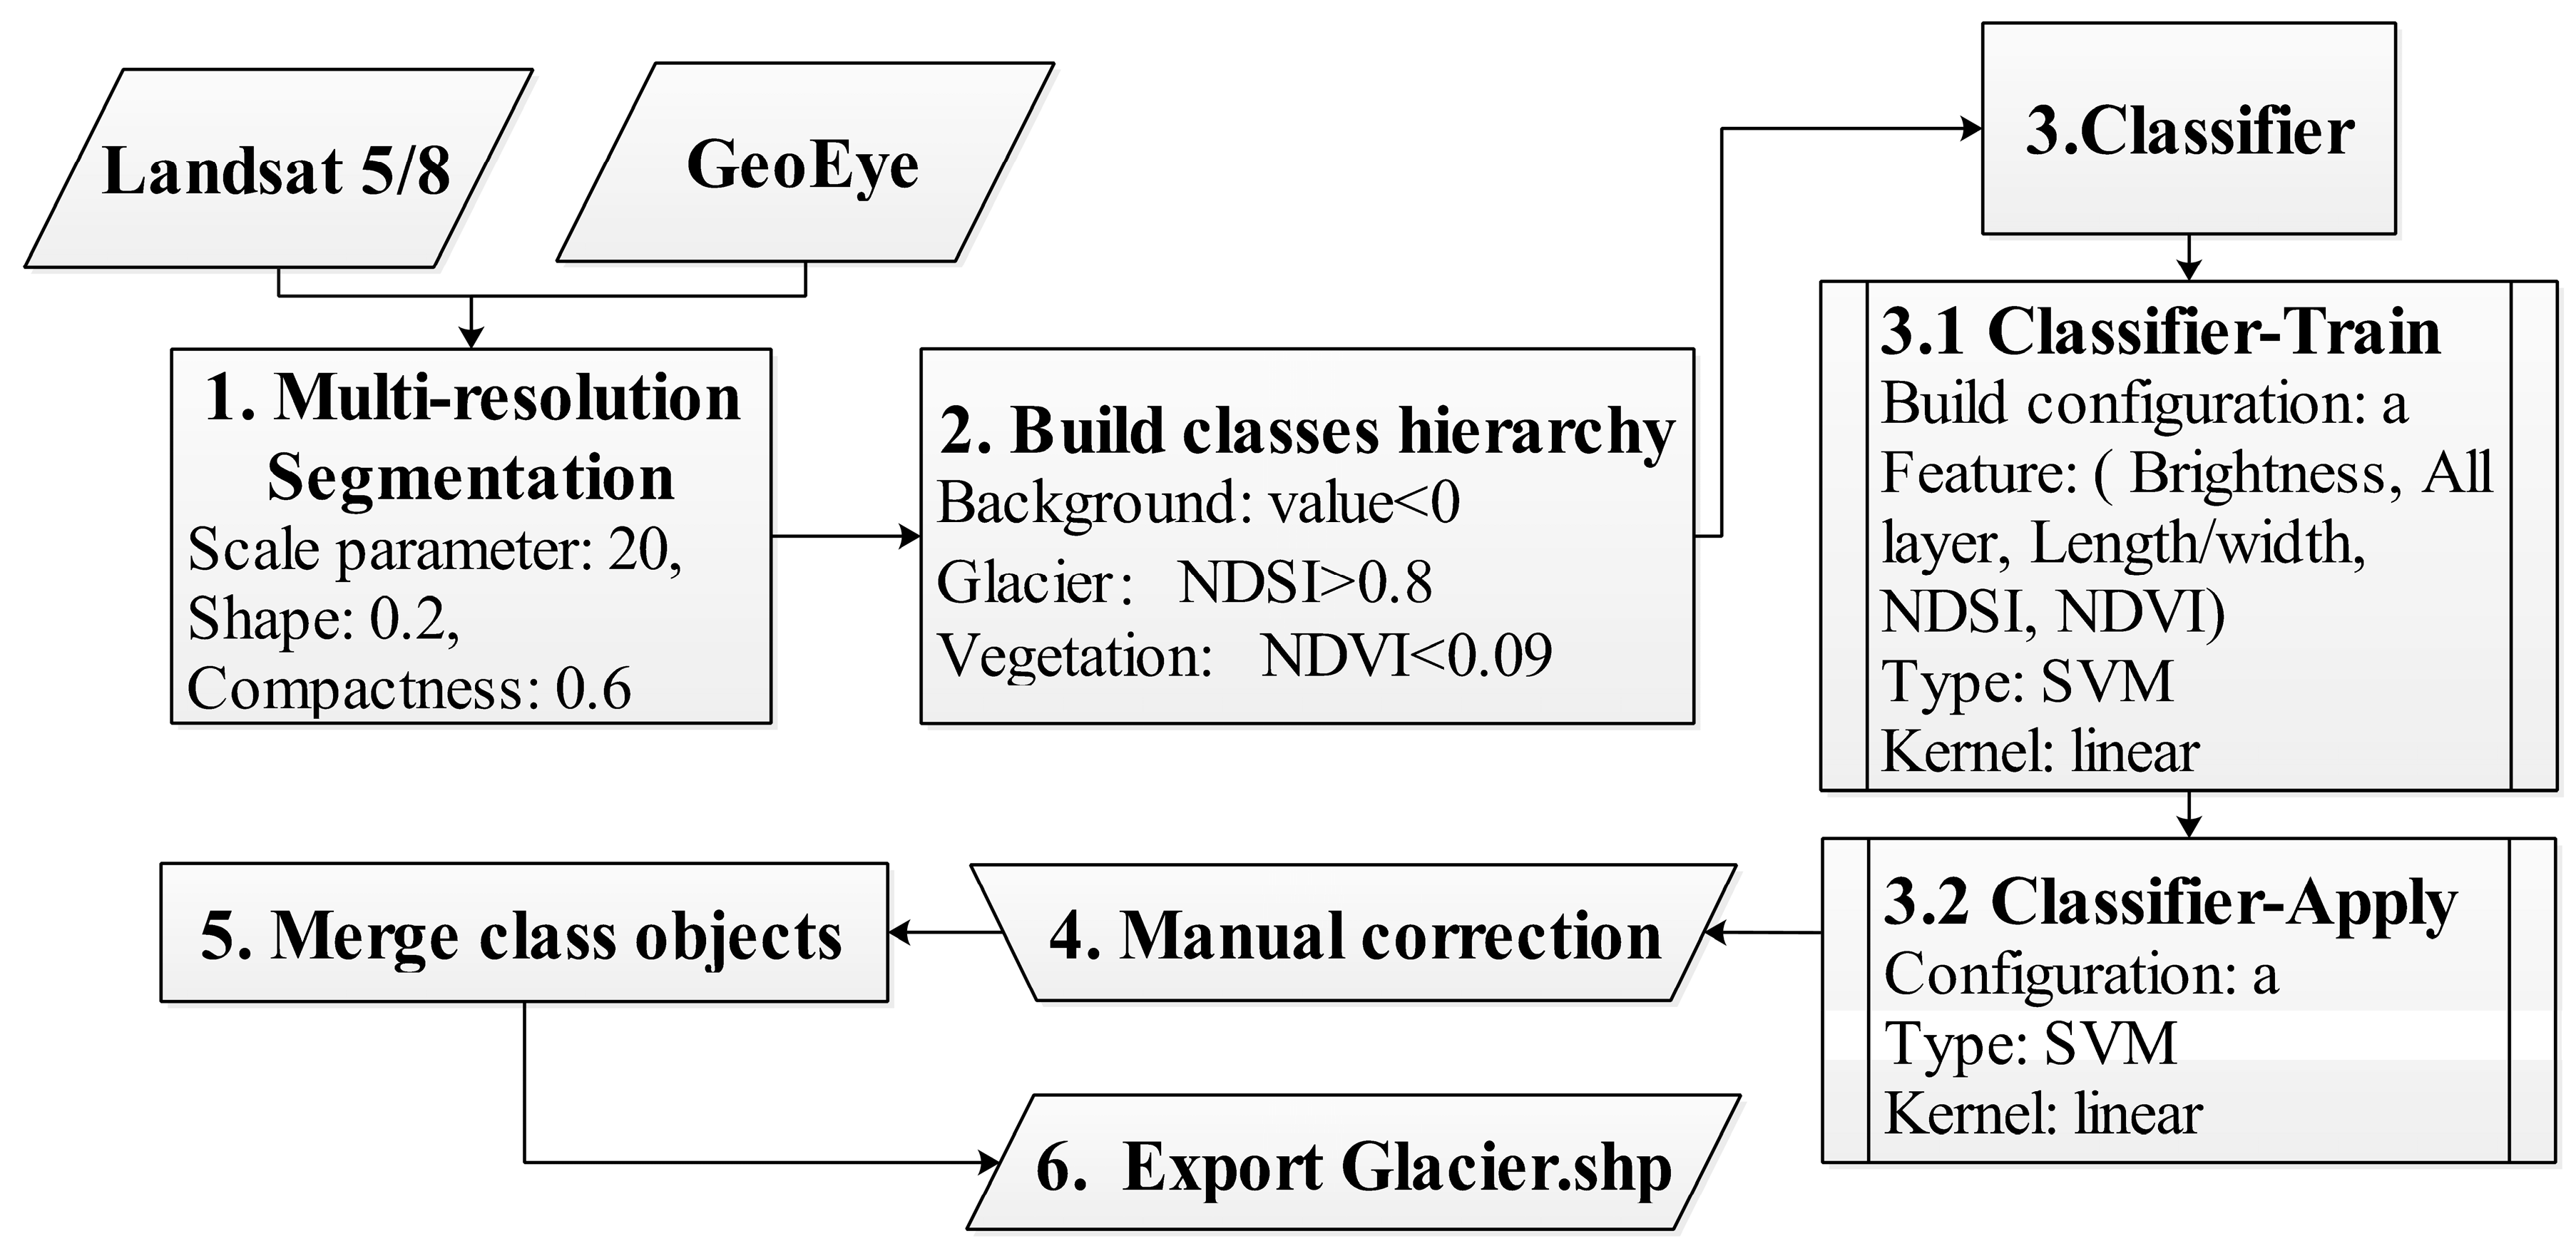
A semi-automatic methodology is utilized to delineate the glacier area using an object-based image classification approach on eCognition 9.0 (Trimble Inc., Sunnyvale, CA, USA) [12,20,21,22]. The specific procedures are illustrated in (Figure 3). The Landsat/GeoEye images are first segmented using multi-resolution segmentation which creates the image object based on spectral and shape characteristics [2]. Then, the class hierarchy is built with a focus on clean ice. Next, the classifier is trained and applied by using the Support Vector Machine (SVM) with a linear kernel [23]. The classified glaciers are manually corrected by visual comparison with images acquired in different years. Finally, the classified objects are merged and exported to vector polygons for further visually checking and manual edition on ArcMap, eliminating misclassified pro-glacial water, snow cover, and shadow areas by overlaying with DEM data and GoogleEarth images.
The ASTER GDEM V2 was downloaded from Japan Space Systems [24], and had a 30-m spatial resolution with reported vertical accuracies of less than 17 m and horizontal accuracies of 71 m. It is suitable for the compilation of topographic parameters in a glacier inventory [25,26], and is used to establish the 3D model, delineate the glacier catchment, compute the slope, and classify the slope zones and elevation bands in this study. All Landsat and GeoEye images, CGI2 and the ASTER GDEM V2 data sets are reprojected to the Universal Transverse Mercator (UTM) coordinate system, zone 44 before analysis.
The study areas are further divided into elevation bands with a 500-m interval and slope zones with a 10° interval based on the ASTER GDEM V2 data. The 3D surface areas in the entire area and different elevation bands and slope zones are estimated by raster-based methods based on the 3D model established from the ASTER GDEM V2 data. Similarly, the 2D project glacier areas are also analyzed in those elevation bands and slope zones. All areal calculations are carried out on ArcMap 10.3 (ESRI, Redlands, CA, USA).
3. Results
3.1. Glacier Outline Extractions
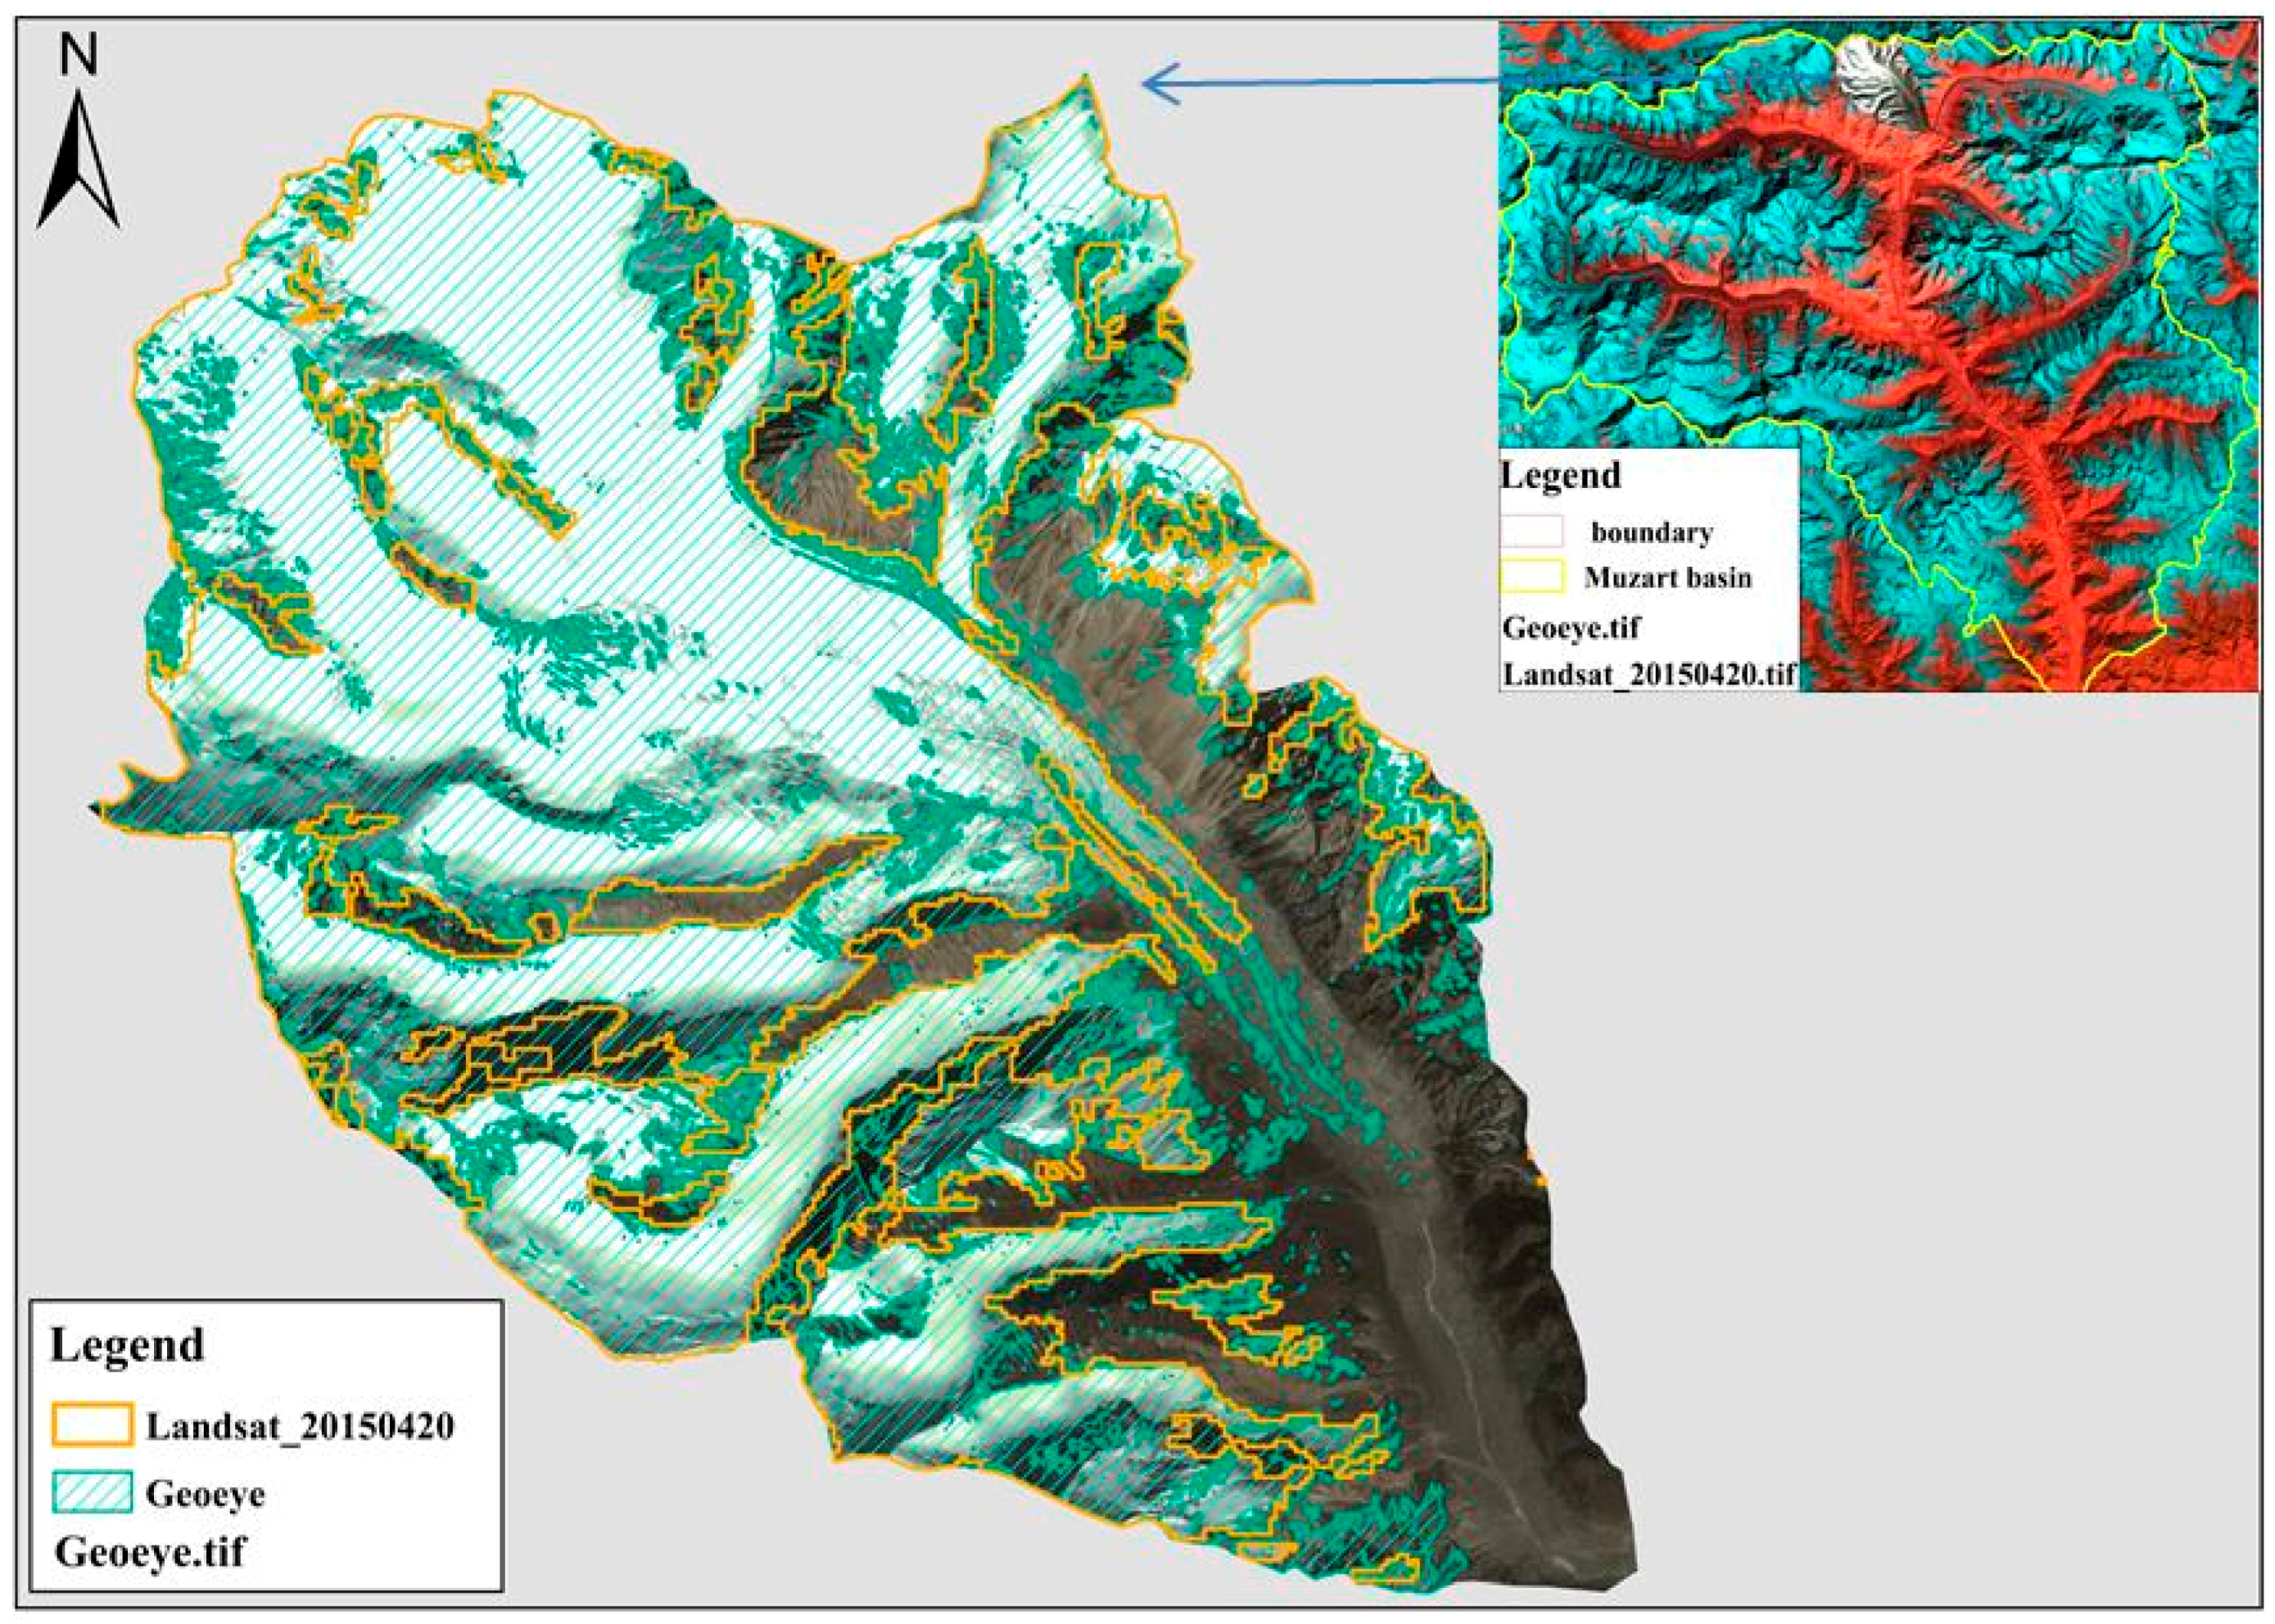
This study derives the glacier maps directly from Landsat images in 2007 and 2013 by utilizing the object-based classification approach, thus can detect the glacier’s 2D and 3D area changes using consistent glacier maps between the two years. In glacier extraction, snow cover and glaciers are not separated, and it is not possible to distinguish them from optical images because of snow-covered glaciers. Meanwhile, both snow and glacier have a similar spectral signature in the optical wavelength range. Glacier/snow covered 65% of this sub-catchment with a total area of 50.5 km2 on 20 April 2015 in the validation GeoEye image (Figure 4). Statistical results show that the glacier/snow classification accuracy is 89.3% (Table 1). Both glacier boundary lines match well with the underlying white glacier/snow of GeoEye images. Most differences are located in debris-covered glaciers, shaded glaciers and the glacier edges. Some of those small and scattering glaciers identified by GeoEye images were seasonal snow in the lower ranges.
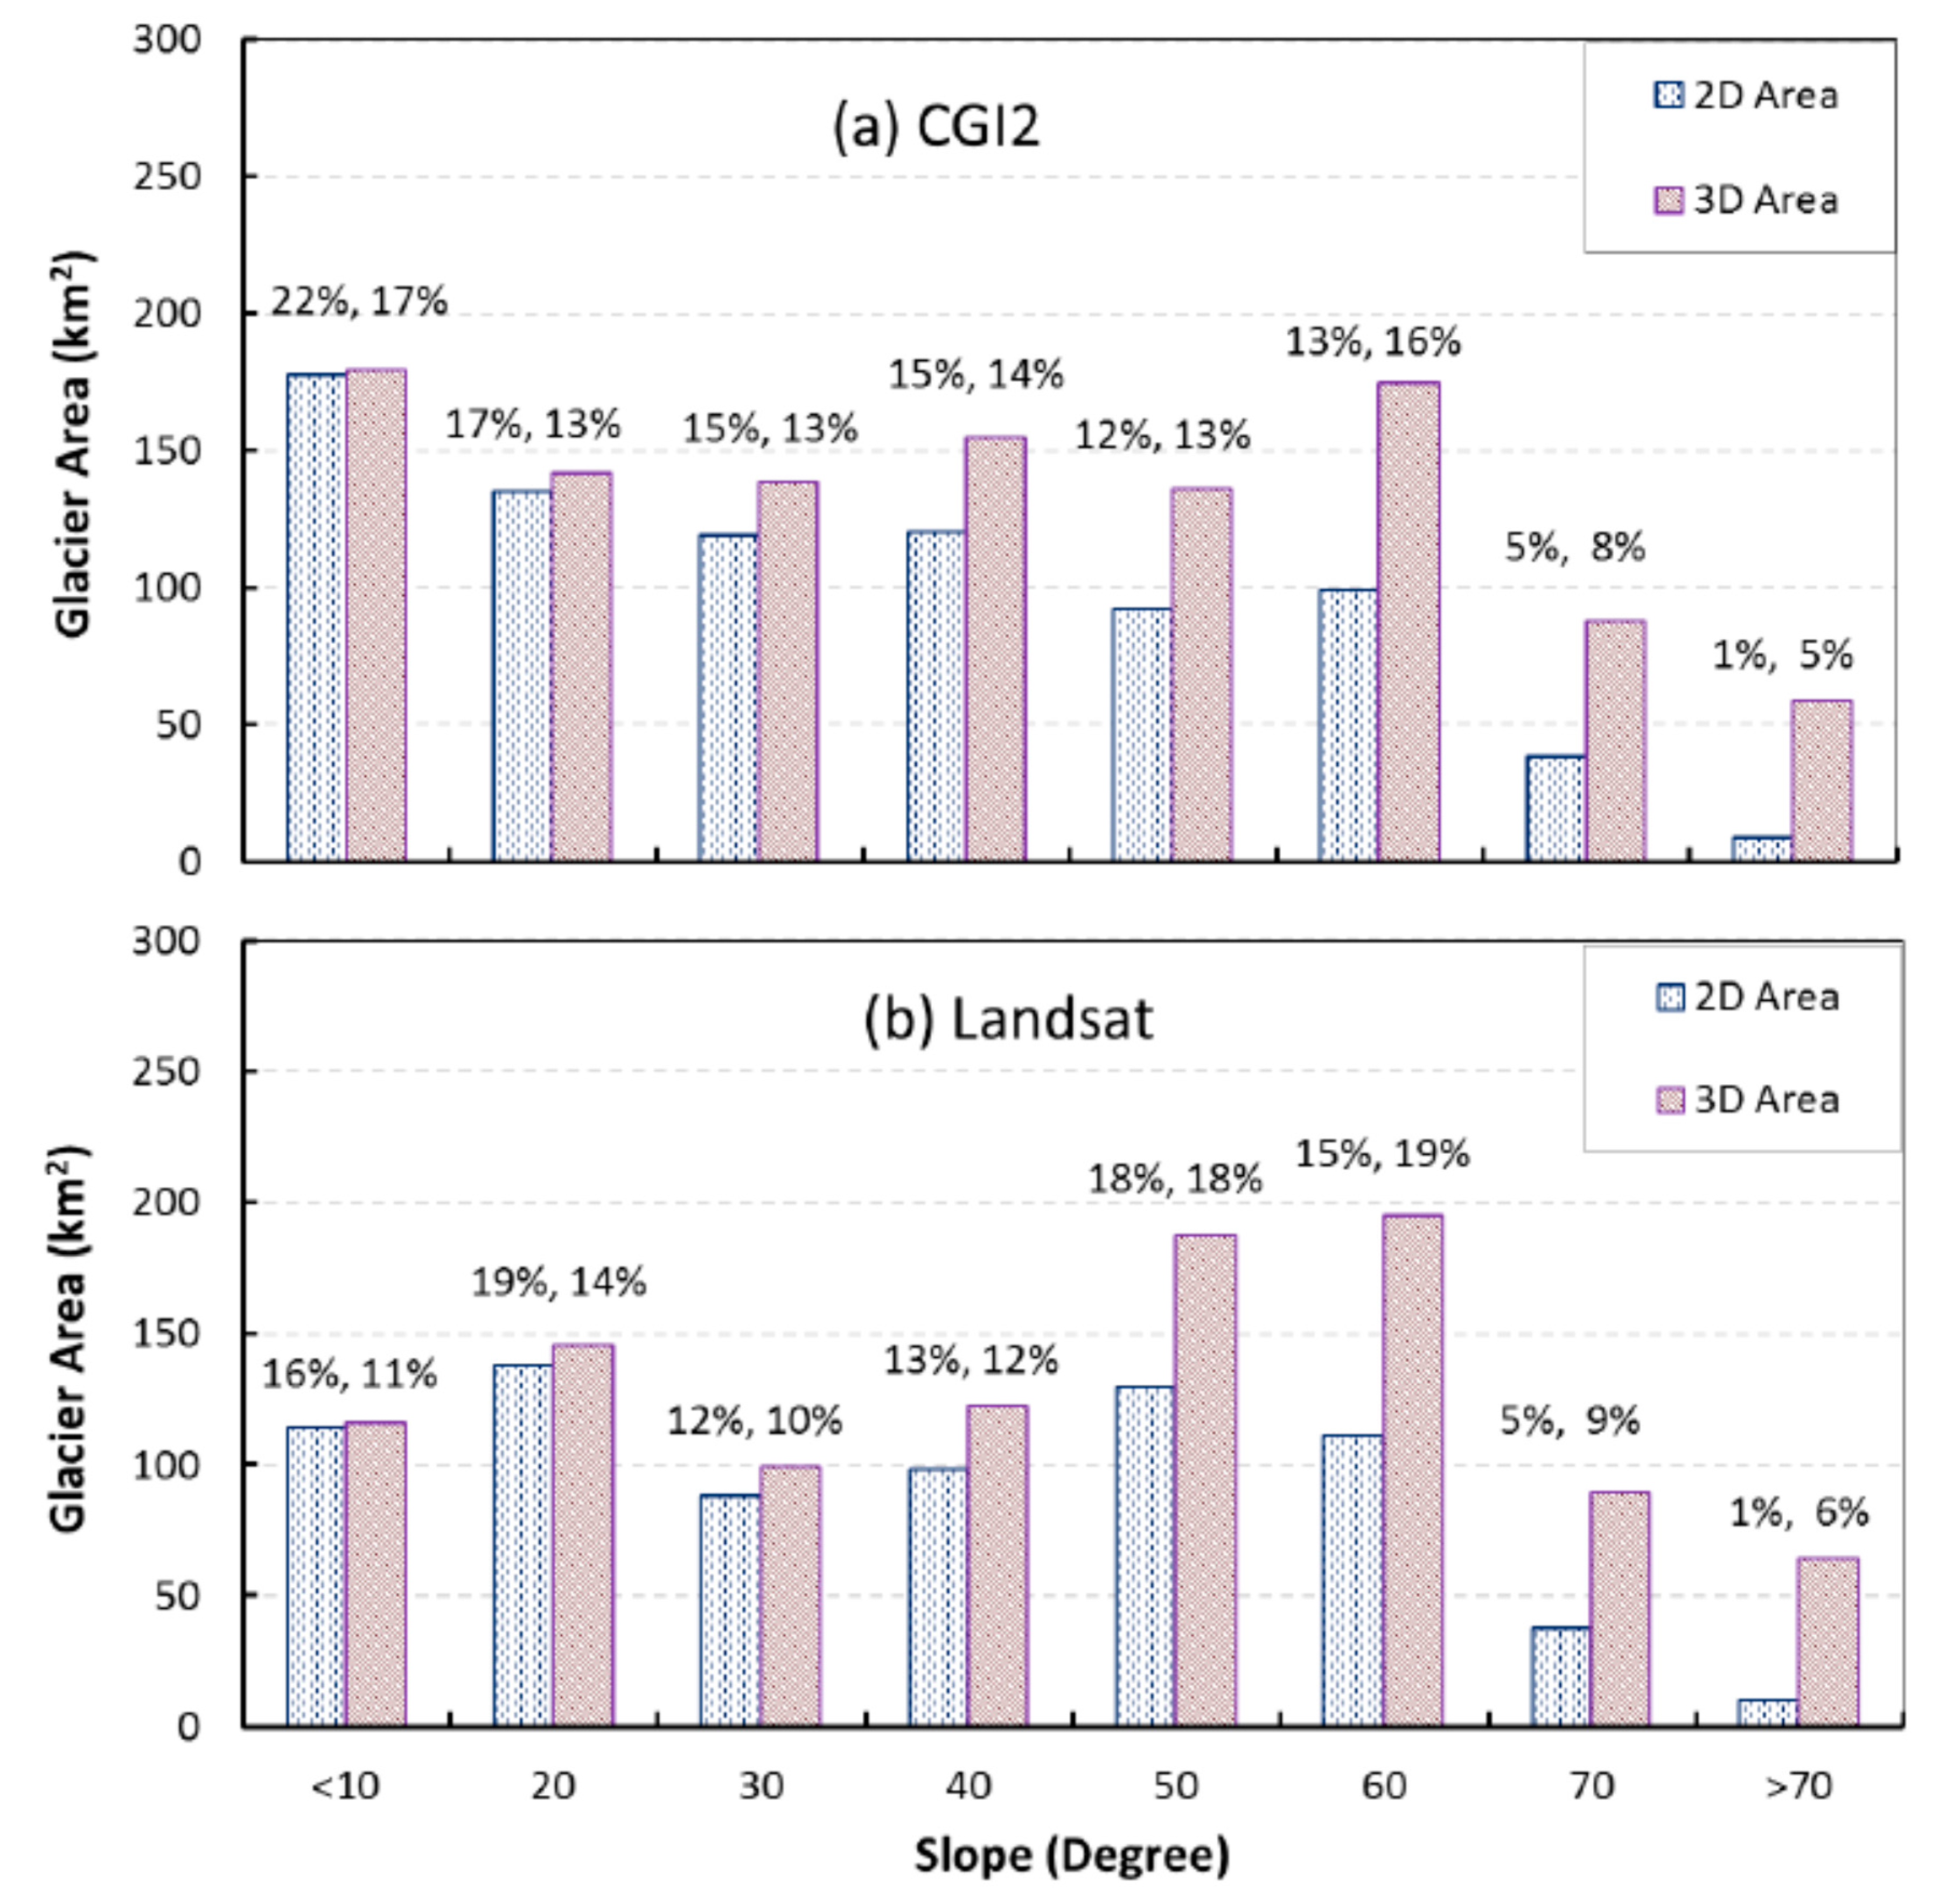
The extracted glacier areas (2D) are 89.3% of CGI2 in the Muzart Glacier catchment (Table 2), where the extracted glaciers’ 3D areas are 91.9% of CGI2. Most of these lower estimates occur at the lower end of debris-covered glaciers and have gentle slope (Figure 5 and Figure 6). Most of the debris-covered/mixed glacier tongues are not classified as glaciers in this comparison due to their low reflectance, while CGI2 manually edits them to be glaciers (Figure 5). The glaciers’ area, as extracted from CGI2 in slope zones of less than 10°, is 22% of the total area for 2D areas and 17% of the total area for 3D areas (Figure 6a), while they are only 16% and 11%, respectively, for those extracted from Landsat images in this study (Figure 6b). The debris-covered glacier areas are around 5%–10% of the total areas according to statistical analysis of all CGI2 data in Central Tianshan [10].
3.2. Glacier Distributions
Glaciers distribute in a large range of slopes in the Muzart Glacier catchment (Figure 6a). According to CGI2, glaciers’ 2D planar areas are 1160 km2 in total, while their 3D surface extents are 1557 km2. About half of the glaciers lie in slopes larger than 30°, causing great differences (397 km2, 34.2%) between the 3D surface extents and 2D planar areas. When the slope is less than 10°, the absolute values of both 3D and 2D areas are similar, while their own frequency percentages reduce from 22% for the 2D area to 17% for the 3D area. When the slopes range from 10° to 20°, the 3D area is 5% larger than the 2D area. When the slopes range from 20° to 30°, the 3D area is 16% larger than the 2D area. When the slopes range from 40° to 50°, the 3D area is 47% larger than the 2D area. When the slope is larger than 50°, glaciers’ 3D areas are nearly two times that of the 2D areas. In addition, the slope zones separate the glacier catchment into many fractional areas instead of continuous areas like elevation bands, leading to large distribution differences/fluctuations between two glaciers (CGI2 and glaciers derived from Landsat images in this study) in each slope zones (Figure 6b).
The glacier maps extracted from Landsat images in 2007 are also analyzed in different elevation bands for their 2D and 3D areas in the Muzart Glacier catchment and the entire Central Tianshan (Figure 7). Their total glacier areas were 1036 km2 (1431 km2 for 3D) and 4518 km2 (5778 km2 for 3D) in 2007, and their 3D surface extents are 38.1% and 27.9% larger than the 2D planner areas, respectively (Table 2). These ratios remained similar in 2013. Most glaciers (83%) distribute in elevation bands of 4000–4500 m (47%) and 4500–5000 m (36%) in the Muzart Glacier catchment (Figure 7a). By contrast, glaciers are more evenly distributed throughout the entire Central Tianshan, although the frequency components of glaciers in the elevation bands of 4000–4500 m (38%) and 4500–5000 m (29%) are also dominant (67%), but smaller than those in the Muzart Glacier catchment (Figure 7b).
3.3. Glacier Area Changes
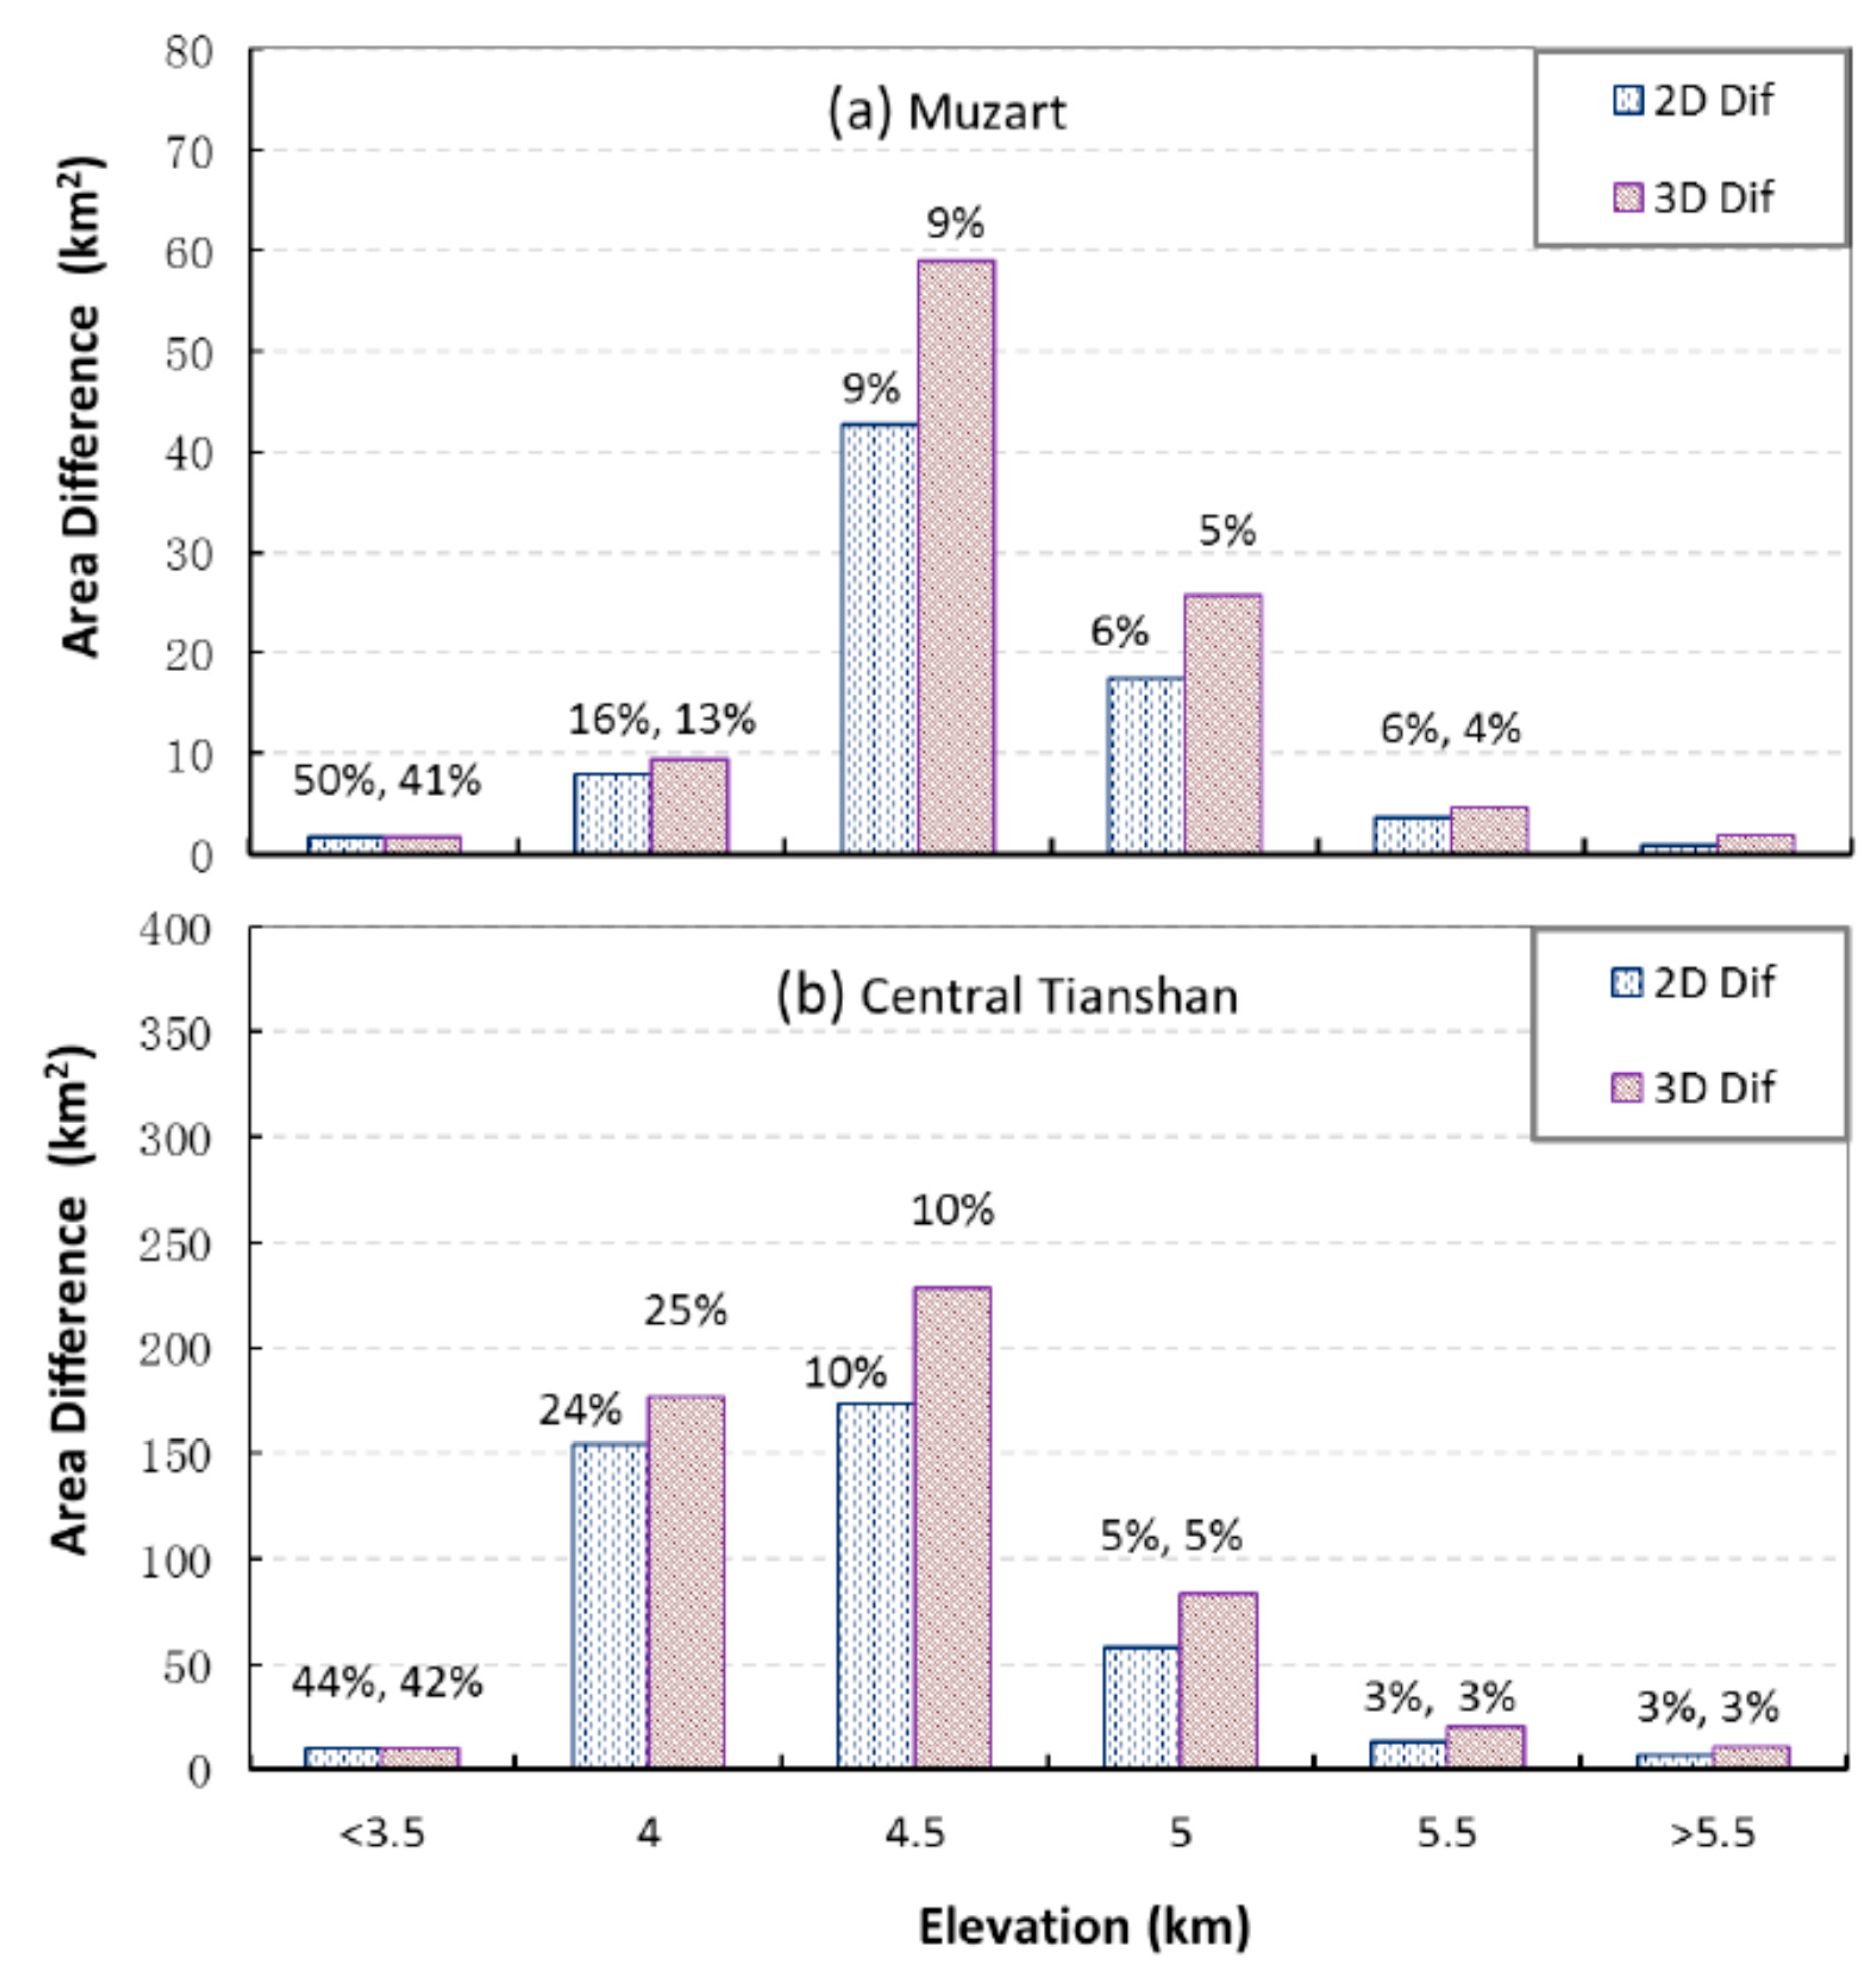
Aside from the glacier distributions in different slope zones and elevation bands, this study further compares the glaciers’ 2D and 3D area changes between 2007 and 2013, and their spatial distributions in different elevation bands in the Muzart Glacier catchment and Central Tianshan. Overall, the glacier areas reduced between 2007 and 2013 (Table 2). In the Muzart Glacier catchment, the 2D planar area reduced by 81 km2, while their actual 3D surface extents reduced by 111 km2, which is 30 km2 (37.0%) larger than the 2D planar area reduction, although their relative shrinking rates are quite similar. As expected, the shrinking rates decrease with elevation increase, and the dominant shrinking areas (42.8 km2, 57%) occurred in the elevation band of 4000–4500 m, where the actual 3D shrinking areas were 16.2 km2 (38%) larger than the 2D area (Figure 8a).
In the entire Central Tianshan Mountains, the 2D planar area reduced by 418 km2, while their actual 3D surface extents reduced by 533 km2, which is 115 km2 (27.6%) larger than the 2D planar area. Their relative shrinking rates are also similar, being slightly larger than that in the Muzart Glacier catchment (Table 2). The shrinking rates also decrease with elevation increase (Figure 8b), and the dominant shrinking areas occurred in the elevation bands of 3500–4000 m (37% for 2D area and 33% for 3D area) and 4000–4500 m (42% for 2D area and 36% for 3D area).
4. Discussion
4.1. Glacier Classifications
There are many factors that affect the accuracy of glacier classification using optical images, such as classification approach, seasonal snow, cloud, shadow, debris, and so on. The primary objective of this study is to investigate the differences between glacier’s 2D planar areas and 3D surface extents using CGI2 data, instead of developing or evaluating different classification approaches. In order to quantify how the difference of 2D and 3D areas affects the change rates of glaciers between different years, consistent glacier area products are expected to cancel out their systematic errors between different glacier products.
There are several classification methods and band-combination options to extract the glacier outlines in literature. This study only utilizes the object-based classification method to extract glacier outline from Landsat images and GeoEye images using the software eCognition 9.0. This approach has been widely used for glacier mapping recently [12,20,21,22]. The common procedure provided in the software manual is adopted to delineate the glacier outlines like those in the literature (Figure 3). Meanwhile, manual corrections were intensive in some areas, such as those within debris-covered/mixed glaciers, shade, under cloud or seasonal snow cover, similar to those stated in making the second Chinese Glacier Inventory [10]. In such complex situations, we compare the images acquired for different years, seasons and time, and only retain the minimum outline. As shown in Figure 9, loading the Landsat image on the 3D surface could be better than the 2D planar image to determine the shaded area and debris-covered glacier tongue, leading to higher confidence and accuracy in manual editing.
This classification approach is validated by comparing glacier outlines derived from high resolution GeoEye image on 20 April 2015, since there was no high spatial resolution image available on the date of the Landsat images, i.e., on 24 August 2007 and 10 September 2013. The selected validation image is constrained by the limited high spatial resolution images and the Landsat images on the same date in the study areas. There was much snow over glacier surface and nearby rocks on 20 April 2015, only when both the GeoEye and Landsat images were available and cloud-free in the study catchment. In practice, snow is not separated from glacier in classification, and a large part of the debris-covered glaciers are not included in our analysis as well (Figure 5). This explains why there is a larger area difference between 3D and 2D areas for our delineated glacier outlines (38.1%) than for those of CGI2 (34.2%) in the Muzart Glacier catchment (Table 2), since debris-covered glaciers have gentler slopes (Figure 5). The glacier 2D areas derived from the Landsat image on 20 April 2015 have an agreement of 89.3% with those from the GeoEye image (Table 1, Figure 4). The classified glacier 2D areas have 89.3% agreement with CGI2 in the Muzart Glacier catchment, both using the same Landsat images (Table 2, Figure 5). This accuracy is similar to those reported in the literature, e.g., 93% for clean ice, 83% for debris-covered glacier, and total accuracy of 91% [22]. This indicates that the classified glacier outlines are suitable for glaciers’ 2D and 3D area analysis.
4.2. Difference between Glacier 2D and 3D Areas
The difference between glacier 2D and 3D areas increases with slope in the Muzart Glacier catchment for both CGI2 and the classified glaciers, revealing their geometric relationship (Figure 6). The slope zones divide the study areas into many small fractions, resulting in larger uncertainties than the elevation bands due to the edge/boundary issues overlaying with glacier areas (Figure 6 and Figure 7). The 3D areas are 38.1% and 27.9% larger than the 2D areas in the Muzart Glacier catchment and Central Tianshan, respectively. This large difference is significant in calculating the total ice volume using the V-A scaling method [2,3,4], and computing surface energy balance and mass melting [9]. It is worthy of further investigation into whether or not 3D areas work better than 2D areas for estimating the total ice volume by the V-A scaling method.
The shrinking rates of glaciers’ 2D areas are −1.1%.a−1 for Muzart Glacier catchment and −1.3%.a−1 for Central Tianshan in this study. They fall within the ranges of those reported in the literature (Table 3). The glaciers’ area remained near constant in the Inylchek Glacier of Central Tianshan during 1999–2007 [27]. The largest shrinking rate was −1.7%.a−1 reported by Du and Li [28] in the Mt. Karlik of Eastern Tianshan during 2007–2013, then −1.0%.a−1 published by Kaldybayev [29] in the Karatal River Basin of Nothern Tianshan during 1989–2012. The mean glacier surface slope of CGI2 is 19.9°, while glaciers in the Central Tianshan, Pamir plateau, Qilian Mountains and Altun Mountains have the steepest glacier surfaces, over one-third of their surface slopes are greater than 30° [10]. Geometrically, the 3D area is 5% larger than the 2D area as the slope is larger than 18°, 15% larger for 30° and 41% larger for 45° (Figure 1). These large areal differences between 3D real surface extents and the projected virtual 2D area is significant not only in areal and volume calculation, but also in glaciers’ precise surface energy budget and mass balance/melting modeling, especially in the high Asian mountain glaciers with large surface slope and strong solar radiation.
5. Summary and Remark
This study utilizes the lastest relatively high-resolution global topographic data (ASTER GDEM V2) and CGI2 data to illustrate the large areal difference between glaciers’ 3D real surface extents and their projected 2D planar area in the Muzart Glacier catchment and Central Tianshan. Besides the CGI2 data, this study also extracts the glacier outlines from Landsat images in 2007 and 2013 by an object-based classification approach, which is validated using GeoEye high-resolution images and shows an accuracy of 89.3%. The extracted glacier outlines in 2007 also had an agreement of 89.3% with CGI2 data in the Muzart Glacier catchment. Most of the differences are in the lower-end of glaciers covered by debris.
The difference between 3D surface extents and 2D planar areas from those extracted glacier outlines in 2007 and 2013 (38.1%) are slightly larger than those of CGI2 (34.2%) in the Muzart Glacier catchment and were 27.9% on average in the entire Central Tianshan. The difference between 3D areas and 2D areas for the shrunk glaciers were slightly smaller than those of existing glaciers in the Muzart Glacier catchment (37.0%), and the entire Central Tianshan (27.6%) since many of the shrunk ones were located on the lower end of glaciers and had a smaller slope. Consequently, their relative shrinking rates from 2007 to 2013 were similar in both Muzart Glacier catchment (−7.8%, 30 km2) and Central Tianshan (−9.2%, 115 km2), although there was a large difference between 3D areas and 2D area of those shrunk glaciers. Those large areal differences remind us to re-consider glacier’s real topographic extent when discussing alpine glacier’s areal and volume changes, especially in calculating the glaciers surface energy balance and melting rates in the high Asian mountain glaciers with large surface slope and strong solar radiation.
Acknowledgments
This study was funded by the Open Foundation of the State Key Laboratory of Desert and Oasis Ecology, Xinjiang Institute of Ecology and Geography, Chinese Academy of Sciences (#G2014-02-06), Natural Science Foundation of China (#41371404, #41630859), Fundamental Research Funds from Sun Yat-sen University (#15lgzd06), and the Water Resource Science and Technology Innovation Program of Guangdong Province (#2016-19). Those funds were used to cover the costs of publishing in open access. We thank the World Data Center for Glaciology and Geocryology in Lanzhou, China, US NASA, Japan Space Systems and the Google Earth and DigitalGlobe companies for providing the CGI2, Landsat and GeoEye images and ASTER GDEM data support of our research work. Comments from two anonymous reviewers greatly improve this manuscript and are highly appreciated.
Author Contributions
Xianwei Wang designed the experiments, analyzed the results and wrote the manuscript; Huijiao Chen processed the data, analyzed the results and wrote part of the manuscript; Yanning Chen improved the experiments and results analysis.
Conflicts of Interest
The authors declare no conflict of interest.
References
- Aizen, V.B.; Aizen, E.M.; Kuzmichonok, V.A. Glaciers and hydrological changes in the Tien Shan: simulation and prediction. Environ. Res. Lett. 2007, 2, 45019. [Google Scholar] [CrossRef]
- Adhikari, S.; Marshall, S.J. Glacier volume-area relation for high-order mechanics and transient glacier states. Geophys. Res. Lett. 2012, 39, 6. [Google Scholar] [CrossRef]
- Bahr, D.B.; Meier, M.F.; Peckham, S.D. The physical basis of glacier volume-area scaling. J. Geophys. Res. Solid Earth 1997, 102, 20355–20362. [Google Scholar] [CrossRef]
- Chen, J.; Ohmura, A. Estimation of alpine glacier water resources and their change since the 1870s. In Hydrology in Mountainous Regions. I: Hydrological Measurements, the Water Cycle, Proceedings of Two International Symposia, Lausanne, Switzerland, 27 August–1 September 1990; Lang, H., Musy, A., Eds.; International Association of Hydrological Sciences (IAHS): Wallingford, UK, 1990; Volume 193, pp. 127–135. [Google Scholar]
- Farinotti, D.; Huss, M.; Bauder, A.; Funk, M.; Truffer, M. A method to estimate the ice volume and ice-thickness distribution of alpine glaciers. J. Glaciol. 2009, 55, 422–430. [Google Scholar] [CrossRef]
- Meier, M.F.; Dyurgerov, M.B.; Rick, U.K.; O'Neel, S.; Pfeffer, W.T.; Anderson, R.S.; Anderson, S.P.; Glazovsky, A.F. Glaciers Dominate Eustatic Sea-Level Rise in the 21st Century. Science 2007, 317, 1064–1067. [Google Scholar] [CrossRef] [PubMed]
- Cogley, J.G.; Hock, R.; Rasmussen, L.A.; Arendt, A.A.; Bauder, A.; Braithwaite, R.J.; Jansson, P.; Kaser, G.; Möller, M.; Nicholson, L. Glossary of Glacier Mass Balance and Related Terms; IHP-VII Technical Documents in Hydrology No. 86, IACS Contribution No. 2; UNESCO-IHP: Paris, France, 2011. [Google Scholar]
- Fierz, C.; Armstrong, R.L.; Durand, Y.; Etchevers, P.; Greene, E.; McClung, D.M.; Nishimura, K.; Satyawali, P.K.; Sokratov, S.A. The International Classification for Seasonal Snow on the Ground; IHP-VII Technical Documents in Hydrology No.83, IACS Contribution No.1; UNESCO-IHP: Paris, France, 2009. [Google Scholar]
- Zhang, Y.; Luo, Y.; Sun, L.; Liu, S.; Chen, X.; Wang, X. Using glacier area ratio to quantify effects of melt water on runoff. J. Hydrol. 2016, 538, 269–277. [Google Scholar] [CrossRef]
- Guo, W.; Liu, S.; Xu, J.; Wu, L.; Shangguan, D.; Yao, X.; Wei, J.; Bao, W.; Yu, P.; Liu, Q. The second Chinese glacier inventory: Data, methods and results. J. Glaciol. 2015, 61, 357–372. [Google Scholar] [CrossRef]
- Zhao, J.; Song, Y.; King, J.W.; Liu, S.; Wang, J.; Wu, M. Glacial geomorphology and glacial history of the Muzart River valley, Tianshan Range, China. Quat. Sci. Rev. 2010, 29, 1453–1463. [Google Scholar] [CrossRef]
- Bajracharya, S.R.; Maharjan, S.B.; Shrestha, F. The status and decadal change of glaciers in Bhutan from the 1980s to 2010 based on satellite data. Ann. Glaciol. 2014, 55, 159–166. [Google Scholar] [CrossRef]
- Ke, L.; Ding, X.; Song, C. Heterogeneous changes of glaciers over the western Kunlun Mountains based on ICESat and Landsat-8 derived glacier inventory. Remote Sens. Environ. 2015, 168, 13–23. [Google Scholar] [CrossRef]
- Paul, F.; Bolch, T.; Kääb, A.; Nagler, T.; Nuth, C.; Scharrer, K.; Shepherd, A.; Strozzi, T.; Ticconi, F.; Bhambri, R. The glaciers climate change initiative: Methods for creating glacier area, elevation change and velocity products. Remote Sens. Environ. 2015, 162, 408–426. [Google Scholar] [CrossRef]
- Petrakov, D.; Shpuntova, A.; Aleinikov, A.; Kääb, A.; Kutuzov, S.; Lavrentiev, I.; Stoffel, M.; Tutubalina, O.; Usubaliev, R. Accelerated glacier shrinkage in the Ak-Shyirak massif, Inner Tien Shan, during 2003–2013. Sci. Total Environ. 2016, 562, 364–378. [Google Scholar] [CrossRef] [PubMed]
- Wang, P.; Li, Z.; Wang, W.; Li, H.; Wu, L.; Huai, B.; Zhou, P.; Jin, S.; Wang, L. Comparison of changes in glacier area and thickness on the northern and southern slopes of Mt. Bogda, eastern Tianshan Mountains. J. Appl. Geophys. 2016, 132, 164–173. [Google Scholar] [CrossRef]
- Zhang, Y.; Zhang, L.; Yang, C.; Bao, W.; Yuan, X. Surface area processing in GIS for different mountain regions. Forest Sci. Pract. 2011, 13, 311–314. [Google Scholar] [CrossRef]
- Pieczonka, T.; Bolch, T.; Wei, J.; Liu, S. Heterogeneous mass loss of glaciers in the Aksu-Tarim Catchment (Central Tien Shan) revealed by 1976 KH-9 Hexagon and 2009 SPOT-5 stereo imagery. Remote Sens. Environ. 2013, 130, 233–244. [Google Scholar] [CrossRef]
- World Data Center for Glaciology and Geocryology, Lanzhou. Available online: http://wdcdgg.westgis.ac.cn/ (accessed on 12 October 2015).
- Kraaijenbrink, P.D.A.; Shea, J.M.; Pellicciotti, F.; Jong, S.M.D.; Immerzeel, W.W. Object-based analysis of unmanned aerial vehicle imagery to map and characterise surface features on a debris-covered glacier. Remote Sens. Environ. 2016, 186, 581–595. [Google Scholar] [CrossRef]
- Nijhawan, R.; Garg, P.; Thakur, P. A comparison of classification techniques for glacier change detection using multispectral images. Perspect. Sci. 2016, 8, 377–380. [Google Scholar] [CrossRef]
- Robson, B.A.; Nuth, C.; Dahl, S.O.; Hölbling, D.; Strozzi, T.; Nielsen, P.R. Automated classification of debris-covered glaciers combining optical, SAR and topographic data in an object-based environment. Remote Sens. Environ. 2015, 170, 372–387. [Google Scholar] [CrossRef]
- Huang, C.; Davis, L.S.; Townshend, J.R.G. An assessment of support vector machines for land cover classification. Int. J. Remote Sens. 2002, 23, 725–749. [Google Scholar] [CrossRef]
- ASTER Global Digital Elevation Model (GDEM). Available online: http://gdem.ersdac.jspacesystems.or.jp/ (accessed on 12 March 2016).
- Frey, H.; Paul, F. On the suitability of the SRTM DEM and ASTER GDEM for the compilation of topographic parameters in glacier inventories. Int. J. Appl. Earth Obs. 2012, 18, 480–490. [Google Scholar] [CrossRef]
- Mashimbye, Z.E.; Clercq, W.P.D.; Niekerk, A.V. An evaluation of digital elevation models (DEMs) for delineating land components. Geoderma 2014, 213, 312–319. [Google Scholar] [CrossRef]
- Shangguan, D.H.; Bolch, T.; Ding, Y.J.; Kröhnert, M.; Pieczonka, T.; Wetzel, H.U.; Liu, S.Y. Mass changes of Southern and Northern Inylchek Glacier, Central Tian Shan, Kyrgyzstan, during ∼1975 and 2007 derived from remote sensing data. Cryosphere 2015, 9, 703–717. [Google Scholar] [CrossRef]
- Du, W.; Li, J. Mapping changes in the glaciers of the eastern Tienshan Mountains during 1977–2013 using multitemporal remote sensing. J. Appl. Remote Sens. 2014, 8, 689–697. [Google Scholar] [CrossRef]
- Kaldybayev, A.; Chen, Y.; Vilesov, E. Glacier change in the Karatal river basin, Zhetysu (Dzhungar) Alatau, Kazakhstan. Ann Glaciol 2016, 57, 11–19. [Google Scholar] [CrossRef]
- Wang, L.; Li, Z.; Wang, F.; Li, H.; Wang, P. Glacier changes from 1964 to 2004 in the Jinghe River basin, Tien Shan. Cold Reg. Sci. Technol. 2014, 102, 78–83. [Google Scholar] [CrossRef]
- Narama, C.; Kääb, A.; Duishonakunov, M.; Abdrakhmatov, K. Spatial variability of recent glacier area changes in the Tien Shan Mountains, Central Asia, using Corona (~1970), Landsat (~2000), and ALOS (~2007) satellite data. Glob. Planet. Chang. 2010, 71, 42–54. [Google Scholar] [CrossRef]
Figure 1.
Schematic diagram of the definitions of glacier’s area (A) and thickness (T) in a longitudinal glacier profile.
Figure 1.
Schematic diagram of the definitions of glacier’s area (A) and thickness (T) in a longitudinal glacier profile.

Figure 2.
Study area in Central Tianshan Mountain and the Muzart Glacier catchment (yellow line) of the upper Muzart River Basin, China. The analyzing areas are constrained by the 2500 m elevation contour (dark blue line).
Figure 2.
Study area in Central Tianshan Mountain and the Muzart Glacier catchment (yellow line) of the upper Muzart River Basin, China. The analyzing areas are constrained by the 2500 m elevation contour (dark blue line).

Figure 3.
Flowcharts of glacier outline delineation using object-based image classification.

Figure 4.
Glacier outlines derived from Landsat images (yellow polygons) and GeoEye images (blue polygon and background images) using object-based classification in the upper sub-catchment of the Muzart Glacier catchment on 20 April 2015.
Figure 4.
Glacier outlines derived from Landsat images (yellow polygons) and GeoEye images (blue polygon and background images) using object-based classification in the upper sub-catchment of the Muzart Glacier catchment on 20 April 2015.

Figure 5.
Comparison of glacier outlines of CGI2 (blue polygon) and those derived from Landsat images (yellow polygons and background images) in this study using object-based classification in the Muzart Glacier catchment on 24 August 2007.
Figure 5.
Comparison of glacier outlines of CGI2 (blue polygon) and those derived from Landsat images (yellow polygons and background images) in this study using object-based classification in the Muzart Glacier catchment on 24 August 2007.
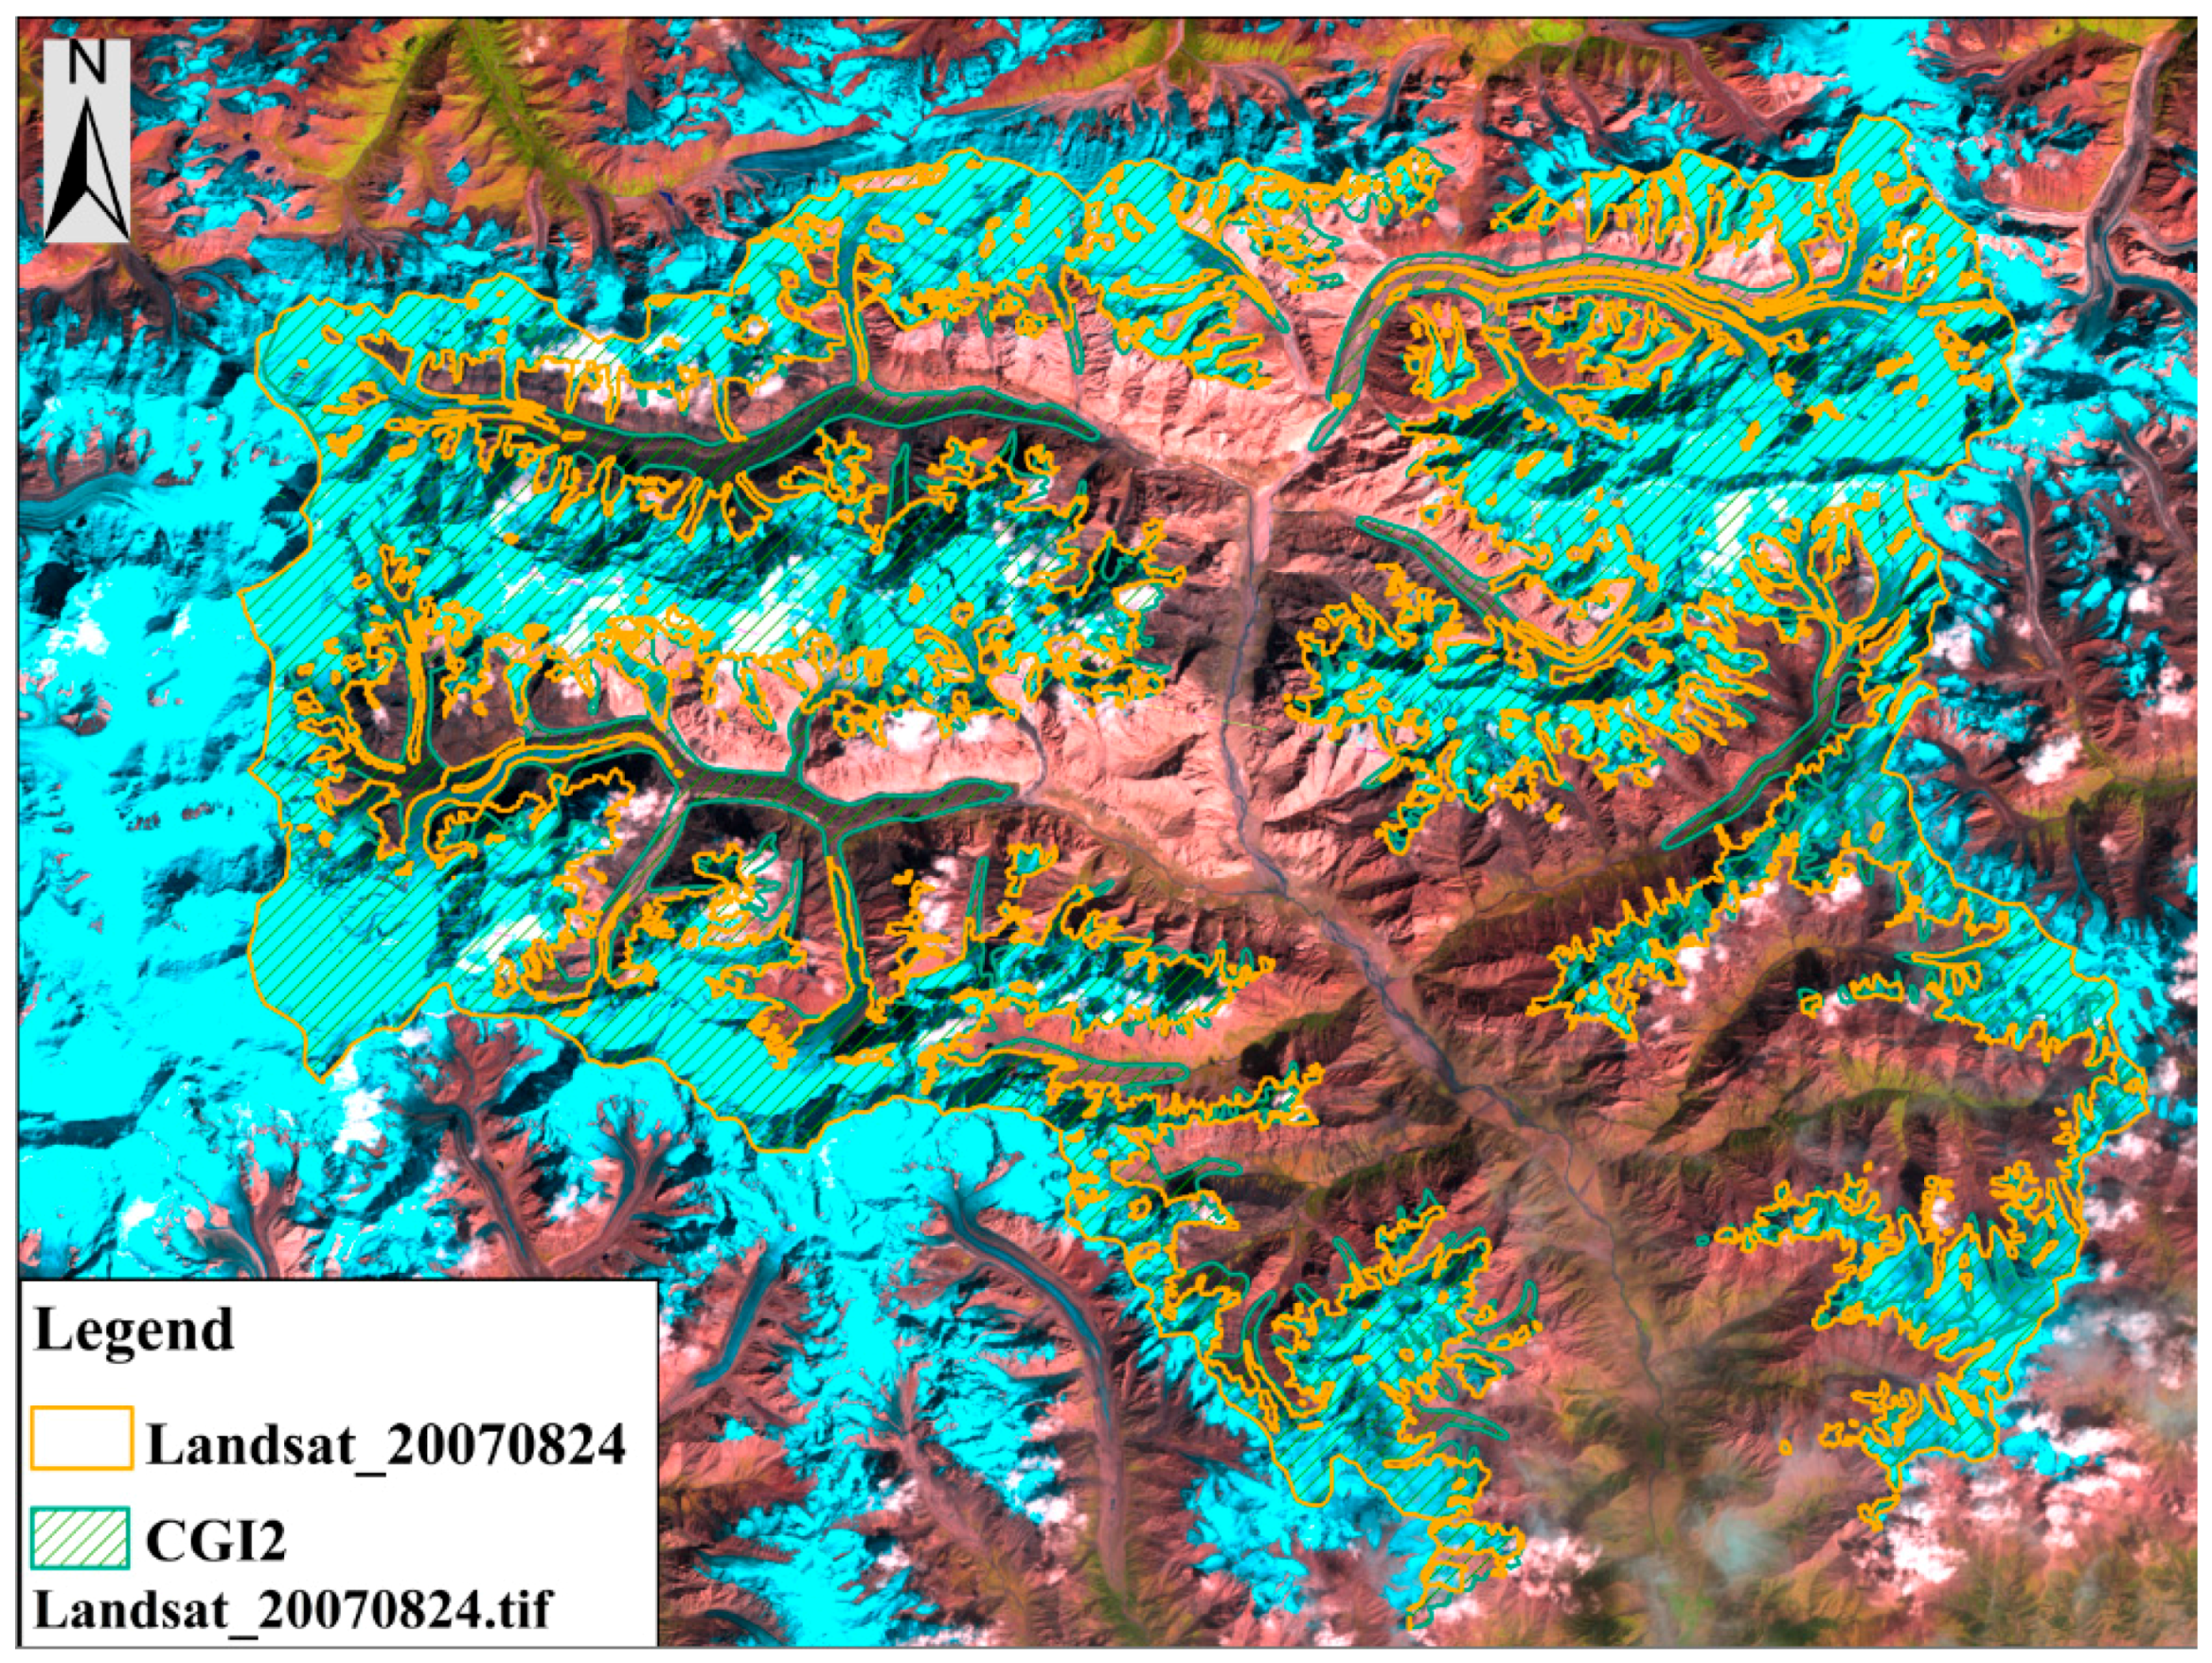
Figure 6.
Histogram of glacier 2D and 3D areas within different slope zones based on the second Chinese Glacier Inventory (CGI2) data (a) and glaciers classified from Landsat images (b) on 24 August 2007 in the Muzart Glacier catchment. The numbers above the columns are the frequency percentages of glacier areas in each slope zones against total 2D and 3D areas, respectively.

Figure 7.
Histogram of Glacier 2D and 3D areas within different elevation bands in 2007 in the Muzart Glacier catchment (a) and Central Tianshan (b). The numbers above the columns are the frequency percentages of glacier areas in each elevation bands against the total 2D and 3D areas, respectively.
Figure 7.
Histogram of Glacier 2D and 3D areas within different elevation bands in 2007 in the Muzart Glacier catchment (a) and Central Tianshan (b). The numbers above the columns are the frequency percentages of glacier areas in each elevation bands against the total 2D and 3D areas, respectively.
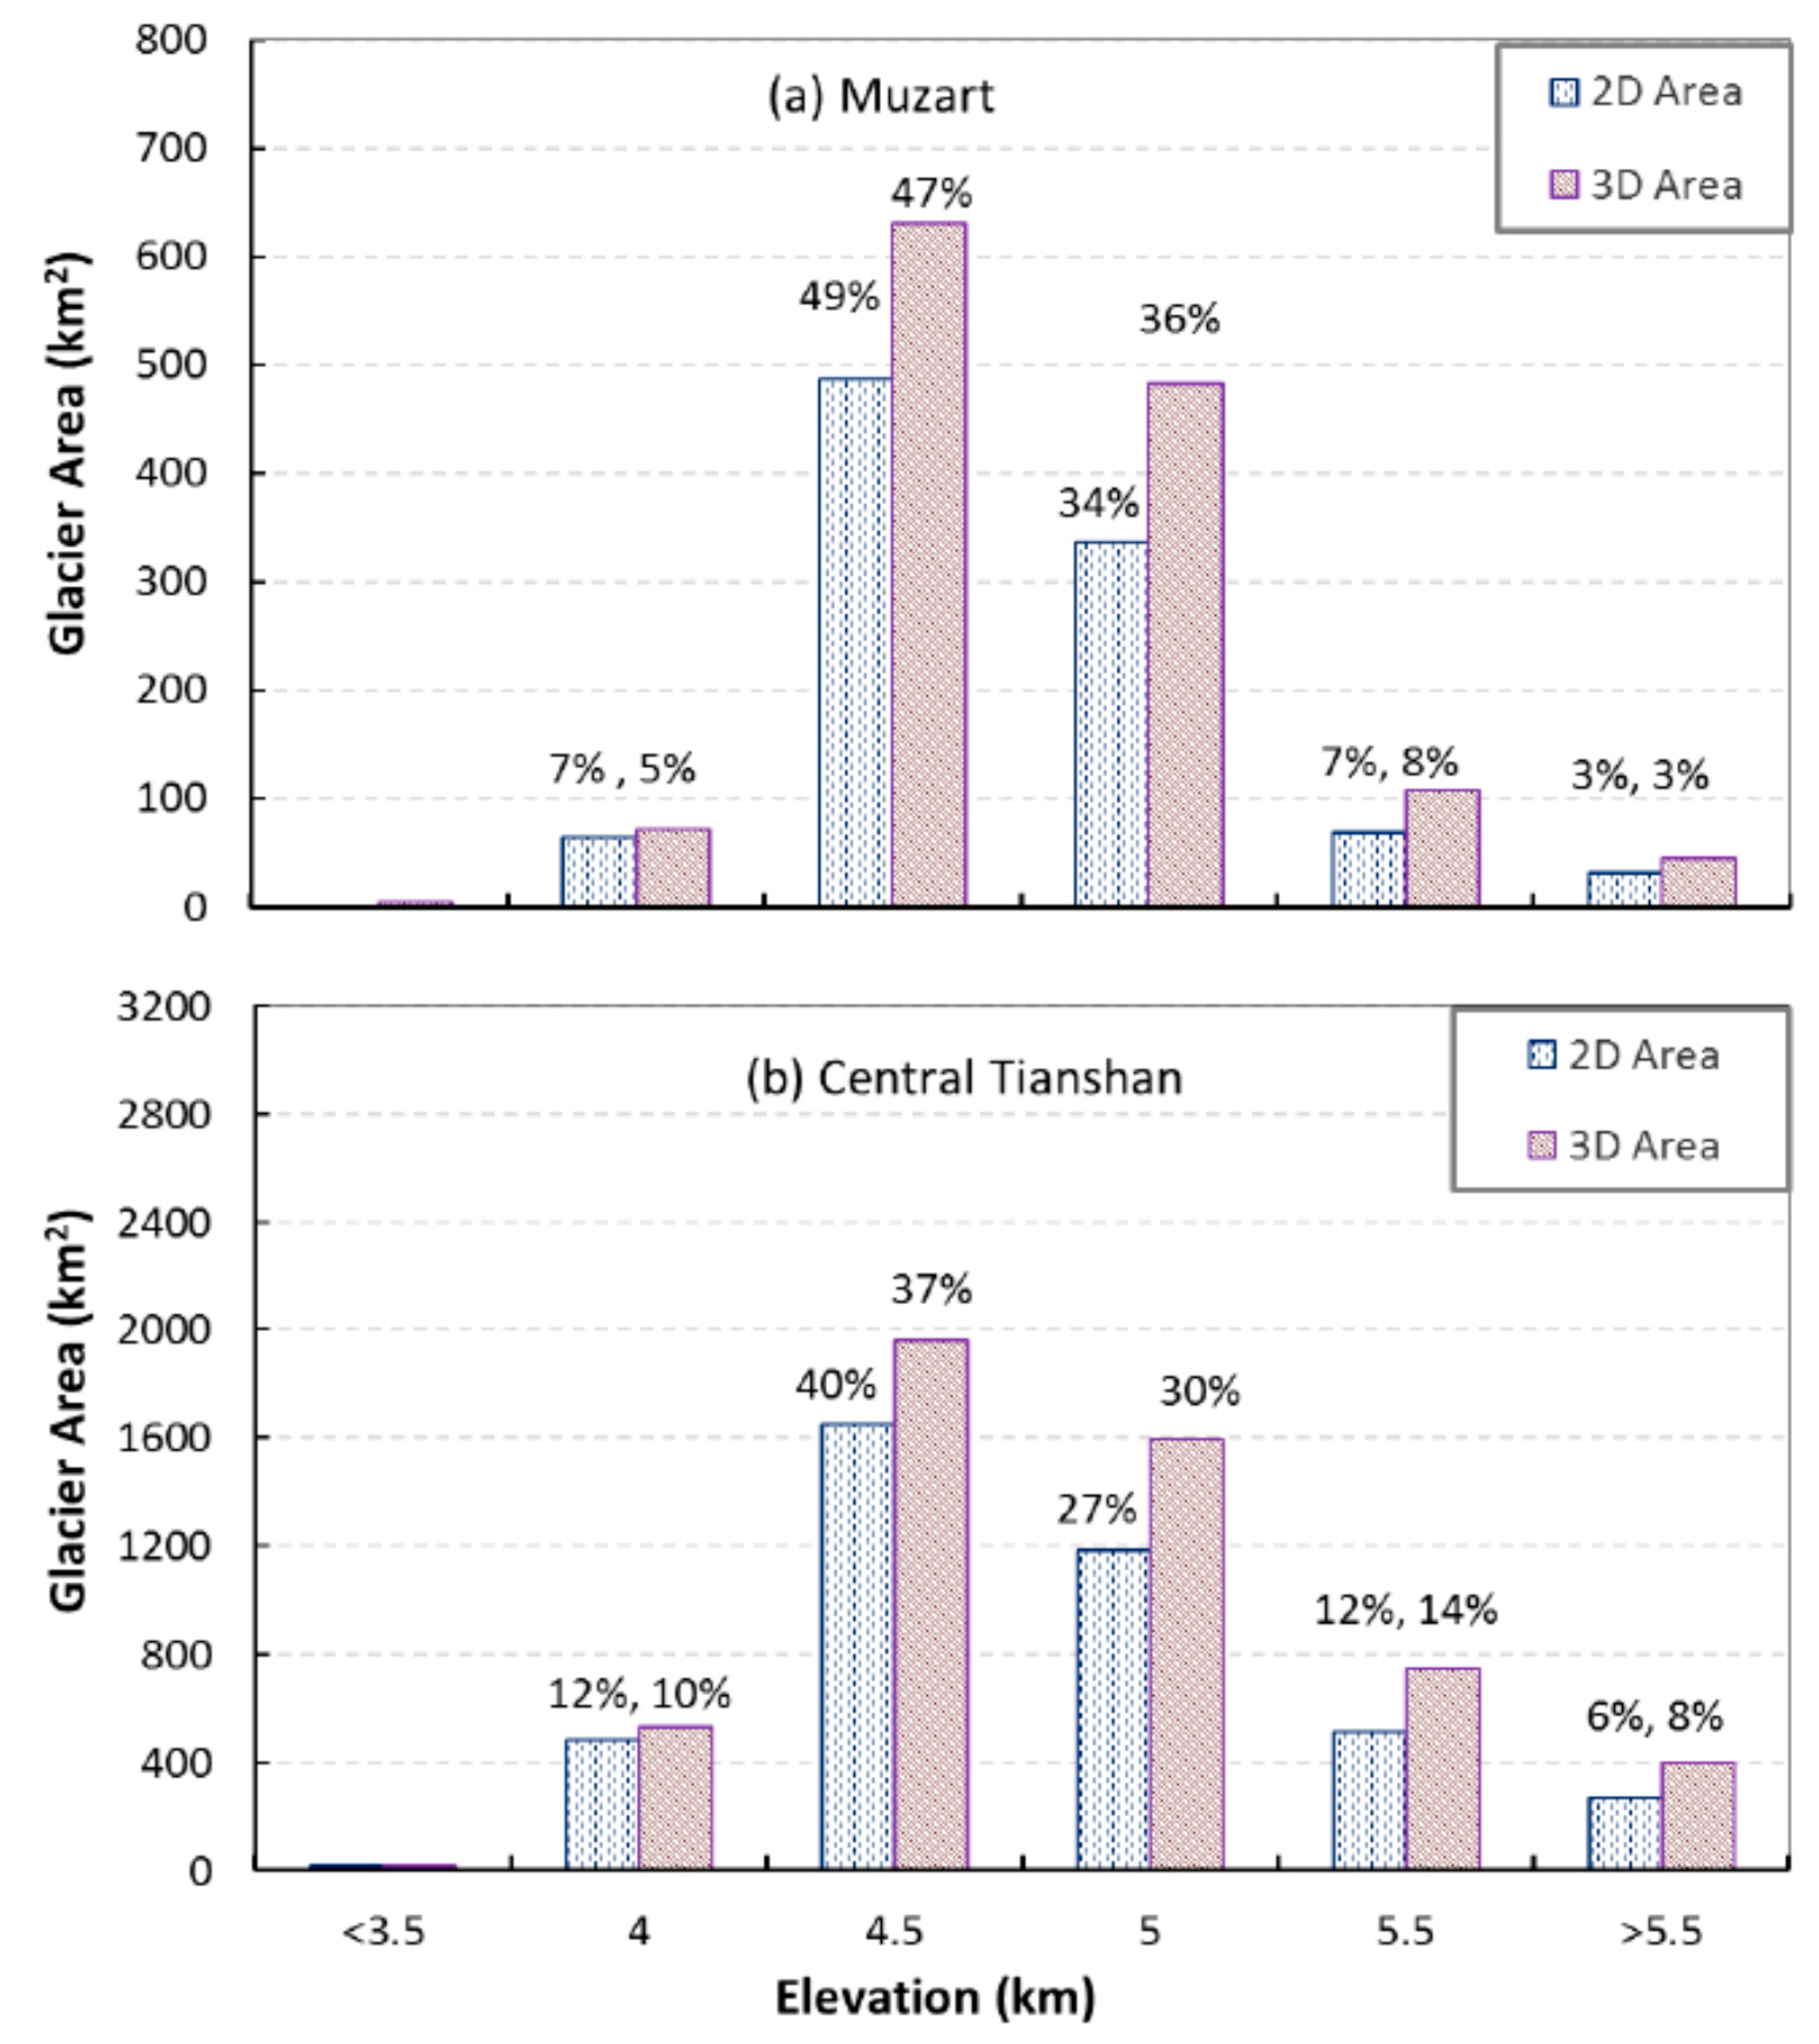
Figure 8.
Histogram of Glacier 2D and 3D area difference between 2007 and 2013 (2013–2007) in different elevation bands in the Muzart Glacier catchment (a) and Central Tianshan (b). The numbers above columns are the area shrinking rates ((2013–2007)/2007) in each elevation bands.
Figure 8.
Histogram of Glacier 2D and 3D area difference between 2007 and 2013 (2013–2007) in different elevation bands in the Muzart Glacier catchment (a) and Central Tianshan (b). The numbers above columns are the area shrinking rates ((2013–2007)/2007) in each elevation bands.

Figure 9.
Comparison of 3D (a) and 2D (b) glacier outlines in 2007 (green lines) and 2013 (white lines) in a glacier sub-catchment of the Muzart Glacier catchment (mid-west). The background image is the Landsat 8 on 10 September 2013.
Figure 9.
Comparison of 3D (a) and 2D (b) glacier outlines in 2007 (green lines) and 2013 (white lines) in a glacier sub-catchment of the Muzart Glacier catchment (mid-west). The background image is the Landsat 8 on 10 September 2013.


Table 1.
Error matrix of glacier mapping between Landsat and GeoEye01 images in the upper sub-catchment of the Muzart Glacier catchment on 20 April 2015.
Table 1.
Error matrix of glacier mapping between Landsat and GeoEye01 images in the upper sub-catchment of the Muzart Glacier catchment on 20 April 2015.
| Image Classification | Reference (km2) | 2015 Landsat 8 OLI (km2) | ||
|---|---|---|---|---|
| Glacier | Non-Glacier | |||
| GeoEye01 | Glacier | 32.8 | 29.3 | 3.5 |
| 89.3% | 10.7% | |||
| Non-glacier | 17.7 | 3.8 | 13.9 | |
| 21.5% | 78.5% | |||
| Overall Accuracy | 85.5% | |||
Table 2.
Statistics of glacier areas (km2) based on CGI2 and those extracted from Landsat images in the Muzart Glacier catchment and the entire Central Tianshan Mountain during 2007–2013. CGI2 does not cover the entire Central Tianshan; its statistics not given.
Table 2.
Statistics of glacier areas (km2) based on CGI2 and those extracted from Landsat images in the Muzart Glacier catchment and the entire Central Tianshan Mountain during 2007–2013. CGI2 does not cover the entire Central Tianshan; its statistics not given.
| Glaciers | Muzart Glacier Catchment | Central Tianshan Mountain | ||||
|---|---|---|---|---|---|---|
| 2D Area | 3D Area | Relative Difference (3D-2D)/2D | 2D Area | 3D Area | Relative Difference (3D-2D)/2D | |
| CGI2 | 1160 | 1557 | 34.2% | |||
| 24 August 2007 | 1036 | 1431 | 38.1% | 4518 | 5778 | 27.9% |
| Landsat/CGI2 | 89.3% | 91.9% | ||||
| 10 September 2013 | 953 | 1316 | 38.1% | 4101 | 5244 | 27.9% |
| Dif. (2013–2007) Dif. (2013–2007)/2007 | −81 | −111 | 37.0% | −418 | −533 | 27.6% |
| −7.76% | −7.82% | −9.25% | −9.23% | |||
Table 3.
The glaciers 2D area changes reported from different studies in Tianshan Mountains.
| Location | Region | Period | 2D Area Changes (%) | Change Rate (%.a−1) | Document Source |
|---|---|---|---|---|---|
| Jinghe River Basin | Eastern Tianshan | 1964–2004 | −15.2 | −0.4 | [30] |
| Karatal River Basin | Northern Tianshan | 1989–2012 | −23.0 | −1.0 | [29] |
| Ak-Shyirak massif | Western Tianshan | 2003–2013 | −5.9 | −0.6 | [15] |
| Ili-Kungoy | Central Tianshan | 2007–2013 | −4.0 | −0.4 | [31] |
| Mt. Karlik | Eastern Tianshan | 2007–2013 | −9.9 | −1.7 | [28] |
| Inylchek Glacier | Central Tianshan | 1999–2007 | −0.3 | −0.1 | [27] |
| Muzart Glacier (south) | Central Tianshan | 2007–2013 | −7.8 | −1.1 | This study |
| Central Tianshan | Central Tianshan | 2007–2013 | −9.2 | −1.3 | This study |
© 2017 by the authors. Licensee MDPI, Basel, Switzerland. This article is an open access article distributed under the terms and conditions of the Creative Commons Attribution (CC BY) license (http://creativecommons.org/licenses/by/4.0/).
Share and Cite
MDPI and ACS Style
Wang, X.; Chen, H.; Chen, Y. Large Differences between Glaciers 3D Surface Extents and 2D Planar Areas in Central Tianshan. Water 2017, 9, 282. https://doi.org/10.3390/w9040282
AMA Style
Wang X, Chen H, Chen Y. Large Differences between Glaciers 3D Surface Extents and 2D Planar Areas in Central Tianshan. Water. 2017; 9(4):282. https://doi.org/10.3390/w9040282
Chicago/Turabian StyleWang, Xianwei, Huijiao Chen, and Yaning Chen. 2017. "Large Differences between Glaciers 3D Surface Extents and 2D Planar Areas in Central Tianshan" Water 9, no. 4: 282. https://doi.org/10.3390/w9040282
Note that from the first issue of 2016, this journal uses article numbers instead of page numbers. See further details here.