Article

Adaptation of Cascade Hydropower Station Scheduling on A Headwater Stream of the Yangtze River under Changing Climate Conditions

1
MOE Key Laboratory of Regional Energy and Environmental Systems Optimization, North China Electric Power University, Beijing 102206, China
2
The Nature Conservancy, No.9 Jianwai Street, Chaoyang District, Beijing 100600, China
3
State Key Laboratory of Water Environment Simulation, School of Environment, Beijing Normal University, Beijing 100875, China
4
Department of Hydraulic Engineering, Tsinghua University, Beijing 100084, China
*
Author to whom correspondence should be addressed.
Water 2017, 9(4), 293; https://doi.org/10.3390/w9040293
Submission received: 25 February 2017 / Revised: 12 April 2017 / Accepted: 18 April 2017 / Published: 22 April 2017
(This article belongs to the Special Issue Adaptation Strategies to Climate Change Impacts on Water Resources)

Abstract

:
Cascade hydropower stations are effective in water resource utilization, regional water allocation, and flood risk management. Under changing climate conditions, water resources would experience complex temporal and spatial changes, which may lead to various issues relating to flood control and water resource management, and challenge the existing optimal scheduling of cascade hydropower stations. It is thus important to conduct a study on cascade hydropower station scheduling under changing climate conditions. In this study, the Jinsha River rainfall–discharge statistical model is developed based on the statistical relationship between meteorological and runoff indicators. Validation results indicate that the developed model is capable of generating satisfactory simulation results and thus can be used for future Jinsha River runoff projection under climate change. Meanwhile, the Providing Regional Climates for Impacts Studies (PRECIS) is run to project future rainfall in the Jinsha River basin under two General Circulation Models (ECHAM5 and HadAM3P), two scenarios (A1B and B2), and four periods (1961–1990, 1991–2020, 2021–2050, and 2051–2099). The regional climate modeling data are analyzed and then fed into the Jinsha hydrological model to analyze the trends of future discharge at Xiangjiaba Hydro Station. Adaptive scheduling strategies for cascade hydropower stations are discussed based on the future inflow trend analysis and current flood scheduling mode. It is suggested that cascade hydropower stations could be operated at flood limited water level (FLWL) during 2021–2099. In addition, the impoundment of cascade hydropower stations should be properly delayed during the post-flood season in response to the possible occurrence of increased and extended inflow in wet seasons.

1. Introduction

Hydropower developments on the Yangtze River and its headwater streams have drawn significant attention in China and globally. Among major headwater streams, the Jinsha River with its abundant runoff has become the largest hydropower base in the basin and in all of China. Key hydropower stations at the Wudongde, Baihetan, Xiluodu, and Xiangjiaba stations of the Jinsha River compose cascade hydropower stations [1]. Cascade hydropower stations are effective to enhance water resource utilization, optimize regional water allocation, and mitigate flood risk through comprehensive scheduling. However, the changing climate has shown significant impacts on flood frequency in the Jinsha River [2], which challenges the scheduling of the cascade hydropower stations [3,4]. In the past, a variety of studies have been carried out on the optimal scheduling of cascade hydropower stations [5,6,7]. These studies can generally be grouped into two categories. One is mainly to maximize the economic benefits of cascade hydropower stations, while the other is focused on developing site-specific cascade station operation rules from a flood control perspective.
The previous research emphasized the maximization of economic benefits focused on the development of techniques or the establishment of management rules and applying them to water resources management and planning [8]. For example, Wang et al. (2015) [1] established rules for long-term scheduling of large cascade hydropower stations on the Jinsha River, and revealed that the joint operation of cascade hydropower stations could effectively increase total power production in wet seasons. Mu et al. (2015) [9] established three operating rules for instructing the operation of the Three Gorges and Gezhouba cascade hydropower stations in the flood season, aiming to maximize total hydropower production. Jiang et al. (2014) [10] presented a method for optimizing cascade hydropower stations graphs. Li et al. (2014) [11] applied a parallel dynamic programming algorithm for optimization of a five-reservoir system in China. Overall, these studies highlighted power generation maximization but failed to take into account flood control linked to climate change. According to the Yangtze Conservation and Development Report, the flood hazards of the Yangtze River correlate to a large extent with climate change [12]. Specifically, water resources would experience complex temporal and spatial changes under a changing climate. These changes in tendency and extent would vary from one place to another, leading to a series of devastating flood hazards in different reaches of the Yangtze River basin.
Previous research on flood control mostly focused on developing site-specific flood control rules to support decision-making dealing with extreme floods [13]. For instance, Lund and Guzman (1999) [14] developed a rule that could help improve the fullness storage rate without increasing the flood risk. Wei and Hsu (2009) [15] established tree-based optimal operation release rules for handling real-time flood control of a multi-purpose multi-reservoir system. Chou and Wu (2014) [16] explored stage-wise optimizing release rules and applied them to a reservoir flood control operation. Chaleeraktrakoon and Chinsomboon (2014) [17] developed dynamic flood control level curves for a dam with limited reservoir capacity to cope with flooding.
Overall, the previous studies mostly focused either on maximizing hydropower production or mitigating flood risk. However, they failed to fully address the relationships between climatic factors and runoff of the Jinsha River for comprehensive, long-term flood scheduling. Therefore, the objective of this study is to propose an adaptation strategy for cascade hydropower station scheduling on the Jinsha River (a headwater stream of the Yangtze River) under changing climatic conditions. The objective will be achieved through integrating climate change factors into a hydrological model. Specifically, a Jinsha River rainfall–discharge statistical model is first developed based on the statistical relationship between meteorological and runoff indicators. In the meantime, high-resolution future precipitation distribution (1960–2099) over Jinsha watershed is simulated using PRECIS (Providing Regional Climates for Impacts Studies), a regional climate modeling tool, given its proven performance at reproducing climate change in China and globally. The obtained regional climate modeling data are then fed into the Jinsha hydrological model to analyze the trends of future discharge at the Xiangjiaba Hydro Station, the most downstream station of four cascade hydropower stations on the Jinsha River. Finally, climate change’s impacts on the hydrological frequency of the Jinsha River are analyzed and a scheduling adaptation strategy for cascade hydropower stations’ operation under climate change is proposed.

2. Rainfall Discharge Modeling over the Jinsha River Basin

The current techniques available for hydrological forecasting can be classified into two categories: process-driven models and data-driven models [18]. The process-driven models mainly take the internal physical mechanisms of hydrological processes into account, and usually need a large amount of data for calibration and validation. In previous studies, a number of process-based hydrological models were adopted for studying climate change studies in this region. For example, Wang et al. (2015) [19] proposed a rainfall–runoff process-based distributed hydrological model to explore the evolution of spatiotemporal variations of water resources from 1999 to 2099 associated with discussions on implications and uncertainties in the upstream Yangtze River region. Birkinshaw et al. (2017) [20] developed Shetran, a process-based, distributed hydrological model, to simulate discharge in the Yangtze River below the Three Gorges Dam at Yichang and examine the effect of climate change on river discharge for 2041–2070. Long et al. (2015) [21] adopted a global hydrological model (PCR-GLOBWB) for simulating total water storage changes in the Yangtze River basin. Lai et al. (2013) [22] developed a new Coupled Hydrodynamic Analysis Model aiming to simulate the water system in the middle reaches of the Yangtze River. Long et al. (2015) adopted a global hydrological model to simulate water storage changes for the Yangtze River basin. Chen et al. (2017) [23] mainly assessed changes of river discharge under global warming of 1.5 °C and 2 °C in the upper reaches of the Yangtze River Basin based on three distributed or semi-distributed hydrological models. Meng et al. (2016) [24] presented a rainfall-process hydrological model, which integrated the variable infiltration capacity model with artificial neural networks (ANNs) and applied it to Jinsha River basin for rainfall–runoff simulation.
Overall, most of the previous process-based hydrology models were developed for the study of discharge change with a focus on the Yangtze River. There are few process-base hydrological models developed and applied to Jinsha River basin. The Jinsha River process-based hydrological model developed by Meng et al. (2016) [24] did not take into account climate change impacts in a long-term discharge simulation. Although physical process-based hydrological models had advantages in directly addressing the relationship between climate change and water discharge dynamically, thus would provide more accurate information for decision support in a long-term perspective, accurate information requires a huge amount of high-quality data to simulate various hydrological processes. In fact, there were insufficient data available for supporting a high-quality process model development in the Jinsha River [25,26], the upper- most reaches of the Yangtze River. In addition, from a long-term perspective, the underlying surface conditions in the basin would be significantly changed. Such changes will affect the performance of process-based models in making future projections as they were developed based on past or current terrain and surface conditions.
The data-driven models adopt black-box methods, which do not ponder complicated physical hydrological processes, instead mathematically discerning the relationship between inputs and outputs. Linear regression models, as one kind of data-driven model based on observed time series (TS), have been widely used in water resources management to forecast streamflow forecasting in the past several decades. The linear regression models have also been applied to the upper-most reaches of the Jinsha River to predict the runoff at Batang station and analyze climate change’s impacts on runoff (Xiong et al. (2013) [27]). Such a study indicated that multivariate linear regression model is suitable for Jinsha River discharge projection due to the lower demands for quantitative data and simpler formulation. To address the issue that the daily precipitation observation is earlier than the daily discharge observation downstream of Jinsha River, the time difference will be calculated by dividing the distance between meteorological stations and Xiangjiaba hydropower station by the average stream flow velocity. Accordingly, the developed multivariate linear regression-model-based rainfall discharge model for the Jinsha River will also be improved with the consideration of the process of runoff generation.

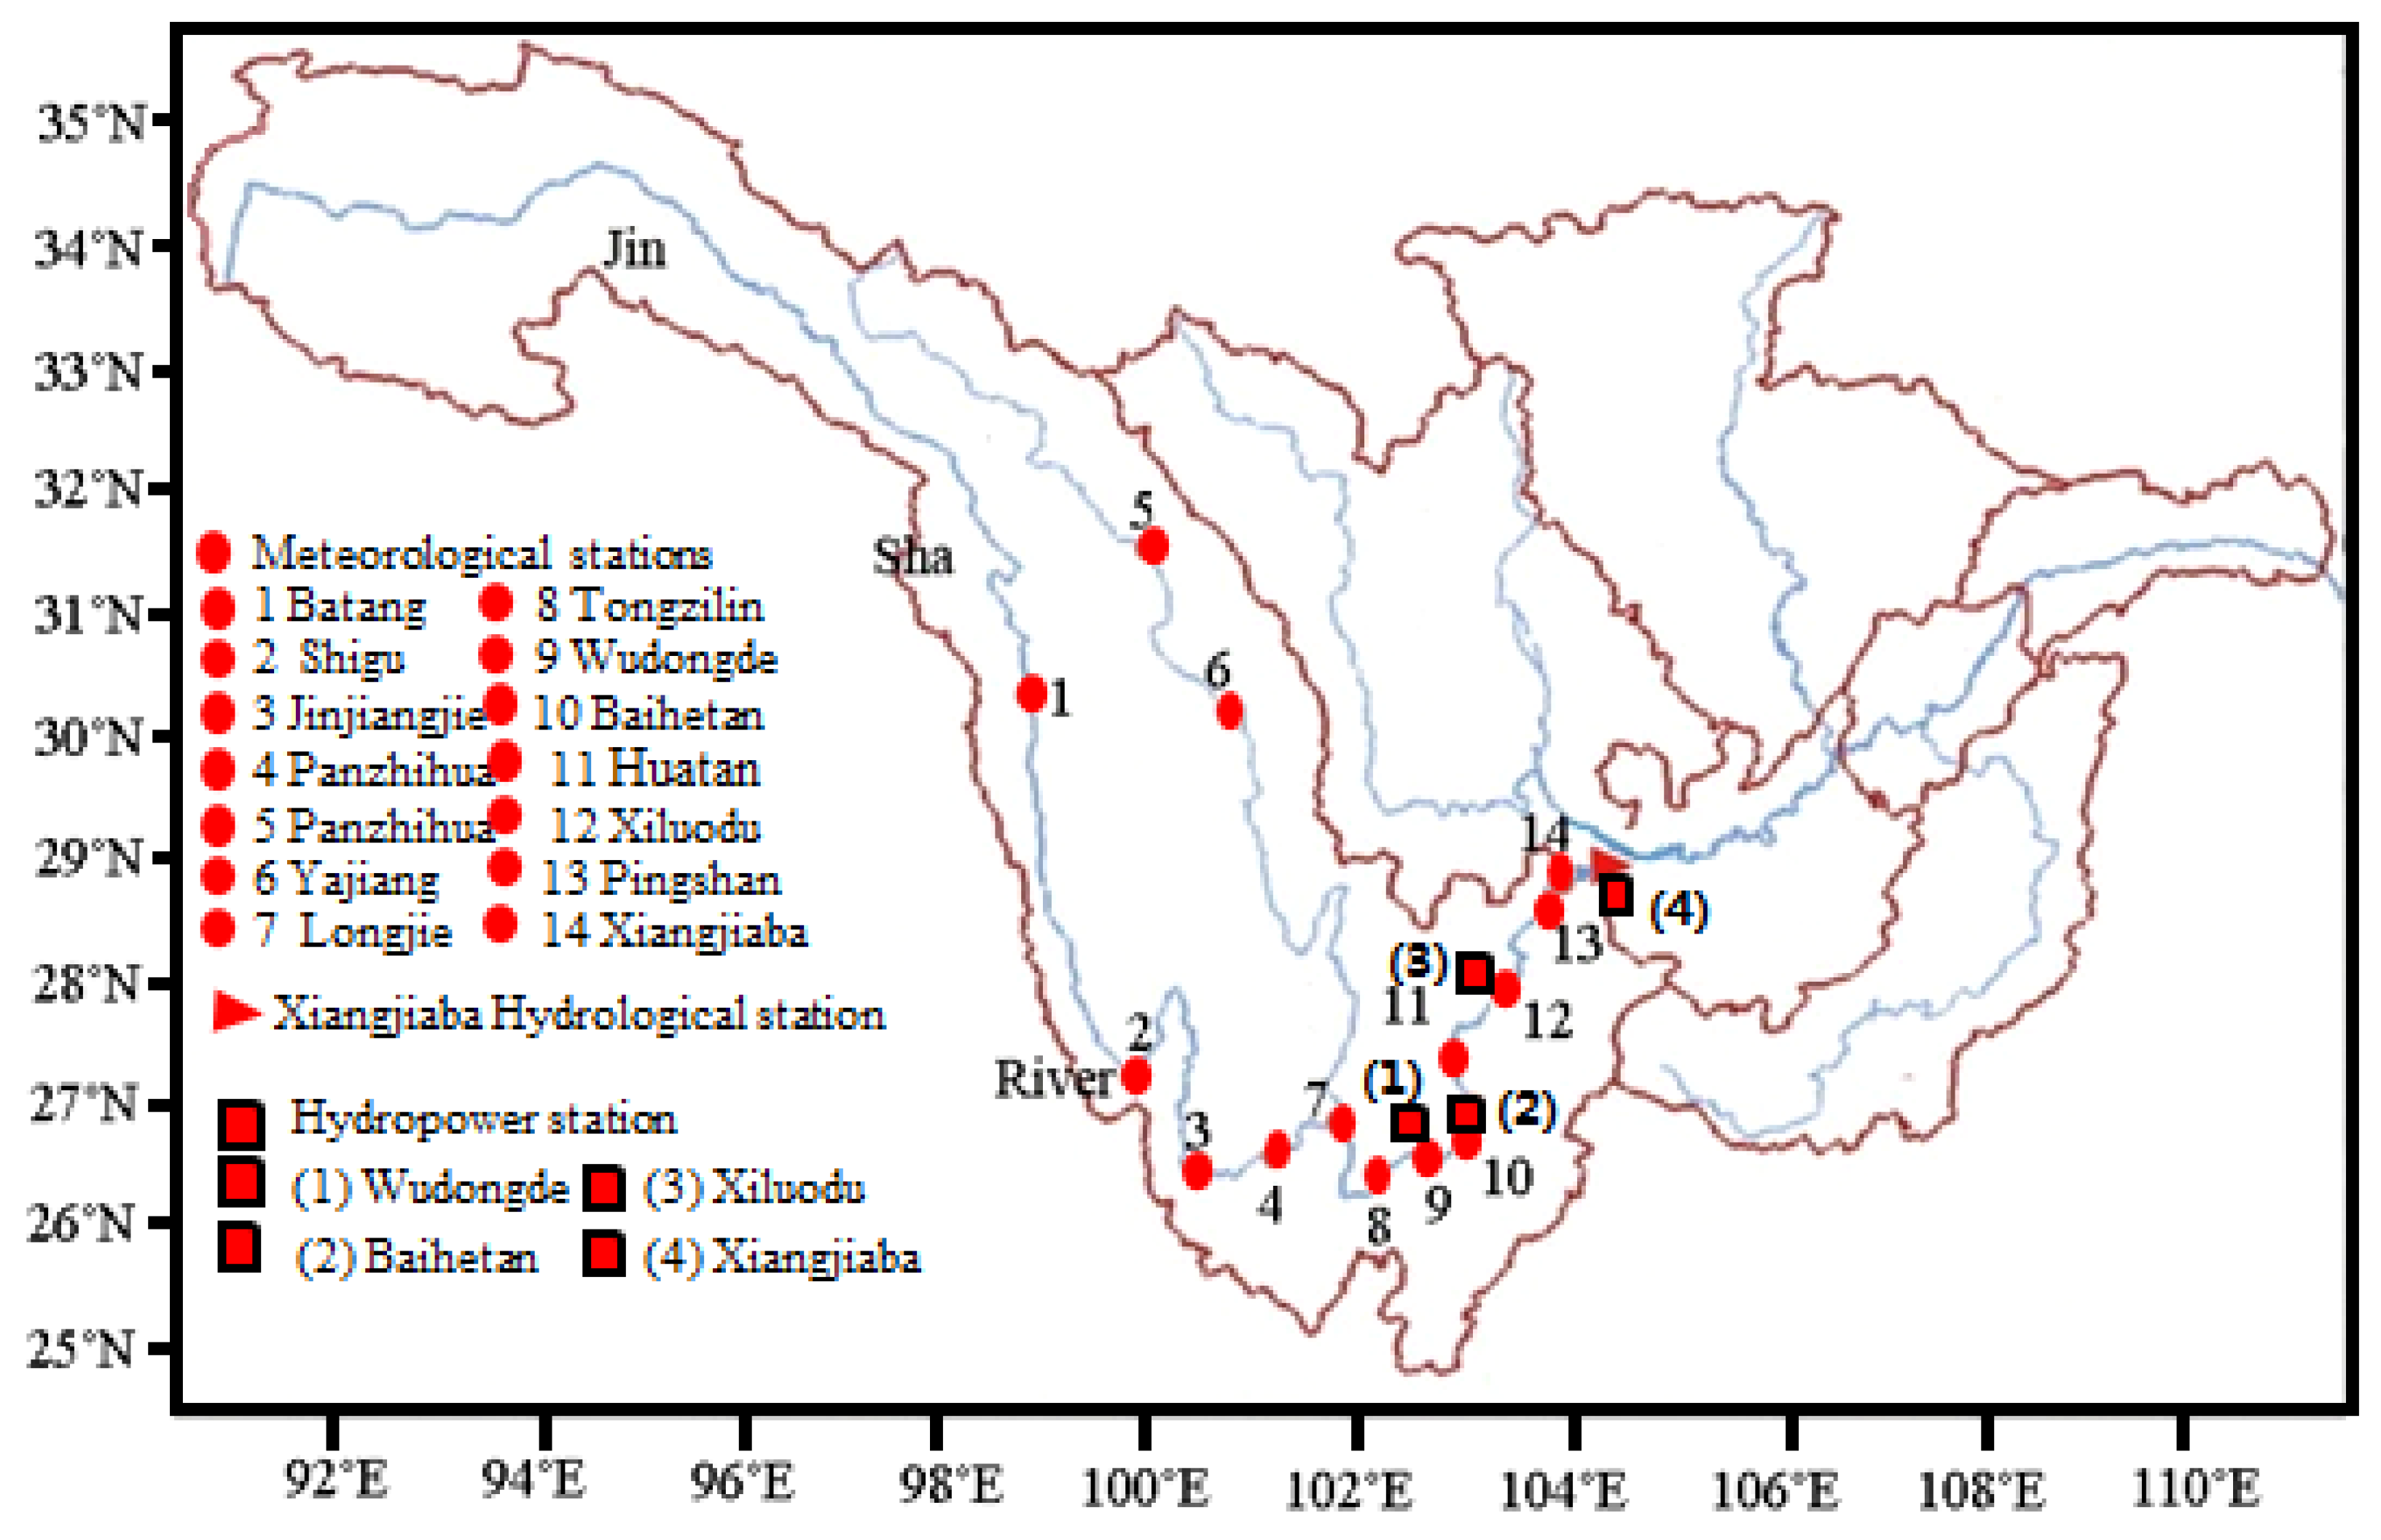
2.1. Overview of the Study Region and Data Collection

The Yangtze River Basin can be divided into three physiographic regions from upstream to downstream: Qinghai-Tibet Plateau, Mid-basin Mountains, and Eastern Plains region [28]. The selected region for this study is located in the upper Yangtze River reaches, namely Jinsha River and Yalong River (the largest tributary of Jinsha River). Jinsha River crosses the Qinghai-Tibet plateau, the Yunnan-Guizhou plateau and the western edge of Sichuan Basin, with longitude ranging from 90°23′ to 104°37′ and latitude from 24°28′ to 35°46′. The Jinsha River watershed covers an area of 326 × 103 km2, and its elevation ranges from 320 m to 6574 m [25]. The climate is quite different between the northern and southern regions. The northern area has a typical continental climate, whereas most of the southern area is characterized by monsoons. Under unfavorable climate conditions, the vegetation in Jinsha Basin generally shows poor growth, especially in dry and hot valley areas. The average annual rainfall in the Jinsha River basin is 750 mm, which mostly occurs from May to October. The annual runoff of the river is stable, which accounts for 34.7% of the upper reaches of the Yangtze River [29].
Cascade hydropower stations are all located downstream of Jinsha River. The missions of the cascade hydropower stations are flood control and electricity generation. The existing 14 weather stations are distributed along the Jinsha River, including Batang, Shigu, Jinjiangjie, Panzhihua, Tongzilin, Yajiang, Ganzi, Longjie, Wudongde, Huatan, Baihetan, Xiluodu, Pinshan, and Xiangjiaba. The Xiangjiaba hydrological station is located at the end of Jinsha River and thus is selected as the study station (Figure 1). Daily rainfall data from 14 meteorological stations from 2000 to 2014 were collected from the Climate Data Center, National Meteorological Information Center, China. Rainfall observation starts at 20:00 (Beijing time) and ends at 20:00 the next day. The corresponding data of Xiangjiaba discharge are exported from the Yangtze River Water Level Information Management System [30].

2.2. Weather Stations’ Rainfall Collinearity Inspection

Linear regression analysis is used to examine the relationship between rainfall and discharge in the upper Jinsha River basin and identify whether rainfall variables are independent. Rainfall data from 14 meteorological stations need to be examined through collinearity inspection. If a perfect or exact relationship exists among the 14 meteorological stations, collinearity inflates the variability of parameter estimates, which may lead to a lack of statistical significance of individual predictor variables even though the overall model may be significant.
Typical diagnostic indexes like eigenvalue, conditional index, and variance proportion can be used to analyze collinearity among rainfall variables using the Statistical Package for Social Sciences (SPSS) [31]. According to the rule of eigenvalues, if values are near zero, collinearity exists among these linear dependent variables. Condition index is the square root of the ratio of the largest eigenvalue to the corresponding eigenvalue. When the conditional index value exceeds 15, there may be collinearity among those explanation variables. It becomes more significant when the conditional index values are greater than 30. Variance proportion refers to the proportion of variance of each estimate that can be accounted for by each component. When variance components are more than 50% and condition indexes have a larger value, collinearity exists between these variables. Therefore, based on daily rainfall data for June, July, and August (the flood seasons), 14 meteorological stations, located along the Jinsha River (Figure 1) were selected to derive eigenvalues using SPSS. As illustrated in Table 1, the condition index does not exceed 15 and the variance proportion index is not more than 50%. Obviously, no collinearity is shown among the rainfall variables observed from the rainfall stations upstream of Xiangjiaba.

2.3. Rainfall–Discharge Multivariate Linear Regression Modeling

The collinearity inspection indicates that each rainfall data is an independent variable. Therefore, these rainfall variables can be used for multivariate linear regression analysis and modeling with SPSS software. Given the confluence process, observed rainfall at the meteorological stations will take time to be reflected at hydrological stations. The daily rainfall observation would be earlier than the daily discharge observation downstream of Xiangjiaba hydrological station. The period can be calculated by dividing the distance between meteorological stations and Xiangjiaba hydropower station by the average stream flow velocity. In this study, after a preliminary collinearity inspection analysis of rainfall upstream of Jinsha River basin, a statistical analysis was conducted with discharge at Xiangjiaba between independent variable and dependent variable. The rainfall observations at a series of meteorological stations, such as Batang, Shigu, Jinjiangjie, Panzhihua, Tongzilin, Yajiang, Ganzi, Longjie, Wudongde, Huatan, Baihetan, Xiluodu, Pinshan, and Xiangjiaba, were selected as independent input variable with detailed locations shown in Figure 1. Meanwhile, the observed discharges at Xiangjiaba were selected as dependent variables to reflect the rainfall intensity in the upstream reaches. The improved statistical rainfall–discharge model was developed as follows:
Y t = b 0 + K = 1 14 b k × X k , t d k ,
where Yt stands for the mean discharge (m3/s) at Xiangjiaba hydrologic station on date t; b0 is a constant term that reflects the stable inflow from glacial meltwater; bk is the actual rainfall–runoff generation coefficient and reflects the correlation between the mean discharge at Xiangjiaba hydrologic station and rainfall at each upstream meteorological station; Xk,tdk is the precipitation at meteorological station k (k = 1…14, representing the meteorological stations of Batang, Shigu, Jinjiangjie, Panzhihua, Tongzilin, Yajiang, Ganzi, Longjie, Wudongde, Huatan, Baihetan, Xiluodu, Pinshan, and Xiangjiaba, respectively) on date tdk (t minus dk), while the symbol of dk reflects the time lag before being observed at the Xiangjiaba hydrologic station, determined by the speed of runoff and the distance between meteorological station k and the hydrological station. To assess the statistical relationship between independent variables X and predictive variable Y, the F-test was used to test the significance of the regression equation. The determination coefficient R2 was employed to assess the accuracy of the simulation. Statistical correlation will be considered significant when R2 is larger than 0.7.
There are many different strategies for selection of variables in a regression model, including forward selection, backward selection, and step-wise selection. Stepwise regression is a combination of forward and backward selection methods. Every time a variable is added, all candidate variables in the model will be checked to see if their significance level has been reduced below a specified tolerance level. If a non-significant variable is found, it will be removed from the model. Step-wise regression requires two significant levels: one for adding variables and one for removing variables. The cutoff probability for adding variables should be smaller than the cutoff probability for removing variables so that the forward and backward selection procedure will not get stuck in an infinite loop. All these steps can be accomplished through SPSS software.
Through a step-wise method, shown in Table 2, it is indicated that the rainfall at Wudongde station would be accepted first, followed by rainfall at Xiangjiaba, Longjie, Jinjiangjie, Shigu, Ganzi, Bangtang, Huatan, Pingshan, Xiangjiaba, Tongzilin, Xiluodu, and Panzhihua stations. The above sieving sequence is mainly determined by the rainfall at each meteorological station in the multiple linear regression models’ contributions to the downstream runoff at Xiangjiaba hydrological station.
Through an F-test for rainfall–discharge regression model for June (Table 3), 13 rainfall variables are added to a model with a correlation coefficient of 0.717 and F less than 0.05. This means that the rainfall data can explain 71.7% of the flow at Xiangjiaba Station, indicating a statistically significant relationship with the discharge at Xiangjiaba Station. The T-test (Table 4) shows that the results of Baihetan rainfall between upstream rainfall variables and downstream discharge is 0.018 higher than 0.05, indicating that the rainfall at Baihetan Station does not exert a significant effect on the flow at Xiangjiaba Station. Thus, the variable X11, t can be excluded. Finally, the rainfall–discharge statistical model for June is formulated as follows:
Q J u n e , t = 2983 . 378 + 120 . 279 X 1 , t 7 133 . 664 X 2 , t 6 + 108 . 082 X 3 , t 3 32 . 282 X 4 , t 2 48 . 243 X 5 , t 2 + 23 . 760 X 6 , t 4 + 73 . 090 X 7 , t 5 + 93 . 203 X 8 , t 3 + 22 . 005 X 9 , t 1 + 46 . 549 X 10 , t 1 + 40 . 802 X 12 , t 254 . 881 X 13 , t + 161 . 600 X 14 , t .
Similarly, all the rainfall variables are added into the rainfall–discharge models for July and August, with the determination correlation coefficients hitting a maximum of 0.724 and 0.745 respectively. Different from the above statistical model for June, models for July and August show that all rainfall variables have passed the T-test, indicating an obvious effect of the upstream rainfall (mm/d) on the downstream runoff (m3/s). The Jinsha River rainfall–discharge statistical models for July and August are formulated as follows:
Q J u l y , t = 5809 . 456 26 . 897 X 1 , t 7 + 71 . 656 X 2 , t 6 + 89 . 609 X 3 , t 3 + 63 . 204 X 4 , t 2 + 33 . 183 X 5 , t 2 + 41 . 21 X 6 , t 4 35 . 453 X 7 , t 5 + 26 . 509 X 8 , t 3 + 28 . 282 X 9 , t 1 + 34 . 461 X 10 , t 1 22 . 262 X 11 , t + 36 . 575 X 12 , t + 33 . 263 X 13 , t 33 . 058 X 14 , t
Q A u g u s t , t = 5338 . 339 + 150 . 121 X 1 , t 7 + 51 . 132 X 2 , t 6 + 94 . 487 X 3 , t 3 + 41 . 111 X 4 , t 2 + 49 . 356 X 5 , t 2 + 33 . 169 X 6 , t 4 + 56 . 208 X 7 , t 5 52 . 334 X 8 , t 3 + 39 . 558 X 9 , t 1 34 . 519 X 10 , t 1 + 34 . 406 X 11 , t 32 . 511 X 12 , t 41 . 160 X 13 ,   t + 68 . 677 X 14 , t .

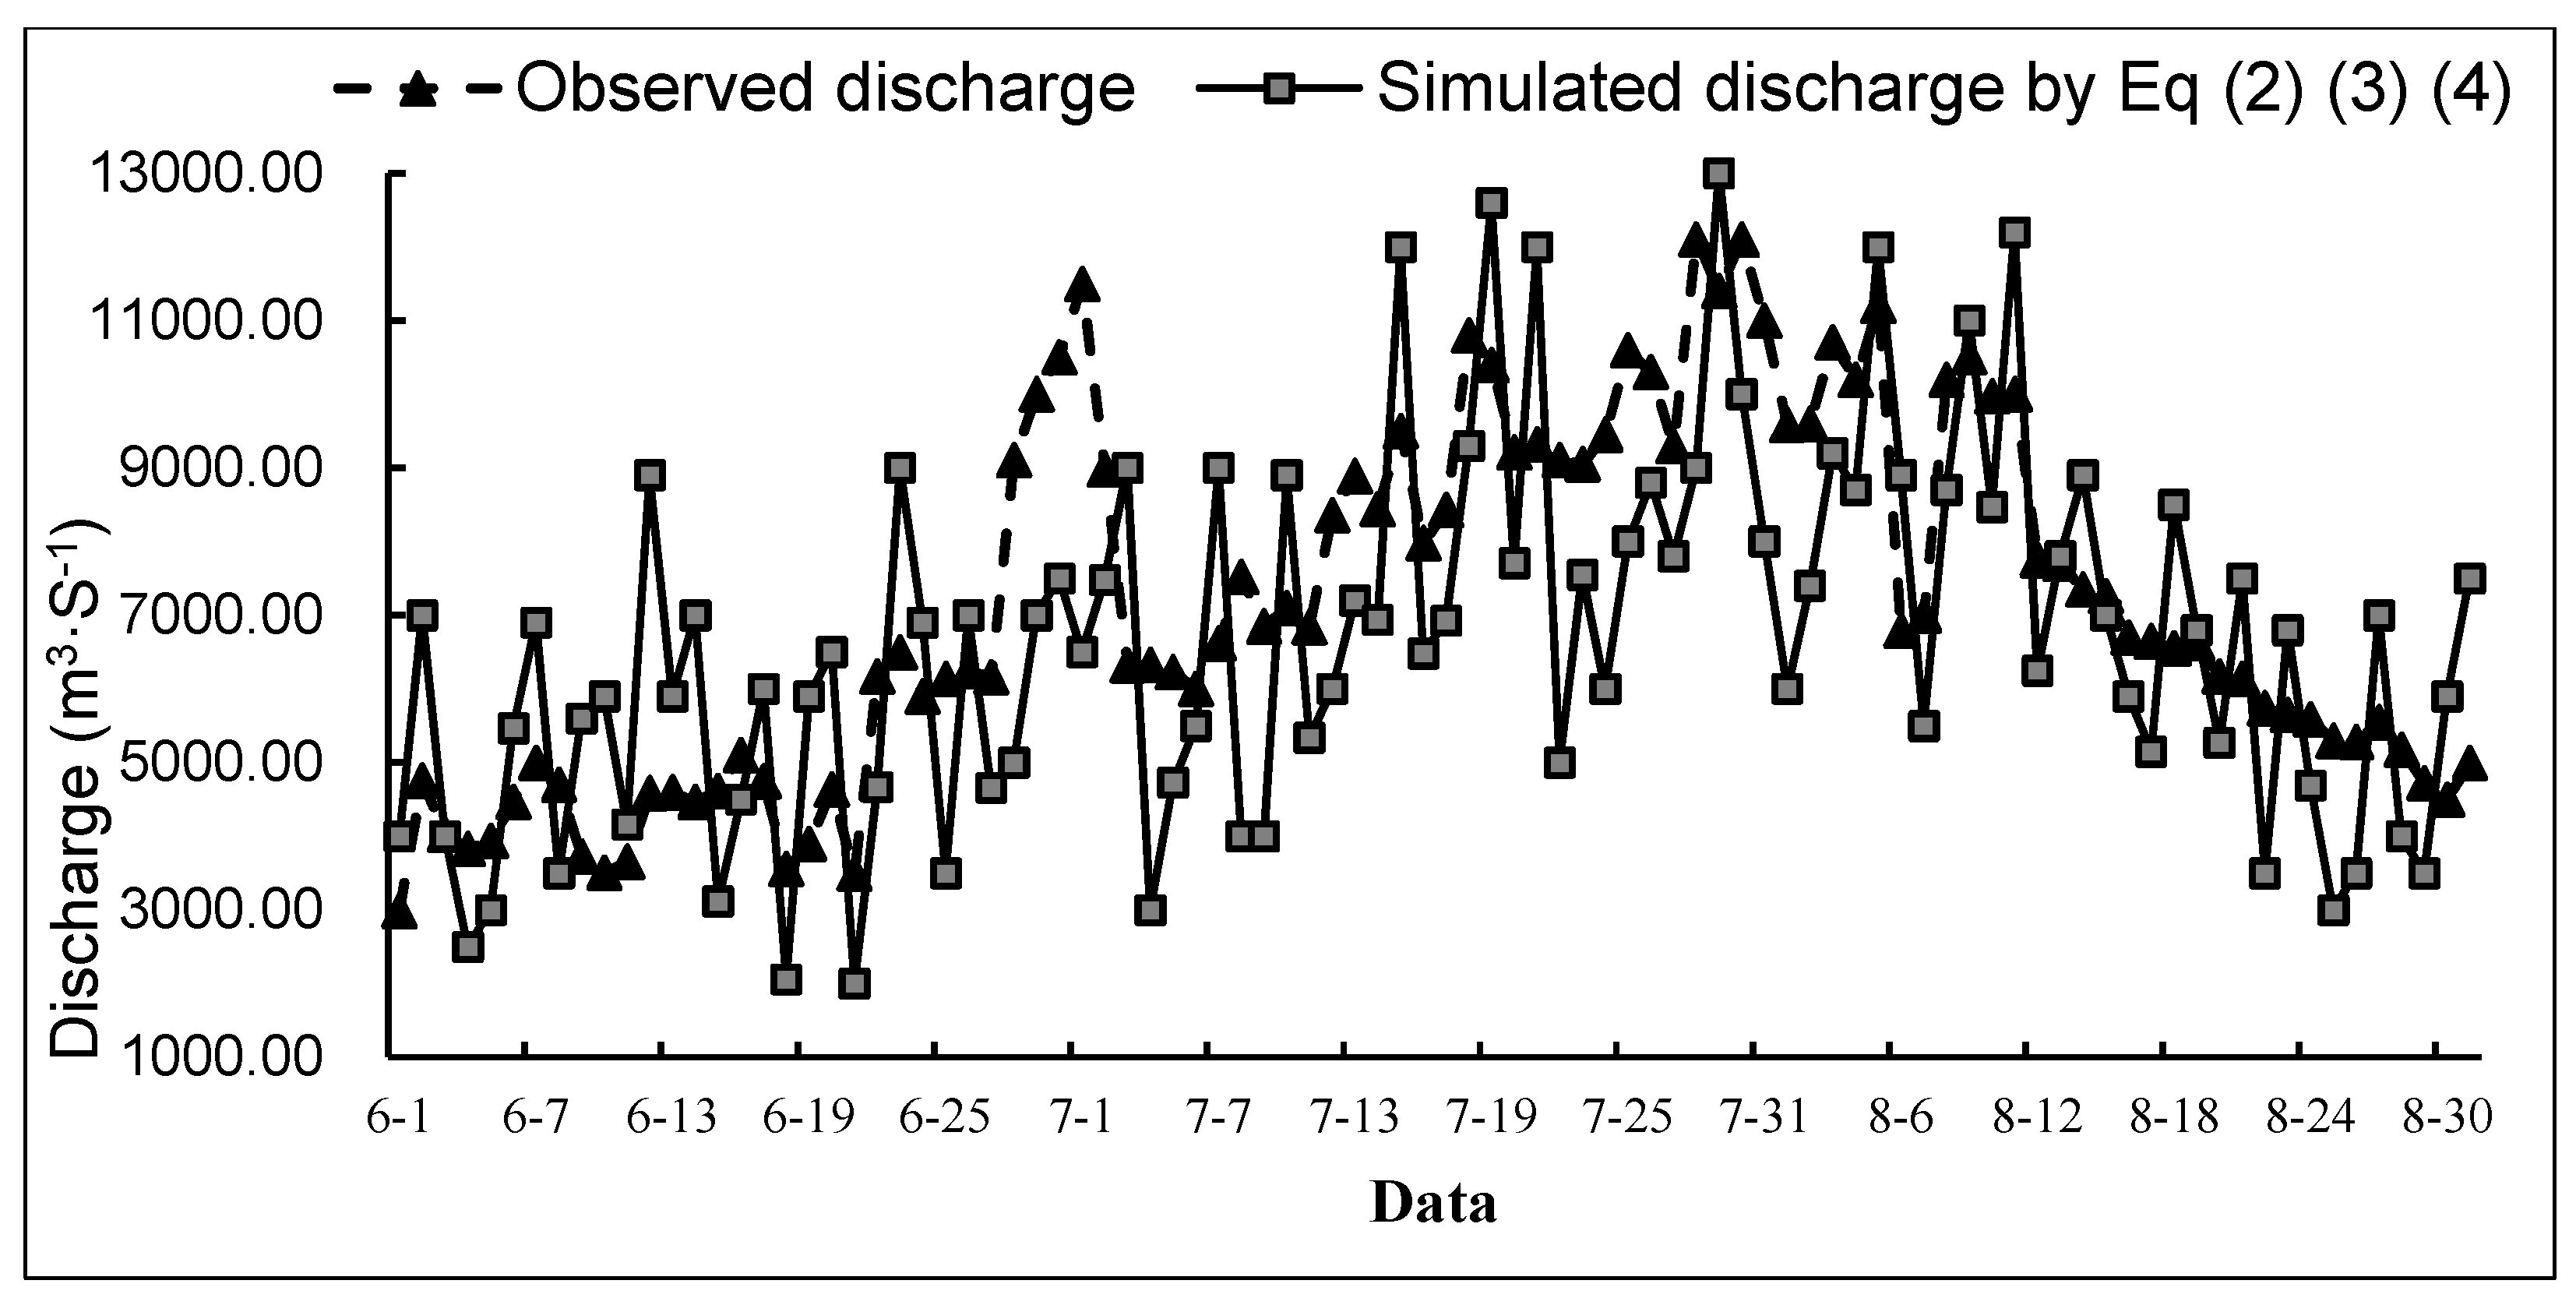
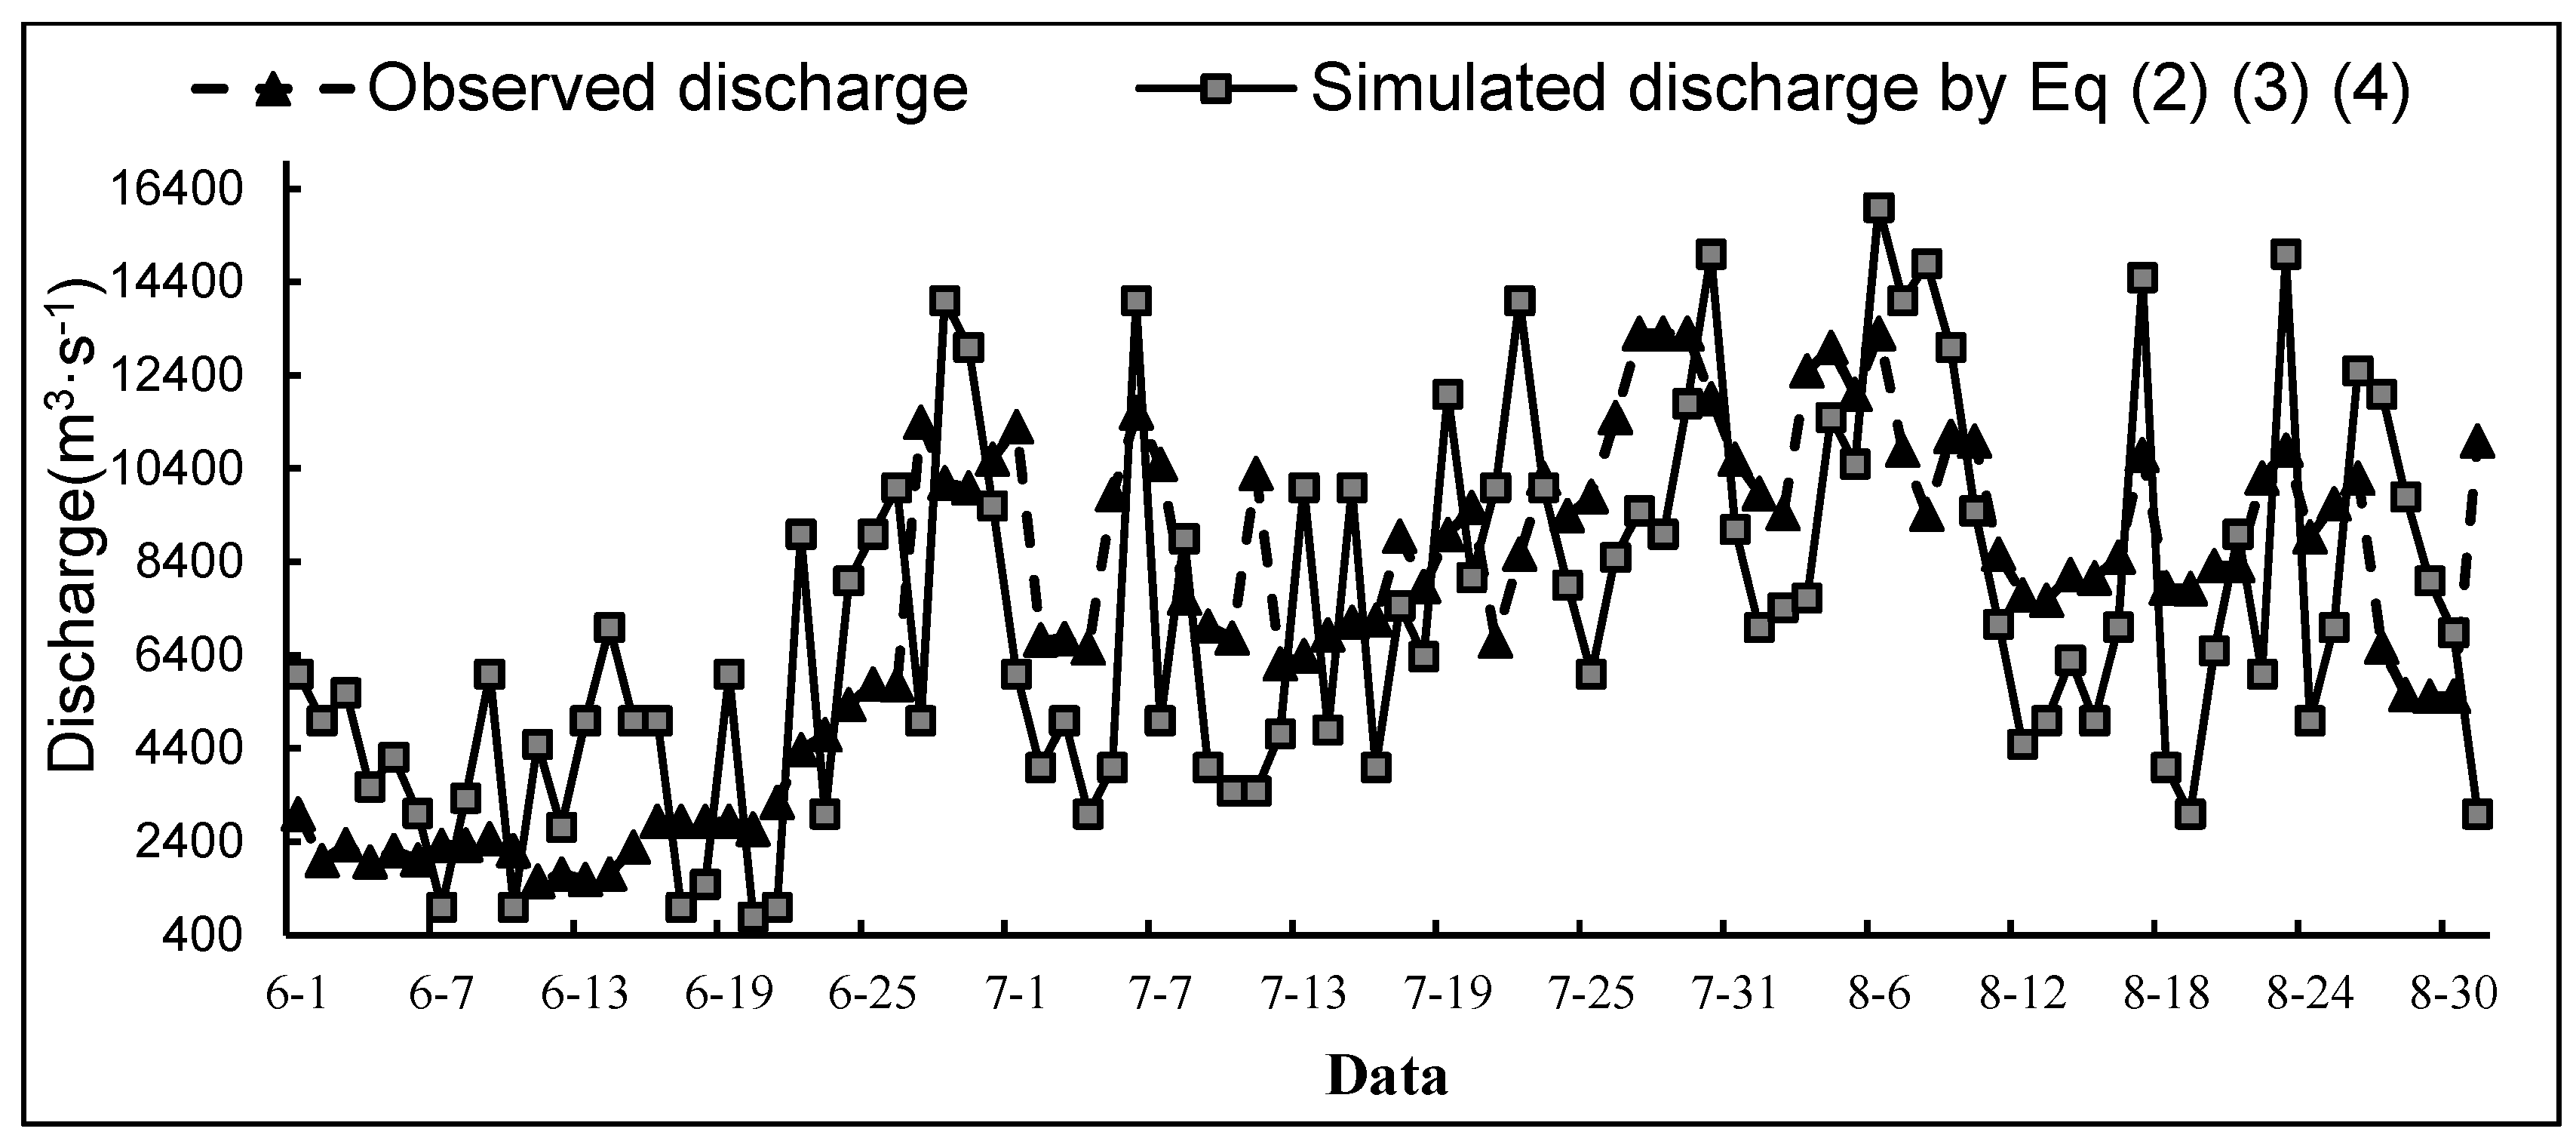
2.4. Validation of Jinsha Rainfall–Discharge Statistical Model

Generally, the statistical forecasting models are validated through hold-out cross method for temporal sequence of the data that have not been used in model parameter inference. This method is to compare the simulated data generated by the model with the observed data. In this study, the average discharge at Xiangjiaba and upstream rainfall data for June, July, and August 2015 and 2016 are not adopted for model parameter inference, and are thus suitable for the cross-validation of Jinsha River rainfall–discharge statistical model. The average daily discharge data at Xiangjiaba hydrological station in 2015 and 2016 were obtained from the Yangtze River Water Level Query System [30] and the corresponding daily rainfall data as rainfall–discharge model input were provided by the China Meteorological Data Sharing Service System [32]. Subsequently, discharge data at Xiangjiaba Station, through the rainfall–runoff statistical model, were compared with on-site observations to assess the overall performance of the rainfall–flow multiple linear regression model (Figure 2 and Figure 3). As presented in Figure 2 and Figure 3, the simulated discharge at Xiangjiaba Station for 2015 and 2016, given by Equations (2)–(4), generally matched the upstream flow trend of observed discharge. According to the hydrological forecasting standard error, absolute relative error between the simulated upstream streamflow of Xiangjiaba and the observed data is generally below 20% and the simulated upstream streamflow trends are in good agreement with the observed discharge. Hence, simulation discharge results are capable of generating satisfactory simulation results and can be used for future Jinsha River runoff projection under climate change.
Meanwhile, there are some deviations between the simulated and observed discharge in 2015 and 2016. At the beginning of the rainy season (June) in 2015 and 2016, the simulated discharge series of Jinsha River is mostly higher than the observed discharge series. However, the simulated discharge values in July 2015 and 2016 are generally below the observed discharge values. As for the late rainy season (August) in 2015 and 2016, the simulated discharge oscillated around the observed discharge values. These deviations are mainly due to the following reasons. Firstly, the rainfall data collected at weather station points could hardly reflect the actual rainfall precipitation in the control area of the point. Secondly, the difference between simulated and observed discharge could exist due to atmospheric acyclic and unstable disturbances, which will affect the accuracy of rainfall measurement and further affect the simulation. Moreover, the deviation between simulation and observation is likely to be amplified due to the operation of upstream hydropower stations, according to the literature (e.g., Djebou (2015) [33]). According to Xiong et al. (2013) [27], from a long-term perspective, the annual streamflow of Jinsha River is more likely influenced by climatic variability; while from a short-term perspective, the simulated discharge is mainly influenced by human activities. In addition, according to Wang et al. (2011) [34], human activities like water diversion, water and soil conservation measures, and dam construction would be also mainly responsible for the drastic decline in river discharge since the 1950s in the Yangtze River basin.
In order to improve the accuracy of discharge simulation, there are some potential measures that could be taken. For example, more weather stations should be set to obtain more precipitation data over the Jinsha River basin. It could also be helpful to investigate the underlying surface conditions (such as different types of soils, land use, and management conditions) and further refine the hydrologic model parameters to improve the projection accuracy.

3. Inflow Trend Analysis of Jinsha River under Climate Change

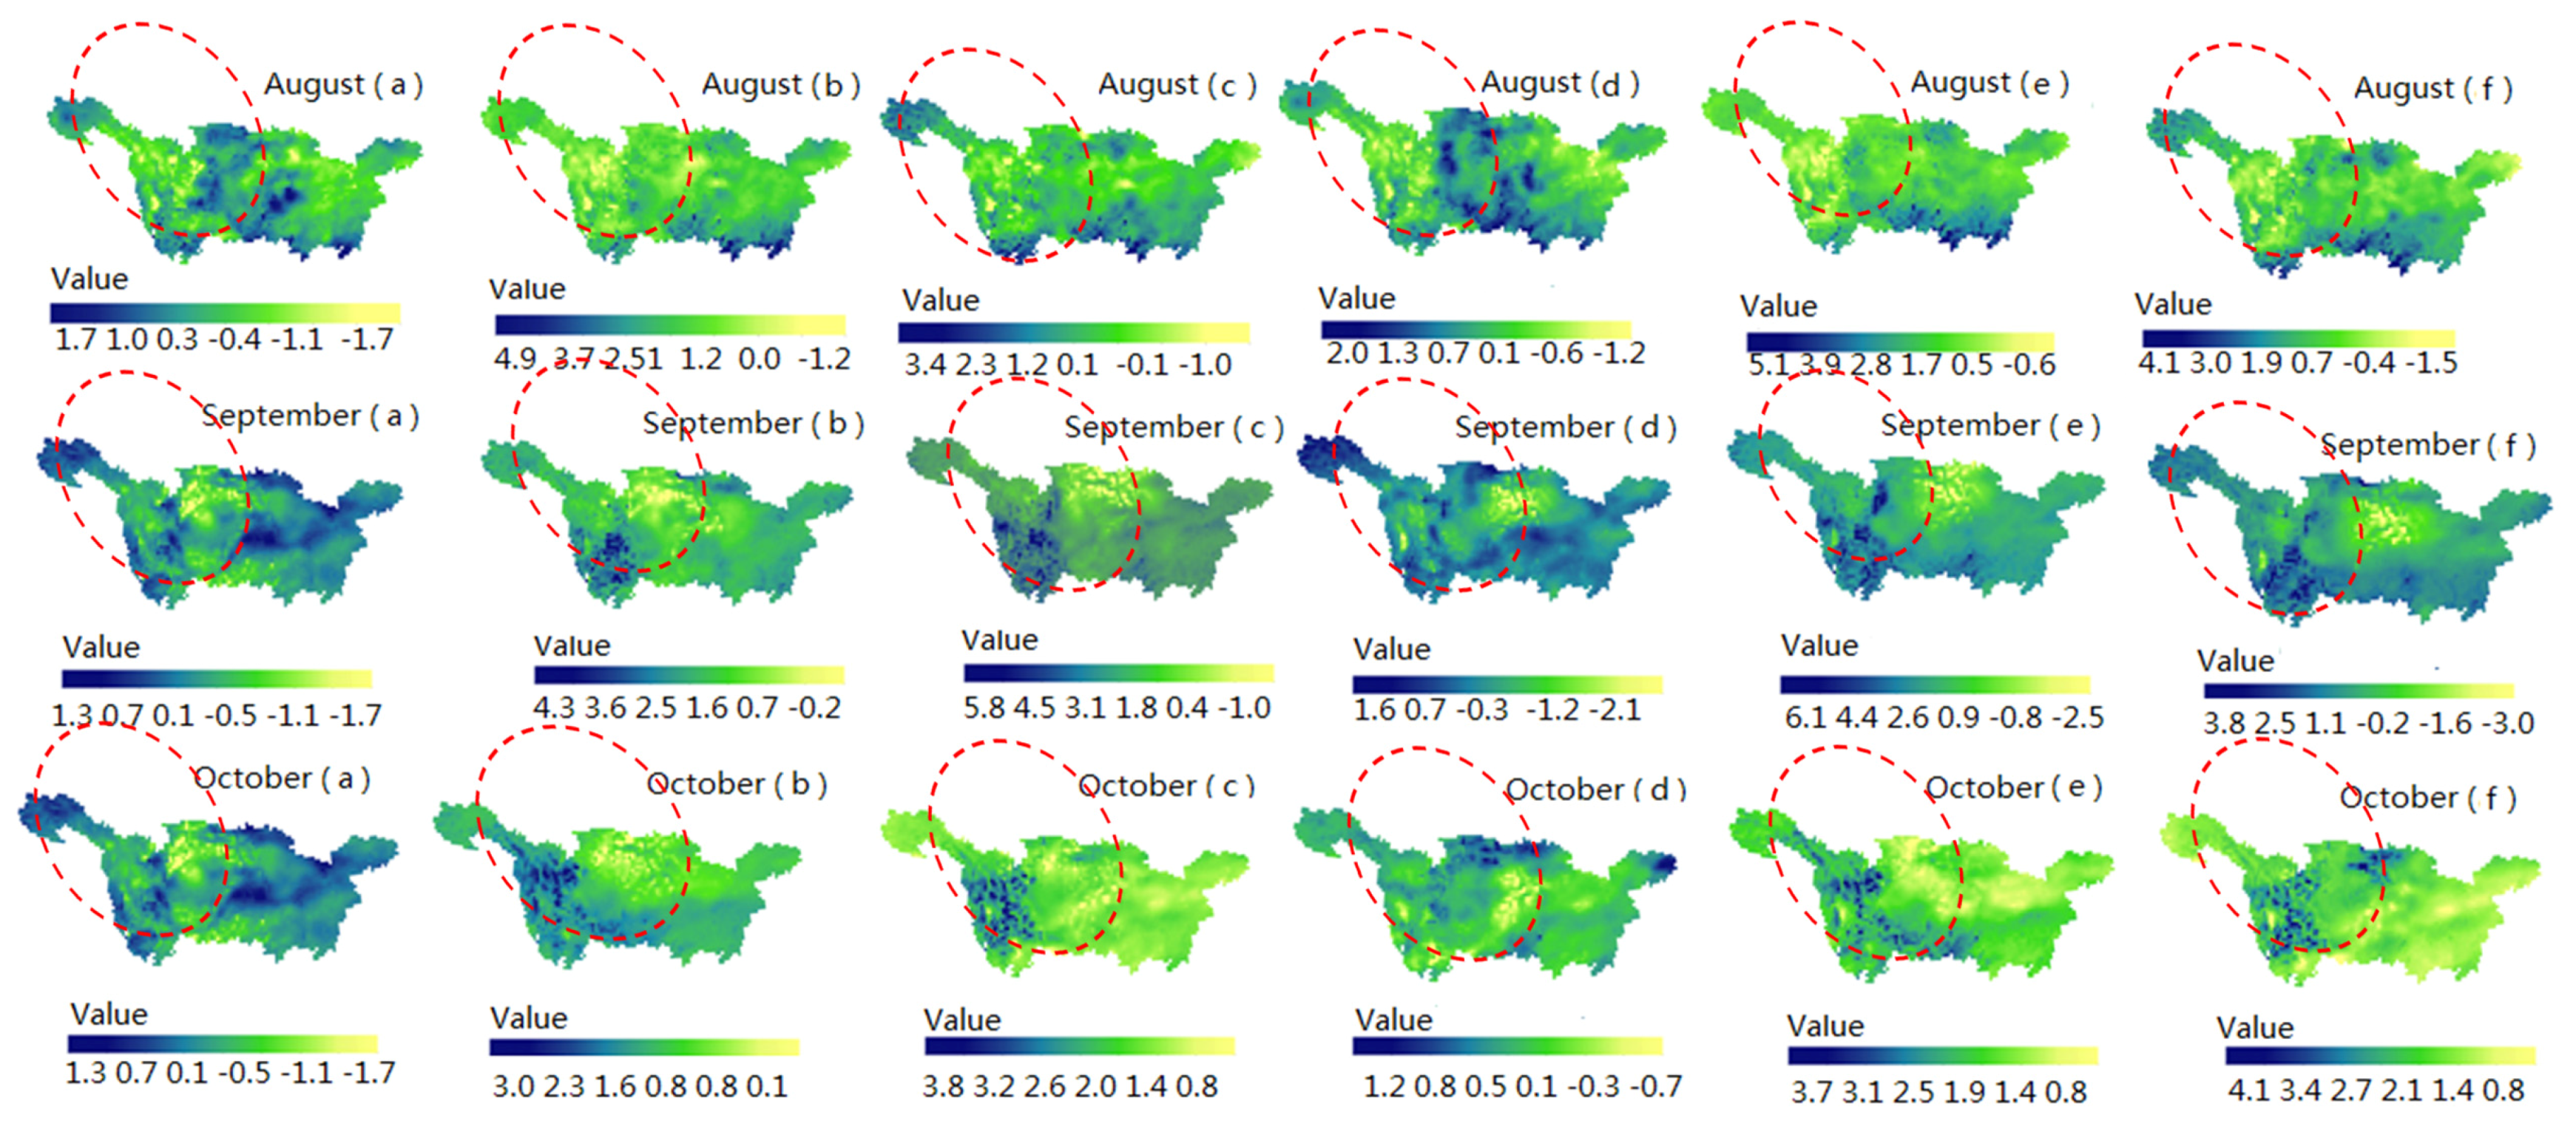
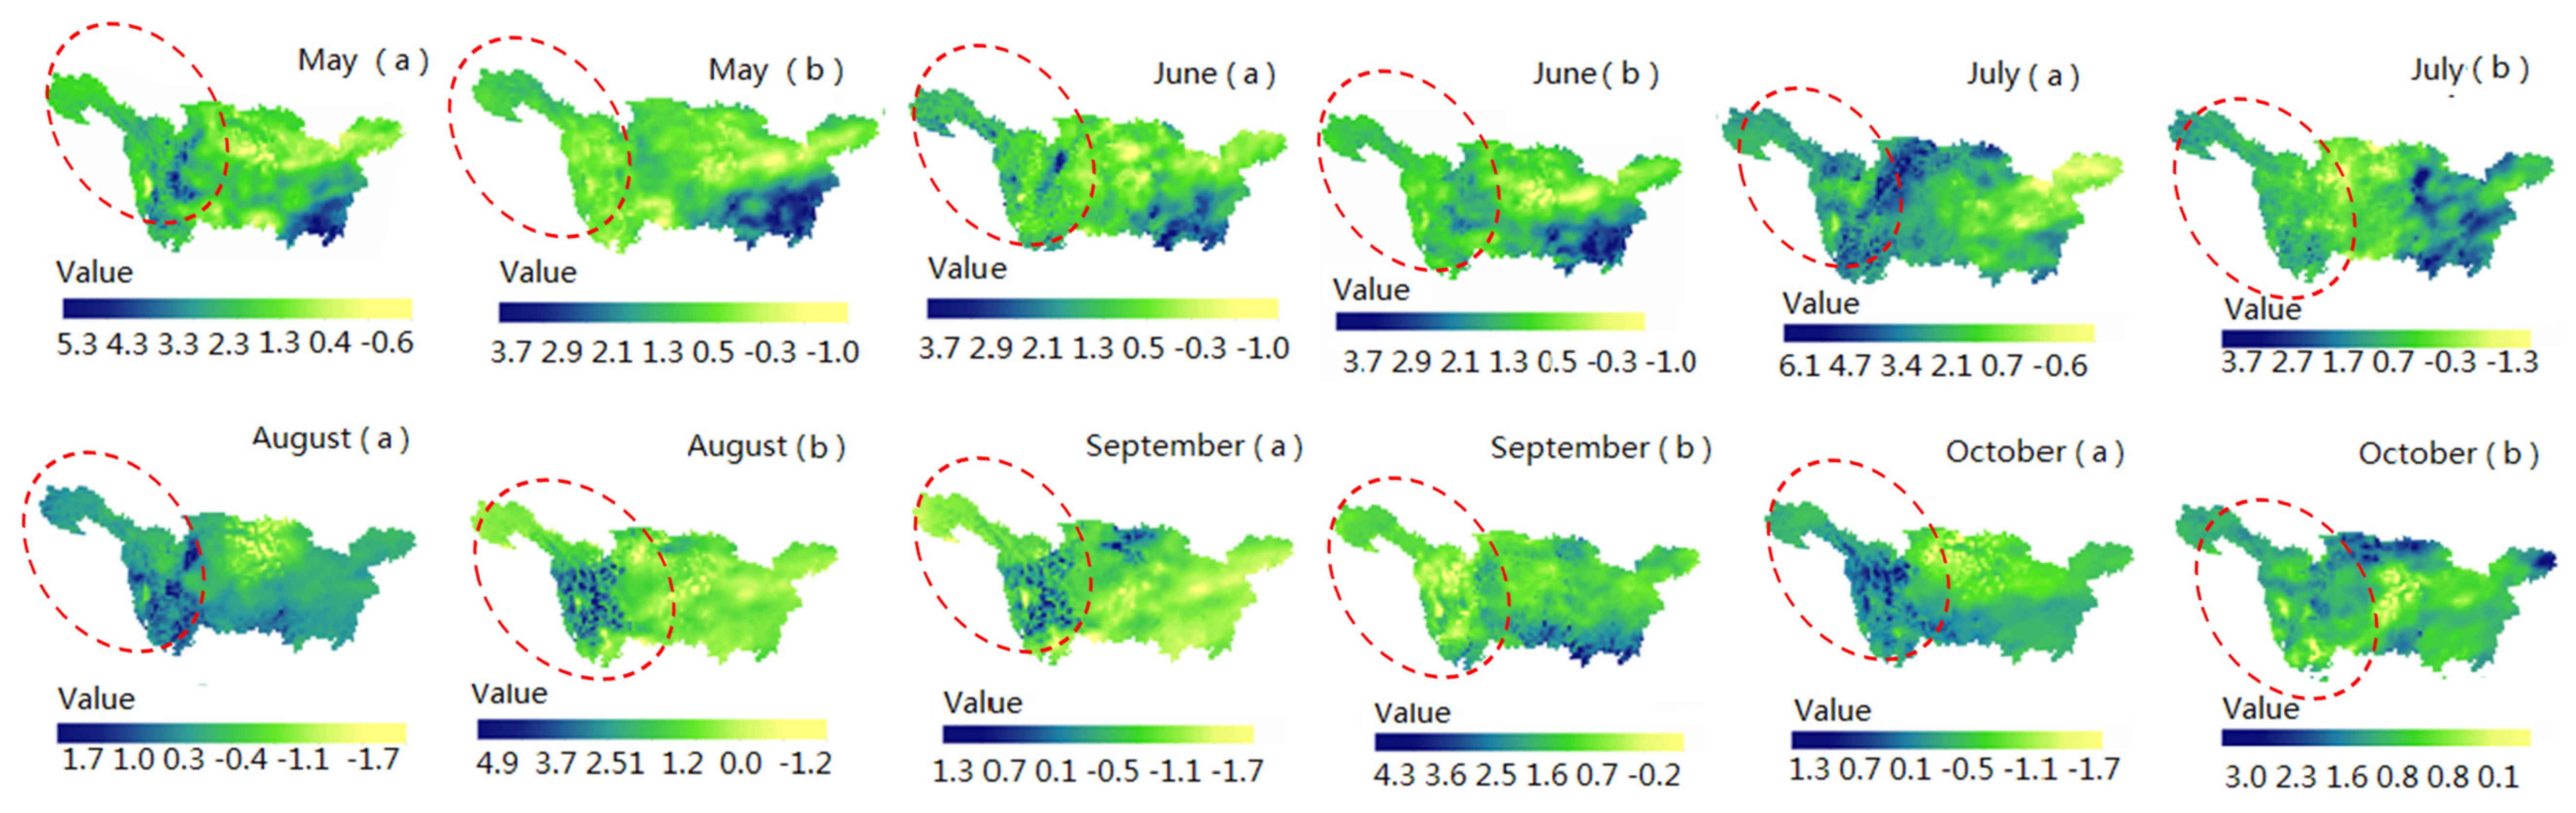
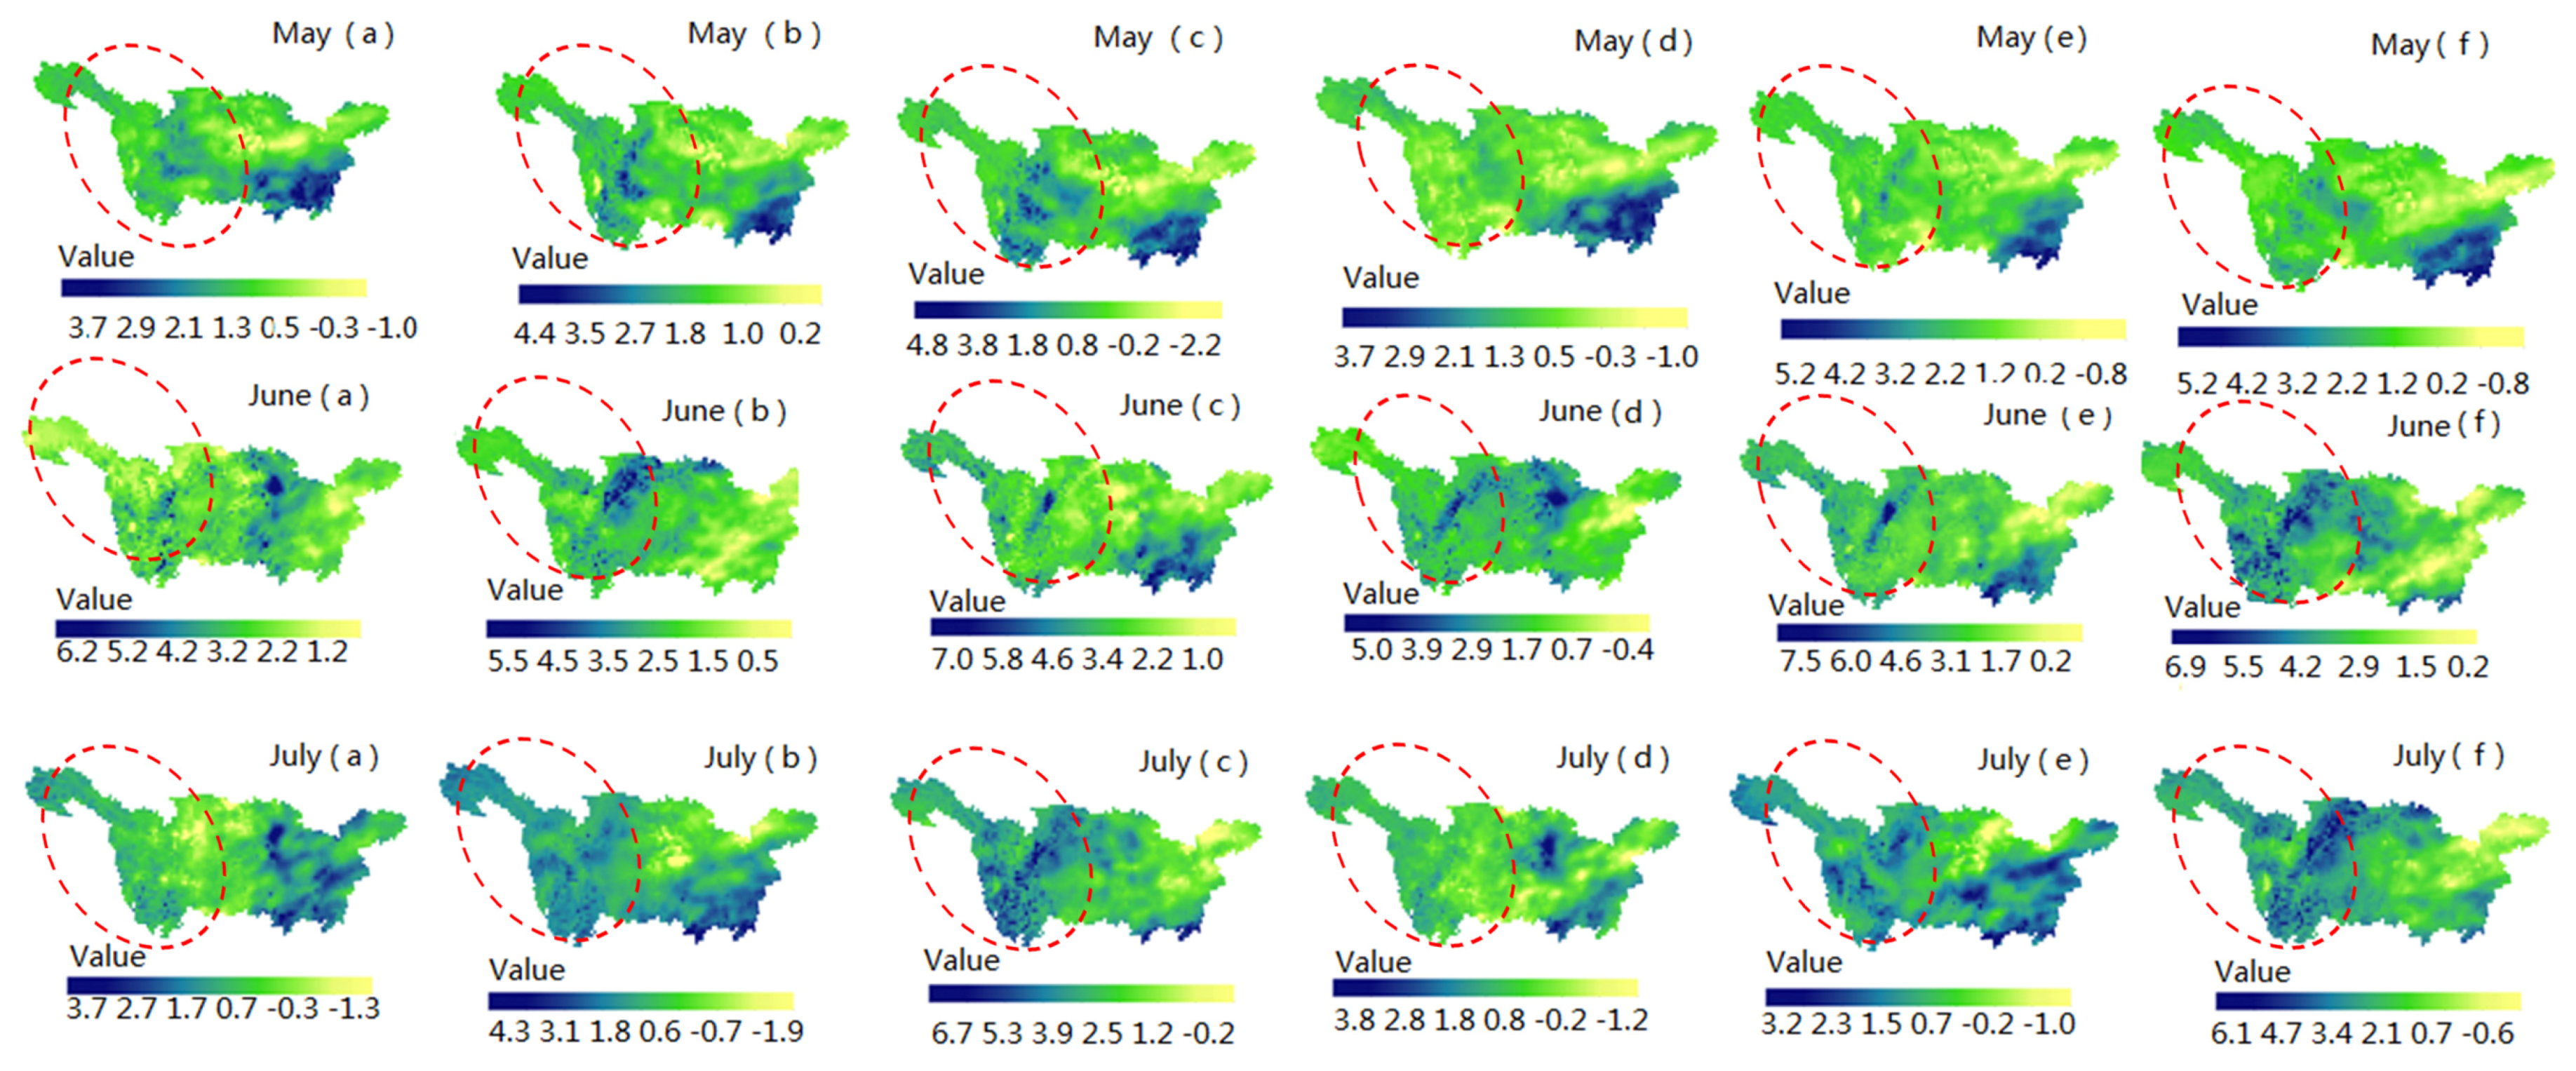
3.1. Climate Change Simulation over Jinsha River Basin

Generally, it is widely accepted that assessment of the impact of climate change on future precipitation scenarios is critical for water resources planning and development [35,36]. Through the above statistical rainfall analysis, it is indicated that climatic factors, particular rainfall, do greatly affect the Jinsha River’s upstream inflow water discharge. Therefore, in order to get a better understanding of climate change’s impacts on the flood scheduling of Jinsha River cascade hydropower stations and develop solid adaptive strategies, it is important to carry out long-term climate change simulation over Jinsha River basin. PRECIS (Providing Regional Climates for Impacts Studies) is adopted in this research to generate high-resolution future climate data at a regional level, given its proven performance at reproducing climate change in China and globally.
To address the uncertainty related to emission levels in regional climate modeling, three scenarios, A2, B2, and A1B, are normally adopted. The emissions level of the A1B scenario is medium. B2 describes an emissions scenario aiming toward economic, social, and environmental sustainability that is more reasonable than A2, which is aiming at intensive economic development and thus is unreasonable, particularly after the Paris Agreement came into effect. Therefore, the A2 scenario is excluded from this study. The A1B scenario simulation, covering 1960 to 2099, is based on a global model ECHAM5, while the B2 scenario is mainly focused on simulating the climate change of 2070–2099 based on the HADAM3P global model. Considering that the main flooding of the Jinsha River mostly occurred in the month from May to October, this study has given emphasis to analyzing climate change’s impact on rainfall and Jinsha River runoff under the A1B and B2 scenarios from May to October.
Figure 4, Figure 5 and Figure 6 show the variance of Jinsha River’s average rainfall, from May to October, between the simulation periods (2010–2040, 2040–2070, and 2070–2099) and the historical periods (1960–1990 and 1980–2010) under A1B and B2 scenarios. The figures illustrate the rainfall intensity or future rainfall change trends, in which dark blue indicates that the region would experience increasing rainfall intensity and light yellow denotes a shortage of rainfall during the whole simulation period in the region. In a comparison of average rainfall in May in 2010–2040, 2040–2070, and 2070–2099 and the average rainfall in 1960–1990, the results (Figure 4) indicate that the precipitation in May shows an increasing trend under the A1B scenario. However, in a comparison of average rainfall in May in 2010–2099 and the historical period of 1980–2010, the simulation results indicate that Jinsha River’s rainfall will have a slight decrement in the period 2010–2099. The precipitation in June for 2010–2040 would decrease compared with 1980–2010 but be higher than in 1960–1990. However, during 2040–2070 and 2070–2099, the average rainfall over the Jinsha River basin shows an increasing trend. Similarly, the variations of Jinsha River’s rainfall from July to October (Figure 4 and Figure 5) indicate that rainfall in future simulation periods are likely to experience a significant increase compared to 1980–2010. Under the B2 scenario, the variations in Jinsha River’s rainfall from May to October (Figure 6) indicate that rainfall in future simulation periods, compared to 1980–2010, are likely to experience a significant decrease.
Meanwhile, the precipitation in three simulation periods in the future (2010–2040, 2040–2070, and 2070–2099) indicates that the whole Jinsha River basin is likely to undergo a marked increase from 2010 to 2070 in May, July, September and October rainfall compared to historical rainfall (1960–1990 and 1980–2010). The precipitation would decrease in 2040–2070 but increase in June and August compared to historical rainfall (1960–1990 and 1980–2010). Moreover, the rainfall displays spatial diversity over Jinsha River basin in the whole simulation (1960–2099). For example, the difference in precipitation between May and July is not very distinct upstream of the Jinsha River basin. The upper reaches of Jinsha River are short of rainfall; nevertheless, downstream of Jinsha River rainfall has an increasing trend. In June, September, and October, total precipitation is generally growing in most areas of Jinsha River. In early August, there is an obvious precipitation increment upstream of Jinsha River, and a decrease downstream of Jinsha River in mid-to-late August. Generally, from the simulated precipitation in the Jinsha River basin under the A1B scenario, during 1960–2099, there first emerges an increasing trend in 2010–2070 compared to the historical periods (1960–1990 and 1980–2010). However, this trend may slow down after 2070. In addition, the above trends are mostly average rainfall trend and it is difficult to guarantee the possibility that the runoff will increase in a certain period or in a certain section of Jinsha River. Under climate change conditions, water resources may undergo some changes of spatial diversity and temporal difference. Therefore, it is desirable to combine these simulations with a rainfall–discharge model to analyze Jinsha River’s future inflow trends and develop appropriate strategies for flood control of the four hydropower stations, under climate change conditions.

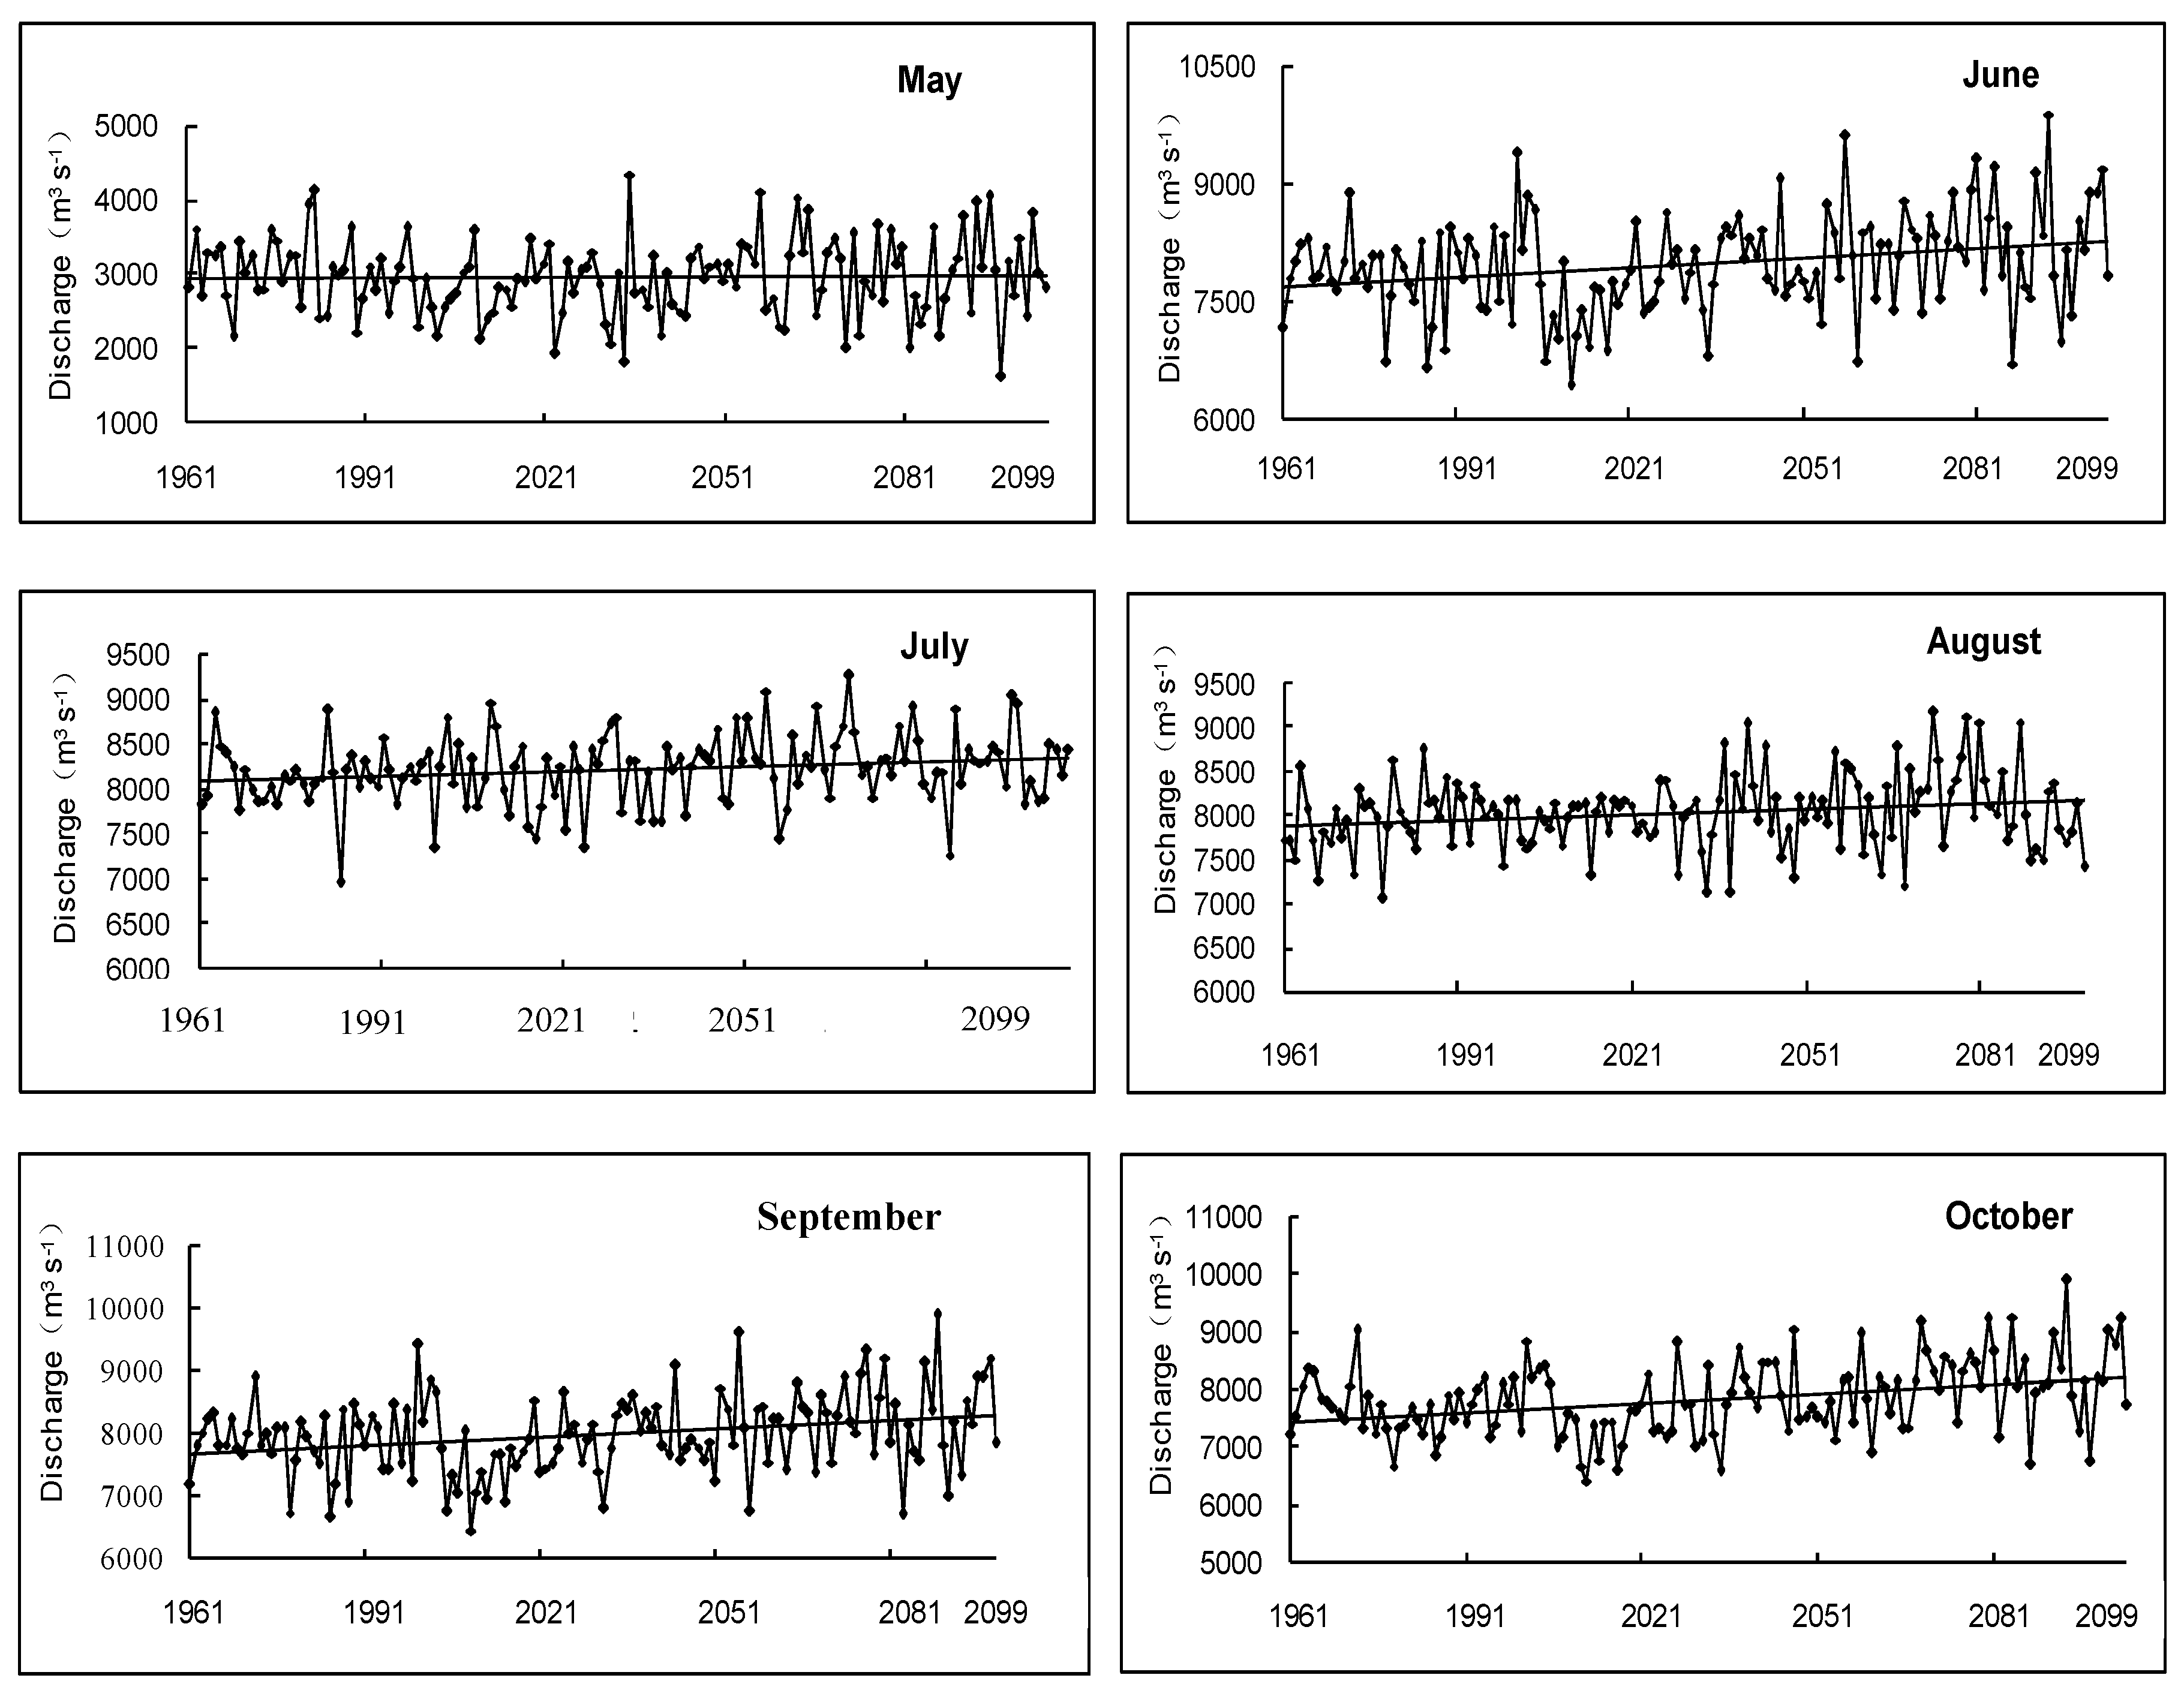
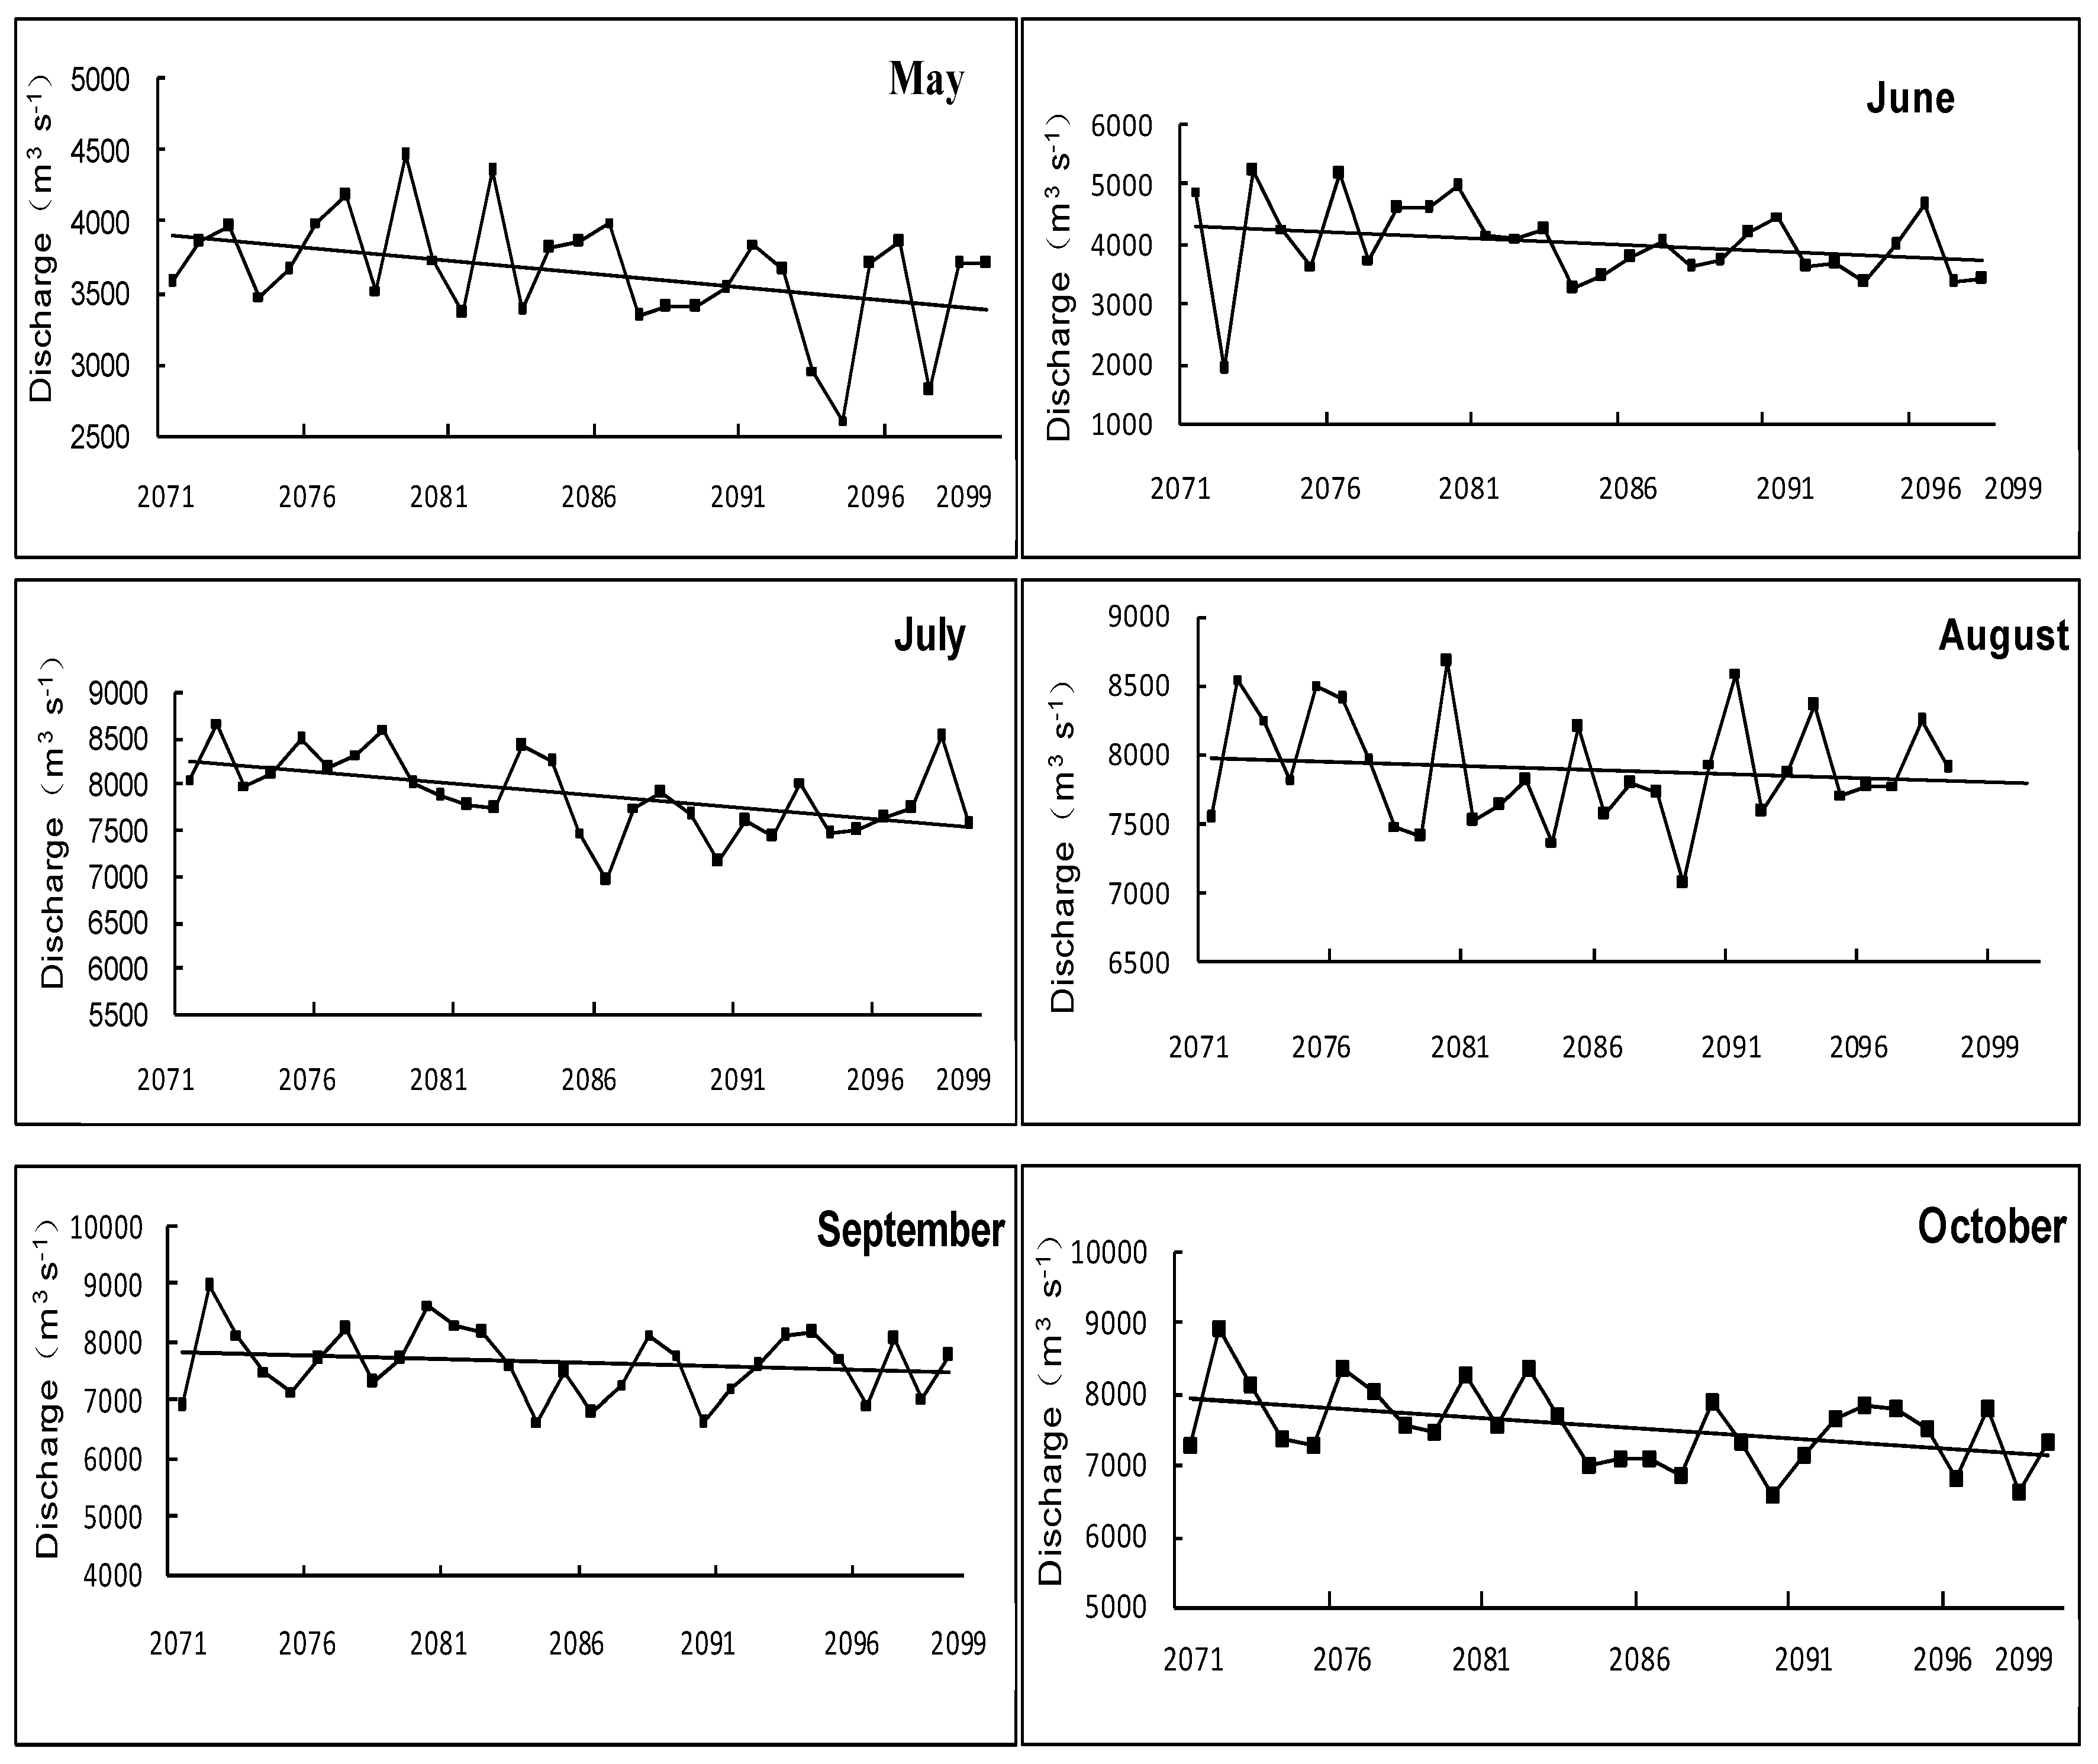
3.2. Inflow Trend Analysis of Jinsha River

The above statistical rainfall analysis indicates that climatic factors (particularly precipitation) have a significant effect on upstream runoff at Jinsha River and may lead to changes in the flood control scheduling of cascade hydropower stations.
The Xiangjiaba hydrological station located downstream of Jinsha River is selected for annual discharge analysis. Firstly, high-resolution (25 km) daily average rainfall data (1960–2099) upstream of the Jinsha River basin are obtained through the PRECIS modeling simulation under scenario A1B. The simulated precipitation data are used to drive the Jinsha River rainfall–discharge model and obtain the average annual discharge at Xiangjiaba hydrological station (1961 to 2099).
Figure 7 presents the results of average annual discharge at Xiangjiaba hydrological station. Through inter-annual discharge (Xiangjiaba) inspection for May under scenario A1B, the results indicate that the discharge basically fluctuates around a mean value of 3000 m3/s. Specifically, the inflow begins with a slow decreasing tendency at the first stage (1961–2020) and then gradually increases after 2020, with the oscillation amplitude of inter-annual discharge decreasing before 2020 but increasing after 2020. Similarly, the upstream inflows of Jinsha River from June to October (Figure 7) generally show significantly increasing trends. Over the simulation period (1961–2099), the discharge at Xiangjiaba varies around 7500–8000, 8000–8400, 7900–8000, and 7000–8000 m3/s in July to October, respectively. Under climate change conditions, the occurrence of peak discharge in the non-flood season (September and October) would likely increase. Overall, as illustrated in Figure 7, the discharge curve shows a larger oscillatory variation around 2050 and 2081–2099. Results also vary in different months. For example, the discharge originally shows increasing trends in July and August, ranging from 7500 to 8000 m3/s and reaching a maximum of 8500 m3/s at the end of July.
The most striking feature of Jinsha River discharge under B2 (Figure 8) during 2071–2099 is that Jinsha River will undergo varying degrees of downward trend in the wet season (from May to October). Specifically, the average Jinsha River discharge in early May 2071 is 4000 (m3/s), then sharply inclines to 3000 (m3/s) in 2099. Similar to the simulation results under A1B, Jinsha discharge keeps creeping up from June to August and then falling in September and October. Meanwhile, it is noticeable that Jinsha discharge is lower during the same simulation period under the A1B scenario than under the B2 scenario. Compared to the B2 scenario, the A1B scenario is closer to the real level of greenhouse emissions predicted for the future. Therefore, the prediction of future Jinsha River inflow under A1B is more reasonable.

3.3. Hydrological Frequency Analysis for Jinsha River

To get a better understanding of the flood risk to cascade hydropower stations under climate change conditions, it is important to conduct hydrological frequency analysis. In most cases, recurrence interval is widely adopted by policy makers or researchers to estimate likely severity. This indicator reflects the probability that an event of any given magnitude will happen in any given year.
The hydrological frequency analysis of this study is mainly based on the discharge results from the above rainfall–discharge model under scenario A1B. These results are then applied to a hydrological frequency curve analysis. As shown in Table 5, in May and August, the designed flood discharge standard with respect to recurrence intervals of 100 years and 50 years would decrease significantly in 1991–2020 and then rise from 2021 to 2099. Jinsha River inflow discharge with respect to a 100-year return period and a 50-year return period in May correspond to 4187 and 4052 m3/s from 1961 to 1990, decreasing to 3888 and 3748 m3/s during 1991–2020, rising in 2021–2050, and reaching 4603 and 4386 m3/s in 2051–2099. The designed flood discharge for August, under the two hydrological frequency conditions in 1961–1990, corresponds to 8896 and 8773 m3/s and then would fall to 8599 and 8525 m3/s, respectively, in 1991–2020 before gradually rising in 2021–2099 and finally reaching a maximum of 9389 and 9224 m3/s. Therefore, drought is likely to occur in May between 1991 and 2020. The inflow discharge in Jinsha River would likely decrease in August between 1991 and 2020 under climate change conditions. However, in June, July, and October, the flood discharge with varying levels of hydrological frequency may increase during four periods (1961–1990, 1991–2020, 2021–2050, and 2051–2099), indicating that the probability of flooding events being affected by climate change may also increase. In September, the discharge with respect to two levels of recurrence (intervals of 100 years and 50 years) also shows great inter-annual variation. For example, the recurrence interval of a 100-year return period during 1960–1991 is 9060 m3/s and then may rapidly rise to 9515 m3/s in 1991–2020. The recurrence interval of 100 years in 2021–2050 is basically close to that in 1960–1991, and may then increase up to 9936 m3/s. It is obvious that the potential flood risk would increase in September of 1991–2020 and 2051–2099, implying that the flood seasons of Jinsha River may be delayed to September.
The above variation implies that the underlying occurrence of extreme discharge intensity and frequency likelihood may greatly increase in wet seasons (from June to October). The possibility of extreme drought frequency events may increase in May and June. For example, in May of 1991–2020 and June of 1960–2020, the discharge in Jinsha River with a 100-year return period risk is less than that in other simulation periods (e.g., 1960–1990 and 2021–2099). This also implies that the upper reaches of Jinsha River may be short of rainfall in this period. Consequently, it is likely to delay the arrival of the conventionally recognized flood season (May and June) in 1991–2020. It is also worth noticing that the generally recognized post-flood inflow discharge, with the decreasing hydrological frequency, would conversely increase significantly and be more obvious in September and October. Under this circumstance, an increase of runoff in the flood season could occur under future climate scenarios, indicating a high possibility of flooding events in the Jinsha River basin in the future.

4. Adaptation of Cascade Hydropower Stations’ Scheduling on Jinsha River under Changing Climate Conditions

According to China’s current Flood Control Act, the flood-limiting water level (FLWL) for cascade hydropower stations is a key parameter of flood control guidelines [37,38,39]. Under these flood control guidelines, before the flood season (June) of each year, the preserved flood control capacity for cascade hydropower stations should be determined in order to reserve sufficient detention capacity for forecasted inflow volume, which is based on the trade-off between flood prevention and water resource use [40,41]. During the flood season (i.e., July and August) the cascade hydropower stations are operated below FLWL in order to reserve adequate reservoir storage for flood prevention. In the recession of flood season (i.e., September and October), cascade hydropower stations reserve water to increase power production. Although the above conventional flood-control operation modes are easy to implement, flood utilization rate is low as excessive water is released from hydropower stations in the pre-flood and post-flood seasons. Frequently, hydropower stations may fail to reserve enough water to maintain normal operating levels in dry years [42]. Due to the fact that the current FLWLs are mostly derived from the maximum discharge value of annual data, they may neglect the seasonal dynamics of flood and climate change factors, leading to non-optimal decision-making, unrealistic expectations, danger, and even failure.
In this study, through the above inflow trend analysis for Jinsha River, it is revealed that future climate change may increase the likelihood of flooding in the Jinsha River basin. The varying upstream runoff under a changing climate also challenges the current scheduling of the downstream cascade hydropower stations. Ignoring climate change effects and runoff variation may lead to certain risks and negative consequences. In view of the variability of inflow processes and climate change factors in flood and non-flood seasons, adaptive impoundment scheduling approaches are presented here for the pre-flood, flood, and post-flood seasons to respond to the varying future upstream runoff in Jinsha River basin. Therefore, it is important to conduct assessment and adaptability analysis of climate change’s effects on Jinsha River cascade hydropower station scheduling. The cascade hydropower stations are located downstream of Jinsha River (Figure 1). The main flood control parameters of these cascade hydropower stations are listed in Table 6. Specifically, the normal water storage level of the cascade hydropower stations is the highest water level under normal operating conditions; the dead water level is the minimum level that could meet normal power generation. Generally, the water level of hydropower stations would fluctuate between the dead water level and the normal water level in the pre-flood seasons; however, in the flood season the water level of cascade hydropower stations should be below the FLWL for preventing floods.
The specific adaptive strategies are generated based on Jinsha River inflow runoff trend analysis in 1961–2099. According to the projected hydrological frequency result under the A1B scenario, flow upstream of Jinsha River in May of 1961–2020 shows a significant decreasing trend and extreme flood occurrences during 2021–2099 are increasing. The inflow trends before and after 2020 indicate that flood control strategies generated before 2020 may no longer be applicable under climate change. Accordingly, the specific flood control scheduling for these cascade hydropower stations before 2020 could be: the reservoirs’ water level for these cascade hydropower in May would keep the normal reservoir water level at 975, 825, 600, and 380 m; however, taking climate change impacts into account, flood control operation with respect to lowering the hydropower reservoirs’ water level could be postponed until late June. The cascade hydropower stations’ water level should be ensured below the FLWL and higher than the dead water level in late May from 2021 to 2099. In addition, all the reservoirs’ water levels should be adjusted within the water level range (the upper bound is the reservoir’s normal storage water level; the lower bound is the reservoir’s dead water level). The above adaptive flood control strategies developed in pre-flood seasons (May) could not only enhance flood control security for the cascade hydropower stations but also increase the power generation.
In flood seasons, from late June to the middle of July of 1961–2099, the hydrological frequency under the A1B scenario indicates that the occurrence of floods shows an increasing trend. Therefore, the reservoir water level should not exceed FLWL to offer adequate storage capacity for the likely increase in flooding. The main principle of flood scheduling for cascade hydropower stations should be to ensure that cascade hydropower stations are secure during a flood. The upstream cascade hydropower stations like Wudongde and Baihetan hydropower stations with large regulating storage can be involved to fulfill the tasks of reducing the peak discharge of Jinsha River, while Xiluodu hydropower station should be adopted for filling the valley and providing an emergency reserve. It is noted that the upstream inflow discharge of Jinsha River is likely to decrease in August from 1991 to 2020 and increase greatly from 2021 to 2099. However, as shown in Figure 6, the general inflow trend would also vary around 8000–8400 (m3/s), which is higher than that in July with the inflow discharge varying around 7500-8000 (m3/s) from 1991 to 2020. Therefore, these four cascade hydropower stations should also ensure that the water level of cascade hydropower stations in August remains below the FLWL during 1991–2020 and 2021–2099.
In the post-flood season (September and October), the previously developed flood scheduling strategies could be: cascade hydropower stations would mostly begin to reserve water up to the normal water level for hydropower generation. However, hydrological frequency analysis under the A1B scenario indicates that flood likelihood under climate change generally shows an increasing trend in September during 1961–2020 and 2051–2099 and a decreasing trend in 2021–2050; the inflow of Jinsha River would generally shows an increasing trend in October from 1961 to 2099. Therefore, the possibility of flooding shows an increasing trend (during 2051–2099). This implies that the flood seasons of Jinsha River may be delayed from August to September or even October. It thus will be secure for cascade hydropower stations to postpone reserving water to October. Therefore, the water level of these four cascade hydropower stations should also operate at FLWL to offer adequate regulating storage capacity to cope with extreme hydrological events in post-flood seasons (September and October) during 1961–2099. In late October, conflicts may exist in terms of water impoundment among cascade hydropower stations for different flood control assignments. The principles of impoundment strategy for the cascade hydropower stations should reflect both the urgency of flooding control assignment and the economic benefits of hydropower stations. For example, if there is no urgent flood control assignment for upstream cascade hydropower stations at Wudongde and Xiluodu, these hydropower stations with large installed capacity can be prioritized to impound water back to the normal water level. A hydropower station with less flood protection such as Baihetan cascade hydropower stations can be ranked in second place. A hydropower station with a small reservoir storage capacity for flood protection and ecology conservation such as Xiangjiaba can be ranked last to impound water.
Based on the above analysis, it is suggested that the current flood control and management mode of the Jinsha River should reflect the impacts of future climate change. As extreme hydrological events increase, it is desirable to advance the joint scheduling management of cascade stations to reduce the flooding risk caused by extreme hydrological events. It is suggested that cascade hydropower stations could postpone decreasing reservoirs’ water level to improve the water utilization rate during the pre-flood season (May and June) before 2020 but should operate at the FLWL during 2021–2099. In addition, the impoundment of cascade hydropower stations should be properly delayed during the post-flood season in response to the possible occurrence of increased and extended inflow in the wet season.

5. Conclusions

This research focused on adaptive scheduling for cascade hydropower stations upstream of Yangtze River, namely Jinsha River, in response to a changing climate. An improved multivariate linear regression model with consideration of hydrological processes was developed for rainfall–discharge projection. Validation results indicated that the developed rainfall–discharge model was capable of generating satisfactory simulation results and can be used for future Jinsha River runoff projection under climate change. PRECIS, a reginal climate modeling tool, was run to project future rainfall in the Jinsha River basin under multiple GCM models (ECHAM5 and HadAM3P), and multi-scenario (A1B and B2) and multi-period (1961–1990, 1991–2020, 2021–2050, and 2051–2099) conditions. The simulated precipitation data were used to drive the Jinsha River rainfall–discharge model and obtain the average annual discharge at Xiangjiaba hydrological station (1961–2099). The data were further applied to inflow trend and frequency analysis of Jinsha River. It was indicated that extreme hydrological events in terms of intensity and frequency of river discharge would significantly increase in both the flood season (July and August) and the post-flood season (September and October). Based on extreme hydrological frequency analysis and the current flood scheduling mode, adaptive flood scheduling strategies for cascade hydropower stations were generated. It was suggested that cascade hydropower stations could postpone decreasing reservoirs’ water level to improve the water utilization rate during the pre-flood season (May and June) before 2020, while hydropower stations should operate below the FLWL in pre-flood seasons during 2021–2099. In addition, the impoundment of cascade hydropower stations should be properly delayed during the post-flood season in response to the possible occurrence of increased and extended inflow in the wet season.

Acknowledgments

This research is supported by the National Key Research and Development Program of China (Grant number: 2016YFA0601502) and the Nature Conservancy (TNC). The authors are grateful to the anonymous reviewers of this manuscript for their valuable suggestions and comments, which have greatly improved the paper.

Author Contributions

Ming Yang Zhai conducted rainfall-discharge modeling and result analysis, carried on climate change simulation and result analysis; Qian Guo Lin was the principal investigator of this project; designed and implemented this research, contribute idea and conducted climate change simulation and result analysis; Guo He Huang contributed idea to this research and provided guidance on climate change modeling; Le Zhu and Kai An contributed idea to this research, steered the research and provided guidance on adaptation of cascade hydropower stations scheduling on Jinsha River under changing climate conditions; Gong Chen Li was involved in rainfall-discharge modeling result analysis; Yue Fei Huang contributed to rainfall-discharge modeling result analysis and climate change impact analysis.

Conflicts of Interest

The authors declare no conflict of interest.

References

  1. Wang, C.; Zhou, J.P.; Lu, P.; Yuan, L. Long-term scheduling of large cascade hydropower stations in Jinsha River, China. Energy Convers. Manag. 2015, 90, 476–487. [Google Scholar] [CrossRef]
  2. Jeroen, C.J.H.A.; Wouter, B.W.J. Climate change impacts on pricing long-term flood insurance: A comprehensive study for the Netherlands. Glob. Environ. Chang. 2011, 21, 1045–1060. [Google Scholar]
  3. Majone, B.; Villa, F.; Deidda, R.; Bellin, A. Impact of climate change and water use policies on hydropower potential in the south-eastern Alpine region. Sci. Total Environ. 2016, 543, 965–980. [Google Scholar] [CrossRef] [PubMed]
  4. Vezzoli, R.; Mercogliano, P.; Pecora, S.; Zollo, A.L.; Cacciamani, C. Hydrological simulation of Po River (North Italy) discharge under climate change scenarios using the RCM COSMO-CLM. Sci. Total Environ. 2015, 521–522, 346–358. [Google Scholar] [CrossRef] [PubMed]
  5. Lu, D.; Wang, B.; Wang, Y.; Zhou, H.; Liang, Q.; Peng, Y.; Roskilly, T. Optimal operation of cascade hydropower stations using hydrogen as storage medium. Appl. Energy 2015, 137, 56–63. [Google Scholar] [CrossRef]
  6. Lu, P.; Zhou, J.; Wang, C.; Qiao, Q.; Mo, L. Short-term hydro generation scheduling of Xiluodu and Xiangjiaba cascade hydropower stations using improved binary-real coded bee colony optimization algorithm. Energy Convers. Manag. 2015, 91, 19–31. [Google Scholar] [CrossRef]
  7. Ma, C.; Lian, J.J.; Wang, J. Short-term optimal operation of Three-Gorge and Gezhouba cascade hydropower stations in non-flood season with operation rules from data mining. Energy Convers. Manag. 2013, 65, 616–627. [Google Scholar] [CrossRef]
  8. Li, C.; Zhou, J.Z.; Shuo, O.Y.; Ding, X.; Chen, L. Improved decomposition–coordination and discrete differential dynamic programming for optimization of large-scale hydropower system. Energy Convers. Manag. 2014, 84, 363–373. [Google Scholar] [CrossRef]
  9. Mu, J.; Ma, C.; Zhao, J.Q.; Lian, J.J. Optimal operation rules of Three-gorge and Gezhouba cascade hydropower stations in flood season. Energy Convers. Manag. 2015, 96, 159–174. [Google Scholar] [CrossRef]
  10. Jiang, Z.; Ji, C.; Sun, P.; Wang, L.P.; Zhang, Y.K. Total output operation chart optimization of cascade reservoirs and its application. Energy Convers. Manag. 2014, 88, 296–306. [Google Scholar] [CrossRef]
  11. Li, X.; Wei, J.H.; Li, T.J.; Wang, G.Q.; Yeh, W.W.G. A parallel dynamic programming algorithm for multi-reservoir system optimization. Adv. Water Resour. 2014, 67, 1–15. [Google Scholar] [CrossRef]
  12. Yang, G.; Weng, L.; Li, L. Yangtze Conservation and Development Report 2007; Science Press: Beijing, China, 2008. [Google Scholar]
  13. Li, Y.; Guo, S.; Guo, J.; Wang, Y.; Li, T.; Chen, J. Deriving the optimal refill rule for multi-purpose reservoir considering flood control risk. J. Hydro-Environ. Res. 2014, 8, 248–259. [Google Scholar] [CrossRef]
  14. Lund, J.R.; Guzman, J. Derived operating rules for reservoirs in series or in parallel. J. Water Resour. Plan. Manag. 1999, 125, 143–153. [Google Scholar] [CrossRef]
  15. Wei, C.-C.; Hsu, N.S. Optimal tree-based release rules for real-time flood control operations on a multipurpose multireservoir system. J. Hydrol. 2009, 365, 213–224. [Google Scholar] [CrossRef]
  16. Chou, F.N.F.; Wu, C.W. Stage-wise optimizing operating rules for flood control in a multi-purpose reservoir. J. Hydrol. 2015, 521, 245–260. [Google Scholar] [CrossRef]
  17. Chaleeraktrakoon, C.; Chinsomboon, Y. Dynamic rule curves for flood control of a multipurpose dam. J. Hydro-Environ. Res. 2015, 9, 133–144. [Google Scholar] [CrossRef]
  18. Peugeot, C.; Cappelaere, B.; Vieux, B.E.; Seguis, L.; Maia, A. Hydrologic process simulation of a semiarid, endoreic catchment in Sahelian West Niger. 1. Model-aided data analysis and screening. J. Hydrol. 2003, 279, 224–243. [Google Scholar] [CrossRef]
  19. Wang, Y.; Liao, W.; Ding, Y.; Wang, X.; Jiang, Y.; Song, X.; Lei, X. Water resource spatiotemporal pattern evaluation of the upstream Yangtze River corresponding to climate changes. Quat. Int. 2015, 380–381, 187–196. [Google Scholar] [CrossRef]
  20. Birkinshaw, S.J.; Guerreiro, S.B.; Nicholson, A.; Liang, Q.H.; Quinn, P.; Zhang, L.L.; He, B.; Yin, J.X.; Fowler, H.J. Climate Change Impacts on Yangtze River Discharge at the Three Gorges Dam. Hydrol. Earth Syst. 2017, 21, 1911–1927. [Google Scholar] [CrossRef]
  21. Long, D.; Yang, Y.; Wada, Y.; Hong, Y.; Liang, W.; Chen, Y.; Yong, B.; Hou, A.; Wei, J.; Chen, L. Deriving scaling factors using a global hydrological model to restore GRACE total water storage changes for China's Yangtze River Basin. Remote Sens. Environ. 2015, 168, 177–193. [Google Scholar] [CrossRef]
  22. Lai, X.; Jiang, J.; Liang, Q.; Huang, Q. Large-scale hydrodynamic modeling of the middle Yangtze River Basin with complex river–lake interactions. J. Hydrol. 2013, 492, 228–243. [Google Scholar] [CrossRef]
  23. Chen, J.; Wu, X.; Finlayson, B.L.; Webber, M.; Wei, T.; Li, M.; Chen, Z. Variability and trend in the hydrology of the Yangtze River, China: Annual precipitation and runoff. J. Hydrol. 2014, 513, 403–412. [Google Scholar] [CrossRef]
  24. Meng, C.Q.; Zhou, J.Z.; Tayyab, M.; Zhu, S.; Zhang, H.R. Integrating Artificial Neural Networks into the VIC Model for Rainfall-Runoff Modeling. Water 2016, 8, 407. [Google Scholar] [CrossRef]
  25. McMillan, H.; Freer, J.; Pappenberger, F.; Krueger, T.; Clark, M. Impacts of uncertain river flow data on rainfall-runoff model calibration and discharge predictions. Hydrol. Process. 2010, 24, 1270–1284. [Google Scholar] [CrossRef]
  26. Bao, A.M.; Liu, H.L.; Chen, X.; Pan, X.L. The effect of estimating areal rainfall using self-similarity topography method on the simulation accuracy of runoff prediction. Hydrol. Process. 2011, 25, 3506–3512. [Google Scholar] [CrossRef]
  27. Xiong, L.H.; Yu, K.X.; Zhang, H.G.; Zhang, L.P. Annual runoff change in the headstream of Yangtze River and its relation to precipitation and air temperature. Hydrol. Res. 2013, 44, 850–874. [Google Scholar] [CrossRef]
  28. Chen, Z.; Yu, L.Z.; Gupta, A. The Yangtze River: An introduction. Geomorphology 2001, 41, 1–248. [Google Scholar] [CrossRef]
  29. Du, J.; Shi, C.X.; Zhang, C.D. Modeling and analysis of effects of precipitation and vegetation coverage on runoff and sediment yield in Jinsha River Basin. Water Sci. Eng. 2013, 6, 44–58. [Google Scholar]
  30. The Yangtze River Waterway Administration. 2016. Available online: http://yu-zhu.vicp.net/ (accessed on 20 April 2017).
  31. Liu, R.X.; Kuang, J.; Gong, Q.; Hou, X.L. Principal component regression analysis with spss. Comput. Methods Programs Biomed. 2003, 71, 141–147. [Google Scholar] [CrossRef]
  32. National Meteorological Information Center. 2016. Available online: http://www.escience.gov.cn/metdata/page/index.html (accessed on 20 April 2017).
  33. Djebou, D.C.S. Integrated approach to assessing streamflow and precipitation alterations under environmental change: Application in the Niger River Basin. J. Hydrol. Reg. Stud. 2015, 4, 571–582. [Google Scholar] [CrossRef]
  34. Wang, H.; Saito, Y.; Zhang, Y.; Bi, N.; Sun, X.; Yang, Z. Recent changes of sediment flux to the western Pacific Ocean from major rivers in East and Southeast Asia. Earth-Sci. Rev. 2011, 108, 80–100. [Google Scholar] [CrossRef]
  35. Djebou, S.; Dagbegnon, C.; Singh, V.P. Impact of climate change on precipitation patterns: A comparative approach. Int. J. Climatol. 2016, 36, 3588–3606. [Google Scholar] [CrossRef]
  36. Sohoulande Djebou, D.C.; Singh, V.P. Impact of climate change on the hydrologic cycle and implications for society. Environ. Soc. Psychol. 2015, 1, 9–16. [Google Scholar]
  37. Liu, P.; Guo, S.; Li, W. Optimal design of seasonal flood control water levels for the Three Gorges Reservoir. IAHS Publ. 2008, 319, 270–278. [Google Scholar]
  38. Yun, R.; Singh, V.P. Multiple duration limited water level and dynamic limited water level for flood control, with implication on water supply. J. Hydrol. 2008, 354, 160–170. [Google Scholar] [CrossRef]
  39. Li, X.; Guo, S.; Liu, P.; Chen, G. Dynamic control of flood limiting water level for reservoir operation by considering inflow uncertainty. J. Hydrol. 2010, 391, 124–132. [Google Scholar] [CrossRef]
  40. Li, Y.; Zhou, J.; Zhang, Y.; Qin, H.; Liu, L. Novel multiobjective shuffled frog leaping algorithm with application to reservoir flood control operation. J. Water Resour. Plan. Manag. 2010, 136, 217–226. [Google Scholar] [CrossRef]
  41. Chou, F.N.F.; Wu, C.W. Reducing the impacts of flood-induced reservoir turbidity on a regional water supply system. Adv. Water Resour. 2010, 33, 146–157. [Google Scholar] [CrossRef]
  42. Liu, P.; Guo, S.; Xiong, L.; Li, W.; Zhang, H. Deriving reservoir refill operating rules by using the proposed DPNS model. Water Resour. Manag. 2006, 20, 337–357. [Google Scholar] [CrossRef]
  43. Zhou, J.Z.; Zhang, Y.C.; Zhang, R.; Shuo, O.Y.; Wang, X.M.; Liao, X. Integrated optimization of hydroelectric energy in the upper and middle Yangtze River. Renew. Sustain. Energy Rev. 2015, 45, 481–512. [Google Scholar] [CrossRef]
  44. Xie, M.F.; Zhou, J.Z.; Li, C.L.; Zhu, S. Long-term generation scheduling of Xiluodu and Xiangjiaba cascade hydro plants considering monthly streamflow forecasting error. Energy Convers. Manag. 2015, 105, 368–376. [Google Scholar] [CrossRef]
Figure 1. Selected meteorological and hydrological stations on the Jinsha River.
Water 09 00293 g001
Figure 2. Simulated and observed results of average daily Jinsha River discharge during flood season in 2015.
Water 09 00293 g002
Figure 3. Simulated and observed results of average daily Jinsha River discharge during flood season in 2016.
Water 09 00293 g003
Figure 4. Rainfall distribution over the Jinsha River basin under A1B from May to July in different periods: (a) 2010–2040 rainfall compared with 1960–1990; (b) 2040–2070 rainfall compared with 1960–1990; (c) 2070–2099 rainfall compared with 1960–1990; (d) 2010–2040 rainfall compared with 1980–2010; (e) 2040–2070 rainfall compared with 1960–1990; (f) 2070–2099 rainfall compared with 1980–2010.
Water 09 00293 g004
Figure 5. Rainfall distribution over Jinsha River basin under A1B from August to October during different periods: (a) 2010–2040 rainfall compared with 1960–1990; (b) 2040–2070 rainfall compared with 1960–1990; (c) 2070–2099 rainfall compared with 1980–2010; (d) 2010–2040 rainfall compared with 1980–2010; (e) 2040–2070 rainfall compared with 1960–1990; (f) 2070–2099 rainfall compared with 1980–2010.
Water 09 00293 g005
Figure 6. Rainfall distribution over Jinsha River basin under B2 from May to October in different periods: (a) 2070–2099 rainfall compared with 1960–1990; (b) 2070–2099 rainfall compared with 1980–2010.
Water 09 00293 g006
Figure 7. Simulation of discharge for Jinsha River from May to October (1961–2099) under scenario A1B.
Water 09 00293 g007
Figure 8. Simulation results of Jinsha River discharge from May to October in 1961–2099 under scenario B2.
Water 09 00293 g008
Table 1. Collinearity inspection by eigenvalue and conditional index.
DimensionEigenvalueConditional IndexVariance Proportion
ConstantBatangShiguJinjiangjiePanzhihuaTongzilinYajiangGanziLongjieWudongdeHuatanBaihetanXiluoduPingshanXiangjiaba
12.911.000.000.020.000.000.000.000.010.000.000.020.010.010.020.010.01
21.931.230.000.000.030.040.000.020.000.000.000.020.060.030.000.000.00
31.671.320.000.000.050.050.010.010.010.060.030.020.020.050.000.000.00
41.251.530.000.070.010.000.040.160.050.010.150.010.000.000.010.000.00
51.181.570.000.080.030.010.060.040.130.250.010.000.000.000.010.000.00
61.031.690.000.010.000.010.560.000.190.000.010.040.010.000.010.000.00
71.001.711.000.000.000.000.000.000.000.000.000.000.000.000.000.000.00
80.921.780.000.180.050.000.020.170.080.080.000.030.000.020.050.000.00
90.811.900.000.020.000.120.020.030.070.050.280.030.010.010.060.000.00
100.692.050.000.230.000.000.110.010.010.000.020.270.010.200.030.000.01
110.652.120.000.170.010.010.140.040.410.400.030.040.010.000.000.000.00
120.412.670.000.000.000.010.000.000.000.030.050.480.330.000.160.010.04
130.293.190.000.050.220.390.000.110.020.040.020.010.110.350.290.000.01
140.233.530.000.100.340.190.000.280.000.060.090.020.360.250.110.000.06
150.048.540.000.080.260.160.030.110.000.010.290.010.080.070.250.980.88
Table 2. Rainfall variables of June, selected through a step-wise method.
NumberInput VariableRemove VariableStep-Wise Method
1Wudongde-Step (criterion: F-to-enter probability ≤ 0.050; F-to-remove probability ≥ 0.1)
2Longjie-Step (criterion: F-to-enter probability ≤ 0.050; F-to-remove probability ≥ 0.1)
3Jinjiangjie-Step (criterion: F-to-enter probability ≤ 0.050; F-to-remove probability ≥ 0.1)
4Shigu-Step (criterion: F-to-enter probability ≤ 0.050; F-to-remove probability ≥ 0.1)
5Ganzi-Step (criterion: F-to-enter probability ≤ 0.050; F-to-remove probability ≥ 0.1)
6Batang-Step (criterion: F-to-enter probability ≤ 0.050; F-to-remove probability ≥ 0.1)
7Huatan-Step (criterion: F-to-enter probability ≤ 0.050; F-to-remove probability ≥ 0.1)
8Pingshan-Step (criterion: F-to-enter probability ≤ 0.050; F-to-remove probability ≥ 0.1)
9Xiangjiaba-Step (criterion: F-to-enter probability ≤ 0.050; F-to-remove probability ≥ 0.1)
10Tongzilin-Step (criterion: F-to-enter probability ≤ 0.050; F-to-remove probability ≥ 0.1)
11Xiluodu-Step (criterion: F-to-enter probability ≤ 0.050; F-to-remove probability ≥ 0.1)
12Panzhihua-Step (criterion: F-to-enter probability ≤ 0.050; F-to-remove probability ≥ 0.1)
13Baihetan-Step (criterion: F-to-enter probability ≤ 0.050; F-to-remove probability ≥ 0.1)
14Yajiang-Step (criterion: F-to-enter probability ≤ 0.050; F-to-remove probability ≥ 0.1)
Table 3. F-test for June rainfall and runoff statistical model.
ModelRR SquareAdjusted RStandard Estimate ErrorSig. FCorrelation Coefficient
10.8450.7140.682677.7380.0070.717
Table 4. T-test and regression coefficient.
VariablesBStandard ErrorTSig. T
constant2983.378121.26224.6030.000
Batang120.27917.0037.0740.000
Shigu−133.66412.197−10.9590.000
Jinjiangjie108.08211.3079.5580.000
Panzhihua−32.2828.664−3.7260.000
Tongzilin−48.2438.945−5.3930.000
Yajiang23.7608.6952.7330.007
Ganzi73.09010.9716.6620.000
Longjie93.2038.15411.4300.000
Wudongde22.0055.3214.1360.000
Huatan46.5497.1646.4980.000
Baihetan−16.6966.984−2.3910.018
Xiluodu40.8029.5814.2590.000
Pingshan−254.88131.724−8.0340.000
Xiangjia161.60025.3426.3770.000
Table 5. Jinsha River hydrological frequency analysis from May to October.
Recurrence intervals1961–19901991–20202021–20502051–2099
May
100-year return period4187388841174603
50-year return period4052374839524387
June
100-year return period5313550958296161
50-year return period5167533856485981
July
100-year return period9054906691529403
50-year return period8926895190409254
August
100-year return period8896859991409389
50-year return period8773852590009224
September
100-year return period9060951591619936
50-year return period8908926789929721
October
100-year return period8907904594859848
50-year return period8721886492239636
Table 6. Parameters of four cascade hydropower stations in the Jinsha River basin [43,44].
ParameterWudongdeBaihetanXiluoduXiangjiaba
Adjustment abilityAnnualAnnualAnnualSeason
Regulating storage (billion m3)2.6010.406.460.90
Installed capacity (MW)870014,00013,8606400
Dead water level (m)945765540 370
Flood limiting water level (m)952785560370
Normal storage water level (m)975825600380
Water level range (m)[945, 975][765, 825][540, 600][370, 380]

