Article

Urban Runoff Characteristics in Combined Sewer Overflows (CSOs): Analysis of Storm Events in Southeastern Spain

by
Juan Tomás García
1,*,
Pablo Espín-Leal
1,
Antonio Vigueras-Rodriguez
1,
Luis G. Castillo
1,
José M. Carrillo
1,
Pedro D. Martínez-Solano
2 and
Simón Nevado-Santos
2
1
Hidr@m Group, Department of Civil Engineering, Universidad Politécnica de Cartagena, Paseo Alfonso XIII, 52, 30203 Cartagena, Spain
2
Empresa Municipal de Aguas y Saneamiento de Murcia, S.A., Plaza Circular 9, 30008 Murcia, Spain
*
Author to whom correspondence should be addressed.
Water 2017, 9(5), 303; https://doi.org/10.3390/w9050303
Submission received: 23 February 2017 / Revised: 17 April 2017 / Accepted: 23 April 2017 / Published: 26 April 2017

Abstract

:
Storm water overflows have an important impact on the environment in many European countries. Nowadays, a better knowledge of combined sewer overflows (CSOs) pollution is required for implementing measures to reduce these emissions. In this work, pollution flows mobilized during rainy events have been monitored and modeled in two urban catchments located in the city of Murcia (southeast Spain). For each analyzed event, rainfall volume, in-sewer turbidity and water flow depth have been continuously measured. Therefore, sets of pollutographs and hydrographs have been obtained for each event analyzed. Characteristic variables have been defined and obtained for each event such as the maximum concentration of turbidity, the total event rainfall, the previous dry weather period, the time to the peak of the hydrograph and to the peak of the pollutograph, among others. Relations between variables have been adjusted through a statistical model. The adjusted parameters are used to generate pollutographs that are compared with those measured in field. The present work provides tools to assist in the knowledge of pollution transported through sewer network during stormy events, suggesting the creation of design pollutographs which may facilitate the evaluation of measures to reduce urban runoff pollution.

1. Introduction

The reduction of pollution emissions from combined sewer overflows (CSOs) is currently a prime issue. Actually, European Directives aim to quantify and reduce them to protect the environment and human health, and to provide water leisure activities and water abstraction for agriculture [1]. Although a lack of knowledge of the quantity and the quality of these overflows is recognized and policies have yet to be achieved in most countries, important efforts are being done (e.g., [2,3,4,5]). Risk based approaches are usually implemented taking into account the type of collecting systems and the intensity of the rain events or flooding. Spill frequency, or volume percentage retained, are habitually selected [4,6]. Other approach is the receiving water quality criteria, based on Urban Pollution Management procedures (UPM) standards [5]. It requires being aware of ecological state of receiving water and effects induced by the pollution. Field measurement campaigns of the urban sub-catchment are recommended as a previous step to implement an approach [3,7,8] so that pollution mobilized during rain events can be evaluated.
Continuous water-quality monitoring sensors are being increasingly implemented in sewers. In order to replace traditional sampling, turbidimeters can be used to estimate total suspended solids (TSS) and chemical oxygen demand (COD) concentration in sewers, by linear regression of on-site turbidity with site-specific measurements [7,8,9,10,11,12,13].
The relationship between pollutant load of TSS and runoff, by statistical approaches, constitutes a field of research to identify pollution associated to CSOs [7,14,15,16,17,18,19,20]. In this way, measured hydrographs and pollutographs analysis are used to relate the peak of the pollutant concentration of the flow, and the mass and flow cumulative volume curves M(V), which, for instance, allow determining whether the first flush effect exists for a particular catchment [7,14,15,16,17]. Suarez and Puertas [17] fitted the maximum suspended solids concentration (CMAXSS) by means of probability distributions. With regard to rainy events, several researchers [7,18,19,20] performed regression analysis between TSS and hydrological and hydraulic variables (Table 1). These statistical models gave rise to adjusted pollution parameters, which can be used for forecasting transported pollution characteristics along storm events, providing useful information to establish effective policies of combined sewer overflow control. As these studies are usually catchment specific, an important aim would be to define standard coefficients for a wide range of catchment conditions [18].
For a proper design of sustainable sewer systems, hydraulic and quality modeling tools are utilized [8,19,21]. Hydraulic models, such as USEPA Storm Water Management Model (SWMM) [22], predict the runoff flow rate and volume from observed rainfall intensities with accuracy. However, for quality models, the uncertainty is an order of magnitude greater than that for the hydraulic submodels [23]. That makes their calibration and use complex.
In this work, statistical models are proposed to predict the event maximum turbidity concentration (CMAXtb), the time to the peak of the pollutograph (TPP), and the time to the descent of pollutograph (TDP).
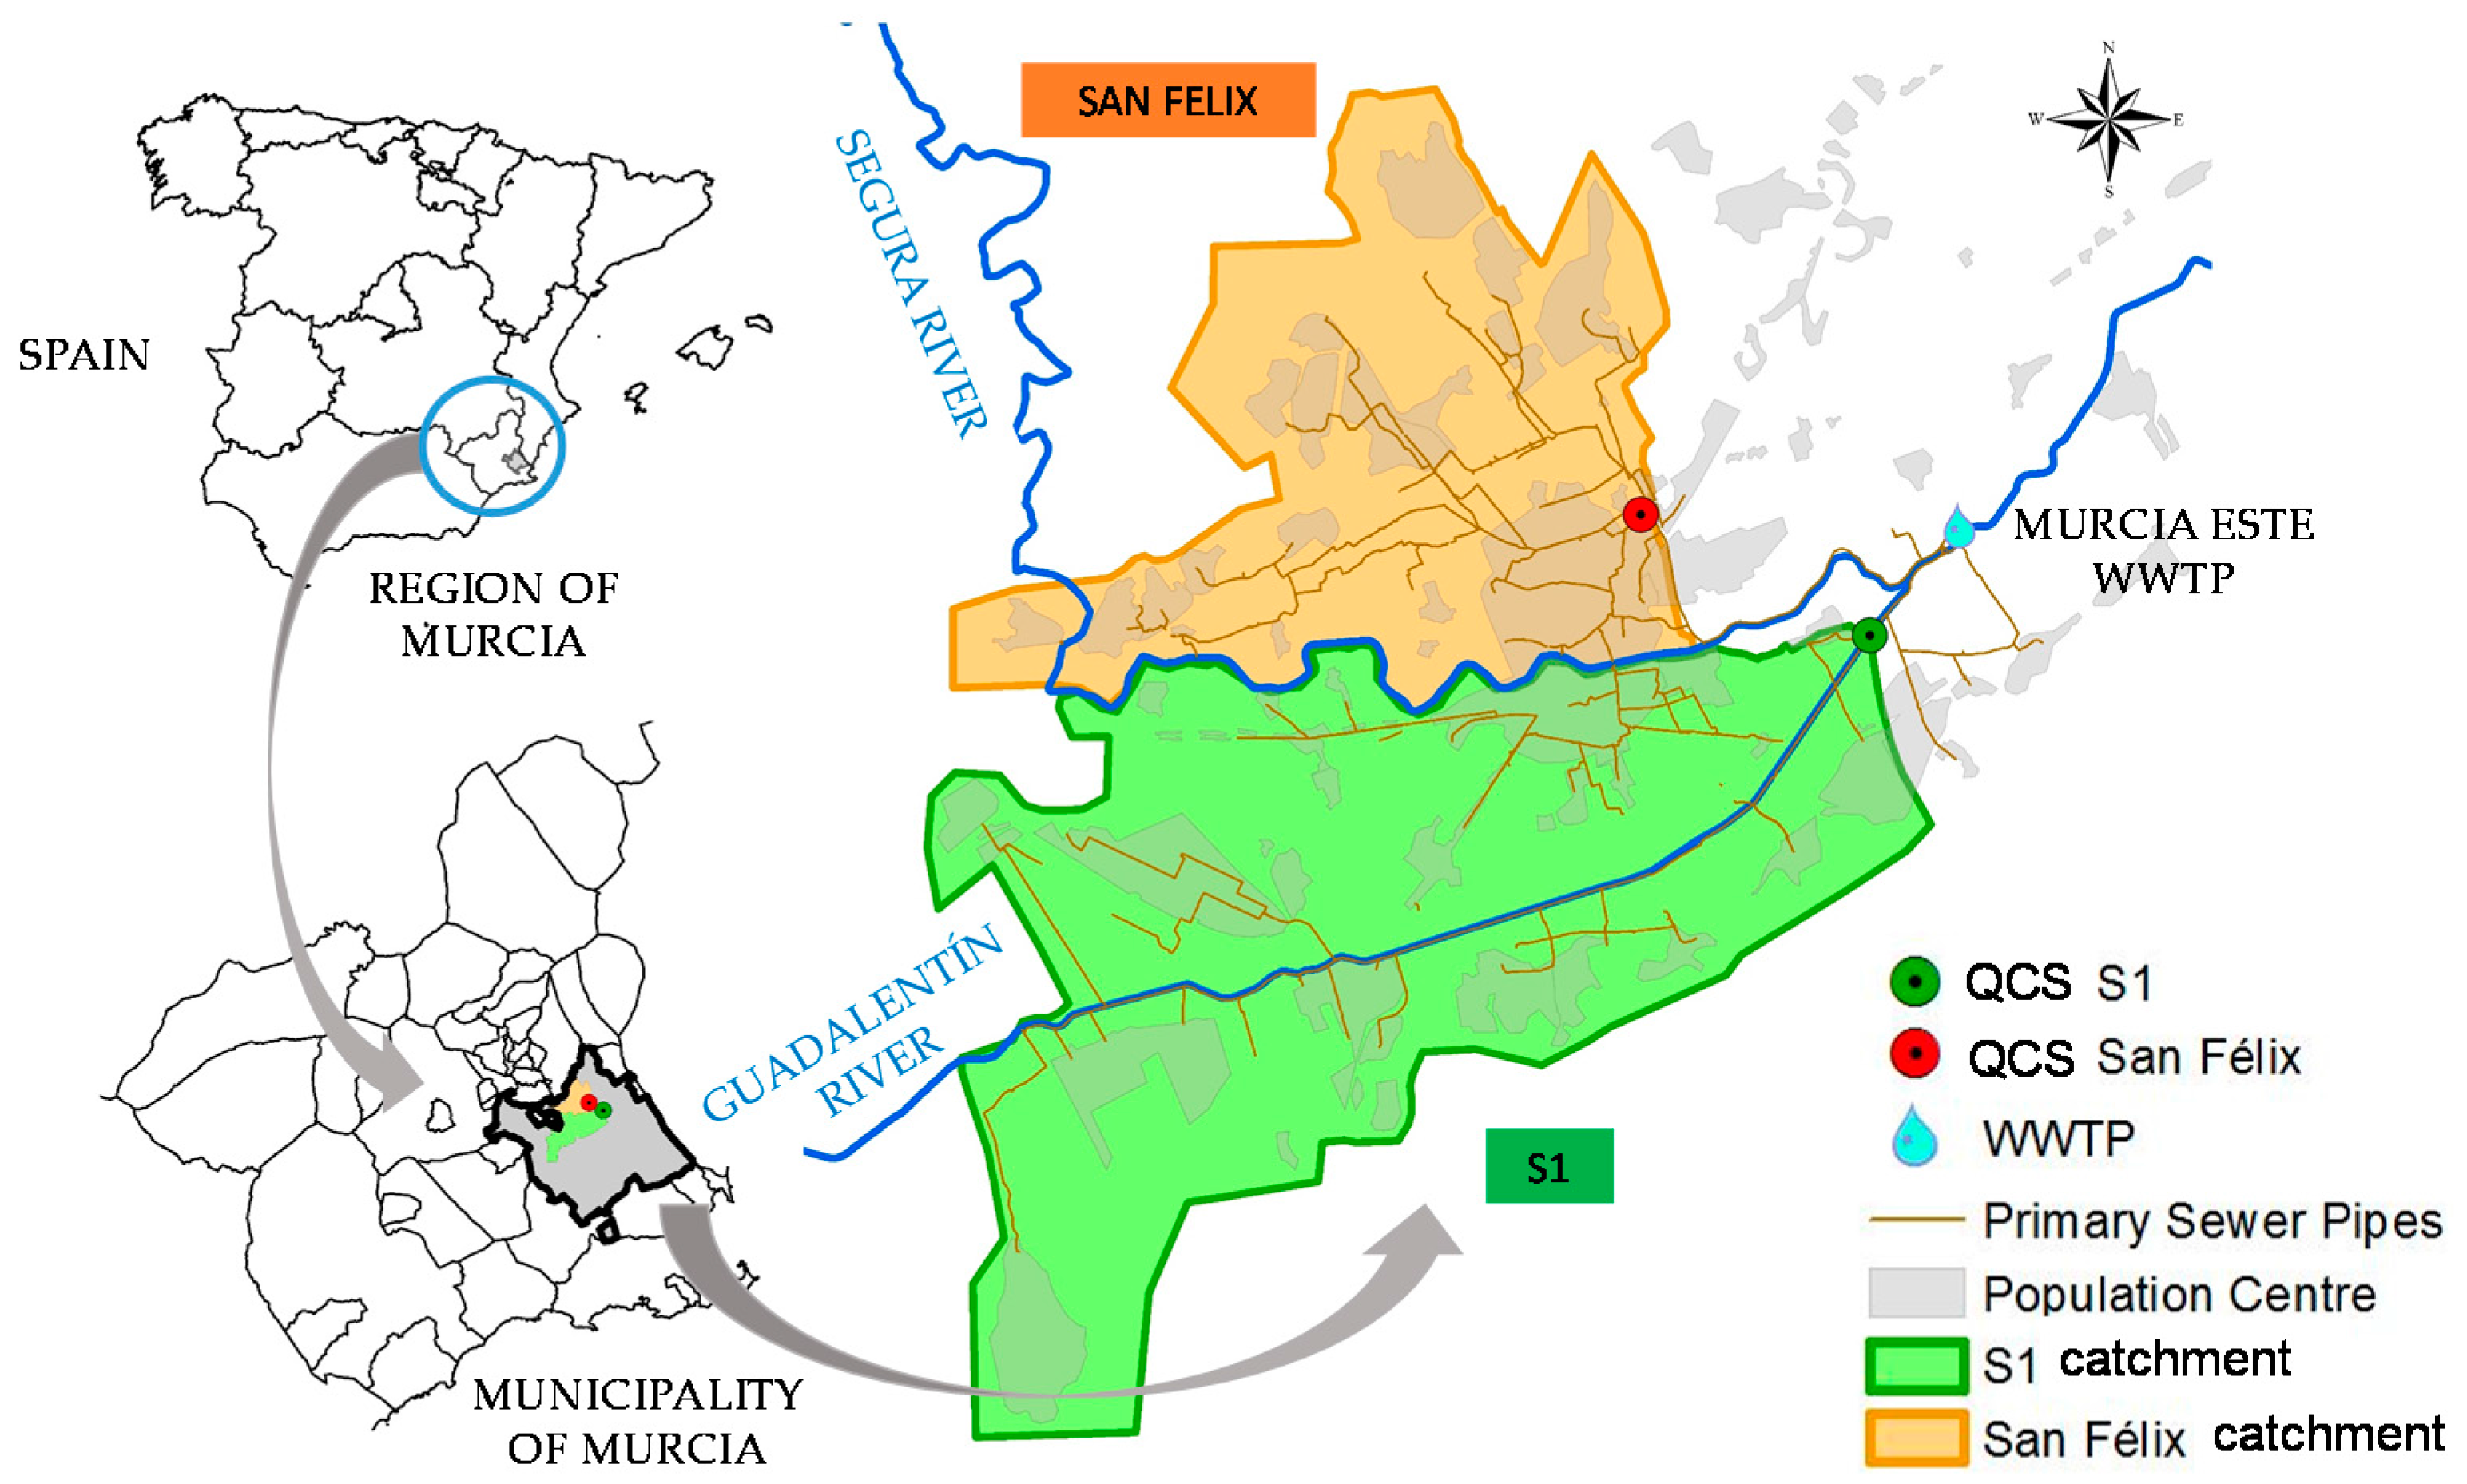
The statistical models are based upon analysis of data collected from rainfall events during period from June 2014 to April 2016 at two urban catchments in the city of Murcia (southeast Spain). Both catchments were monitored with continuous measurements from rain gauges, in-sewer turbidimeters and water gauges. Several input parameters of the statistical models were considered to assess their significance, and the most significant parameters were selected. Predicted pollutograph parameters are calculated and modeled. The proposed pollutographs are compared with the measured ones showing a significant agreement. A calibrated hydraulic model of the city of Murcia has been generated in the USEPA Storm Water Management Model (SWMM). The numerical model is used to analyze the catchment hydraulic response to each rainfall event.
The present work provides tools to assist in the knowledge of pollution transported through sewer network during stormy events, suggesting the creation of design pollutographs which may facilitate the evaluation of measures to reduce urban runoff pollution.

2. Experimental Methods

2.1. Description of the Experimental Catchment Areas

Murcia is a southeastern Spanish city with an equivalent population of 525,027. It is situated in a valley at the confluence of the Guadalentín and Segura rivers (Figure 1). The study site includes two urban catchments, called San Félix and S1. Both catchments are residential areas, their impervious areas being 21% and 47%, respectively (Table 2). The sewer system is combined incorporating storm water. Due to the flat topographic conditions, there are several sewer pump stations. Both catchments flow into “Murcia Este” Wastewater Treatment Plant whose maximum capacity during dry weather is Qmaxdw = 10.000 m3/h. At the outlet pipe of each catchment, monitoring equipments were placed in Quality Control Stations (QCS) (Figure 1).
The catchment slope was estimated from a Digital Elevation Model with a 2 m × 2 m grid, using ArcGIS 10.3 software. The catchment flow length was obtained from the sewer network geodatabase of the Empresa Municipal de Aguas y Saneamiento de Murcia S.A. (Emuasa).

2.2. Monitoring Equipment

The city of Murcia is equipped with 39 tipping-bucket rain gauges that cover the different catchments. Their measurements range is between 0 and 7 mm/min, with an accuracy of 0.2 mm. Data are continuously sent and plotted through a SCADA system.
Monitoring equipments were placed at the outlet sewer pipe of the analysed catchments, close to an important overflow point (Figure 1). They consisted of a water gauge to continuously monitor the flow. The water level was measured with an ultrasonic sensor Endress + Hauser FMR50. The wastewater circulating in sewers is continuously pumped by means of a 1 L/s peristaltic pump to a 20 L sedimentation tank, through a suction 25 mm-diameter pipe inserted in the sewer and protected by a screen of stainless steel to trap sediments (Figure 2). Wastewater passes through a 20 L tank, in which the probes are located. The probes measure turbidity, conductivity and temperature. Data are recorded within a 20 s time interval. The turbidity data are obtained with an infra-red nephelometric turbidimeter Endress + Hauser CUS 42 measuring at a wavelength of 880 nm according to the standard NF EN 27027, associated to a data logger. A backwash proccess with clear water is automatized each hour to avoid disturbing measurements. Turbidimeters are calibrated with formazine solution. A technique for the removal of these outliers has been implemented.
The rating curve for each monitoring station was developed in previous studies. There is a control section-free overfall in the Quality Control Station of San Felix. A water level measurement is used in the Quality Control Station of S1. Velocity sensors were used in a straight conduit of 1.8 m diameter and around 1000 m length, where uniform conditions were confirmed.

2.3. Hydraulic Model

The US Environmental Protection Agency’s Storm Water Management Model (USEPA) is a numerical model that allows simulating the hydrological and hydraulic behavior of an urban drainage system. A calibrated SWMM hydraulic model of the city of Murcia has been used. It serves to study the catchment response to any rainfall event (Figure 3). The characteristics of the model are shown in Table 3. The total length of the network included in the model is around 234.5 km.
The Horton equation was used for infiltration modeling. Values adopted are in accordance with soil characteristics and with those proposed in the literature [21,22]. The maximum infiltration, f0, is around 20 mm/h, while the minimum infiltration, fc, is 1 mm/h. The decay coefficient, k, has been estimated at 4.14 h−1. The Manning’s roughness coefficients for pervious and impervious areas were used as calibration parameters of the model. Initial values were selected from the literature [21,22]: 0.02–0.045 for pervious areas and 0.01–0.015 for impervious areas. The Manning roughness coefficient for conduits varies from 0.011 to 0.013 depending on the pipe material.
The comparison of the measured and simulated flow depth is shown in Figure 4. In wet weather, two different events are presented. Some differences are found in S1 Catchment, whereas a quite good agreement is observed in San Felix Catchment. Those differences, which are below 10%, are caused by pump stations.
From the hydraulic model, the time of concentration, Tc, is obtained for each catchment. The concentration time, Tc, may be decomposed into two terms: overland runoff time, TE, and in-sewer run time, TR [3]:
T c = T E + T R
A common expression to calculate Tc in non-urban catchments is presented by Temez [24]:
T c _ r u r a l = 0.3 L 0.76 S 0.19
where L is the longest overland flow length (km), and S the mean catchment slope (-).
Values calculated from the hydraulic model and presented in Table 4 adjust to the Temez equation modified for urban areas [25]:
T c = T c _ r u r a l 1 + 3 μ ( 2 μ )
where Tc is the concentration time modified for urban catchments that takes into account the in-sewer run time, and μ is the fraction of the area that is impervious. The time of concentration of the catchment was obtained introducing a uniform precipitation in each sub-catchment with a duration higher enough to assure that all the surface contributes to the outfall.
The values of the modified concentration time, Tc, calculated by the hydraulic model and by Equation (3) are presented in the following table:

3. Results and Discussion

3.1. Variables Definition from Wet Weather Measured Events

The data registered from monitoring rainfall events corresponds to the period from June 2014 to April 2016 at both urban catchments. During this period, 10 storm events were measured in the S1 QCS and 9 in the San Felix QCS.
Measured values are presented in Table 5 and Table 6 for San Felix and S1, respectively. All rainfalls exceed the total amount of 2 mm, which is the minimum value to assure runoff.
Several variables have been calculated from the monitored data and are also collected in Table 5 and Table 6, such as the total rainfall volume PTOTAL, the maximum rainfall intensity during ten minutes Imax10, the mean intensity Imean, and the number of antecedent dry days DWP. There are also others parameters such as the maximum runoff flow rate Qmax, the mean runoff flow rate Qmean, the time to hydrograph peak TPH, the total runoff volume EV, the part of the runoff volume that would correspond to dry weather EVdw, the difference between both EVww, the maximum turbidity registered during the episode CMAXtb, the mean event turbidity value EMCtb, and the time to the peak of pollutograph TPP.
These variables have been calculated for all rainfalls, which are hereinafter used to study the correlation among them to adjust statistical models that allow predicting several variables at any rainfall event, e.g., the event maximum turbidity concentration CMAXtb, and the time to the peak of pollutograph TPP.
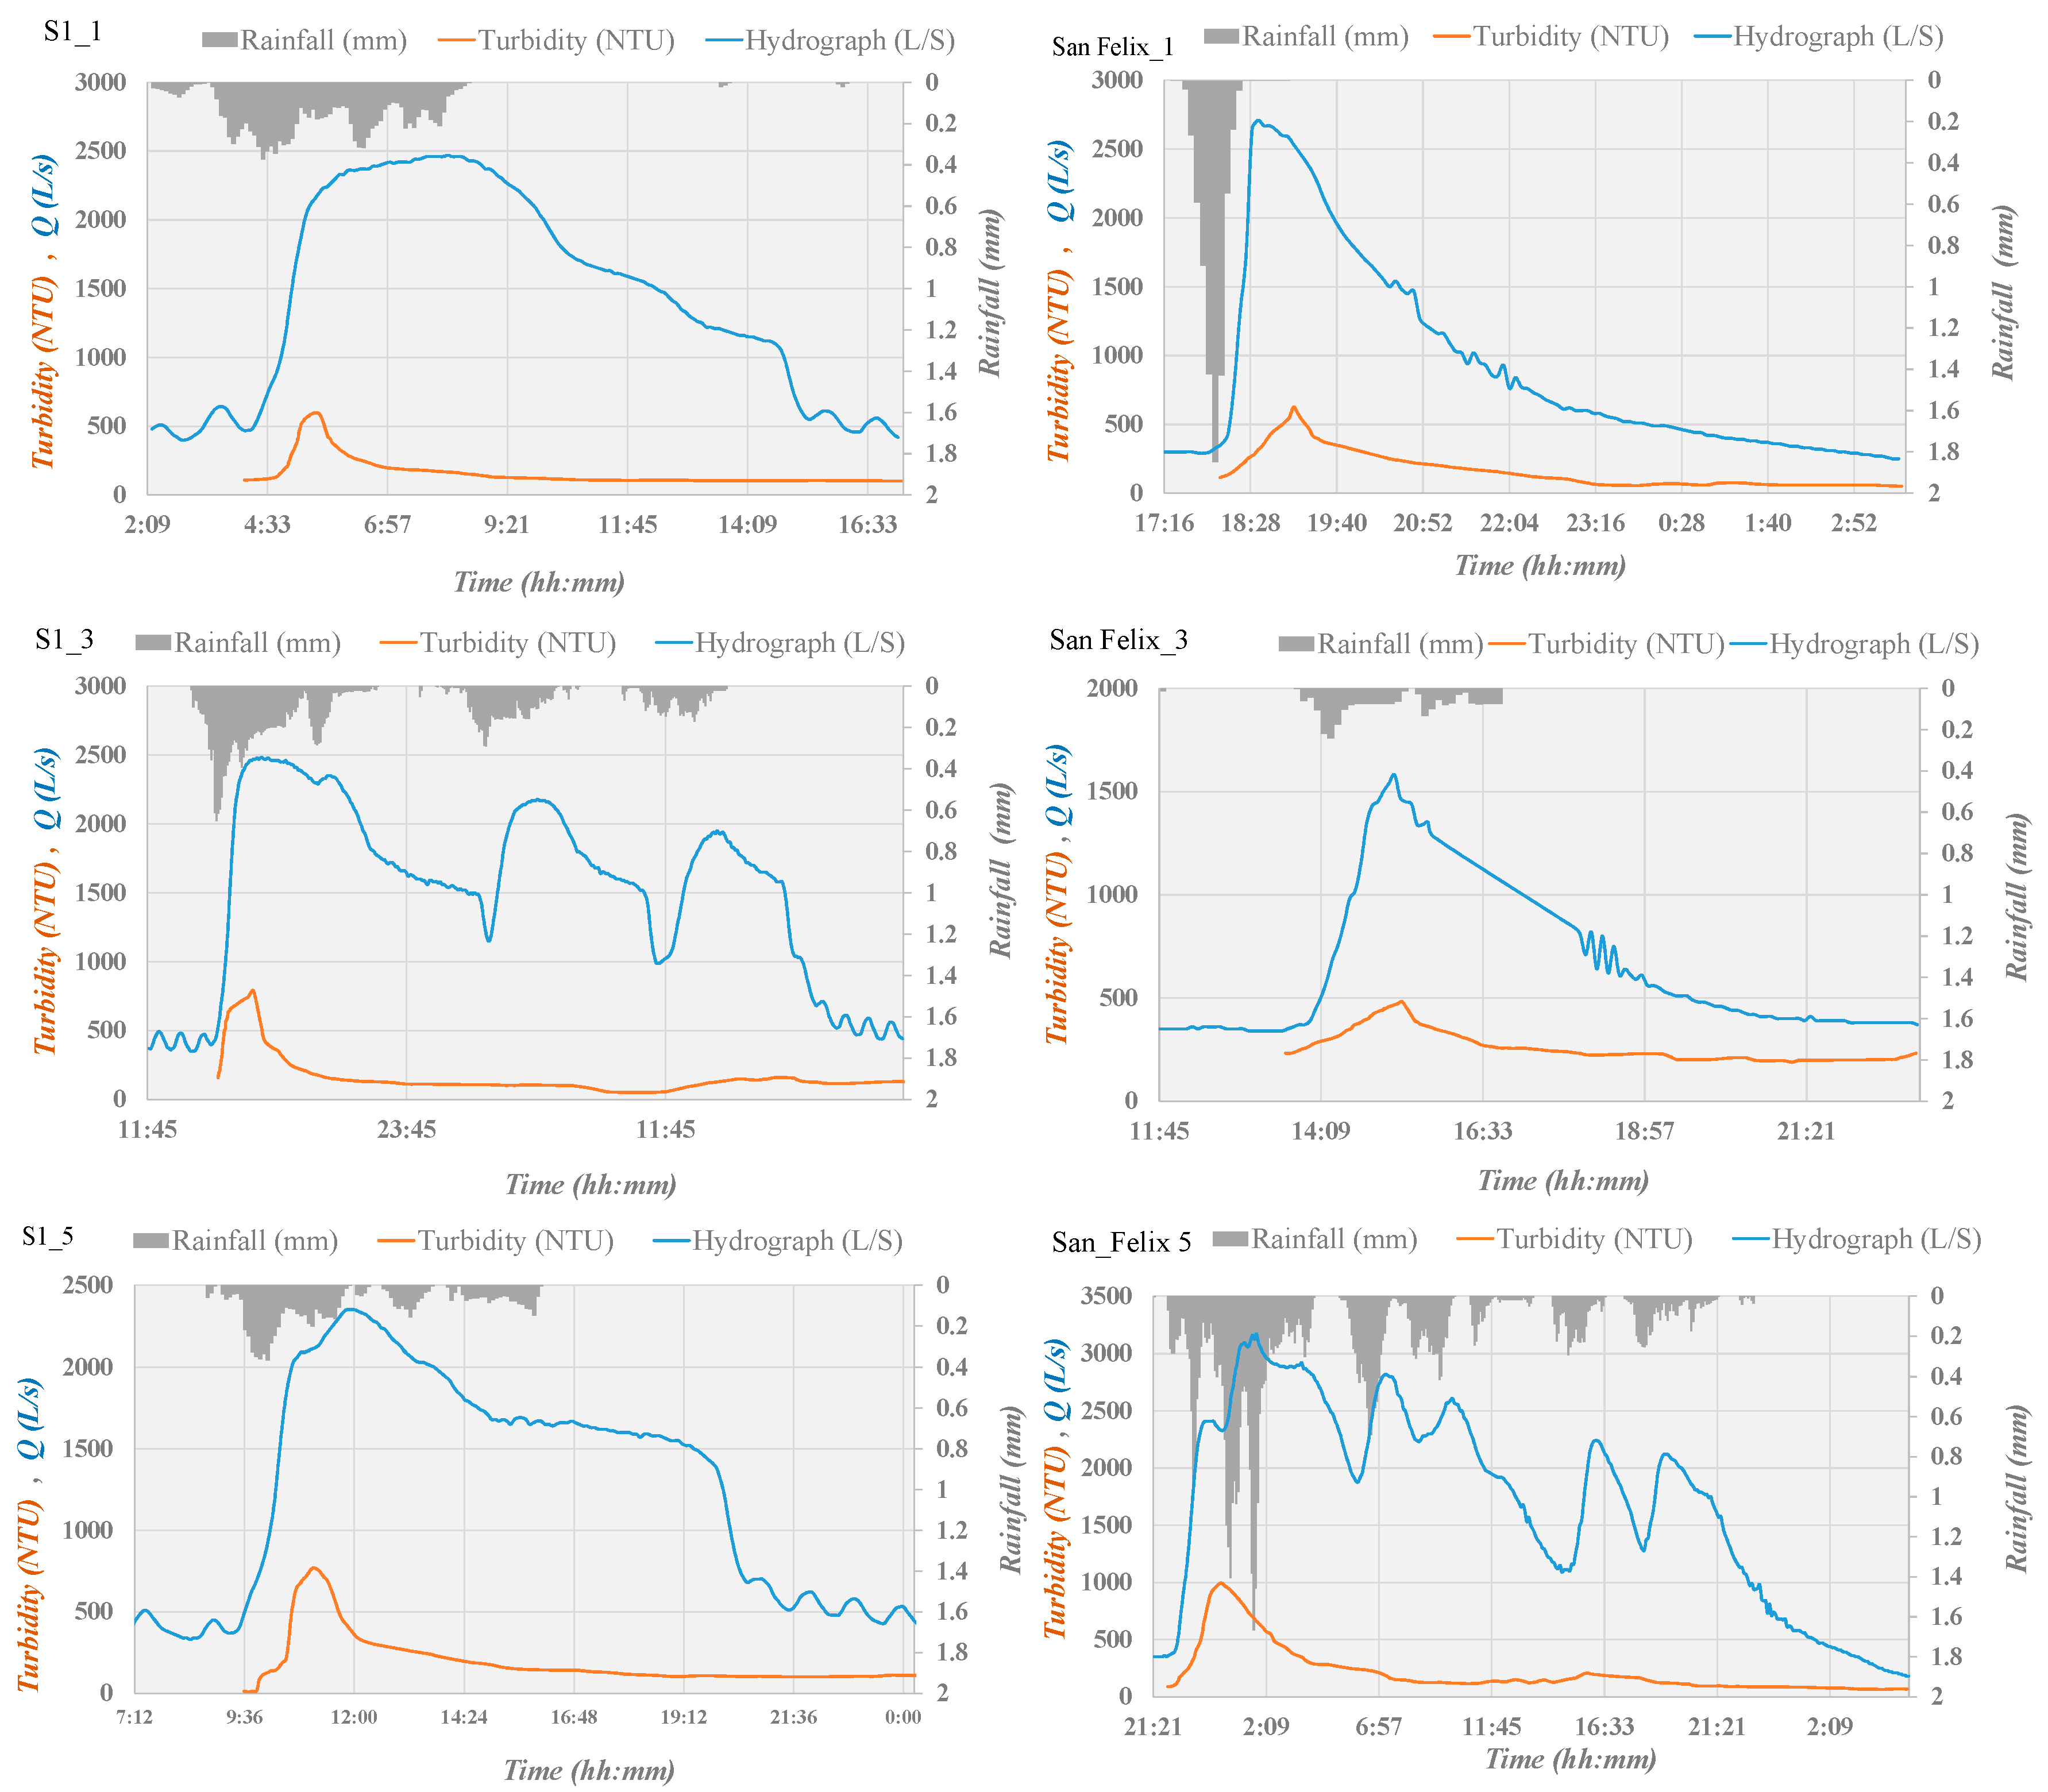
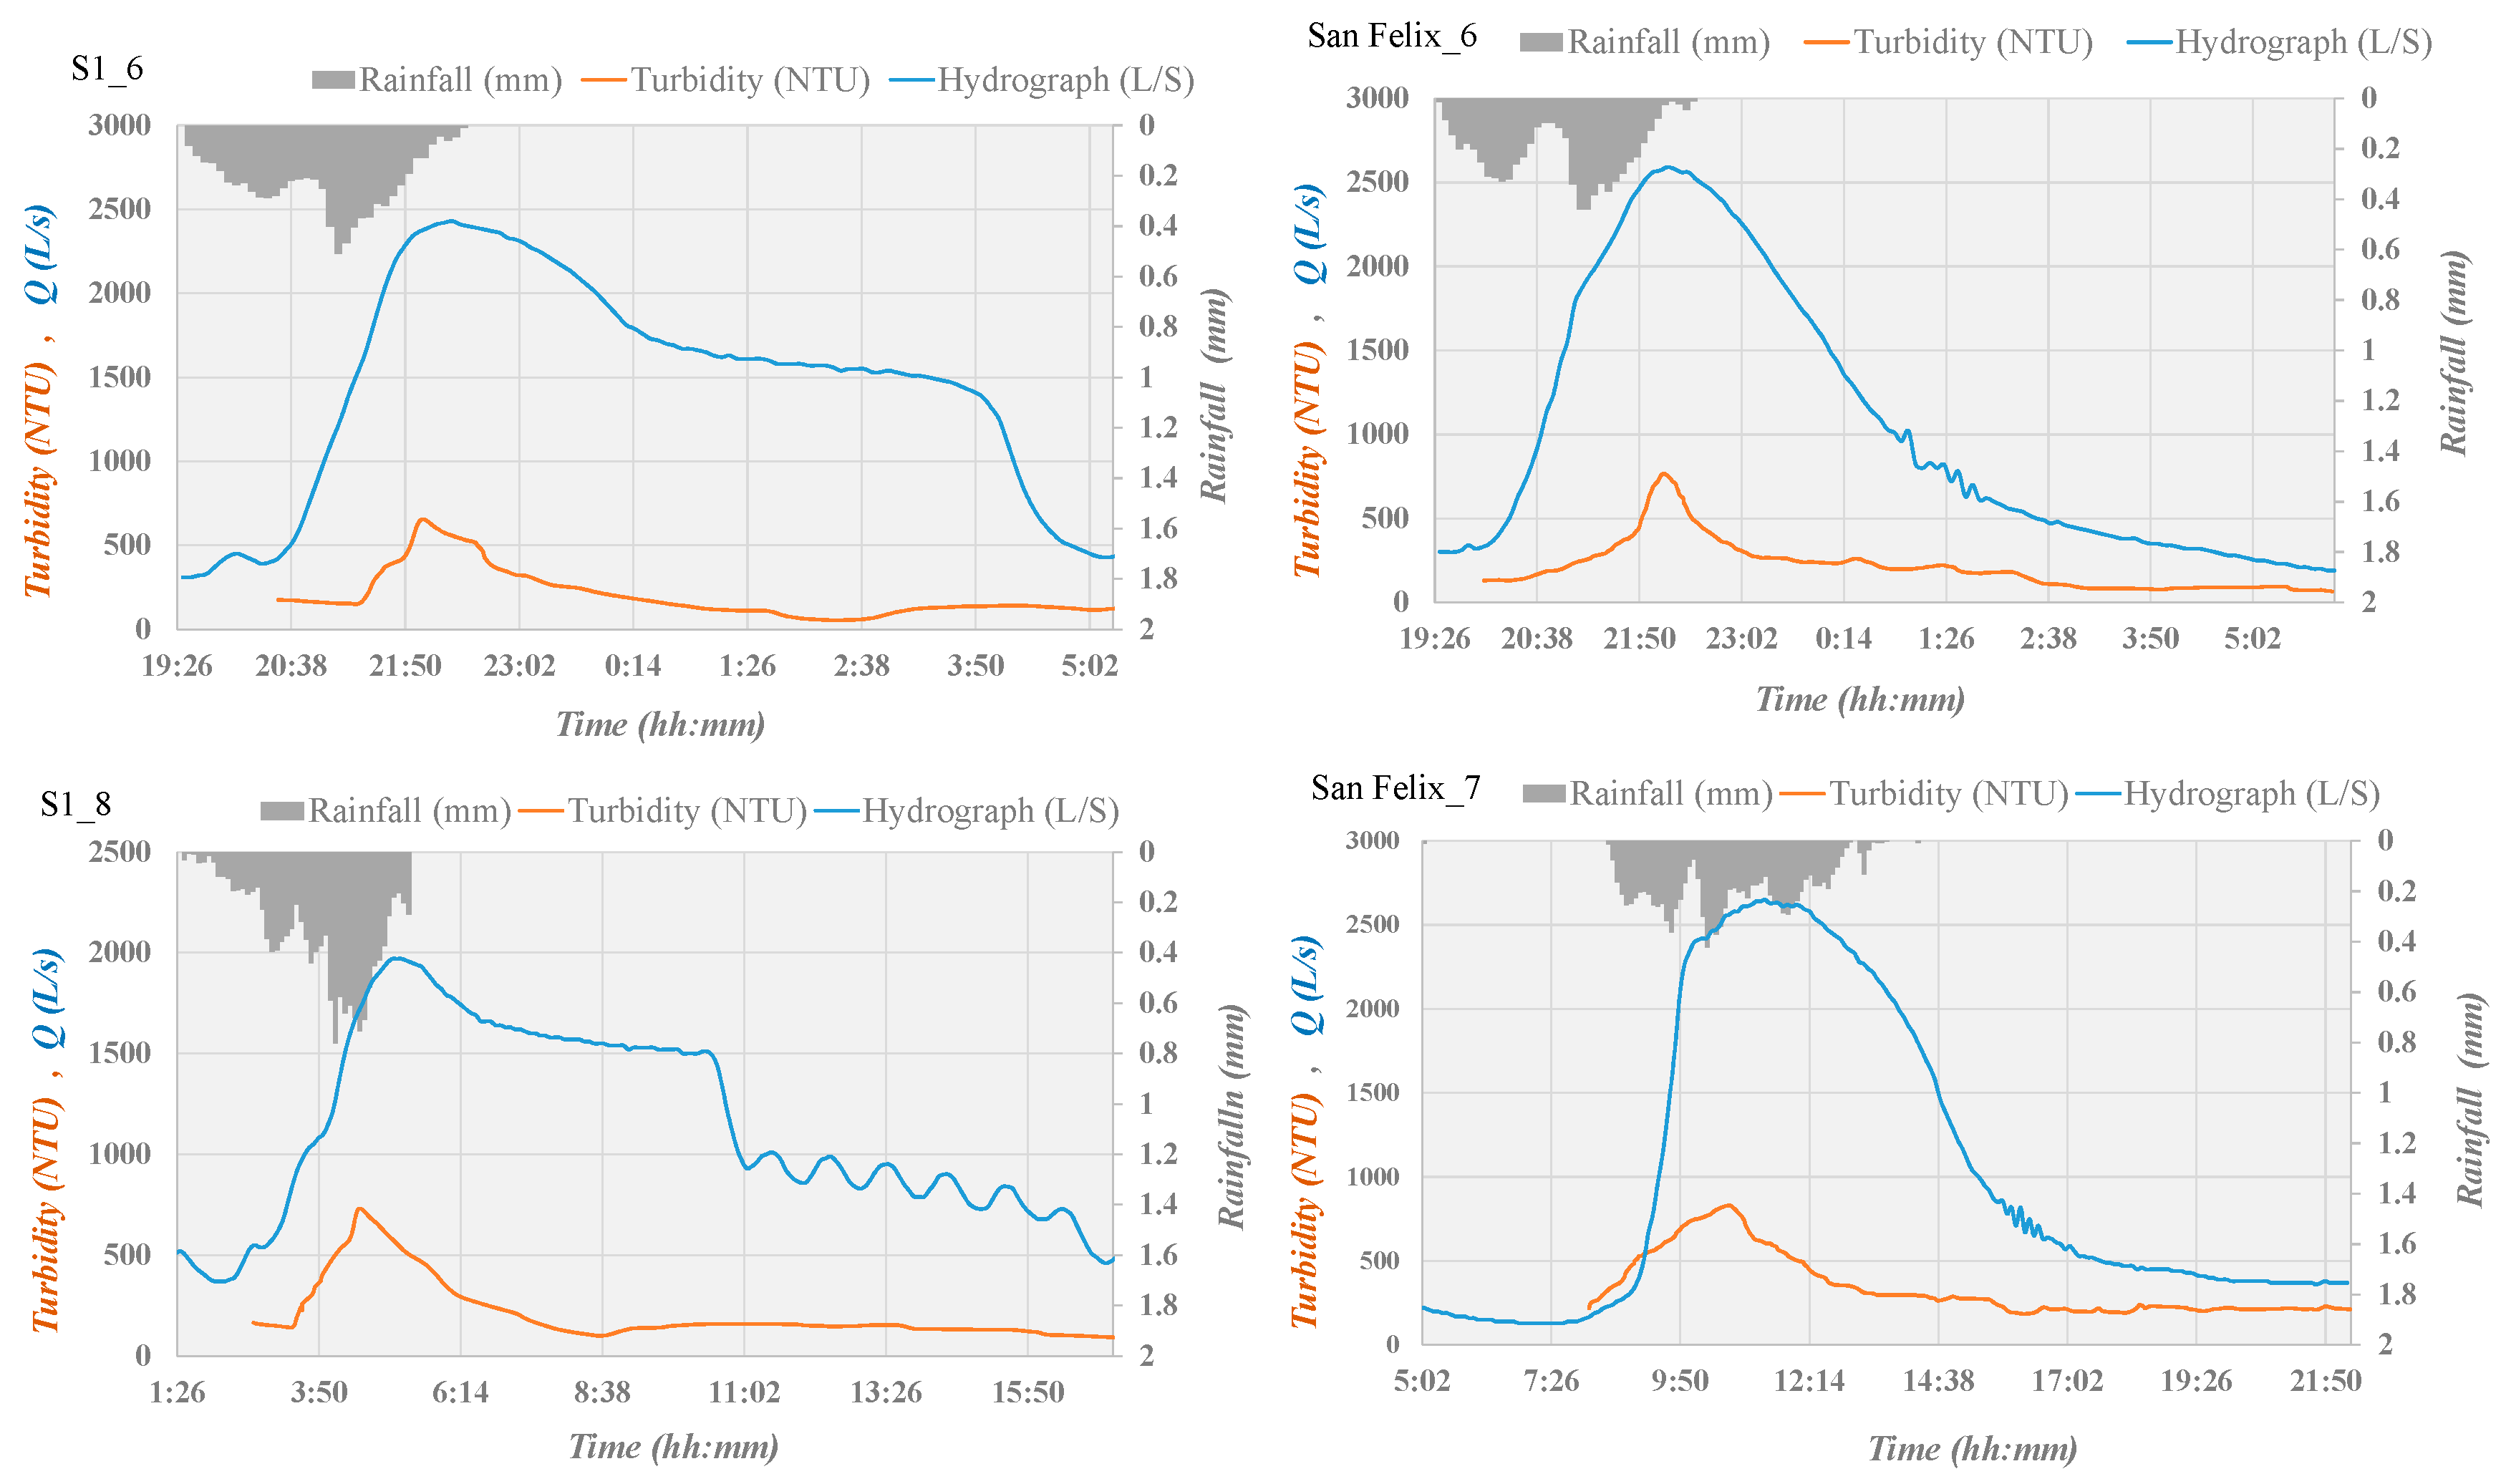
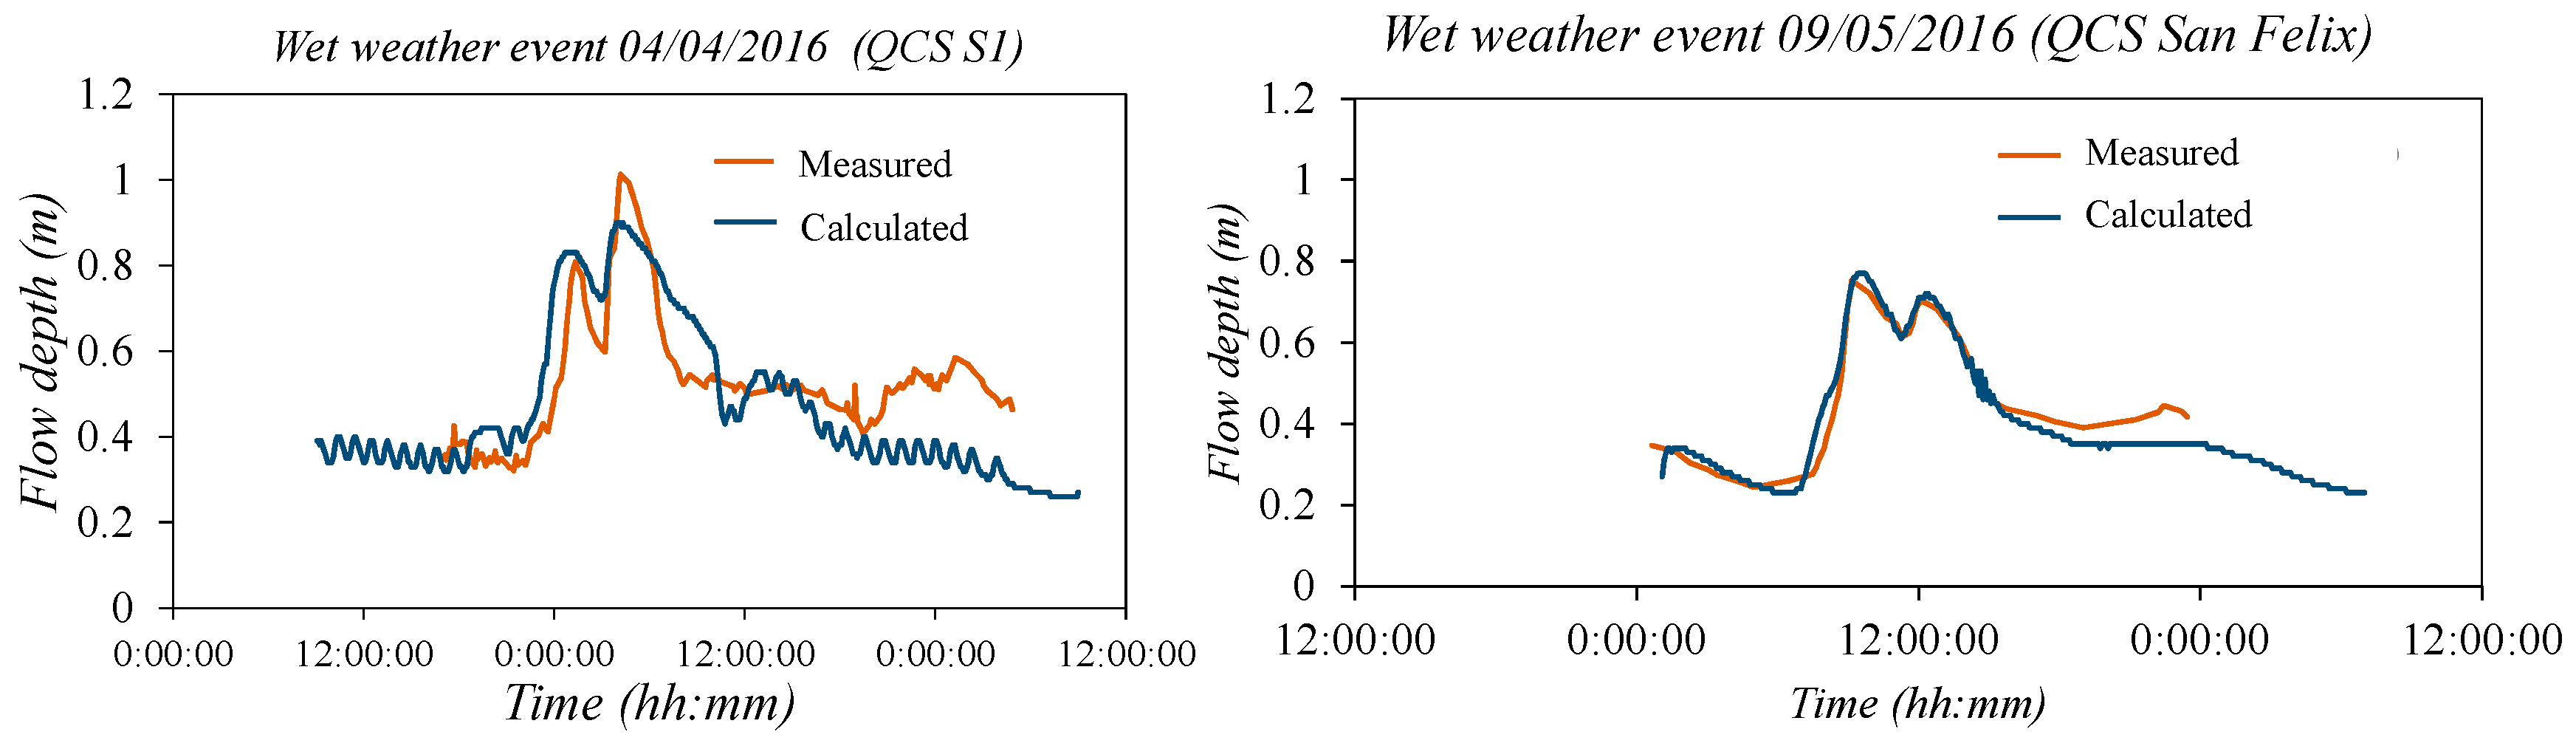
The hydrographs and turbidity-pollutographs of some of the measured rainfall events are presented in Figure 5. The pollutograph peak does not always precede the hydrograph one, as can be observed in Table 5 and Figure 5 for San Felix Catchment.
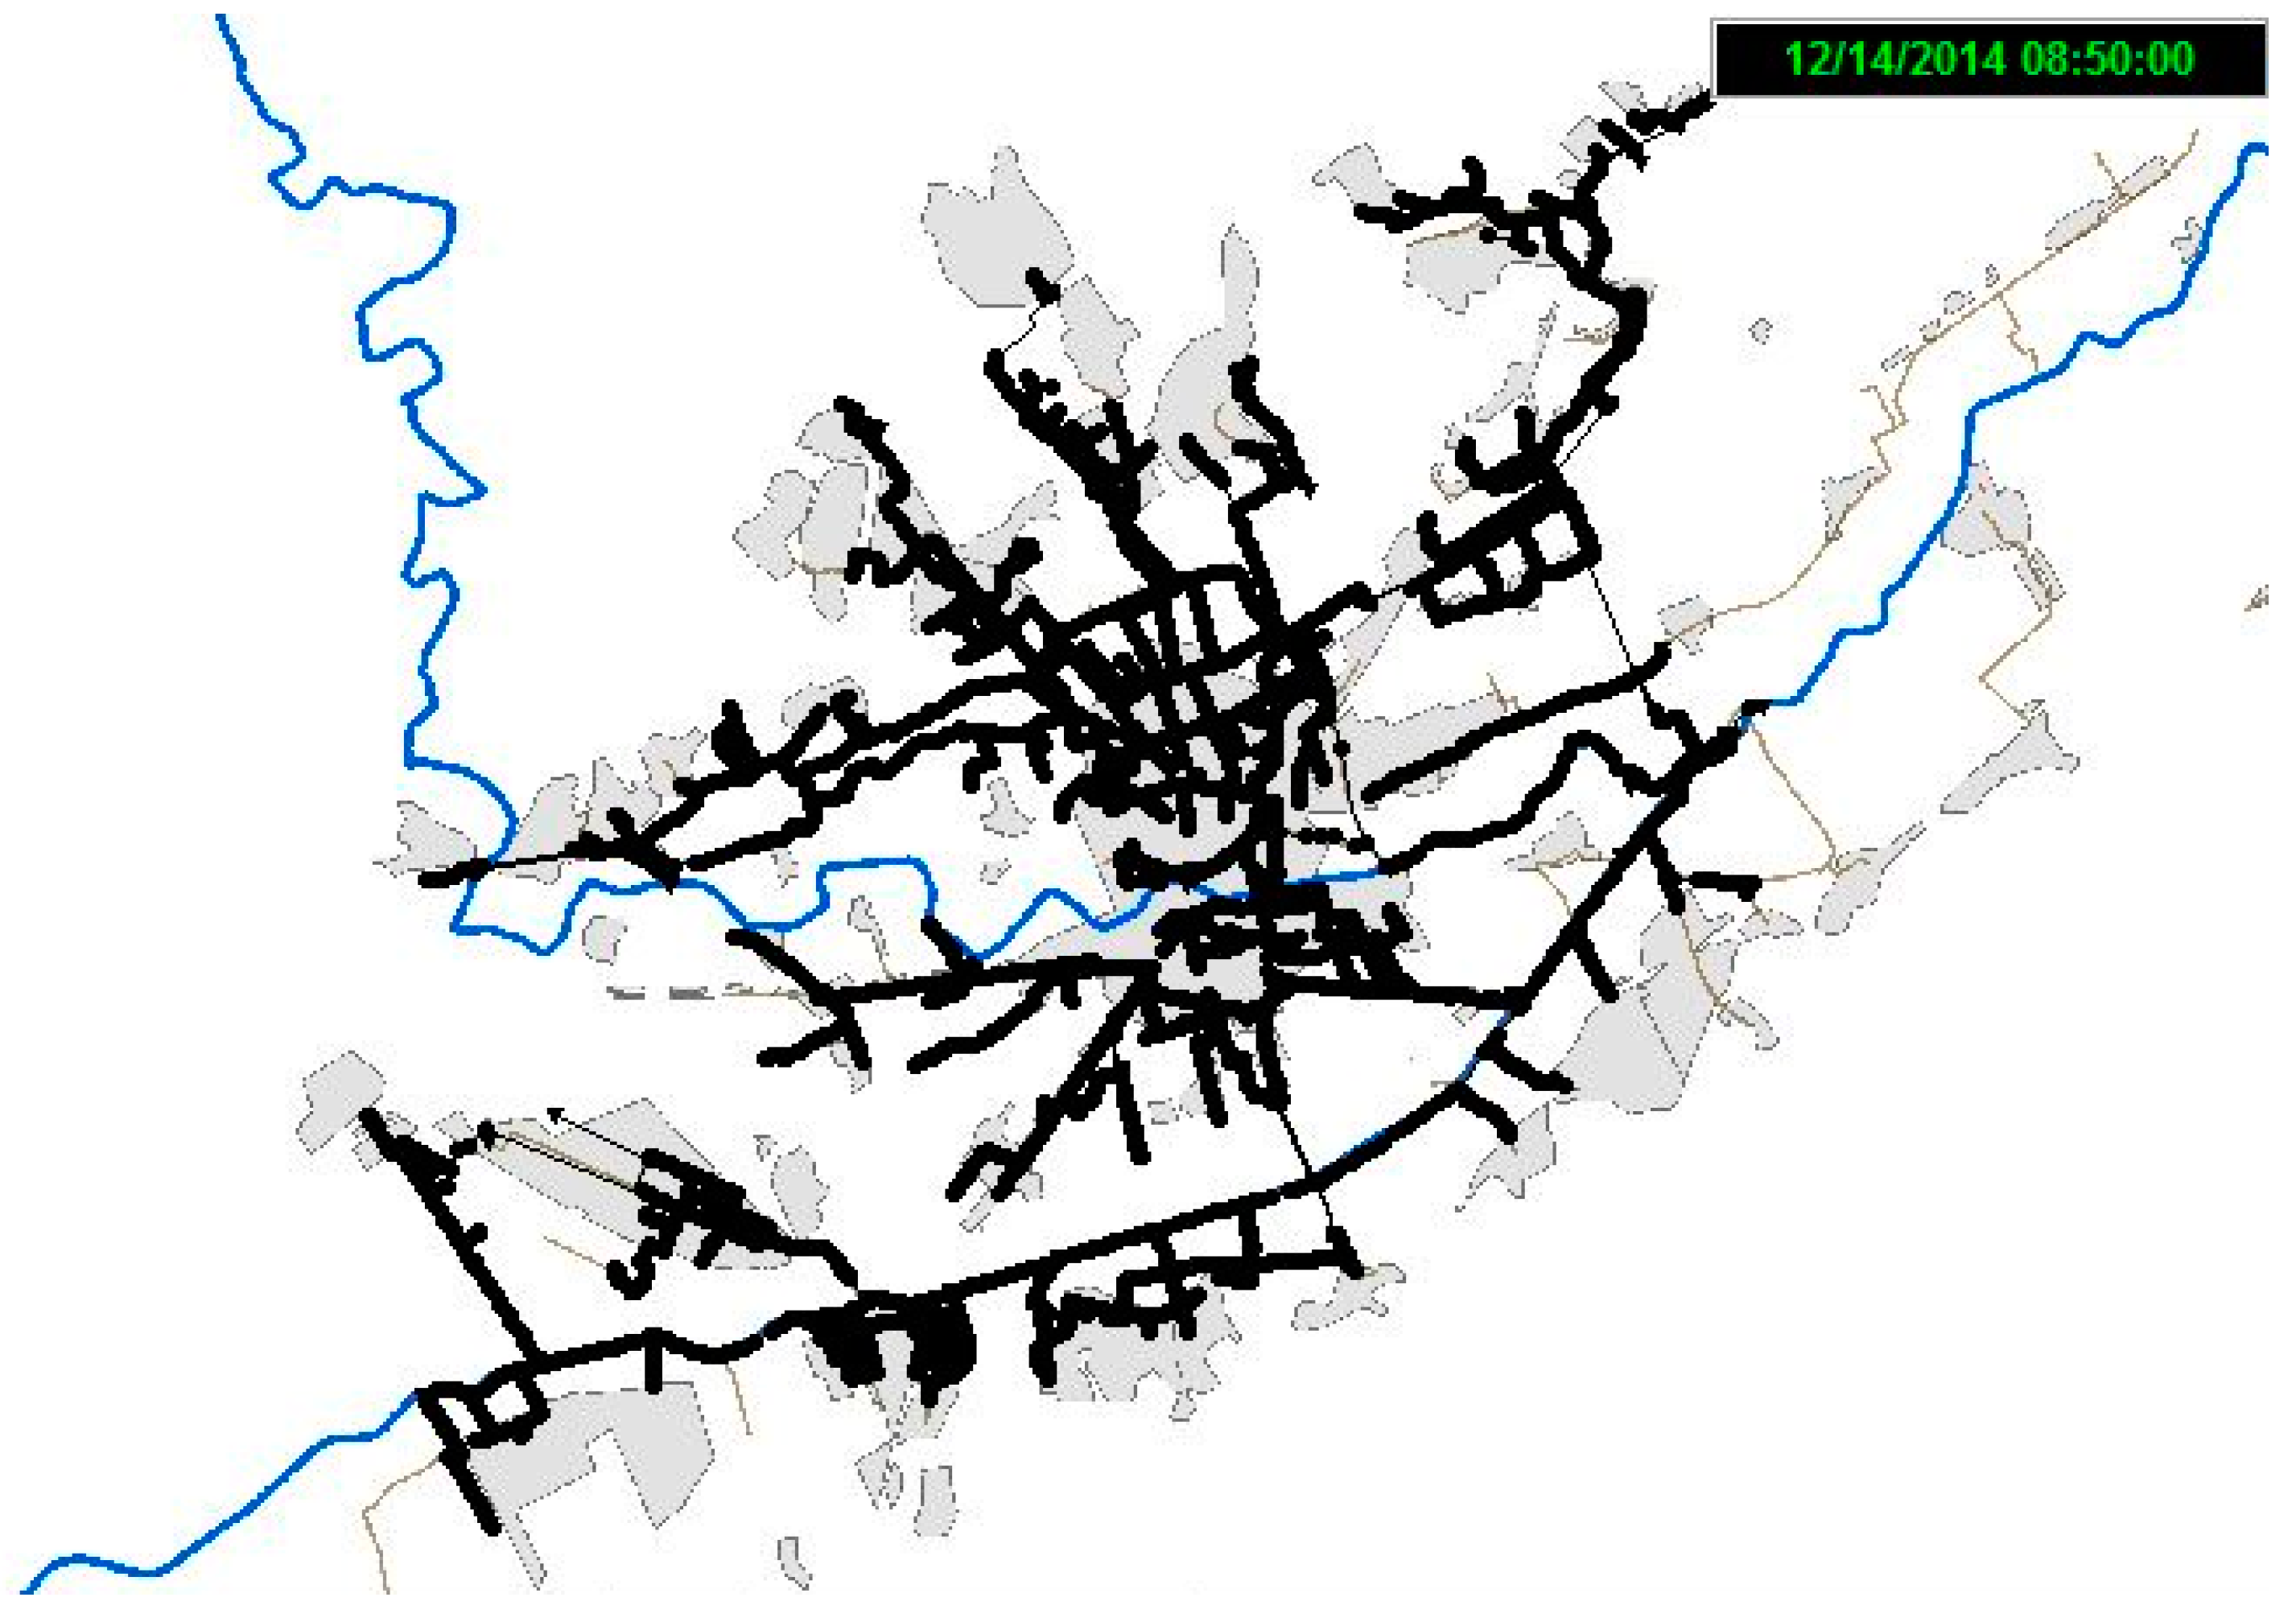
The calibrated hydraulic model in SWMM has been used to obtain the hydrographs presented in Figure 5.

3.2. Predictor Variables Correlations

With the objective of adjusting a statistical model, the correlation between predictor variables has been traced. The chosen predictor variables are DWP, Qmax, TPH, PTOTAL, Imax10, CMAXtb, and TPP. The correlation matrix is presented in Table 7 and Table 8 for S1 and San Felix catchments, respectively. The Pearson’s correlation coefficient has been applied to the sample of each pair of variables. From the matrices, correlation between the time to pollutograph peak, TPP, and the time to hydrograph peak, TPH, is observed with values of R2 = 0.79 and 0.94 for S1 and San Felix, respectively. The dry period preceding the episode, DWP, and the maximum concentration of turbidity, CMAXtb, show good relation, especially in the S1 Catchment with R2 = 0.68. There is also certain relationship between the maximum concentration of turbidity, CMAXtb, with the total precipitation and the maximum flow in the San Felix Catchment.

3.3. Pollution Prediction Indexes. Statistical Model

From the previous section, the correlation between predictor variables individually analyzed is considered not significant enough to be used as a prediction tool of the pollution in a rainfall event. For this reason, multivariate indexes are proposed. The aim is to predict, on the one hand, the maximum concentration of turbidity during each event, CMAXtb, and, on the other hand, the time elapsed from the beginning of the event until the maximum peak of the pollutograph, TPP. To achieve this, two indexes of prediction are adjusted: the time to peak of the pollutograph index, ITPP, and the maximum concentration index, ICMAX.

3.3.1. Time to the Peak of Pollutograph Index, ITPP

The index time to the peak of the pollutograph will be used to predict the time that elapses from the beginning of the episode until the maximum value of turbidity in the event is reached, TPP. It can be defined with dimensionless factors:
I T P P = ( T P H T C ) 0.13 ( P T O T A L P T O T A L _ A N N U A L ) 0.02
where PTOTAL_ANNUAL is the total precipitation expected in a year, adopting 350 mm for this region. In Equation (4), the time to the peak of the hydrograph, TPH, is considered. Its significant relation with TPP is shown in the correlation matrices (Table 7 and Table 8).
The first term of Equation (4), TPH/Tc, reflects the time of the catchment to respond as a function of: (i) how the rain is distributed proportionally to TPH; and (ii) the shape of the catchment inversely proportional to Tc. The second term, PTOTAL/PTOTAL_ANNUAL, magnitude of the rainfall, is also proportional to the time to the peak of the pollutograph. In this Equation, the term PTOTAL/PTOTAL_ANNUAL has lower influence on the index than TPH/Tc. However, its inclusion improves the adjustment from R2 = 0.87 to R2 = 0.96. 
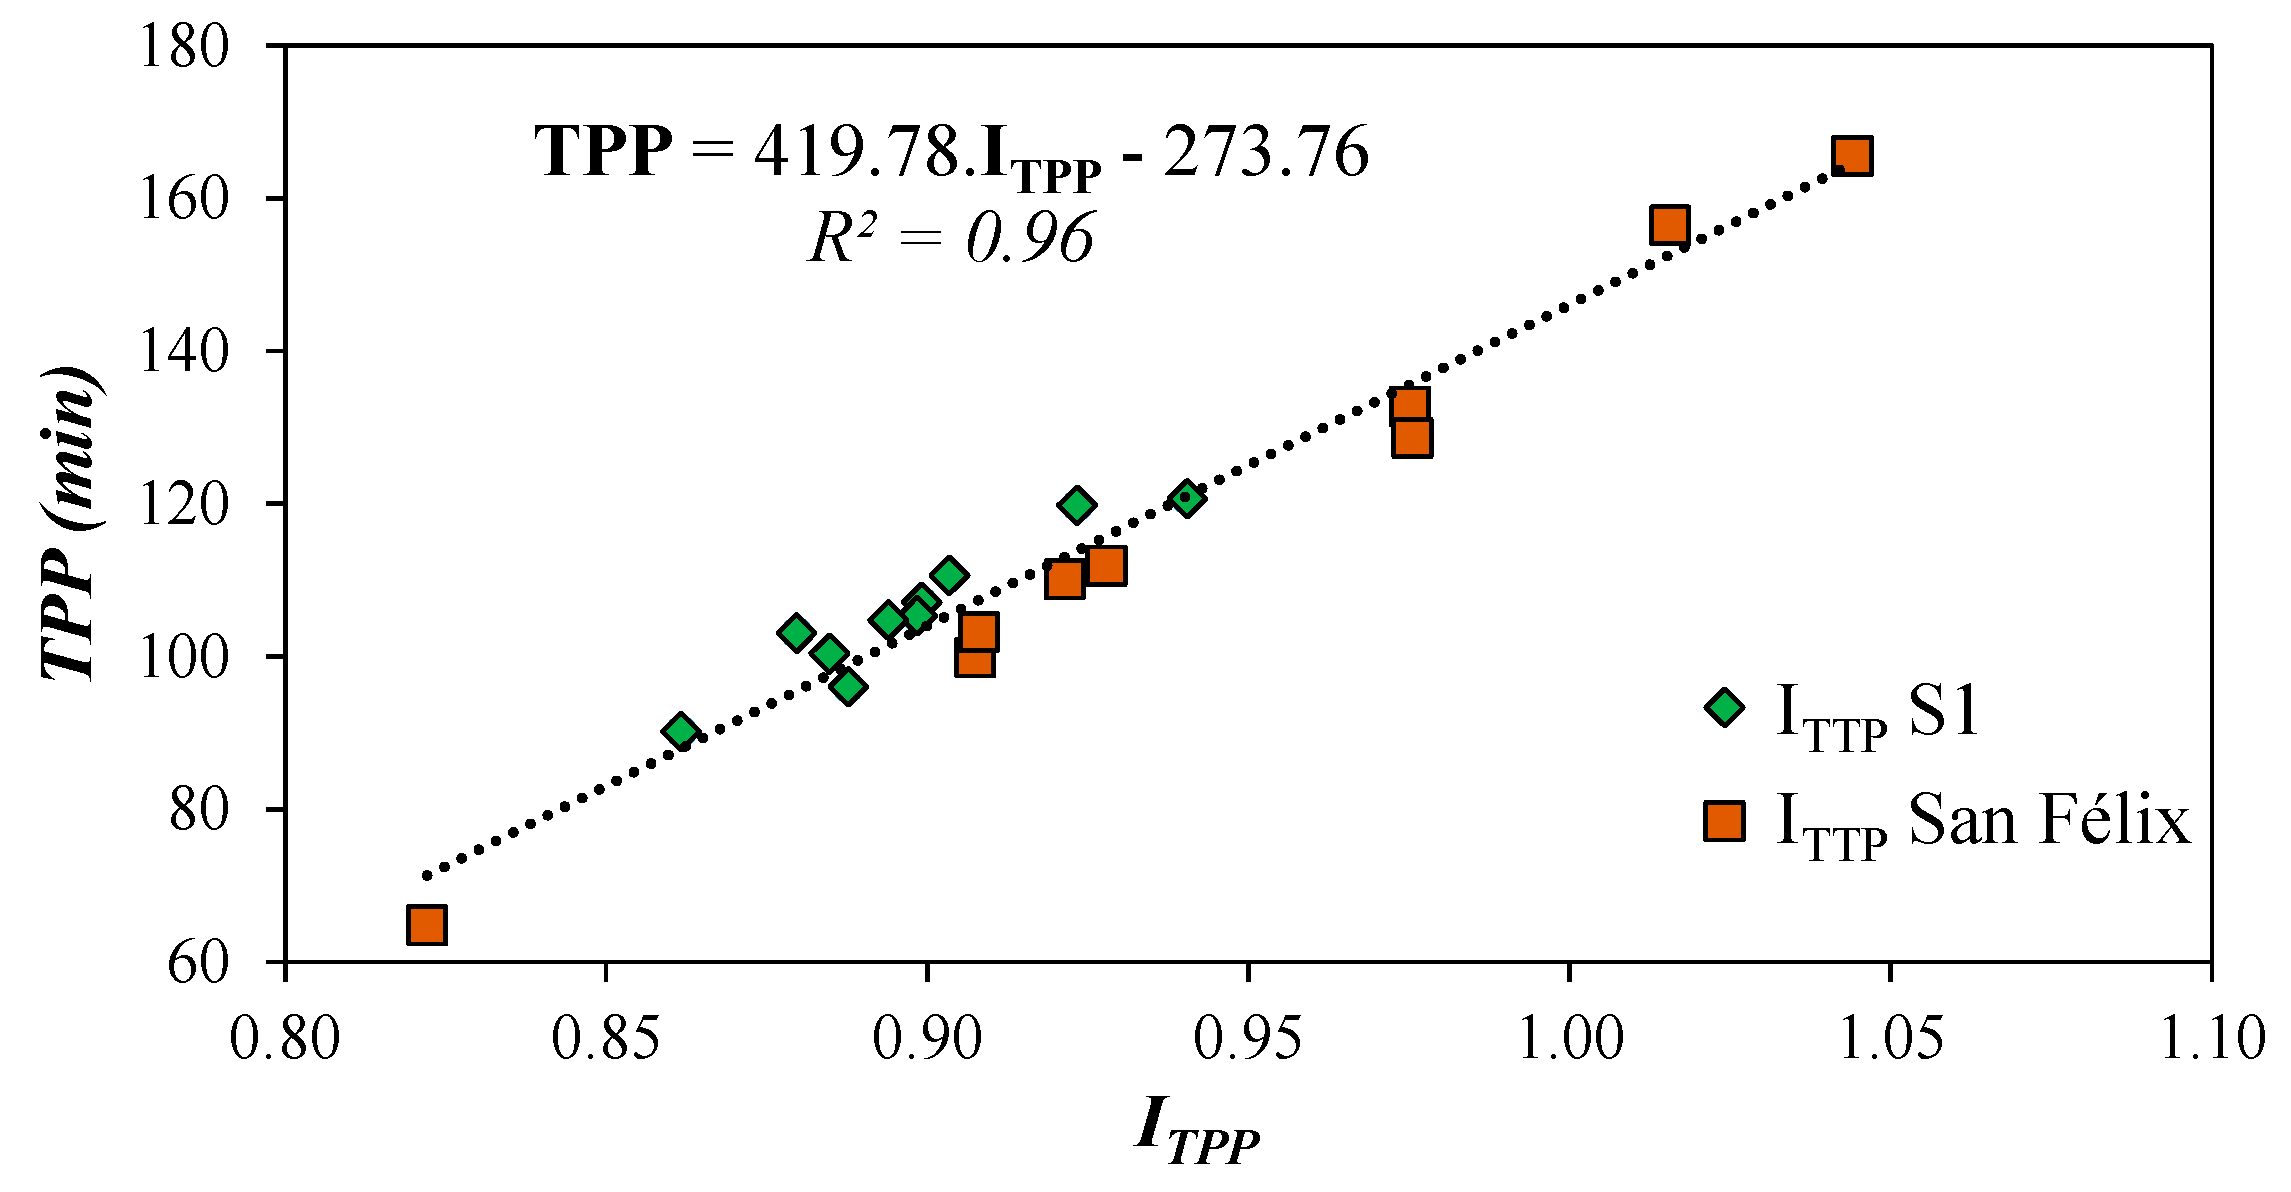
Figure 6 shows the linear relationship between the pollutograph time to the peak index, defined in previous equation, and the time to the peak of pollutograph.
In Figure 6, a linear regression that relates the time index to the peak of the pollutograph and the time to the peak, expressed in minutes, can be obtained as:
T P P = 419.78 I T P P 273.76

3.3.2. Maximum Concentration Index, ICMAX

The maximum concentration index ICMAX arises with the objective of estimating the maximum concentration of turbidity, CMAXtb, from predictor variables quantified in rainfall events. Together with the ITPP, they allow estimating both the magnitude of the pollutograph and the location in time of the higher turbidity. The equation for ICMAX is defined as
I C M A X = ( P T O T A L P T O T A L _ A N N U A L S ) 0.3 ( D W R ) 0.3 F s h a p e
where DWR is the proportion of consecutive dry weather days previous to the event in the last month. Equation (6) is dimensionless and can be divided into three main terms. The first term is related to the power of the event, where an increase in the total rainfall causes a greater sediment wash. Assuming the rest of parameters fixed, a higher maximum concentration will occur in the catchment with a higher average slope. The second term reflects that during the time without precipitation there is sedimentation and accumulation of deposits along the network that can be washed away during storm events. Finally, the third term is a shape factor of the catchment. It is a catchment geometric parameter defined according to
F s h a p e = 10 A L 2
where A is the area of the catchment (km2) and L is the catchment flow length (km).
Table 9 summarizes the shape factor obtained in both catchments analyzed.
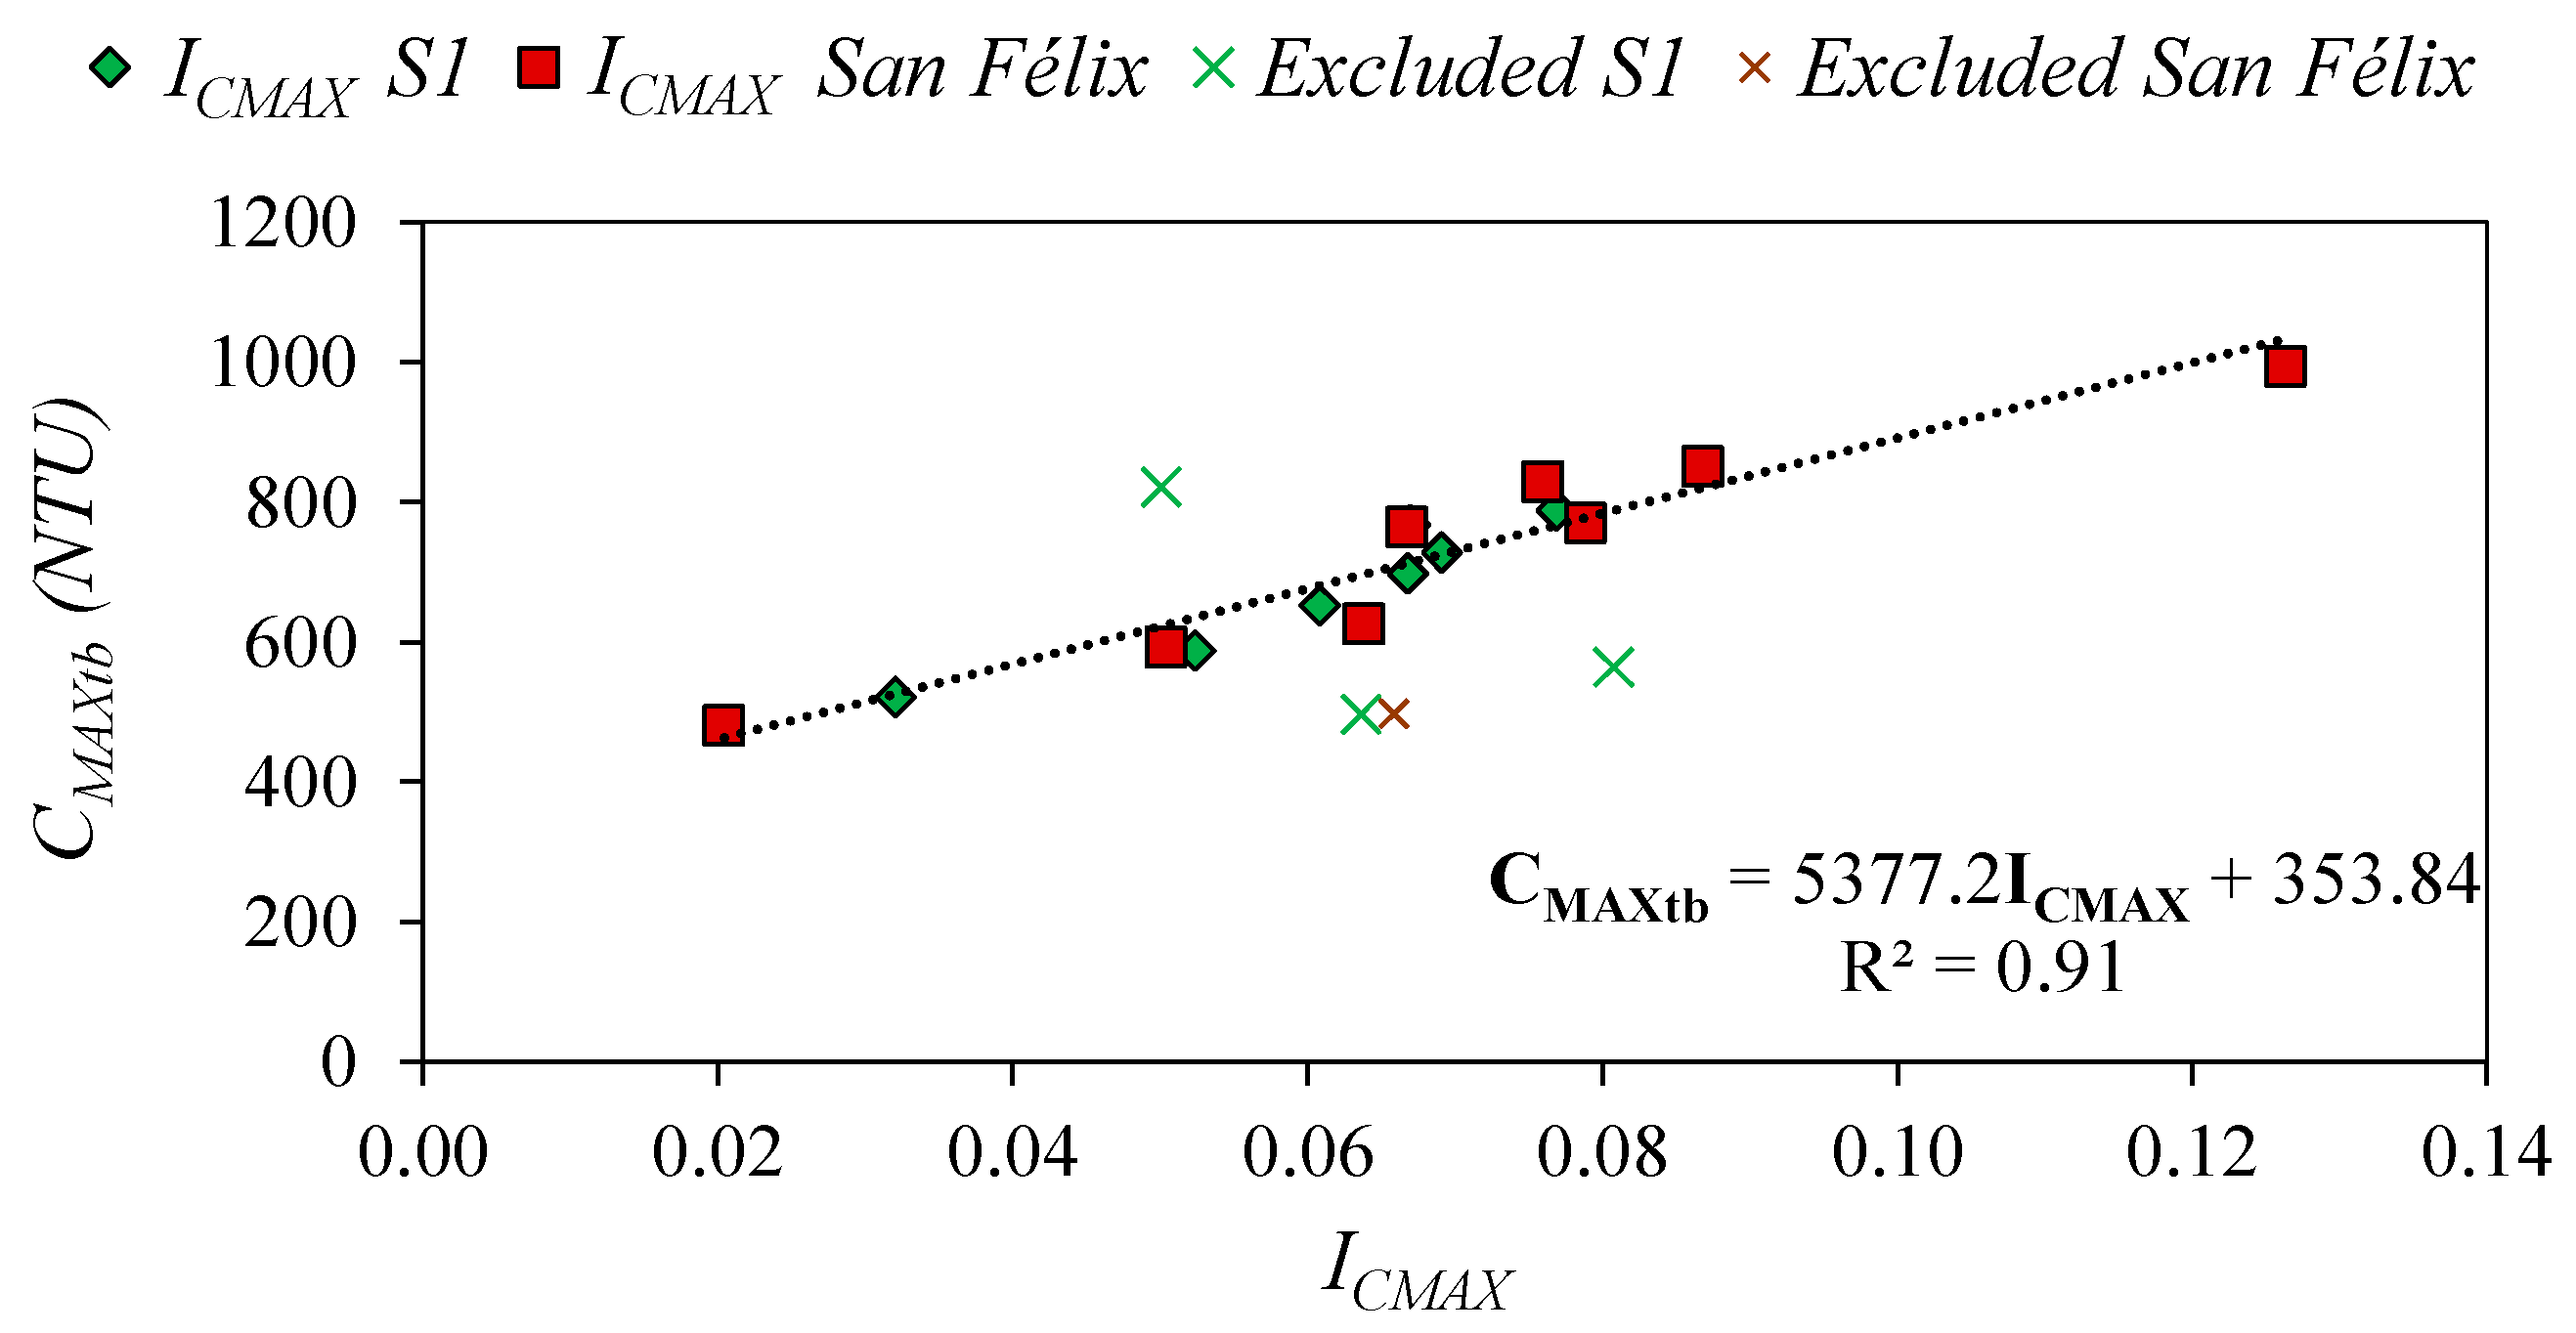
Figure 7 presents the values of ICMAX, calculated by Equation (6) for each rainfall event, and the maximum of measured turbidity in each event, CMAXtb. Most values fit around a line except four cases:
(i)
S1_4: It is an episode with very low precipitation (3 mm). Thus, although the previous dry period is very extensive (24 days), the prediction index yields lower values of the maximum concentration.
(ii)
S1_9 and S1_10: The measured maximum concentration values are below the trend followed by the other data. The possible reason of this phenomenon seems to be related with the energy of both events. The rains on these two days are characterized by an average intensity of low precipitation (less than 1 mm/h), so that the catchment and the network were slowly washed.
(iii)
SF_8: It is similar to episode S1_4. The precipitation is very low (2.3 mm).
Those reasons justify discarding the four cases. The relationship between CMAXtb and ICMAX fit to a line with a correlation coefficient of R2 = 0.91.
The fitted line of the adjustment between the maximum concentration index, ICMAX, and the maximum concentration of turbidity, CMAXtb, is given by a linear regression
C M A X t b = 5377.2 I C M A X + 353.84
Table 1 summarizes the parameters presented in the literature to predict pollution. This manuscript proposes a new model to estimate CMAXtb. Moreover, proposed methodology also allows estimating TPP from hydraulic and hydrological parameters.

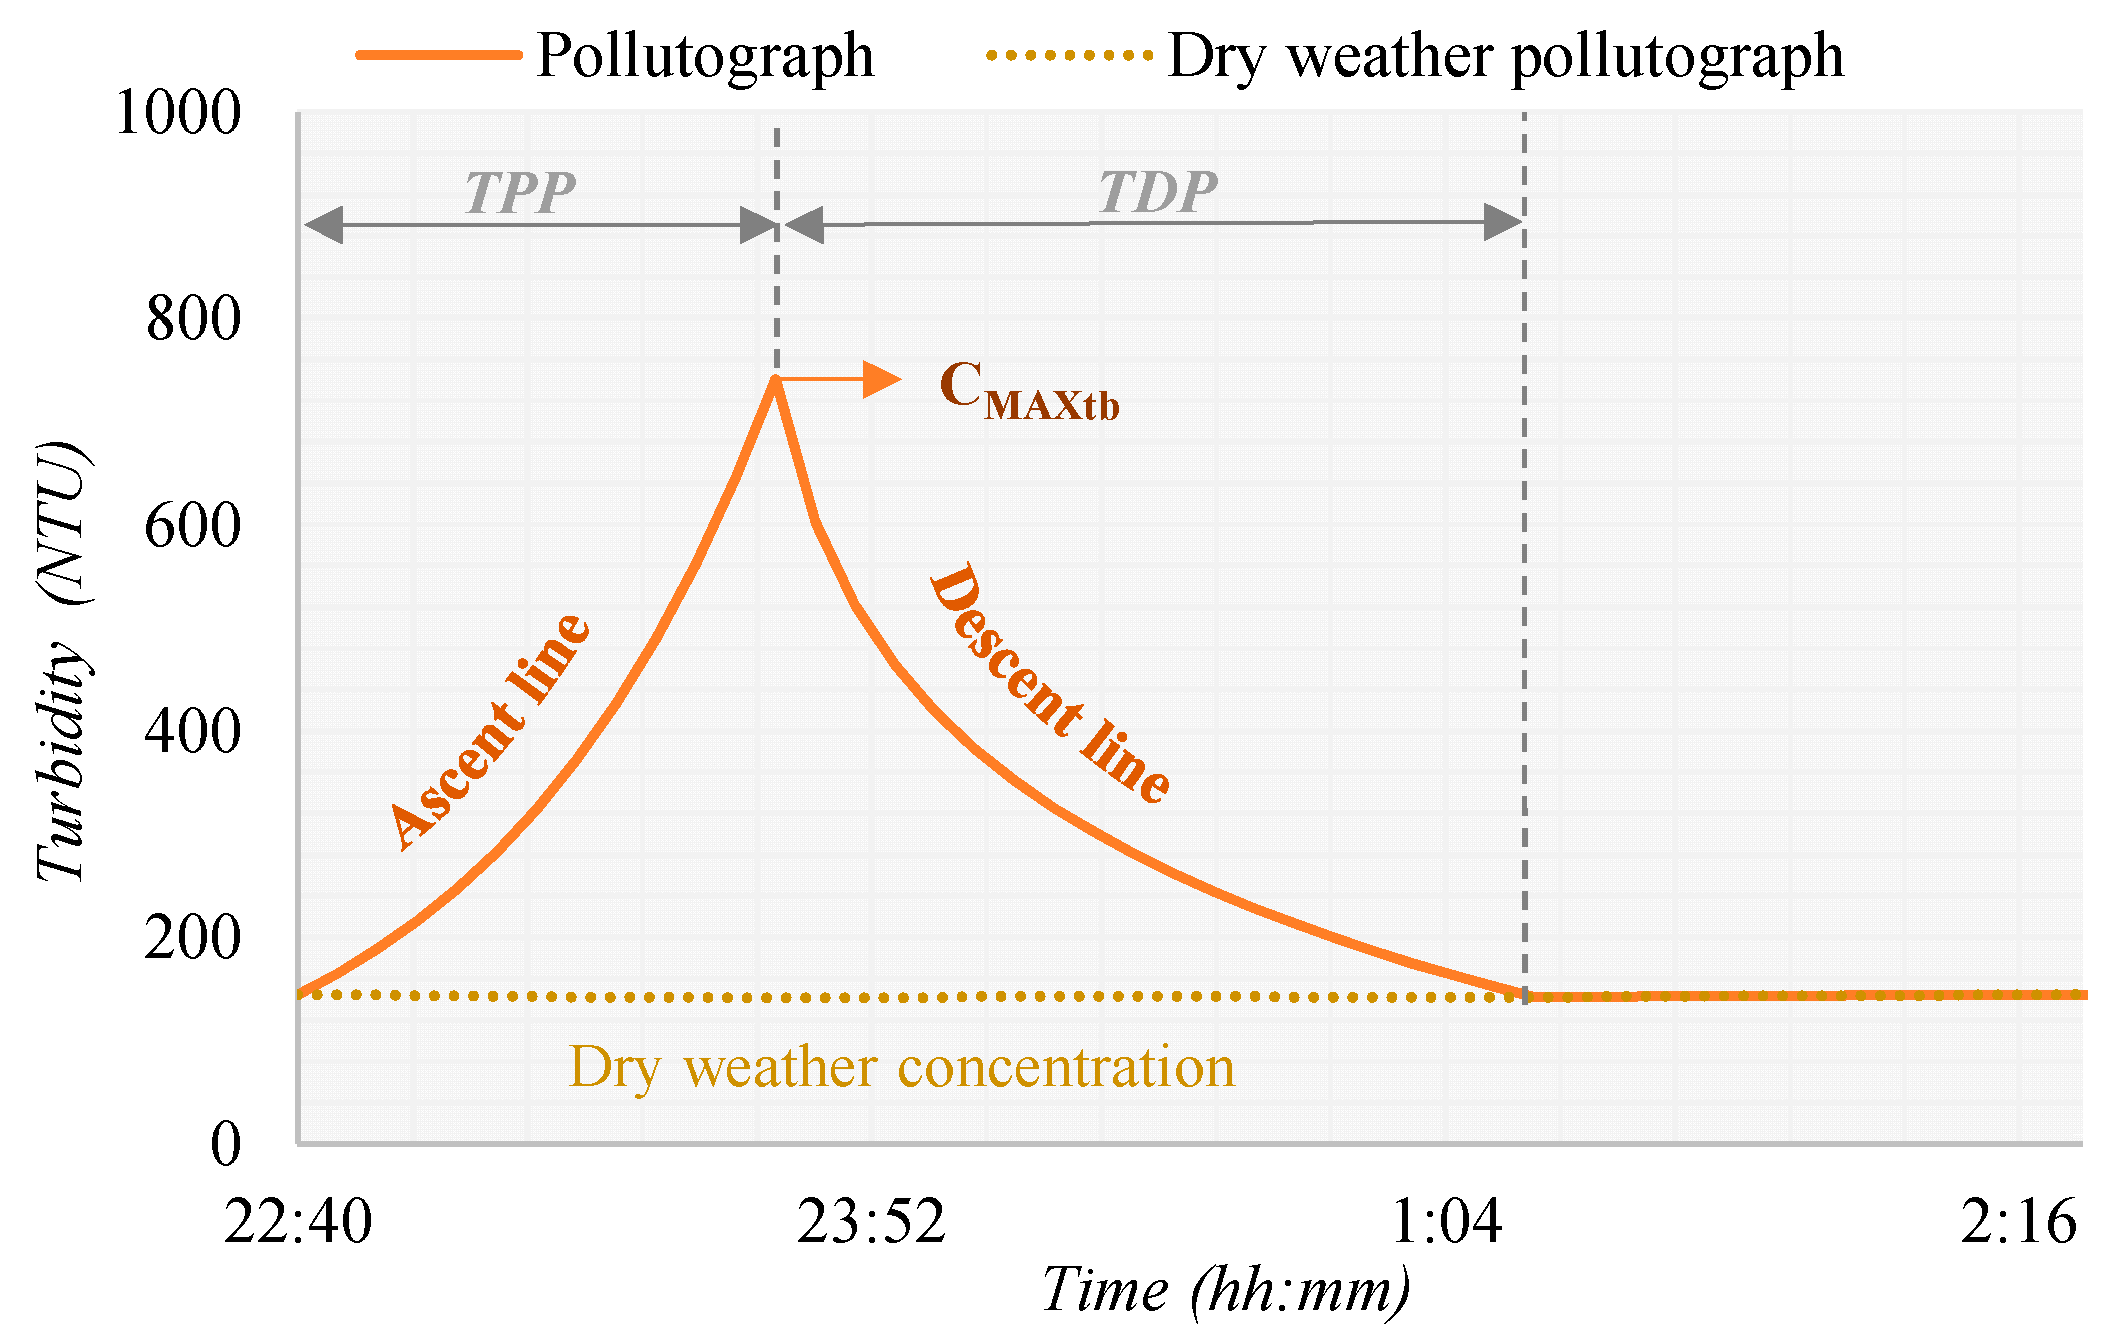
3.4. Development of Pollutographs from Prediction Indexes

Pollutograph is the representation of the concentration of a certain pollutant over time. The analysis of the ensemble formed by the hydrograph, the rainfall and the pollutograph of a given event can provide very important information about the mass mobilization of contaminants in an episode. For this reason, the knowledge of this graph is essential for the tasks of pollution management. Figure 8 presents a standard pollutograph.
The line of ascent can be adjusted to the following exponential equation
C a = a b x = C 0 [ ( C M A X t b C 0 ) 1 N a ] n
where Na is the number of intervals of 5 min in which the ascent time is divided; n indicates the interval (0 ≤ nNa) in units of five minutes; and Ca and C0 are the turbidity values at each interval n and at the beginning of the pollutograph, respectively (measured in NTU). The value of C0 is assumed as the dry weather value at the beginning of the episode.
Once CMAXtb and TPP have been calculated from prediction indexes, the time to the descent of pollutograph, TDP, can be defined as the time interval between the instant of the maximum concentration and the time when the concentration reaches dry weather values. The time to the descent of pollutograph value has been adjusted for each of the catchments showing a linear relationship with pollutograph time to the peak. The adjustment of TDP for each catchment is given by
S 1 T D P = 3.5 T P P 125 S a n   F e l i x T D P = 4.24 T P P 40
where TPP and TDP, in this equation, are expressed in minutes.
Differences between measured and calculated TDP at the studied events present average relative errors below 13% for the S1 catchment and 14% for the San Félix catchment.
The descent line of the pollutographs can be adjusted to a logarithmic function:
C d = a ln ( x ) + b = ( C T S t b C M A X t b ln ( N d N a + 1 ) ) ln ( n N a + 1 ) + C M A X t b
where Nd is the number of intervals of five minutes in which the descent time is divided; n indicates the interval (NanNd) in units of five minutes; and Cd and CTStb are the turbidity values at each n interval and at the end of the event, corresponding to TDP time, respectively (measured in NTU). Equation (11), when n = Na, ln(nNa + 1) = 0, and Ca = Cd = CMAXtb, assures continuity.
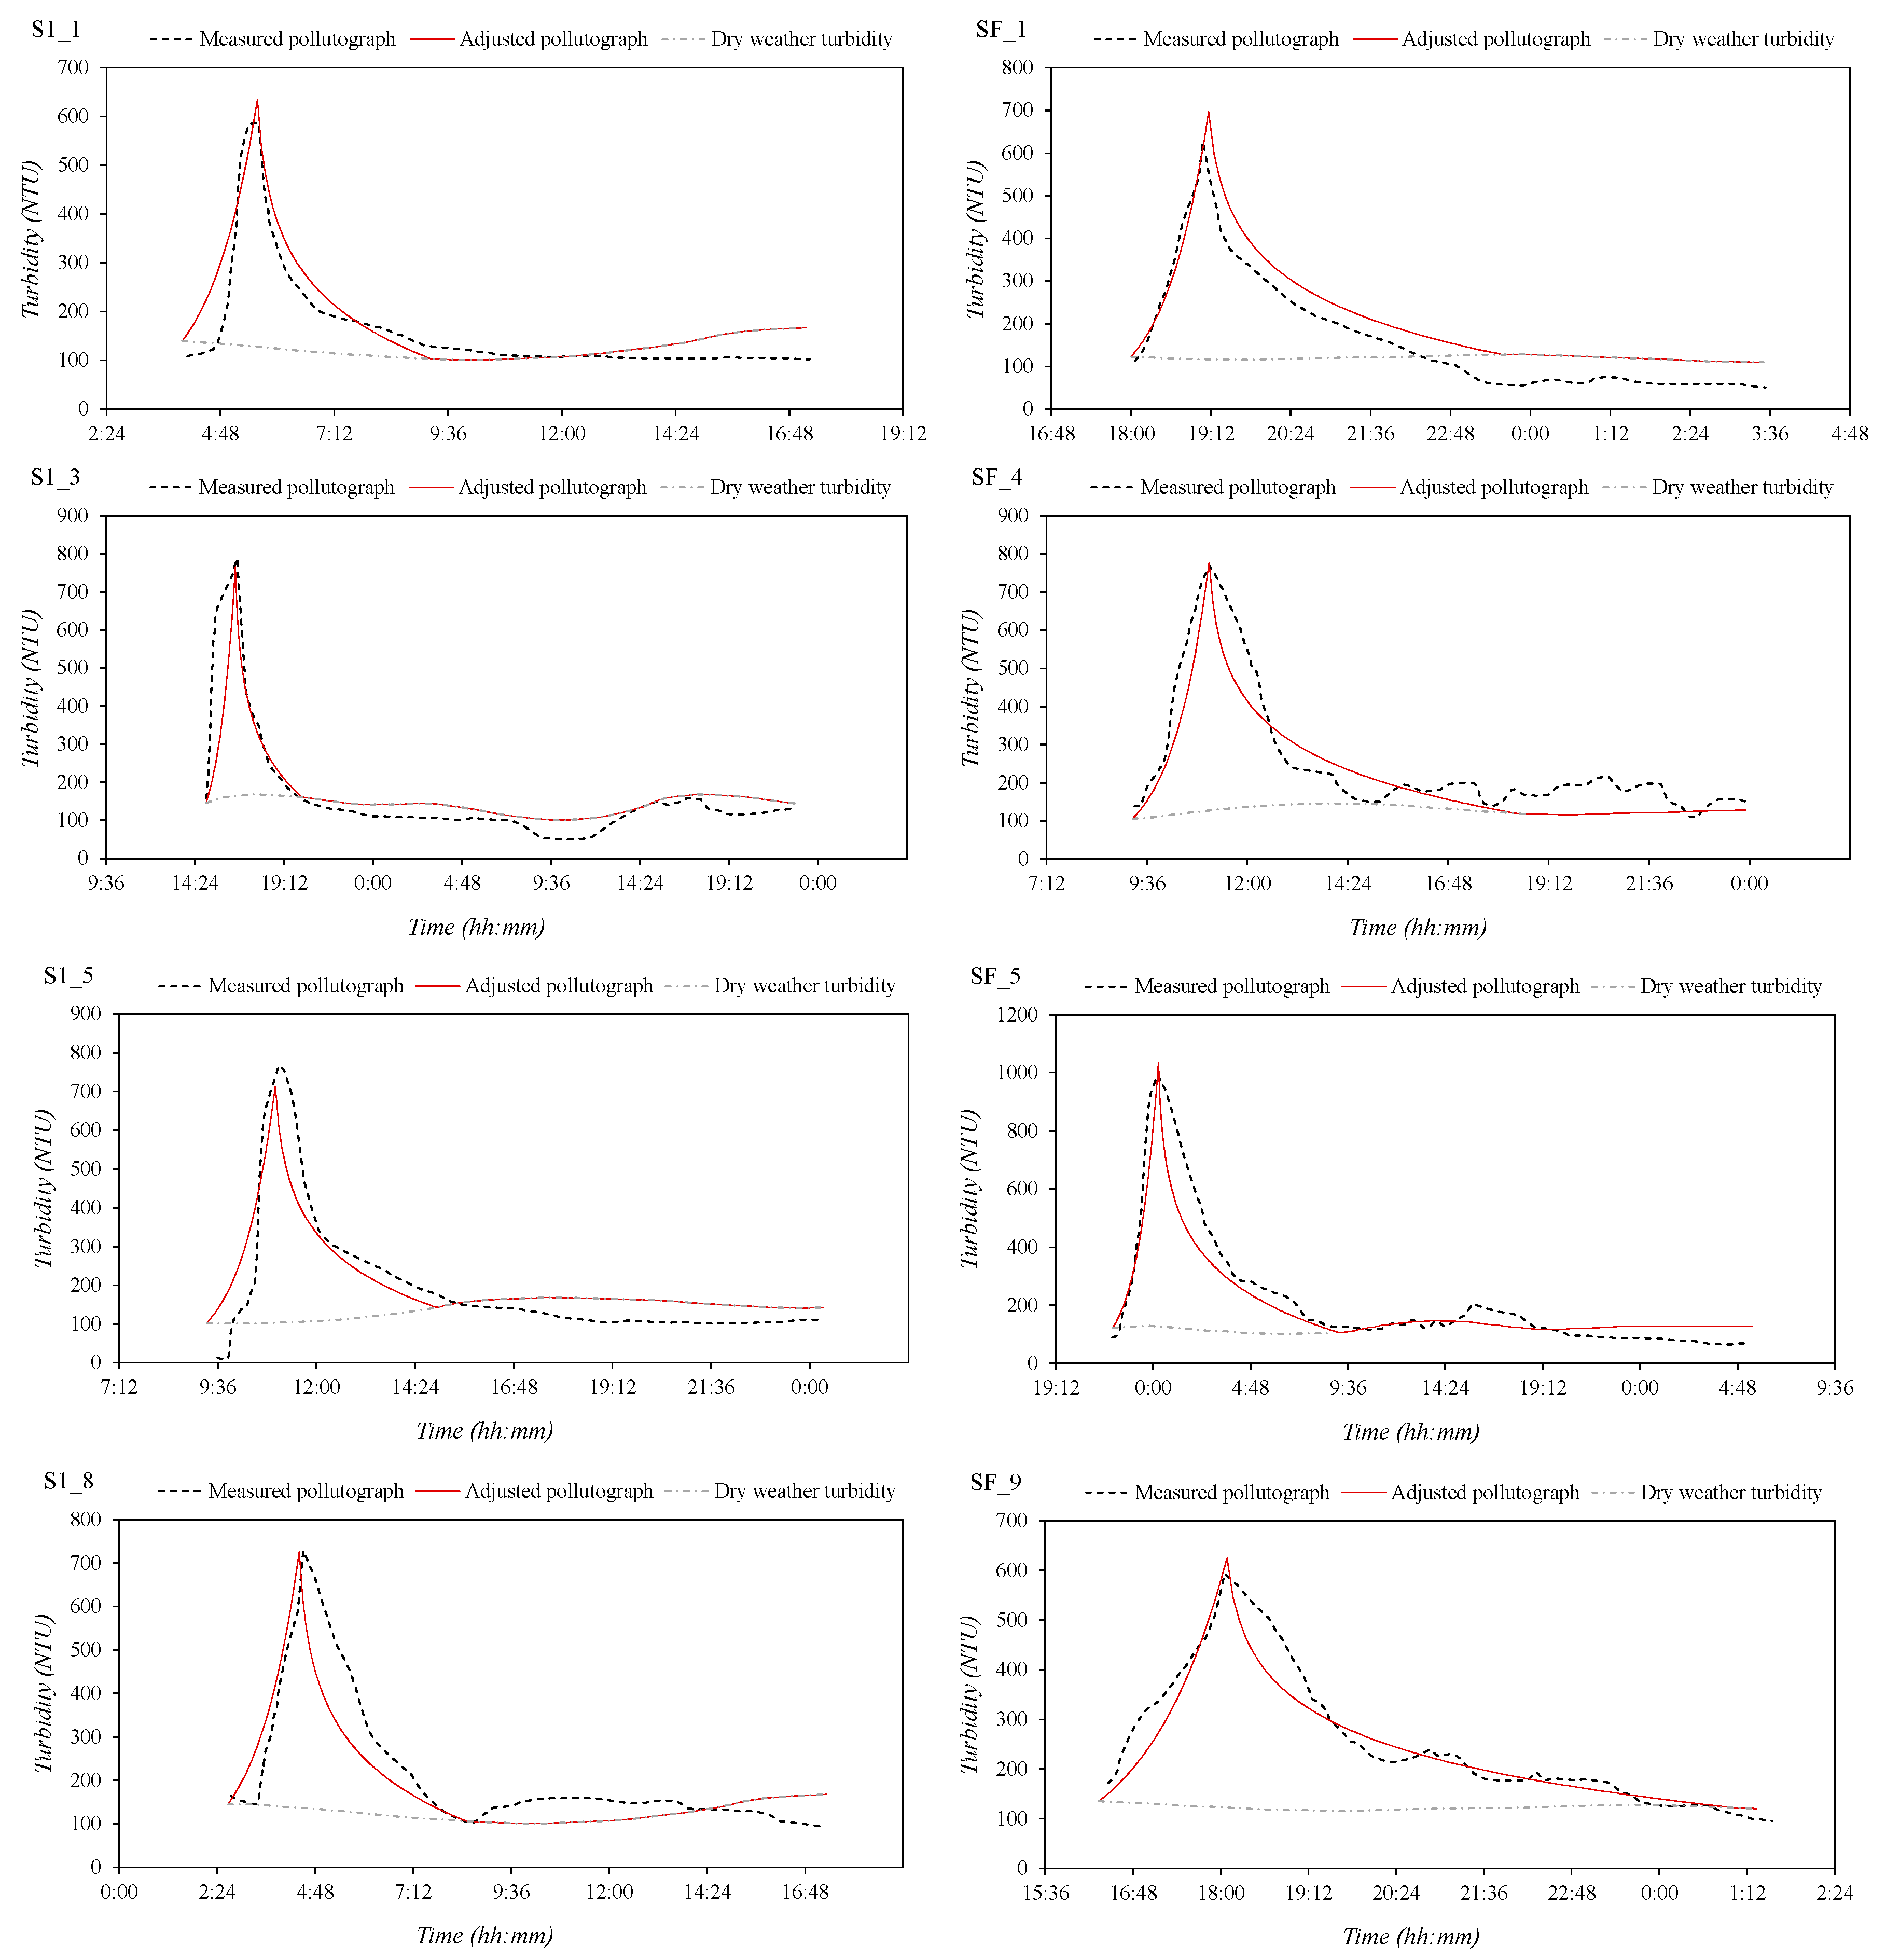
Figure 9 shows some of the measured pollutographs. They are compared with the pollutographs obtained by Equations (9)–(11). Results show a good agreement between measured and calculated pollutographs; therefore, the proposed methodology is suitable for estimating pollutographs from indexes.
Several multi-peaked hydrographs have been registered, however none of them led to a multi-peak pollutograph (see case S1_3 and San Felix _5 in Figure 5). Actually, the flushing produced by the first hydrograph peak leads to the removal of a second peak in the pollutograph. Present methodology also covers multi-peak hydrographs with unique pollutograph peak, according to observed events.

4. Conclusions

Time-continuous measurements of rainfall, in-sewer turbidity and water flow depth have been registered for almost two years. From the measurements, quality and hydraulic rainfall-event variables have been defined (Table 5 and Table 6).
In this paper, turbidity has been chosen as a pollutant indicator as other authors have pointed out it can be used in order to estimate different water quality parameters, e.g., TSS or COD, through on-site linear regressions.
The correlation between variables has been studied (Table 7 and Table 8). High correlations have been found between some of the analyzed variables, such as between the time to the peak of hydrograph, TPH, and the time to peak of pollutograph, TPP.
To improve those correlations, two prediction indexes have been suggested: the pollutograph time to the peak index, ITPP, presented in Equation (4), and the maximum concentration index, ICMAX, shown in Equation (6).
From the above prediction indexes, a statistical model has been proposed. This model allows estimating the time to peak of the pollutographs, TPP, presented in Equation (5), and the maximum values of turbidity, CMAXtb, as seen in Equation (8).
The statistic model proposed has a high correlation for catchments S1 and San Felix in the city of Murcia. This model constitutes a useful tool for providing knowledge about pollutants transport in the combined sewer overflow in the city of Murcia. In fact, it can help, as an advisory tool, to support the design of CSO tanks or to forecast pollution risks for use within a CSO management strategy.
An application of the proposed model is the definition of pollutographs. In Figure 8, a standard pollutograph is shown. Pollutograph is modeled through the former index variables together with the pollutographs time to descent, TDP, proposed in Equation (10). Ascent and descent curves are proposed in Equations (9) and (11). Pollutographs estimated through this methodology agree reasonably well with the measured ones during the registered events (Figure 9). In this way, from a rainfall forecast, PTOTAL, and other variables such as the dry weather period, DWP, and the time to peak of the hydrograph, pollutographs can be simulated for multiple prognosis scenarios. Thus, the methodology provides information of the pollution during wet weather in combined sewer systems.
Although this study is specific for these catchments, it may be used as a starting point for other catchments to establish effective policies for combined sewer overflow control. Moreover, the authors consider that extending the pollutographs to other catchments could lead to standardize the coefficients so that a “design pollutograph” can be defined and used as a reference for other studies.

Acknowledgments

The authors are grateful for the financial support received from Empresa Municipal de Aguas y Saneamiento de Murcia, S.A. through project: “Estudio de flujos de contaminación transportados por un sistema de saneamiento y drenaje unitario en tiempo de lluvia para la ciudad de Murcia” ref-C-74/2016.

Author Contributions

Pedro D. Martinez-Solano and Simón Nevado-Santos built and calibrated the hydraulic model, supervised and calibrated the field instrumentation and arranged information from rainfall events. Juan Tomás García, Pablo Espín-Leal, Antonio Vigueras-Rodríguez, Luis G. Castillo and José M. Carrillo processed field information, undertook the statistical treatment and established the methodology to achieve the pollutographs. All authors contributed equally to the manuscript revision.

Conflicts of Interest

The authors declare no conflict of interest.

Notation

ACatchment area (ha)
CMAXSSMaximum concentration for suspended solids (mg/L)
CMAXtbMaximum concentration for turbidity (NTU)
CSMSSSpecific mobilized volume of suspended solids (kg/ha)
Ca, Cd, C0, CTStbTurbidity at the ascent, descent, beginning and end part of pollutographs, respectively (NTU)
DrainRainfall duration (h)
Drunoff (h)Runoff duration (h)
DWPDry weather period (days)
DWRProportion of consecutive dry weather days previous to the event in the last month
EMCMean event concentration (mg/L)
EMCtbMean event concentration of turbidity (NTU)
EVEvent runoff volume (m3)
ICMAXPollution prediction index associated to the maximum concentration of turbidity (-)
ImaxMaximum rainfall intensity (mm/h)
Imax10Maximum 10 minutes rainfall intensity (mm/h)
ImeanMean rainfall intensity (mm/h)
ITTPPollution prediction index associated to the time to the peak of pollutograph (-)
LCatchment flow length (km)
Na, NdNumber of intervals of five minutes in which the pollutograph is divided, applied to ascent and descent part respectively (-)
PTOTALTotal event rainfall (mm)
PTOTAL_ANNUALTotal precipitation expected in a year, adopting 350 mm for this region
QmaxMaximum event inflow (m3/s)
QmeanMean event inflow (m3/s)
QmaxdwMaximum dry weather inflow (m3/s)
QCSQuality Control Station, place where monitoring instrumentation is located
RDRain depth (mm)
SMean slope of the catchment (m/m)
TcTime of concentration of urban catchment (h)
Tc_ruralTime of concentration of rural catchment (h)
TDPDescent time of the pollutograph (h)
TPHPeak time of hydrograph (h)
TPPTime to the peak of pollutograph (h)
TSSTotal suspended solids (mg/L)
TSSTECumulative suspended solids per event (kg/event)
TSSffTotal pollutant load in the first flush (kg/event)
M(V)Cumulative load and runoff ratios
ΜRatio of impervious area with total area (-)

References

  1. Rakedjian, B. Storm Water Overflows Challenges. In Proceedings of the 12th EWA Brussels Conference EU Water Policy and Sustainable Development, Brussels, Belgium, 8 November 2016. [Google Scholar]
  2. Ward, S.; Butler, D. Compliance with the Urban Waste Water Treatment Directive: European Union City Responses in Relation to Combined Sewer Overflow Discharges; University of Exeter: Exeter, UK, 2009. [Google Scholar]
  3. Puertas-Agudo, J.; Suárez-López, J.; Anta-Álvarez, J. Gestión de las Aguas Pluviales. Implicaciones en el Diseño de Sistemas de Saneamiento y Drenaje Urbano; CEDEX: Madrid, Spain; Ministerio de Fomento Información Administrativa: Madrid, Spain, 2008.
  4. Barro, J.R.; Comas, P.; Malgrat, P.; Sunyer, D. Manual Nacional de Recomendaciones Para el Diseño de Tanques de Tormentas; Universidade da Coruña: A Coruña, Spain, 2014. [Google Scholar]
  5. Butler, D.; Davies, J. Urban Drainage, 3rd ed.; CRC Press: Boca Raton, FL, USA, 2011. [Google Scholar]
  6. Lau, J.; Butler, D.; Schütze, M. Is combined sewer overflow spill frequency/volume a good indicator of receiving water quality impact? Urban Water 2002, 4, 181–189. [Google Scholar] [CrossRef]
  7. Del Río Cambeses, H. Estudio de los Flujos de Contaminación Movilizados en Tiempo de Lluvia y Estrategias de Gestión en un Sistema de Saneamiento y Drenaje unitario de una Cuenca Urbana Densa de la España Húmeda. Ph.D. Thesis, Universidade da Coruña, A Coruña, Spain, 2011. [Google Scholar]
  8. Di Modugno, M.; Gioia, A.; Gorgoglione, A.; Iacobellis, V.; la Forgia, G.; Piccinni, A.F.; Ranieri, E. Build-up/wash-off monitoring and assessment for sustainable management of first flush in an urban area. Sustainability 2015, 7, 5050–5070. [Google Scholar] [CrossRef]
  9. Bertrand-Krajewski, J.L. TSS concentration in sewers estimated from turbidity measurements by means of linear regression accounting for uncertainties in both variables. Water Sci. Technol. 2004, 50, 81–88. [Google Scholar] [PubMed]
  10. Métadier, M.; Bertrand-Krajewski, J.L. The use of long-term on-line turbidity measurements for the calculation of urban stormwater pollutant concentrations, loads, pollutographs and intra-event fluxes. Water Res. 2012, 46, 6836–6856. [Google Scholar] [CrossRef] [PubMed]
  11. Anta, J.; Cagiao, J.; Suárez, J.; Peña, E. Análisis de la movilización de sólidos en suspensión en una cuenca urbana separativa mediante la aplicación del muestreo en continuo de la turbidez. Ing. Agua 2009, 16, 189–200. [Google Scholar] [CrossRef]
  12. Bersinger, T.; Pigot, T.; Bareille, G.; Le Hecho, I. Continuous monitoring of turbidity and conductivity: A reliable, easy and economic tool for sanitation management. WIT Trans. Ecol. Environ. 2013, 171. [Google Scholar] [CrossRef]
  13. Hannouche, A.; Chebbo, G.; Ruban, G.; Tassin, B.; Lemaire, B. Relation between turbidity and total suspended solids concentration within a combined sewer system. Water Sci. Technol. 2011, 64, 2445–2452. [Google Scholar] [CrossRef] [PubMed]
  14. Lee, J.H.; Bang, K.W. Characterization of urban stormwater runoff. Water Res. 2000, 34, 1773–1780. [Google Scholar] [CrossRef]
  15. Francey, M. Characterising Urban Pollutant Loads. Ph.D. Thesis, Monash University, Clayton, VIC, Australia, 2010. [Google Scholar]
  16. Nazahiyah, R.; Yusop, Z.; Abustan, I. Stormwater quality and pollution loading from an urban residential catchment in Johor, Malaysia. Water Sci. Technol. 2007, 56, 1–9. [Google Scholar] [CrossRef] [PubMed]
  17. Suarez, J.; Puertas, J. Determination of COD, BOD, and suspended solids loads during combined sewer overflow (CSO) events in some combined catchments in Spain. Ecol. Eng. 2005, 24, 199–217. [Google Scholar] [CrossRef]
  18. Gupta, K.; Saul, A.J. Specific relations for the first flush load in combined sewer flows. Water Res. 1996, 30, 1244–1252. [Google Scholar] [CrossRef]
  19. LeBoutillier, D.W.; Kells, J.A.; Putz, G.J. Prediction of pollutant load in stormwater runoff from an urban residential area. Can. Water Resour. J. 2000, 25, 343–359. [Google Scholar] [CrossRef]
  20. Gromaire, M.C.; Garnaud, S.; Saad, M.; Chebbo, G. Contribution of different sources to the pollution of wet weather flows in combined sewers. Water Res. 2001, 35, 521–533. [Google Scholar] [CrossRef]
  21. Temprano, J.; Arango, Ó.; Cagiao, J.; Suárez, J.; Tejero, I. Stormwater quality calibration by SWMM: A case study in Northern Spain. Water SA 2005, 32, 55–63. [Google Scholar] [CrossRef]
  22. Rossman, L.A. Storm Water Management Model User’s Manual Version 5.0; EPA/600/R-05/040; U.S. Environmental Protection Agency, National Risk Management Research Laboratory—Office of Research and Development: Cincinnati, OH, USA, 2010. [Google Scholar]
  23. Willems, P. Quantification and relative comparison of different types of uncertainties in sewer water quality modeling. Water Res. 2008, 42, 3539–3551. [Google Scholar] [CrossRef] [PubMed]
  24. TÉMEZ, J.R. Cálculo Hidrometeorológico de Caudales Máximos en Pequeñas Cuencas Naturales; Dirección General de Carreteras: Madrid, Spain, 1978; p. 111.
  25. Gómez, M.; Sánchez, H.; Dolz, J.; López, R.; Nania, L.; Cabrera, E.; Espert, V.; García-Serra, J.; Malgrat, P.; Puertas, J. Curso de Hidrología Urbana; Flumen Research Institute, Universitat Politècnica de Catalunya: Barcelona, Spain, 2008. [Google Scholar]
Figure 1. Location of the study site.
Water 09 00303 g001
Figure 2. (a) Scheme of Quality Control Station devices; and (b) Image of QCS.
Water 09 00303 g002
Figure 3. View of the hydraulic model of Murcia in USEPA Storm Water Management Model (SWMM).
Water 09 00303 g003
Figure 4. Flow depth measured and calculated by the hydraulic model during wet weather at Quality Control Stations S1 and San Felix.
Water 09 00303 g004
Figure 5. Rainfall, hydrographs and turbidity-pollutograph of events: S1_1; S1_3; S1_5; S1_6; S1_8; San Felix_1; San_Felix_3; San Felix_5; San Felix_6; and San Felix_7.
Water 09 00303 g005aWater 09 00303 g005b
Figure 6. Linear adjustment of TPP with prediction index ITPP.
Water 09 00303 g006
Figure 7. Linear adjustment of CMAXtb with the prediction index ICMAX.
Water 09 00303 g007
Figure 8. Main parameters of a design pollutograph.
Water 09 00303 g008
Figure 9. Comparison between measured pollutographs and calculated ones through the suggested methodology.
Water 09 00303 g009
Table 1. Variables and adjusted parameters of TSS pollution load.
Variables and Adjusted ParametersGupta and Saul [18]LeBoutillier et al. [19]Gromaire et al. [20]Del Rio [7]
VariablesHydrologyImax (mm/h)XXX
Drain (h)XX X
DWP (day)XXX
RD (mm) XXX
Imax5 (mm/h) X
Tc (h) X
A (ha) X
HydraulicQmax (m3/s)X X
Qmean (m3/s) X
Qmaxdw (m3/s) X
TPH (h) X
TPP (h) X
Adjusted parametersTSSTE (kg/event) X
TSSff (kg/event)X X
CMAXSS (mg/L) X
CSMSS (kg/ha) X
Notes: Imax = maximum rainfall intensity; Drain = rainfall duration; DWP = dry weather period; RD = rain depth; Imax5 = maximum five-minute rainfall intensity; Tc = time of concentration of the catchment; A = catchment area; Qmax = maximum event inflow; Qmean = mean event inflow; Qmaxdw = maximum dry weather inflow; TPH = time to the peak of the hydrograph; TPP = time to the peak of the pollutograph; TSSTE = cumulative suspended solids per event; TSSff = total pollutant load in the first flush; CMAXSS = maximum suspended solids concentration; and CSMSS = specific mobilized volume of suspended solids.
Table 2. Catchments description.
CatchmentSan FélixS1
Area of catchment (km2), A14.8947.53
Population density (inh/km2)14,2502685
Ratio of imperviousness (m2/m2)0.470.21
Mean slope (m/m), S0.00430.0013
Catchment flow length (km), L10.7517.00
Length combined sewerage (km)513.15616.84
Table 3. Description of the hydraulic model of Murcia.
DescriptionElementNumber
HydrologyPluviographs39
Subcatchments4553
HydraulicsNodes6073
Outfalls58
Tanks70
Links6304
Pump stations100
Table 4. Comparison of the modified concentration time.
CatchmentConcentration Time, Tc (min)
Hydraulic ModelEquation (3)
S1193.75200
San Felix87.1480
Table 5. Variables of rainfall events at San Felix Catchment.
San Felix Catchment
Event codeSF_1SF_2SF_3SF_4SF_5SF_6SF_7SF_8SF_9
Year201420142015201520152015201520162016
Date (dd-m)17 June14 December22 March11 June5 September27 September15 January9 May4 June
PTOTAL (mm)7.3430.712.4710.1356.477.5311.576.802.27
Imean (mm/h)4.631.230.991.402.262.442.281.012.27
Imax10 (mm/h)19.678.862.765.3218.765.284.714.846.04
DWP (days)15101221917171822
Qmax (L/s)271029301580253031702590265022601680
Qmean (L/s)945.001396.53746.671217.951726.961073.251173.92989.42680.19
Qmax/Qmeandw10.0410.855.859.3711.749.599.818.376.22
TPH (min)3560105809513020518090
EV (m3)32,493155,85325,53664,308195,83738,63760,22246,30522,038
EVdw (m3)10,46731,63811,02817,04630,993984615,72913,14910,335
EVww (m3)22,02612,421514,50847,262164,84428,79144,49333,15611,703
Eww/EVdw0.680.800.570.730.840.750.740.720.53
CMAXtb (NTU)626851481770994765830498593
EMCtb (NTU)251279286319270308440301318
TPP (min)64.8199.88111.89110.18132.82128.67165.61156.5164.81
Table 6. Variables of rainfall events at S1 Catchment.
S1 Catchment
Event codeS1_1S1_2S1_3S1_4S1_5S1_6S1_7S1_8S1_9S1_10
Year2014201420142015201520152015201620162016
Date (dd-m)24 June22 September14 December20 May11 June27 September15 January30 January21 March4 April
PTOTAL (mm)12.063.2930.373.038.698.1811.1614.1927.4813.46
Imean (mm/h)1.900.671.221.351.162.802.093.700.990.71
Imax10 (mm/h)4.242.557.623.864.245.875.338.254.397.05
DWP (days)751024221717151312
Qmax (L/s)2360152024801560235024302440197021502580
Qmean (L/s)1567.34960.001617.77790.001393.441580.001690.001190.001700.871390.00
Qmax/Qmeandw5.063.105.222.554.495.105.453.847.814.48
TPH (min)130.0175.2110.0150.0150.0109.8205.2145.2155.0135.0
EV (m3)74,29232,349184,91132,62875,24650,09165,74563,048210,66399,084
EVdw (m3)12,97510,24236,91814,59218,49510,88412,89114,66139,16221,297
EVww (m3)61,31722,107147,99318,03656,75139,20752,85448,387171,50177,787
Eww/EVdw0.830.680.800.550.750.780.800.770.810.79
CMAX (mg/L)588522788822767652698728564496
EMCtb (NTU/L)174257171299226229292239147237
TPP (min)96.03107.12100.37103.06105.3390.19120.65110.65119.82104.76
Table 7. Correlation matrix for variables of rainfall events at S1 Catchment.
DWPQmaxTPHPTOTALImax10CMAXtbTPP
DWP1.00−0.010.09−0.290.020.680.07
Qmax 1.00−0.350.240.550.02−0.31
TPH 1.00−0.32−0.43−0.100.79
PTOTAL 1.000.500.010.24
Imax10 Symmetrical 1.000.21−0.06
CMAXtb 1.00−0.08
TPP 1.00
Table 8. Correlation matrix for variables of rainfall events at San Felix Catchment.
DWPQmaxTPHPTOTALImax10CMAXtbTPP
DWP1.000.280.120.100.130.320.19
Qmax 1.00−0.120.740.610.840.06
TPH 1.00−0.18−0.61−0.080.94
PTOTAL 1.000.590.800.11
Imax10 Symmetrical 1.000.48−0.52
CMAXtb 1.000.16
TPP 1.00
Table 9. Catchments shape factors.
CatchmentSlope (m/m)Catchment Flow Length, L (km)S (km2)Fshape
S10.001317.0047.531.645
San Félix0.004310.7514.891.288

