
Algal Bioproductivity in Turbulent Water: An Experimental Study

1
College of Urban Construction & Environmental Engineering, Chongqing University, Chongqing 400045, China
2
College of Engineering and Technology, Southwest University, Chongqing 400715, China
3
Department of Civil and Environmental Engineering, University of Hawaii at Manoa, Honolulu, HI 96822, USA
*
Author to whom correspondence should be addressed.
Water 2017, 9(5), 304; https://doi.org/10.3390/w9050304
Submission received: 2 February 2017
/
Revised: 10 April 2017
/
Accepted: 24 April 2017
/
Published: 28 April 2017
Abstract
:Excessive growth of biomass causes eutrophication and other related water quality problems. For the past several decades, these problems have been managed based on the principle of limiting nutrient, which is to reduce the loading of essential nutrients—either nitrogen or phosphorus—through point and non-point waste source control. More recent research efforts indicated that eutrophication of a natural water body such as a lake or a reservoir can be controlled alternatively by altering its turbulent intensity. The success of this alternative approach depends on more knowledge on the intimate relationship between turbulent intensity and the bioproductivity of a water body. In this experimental study, an oscillating grid turbulence (OGT) reactor was constructed to evaluate the effect of turbulent pulsation strength in terms of vibration frequency on algae bioproductivity under adequate nutrient, light, and temperature conditions. Experimental results showed that moderate turbulent intensity with vibration frequency of 0.5 Hz or less increased algal growth; with a vibration frequency of 1.0 Hz, the observed peak chlorophyll a (Chl-a) concentration in the reactor was 0.112 mg/L. The experimental results also showed that strong turbulent intensity with vibration frequency of 1.5 Hz or more reduced algal growth; with vibration frequency of 1.5 Hz, the observed peak Chl-a concentration in the reactor was only 0.06 mg/L, which was even lower than the observed peak Chl-a concentration in the reactor with stationary water. In this study, the effect of water turbulence on algal bioproductivity was further verified with experimental data on the variations of other relevant water quality parameters in the OGT reactor including total nitrogen (TN), total phosphorus (TP), pH, and dissolved oxygen (DO).
1. Introduction
For natural water bodies with adequate nutrient supply and favorable climatic conditions, their hydraulic characteristics are principal factors affecting algal bioproductivity [1,2,3,4]. Several studies were recently conducted to establish the relationship between bioproductivity of natural water bodies and their hydraulic characteristics in terms of turbulence intensity [5,6,7,8,9]. Natural water bodies such as lakes and rivers are generally in turbulent flow conditions, and the turbulence intensity of these water bodies can be characterized by average velocity, shear stress, and turbulent pulsation strength [5]. Zhong [6] studied the relationship between algal bioproductivity and the rate of flow and velocity under natural turbulent flow conditions in the Yangtze River. His results indicate that algae grows well only under a particular flow rate. Using rotating coaxial cylinders as a bioreactor, Hondzo et al. [7] studied the influence of shear flow and Reynolds number on the growth of quadrilateral Scenedesmus, while suitable light and temperature conditions were maintained throughout their experiments. Their results show that Reynolds number has an obvious influence on the growth of gathered algae, and that strong shear flow damages cellular structure and causes significant mortality. Zou et al. [8] carried out numerical experiments on the growth of cyanobacteria in water bodies with varying turbulent pulsation strength. They found that the peak concentration of chlorophyll a (Chl-a), total nitrogen (TN), and total phosphorus (TP) decreased as water turbulent pulsation increased. In a similar study, Hondzo and Lin [9] showed that the buoyancy generated by turbulence has negative effects on the growth and aggregation of algae.
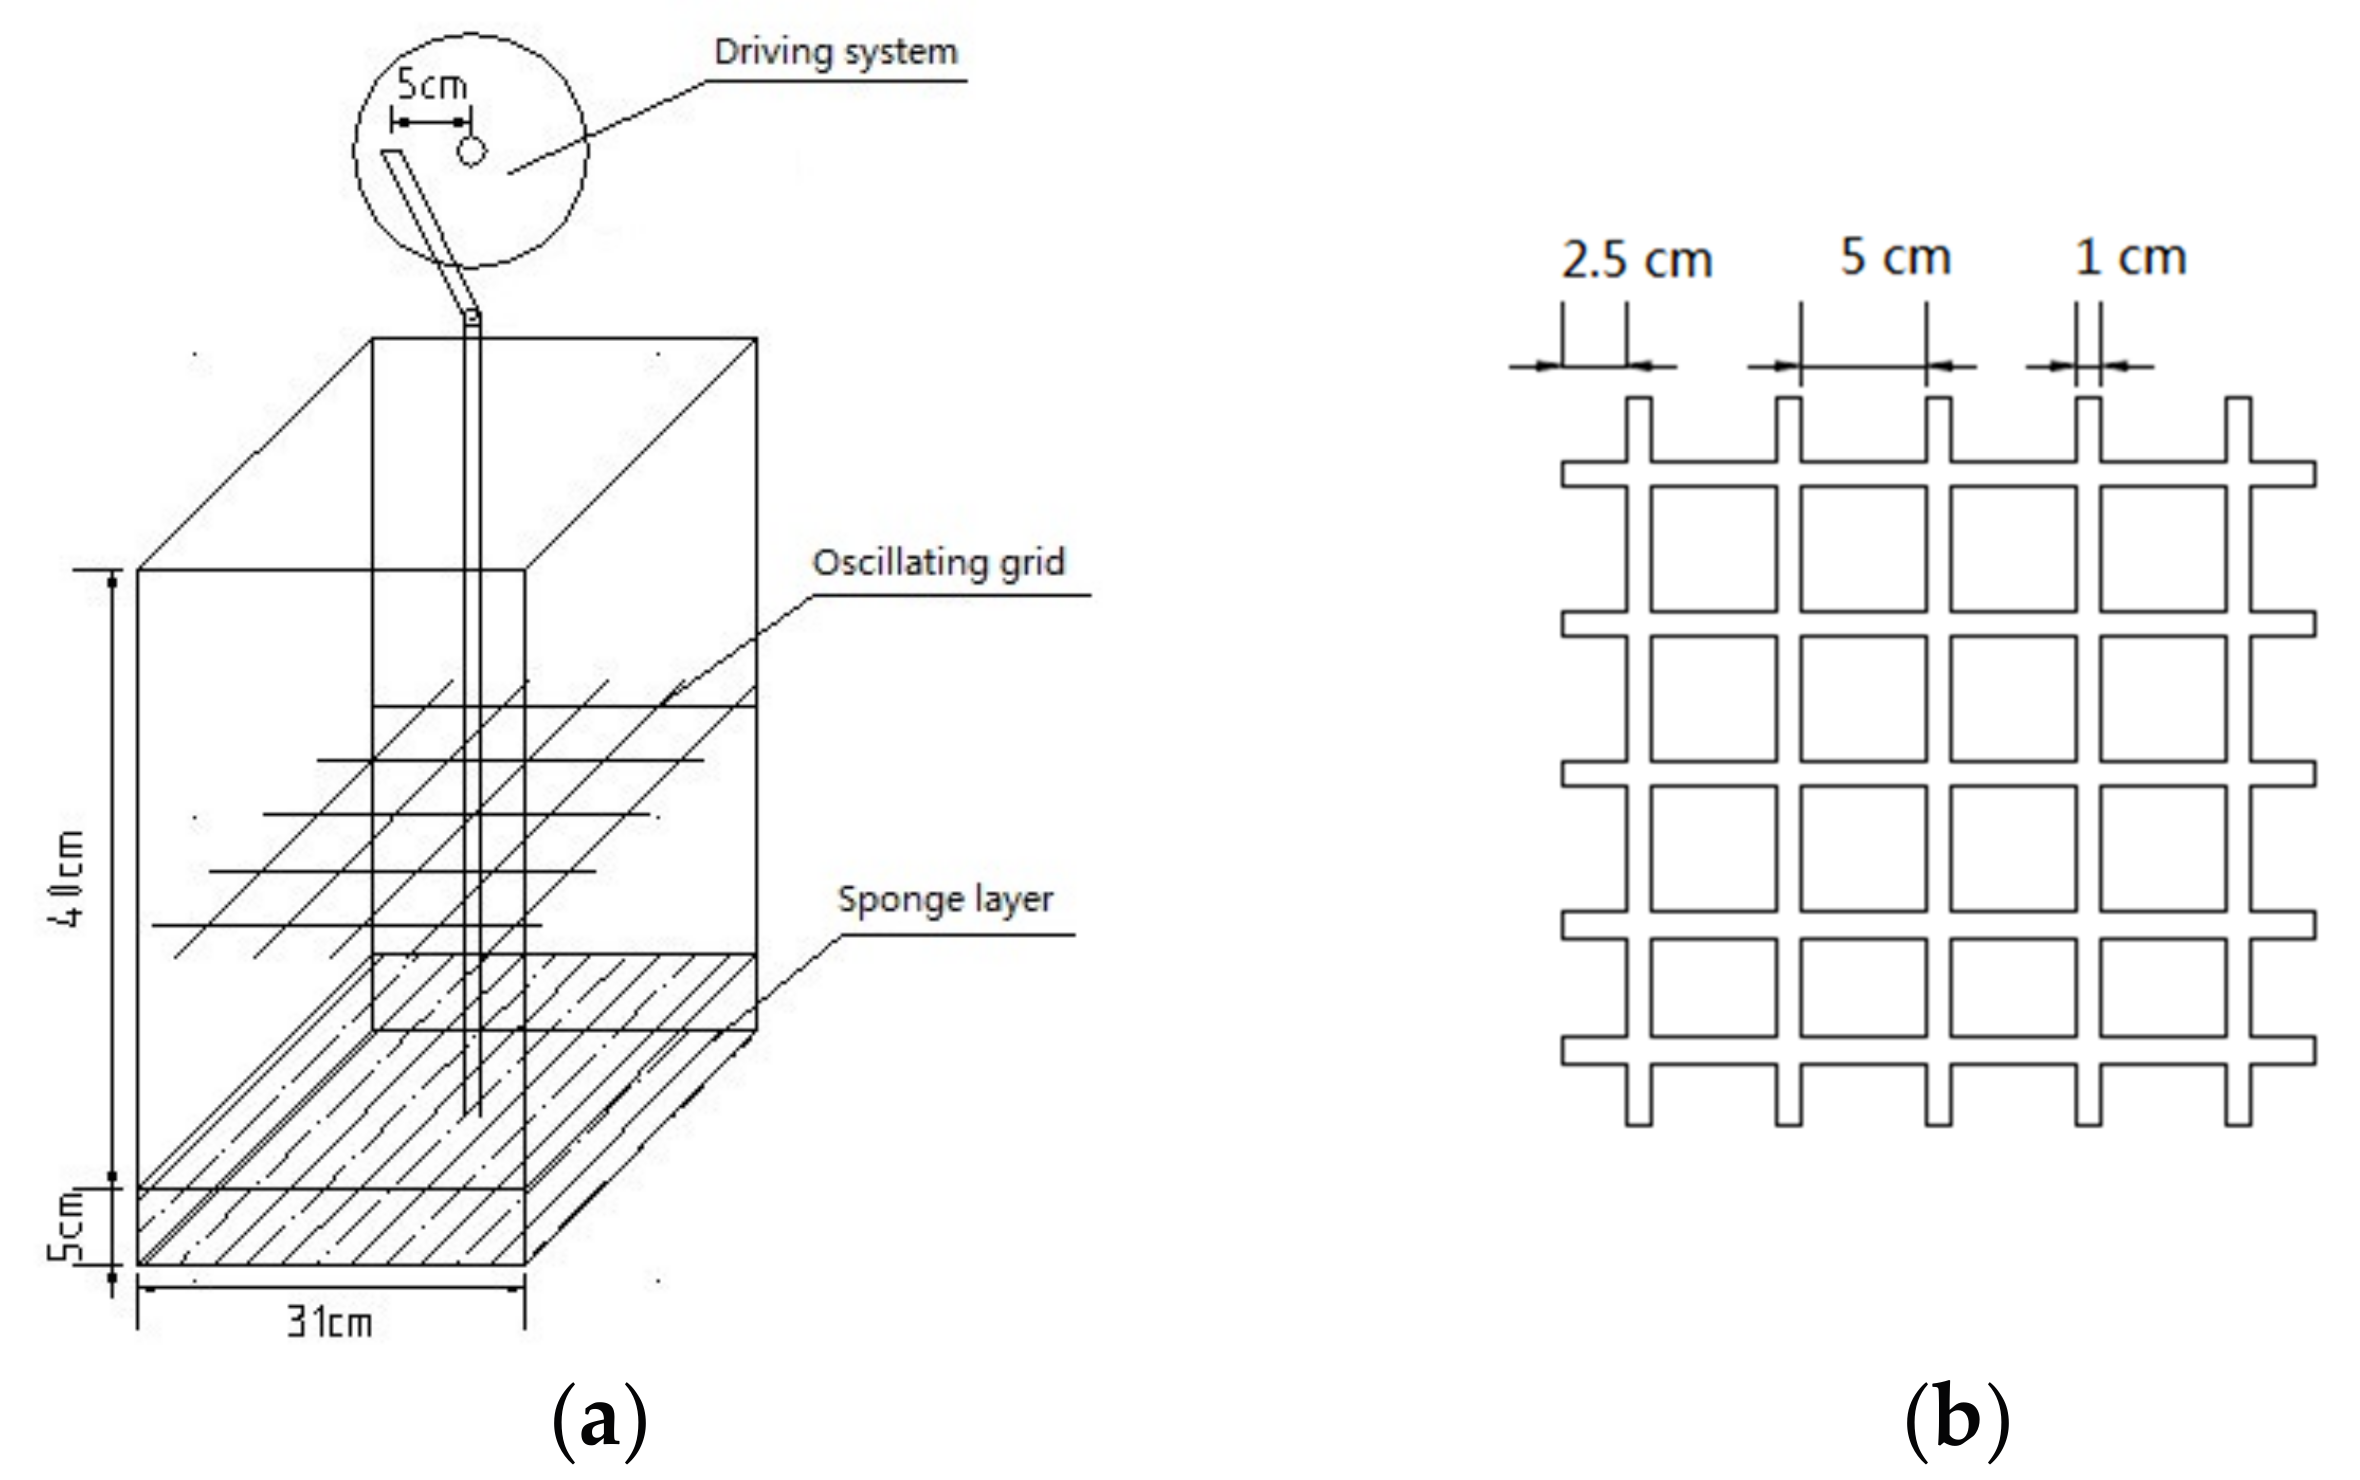
In turbulent flow, average velocity, shear stress, and turbulence pulsation strength are interrelated, and thus it is difficult to distinguish their individual effects on algal bioproductivity. In this study, the impacts of flow turbulence on algal bioproductivity were investigated experimentally by using an oscillating grid turbulence (OGT) reactor with zero flow velocity and zero shear stress [10,11] (Figure 1).
An OGT device was first used by Rouse [12] to study sediment transport and suspension. Later, OGT devices were used to study interfacial mixing in stratified flows that are widely observed in oceans, lakes, and the atmosphere [13,14,15,16,17]. OGT devices were also used to study the mechanics of sediment transport—particularly for flow situations where sediment starts to move or is entrained and suspended due to flow fluctuation in high intensity turbulent flow [18,19,20]; and to study the mass transfer across a shear-free water–air interface [21,22,23]; desorption of contaminants from sediment [24,25]; and more recently, to study the effects of small-scale turbulent fluid motion on the growth rate of freshwater algae Scenedesmus quadricauda [9].
As shown in Figure 1, an OGT reactor developed by this study is equipped with a vertical reciprocating moving grid driven by a motor. With the grid’s vertical reciprocating movements, a coupled jet flow in the grid opening and wake flow below or above the grid were formed in the reactor. An isotropic turbulent flow condition with zero-average velocity and zero-shear stress can be approximately recreated in the experimental OGT reactor [26]. Therefore, the reactor can be used to evaluate the effects of water turbulence intensity on algal bioproductivity.
2. Materials and Methods
2.1. Experimental Apparatus
The OGT reactor constructed for this study had dimensions 31 cm × 31 cm × 45 cm. The width of the grille gridline was 1 cm, the center distance of two adjacent grid holes was 6 cm, and porosity was 0.69 (Figure 1). As the grid moves in the water reciprocally along a vertical line, it generates a stable, zero-average velocity and zero-shear force vibration grid turbulence [13]. The distance between the grid edge and tank wall was 0.5 cm—small enough to effectively remove the impact of the grid edge and the tank wall boundary. A 5 cm-thick sponge layer was set up at the bottom of the tank to absorb wave energy and to prevent wave reflection and superposition.
2.2. Analysis Measuring Method
pH and dissolved oxygen (DO) were measured directly in the reactors using a multi-parameter instrument (SX751, Sanxin, Shanghai, China) every two days for a period of 20 days. At the same time, three batch water samples were collected from every reactor and were then analyzed to determine the concentrations of TN, TP, and Chl-a. TN and TP were measured by potassium persulfate oxidation ultraviolet spectrophotometry and ammonium molybdate spectrophotometry [27], respectively. The instrument used was a T6 New Century spectrophotometer (PERSEE, Beijing, China). According to the acetone extract spectrophotometry [27,28], Chl-a was measured through a DR5000 spectrophotometer (HACH, Shanghai, China). The algae species in the natural water were measured by the direct microscopic count [27] (CX31 biological microscope, Olympus, Japan). After each sampling, the reactor was filled with deionized water to replenish evaporation loss.
2.3. Source Water
The source water used by this experimental study was collected from Jialing River at Ciqikou. Algae species in the source water consisted of a variety of algae present in the natural water environment, and the micro-ecosystem was relatively homogeneous and stable (Table 1) [29]. At the beginning of the experiment, three samples were collected from the source water to measure the concentrations of TN, TP, Chl-a, and the percentage of the dominant algae. As can be seen, the nitrogen and phosphorus concentration in the source water were both high, and the water was in the eutrophic state (Table 2). Therefore, no nitrogen or phosphorus were added to the device during the experimental process of the dominant algae.
2.4. Experimental Program
The experiment was conducted in May 2016 in four OGT reactors with grid vibration frequencies of 0.5 Hz, 1.0 Hz, 1.5 Hz, and 2.0 Hz. In addition, the algal bioproductivity experiment was also conducted in a fifth reactor with stationary water to serve as a blank control group (f = 0 Hz). All five reactors were subjected to air temperature, light strength, and other environmental conditions similar to that of the Three Gorges Reservoir region during the peak growing season [29,30]. The water temperature was controlled by adjustable insulated electric rods (AQEH7, Aquael, Poland) and set to 20 °C; the light source was provided by a fluorescent lamp cold light (MASTER PL-1CT, PHILIPS, Shanghai, China), which was fixed at 30 cm above the OGT reactor. The light strength was measured by using the illuminometer (1339R, TES, Taiwan, China). The light strengths measured were 5000 lux at the level of the source water and 4200 lux at the bottle of the reactor. The time ratio of light and dark was maintained at 10 h:14 h [29,30]. Chai [30] studied the relationship between algal bioproductivity and irradiance in Three-Gorges Valley. Her results indicated that light strength in the Three-Gorges Valley region at peak growing season was between 4050 lux and 5200 lux.
3. Results and Discussion
In a vibration grid device, the root-mean-square (RMS) turbulent velocities are related to oscillation frequency as [12,14,24]:
In Formulas (1) and (2), u’, v’, and w’ are the RMS velocities of the three directions (x, y, z), respectively; M is the distance between the two centers of the grid (M = 6 cm); S is the stroke of the length (S = 5 cm); C1 and C2 are constants (equal to approximately 0.25 and 0.27, respectively); f is the oscillation frequency; Z is the distance measured from a “virtual origin” that was a little lower (1 cm for square bars and 2 cm for round bars of oscillation grid) than the mid-position of the grid and n damped exponentials (n = 1).
Due to its simplicity and applicability, Formulas (1) and (2) have been used to describe the characteristics of the OGT. Based on Formulas (1) and (2), the oscillation frequency of the grid can be used to represent water turbulence intensity in an OGT reactor.
3.1. The Effects of Turbulence Intensity on Algal Growth
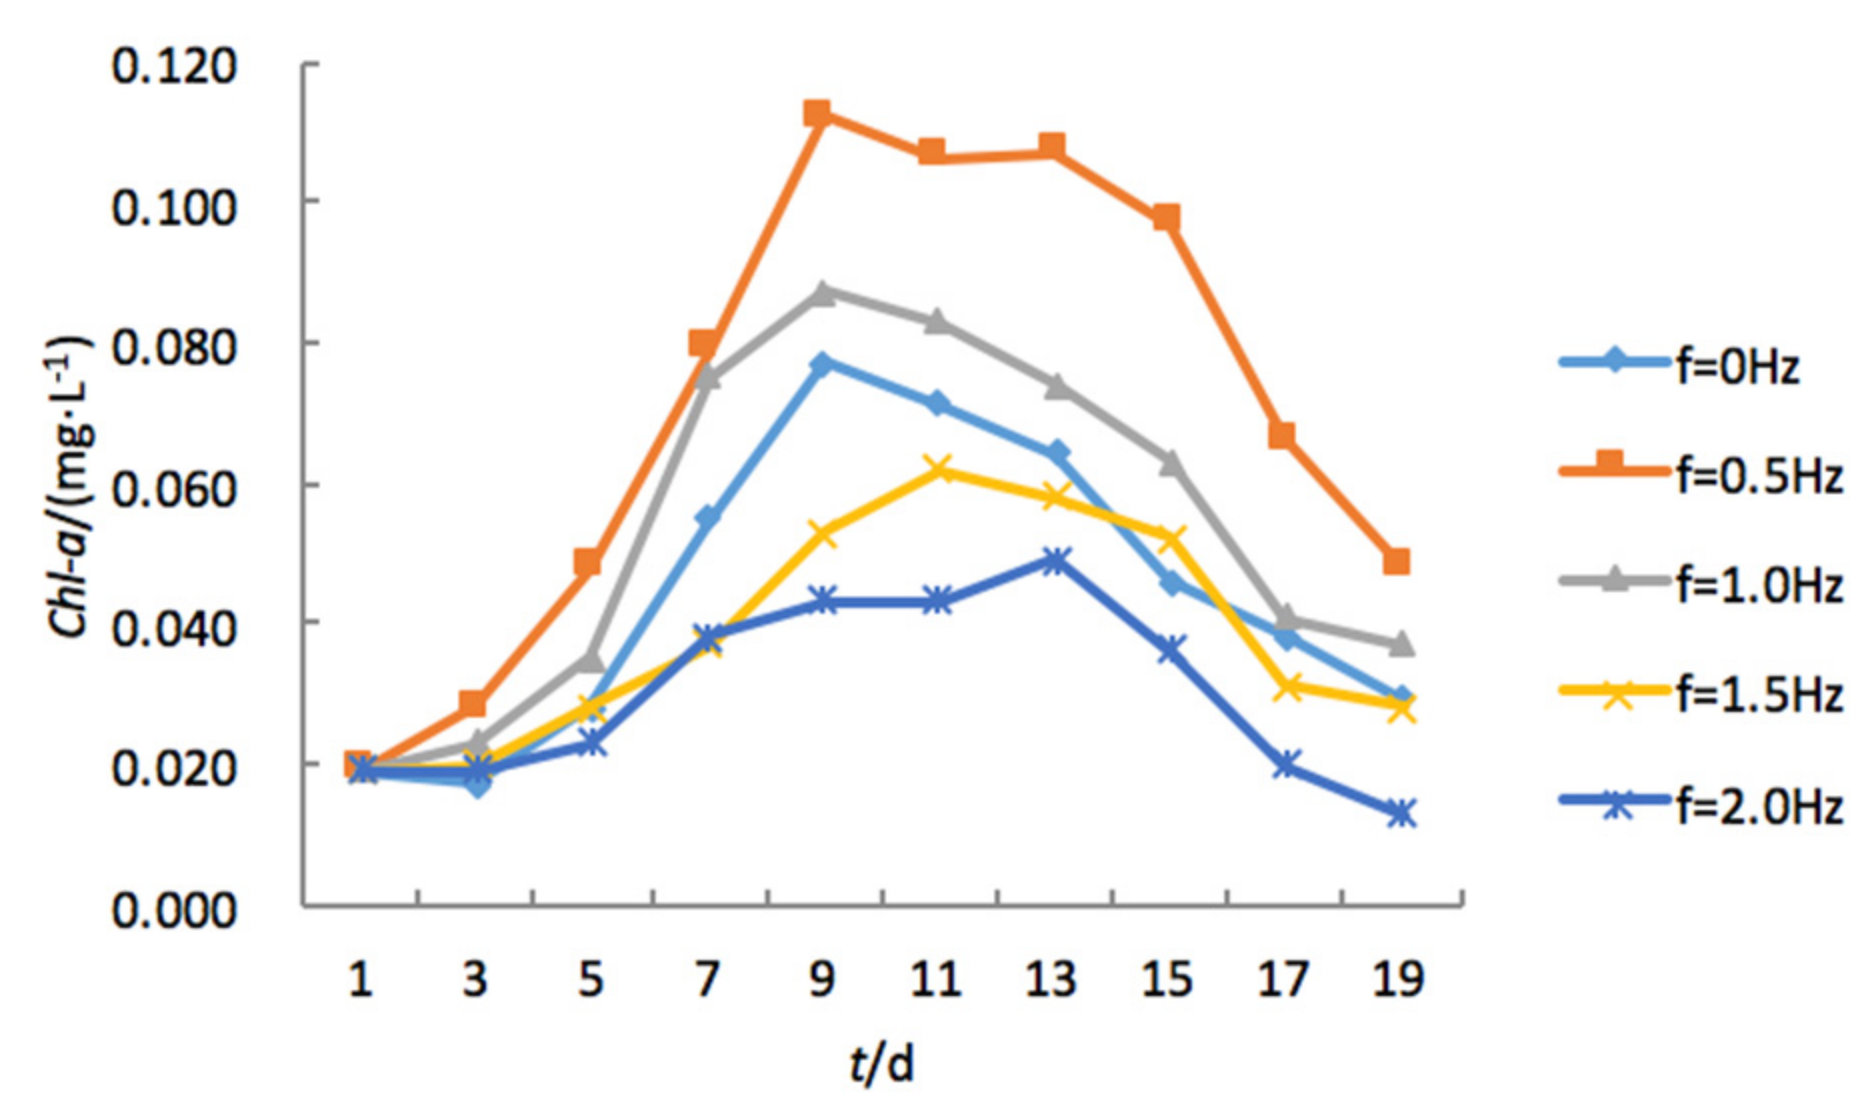
Figure 2 shows changes of the concentration of Chl-a in OGT devices with different vibration frequencies. Under different turbulence conditions, the concentration of Chl-a in each device increased initially with time and reached a peak value, then decreased following a general pattern of plankton growth in the water environment. Within the scope of the turbulence strength in the experiments, a weak pulsation strength promoted the maximum growth of experimental algae when the vibration frequency was at 0.5 Hz. However, with the gradual increase of the vibration frequency, the high strength of the pulsation had a substantial inhibition role on the algae growth; the maximum biomass was level in the stationary experiments.
As can be seen, the peak concentration of Chl-a in stationary water was 0.077 mg/L. Nine days after the experiment began, the highest peak concentrations of Chl-a (0.112 mg/L) for the five OGTs was observed with a vibration frequency of 0.5 Hz. The highest peak concentration of Chl-a was about 145% of the OGT device with stationary water. The second highest peak concentration of Chl-a occurred in the OGT device with a vibration frequency of 1.0 Hz, and was about 113% of those observed in the OGT device with stationary water.
The experimental data indicated that highly turbulent water with a vibration frequency larger than 1.0 Hz was less favorable for the growth of Chl-a. When the water vibration frequency in the device was 1.5 Hz, the observed peak concentration of Chl-a was only 0.060 mg/L, or about 78% of that observed in the stationary device. When the vibration frequency reached the maximum value used by this experiment (2.0 Hz), the observed peak concentration of Chl-a was only 0.049 mg/L, or about 63% of that observed in the stationary device.
The experimental data also indicated that the time from the beginning of the experiment to the peak concentration depended on the turbulence strength of the water in the device. In the experiments, for the vibration frequencies of 0 Hz, 0.5 Hz, and 1.0 Hz, the Chl-a concentration reached its peak on the ninth day after the start of the experiment. However, when the vibration frequencies were 1.5 Hz and 2.0 Hz, the peak concentration took place on the 11th and 13th day after the start of the experiment, respectively.
Moderate turbulent pulsation may help to promote the growth of algae in water and preserve its higher biomass. Strong turbulent pulsation may slow the growth of the algae compared with static conditions, resulting in lower biomass.
With favorable water temperature and nutrient supply, algal bioproductivity would be altered by water turbulence. As shown in Figure 2, water turbulence had a positive effect on algal bioproductivity when the water vibration frequency was at 1 Hz or smaller, and the effect became negative when the water vibration frequency was at 1.5 Hz or larger. Moderate water turbulence was favorable for algal bioproductivity because it enhanced diffusive transport and thus effectively reduced the distribution of light intensity and nutrient differences in a water system. As a result, it increased the efficiency of photosynthesis and primary productivity. However, strong water turbulence damaged algal cells, and the turbulence resulted in the re-suspension of bottom sediments. A previous study [15] indicated that these suspended solids reduced algal bioproductivity by the sedimentation and buried effects on algae.
Temporal changes of other relevant water quality parameters such as TN, TP, pH, and DO were also observed in this study. Further examination of the data yielded a better understanding of the effects of water turbulence on algal bioproductivity.
3.2. Temporal Changes of TN and TP Concentration under Varying Turbulence Intensity
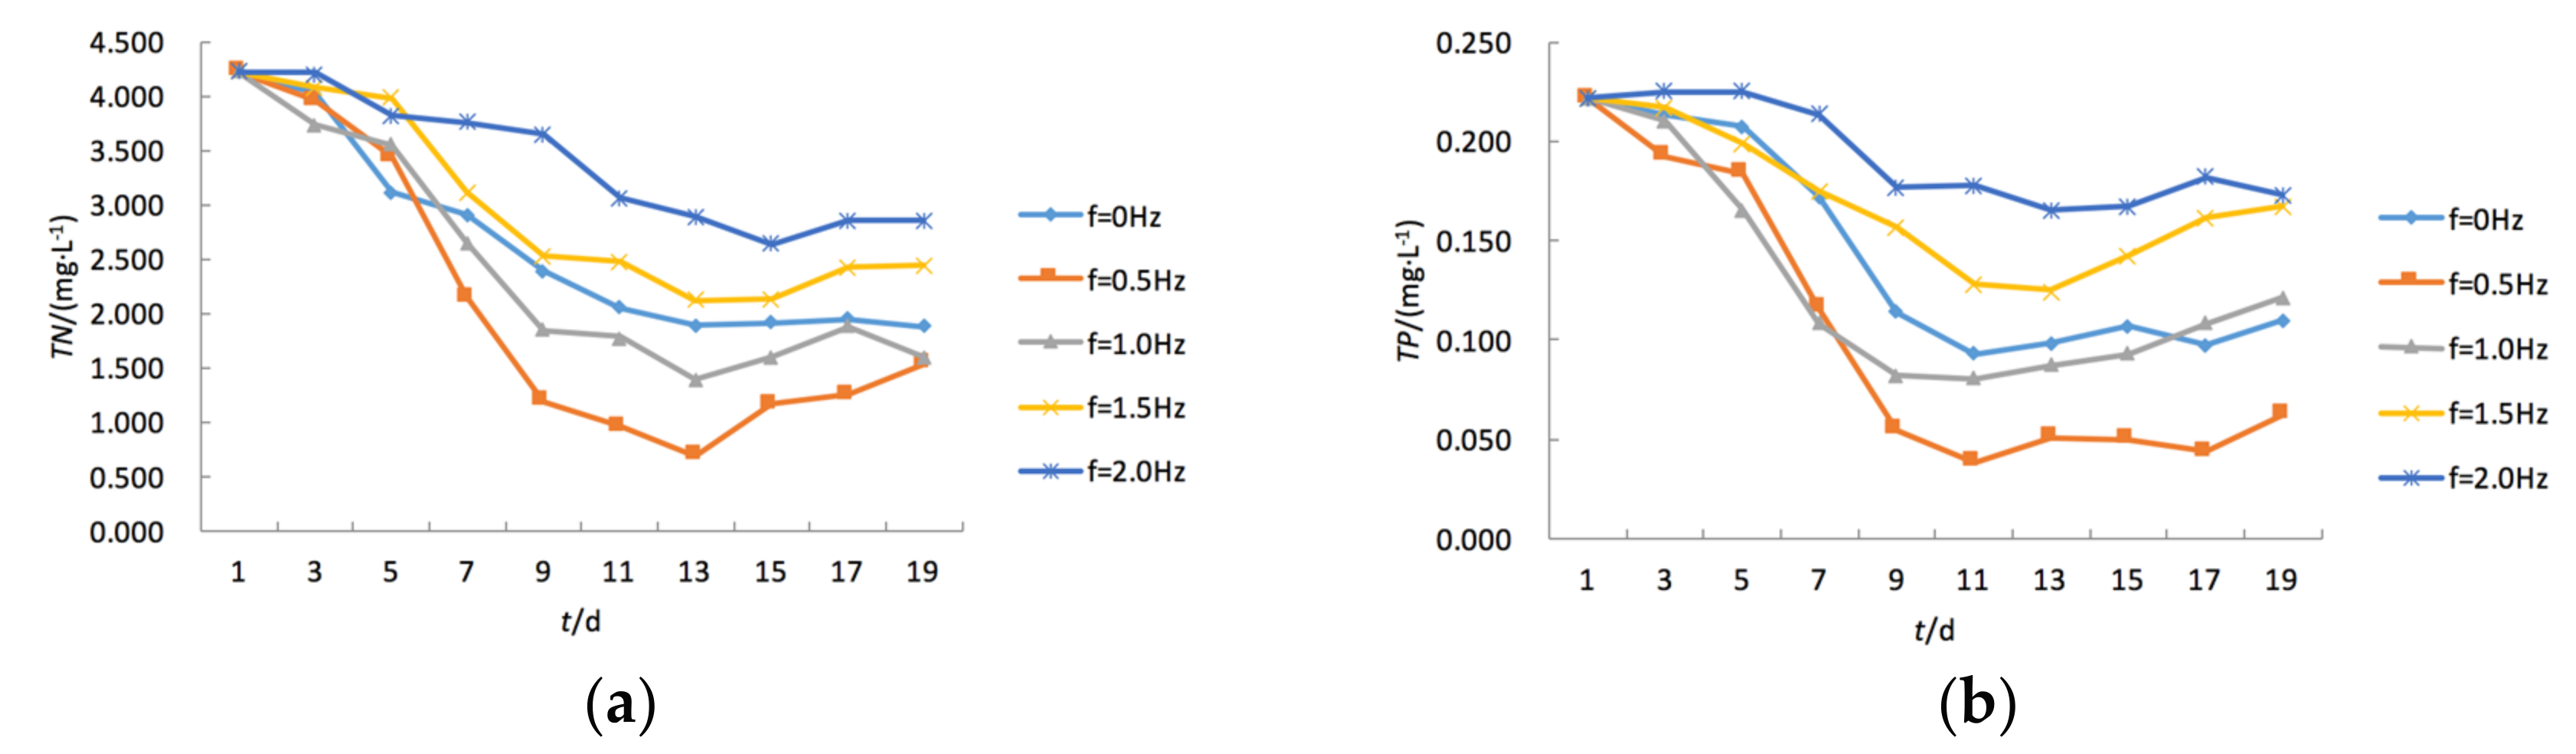
Changes in the nitrogen and phosphorus concentrations were closely related to the growth of the algae. At the start of the experiment, the high rate of algae growth consumed nitrogen and phosphorus and converted them to body cells. Consequently, the concentration of TN and TP rose sharply in the first half of the experiment (Figure 3a,b). With the reduction of available nutrients, the death rate of the algae increased gradually. In the meantime, nutrients in the dead algal cells were released back into the water, and as a result, the concentration of TN and TP increased in the second half of the experiment (Figure 3a,b). The water turbulence with a vibration frequency of 0.5 Hz created the most favorable condition for algae growth. Figure 3a,b shows that the concentration of TN and TP in the water body reduced to the lowest at this level of turbulence intensity (0.7 mg/L and 0.03 mg/L, respectively). The algal growth was retarded by continuous turbulence strength. Consequently, smaller reduction rates of the concentration of TN and TP were observed. When the vibration frequency was at 2.0 Hz, the minimum observed concentrations of TN and TP were 2.6 mg/L and 0.16 mg/L, respectively. This showed that in a closed water body, the net rate of nutrient uptake depended on water turbulence intensity, and that the effect on the rate of nitrogen uptake was pronounced.
3.3. Temporal Changes of pH and DO under Varying Turbulence Intensities
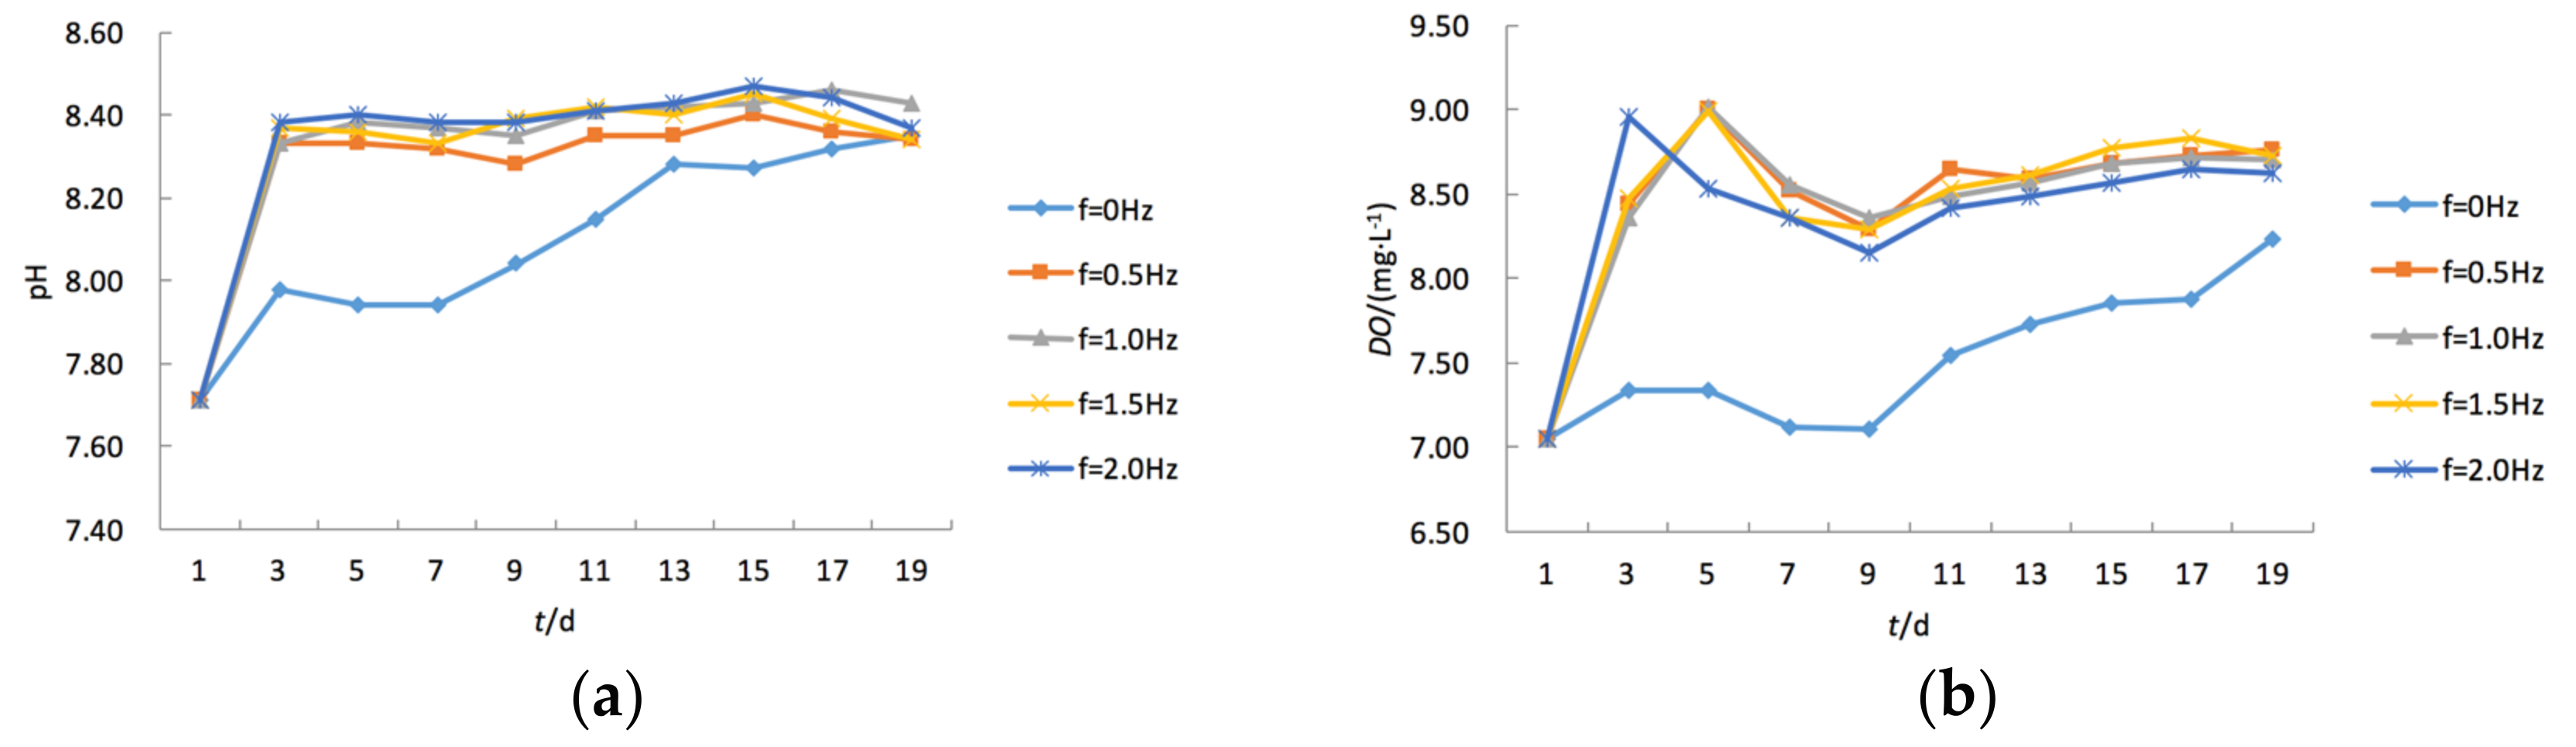
Algae grows well in neutral or slightly alkaline water. Figure 4a shows that the initial pH value in the experimental OGT devices was about 7.7 and raised to a stable value of about 8.4. Figure 4a also shows that the pH value in four OGT devices with turbulent water was raised to the stable value in only 3 days, while it took 19 days for the pH in the device with stationary water to reach the stable value. The vertical movement of the vibration grids promoted the exchange of CO2 between the eutrophic water body and the atmosphere, while the pH value remained relatively constant.
Figure 4b shows that the initial value of the DO in the five experimental OGT devices was 7.0 mg/L. In four OGT devices with turbulent water, the DO increased rapidly and eventually reached a constant value of about 8.5 mg/L. In the OGT device with stationary water, the DO showed little change until 9 days after the experiment began, when the DO increased gradually to a final value of 8.0 mg/L.
The DO concentration in a water body is determined by the joint actions of the decomposition of organic matter or deoxygenation, reaeration, and photosynthesis/respiration of aquatic plants. If aquatic plants consist of mainly algae, the photosynthesis/respiration is directly related to algal bioproductivity. Generally, the DO in a water body is reduced by the decomposition of organic matter and plant respiration, and increased by reaeration and plants photosynthesis.
During this experiment, the water temperature in the five OGT devices was kept at 20 °C. At this temperature, the equilibrium or the saturated DO content was about 9.1 mg/L. Initially, the DO in the five OGT devices was unsaturated and replenished by the actions of atmospheric reaeration. Atmospheric reaeration is the interface transfer of oxygen from air to water when the DO content in the water is less than its saturation level, and the rate of reaeration depends on water turbulence [31]. Therefore, the DO concentration in the four OGT devices with turbulent water increased much more quickly than the DO in the device with stationary water, as shown in Figure 4b.
4. Conclusions
An experimental study on algal bioproductivity in turbulent water was conducted at the Chinese Ministry of Education Key Laboratory of Ecological Environment in the Three Gorges Reservoir Area, using custom-designed OGT devices with varying water turbulence intensities. Data analysis led to the following conclusions:
- (1)
- Algal bioproductivity changed with water turbulence intensity. In moderately turbulent water, algal bioproduction increased with respect to vibration frequency. The observed peak of Chl-a concentrations in an OGT device with a vibration frequency of 0.5 Hz was 0.087 mg/L; the peak observed concentration increased to 0.112 mg/L in the OGT device with a vibration frequency of 1.0 Hz.
- (2)
- In strongly turbulent water, algal bioproduction decreased with respect to vibration frequency. The observed peak Chl-a concentrations in an OGT device with a vibration frequency of 1.5 Hz was 0.060 mg/L; the observed peak concentration was reduced to 0.049 mg/L in the OGT device with a vibration frequency of 2.0 Hz.
- (3)
- Water turbulence also had a strong influence on the concentration of TN in a water body. Experimental data indicated that when the vibration frequency in OGT reactors increased from 0.5 Hz to 2.0 Hz, the corresponding TN and TP were reduced by 27% and 19%, respectively.
- (4)
- Water turbulence adjusted the pH value to a level in the water body desirable for the growth of aquatic plants. Experimental data showed that the pH values in four OGT reactors were adjusted to their stable values in only 3 days, while the adjustment time for the OGT with stationary water was more than 19 days.
- (5)
- During this experimental investigation, the time-variation of the biodiversity of the individual algae species in the experimental OGT reactors was not evaluated. Recent literature [32,33] has reported that algal bioproductivity and biodiversity in biologically-active water are interrelated. Therefore, the effects of water turbulence on concurrent changes of bioproductivity and biodiversity—an important step toward effective control of lake eutrophication—needs to be evaluated in follow-up research.
The influence of water turbulence on the growth of the algae was produced by its direct action or the effect of the shear through flow, and by its indirect action or the mixture and material transmission of the water body through dissipation vortex, etc. It would be an important follow-up research subject to separately evaluate the effects of water turbulence’s direct and indirect actions on algal bioproductivity.
Acknowledgments
This research was supported by the Fundamental Research Funds for the Central Universities (No. XDJK2013C033) and the financial support of the National Natural Science Foundation of China (No. 51209240). Part of this research was conducted when the first author was at University of Hawaii at Manoa as a visiting scholar.
Author Contributions
Lei San, Tianyu Long, and Clark C. K. Liu conceived and designed the experiments; Lei San performed the experiments; Lei San and Tianyu Long analyzed the data; Lei San, Tianyu Long, and Clark. C.K. Liu wrote the paper.
Conflicts of Interest
The authors declare no conflict of interest.
References
- Escartín, J.; Aubrey, D.G. Flow structure and dispersion within algal mats. Estuar. Coast. Shelf Sci. 1995, 40, 451–472. [Google Scholar] [CrossRef]
- Steinman, A.D.; Mcintire, C.D. Effects of current velocity and light energy on the structure of periphyton assemblages in laboratory streams. J. Phycol. 1986, 22, 352–361. [Google Scholar] [CrossRef]
- Wu, X.H.; Li, Q.J. Reviews of influences from hydrodynamic conditions on algae. Ecol. Environ. Sci. 2010, 19, 1732–1738. (In Chinese) [Google Scholar]
- Marshall, J.S.; Sala, K. A stochastic Lagrangian approach for simulating the effect of turbulent mixing on algae growth rate in a photobioreactor. Chem. Eng. Sci. 2011, 6, 384–392. [Google Scholar] [CrossRef]
- Wang, H.; Zhou, Y.Y.; Xia, K.; Yang, R.; Liu, X.D. Flow-Disturbance considered simulation for algae growth in a river-lake system. Ecohydrology 2016, 9, 601–609. [Google Scholar] [CrossRef]
- Zhong, C.H. A Study on the Eutrophication of the Three Gorges Reservoir. Ph.D. Thesis, School of Water Resources and Hydropower, Sichuan University, Chengdu, China, March 2004. (In Chinese). [Google Scholar]
- Hondzo, M.; Al-Homoud, A. Model development and verification for mass transport to Escherichia coli cells in a turbulent flow. Water Resour. Res. 2007, 43, W08413. [Google Scholar] [CrossRef]
- Zou, R.; Zhou, J.; Sun, Y.J.; Ji, X.Y.; Yue, J.; Liu, Y. Numerical experiment study on the algae suppression effect of vertical hydrodynamic mixers. Environ. Sci. 2012, 33, 1540–1549. (In Chinese) [Google Scholar]
- Hondzo, M.; Lyn, D. Quantified small-scale turbulence inhibits the growth of a green alga. Freshw. Biol. 1999, 41, 51–61. [Google Scholar] [CrossRef]
- Shy, S.S.; Tang, C.Y.; Fann, S.Y. A nearly isotropic turbulence generated by a pair of vibrating grid. Exp. Therm. Fluid Sci. 1997, 14, 251–262. [Google Scholar] [CrossRef]
- Cheng, N.S.; Law, A.W.K. Measurement of turbulence generated by oscillating grid. Can. Metall. Q. 2001, 127, 201–208. [Google Scholar] [CrossRef]
- Rouse, H. Experiments on the mechanics of sediment suspension. In Proceedings of the Fifth International Congress for Applied Mechanics, Cambridge, MA, USA, 1938; John Wiley & Sons: New York, NY, USA, 1939; pp. 550–554. [Google Scholar]
- Xuequan, E.; Hopfinger, E.J. On mixing across an interface in stably stratified fluid. J. Fluid Mech. 1986, 166, 227–244. [Google Scholar] [CrossRef]
- Hopfinger, E.J.; Toly, J.A. Spatially decaying turbulence and its relation to mixing across density interfaces. J. Fluid Mech. 1976, 78, 155–175. [Google Scholar] [CrossRef]
- Mcdougall, T.J. Measurement of turbulence in a zero-mean-shear mixed layer. J. Fluid Mech. 1979, 94, 409–431. [Google Scholar] [CrossRef]
- Rouse, H.; Dudo, J. Turbulent diffusion across a density discontinuity. La Houille Blanche 1955, 10, 530–532. [Google Scholar]
- Thompson, S.M.; Turner, J.S. Mixing across an interface duo to turbulence generated by an oscillating grid. J. Fluid Mech. 1975, 67, 349–368. [Google Scholar] [CrossRef]
- Huppert, H.E.; Turner, J.S.; Hallworth, M.A. Sedimentation and entrainment in dense layers of suspended particles stirred by an oscillating grid. J. Fluid Mech. 1995, 289, 263–293. [Google Scholar] [CrossRef]
- Orlins, J.J.; Gulliver, J.S. Turbulence quantification and sediment resuspension in an oscillating grid chamber. Exp. Fluids 2003, 34, 662–677. [Google Scholar] [CrossRef]
- Tsai, C.H.; Lick, W. A portable device for measuring sediment resuspension. J. Gt. Lakes Res. 1986, 12, 314–321. [Google Scholar] [CrossRef]
- Brumley, B.H.; Jirka, G.H. Near-surface turbulence in a grid-stirred tank. J. Fluid Mech. 1987, 183, 236–263. [Google Scholar] [CrossRef]
- Chu, C.R.; Jirka, G.H. Turbulent gas flux measurements below the air-water interface of a grid-stirred tank. Int. J. Heat Mass Transf. 1992, 35, 1957–1968. [Google Scholar]
- Jirka, G.H. Application of LIF to investigate gas transfer near the air-Water interface in a grid-Stirred tank. Exp. Fluids 2004, 37, 341–349. [Google Scholar]
- Connolly, J.P.; Armstrong, N.E.; Miksad, R.W. Adsorption of hydrophobic pollutants in estuaries. J. Environ. Eng. 1983, 109, 17–35. [Google Scholar] [CrossRef]
- Valsaraj, K.T.; Ravikrishna, R.; Orlins, J.J.; Smith, J.S.; Gulliver, J.S.; Reible, D.D.; Thibodeaux, L.J. Sediment-to-air mass transfer of semi-volatile contaminants due to sediment resuspension in water. Adv. Environ. Res. 1997, 1, 145–156. [Google Scholar]
- Yan, J.; Cheng, N.S.; Tang, H.W.; Tan, S.K. Oscillating-grid turbulence and its applications: A review. J. Hydraul. Res. 2007, 45, 26–32. [Google Scholar] [CrossRef]
- State Environmental Protection Administration. Water and Waste Water Monitor and Analyze Method, 4th ed.; China Environment Science Press: Beijing, China, 2002. (In Chinese) [Google Scholar]
- Lorenzen, C.J. Determination of chlorophyll and pheo-pigments: Spectrophotometric equations. Limnol. Oceanogr. 1967, 2, 343–346. [Google Scholar] [CrossRef]
- Zeng, T. Study on Phytoplankton Composition and Water Quality in Chongqing Reach of Jialing River and Yangtze River. Master’s Thesis, College of Chemistry and Chemical Engineering, Chongqing University, Chongqing, China, April 2004. (In Chinese). [Google Scholar]
- Chai, X.Y. Behavior Study on the Role of Irradiance and Temperature on the Algae Bloom of Typical Algae in Three-Gorges Valley. Master’s Thesis, College of Chemistry and Chemical Engineering, Chongqing University, Chongqing, China, April 2004. (In Chinese). [Google Scholar]
- Liu, C.C.K.; Fok, Y.S. Stream waste assimilative capacity analysis using reaeration coefficients measured by tracer techniques. J. Water Resour. Bull. 1983, 19, 439–445. [Google Scholar] [CrossRef]
- Carno-Kyker, S.R.; Swanson, A.K. Temporal and spatial patterns of eukaryotic and bacterial communities found in vernal pools. J. Appl. Environ. Microbiol. 2008, 74, 2554–2557. [Google Scholar] [CrossRef] [PubMed]
- Lefranc, M.A.; Thenot, A.; Lepere, T.C.; Debroas, D. Genetic diversity of small eukaryotes in lakes differing by their trophic status. J. Appl. Environ. Microbiol. 2005, 71, 5935–5942. [Google Scholar] [CrossRef] [PubMed]
Figure 1.
The oscillating grid turbulence (OGT) reactor: (a) typical experimental setup; (b) oscillation grid size.
Figure 1.
The oscillating grid turbulence (OGT) reactor: (a) typical experimental setup; (b) oscillation grid size.

Figure 2.
Chl-a concentration under different vibration frequencies.

Figure 3.
(a) TN concentration under different vibration frequencies; (b) TP concentration under different vibration frequencies.
Figure 3.
(a) TN concentration under different vibration frequencies; (b) TP concentration under different vibration frequencies.

Figure 4.
(a) pH concentration under different vibration frequencies; (b) DO concentration under different vibration frequencies.
Figure 4.
(a) pH concentration under different vibration frequencies; (b) DO concentration under different vibration frequencies.


Table 1.
The algae species in the natural water in Jialing River, Ciqikou [29].
Table 1.
The algae species in the natural water in Jialing River, Ciqikou [29].
| Species | Diatom | Blue Algae | Green Algae | Others |
|---|---|---|---|---|
| Percent | 43–60 | 3–20 | 8–40 | 3–16 |
Table 2.
Parameters of raw water quality in Jialing River, Ciqikou.
| Item | TN (mg/L) | TP (mg/L) | Chl-a (mg/L) | Dominant Algae (%) |
|---|---|---|---|---|
| Parameters | 4.215 (0.209) | 0.222 (0.025) | 0.019 (0.002) | 47.32 (1.91) |
Notes: Number in parentheses indicates variance. Chl-a: chlorophyll a; TN: total nitrogen; TP: total phosphorous.
© 2017 by the authors. Licensee MDPI, Basel, Switzerland. This article is an open access article distributed under the terms and conditions of the Creative Commons Attribution (CC BY) license (http://creativecommons.org/licenses/by/4.0/).
Share and Cite
MDPI and ACS Style
San, L.; Long, T.; Liu, C.C.K. Algal Bioproductivity in Turbulent Water: An Experimental Study. Water 2017, 9, 304. https://doi.org/10.3390/w9050304
AMA Style
San L, Long T, Liu CCK. Algal Bioproductivity in Turbulent Water: An Experimental Study. Water. 2017; 9(5):304. https://doi.org/10.3390/w9050304
Chicago/Turabian StyleSan, Lei, Tianyu Long, and Clark. C. K. Liu. 2017. "Algal Bioproductivity in Turbulent Water: An Experimental Study" Water 9, no. 5: 304. https://doi.org/10.3390/w9050304
Note that from the first issue of 2016, this journal uses article numbers instead of page numbers. See further details here.