
A New Device for Pressure Control and Energy Recovery in Water Distribution Networks


1
Dipartimento di Ingegneria Civile, Ambientale, Aerospaziale, dei Materiali (DICAM), Università di Palermo, Viale delle Scienze, 90128 Palermo, Italy
2
Dipartimento di Ingegneria Civile, dell’Energia, dell’Ambiente e dei materiali (DICEAM), Università degli Studi “Mediterranea” di Reggio Calabria, Salita Melissari, 89124 Reggio Calabria, Italy
3
WECONS, Via Agrigento, 67, 90141 Palermo, Italy
*
Author to whom correspondence should be addressed.
Water 2017, 9(5), 309; https://doi.org/10.3390/w9050309
Submission received: 31 March 2017
/
Revised: 18 April 2017
/
Accepted: 19 April 2017
/
Published: 28 April 2017
Abstract
:The potential energy of the water in Water Distribution Networks (WDNs) usually exceeds the amount needed for delivery and consumption and, at the present time, it is mainly dissipated through Pressure Reducing Valves (PRVs) or Open Water Tanks. The present study suggests the use of a new energy-producing device, a Cross-flow turbine with positive outlet pressure named PRS (Power Recovery System), which can provide the same service as PRVs and water tanks, with additional significant hydropower production. After a short presentation of the PRS, the management rules of the proposed device are laid out, according to two possible modes. In the ‘passive’ mode, the piezometric level downstream of the turbine is fixed at the sought after value, in the ‘active’ mode, the discharge is regulated according to the required value. The design criterion is then presented, based on a simple relationship linking dimensionless numbers. A PRS is finally designed for a typical water distribution network, serving the city of Palermo (Italy). The resulting cost-benefit analysis is compared with a similar one carried out in previous work for a regulation system based on the use of a Pump As Turbine (PAT). The comparison shows the improvement obtained by the use of the PRS, consisting of higher energy production, as well as lower construction and installation costs.
1. Introduction
The water loss per unit time in a Water Distribution Network (WDN) is strictly related to the pressure around the leaks [1,2]. The pressure control is usually carried out by means of open water tanks and/or the installation of Pressure Reducing Valves (PRVs) [3,4,5].
In water transport conduits and WDNs, the open water tanks traditionally perform two main functions. The first function is the storage of water during low consumption time periods, required to satisfy the water demand during high consumption time periods; the second function is the regulation of the piezometric level, in order to fix the maximum pressure value downstream of the tank. PRVs are used in transport conduits to dissipate the surplus energy head resulting from lower head losses in smoother new pipes during the earlier stage of their life cycle or from low discharge transportation and, in WDNs, to create different pressure zones inside the water networks.
In the recent technical literature the use of several devices for energy recovery upstream of open water tanks has been investigated [6]. Pump As Turbine (PAT) systems [7,8,9] and micro turbines, like Cross-flow turbines [10,11,12,13], have provided interesting opportunities. More complex turbine types, like Francis [14], are usually too expensive for the produced power, also because high values of the efficiency curve are restricted to a small interval around the design discharge against a strong hourly variability of the actual discharge. The only device largely used inside pipes, far from open water tanks and for relatively small discharge values, is the PAT, because traditional Cross-flow turbines have atmospheric pressure outflow [15,16,17,18]. New micro turbines, like tubular propellers [19,20], have not yet attained a satisfactory efficiency during variable flow conditions. The major drawback of the PAT system is that it lacks a control device able to change the characteristic curve along with the actual discharge. The use of the inverter to partially accomplish this goal [21] requires a strong efficiency reduction. This implies the need to dissipate part of the pressure when the discharge is smaller than the design one and to bypass part of the discharge when it is larger than the design discharge.
In the following sections, a new simple turbine with positive outlet pressure, named Power Recovery System (PRS), is proposed, which fits all the requirements needed to provide a strong benefit from the replacement of water tanks or PRVs. The new device has the simplicity of Banki turbines for free outflow, but can be installed in pipes with positive outflow pressure and has high hydraulic efficiency, almost always larger than 75%. The proposed device can be set in the ‘passive’ or ‘active’ mode. When the device is set in the ‘passive’ mode this allows:
- (1)
- fixing the outlet piezometric level at any required value, lower than the inlet one, but even much greater than the ground elevation, while also being variable in time;
- (2)
- transforming the inlet-outlet hydraulic power difference in electricity;
- (3)
- measuring the flow rate.
When the device is set in the ‘active’ mode this provides discharge regulation by fixing the outlet piezometric level corresponding to the required discharge in the accomplishment of function (1), also replacing function (3) with pressure metering.
Use of PRS could limit water tank construction only in sites where water storage is required, with a strong benefit for the water manager. The reason for this benefit is that tank construction and maintenance costs are very high, especially because contact between the water and the open air leads to many security and sanitary requirements (like periodic water quality controls and man-sized access to the tanks). Moreover, the open water tanks set the piezometric level a few meters above the ground level and this is not always the best choice in water transport conduits and WDN design, according to the actual elevations occurring in downstream conduits.
2. A Cross-Flow Turbine with Positive Outlet Pressure
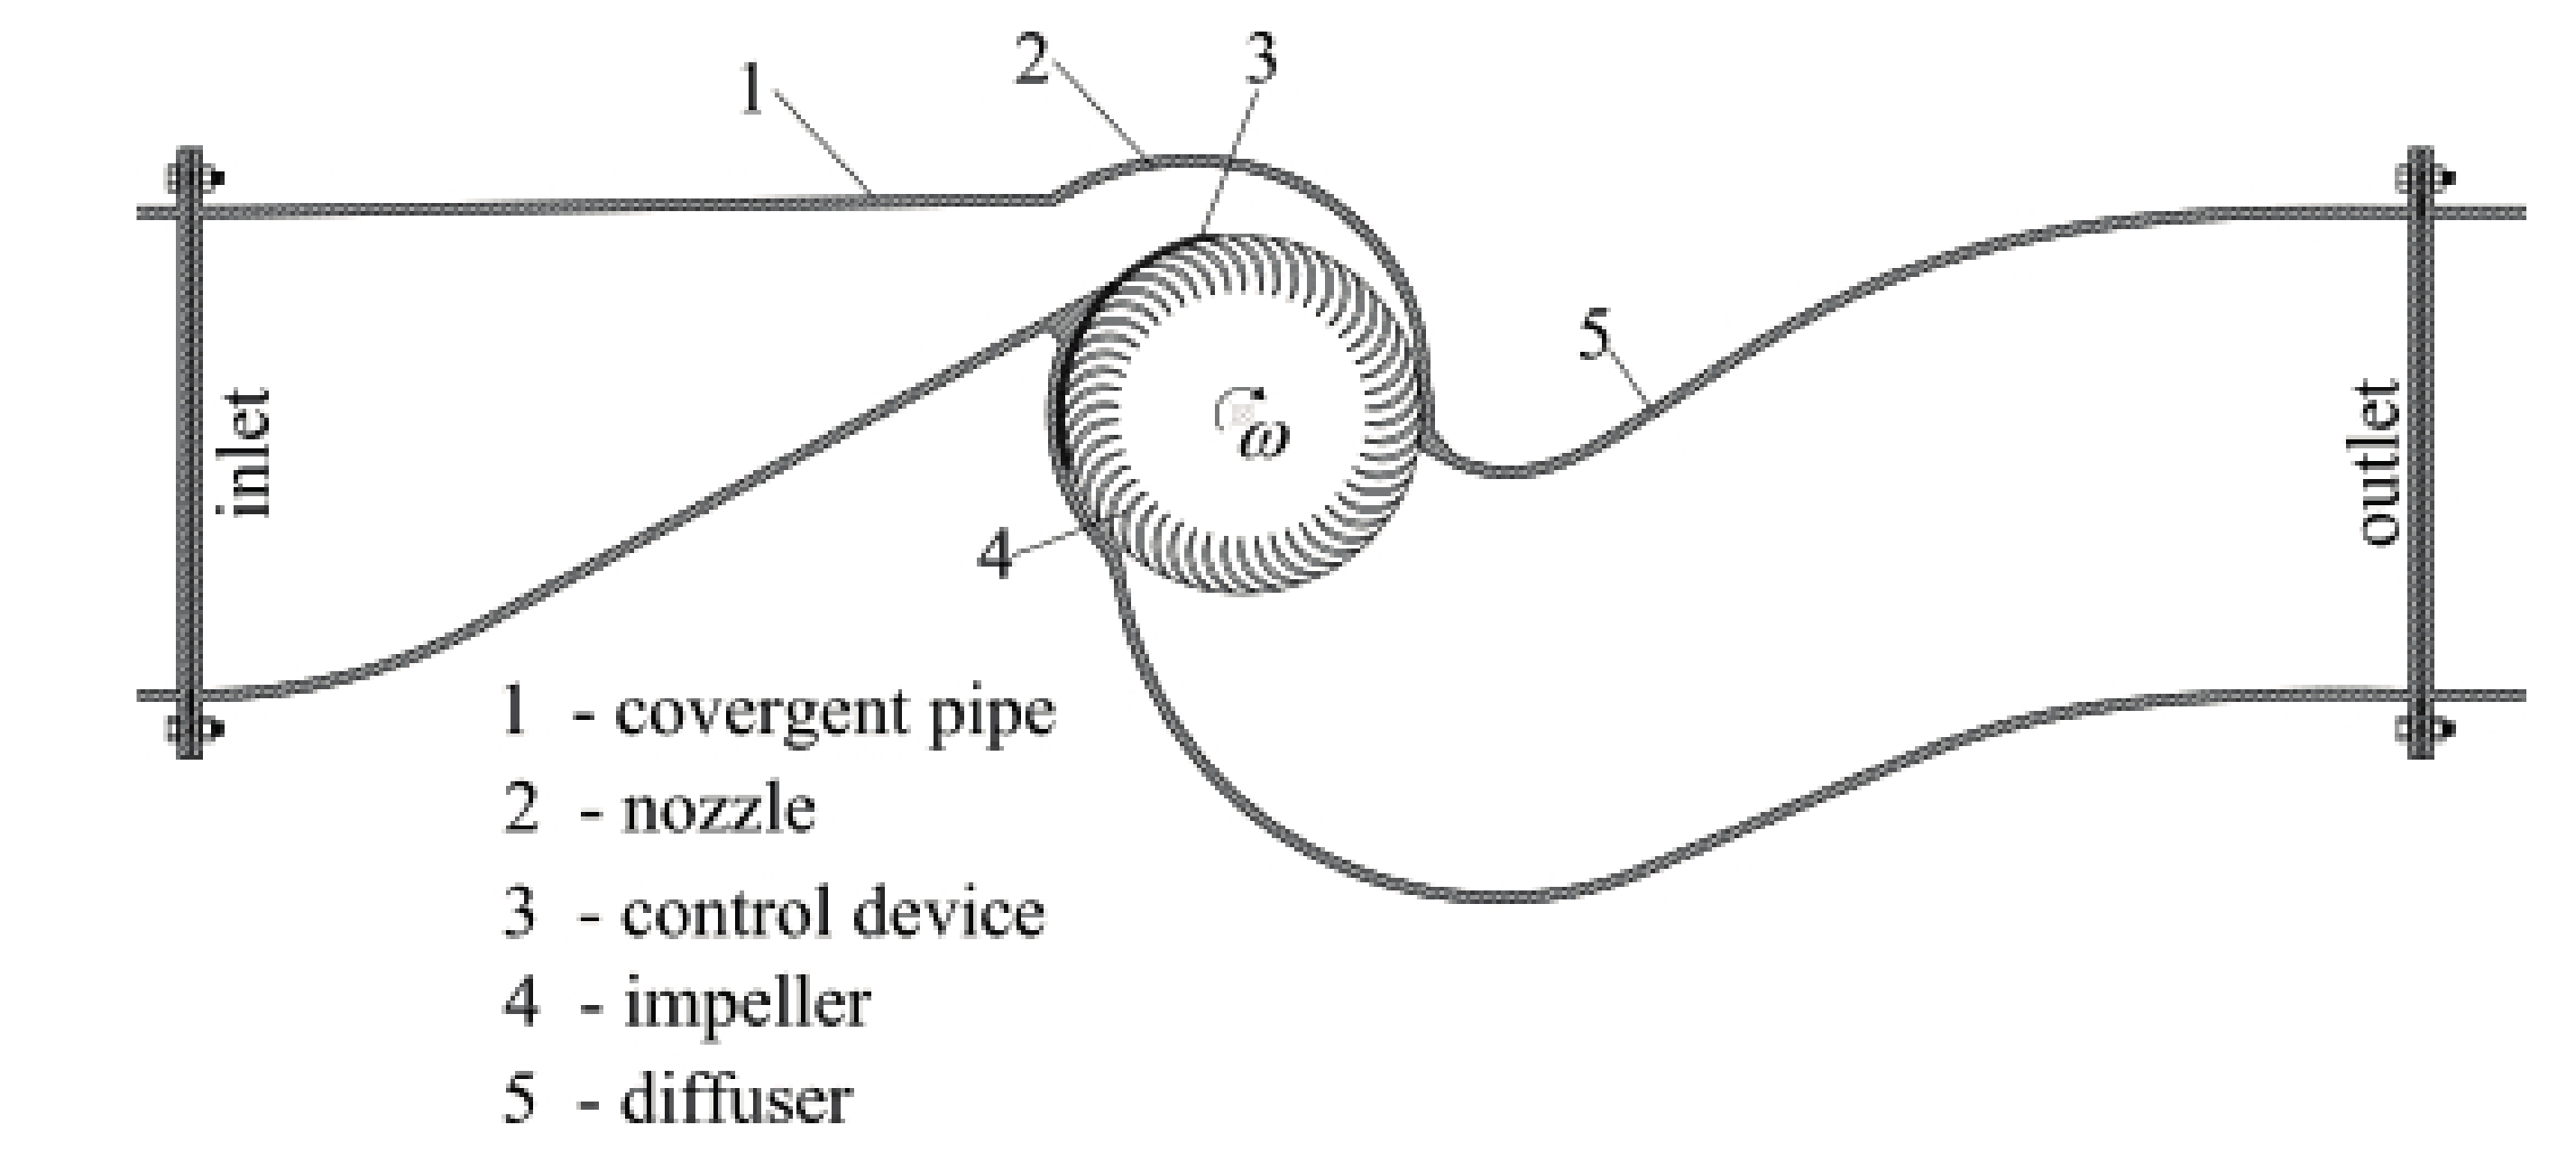
The PRS can be viewed as a Banki type turbine with pressurized outflow. See in Figure 1, section of the turbine, which has a cylindrical shape, with inlet and outlet rectangular sections, as well as negligible velocity and gradient pressure components in the axis direction. The flux enters through the nozzle, which covers the impeller inlet for an angle named λ. After crossing the channels of the impellers a first time, the flux leaves the machine by crossing the channels a second time, before entering the diffuser. The maximum λ angle allowed to avoid the partial return of the flux through the same inlet surface is about 110° [22]. The diffuser guarantees gradual variation of the particle velocity direction and is connected to the outlet pipe, which has the same axis as the inlet one. Preliminary laboratory tests on the PRS are described in [22].
The major advantages of the proposed turbine, with respect to other possible ones, are the following:
- (1)
- the blades and all the rotating parts have a simple cylindrical shape;
- (2)
- the flux direction is always along a vertical plane shared with the original pipe axis;
- (3)
- it is possible to simply change the characteristic curve by partially closing the impeller inlet surface through a simple semi-circular cylindrical flap, without major efficiency reduction within a large discharge range (up to 1:3).
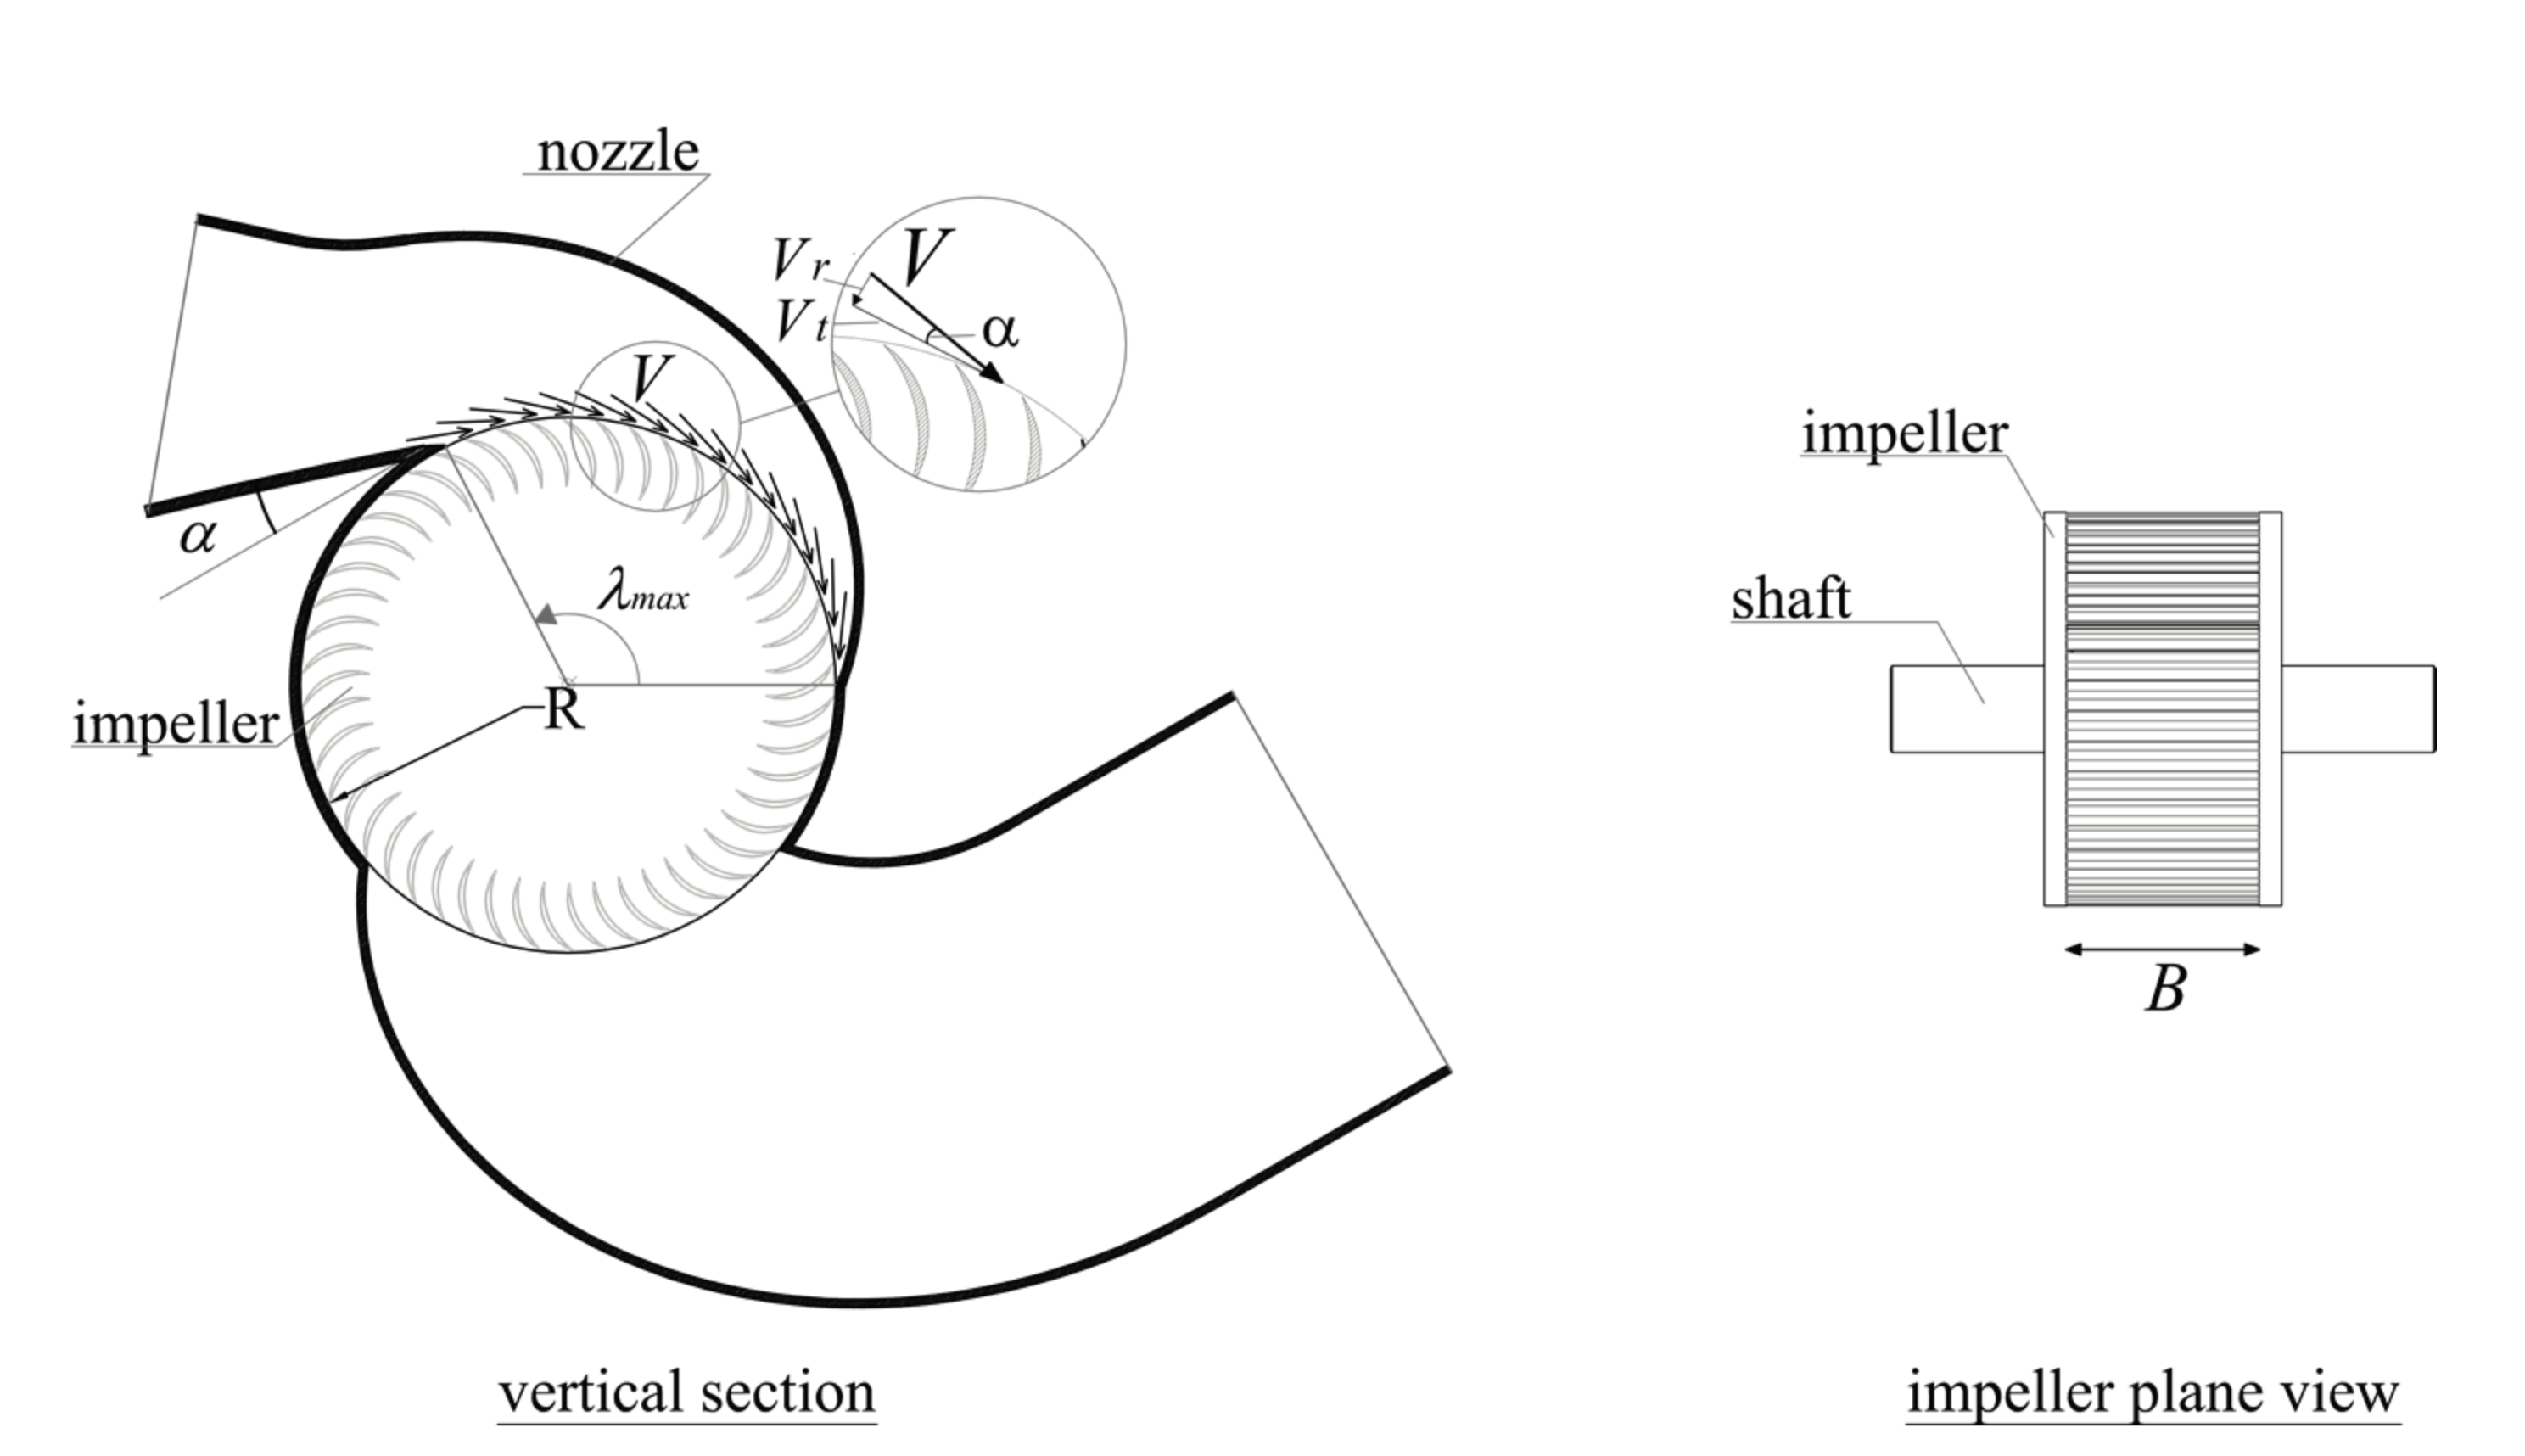
Previous studies [13] showed that Banki turbine efficiency is mainly a function of two parameters: (1) the velocity ratio Vr, given by the ratio between the tangent component of the inlet velocity and the reference system velocity at the impeller inlet surface; (2) the λ angle (Figure 2). The efficiency always drops along with λ and, in Banki turbines with free outflow, attains the maximum value for Vr ≈ 2 and λ=λmax, where
Experimental evidence [22] has shown that the maximum efficiency, in pressurized Banki turbines, is obtained with a smaller velocity ratio. Numerical experiments, carried out by the authors on two geometrically similar reference turbines, suggest the optimal velocity ratio to be about 1.75 at the maximum λ angle. See in Table 1 the geometrical parameters of the two turbines. This optimal relative velocity increases with the inverse of the λ angle, up to a value of 2.4 for very small values of the λ angle (Figure 3). Figure 4 shows the best efficiency point (BEP) for each λ value, obtained with turbine 1 and turbine 2. Details of the CFD (computational fluid dynamics) analysis on the model created in the CFX module and used to derive the discharge-head relationship, as well as the hydraulic efficiency of a Banki turbine, can be found in [13].
To design the turbine, it is very important to evaluate the relationship among the rotational velocity V, the inlet velocity V and the head jump ΔH occurring under the maximum efficiency condition. Previous studies [23] have shown that this relationship, according to the results of extended 2D simulations, is given by:
where Cv = 0.98, ξ =1 in the case of free outlet flow or ξ =2.65 in the case of pressurized outflow. Laboratory experiments have confirmed the numerical result in the case of free outflow, but in the case of pressurized outflow experimental evidence, Reference [22,24] provides inlet velocities smaller than the velocities predicted by Equation (2). A possible explanation of this result is that in both cases laboratory experiments were carried out on Banki turbines designed assuming an optimal velocity ratio of 2 and this optimality condition was only confirmed in the case of free outflow. In the case of pressurized flow the best efficiencies are always attained, in the numerical experiments with both the reference turbines, using a coefficient ξ equal to 2.1.
3. PRS Management
Neglecting velocity and pressure gradient components in the axis direction, affinity laws [25] provide the following relationship among the index number of geometrically scaled pumps and turbines:
where g(m/s2) is the gravity acceleration, ΔH(m) is the head jump through the turbine, ω(rad/s) is the impeller rotational velocity, D(m) is the impeller diameter, q(m2/s) is the discharge per unit width, p(N/s) is the output mechanical power per unit width, and ρ(Ns2/m4) is the water density.
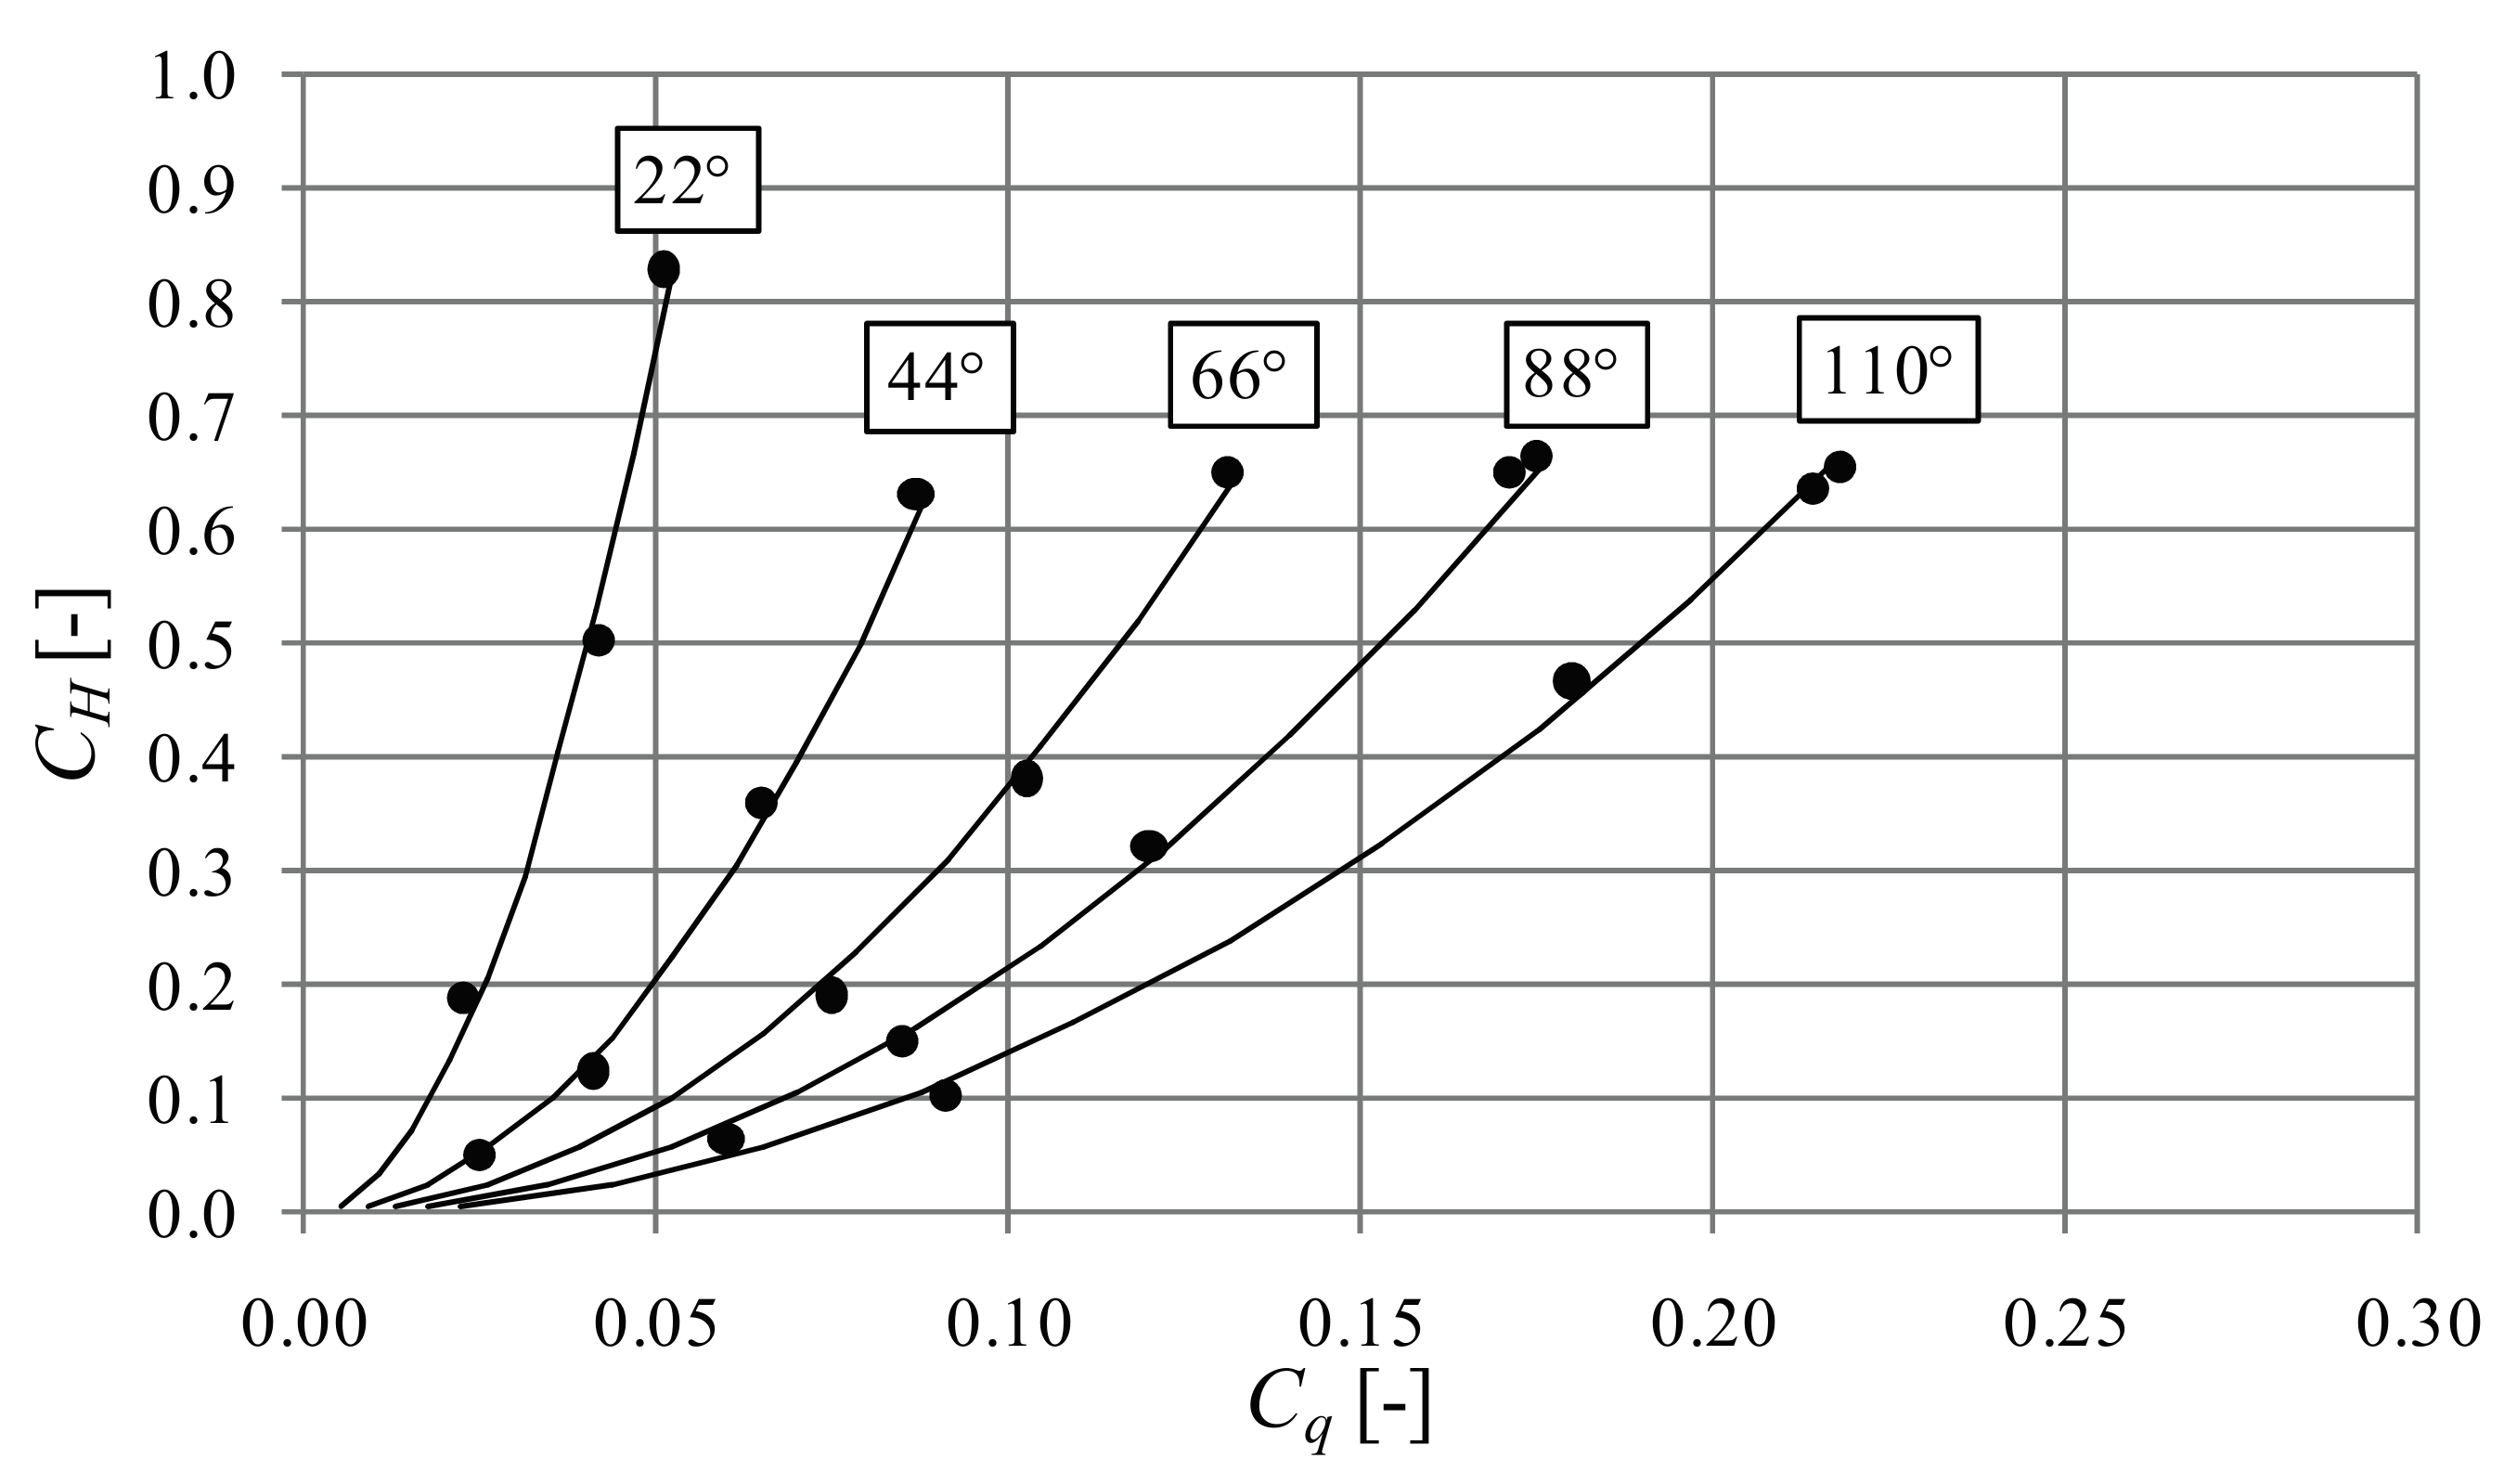
In this section the authors look through numerical simulations at the one-to-one relationship existing through CH and Cq for a fixed value of the λ angle, when the maximum efficiency condition is attained in relationships (3). Efficiency η is defined as:
and optimality of η is meant with respect to the ω input variable, such that any small variation of the input ω provides a reduction of the efficiency η. Simulations were carried out with the previously mentioned reference turbines. See in Figure 5 the (CH, Cq) points computed by differentiating the input discharge and rotational velocity in the two test machines. Table 2 shows the λ angle, efficiency, impeller diameter, discharge, rotational velocity and computed head jump, computed for each BEP point. Points not corresponding to the optimality condition have been discarded for clarity.
It can be observed in Figure 5 that all points are well aligned along a quadratic curve, such that the following relationship holds:
where the K(λ) values are those plotted in Figure 6.
Relationship (5) is quite useful to easily predict the head jump corresponding to any pair of λ and Q values. Using the physical parameters, Equation (5) can be written as:
where Q is the discharge and B is the impeller width. Equation (6) can also be used in reverse mode to compute the angle λ required to obtain the required Q for a given ΔH (active mode) or a required ΔH for a given Q (passive mode). The corresponding power can be predicted by estimating the best hydraulic efficiency through the curve in Figure 4. The optimal rotating speed is obtained, for each control device position, by means of the following continuity equation:
where Vr is the velocity ratio corresponding to each specific control device position (Figure 2) and λr is the radiant measure of λ.
An example of the active mode is given by a PRS located immediately before a storage tank and used for discharge regulation. An example of the passive mode is given by a PRS located immediately after a storage tank serving a WDN, where the discharge depends only on the population demand within a large range of pressures and the PRS is used to fix the downstream pressure at a constant value. Finally, observe that the PRS also provides a precise discharge estimation, when used in the passive mode. The quadratic relationship (6), coupled with the relationship represented by Figure 6, allows a very small sensitivity of Q with respect to the ΔH and λ input inside a large range of λ values.
4. PRS Design
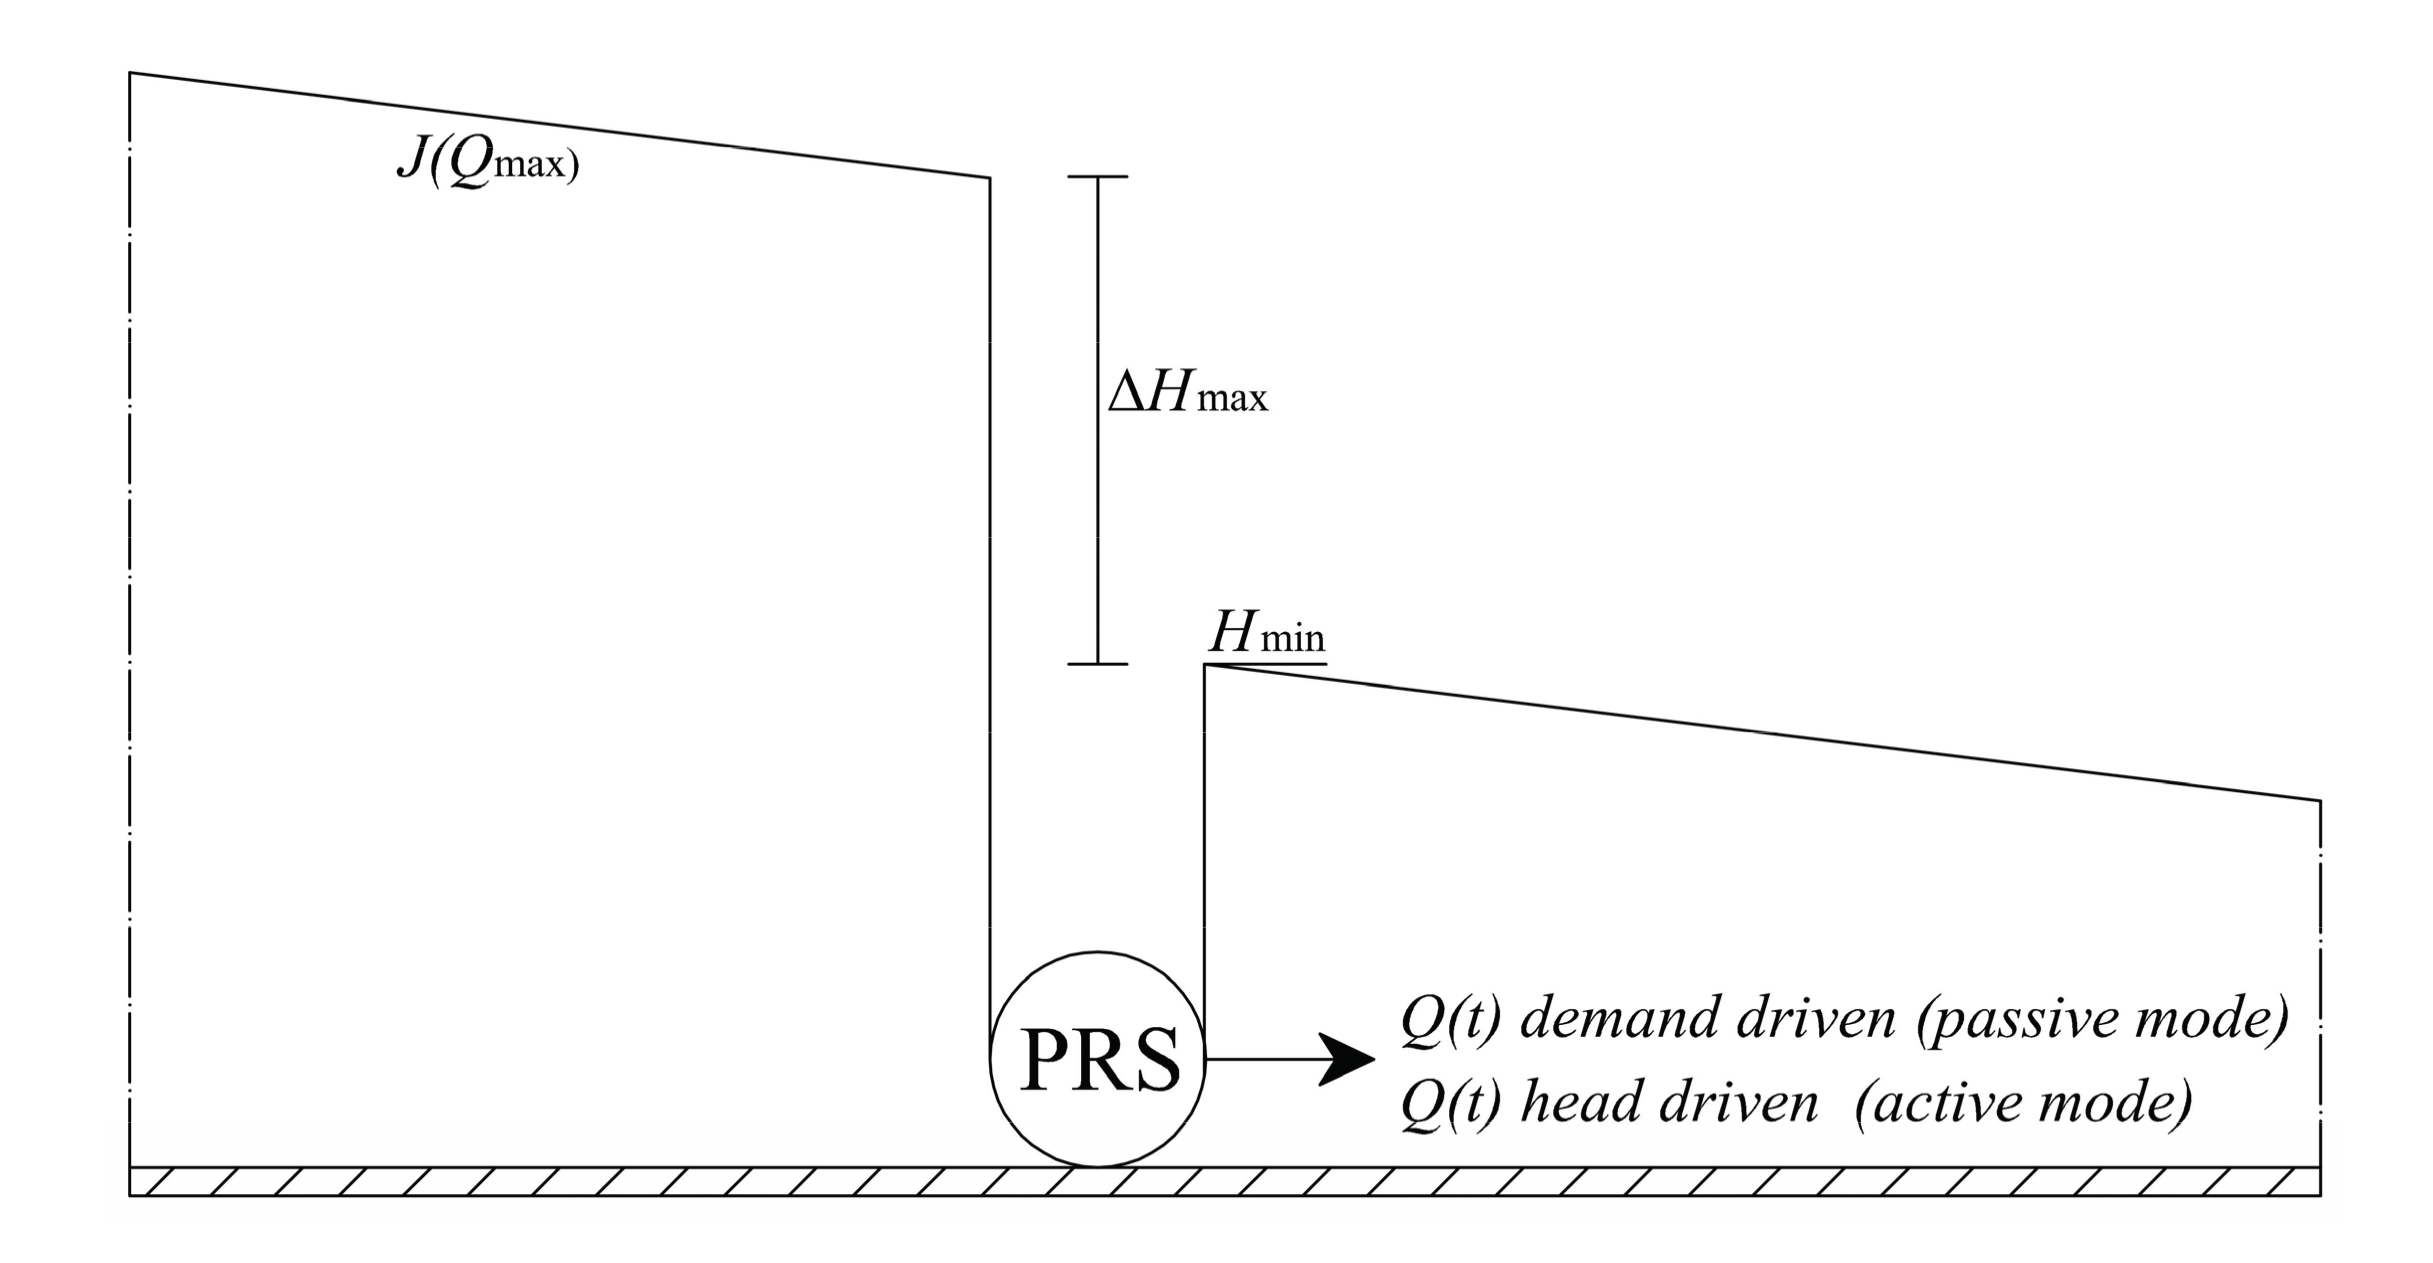
PRS can be designed in both the active and passive modes after setting the design discharge Qd corresponding to the fully open regulating device (λr = λrmax, where λrmax is the radiant measure of the maximum angle) and the corresponding ΔHmax value. If the turbine has to be used in the passive mode, ΔHmax is selected in order to guarantee, for the maximum discharge, a minimum head Hmin after the turbine. In the other case, ΔHmax is selected in order to match, upstream of the turbine, the piezometric level occurring with the maximum discharge (Figure 7).
One of two options must be preliminary chosen. Option 1 is to fix the B/D ratio, where B is the impeller width (see Figure 2), and to compute the corresponding optimal rotational velocity; option 2 is to fix the rotational velocity and compute the B and D parameters in order to obtain the optimal relative velocity 1.7 at the angle λr = λrmax. Although use of an inverter is nowadays quite common and allows regulation of λ for λr values smaller than λrmax, the second option is usually preferred because it allows preliminary selection of the electric generator. Observe that the optimal rotational velocity always increases with the optimal velocity ratio, which decreases with the λ angle. This implies that the ω value corresponding to λr = λrmax is the maximum possible one.
If option 2 is chosen, diameter D is computed by coupling Equation (2) with the relative velocity optimality condition, which provides:
The impeller width B is computed from the mass continuity requirement, that is:
where α is the velocity inlet angle with respect to the tangent direction.
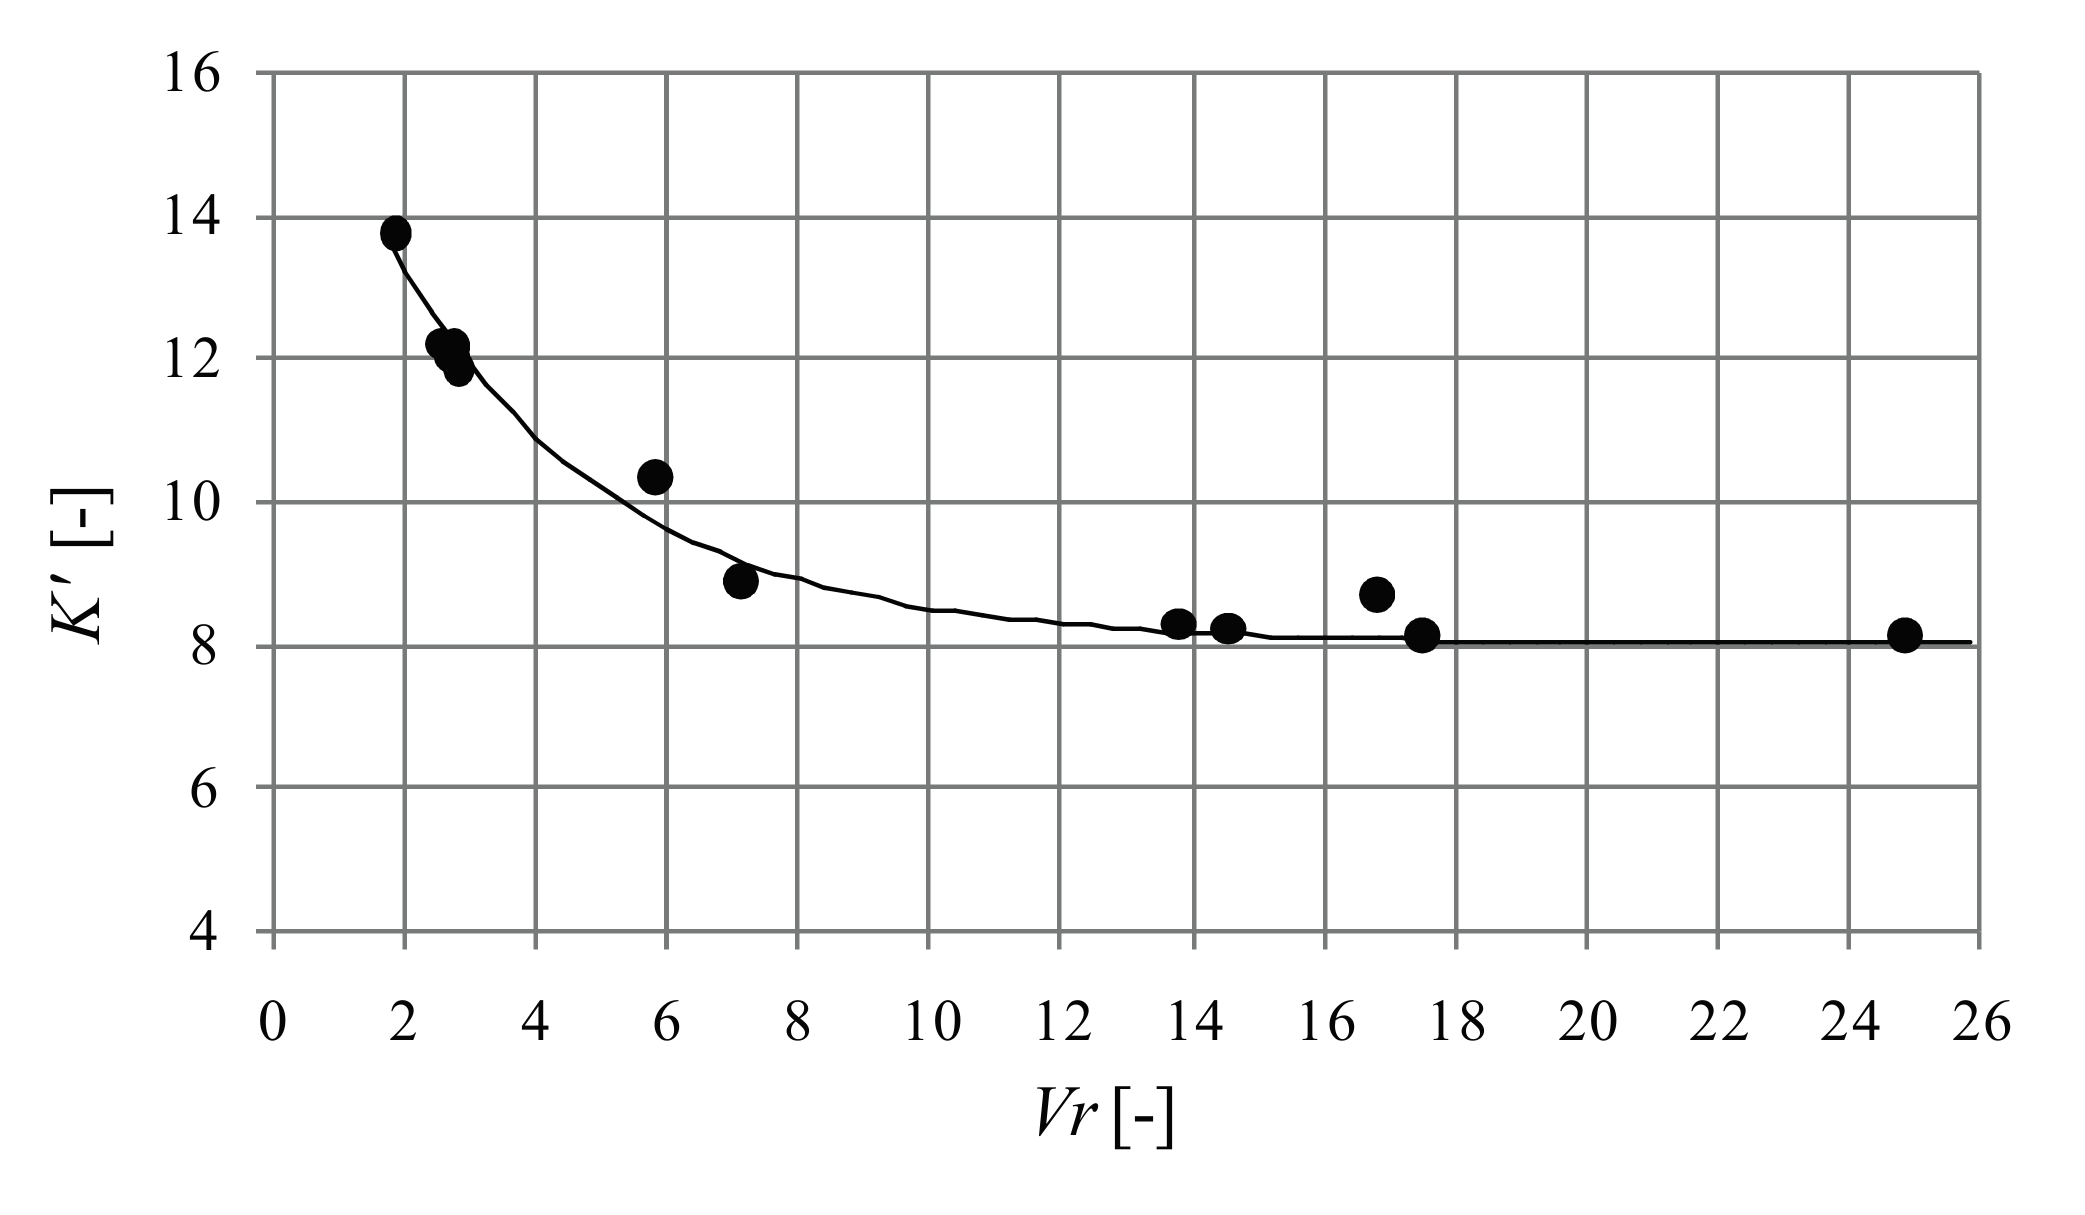
When, in the passive mode, the actual discharge is greater than the design discharge Qd, it is not possible to satisfy Equation (6), because a K corresponding to the required head jump ΔH does not exist for any possible λ and optimal efficiency cannot be saved. In this case, up to a maximum Qmax value, it is still possible to get the same ΔH by reducing the rotational speed. To this end, the authors observed from the numerical simulations that, when λ = λmax, the following quadratic relationship still holds between CH and Cq:
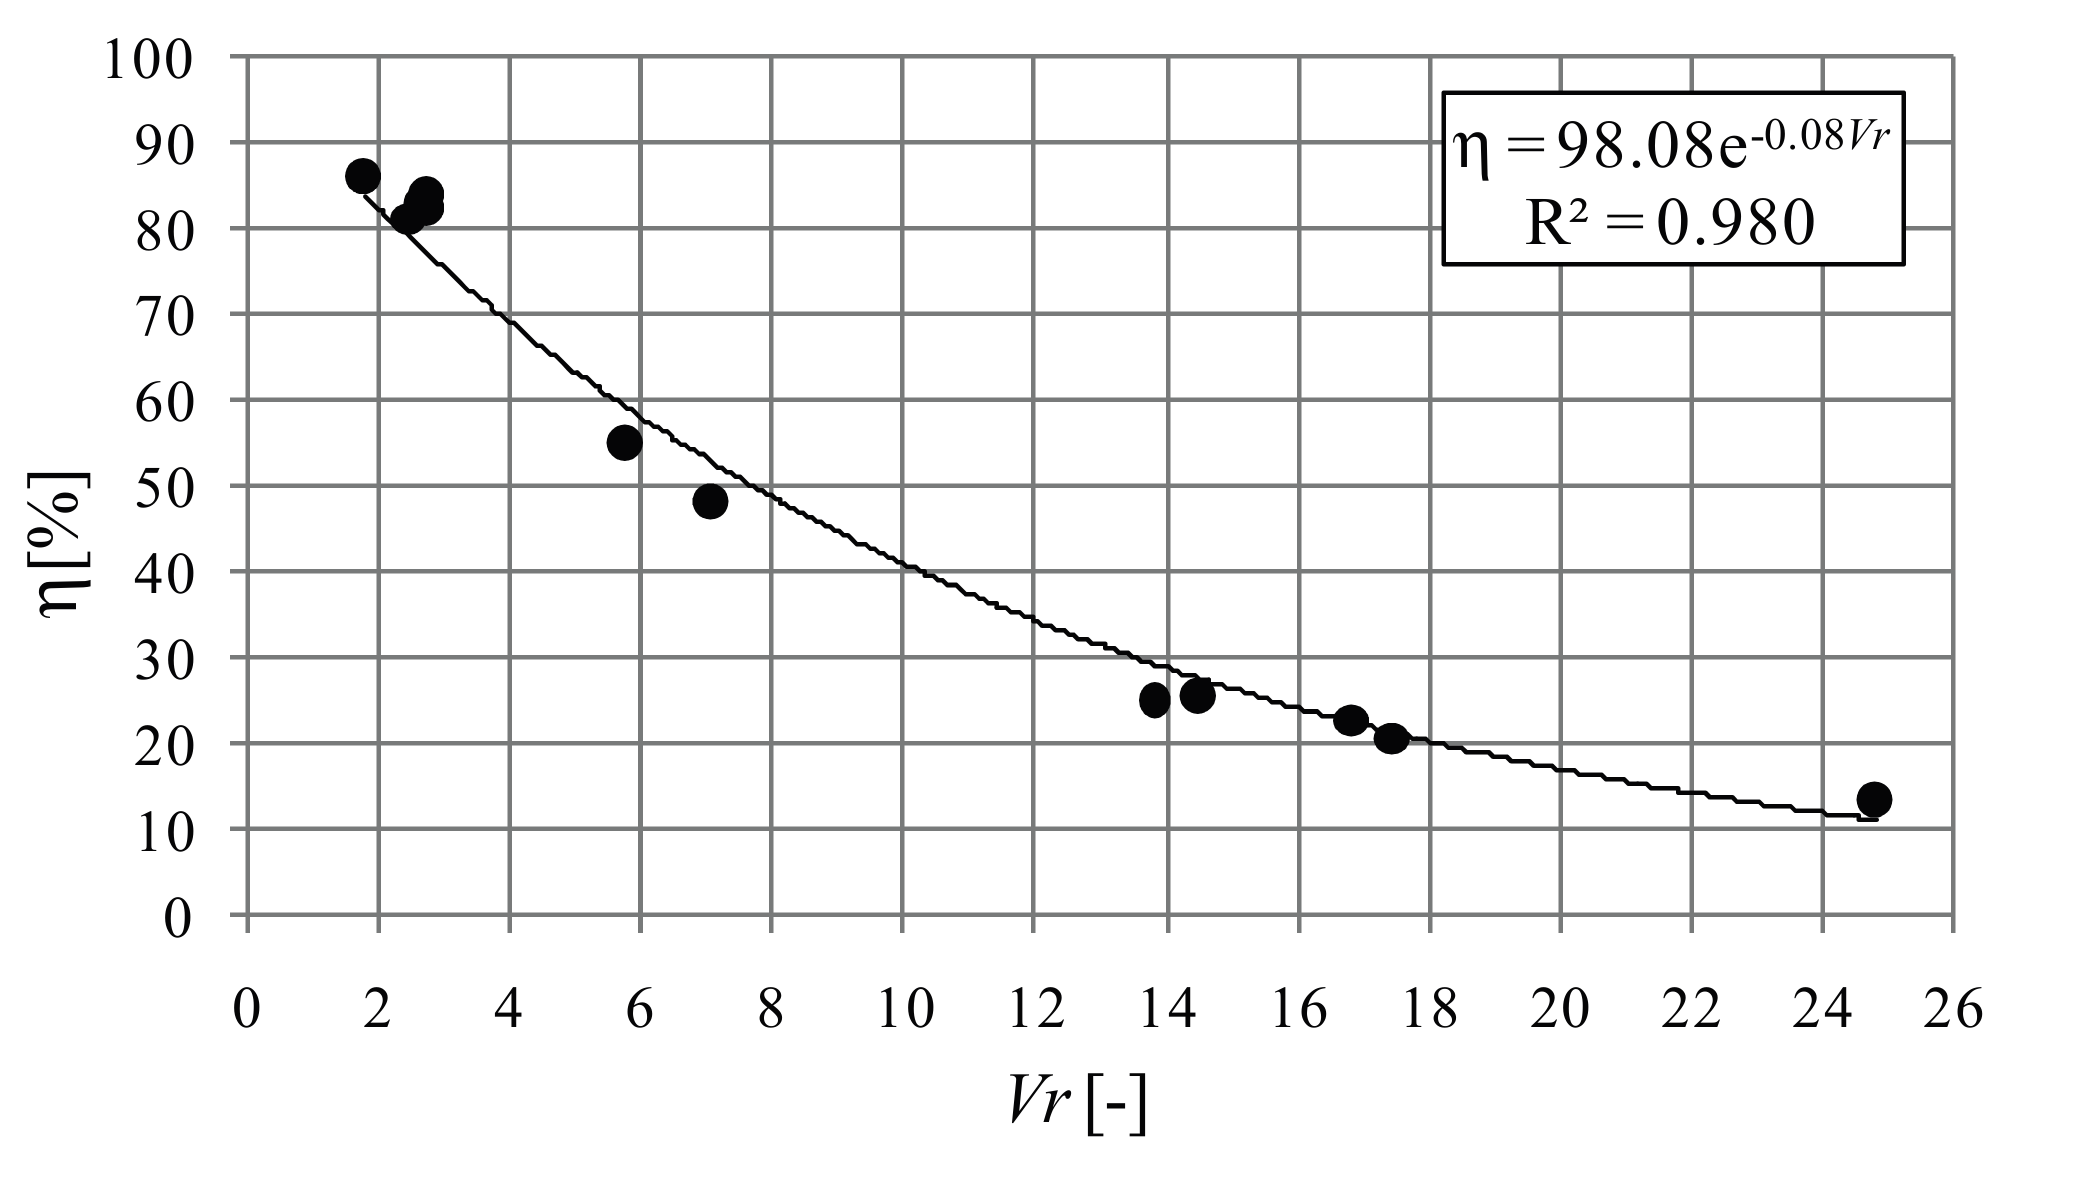
and that the K’ and η(Vr) functions can be interpolated from the computed points inside the range of Vr [1.7,25] as shown in Figures 8 and 9.
Assuming a discharge always smaller than Qmax it is possible to compute, for each candidate design discharge Qd, the corresponding diameter from the system of Equations (2), (8) and (9). For a given diameter, the power produced for each forecasted discharge can then be found by computing first the corresponding ratio , equal to K (Equation (5)) or K’ (Equation (10)) depending on whether condition Q < Qd or Q > Qd holds. The efficiency η and the corresponding power can be computed in the first case from the relationships between η, K and λ represented in Figures 4 and 6, and in the second case from the relationships among η, K’ and Vr represented in Figures 8 and 9. By integrating the estimated power in time and comparing the produced energies, it is finally possible to select the optimal design discharge and the corresponding diameter.
The maximum discharge that can pass through the turbine with a ΔH head jump corresponds to a zero rotational velocity. According to Equation (10), the maximum discharge Qmax allowed by the assigned ΔH can be written as:
where K’, obtained with Vr = ∞, is 8.
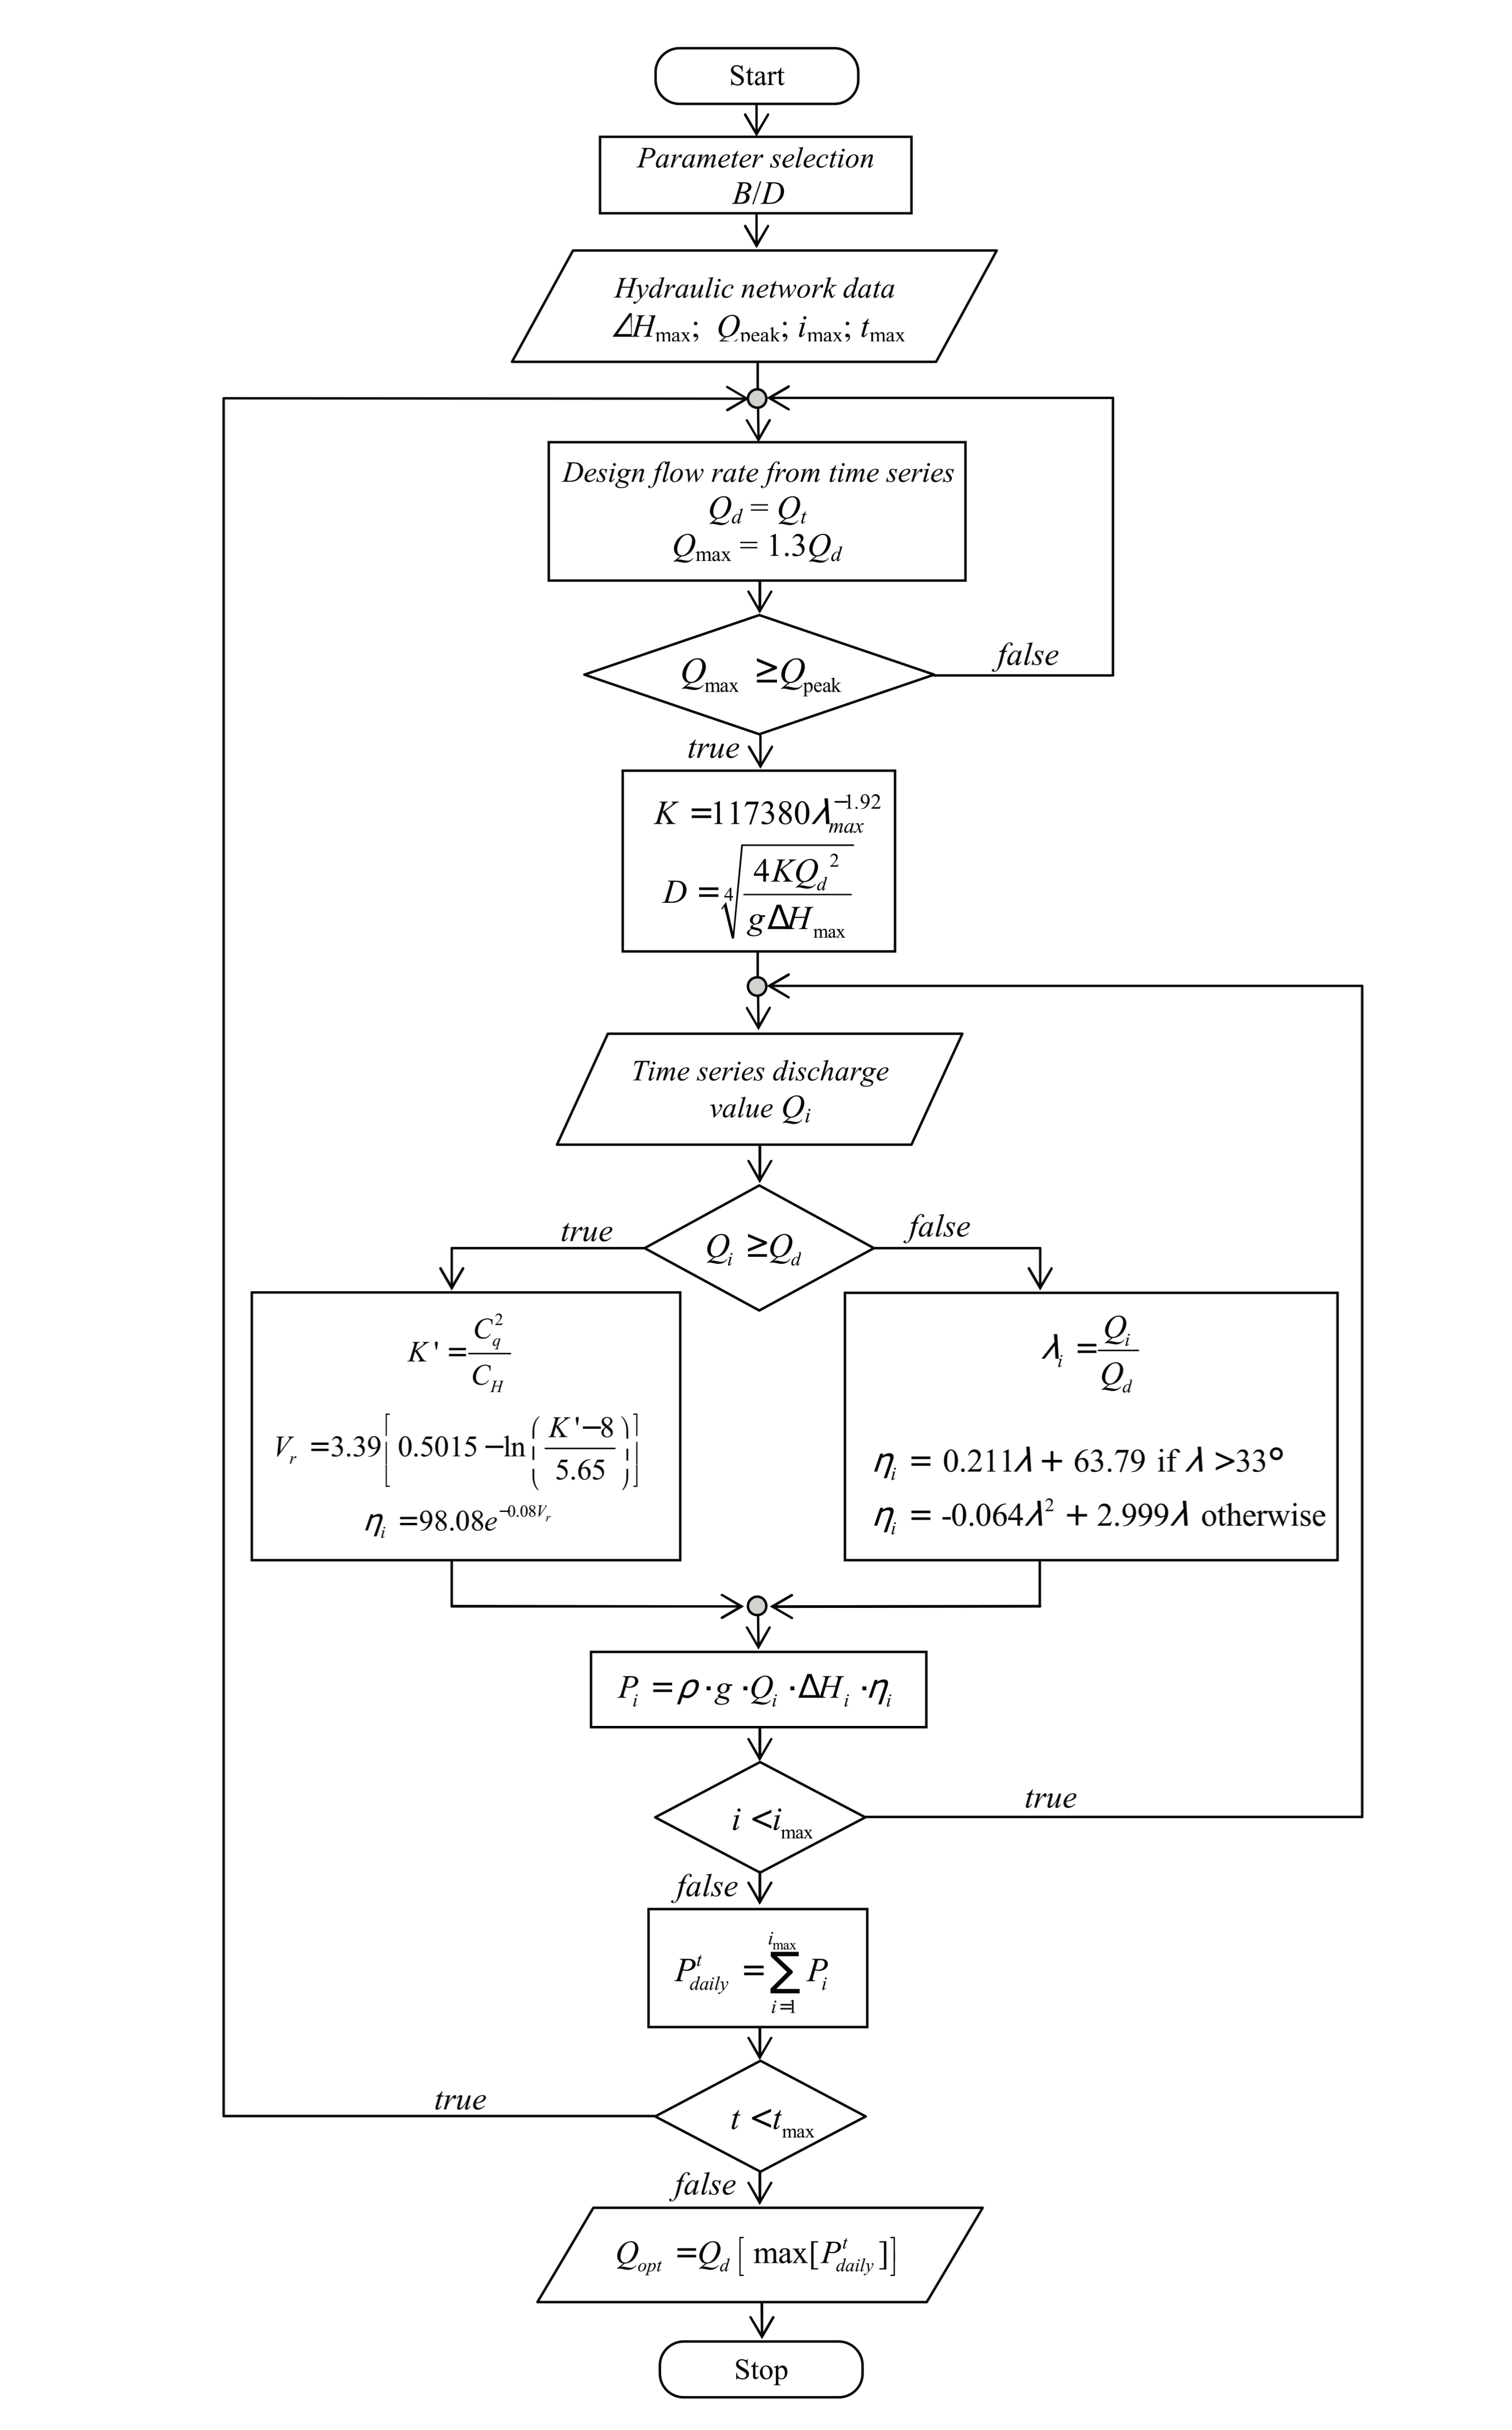
By comparing the two coefficients, K and K’, which corresponds respectively to the design discharge Qd (Figure 6, for λ = λmax) and to the maximum discharge Qmax with the assigned ΔH head jump (Figure 8, for Vr = ∞), we obtain an approximately 1.30 ratio between the maximum and the design discharge. This implies that actual discharges above the design value can be guaranteed by the turbine, with respect to the design head jump value, only in electricity generation disadvantage and up to a maximum value about 1.3 times the design discharge. A flow-chart representing the procedure for the selection of the optimal Qopt design discharge with the passive mode is reported in Figure 10, where Qpeak is the maximum discharge forecasted in the conduit.
The previous design procedure maximizes the energy production assuming the required head jump as a fixed constraint and reliable knowledge of the daily flow time series. A more complex cost/benefit analysis is required if either one of these two hypothesis is relaxed.
5. The Oreto-Stazione Study Case
In this section the authors investigate the economic benefit of installing a PRS in a real water distribution network. The case study is a District Metered Area named Oreto-Stazione and is shown in Figure 11, part of the larger Water Distribution Network of Palermo town (Italy). The entire network, rebuilt in the year 2002, is made of High Density PolyEthylene (HDPE) and is about 38 km long. The network was designed to supply about 400 L/capita/day, and for this purpose the pipe diameter is in the range of 110–225 mm. However, the network is oversized compared to the current consumption of 260 L/capita/day [26].
In this case study, the network inlet node is connected to one reservoir, located at an altitude of 88.5 m above sea level, named ‘San Ciro Alto’, through one cast-iron pipeline with a 500 mm diameter. In order to reduce the hydraulic head under normal operating conditions, at the present time a PRV is installed along the adduction pipeline immediately before the inlet node (Figure 11).
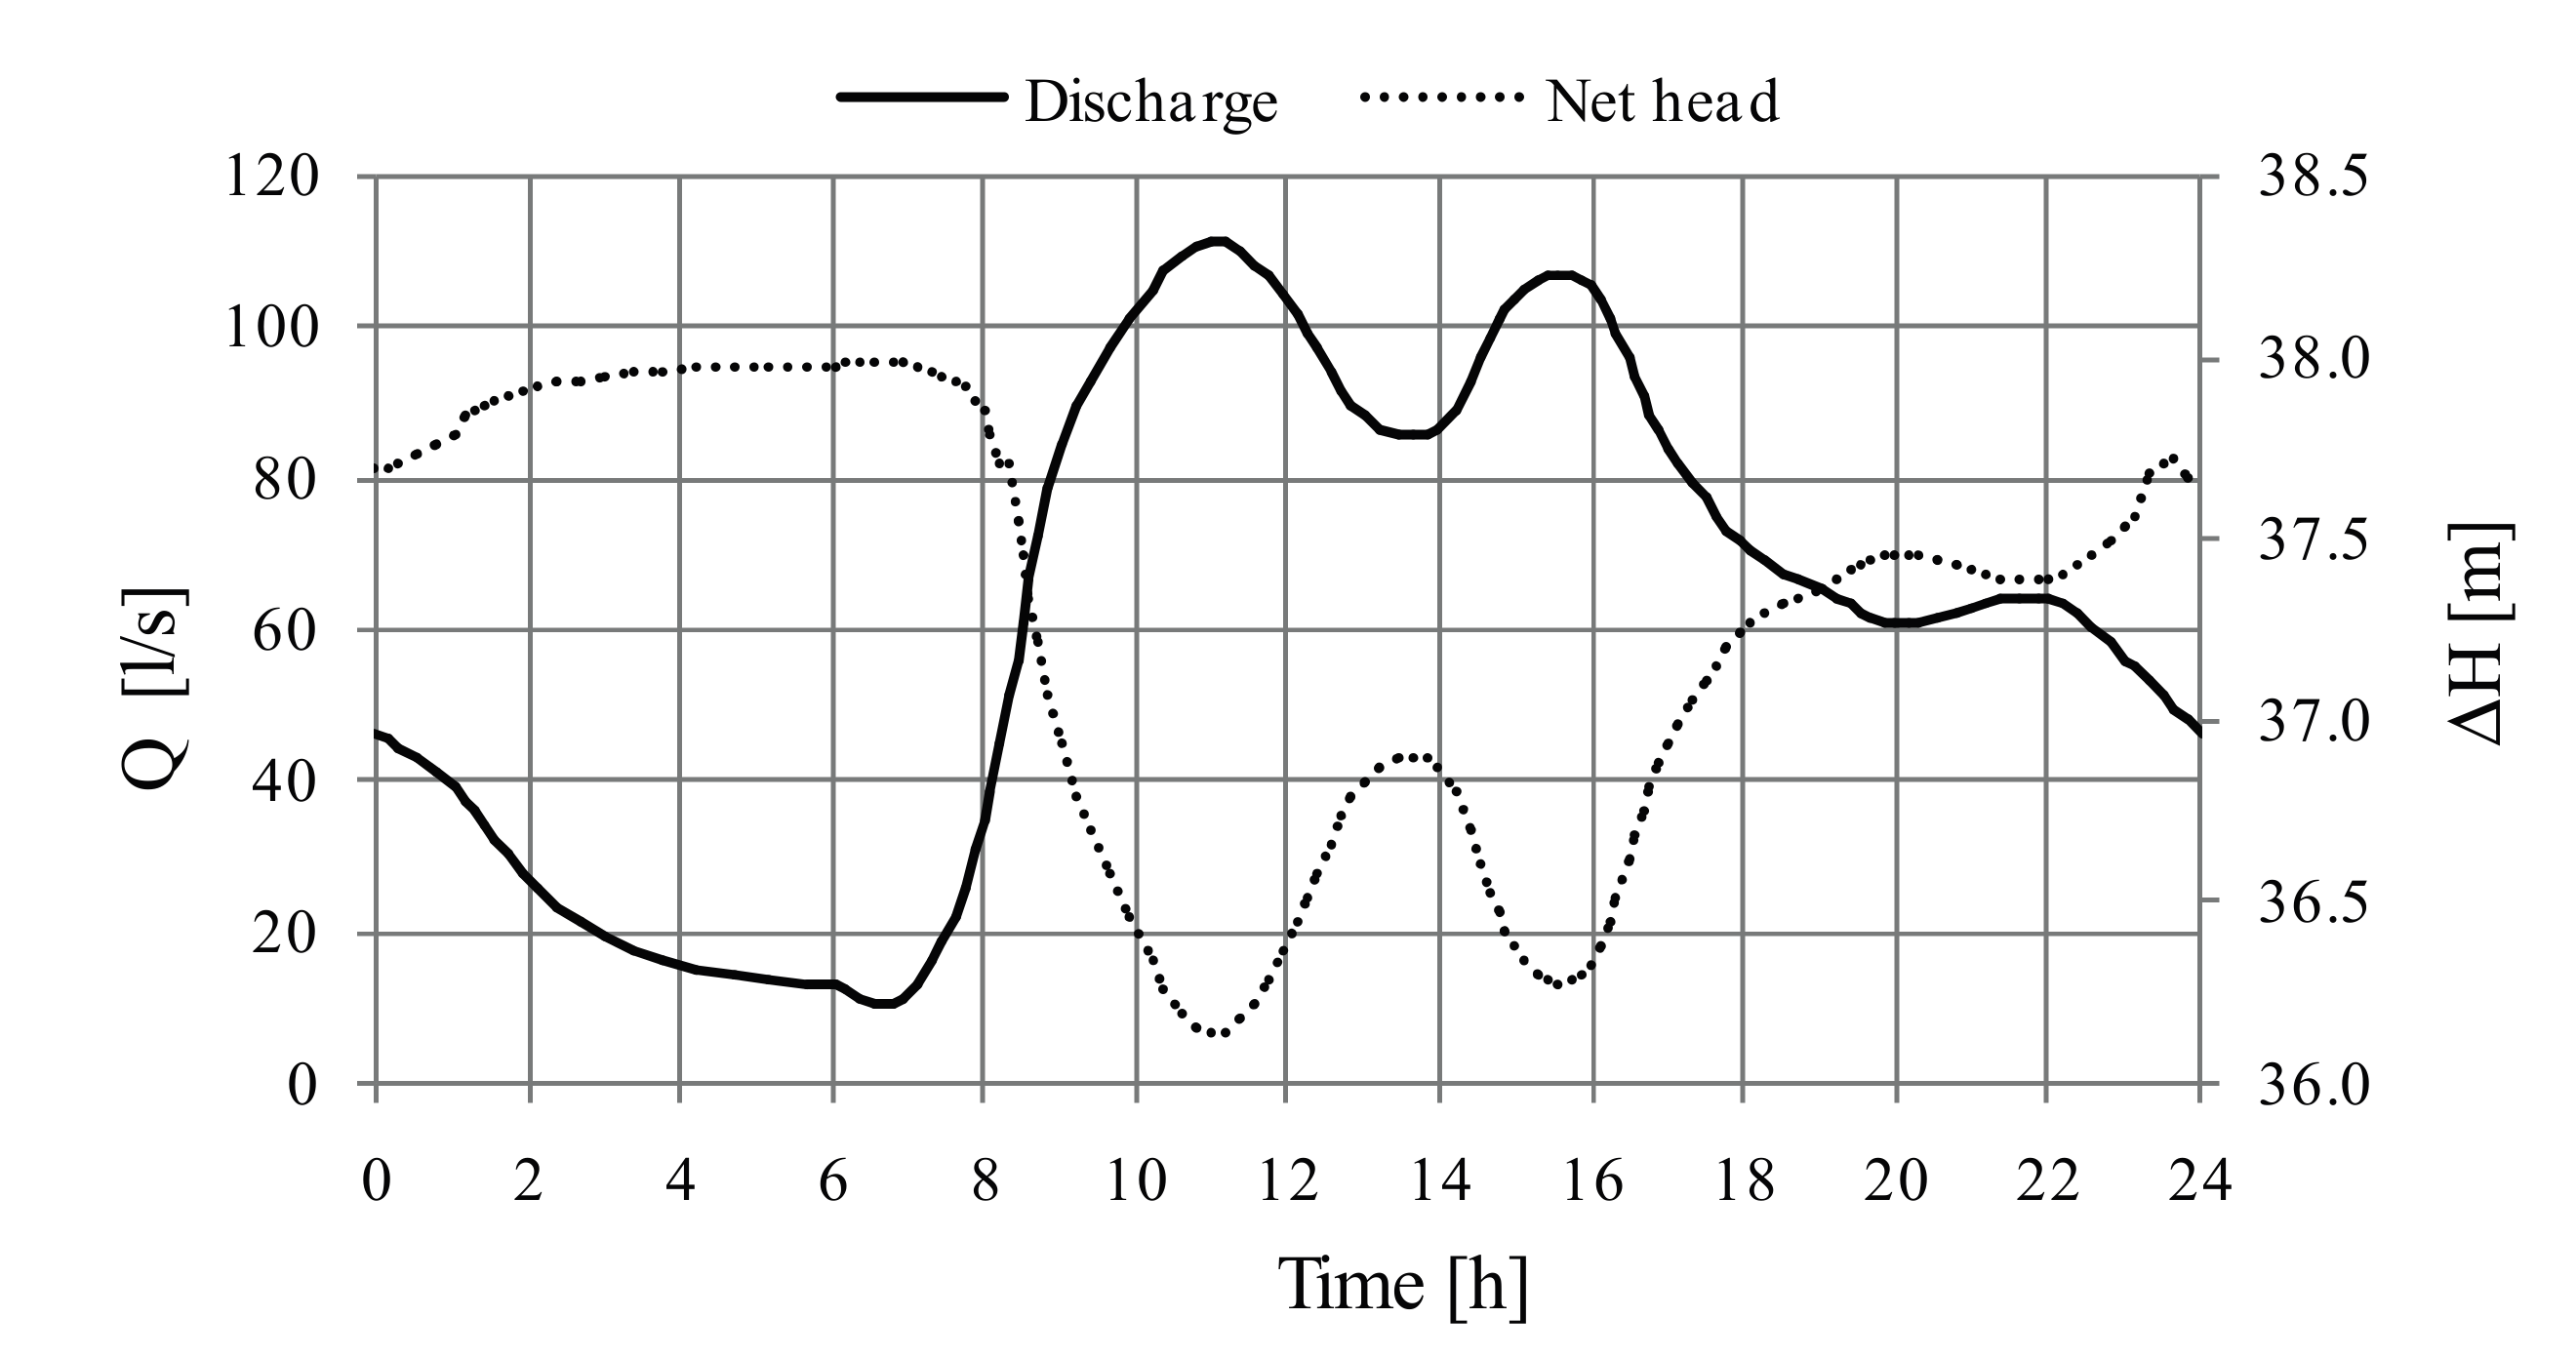
In a previous study [27], the WDN was numerically modeled, in order to evaluate the net head dissipation provided by the PRV over 24 h. The calculated dissipation guarantees the minimum and maximum hydraulic head value to be respected for most hydraulically disadvantaged users. The input discharge varies between 10 L/s and 110 L/s and the net head varies between 36 m and 38 m. Figure 12 shows the daily discharge into the inlet node and the net head available for hydroelectric production. Observe that the net head is almost constant despite the large variability of the discharge, due to the large diameter of the adduction pipeline.
In this test case, a PRS is installed at the inlet of the network (Figure 11) and is used in the passive mode, with a constant ΔHmax equal to 38 m. Assuming a B/D ratio of 0.5, it is possible to select the optimum discharge value for the impeller diameter D designed according to the procedure described in the previous section, with the discharge time series shown in Figure 12. The design flow rate Qd that maximizes the yearly production is equal to 106.68 L/s. The impeller diameter, computed with a maximum rotating speed of 1000 rpm, is 204 mm. Assuming a constant electrical and mechanical efficiency of 0.93, the corresponding daily production, computed by integrating over all the day the power provided by each pair of network operating values, Qi and ΔHi (Figure 12), is 388.31 kWh (Figure 13). Because the total daily available energy is 592.5 kWh, it follows that the designed PRS provides an average efficiency equal to 65.5%, while maintaining the assigned service level of the water network. Assuming an electricity price of 0.2 €/kWh and a continuous service for 350 days per year the economic benefit is 27.181 €/year.
The Oreto-Stazione network is served at the present time by an oversized pipeline, due to a forecasted increased consumption. The simulation of PRS electricity production shows how this oversizing is able to provide a non-negligible economic benefit. The construction and installation cost of the PRS, in the present case study, was estimated to be about 60,000€, corresponding to almost a two year Simply Payback Time (SPB).
Observe that the optimal design discharge is only slightly smaller than the historical peak value, Qpeak = 110.83 L/s, and makes it possible to convey discharges up to the maximum value of Qmax = 138 L/s, much higher than the historical peak value.
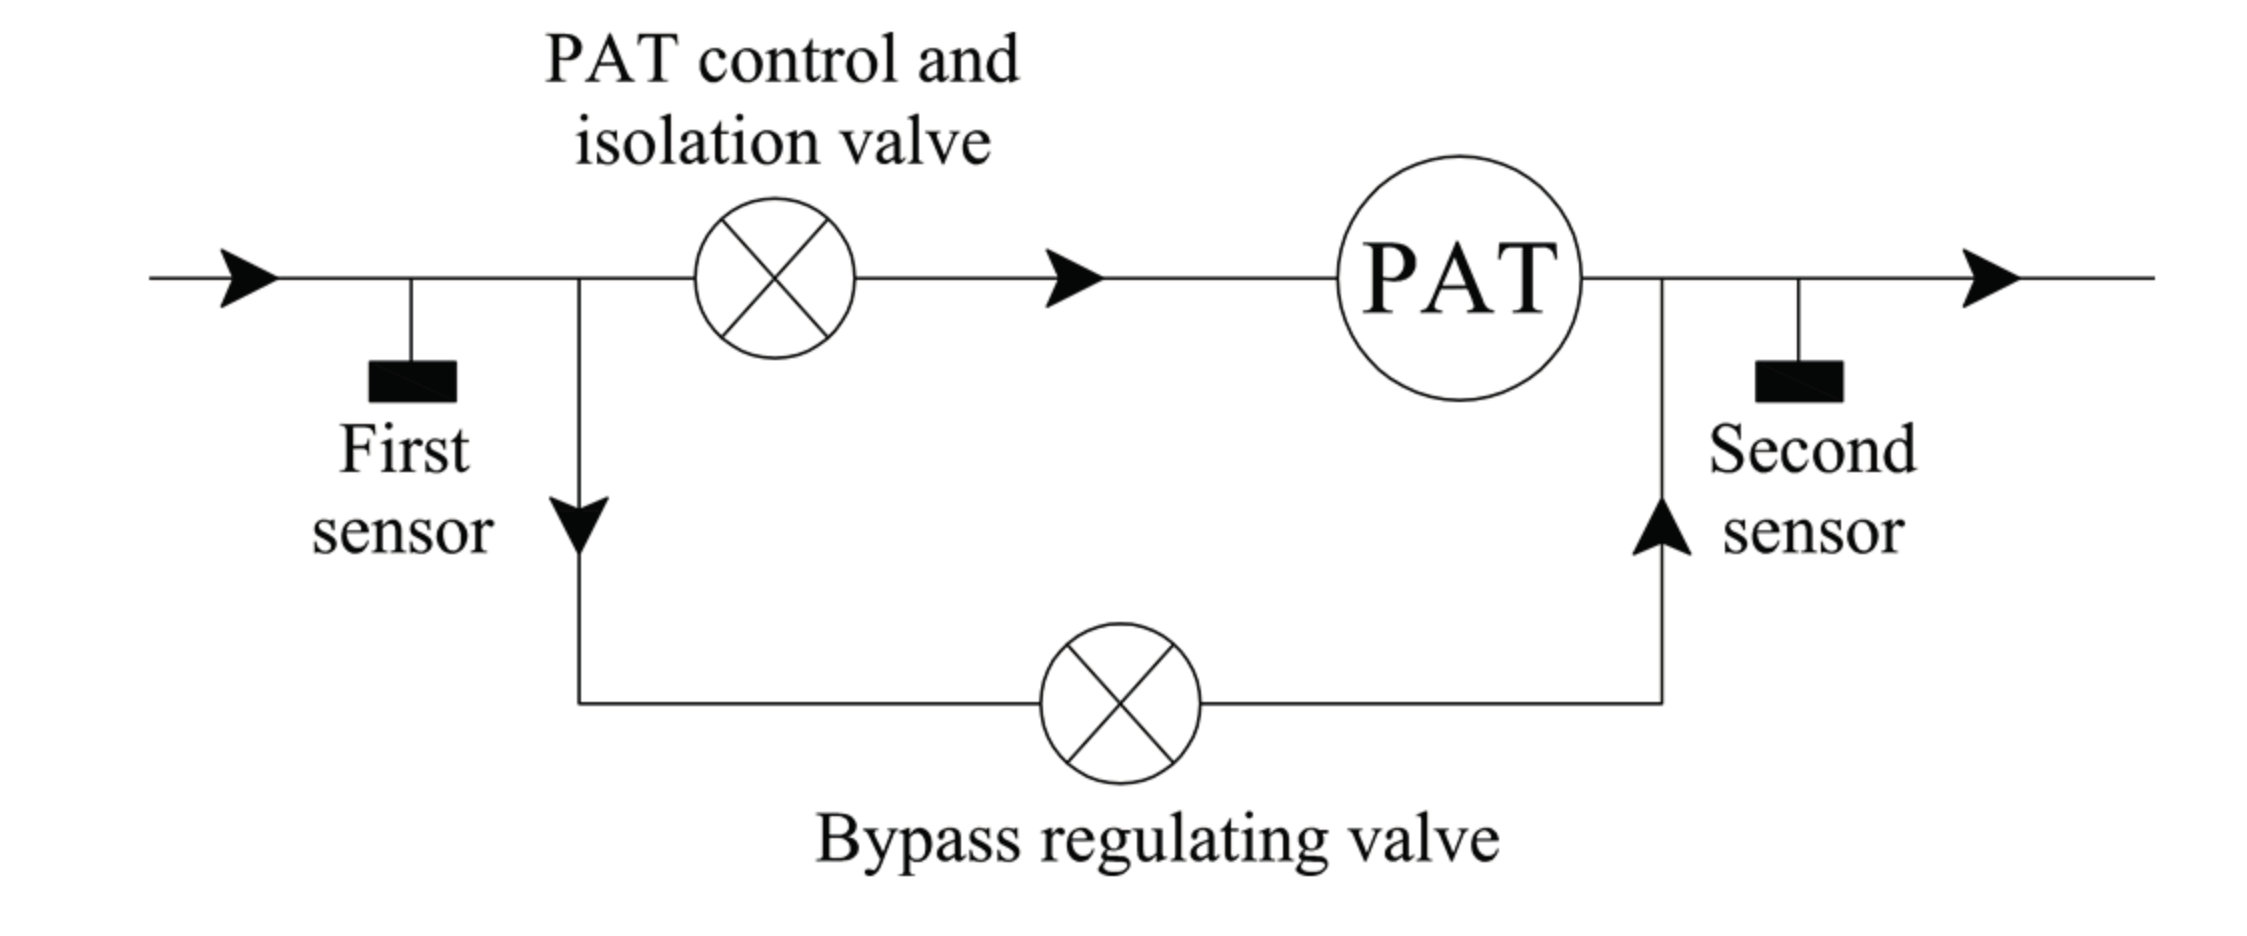
The same case study, in previous work [27], was used to evaluate the economic benefit of installing an energy production device in the inlet node. The planned device was composed by a centrifugal PAT, an inline control valve and a bypass regulating valve (Figure 14) and the best solution investigated converted 47.8% of the available energy. The comparison of the performances of the two control systems shows that the PRS is likely to be a better choice, not only because of the higher average efficiency in the hydropower production, but also because the PRS includes in a single device the functions of the control valve and the bypass regulating valve. This implies a strong reduction of the machinery costs, as well as of the required space (Figure 15).
An open question is the net benefit of installing the inverter in order to regulate the rotational velocity of the impeller [28]. In the test case, the predicted variability of the rotational velocity of the designed turbine is between 0 rpm and 1000 rpm. Installing a machine without an inverter, designed for the peak discharge value and keeping a constant rotational velocity of 1000 rpm, would have implied a revenue reduction of only 220€ per year. In this case, the Qmax value without any head jump increment can still be obtained by switching off the turbine and by stopping the impeller with the use of a simple mechanical brake.
6. Conclusions
The dissipation nodes in water urban districts or in water transport conduits are often characterized by large variability in flow rate and head drop. This variability discourages the water companies from installing micro turbines, which usually have to be installed along with a bypass, and added to PRVs, discharge meters or other metering and control devices. The new proposed device, named PRS, provides high efficiency and low construction costs, along with the capability of performing pressure control and discharge metering while producing electrical power.
The previous analysis, applied to the data available for the Oreto-Stazione network, in the city of Palermo, showed that PRS installation can provide interesting economic benefit for network management in urban areas and should be included as a possible decision variable in optimal network design, and also as an alternative option to PRVs or open water tanks.
Structural and mechanical optimization, as well as extensive field testing, are in order to achieve a full availability of the proposed device.
Author Contributions
All the authors discussed the conceptual model. Tullio Tucciarelli supervised the development of the model algorithm. Marco Sinagra wrote the source code for PRS design and took care of model testing, Vincenzo Sammartano performed the CFD simulations and Gabriele Morreale conceived and designed the case study.
Conflicts of Interest
The authors declare no conflict of interest.
Abbreviations
The following abbreviations are used in this manuscript:
| α | angle of attack |
| B | impeller width |
| CH | head coefficient |
| Cp | power coefficient |
| Cq | discharge coefficient |
| Cv | discharge coefficient |
| D | impeller diameter |
| ΔH | head jump |
| ΔHmax | maximum head jump |
| e | 2.718281828 |
| g | gravitational acceleration |
| Hinlet | head upstream the turbine |
| η | hydraulic efficiency |
| imax | length of the time series |
| J | energy slope |
| K | impeller angle coefficient |
| K’ | velocity ratio coefficient |
| λ | inlet impeller angle [degree] |
| λmax | maximum inlet impeller angle [degree] |
| λr | inlet impeller angle [radiant] |
| λrmax | maximum inlet impeller angle [radiant] |
| P | daily electrical production |
| p | output mechanical power per unit width |
| Q | discharge |
| Qd | design discharge |
| Qi | ith discharge value of the time series |
| Qmax | maximum PRS discharge |
| Qpeak | maximum flow rate of the time series |
| Qt | discharge value at time t |
| q | discharge per unit width |
| R | impeller radius |
| tmax | maximum time of the time series |
| ρ | water density |
| Vr | velocity ratio |
| Vropt | optimal velocity ratio |
| ω | rotational velocity |
| ωopt | optimal rotational velocity |
| ξ | inlet velocity parameter |
References
- Nazif, S.; Karamouz, M.; Tabesh, M.; Moridi, A. Pressure Management Model for Urban Water Distribution Networks. Water Resour. Manag. 2010, 24, 437–458. [Google Scholar] [CrossRef]
- Araujo, L.; Ramos, H.; Coelho, S. Pressure control for leakage minimization in water distribution systems management. Water Resour. Manag. 2006, 20, 133–149. [Google Scholar] [CrossRef]
- Almandoz, J.; Cabrera, E.; Arregui, F.; Cabrera, E.; Cobacho, R. Leakage Assessment through Water Distribution Network Simulation. J. Water Res. 2005, 131, 458–466. [Google Scholar] [CrossRef]
- Tucciarelli, T.; Criminisi, A.; Termini, D. Leak Analysis in Pipeline Systems by Means of Optimal Valve Regulation. J. Hydraul. Eng. 1999, 125, 277–285. [Google Scholar] [CrossRef]
- Prescott, S.; Ulanicki, B. Improved Control of Pressure Reducing Valves in Water Distribution Networks. J. Hydraul. Eng. 2008, 134, 56–65. [Google Scholar] [CrossRef]
- Sammartano, V.; Morreale, G.; Sinagra, M.; Collura, A.; Tucciarelli, T. Experimental study of cross-flow micro-turbines for aqueduct energy recovery. Procedia Eng. 2014, 89, 540–547. [Google Scholar] [CrossRef]
- Chapallaz, J.; Eichenberger, P.; Fischer, G. Manual on Pumps Used As Turbines; Deutsches Zentru fur Entwicklungstechnologien, GATE: Eschborn, Germany, 1992. [Google Scholar]
- Ramos, H.; Covas, D.; Araujo, L.; Mello, M. Available Energy Assessment in Water Supply Systems; XXXI IAHR Congress: Seoul, Korea, 2005. [Google Scholar]
- Ramos, H.; Mello, M.; De, P. Clean power in water supply systems as a sustainable solution: From planning to practical implementation. Water Sci. Technol. 2010, 10, 39–49. [Google Scholar] [CrossRef]
- Khosrowpanah, S.; Albertson, M.; Fiuzat, A. Historical overview of Cross-Flow turbine. Int. Water Power Dam Constr. 1984, 36, 38–43. [Google Scholar]
- Fiuzat, A.; Akerkar, B. Power Outputs of Two Stages of Cross-Flow Turbine. J. Energy Eng. 1991, 117, 57–70. [Google Scholar] [CrossRef]
- Desai, V.; Aziz, N. Power Outputs of Two Stages of Cross-Flow Turbine. J. Fluids Eng. 1994, 116, 545–550. [Google Scholar] [CrossRef]
- Sammartano, V.; Aricò, C.; Sinagra, M.; Tucciarelli, T. Cross-Flow Turbine Design for Energy Production and Discharge Regulation. J. Hydraul. Eng. 2014, 141, 04014083. [Google Scholar] [CrossRef]
- Singh, P.M.; Chen, Z.; Hwang, Y.; Kang, M.; Choi, Y. Performance characteristic investigation and stay vane effect on Ns100 inline francis turbine. J. Korean Soc. Mar. Eng. 2016, 40, 397–402. [Google Scholar] [CrossRef]
- Fontana, N.; Giugni, M.; Portolano, D. Losses Reduction and Energy Production in Water-Distribution Networks. J. Water Res. Plan. Manag. 2012, 138, 237–244. [Google Scholar] [CrossRef]
- Fecarotta, O.; Aricò, C.; Carravetta, A.; Martino, R.; Ramos, H.M. Hydropower Potential in Water Distribution Networks: Pressure Control by PATs. Water Res. Manag. 2014, 29, 699–714. [Google Scholar] [CrossRef]
- Fecarotta, O.; Carravetta, A.; Ramos, H.M.; Martino, R. An improved affinity model to enhance variable operating strategy for pumps used as turbines. J. Hydr. Res. 2016, 54, 332–341. [Google Scholar] [CrossRef]
- De Marchis, M.; Milici, B.; Volpe, R.; Messineo, A. Energy Saving in Water Distribution Network through Pump as Turbine Generators: Economic and Environmental Analysis. Energies 2016, 9, 877. [Google Scholar] [CrossRef]
- Samora, I.; Hasmatuchi, V.; Münch-Alligné, C.; Franca, M.J.; Schleiss, A.J.; Ramos, H.M. Experimental characterization of a five blade tubular propeller turbine for pipe inline installation. Renew. Energy 2016, 95, 356–366. [Google Scholar] [CrossRef]
- Samora, I.; Manso, P.; Franca, M.J.; Schleiss, A.J.; Ramos, H.M. Energy recovery using micro-hydropower technology in water supply systems: The case study of the city of Fribourg. Water 2016, 8, 344. [Google Scholar] [CrossRef]
- Carravetta, A.; Del Giudice, G.; Fecarotta, O.; Ramos, H. PAT Design Strategy for Energy Recovery in Water Distribution Networks by Electrical Regulation. Energies 2013, 6, 411–424. [Google Scholar] [CrossRef]
- Sammartano, V.; Sinagra, M.; Filianoti, P.; Tucciarelli, T. A Banki-Michell turbine for in-line hydropower systems. J. Hydr. Res. 2017, in press. [Google Scholar]
- Sinagra, M.; Sammartano, V.; Aricò, C.; Collura, A. Experimental and Numerical Analysis of a Cross-Flow Turbine. J. Hydraul. Eng. 2015, 142, 04015040. [Google Scholar] [CrossRef]
- Sammartano, V.; Sinagra, M.; Morreale, G.; Filianoti, P.; Tuccarelli, T. Banki-Michell micro-turbines for energy production in water distribution networks. In Proceedings of the 4th European IAHR Conference, Liedge, Belgium, 27–29 July 2016. [Google Scholar]
- Simpson, A.R.; Marchi, A. Evaluating the approximation of the affinity laws and improving the efficiency estimate for variable speed pumps. J. Hydr. Eng. 2013, 139, 1314–1317. [Google Scholar] [CrossRef]
- De Marchis, M.; Fontanazza, C.; Freni, G.; La Loggia, G.; Napoli, E.; Notaro, V. Analysis of the impact of intermittent distribution by modelling the network-filling process. J. Hydroinf. 2011, 13, 358–373. [Google Scholar] [CrossRef]
- Carravetta, A.; Fecarotta, O.; Sinagra, M.; Tucciarelli, T. Cost-Benefit Analysis for Hydropower Production in Water Distribution Networks by a Pump as Turbine. J. Water Resour. Plann. Manag. 2014, 140, 04014002. [Google Scholar] [CrossRef]
- Sammartano, V.; Filianoti, P.; Sinagra, M.; Tucciarelli, T.; Scelba, G.; Morreale, G. Coupled Hydraulic and Electronic Regulation of Cross-Flow Turbines in Hydraulic Plants. J. Hydraul. Eng. 2017, 143, 04016071. [Google Scholar] [CrossRef]
Figure 1.
Vertical section of a pressurized Cross-Flow turbine.

Figure 2.
Scheme of the turbine nozzle, impeller and diffuser.

Figure 3.
Optimal relative velocity versus λ angle.
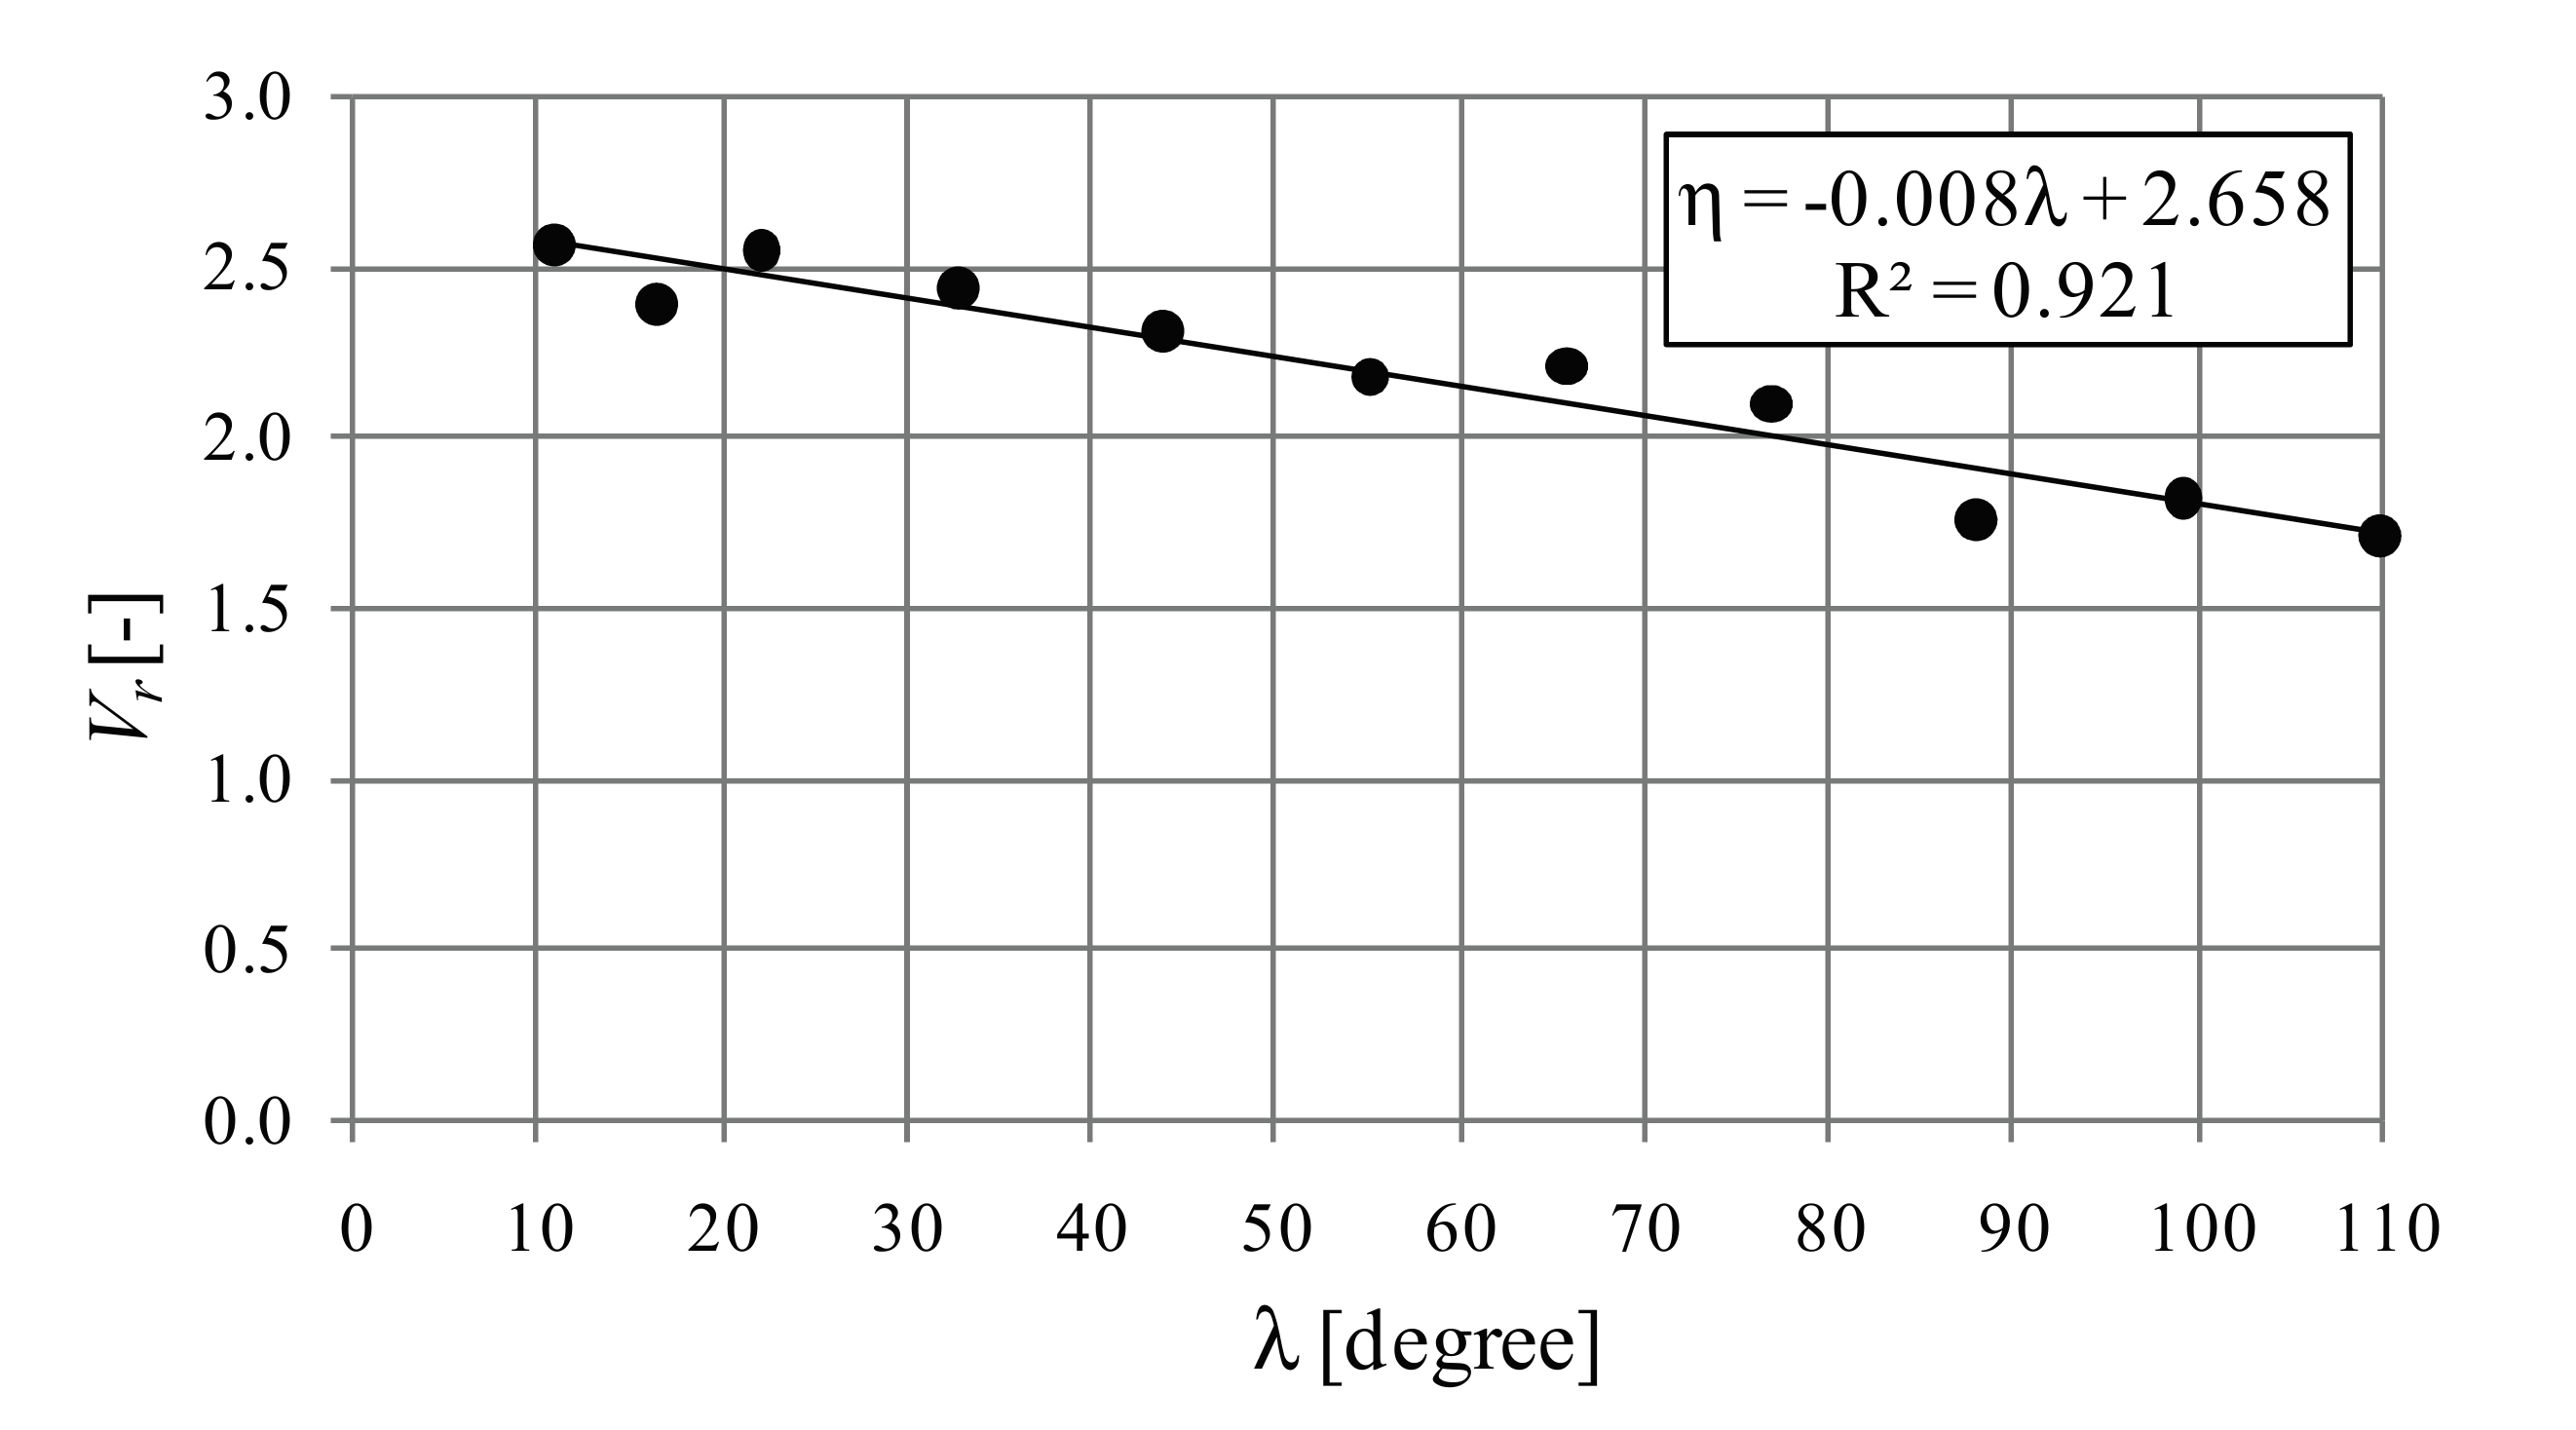
Figure 4.
Best hydraulic efficiency versus λ angle.
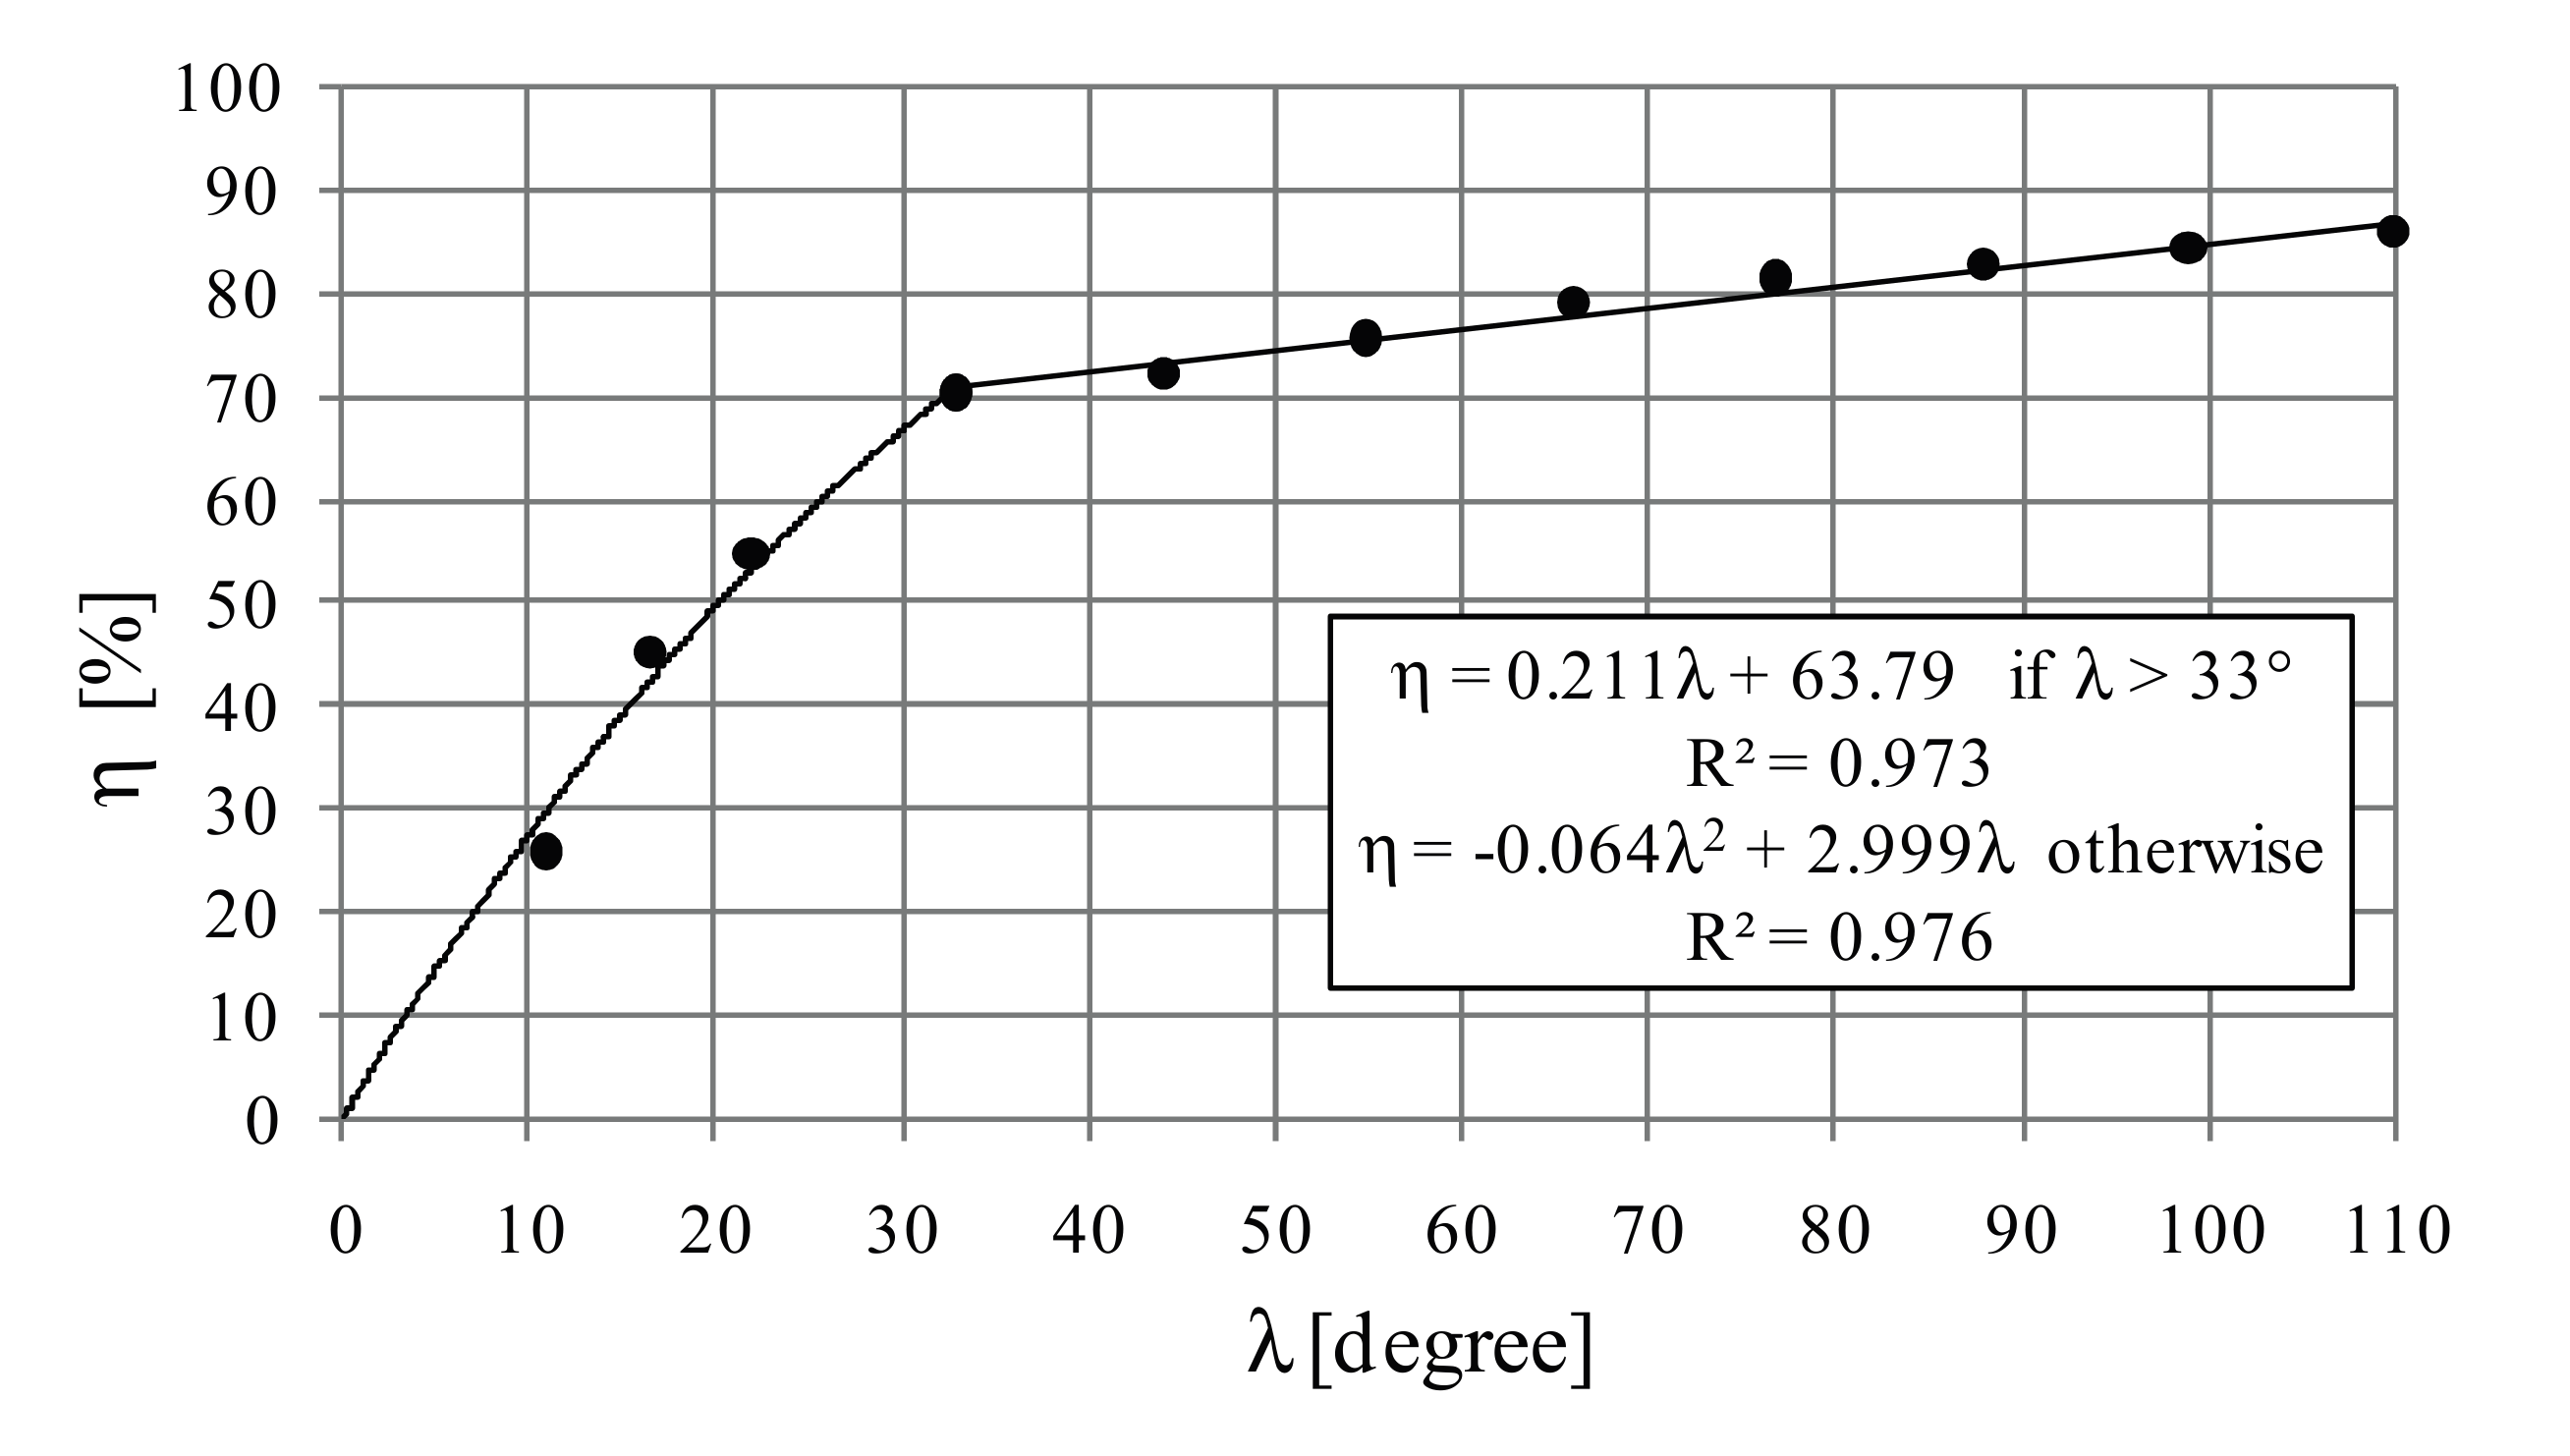
Figure 5.
(CH,Cq) points computed using the two reference turbines.

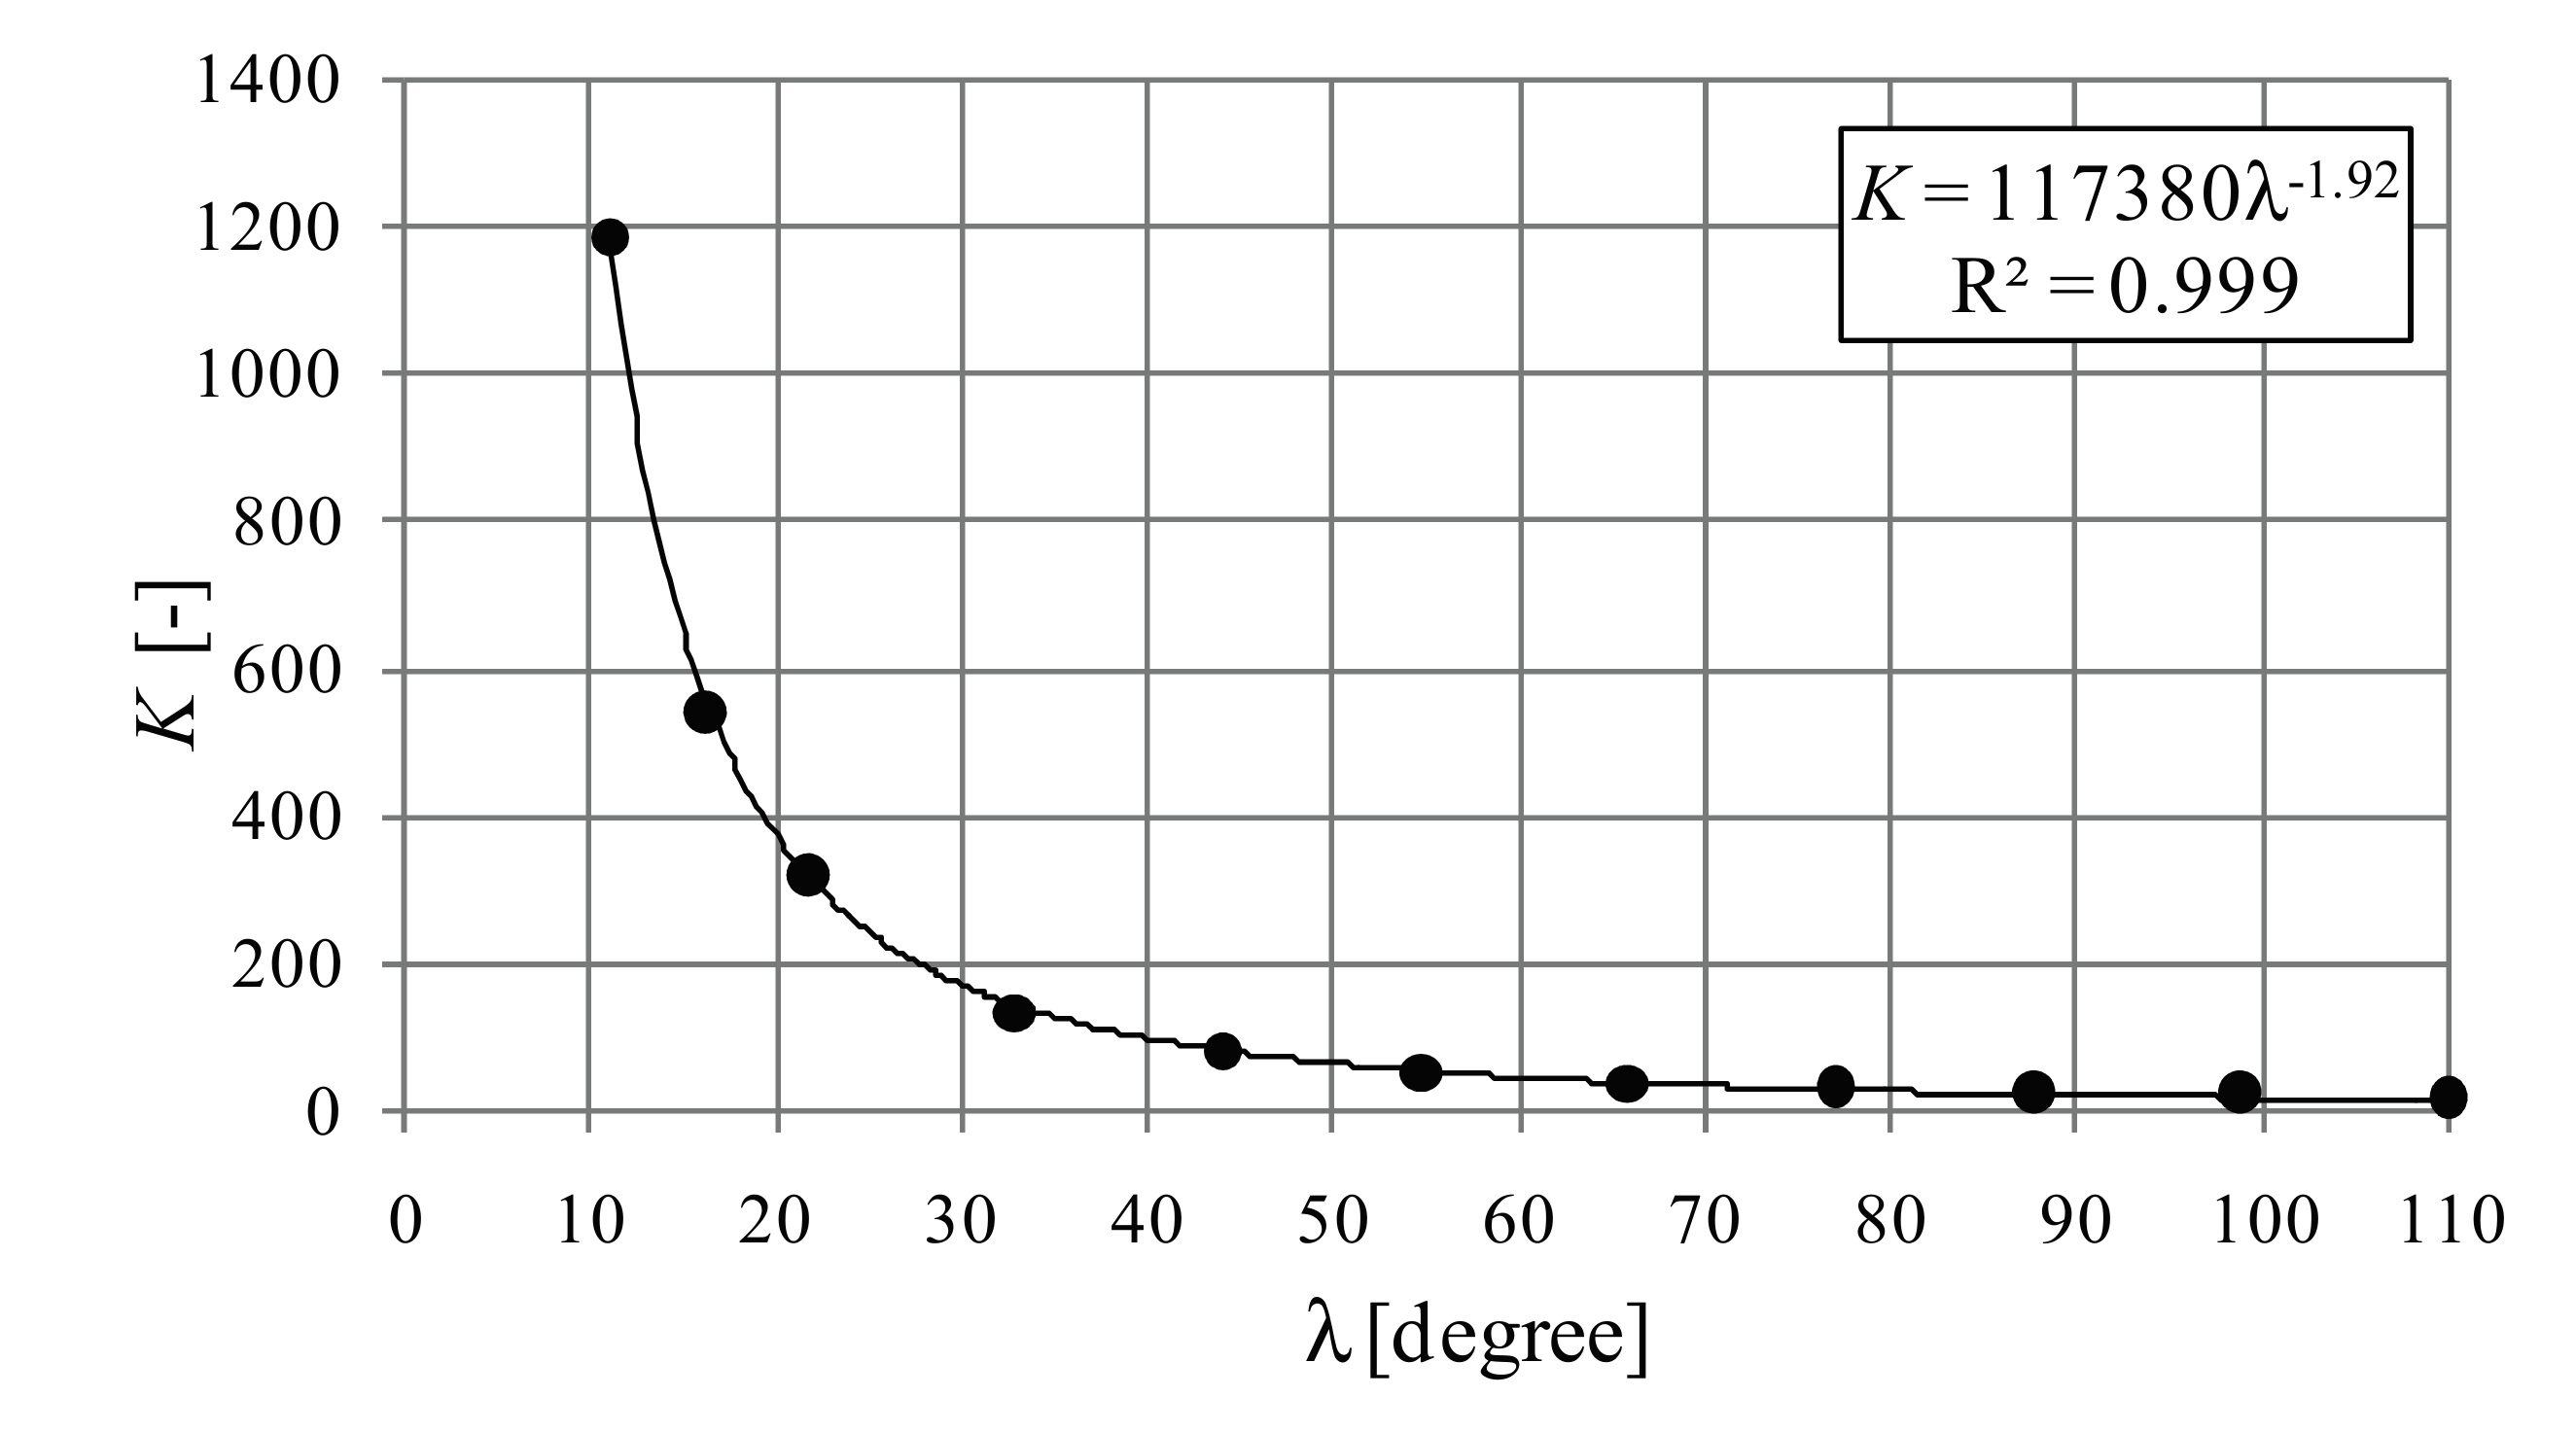
Figure 7.
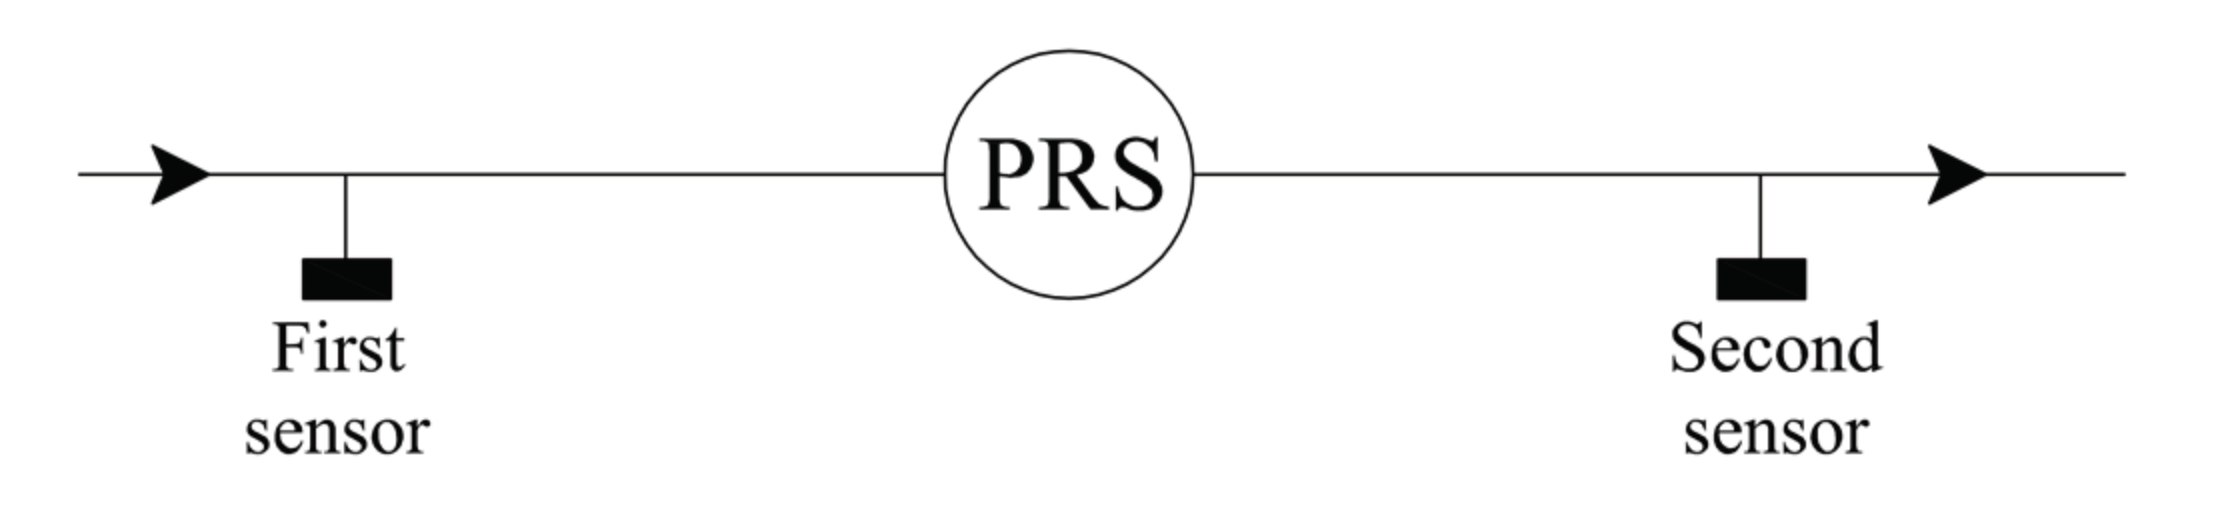
PRS scheme.

Figure 8.
K’ function.

Figure 9.
Hydraulic efficiency versus velocity ratio with λ = λmax.

Figure 10.
Flow-chart of the design procedure.

Figure 11.
Case study pipeline network.
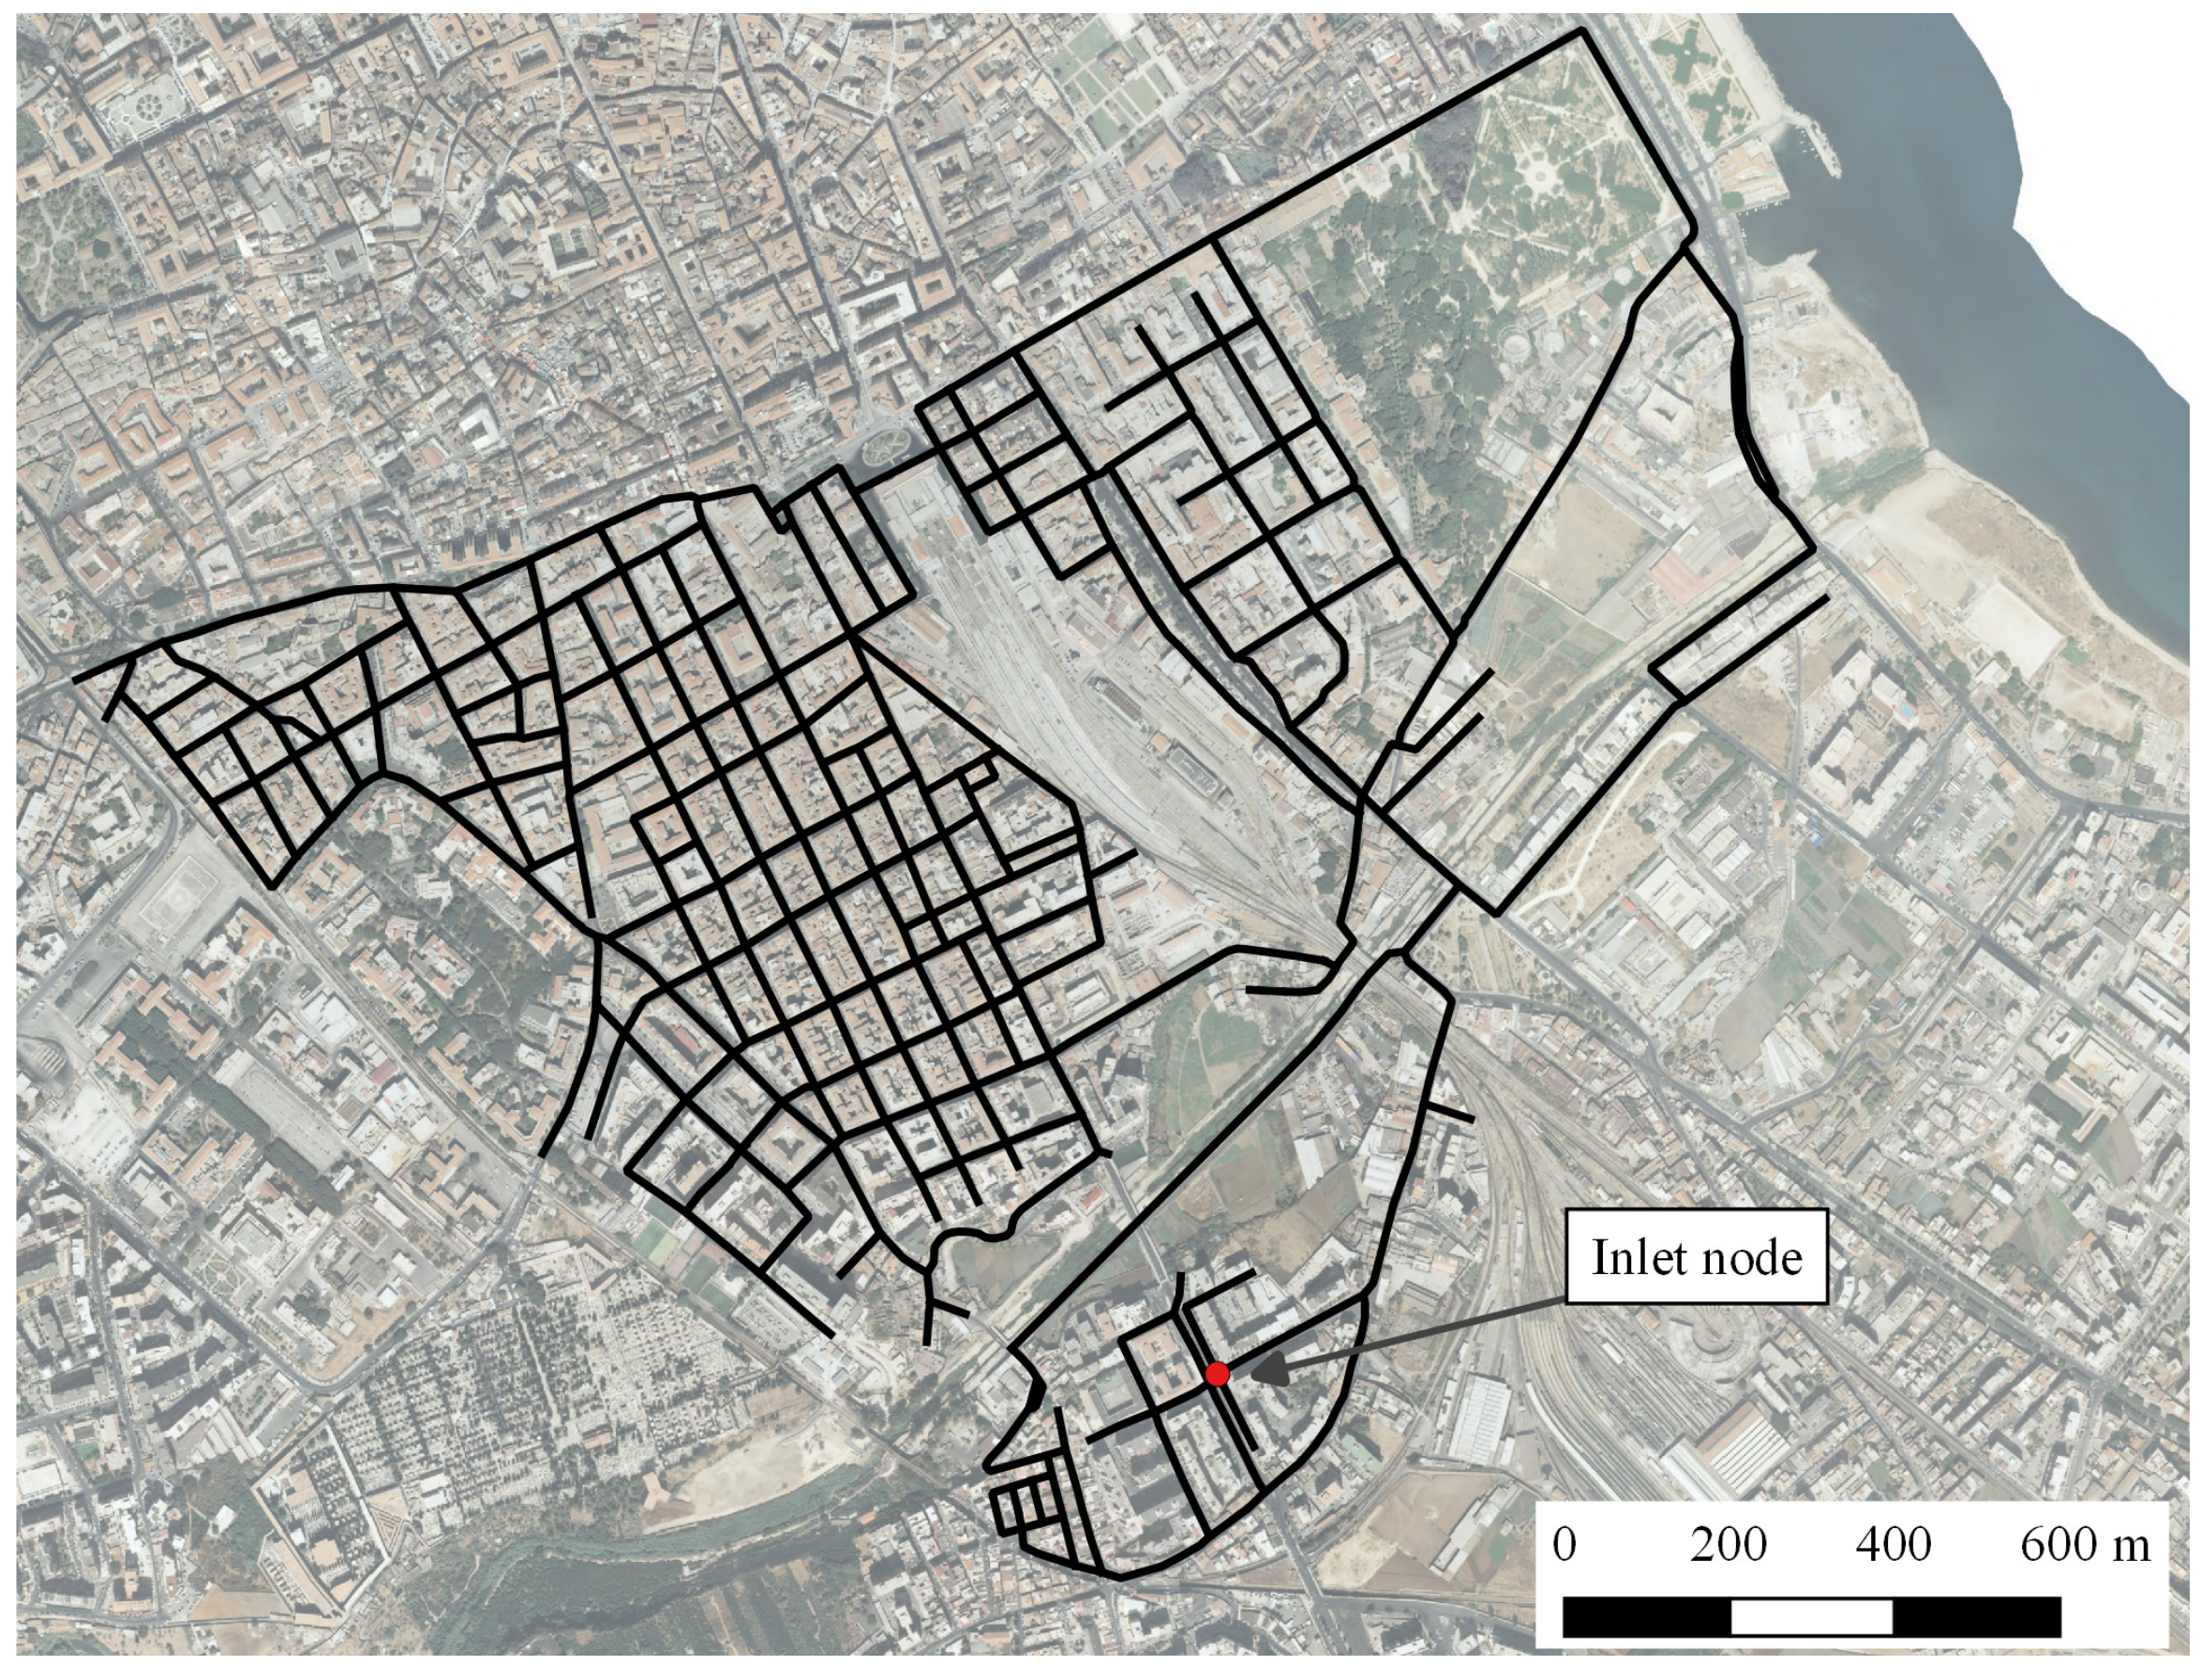
Figure 12.
Discharge and net head at the inlet node.

Figure 13.
Daily production for each design discharge.
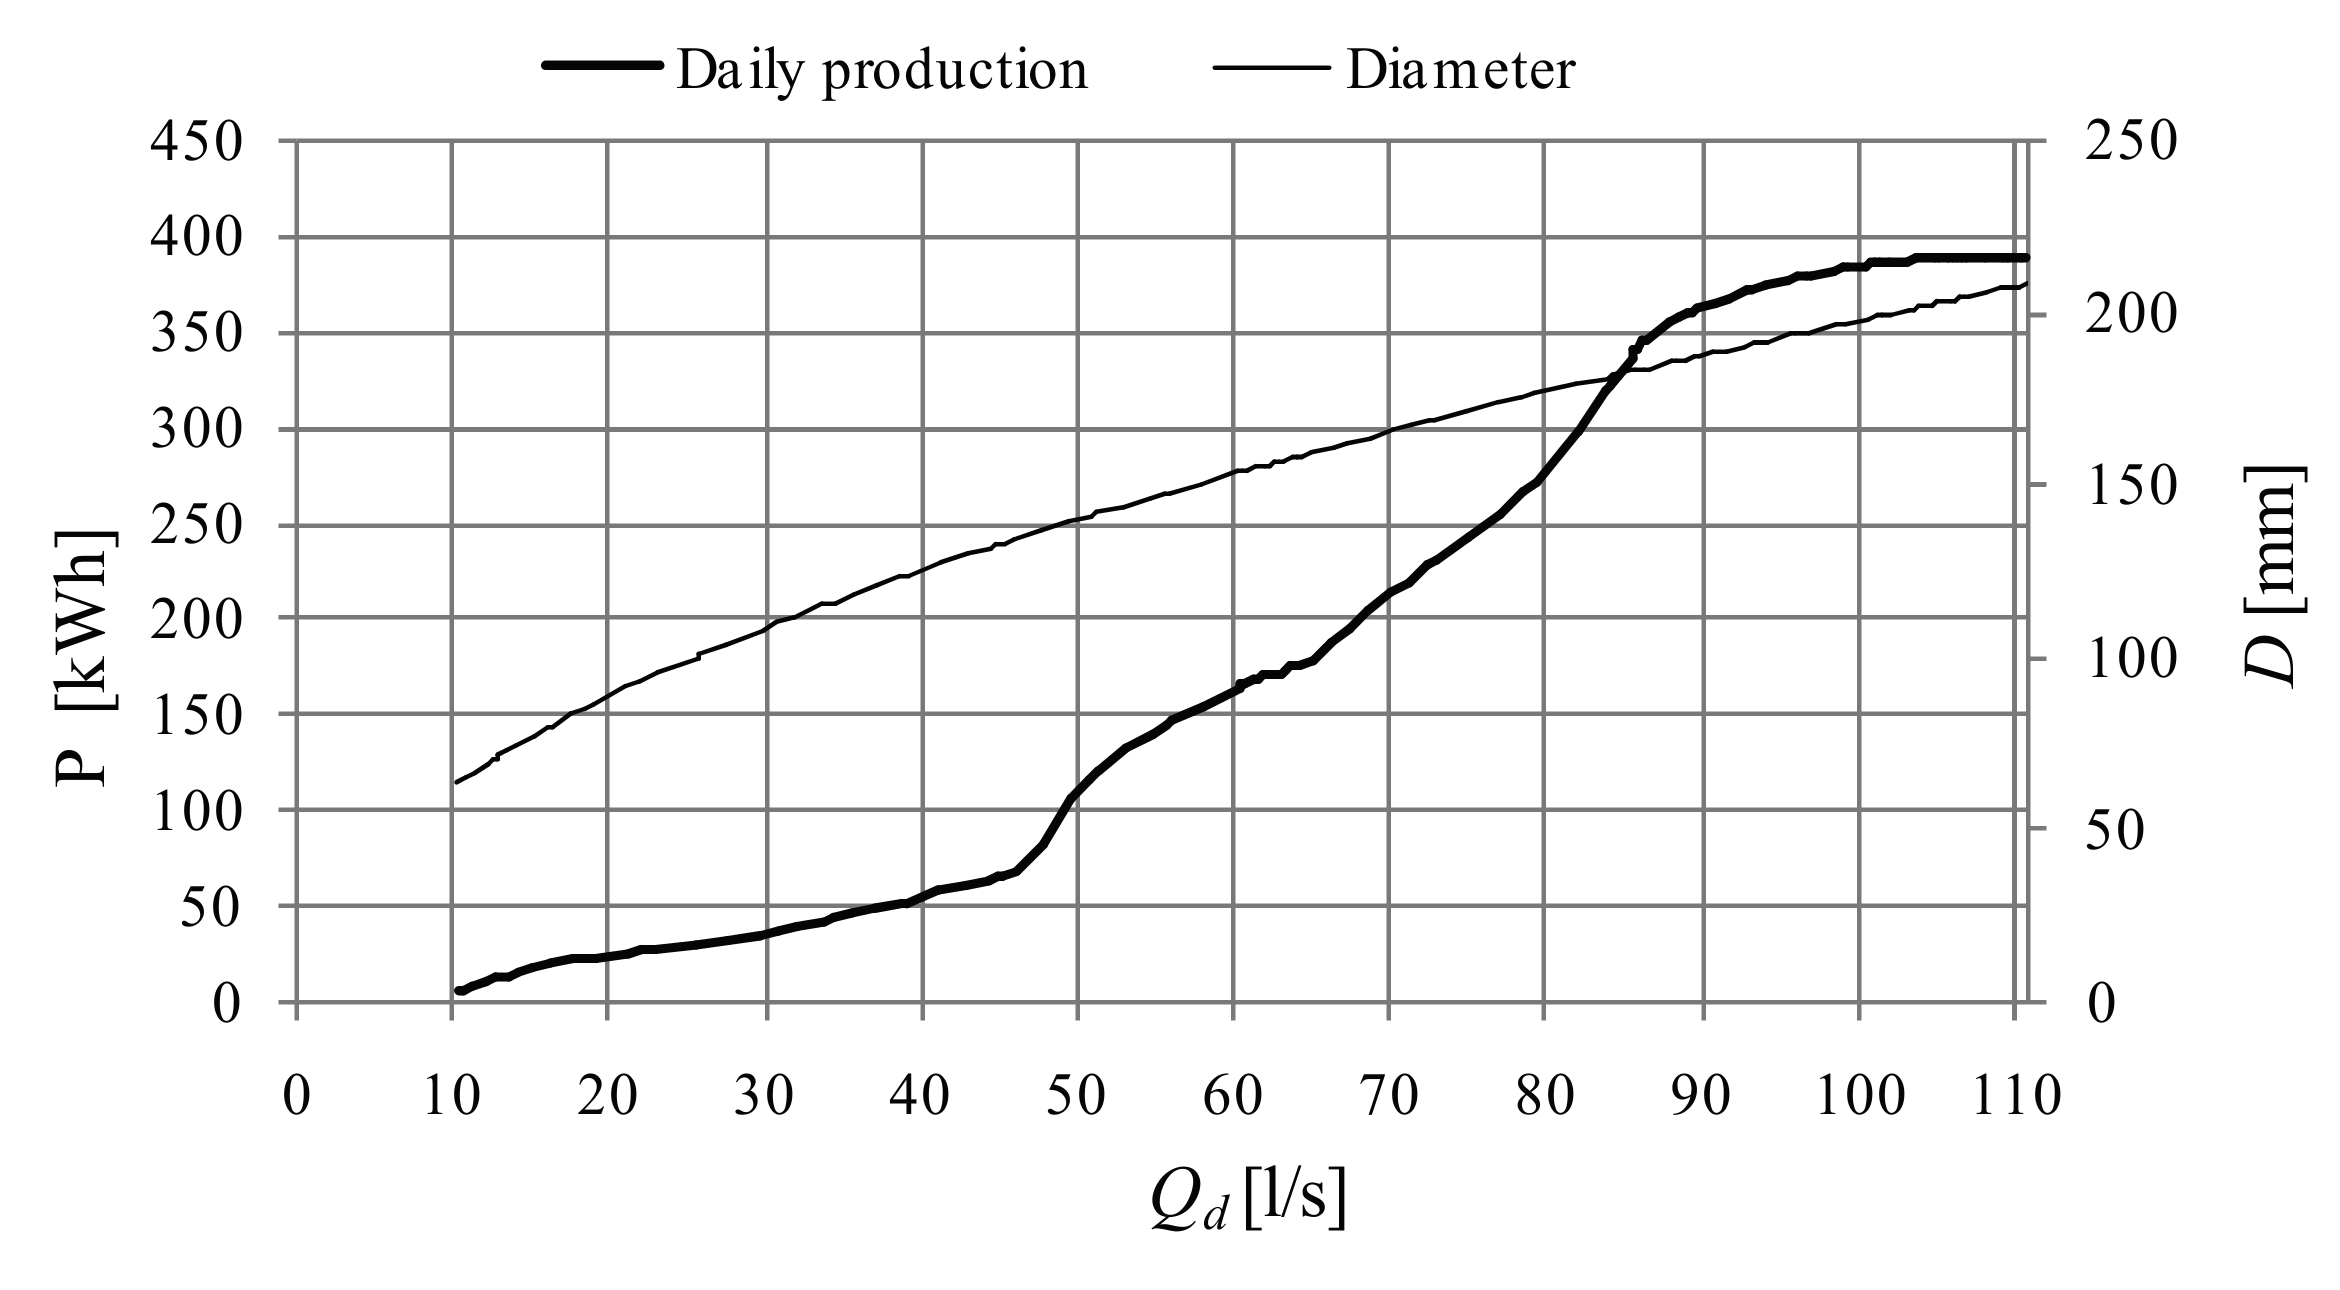
Figure 14.
Energy production device scheme.

Figure 15.
PRS versus PAT installation scheme.

Table 1.
Geometrical parameters of the reference turbines.
| Description | Turbine n° 1 | Turbine n° 2 |
|---|---|---|
| Upstream Head(m) | 84.10 | 130.48 |
| Downstream Head(m) | 47.00 | 47.00 |
| Head jump (m) | 37.10 | 83.48 |
| Discharge (m3/s) | 0.110 | 0.440 |
| Angle of attack α | 15° | 15° |
| Rotational velocity (rpm) | 1000 | 750 |
| Max inlet impeller angle λmax | 110° | 110° |
| Diameter (m) | 0.223 | 0.447 |
Table 2.
Input and output parameters for each point in Figure 5.
Table 2.
Input and output parameters for each point in Figure 5.
| λ(Degree) | η(%) | D(mm) | q(m2/s) | ωopt(rpm) | ΔH(m) |
|---|---|---|---|---|---|
| 110 | 85.8 | 447 | 1.139 | 1000 | 36.4 |
| 99 | 84.4 | 223 | 1.026 | 1000 | 37.1 |
| 88 | 82.9 | 447 | 0.913 | 1000 | 37.0 |
| 77 | 81.4 | 223 | 0.800 | 1000 | 36.7 |
| 66 | 78.8 | 447 | 0.685 | 1000 | 36.2 |
| 55 | 75.5 | 223 | 0.571 | 1000 | 35.0 |
| 44 | 72.0 | 447 | 0.456 | 1000 | 35.0 |
| 33 | 70.3 | 223 | 0.343 | 900 | 32.1 |
| 22 | 54.7 | 447 | 0.228 | 850 | 33.3 |
| 17 | 45.1 | 223 | 0.178 | 850 | 34.8 |
| 11 | 25.9 | 447 | 0.114 | 850 | 31.6 |
© 2017 by the authors. Licensee MDPI, Basel, Switzerland. This article is an open access article distributed under the terms and conditions of the Creative Commons Attribution (CC BY) license (http://creativecommons.org/licenses/by/4.0/).
Share and Cite
MDPI and ACS Style
Sinagra, M.; Sammartano, V.; Morreale, G.; Tucciarelli, T. A New Device for Pressure Control and Energy Recovery in Water Distribution Networks. Water 2017, 9, 309. https://doi.org/10.3390/w9050309
AMA Style
Sinagra M, Sammartano V, Morreale G, Tucciarelli T. A New Device for Pressure Control and Energy Recovery in Water Distribution Networks. Water. 2017; 9(5):309. https://doi.org/10.3390/w9050309
Chicago/Turabian StyleSinagra, Marco, Vincenzo Sammartano, Gabriele Morreale, and Tullio Tucciarelli. 2017. "A New Device for Pressure Control and Energy Recovery in Water Distribution Networks" Water 9, no. 5: 309. https://doi.org/10.3390/w9050309
Note that from the first issue of 2016, this journal uses article numbers instead of page numbers. See further details here.