
Experimental Study on Wetland Hydraulic Characteristics of Vegetated Drainage Ditches

State Key Laboratory of Water Resources and Hydropower Engineering Sciences, Wuhan University, Wuhan 430072, China
*
Author to whom correspondence should be addressed.
Water 2017, 9(5), 311; https://doi.org/10.3390/w9050311
Submission received: 5 March 2017
/
Revised: 13 April 2017
/
Accepted: 25 April 2017
/
Published: 28 April 2017
(This article belongs to the Special Issue Sustainable Water Management within Inland River Watershed)
Abstract
:Small vegetated drainage ditches play an important role in water and nutrient removal, but may cause water blocking problems. The aim of this study was to investigate vegetated drainage ditches’ hydraulic and wetland hydraulic characters. Field experiment were carried out, small drainage ditches with Juncus, Zizania latifolia, and Acorus calamus were selected under different water flows, and a tracer experiment was also conducted. Research findings suggested that with increased water flow, vegetation roughness coefficient declined, vegetation resistance rose, and drag coefficient declined. Small drainage ditches with emergent vegetation showed a high roughness coefficient value, which was most significant in Juncus, followed by Zizania latifolia, and Acorus calamus. Plants each took on a unique eigenvalue k that was a relative coefficient between the drag coefficient and stem Reynolds number. As small ditches for drainage showed longer residence time and smaller surface hydraulic loading, they featured excellent wetland hydraulic characteristics that could be weakened rapidly as rainfall or flood intensified. This study indicates that the small vegetated drainage ditch shows favorable wetland hydraulic characteristics with good discharge capacity and can be extensively used in irrigated districts.
1. Introduction
In rice irrigation districts, there are a large number of natural drainage ditches that are mostly vegetated and play an important role in the ecosystem. Due to the fact that China faces serious non-point source pollution, such vegetated drainage ditches are also used for non-point source pollution control, such as removal of nitrogen and phosphorus, and sediment blocking [1]. Farmers also purposefully grow cash crops in those small drainage ditches for higher economic income. On the other hand, discharge capacity of ditches can be impacted by plants. Quantitative analysis and evaluation of the comprehensive impact of plants on both aspects is of significance for drainage ditch design, operation, and management.
Instead of focusing on the roughness coefficient and velocity distribution characteristics of hydraulic elements, as well as the mechanism that causes such a phenomenon, researchers of previous studies mainly investigated the resistance of vegetation to water flow from a ditch design perspective. In the early 20th century, Ree et al. [2] studied the relationship between hydraulic parameters in the presence of different plants in controlled laboratory conditions, showing that the parameter VR, i.e., the product of the average section speed of flow V and hydraulic radius R, could be used to estimate a ditch’s roughness coefficient value n, with n-VR curves of different plants drawn. Research findings of Kouwen et al. [3,4,5] suggested that n-VR curve did not apply to ditches with base slopes less than 5% or short, hard vegetation, and that flexible vegetation showed layered distribution of flow velocity in the effect of water flow, thus, it would be suitable to describe using the drag coefficient of vegetation Cd with respect to the water flow. By summarizing previous research achievements, Wu et al. [6] carried out flume experiments with horsehair, which indicated that the average water velocity increased and the roughness coefficient declined to a gentle level as water depth increased in a non-submerged condition. Huai et al. [7,8] put forward the arithmetic solutions of velocity distribution and hydraulic elements at a steady flow of the vegetated open channel by implementing mechanical analysis and precise observation of water flow. Researchers investigated the velocity distribution characteristics and turbulence structure of water flows with vegetation [9,10,11].
The irrigation districts contain numerous drainage ditches whose substrate is mainly soil on which plants grow. With water coverage throughout the year, or intermittently, those ditches that can be deemed as a kind of natural band wetland [12] are used to draw off flood water or discharge subsurface water. Ecological effects of drainage ditches are manifested by the survival space that they provide for plants and animals, as well as rich biological diversity [13]. Armitage et al. [14] carried out an investigation on animals and plants on Chalk Plain and found that nearly 30% of invertebrates and 47.5% of plants could only be seen in drainage ditches. As those ditches undertook farmland drainage, such hydraulic connection provided animals and plants with a habitat and migration channel [15]. Different water-levels in the bottom and sides of a ditch resulted in varied plant diversity characteristics [16] that could be impacted by water quality [17]. Drainage ditches in the irrigation districts, as a kind of wetland, can be used for the removal of agricultural non-point pollutants. Kroger, He, Peng, and Jiang et al. [18,19,20,21] found that drainage ditches showed excellent effects in removing the major nutrients of non-point pollutant indices, such as nitrogen and phosphorus. Research findings of Alexander and Applegate et al. [22,23] suggested that drainage ditches presented favorable decontamination effects, such as nitrogen and total suspended particulates.
Instead of association studies on two or three factors, existing research achievements are mainly targeted at only one factor of a small drainage ditch, such as the hydraulic characteristics, ecological characteristics, or decontamination performance. By taking the changing rules of hydraulic characteristics and wetland hydraulic parameters of drainage ditches with vegetation at different velocities and discharges into consideration, this study will provide a reference for quantitative analysis and evaluation of the comprehensive impact of vegetation on discharge capacity.
2. Materials and Methods
2.1. Study Site
The study site is located in Jiangxi Provincial Irrigation Experimental Station of Ganfu Plain Irrigation District, which is a typical rice irrigation district with an average elevation of 20 m above sea level. This area features a typical subtropical humid monsoon climate with perennial mean air temperature of 18.1 °C, paddy red soil with heavy soil quality, and faintly acidic (pH: 4.5–6.5). Annual average temperature, annual average sunshine, annual average evaporation, and annual average precipitation of the irrigation district where the study site is located are 17.5 °C, 1720.8 h, 1139 mm, and 1747 mm, but annual precipitation is unevenly distributed, with precipitation from April to June accounting for 48% of the annual rainfall and from July to September accounting for only 20%.
Located in the rice experiment site of the experimental station, the drainage ditch in the irrigation area is responsible for discharge of water from a rice field that covers an area of 8400 m2. It has been determined that lateral leakage from the rice field to the drainage ditch through the ridge is about 2 mm/d; drainage discharge of subsurface water by the ditch is, on average, 0.20 L/s. In the event of storms once in five years, one-day maximum direct surface runoff and drainage capacity are 110.00 mm and 3.56 L/s, if it is discharged in three days.
The designed section of the drainage ditch that was constructed in 2011 is a trapezoid whose top width, bottom width, depth, side slope m, and bottom gradient are 1.20 m, 0.6 m, 0.6 m, 0.5, and 1:504, respectively. Having been used for years, however, the drainage ditch has turned into an irregular section due to the effect of sedimentation of sand and soil from the rice field and withered stems and leaves, as well as water scouring (Figure 1).
With a total length of 103 m, the drainage ditch was divided into three sections on which three kinds of emergent plants were grown (see Figure 2), i.e., Juncus, Zizania latifolia, and Acorus calamus.
2.2. Experiment Design and Measurements
2.2.1. Experiment Design
Three kinds of plants, i.e., Juncus, Zizania latifolia, and Acorus calamus, are different major plant treatments; a total number of nine different drainage discharges (0.22, 0.51, 0.79, 1.24, 1.83, 1.96, 2.25, 2.88, and 3.33 L/s) were set for each plant; namely, there were 27 groups of experimental treatment.
2.2.2. Measurements
Measurement of the morphological parameters of sections and water surface was conducted, as well as velocity and plant parameters.
Section Measurement: Cross- and Longitudinal-Section Measurement
A 10 m straight ditch section was selected randomly from the three ditch sections, with a flow measurement section set at the starting position and the gradient measured at the bottom of the head/tail of the ditch section using a leveling instrument. The cross-section at the starting position was measured using a graduated wooden frame, and the width and height were 2 m and 1 m. A leveling rod was mounted to the top of wooden frame in order to keep it level. Probes were used to measure the relative elevations of the ditch bottom and the water surface profile at an interval of 2 cm.
Measurement of Flow and Velocity of the Ditch
A pump with adjustable power was set at the head end of the ditch section; triangular-notch weirs were set at both the head and tail ends of the ditch in order to measure influent flow and outlet flow. When the errors of drainage flow measured by the triangular-notch weir at the inlet and outlet were continuously stable within 2%, it was deemed to be in a stable flow regime.
The velocity of the water flow in the ditch was measured using a Rhodamine WT tracer agent, a water-soluble organic pigment, for the test [24]. A YSI-600 OSM multifunctional water quality monitor (YSI, Yellow Springs, Ohio 45387 USA) was used as the tracer agent monitoring instrument, which was able to display the concentration of the organic pigment by detecting the reflection characteristics of the fluorescent agent. During the test, 0.5–1.0 g of net tracer agent was applied to the head end of the three ditch sections; sensor probes placed at both the head and tail ends of the 10 m straight ditch section were used to monitor the concentration of the tracer agent every other 10 s. The average velocity of the water flow in the ditch was determined by calculating the time when the peak concentration of the tracer agent passed the straight ditch section and its length, as u = L/Δt, where u is the flow velocity, m/s; L is the length of the head and end sections, m; and Δt is the interval time of peak concentration passed from the head to end section, s.
Measurement of Plant Density and Plant Morphological Parameters
Morphological parameters of plant stems could be measured using the Vernier caliper by random sampling [25], which was completed by drawing a 1.0 m × 1.0 m quadrant randomly at the head, middle, and tail ends of the ditch along its axis to determine the stem density of plants. The results of the vegetation survey on the morphological and frontal face parameters suggested that the growth distribution of Acorus calamus, whose stem height was about 0.95 m and stem width at the frontal face was about 0.01 m, approximated to an even distribution, with 7500 plants growing in the 10 m straight ditch section; the growth distribution of Zizania latifolia, whose stem height was about 1.8 m and stem width at the frontal face was 0.05 m, approximated to sparse distribution, with 30 clumps growing in the 10 m ditch section. Every clump contained about 20 tillers on which there were about five stems each; and the growth distribution of Juncus, whose stem height was about 0.83 m and stem leaf width at the frontal face was 0.005 m, lay between even distribution and clump distribution, with 15 clumps growing in the 10 m ditch section. Each Juncus clump contained 1930 plants of stem leaves.
2.3. Data Analysis
Resistance of the small drainage ditch to water flow is always described by a roughness coefficient value n. There are various reasons that cause such resistance, such as an uneven side wall, vegetation resistance, water flow bending, and abrupt change of the section [26]. Drag force FD of plants obstructed the water flow and affected the roughness coefficient. Factors, including plant type, whether the plants were submerged, stem thickness, deflection angle of stem leaves, and plant density, affected the plants’ resistance to water flow. The dragging effect of plants to water flow was reflected in the drag coefficient, denoted as Cd. The correlation between plant drag coefficient Cd’, which eliminated the impact of plant density and the Reynolds number of plant stem Res, was expressed by k [6], i.e., the eigenvalue of the plants.
When the flow regime of the drainage ditch was stable, the flow regime was in a steady non-uniform flow of the open channel. The energy equation was used to deduce the roughness coefficient of ditch’s side wall to the water flow at a unit length of (10 m).
The roughness coefficient equation in the context of minimal curves in the ditch section is given as follows:
Here n is the roughness coefficient that shows the ditch’s (including side wall and vegetation) impact on the water flow, s/m1/3; is the flow rate, m3/s; i is the ditch’s gradient, which is dimensionless. According to measurements, gradient values in all three ditch sections were 1:504; Es is the specific energy that contains kinetic hydraulic energy and hydraulic potential, m; A is the discharge section area, m2; R is the hydraulic radius of the discharge section, m; u and d are the numbers of sections upstream and downstream.
By using a simplified flow model for resistance analysis, Petryk et al. [27] studied the relationship among overall roughness coefficient n, hydraulic radius R, and boundary roughness rate nb without vegetation by hypothesizing that the velocity was as small as possible, with a function deduced as follows:
where nb is the roughness coefficient of the bottom boundary, s/m1/3, which was 0.025 in the test according to local conditions; Cd is the drag coefficient, which is dimensionless; Ac is the cross-sectional area of the ditch section, m2; Ai is the frontal area of a single plant, m2; L is the selected insulation length, which was 10 m in the test.
The drag coefficient Cd that was used to quantitatively describe the resistance of a certain object to fluid in water hydraulics was determined by Equation (2). This value was not a constant; instead, it varied with velocity, flow direction, object position, and size. With other conditions remaining the same, a smaller drag coefficient corresponded to a smaller drag force of the object acting on the water flow.
The drag force of plants to the water flow was also known as the plants’ resistance to water flow, denoted as FD, which could be calculated by the following equation as the average water velocity at the surface of plants and the plants’ drag coefficient:
where FD is the plant’s resistance to water flow, N; ρ is the density of water, kg/m3; A is the plant’s frontal area; λ is the total water area with submerged plants in the upstream direction in the unit volume of the ditch section, m2/m3, with the equation given as follows:
where Cd’ is the plant drag coefficient, 1/m. This is different from the drag coefficient Cd since the Cd represents the drag coefficient of all plants within the ditch section to the water flow, while Cd’ is a more rational value with plants’ growth distribution density λ taken into consideration.
As indicated by existing research findings [3,6], the plant drag coefficient Cd’ and plant stem’s Reynolds number Res showed the following relation with non-submerged flow:
where i is the ditch’s gradient, which is dimensionless; h is the water depth with non-submerged flow, m; Res is the plant stem Reynolds number, which is also dimensionless; k are the plant characteristics, a dimensionless constant. Plant stem Reynolds number was determined by the following equation:
where us is the water velocity at the surface of plant stems, m/s; μ is the dynamic viscosity of water, kg/m·s.
The ditch, with aquatic plants growing on soil as the substrate, is a typical band wetland [12]. Hydraulic performance indices for a constructed wetland include its length-width ratio, hydraulic residence time τa, and qhs. Tracer tests using Rhodamine WT and YSI sensors, nine discharges of all situations were conducted. Wetland residence time distribution (RTD) was measured by tracer concentration and time, and the RTD function was described as [28]:
where C(t) is the exit tracer concentration, g/m3; Q is the water flow rate, m3/day. E is the RTD function, 1/day; and t is the time, given in days.
The actual detention time (τa) was the average time that the tracer particle spends in the wetland, is measured by:
where τa is the residence time, given in days.
The nominal detention time τn and surface loading could be determined by qhs [29]:
where τn is the nominal time, given in days; V is the wetland water volume, m3; qhs is the hydraulic surface loading, m3/(m2·d); Aw is the surface area of the constructed wetland, m2. Since it is the indices, such as cross-section, that matter in a small drainage ditch, dimensions would be inconsistent if Equations (7) to (10) were applied. In order to keep hydraulic performance indices of the constructed wetland in the band wetland and dimensions consistent, it was assumed that the standard lengths of all drainage ditches were 1000 m.
3. Results
3.1. Variation of the Roughness Coefficient of Drainage Ditch with Vegetation
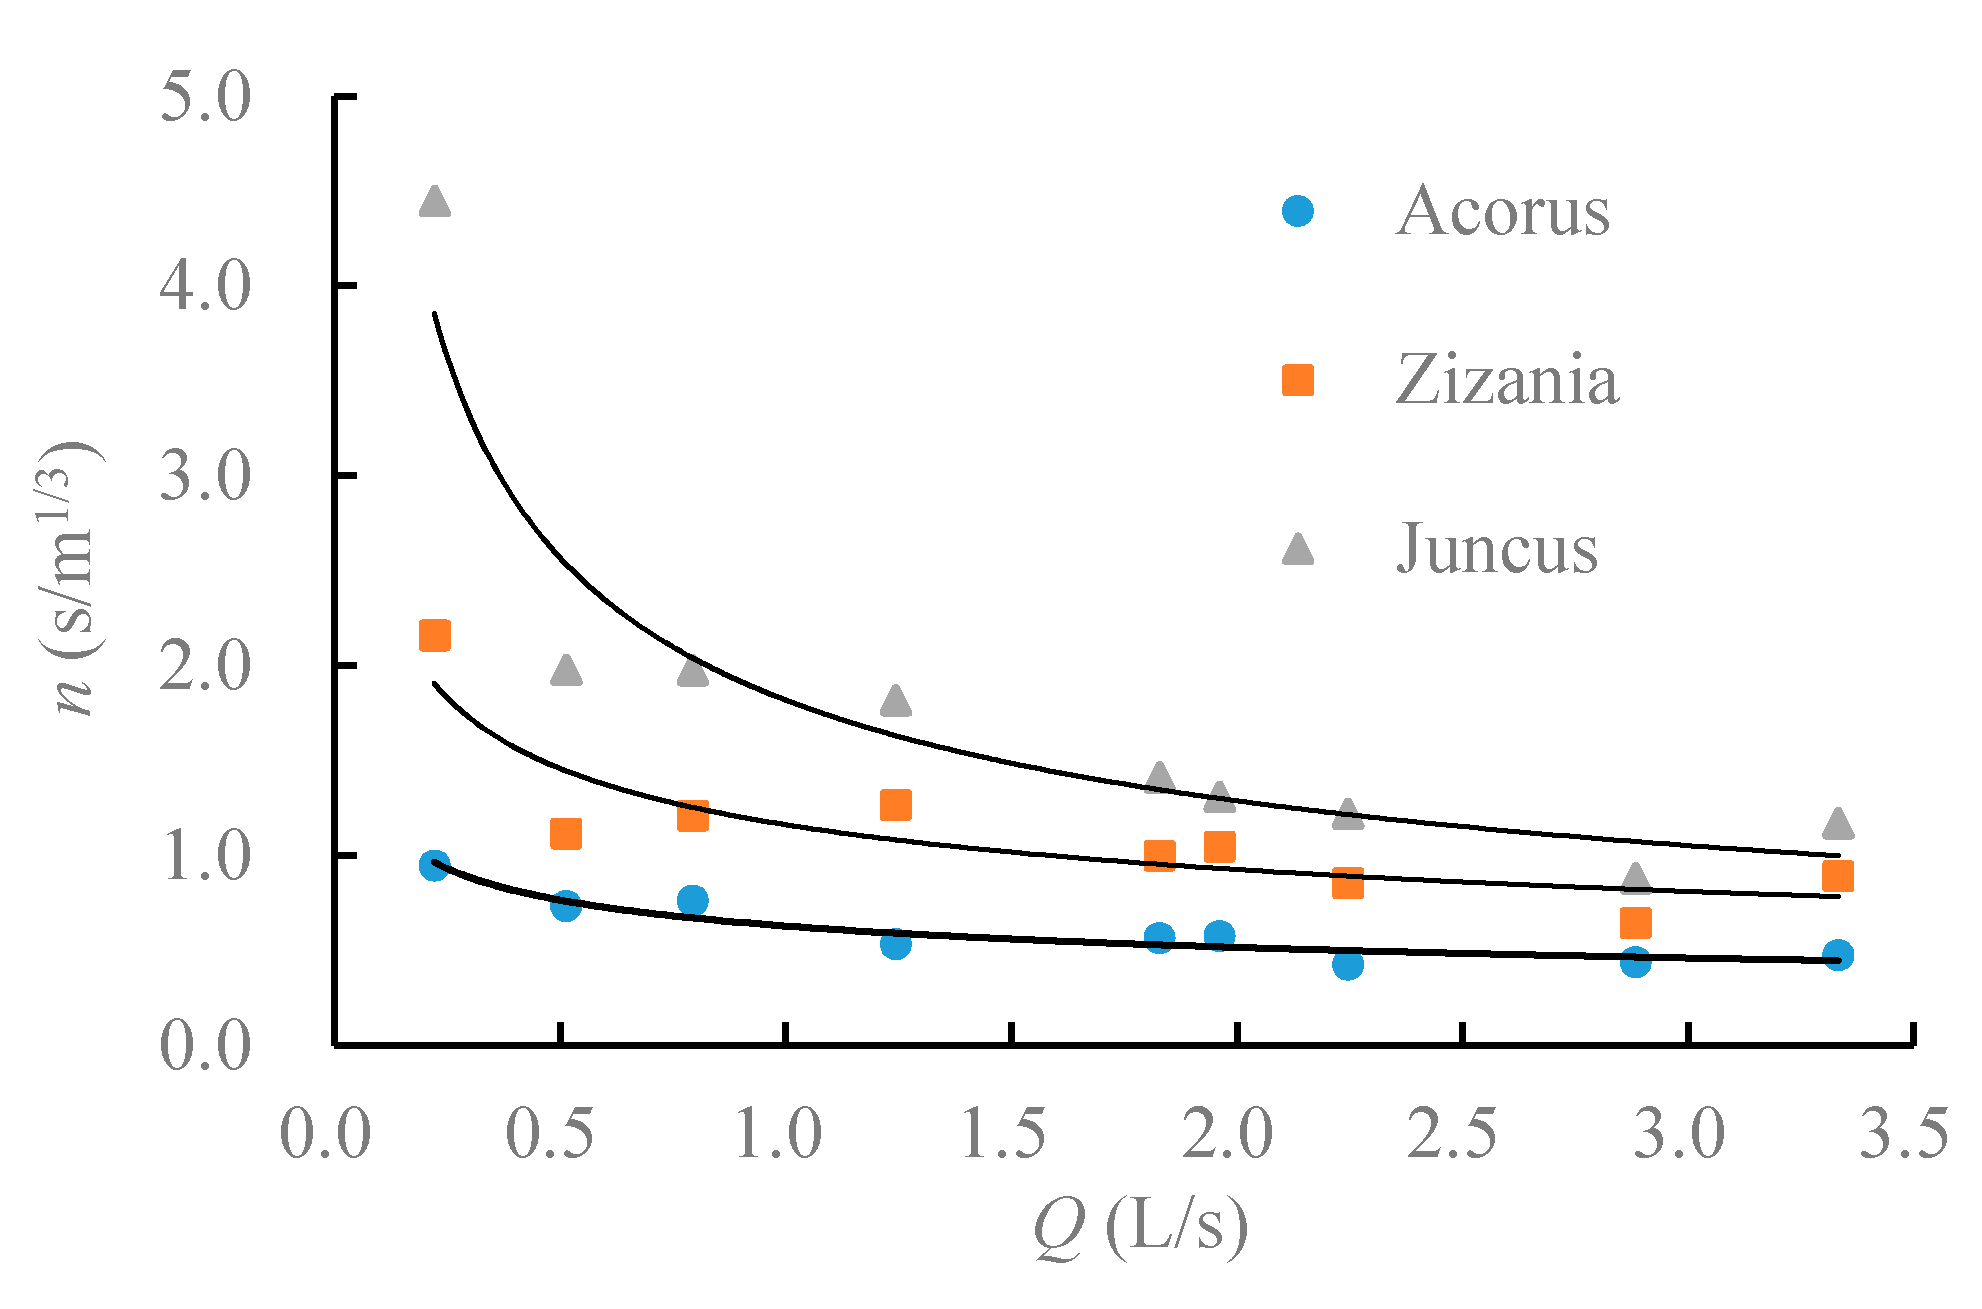
Equation (1) was used to calculate the roughness coefficient of small drainage ditches with different plants at different flow rates. The results indicated that the roughness coefficient of different drainage ditches was 0.43~4.45, and that roughness coefficient declined as the flow rate increased. A comparison between different plants suggested that (Figure 3). As the longitudinal sections both upstream and downstream of the drainage ditch were basically consistent, the reason why there was difference of value n in different ditch sections was due to plant differences, such as the thickness of plant stems, growth density, stem shapes, etc.
3.2. Variation of Plant Resistance to Water Flow
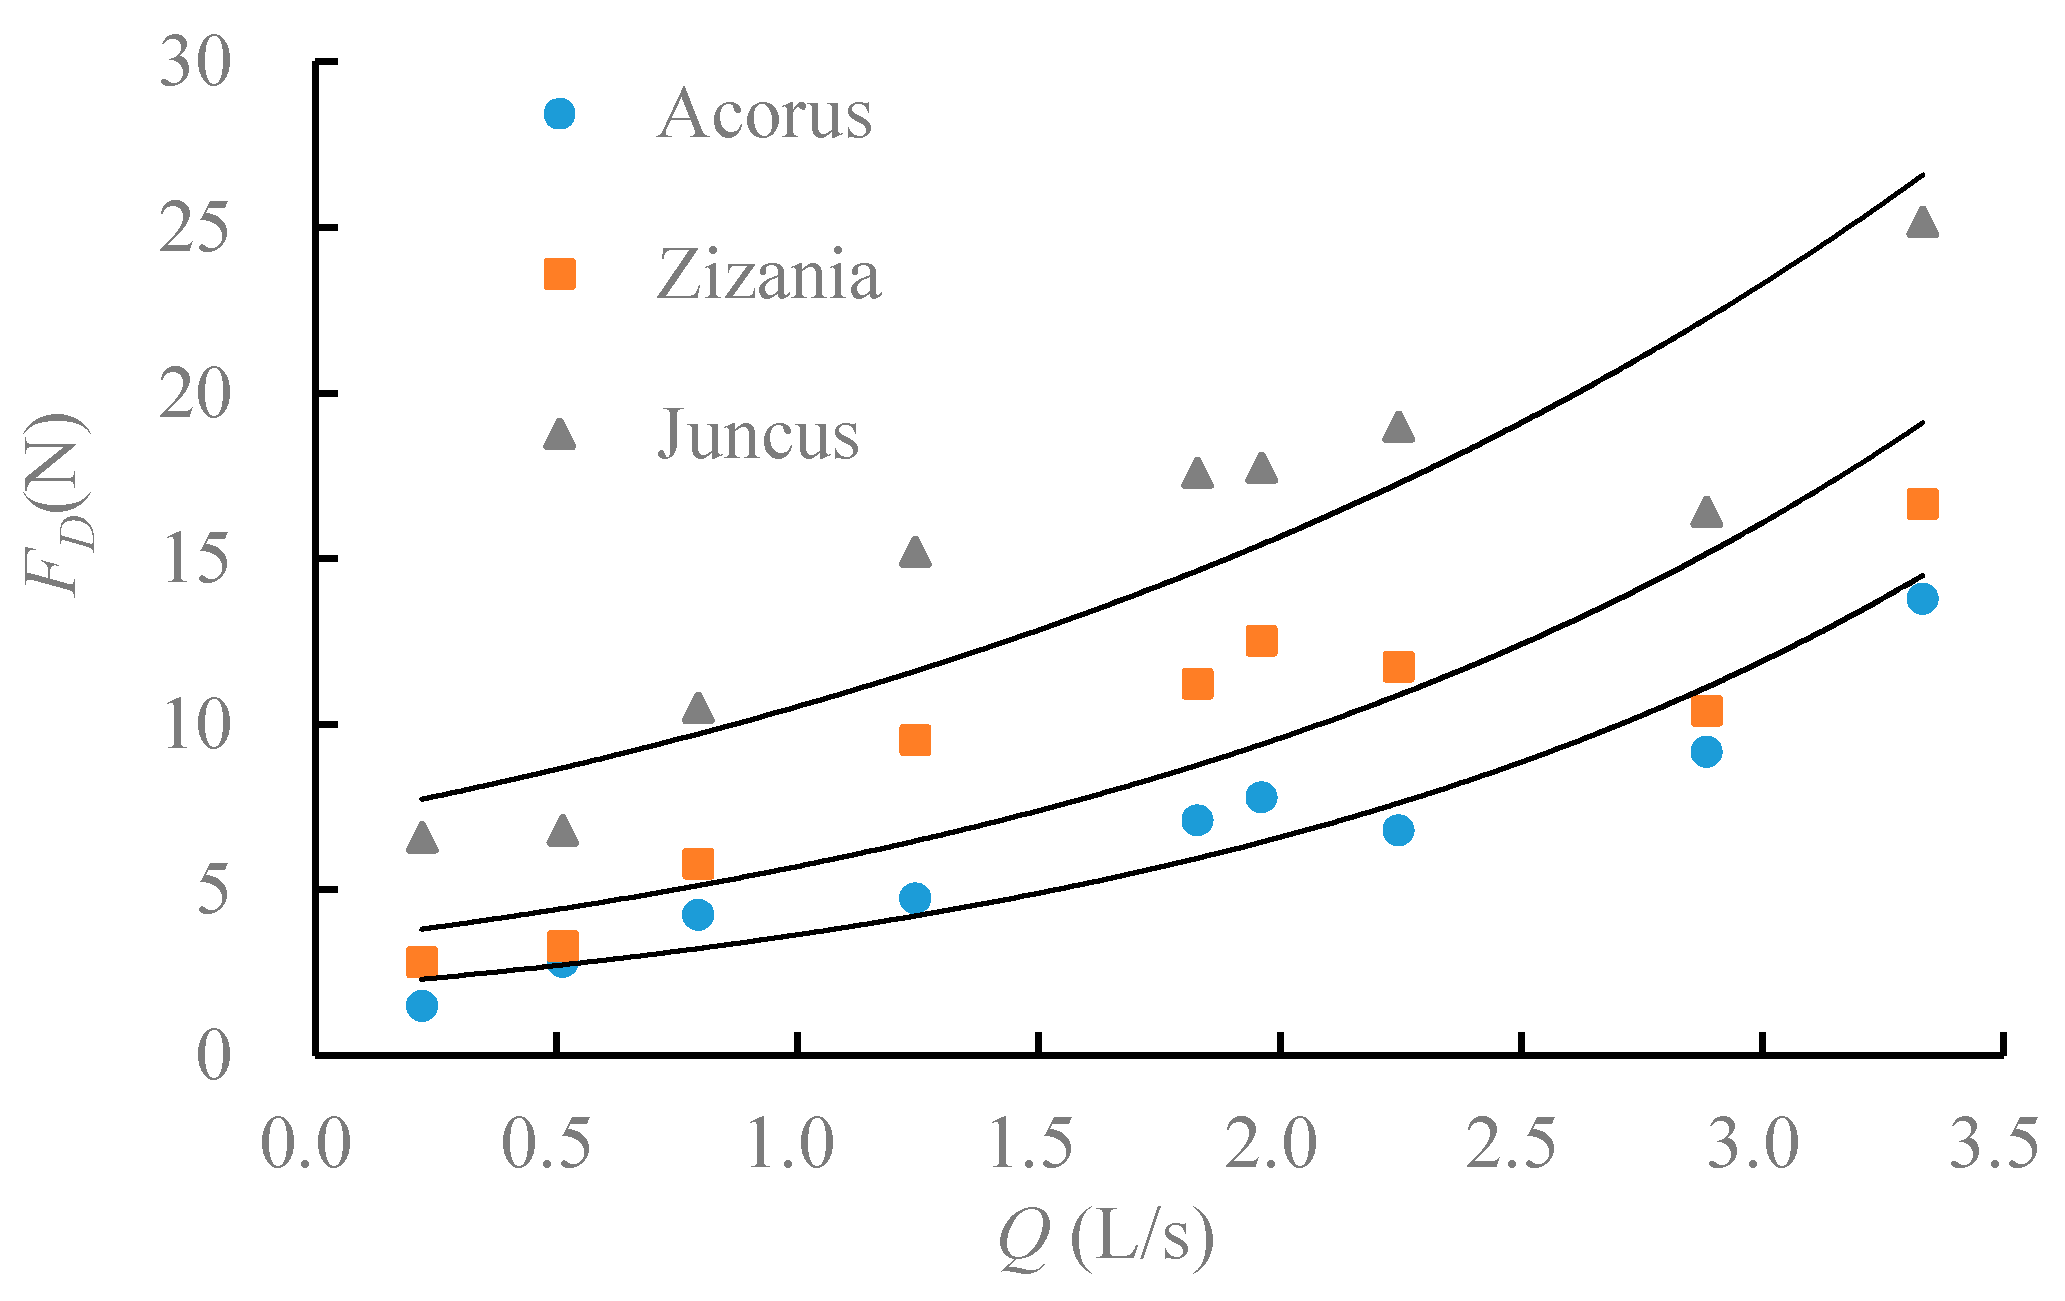
Equation (2) was used to calculate the plant drag coefficient. The results suggested that the drag coefficient of different plants was 0.61–26.24, it decreased as the flow rate rose, and that , shown by the comparison between different plants (Figure 4). Equation (3) was employed to calculate the resistance of different plants to water flow. Calculations showed that the drag force of different plants to water flow, i.e., resistance FD, was 1.49–25.17 N, which increased with water flow, and that the comparison between different plants suggested that (Figure 5).
A comparison between plant resistance FD and roughness coefficients n indicated that the difference was caused by plants’ frontal area. According to plant investigations, the total area of submerged Juncus, Zizania latifolia, and Acorus calamus in the frontal area was 28.8 m2, 26.4 m2, and 9.7 m2, respectively.
3.3. Relationship between Plant Drag Coefficient and Stem Reynolds Number
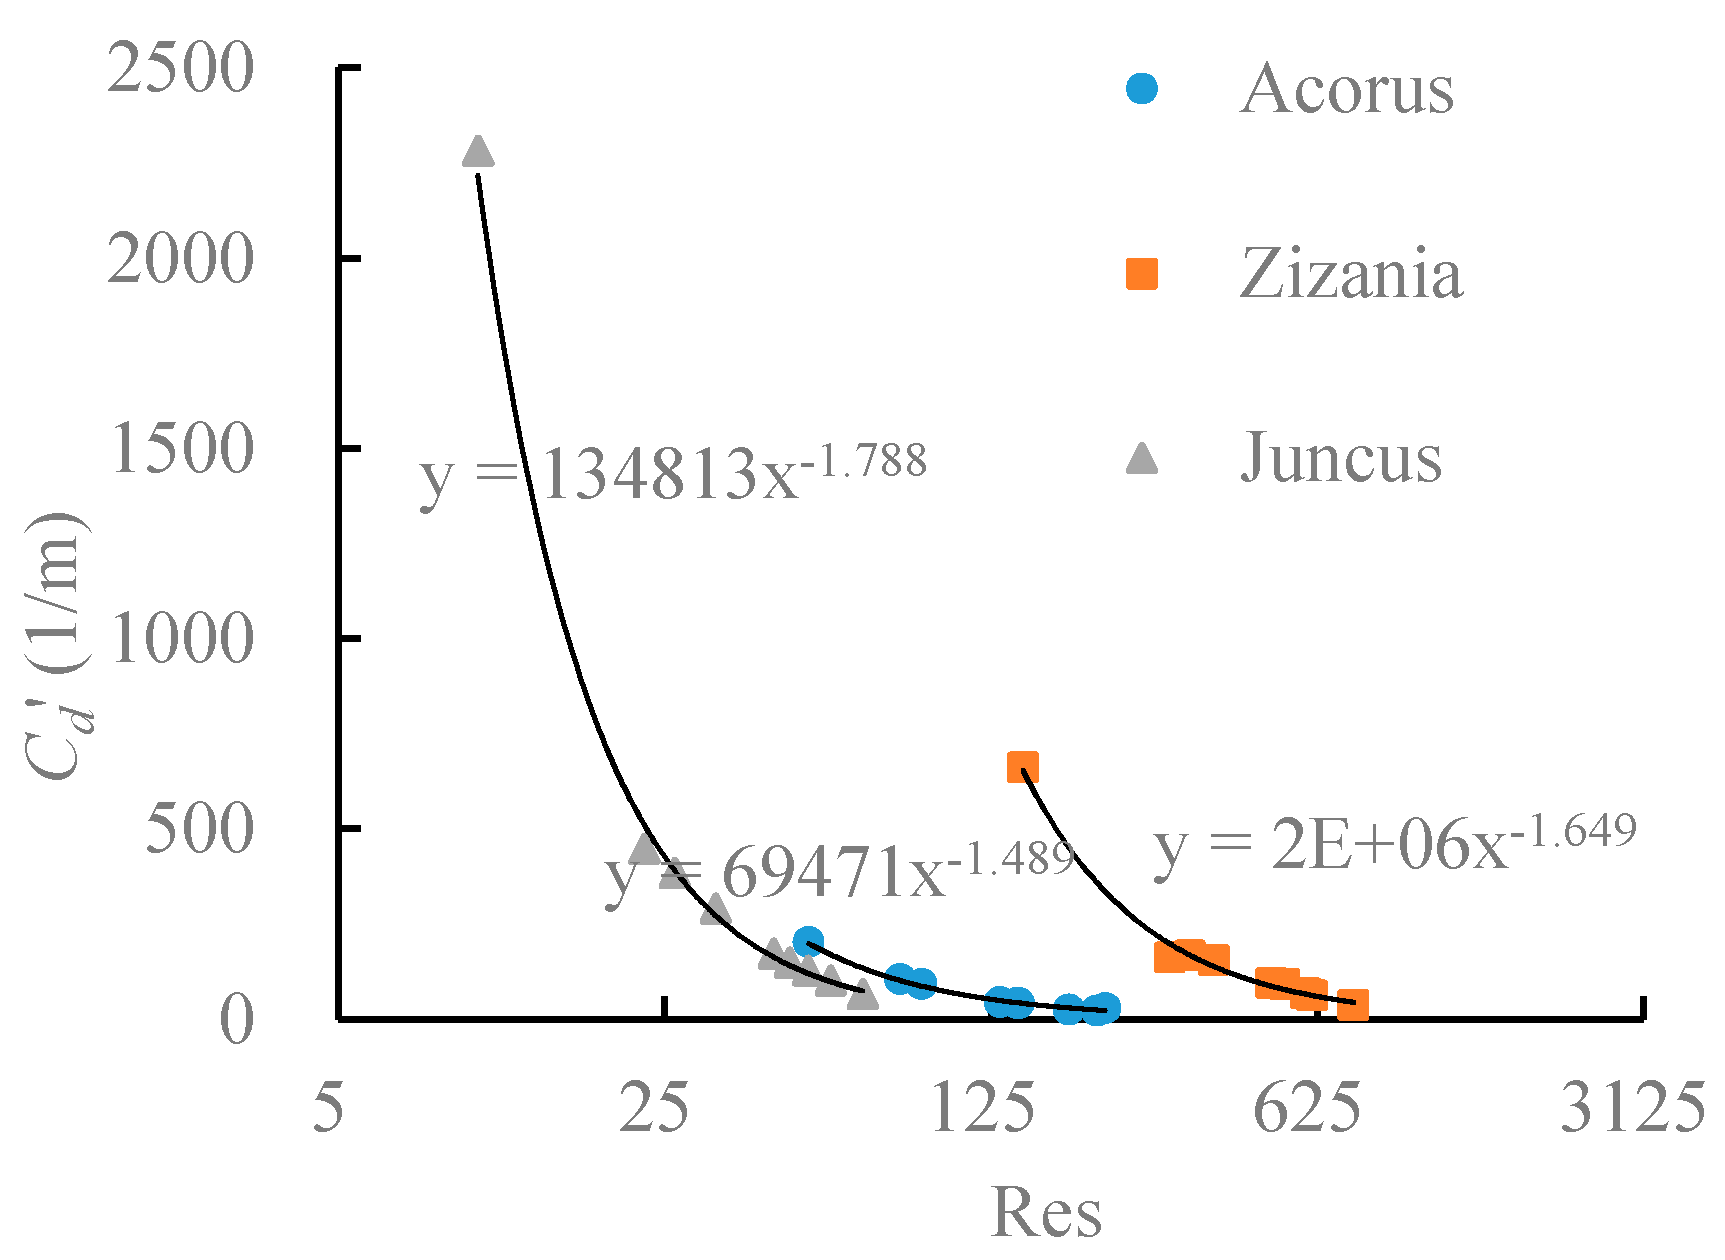
Equations (4) and (6) were used to calculate plant drag coefficient Cd’ and Reynolds number of plant stem Res at different water flow rates. The correlation of these two values were analyzed by Equation (5). Results suggested drag coefficients of different plants all declined as Reynolds number dropped (Figure 6). Fitting result could be fitted using the power function suggested by Equation (5). Value k of Juncus, Zizania latifolia, and Acorus calamus was 1.79, 1.65, and 1.49, respectively. Existing studies [3,6] indicated that this value was 1.0~2.0 in a non-submerged condition, in Wu et al’s paper, different value of k of vegetation was discussed both of his results and others’ results, k values are due to the differences in vegetation characteristics and may depend on the stiffness, density and configuration of the plants.
3.4. Wetland Hydraulic Characteristics of a Drainage Ditch with Vegetation
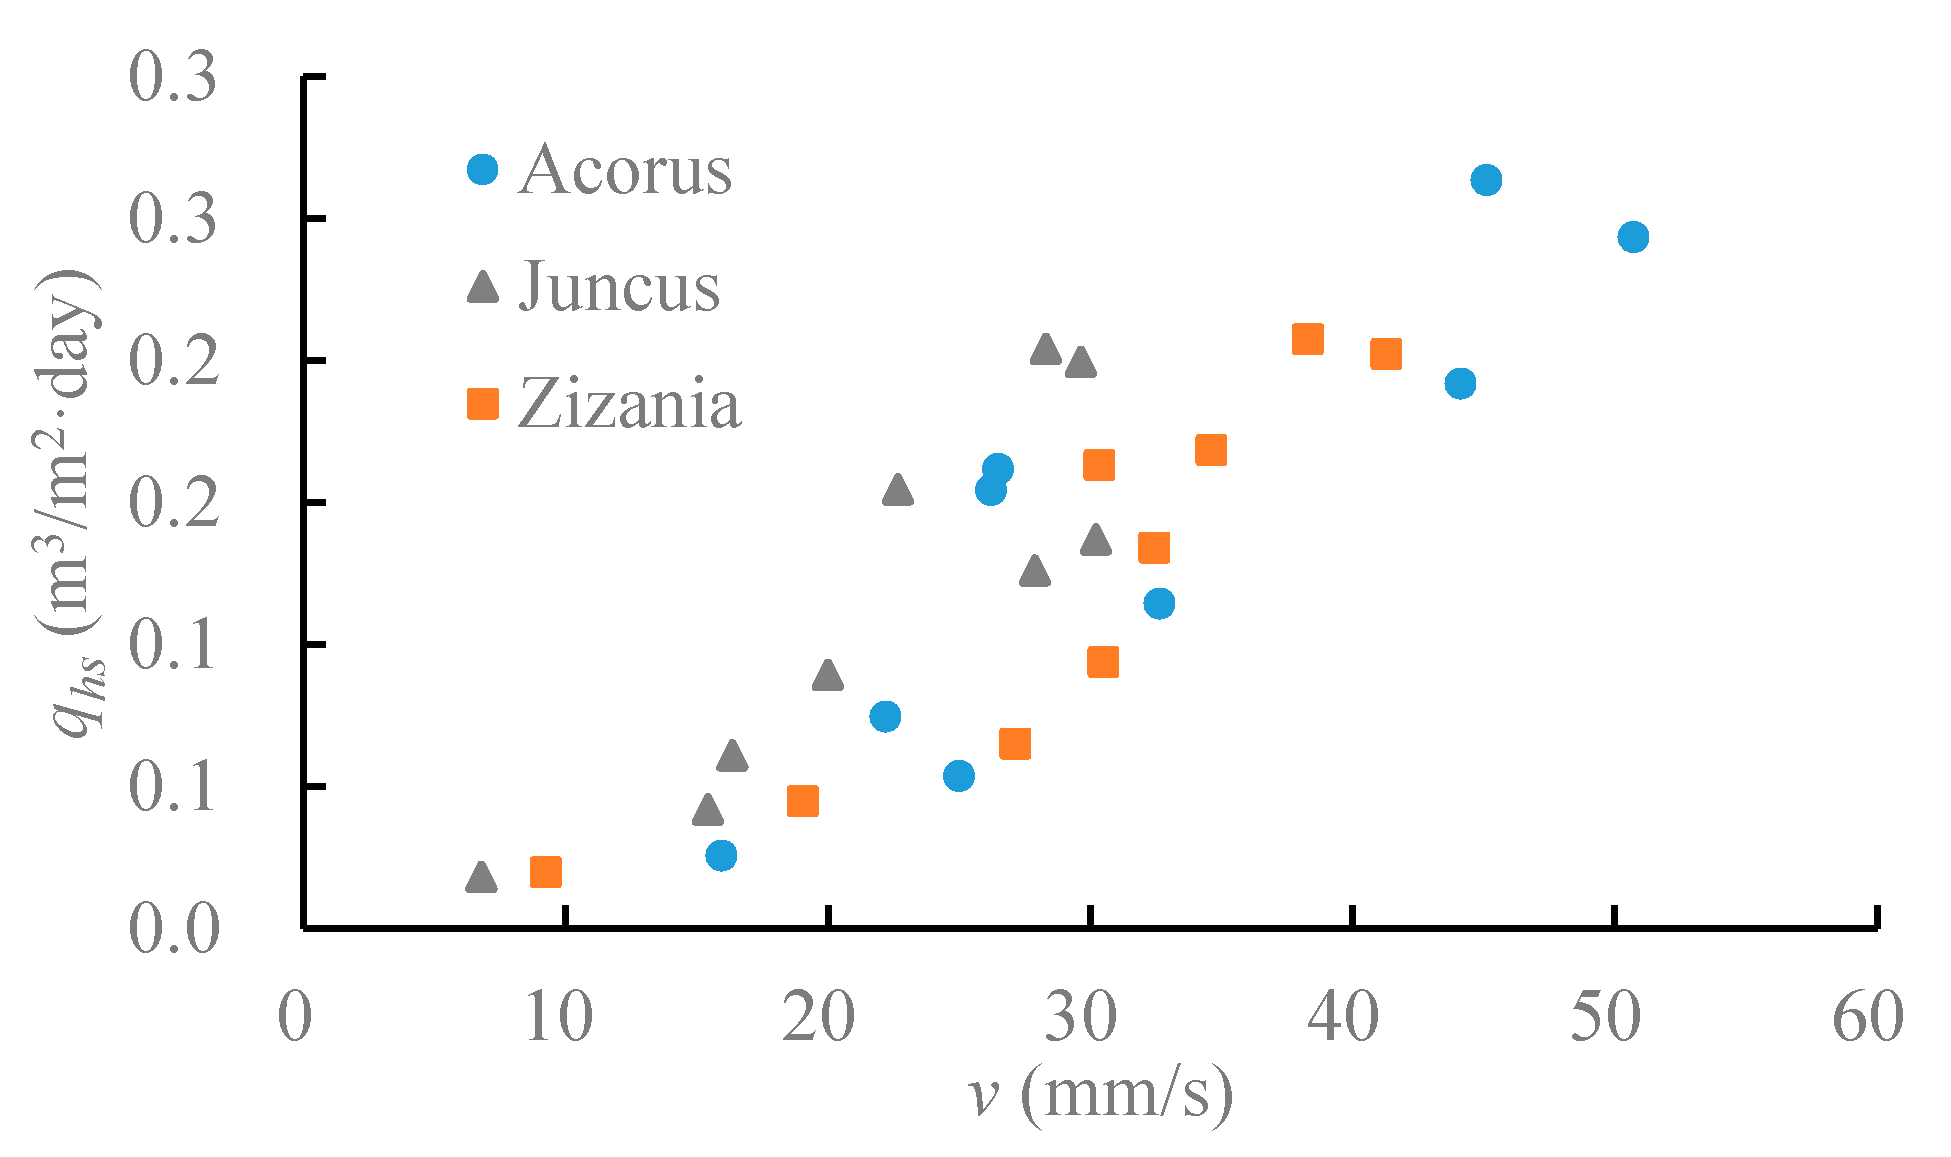
Standard length of the drainage ditch was 1000 m, according to previous assumption, based on which Equations (7), (8), and (10) were used to calculate the residence time and hydraulic surface loading of drainage ditches at different discharge flow rates, with their relationship with the average water velocity analyzed. Results suggested that the residence time of different drainage ditches lay between 0.98 and 4.32 days (Figure 7). As the flow rate rose, the residence time of drainage ditches with different plants declined. A comparison between different plants showed that and (Figure 8).
For a surface flow-constructed wetland, a longer residence time and smaller hydraulic surface loading would help with contamination removal. According to the design requirements for surface flow-constructed wetlands, residence time τa > 2 days, and hydraulic surface loading qhs < 0.1 m3/(m2·day). As indicated by Figure 7, the three kinds of plants met the requirements when the average surface flow velocity was less than 16.3 mm/s, during which the ditch showed excellent wetland characteristics.
4. Discussion
Compared with the result made by traditional flume experiment, drainage ditch roughness coefficient n in this study was 0.43–4.45, which was a relatively larger value that lay between the small natural river and the free surface flow-constructed wetland. (1) In traditional flume experiments, Rhee et al. [30] determined a roughness coefficient that was 0.029–0.195 using the combination of flume and real grass. Research made by Abood et al. [31] suggested that roughness coefficient was 0.01~0.23, and that roughness coefficient turned to the largest at a minimum water velocity or water depth. (2) In terms of a natural watercourse, Nikora et al. [32] investigated a number of natural rivers and channels in New Zealand, by which the roughness coefficient was determined, i.e., 0.027–0.56, with the maximum value measured in a small stream where plants flourished and the water velocity was 0.034–0.068 m/s. Test results by Sukhodolovet al. [33] also suggested a similar conclusion. (3) By summarizing the research results on a group of free surface flow-constructed wetlands, Kadlec et al. [34] determined a roughness coefficient that was between 0.18 and 4.0.
According to the research findings of plant resistance to water flow, the larger plant resistance to water flow meant a higher roughness coefficient when the longitudinal sections were basically the same, which, in the test, was manifested by the fact that Juncus’ drag resistance to water flow was the largest at the same flow rate, and that this ditch section showed the largest roughness coefficient. The reason why Juncus had the largest resistance was that the frontal face area of its stems was the largest per unit length. As indicated by Equation (3), when flow rate changed with the same kind of plant, its resistance to water flow rose as water flow increased, which accorded with test results. Additionally, as indicated by Equation (3), plant resistance to water flow increased with plant density, which caused the roughness coefficient of drainage ditch to increase. The experiment did not carry out plant density studies, such as cutting or removing parts of the plants though, according to Equation (2), plant density will impact water flow, further experimental study remains to be explored.
Test results regarding the drag coefficients Cd of different plants took on varied orders with plant resistance to water flow, revealing that the drag coefficient subject to the impact of plants on water flow showed different characteristics. In the test, the drag coefficient of Juncus varied in a minimum range as water flow changed, and this value was the smallest when the water flow rate was the same, suggesting that Juncus could cause a minimum drag force to water flow as other conditions remained the same. The traditional leaf area index (LAI) in this research was in the context of immersed surfaces and drag. The LAI below water and its vertical distribution are of interest, and a direct relation between them would be expected [33].
Correlation analysis of the plant drag coefficient Cd’, with respect to the impact of plant density and stem Reynolds number Res of plant stems, indicated different plants varied with each other regarding the correlation coefficient k that could be used to describe the characteristics of the drag effect of plants to water flow at different flow rates. As for the k number, in this research differs from 1.49 to 1.79. The trend that the drag coefficient decreases with the Reynolds number was confirmed by previous studies [35,36,37], while different studies have different k numbers—in Lee et al.’s study the k number was 0.70 [38], and in Wilson et al.’s study the k number varies from 1.50 to 1.85 [39]—and the value of k was thought to be related to the properties of vegetation.
Residence time of the drainage ditch was related to the flow and the wetland, though only in steady-state systems without excluded zones does the actual residence time equals the nominal residence time. In the experiment, the actual residence time was larger than the nominal time, meaning the drainage ditch’s volumetric efficiency was larger than most of the pond wetlands, in which the volumetric efficiency averaged 0.80 [34]. According to Equation (9), the nominal detention time can be simplified to when the longitudinal section was basically the same, where L is the ditch length and v is the average surface water velocity. When L remained the same, the residence time bore only an average water velocity. As indicated by Equation (7), increasing ditch length would prolong the residence time. When the ditch width remained basically the same, Equation (8) could be simplified to , showing that the hydraulic surface loading was only related to average depth h; the drainage ditch with Juncus showed the largest resistance, average water depth, and hydraulic surface loading at the same flow rate. As indicated by Equations (7)–(9), residence time could be increased and hydraulic surface loading could be reduced by increasing ditch width, which will require much more land.
From the above discussion, vegetated drainage ditches with smaller flow rates have larger ditch roughness coefficients, smaller plant resistance to water flow, larger drag coefficient of plants, a longer residence time, and a smaller hydraulic surface loading, which shows favorable wetland hydraulic characteristics. As the flow rate rose, the roughness coefficient decreased, plant resistance to water flow increased, the drag coefficient of plants to water flow increased, residence time was shortened, and hydraulic surface loading increased, which suggested that the flow rate increase caused hydraulic characteristics to decline, and the drainage ditch in such a condition was conducive to floodwater discharge. In the study site, the flow rate of the drainage ditch during daily subsurface water discharge was about 0.20 L/s, while the drainage discharge could peak to 3.5 L/s in the case of extreme storms, which, in the test results, was manifested by small drainage ditches not only showing excellent wetland hydraulic characteristics, but also satisfied floodwater discharge during storms.
5. Conclusions
An experimental study on drainage ditches with different plants at different flow rates was conducted, with hydraulic characteristics and wetland hydraulic parameter characteristics of small drainage ditches analyzed. The conclusions of this study are given as follows:
- (1)
- The roughness coefficient of the drainage ditch with vegetation declines as the water flow rate increases, with its value lying between that of the small natural river and that of the free surface flow-constructed wetland. When it comes to different plants, , the drainage ditch with vegetation is capable of floodwater discharge when the flow rate is large.
- (2)
- Plant resistance to water flow increases as the flow rate rises; for different plants the flow rate remains the same, , which is because the total stem area of Juncus in the upstream direction is the largest.
- (3)
- The plant drag coefficient Cd declines as the flow rate increases; the eigenvalue k of correlation coefficient of plant drag coefficient Cd’ without the impact of plant density and Reynolds number Res varies in different plants. When it comes to Juncus, Zizania latifolia, and Acorus calamus, this value k is 1.79, 1.65, and 1.49, respectively.
- (4)
- As the water flow rate rises, the residence time of the drainage ditch with vegetation, as a kind of band wetland, declines while the hydraulic surface loading becomes larger. Drainage ditches with vegetation show excellent wetland hydraulic performance when the flow rate is small.
Since several issues are not investigated, such as the influence of vegetation during storms, seasonal aspects, or the influence on sedimentation, small drainage ditches with vegetation feature both excellent wetland hydraulic characteristics during daily drainage and outstanding floodwater discharge capacity during storms. With both favorable hydraulic characteristics and excellent wetland hydraulic characteristics, such drainage ditches with vegetation can be extensively used in irrigation districts.
Acknowledgments
The research work was funded by the National Natural Science Foundation of China (51579184). We acknowledge Jiangxi Provincial Irrigation Experimental Station support for providing experiment land and instruments.
Author Contributions
Shujun Zhao conceived and designed the experiments, Peifeng Li performed the experiments; Shujun Zhao and Peifeng Li analyzed the data; Yuanlai Cui and Yufeng Luo contributed to the analysis work; and Shujun Zhao and Yuanlai Cui wrote the paper.
Conflicts of Interest
The authors declare no conflict of interest.
References
- Needelman, B.A.; Kleinman, P.J.A.; Strock, J.S.; Allen, A.L. Improved management of agricultural drainage ditches for water quality protection: An overview. J. Soil Water Conserv. 2007, 62, 171–178. [Google Scholar]
- Ree, W.O.; Palmer, V.J. Flow of Water in Channels Protected by Vegetative Linings; USA Department of Agriculture: Washington, DC, USA, 1949.
- Kouwen, N.; Unny, T.; Hill, H.M. Flow retardance in vegetated channels. J. Irrig. Drain. Div. 1969, 95, 329–344. [Google Scholar]
- Kouwen, N. Modern approach to design of grassed channels. J. Irrig. Drain. Eng. 1992, 118, 733–743. [Google Scholar] [CrossRef]
- Kouwen, N.; Fathi-Moghadam, M. Friction factors for coniferous trees along rivers. J. Hydraul. Eng. 2000, 126, 732–740. [Google Scholar] [CrossRef]
- Wu, F.-C.; Shen, H.W.; Chou, Y.-J. Variation of roughness coefficients for unsubmerged and submerged vegetation. J. Hydraul. Eng. 1999, 125, 934–942. [Google Scholar] [CrossRef]
- Huai, W.-X.; Han, J.; Zeng, Y.-H.; An, X.; Qian, Z.-D. Velocity distribution of flow with submerged flexible vegetations based on mixing-length approach. Appl. Math. Mech. 2009, 30, 343–351. [Google Scholar] [CrossRef]
- Hu, Y.; Huai, W.; Han, J. Analytical solution for vertical profile of streamwise velocity in open-channel flow with submerged vegetation. Environ. Fluid Mech. 2013, 13, 389–402. [Google Scholar] [CrossRef]
- Lightbody, A.; Nepf, H. Prediction of near-field shear dispersion in an emergent canopy with heterogeneous morphology. Environ. Fluid Mech. 2006, 6, 477–488. [Google Scholar] [CrossRef]
- Luhar, M.; Nepf, H.M. Flow-induced reconfiguration of buoyant and flexible aquatic vegetation. Limnol. Oceanogr. 2011, 56, 2003–2017. [Google Scholar] [CrossRef]
- Nepf, H.M. Hydrodynamics of vegetated channels. J. Hydraul. Res. 2012, 50, 262–279. [Google Scholar] [CrossRef]
- Tiner, R.W. Wetland definitions and classifications in the united states. In National Water Summary on Wetland Resources; Fretwell, J.D., Williams, J.S., Redman, P.J., Eds.; USA Geological Survey: Reston, VA, USA, 1996; Volume 2425, pp. 27–34. [Google Scholar]
- Liu, W.-L.; Deng, W.; Wang, G.-X.; Li, A.-M.; Zou, J. Aquatic macrophyte status and variation characteristics in the past 50 years in hongzehu lake. J. Hydroecol. 2009, 6, 1079–1083. [Google Scholar]
- Armitage, P.D.; Szoszkiewicz, K.; Blackburn, J.H.; Nesbitt, I. Ditch communities: A major contributor to floodplain biodiversity. Aquat. Conserv. Mar. Freshw. Ecosyst. 2003, 13, 165–185. [Google Scholar] [CrossRef]
- Mazerolle, M.J. Drainage ditches facilitate frog movements in a hostile landscape. Landsc. Ecol. 2005, 20, 579–590. [Google Scholar] [CrossRef]
- Wu, P.; Chen, Y.; Zhao, Y.; Hu, Y.; Huang, L.; Zhang, Z. Plant species diversity in agricultural drainage ditches in lingwu district of ningxia, northwest china. Chin. J. Ecol. 2011, 30, 2790–2796. [Google Scholar]
- Cheng, Z.; He, T.-H.; Guo, L.-H.; Zhang, Y.-F. Preliminary research of the structure of higher plant community in the wet land of ditches and canals on yinchuan plain. J. Agric. Sci. 2010, 31, 40–43. [Google Scholar]
- Kröger, R.; Holland, M.; Moore, M.; Cooper, C. Hydrological variability and agricultural drainage ditch inorganic nitrogen reduction capacity. J. Environ. Qual. 2007, 36, 1646–1652. [Google Scholar] [CrossRef] [PubMed]
- He, J.; Cui, Y.; Lv, L.; Yi, F.; Duan, Z. Experiments on removal effects of ditch-pond wetland system on n and p pollutants from paddy field. J. Agro-Environ. Sci. 2011, 30, 1872–1879. [Google Scholar]
- Peng, S.-Z.; Gao, H.-Z.; Zhang, Z.-L. Effect of pond wetland on n and p removal in drainage water from paddy field and its mechanism. J. Hydraul. Eng. 2010, 41, 406–411. [Google Scholar]
- Jiang, C.; Fan, X.; Cui, G.; Zhang, Y. Removal of agricultural non-point source pollutants by ditch wetlands: Implications for lake eutrophication control. Hydrobiologia 2007, 581, 319–327. [Google Scholar] [CrossRef]
- Alexander, R.B.; Smith, R.A.; Schwarz, G.E. Effect of stream channel size on the delivery of nitrogen to the gulf of mexico. Nature 2000, 403, 758–761. [Google Scholar] [CrossRef] [PubMed]
- Applegate, C.S.; Wilder, B.; DeShaw, J.R. Total nitrogen removal in a multi-channel oxidation system. Water Pollut. Control Fed. 1980, 52, 568–577. [Google Scholar]
- Stern, D.A.; Khanbilvardi, R.; Alair, J.C.; Richardson, W. Description of flow through a natural wetland using dye tracer tests. Ecol. Eng. 2001, 18, 173–184. [Google Scholar] [CrossRef]
- Sutherland, W.J. The Conservation Handbook: Research, Management and Policy; John Wiley & Sons: Hoboken, NJ, USA, 2008. [Google Scholar]
- Arcement, G.J., Jr.; Schneider, V.R. Guide for Selecting Manning’s Roughness Coefficients for Natural Channels and Flood Plains; USA Government Printing Office: Washington, DC, USA, 1989.
- Petryk, S.; Bosmajian, G., III. Analysis of flow through vegetation. J. Hydraul. Division 1975, 101, 871–884. [Google Scholar]
- Kadlec, R.H. Detention and mixing in free water wetland. Ecol. Eng. 1994, 3, 345–380. [Google Scholar] [CrossRef]
- Technical Specification of Constructed Wetlands for Wastewater Treatment Engineering; Ministry of Environment Protection the People’s Republic of China: Beijing, China, 2010.
- Rhee, D.S.; Woo, H.; Kwon, B.; Ahn, H.K. Hydraulic resistance of some selected vegetation in open channel flows. River Res. Appl. 2008, 24, 673–687. [Google Scholar] [CrossRef]
- Abood, M.M.; Yusuf, B.; Mohammed, T.A.; Ghazali, A.H. Manning roughness coefficient for grass-lined channel. J. Sci. Technol. 2006, 13, 317–330. [Google Scholar]
- Nikora, V.; Larned, S.; Nikora, N.; Debnath, K.; Cooper, G.; Reid, M. Hydraulic resistance due to aquatic vegetation in small streams: Field study. J. Hydraul. Eng. 2008, 134, 1326–1332. [Google Scholar] [CrossRef]
- Sukhodolov, A.N.; Sukhodolova, T.A. Case study: Effect of submerged aquatic plants on turbulence structure in a lowland river. J. Hydraul. Eng. 2009, 136, 434–446. [Google Scholar] [CrossRef]
- Kadlec, R.H.; Wallace, S. Treatment Wetlands, 2nd ed.; CRC press: Boca Raton, FL, USA, 2008; pp. 37–40. [Google Scholar]
- Mazda, Y.; Wolanski, E.; King, B.; Sase, A.; Ohtsuka, D.; Magi, M. Drag force due to vegetation in mangrove swamps. Mangroves Salt Marshes 1997, 1, 193–199. [Google Scholar] [CrossRef]
- Mei, R. An approximate expression for the shear lift force on a spherical particle at finite reynolds number. Int. J. Multiph. Flow 1992, 18, 145–147. [Google Scholar] [CrossRef]
- Abraham, F.F. Functional dependence of drag coefficient of a sphere on reynolds number. Phys. Fluids 1970, 13, 2194–2195. [Google Scholar] [CrossRef]
- Lee, J.K.; Roig, L.C.; Jenter, H.L.; Visser, H.M. Drag coefficients for modeling flow through emergent vegetation in the florida everglades. Ecol. Eng. 2004, 22, 237–248. [Google Scholar] [CrossRef]
- Wilson, C. Flow resistance models for flexible submerged vegetation. J. Hydrol. 2007, 342, 213–222. [Google Scholar] [CrossRef]
Figure 1.
Designed section of drainage ditch and that after years of operation.
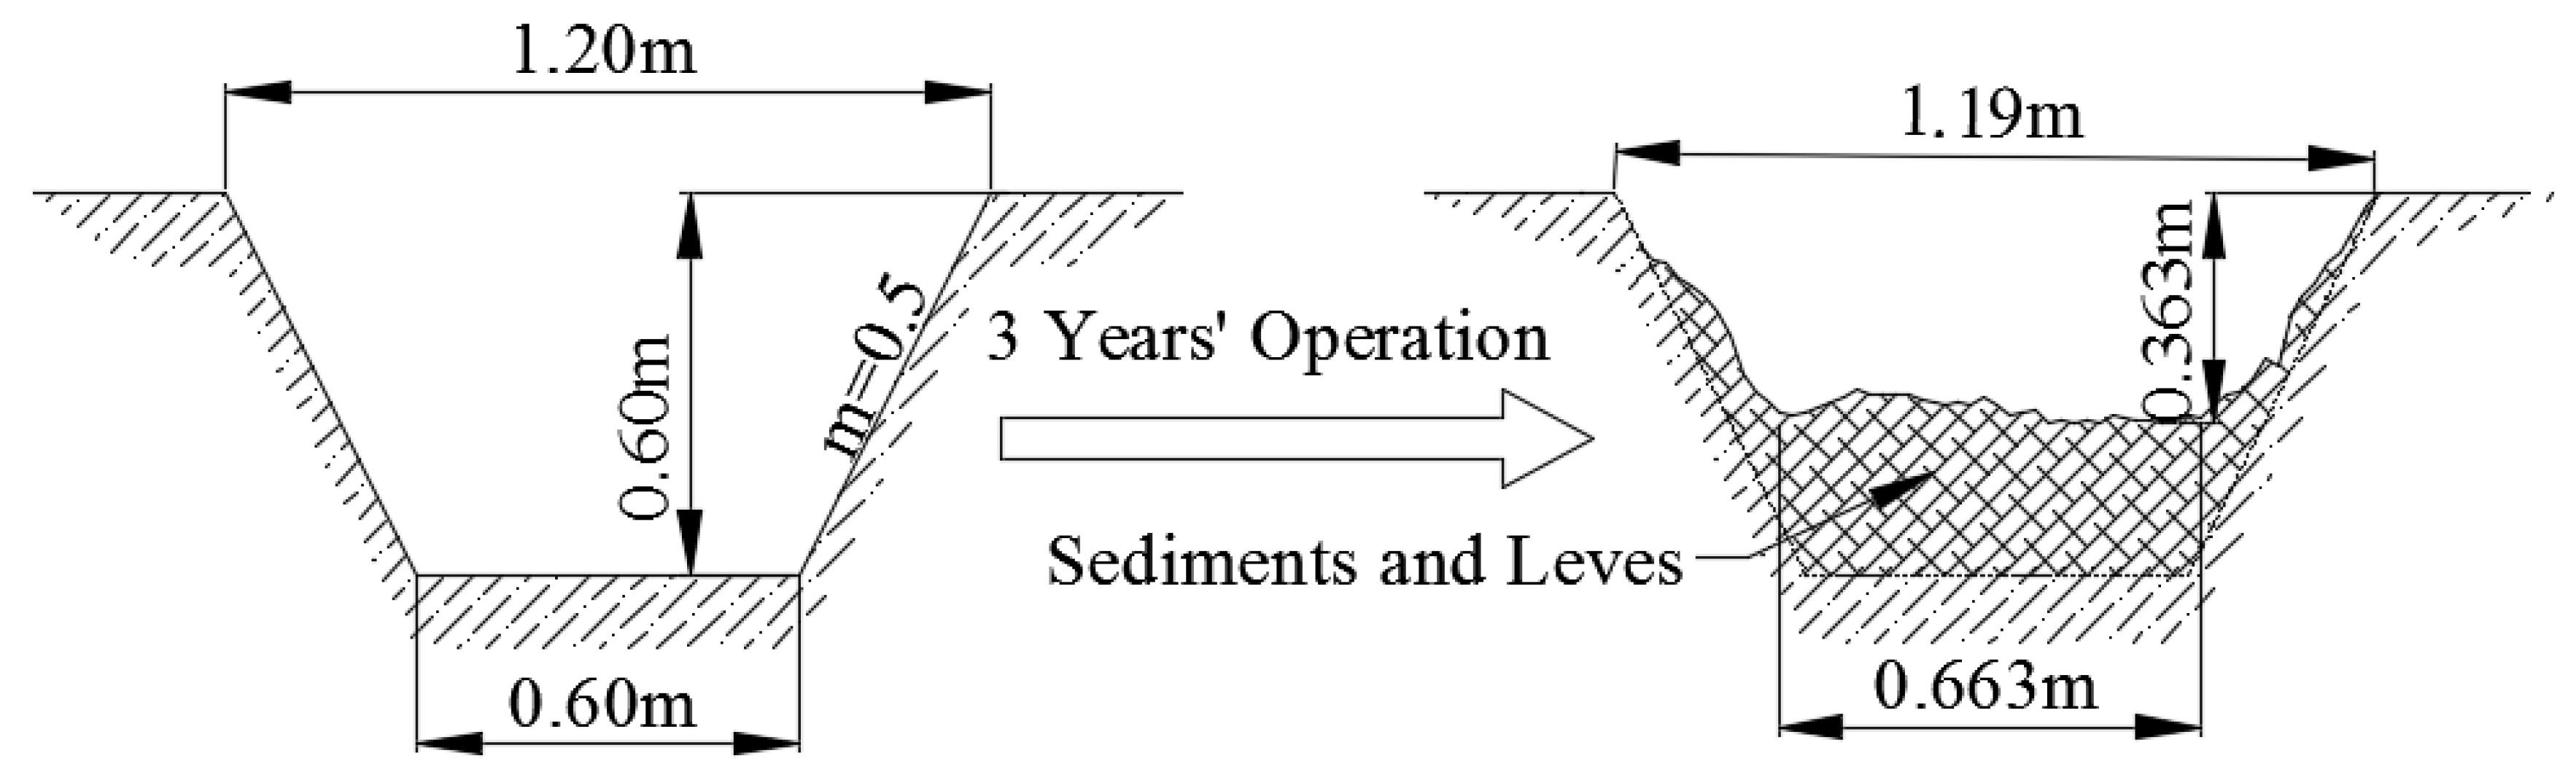
Figure 2.
Drainage ditch sections with different plants: (a) Juncus; (b) Acorus Calamus; and (c) Zizania Latifolia.
Figure 2.
Drainage ditch sections with different plants: (a) Juncus; (b) Acorus Calamus; and (c) Zizania Latifolia.
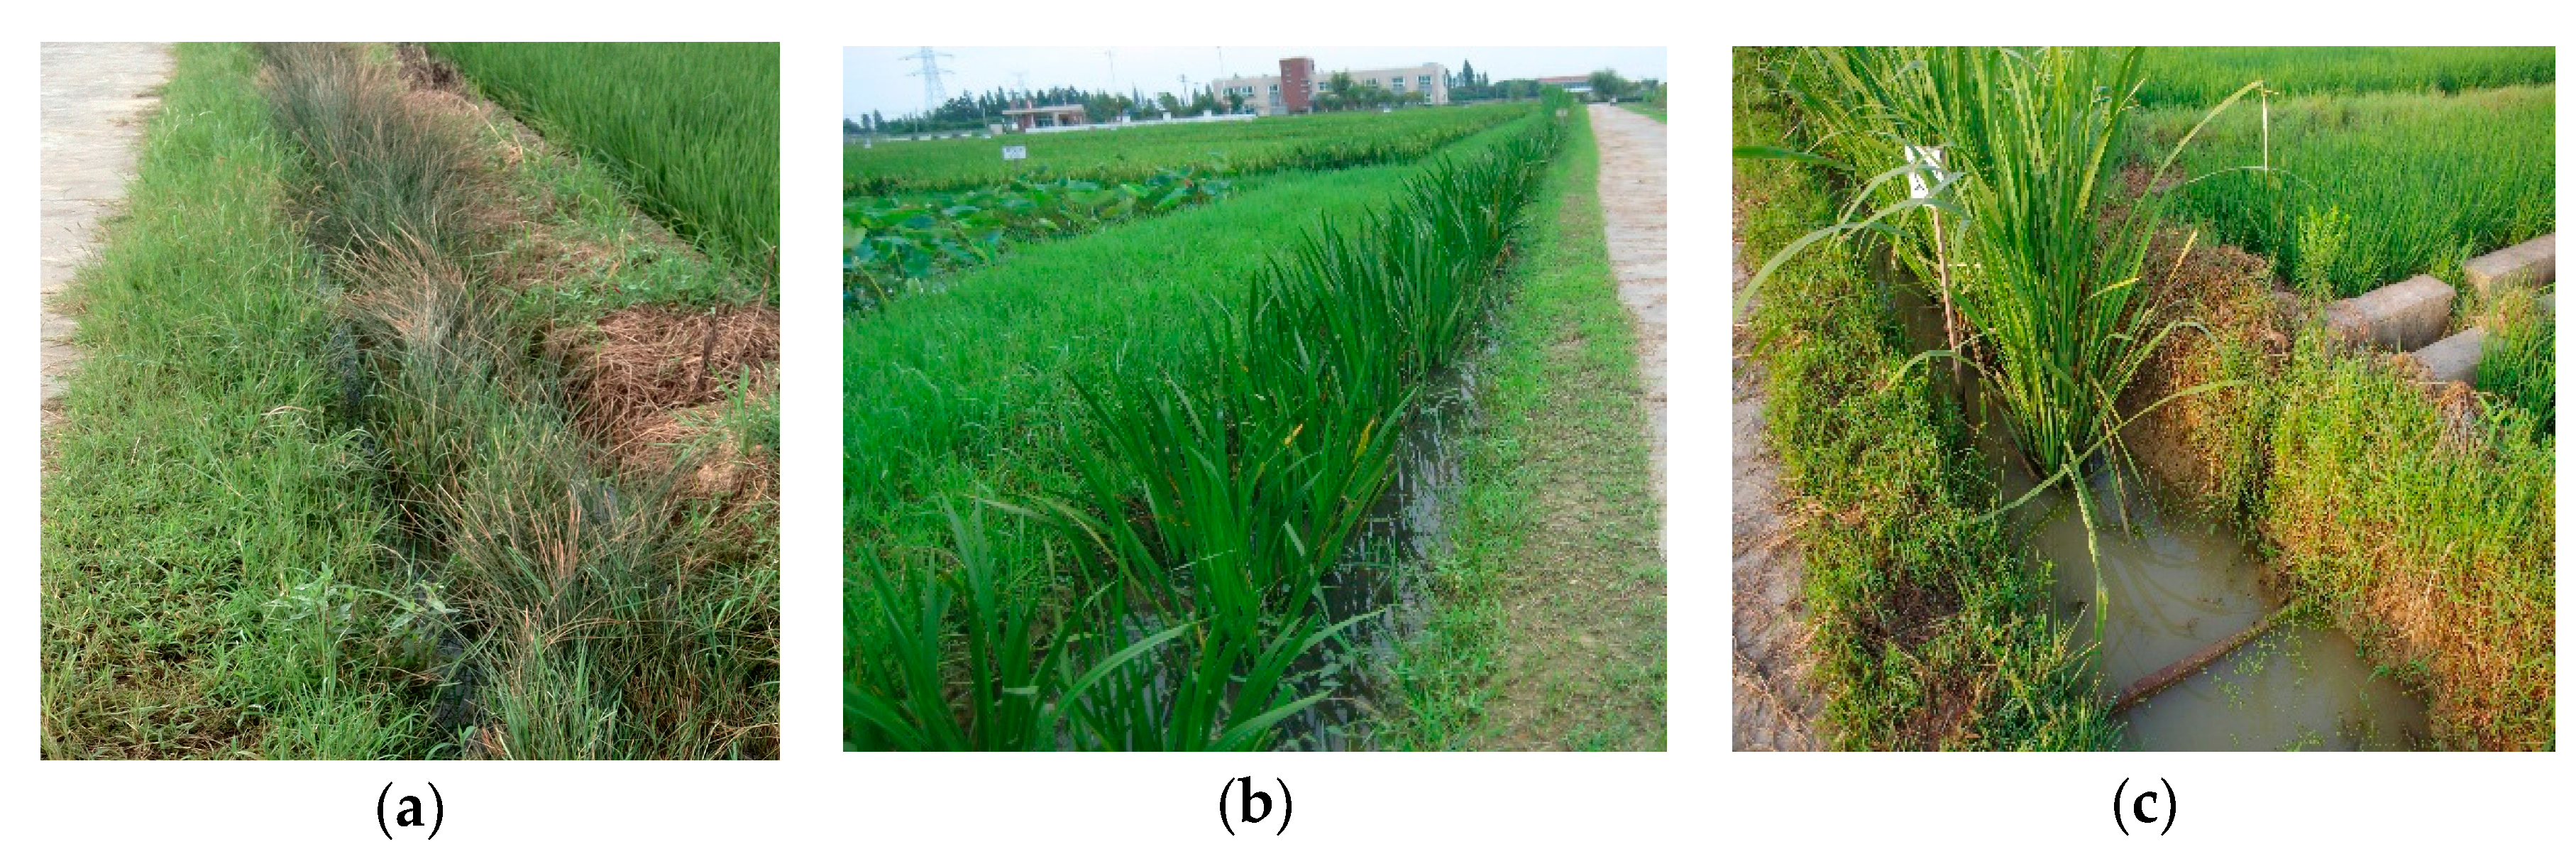
Figure 3.
Roughness coefficient of drainage ditches with different plants at varied discharge flow rates.
Figure 3.
Roughness coefficient of drainage ditches with different plants at varied discharge flow rates.

Figure 4.
Drag coefficient of different plants with varied discharge flow rates.
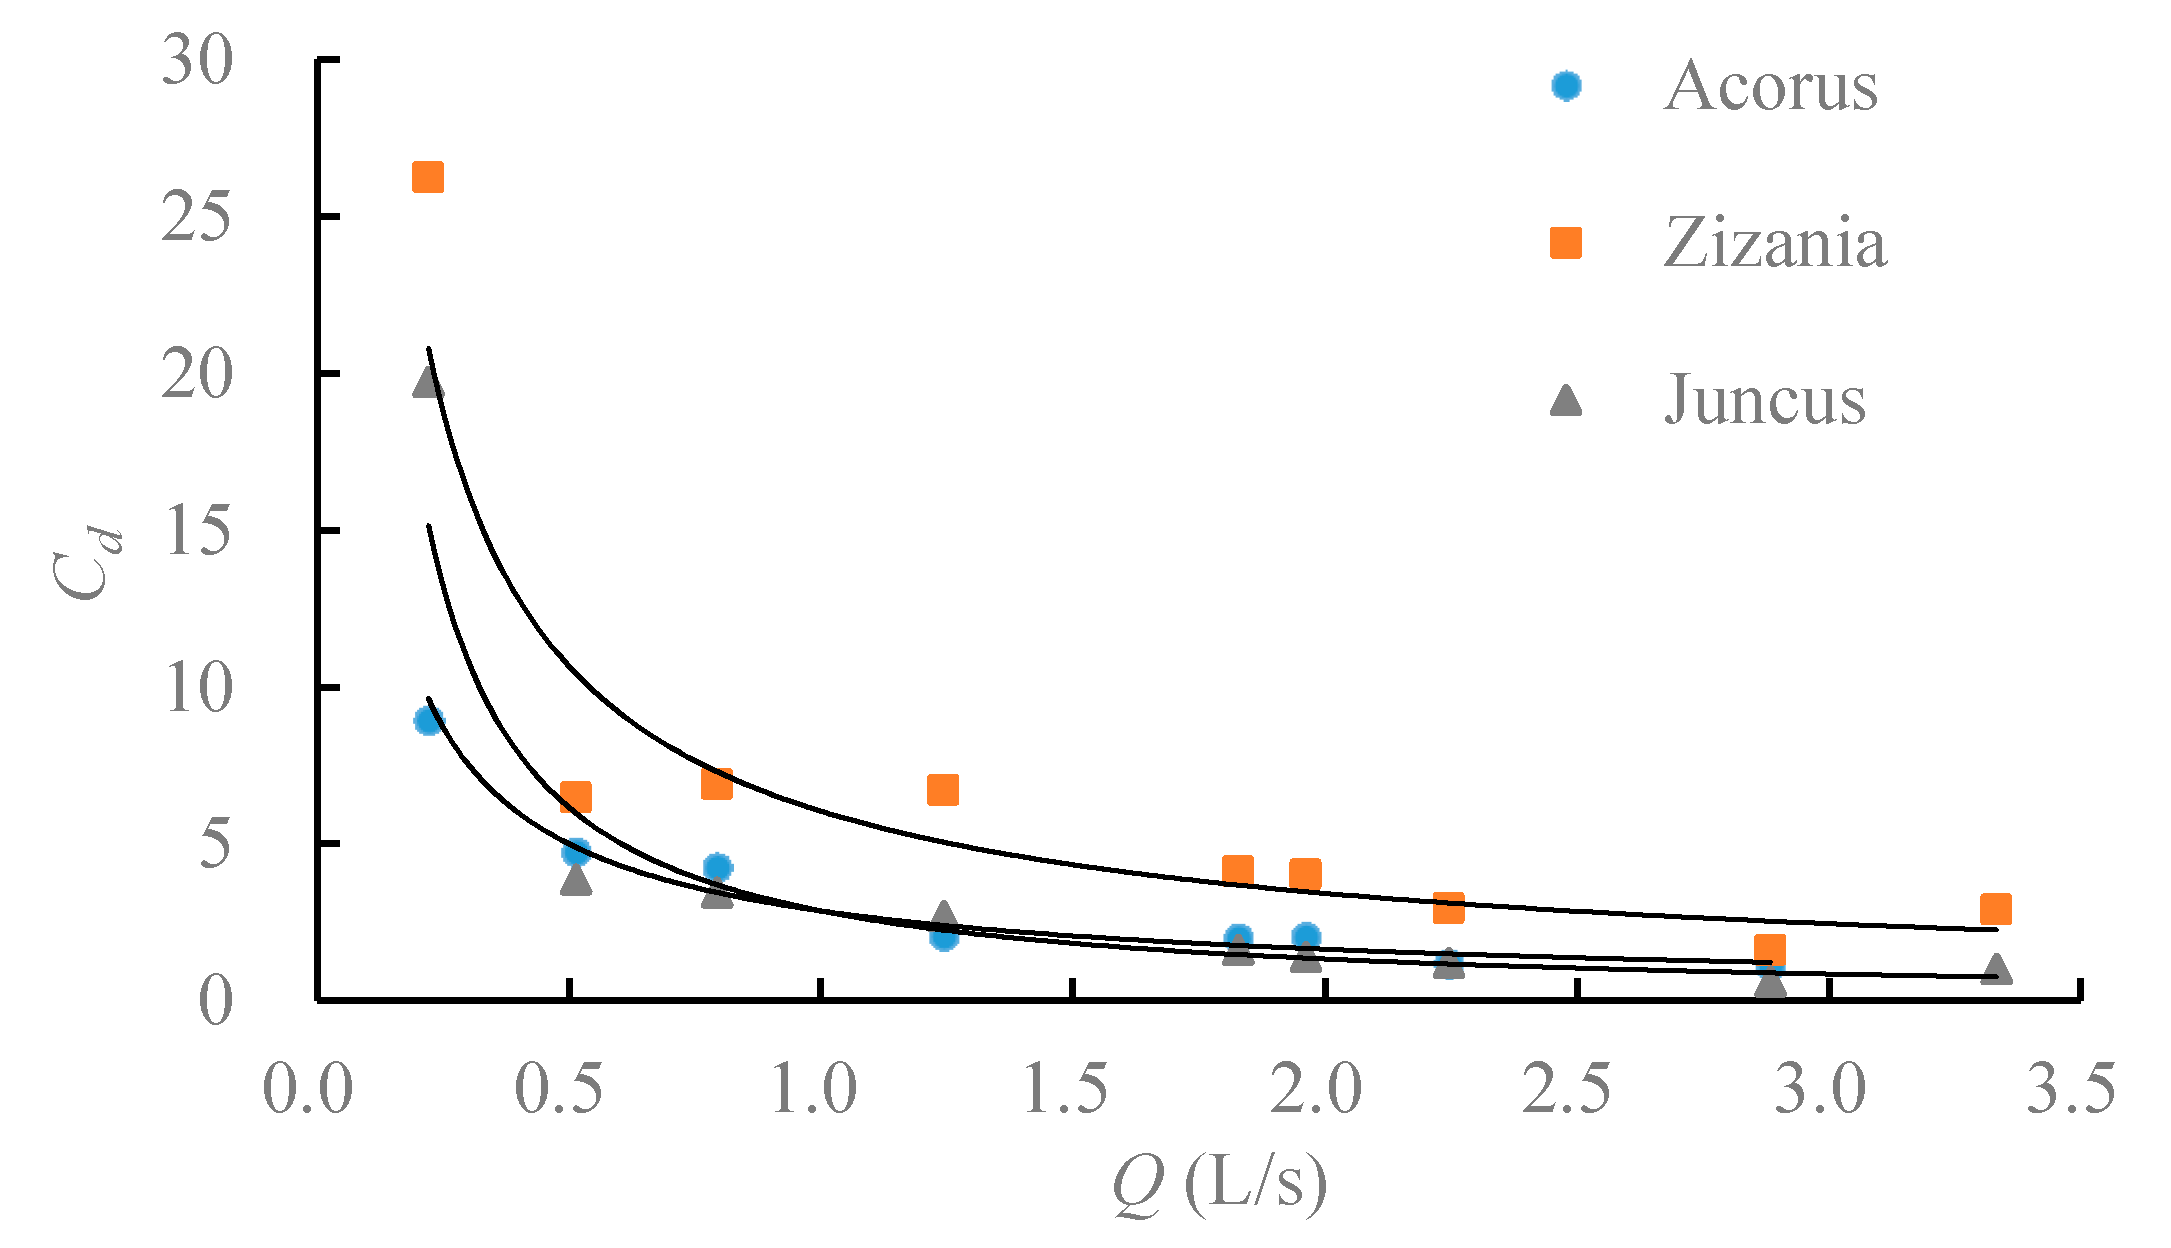
Figure 5.
Resistance of different plants to water flow with varied discharge flow rates.

Figure 6.
Correlation between the plant drag coefficient and the stem Reynolds number.

Figure 7.
Residence time of a drainage ditches with vegetation.
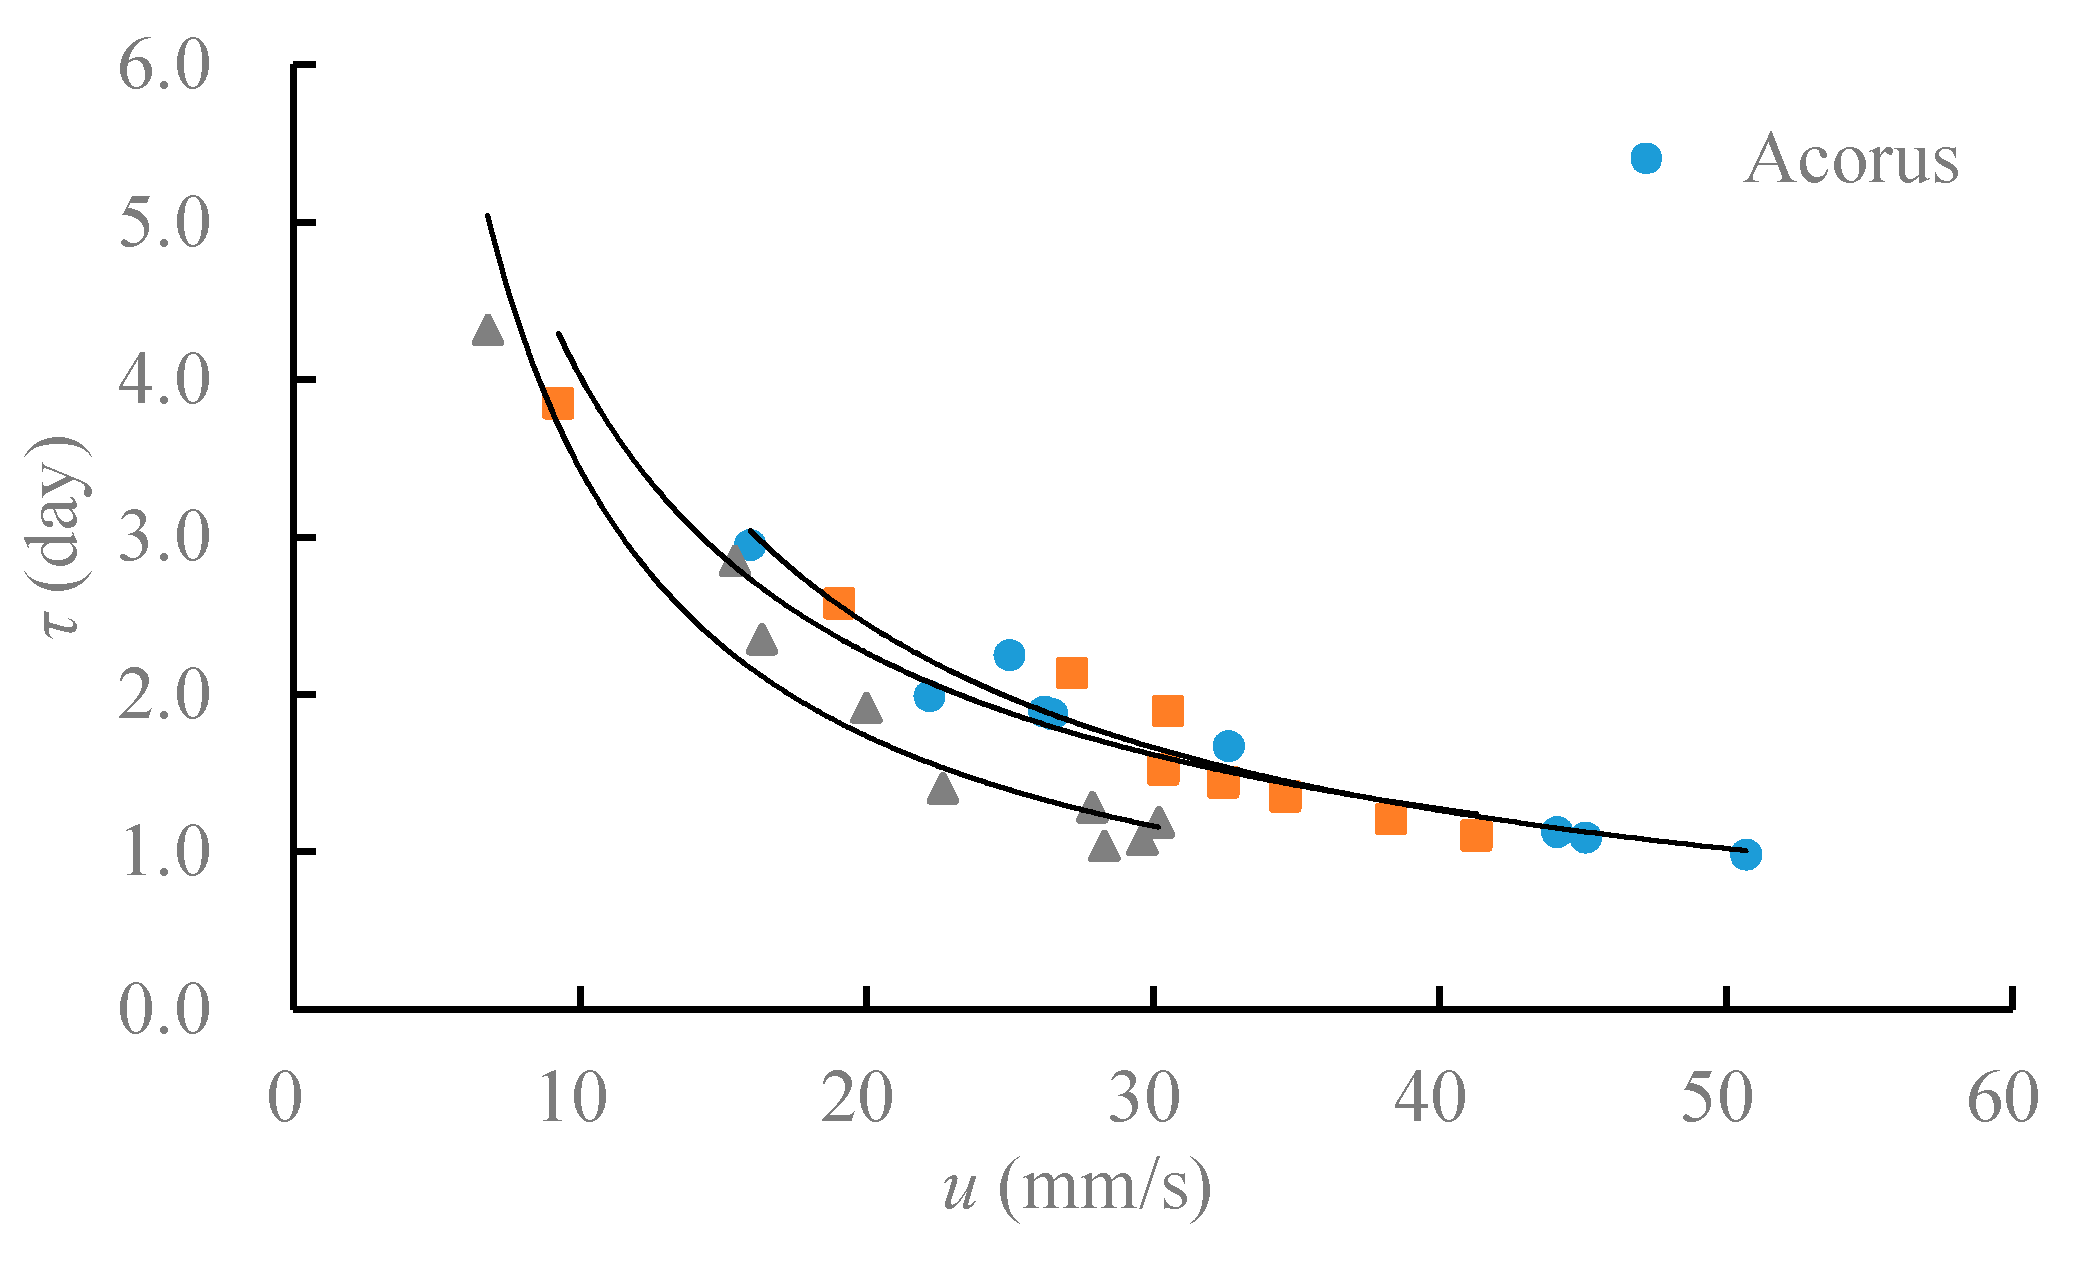
Figure 8.
Hydraulic surface loading of a drainage ditches with vegetation.
© 2017 by the authors. Licensee MDPI, Basel, Switzerland. This article is an open access article distributed under the terms and conditions of the Creative Commons Attribution (CC BY) license (http://creativecommons.org/licenses/by/4.0/).
Share and Cite
MDPI and ACS Style
Zhao, S.; Cui, Y.; Luo, Y.; Li, P. Experimental Study on Wetland Hydraulic Characteristics of Vegetated Drainage Ditches. Water 2017, 9, 311. https://doi.org/10.3390/w9050311
AMA Style
Zhao S, Cui Y, Luo Y, Li P. Experimental Study on Wetland Hydraulic Characteristics of Vegetated Drainage Ditches. Water. 2017; 9(5):311. https://doi.org/10.3390/w9050311
Chicago/Turabian StyleZhao, Shujun, Yuanlai Cui, Yufeng Luo, and Peifeng Li. 2017. "Experimental Study on Wetland Hydraulic Characteristics of Vegetated Drainage Ditches" Water 9, no. 5: 311. https://doi.org/10.3390/w9050311
Note that from the first issue of 2016, this journal uses article numbers instead of page numbers. See further details here.