Article

The Relationship between Effective and Equitable Water Allocation, Local Rice Farmer Participation and Economic Well-Being: Insights from Thailand’s Chiang Mai Province

Agribusiness Management, Agricultural Systems and Engineering, School of Environment, Resources and Development Asian Institute of Technology, Klong Luang, Pathumthani 12120, Thailand
*
Author to whom correspondence should be addressed.
Water 2017, 9(5), 319; https://doi.org/10.3390/w9050319
Submission received: 25 January 2017 / Revised: 24 April 2017 / Accepted: 25 April 2017 / Published: 2 May 2017

Abstract

:
This research investigates the relationship between equitable water allocation, participation in the local irrigation operation, and improved economic well-being. The study area consisted of the rice-growing districts of Doi Saket and Mae On in Thailand’s northern province Chiang Mai, where locals have adopted a participatory farmer-managed irrigation system. The samples were 150 small-scale rice farmers who were divided into four groups by their membership: community irrigation (CI); community irrigation and enterprise (CIE); and farmland location (head-end or tail-end of the irrigation canal). The findings revealed a strong relationship between the three variables. Specifically, despite less advantageous farmland locations, the tail-end CI farmers outperformed in the dry-season and annual paddy yields per household. The higher paddy yields translated into higher household earnings. The improved economic well-being of the tail-end CI farmers could be attributed to their active participation in the local irrigation operation. Another contributing factor was equitable water allocation, which is the product of the farmers’ active participation as their irrigation demands and concerns are constantly acknowledged and addressed. Importantly, the findings verified the effectiveness and usability of the participatory irrigation system in tackling the problem of inequitable water allocation between the head-end and tail-end farmers. Moreover, the participatory irrigation scheme was readily implementable since it required no additional investment, only active local participation.

1. Introduction

In general, the economic well-being of farmers is closely tied to the degree of their involvement in the management and allocation of irrigated water. The farmer-managed irrigation system contributes to higher agricultural yields and greater earnings. In other words, a positive correlation exists between an irrigation management system that encourages the participation of local farmers, and increased farm productivity and higher incomes [1,2,3,4,5,6,7,8,9,10].
By the 1990s, Thailand had decentralized the governance of natural resources, conferring greater responsibilities upon sub-district administrations and providing fiscal opportunities for local development planning [11]. Irrigation officials were in charge of involving the wider public in information and consultation in the water governance processes [12]. Participation in agricultural water management by farmers and local leaders were coordinated by government agencies at the local level, and subsequently developed a collaborative water distribution plan [11]. The success of an irrigation system is largely governed by the participative dynamics between the resource appropriators and other actors [13,14,15]. Moreover, participatory irrigation management promotes the equitable and sustainable use of water, and contributes to increased farm productivity and improved economic well-being [16]. Participatory irrigation management is ideal for successful and sustainable irrigation management [17] where the participation-based equitable water allocation and increased crop yields and earnings are positively correlated. The contributions of various stakeholders in working closely with irrigation policy and management (e.g., information and time schedule) of the local irrigation system are essential [17]. Furthermore, the participatory irrigation system safeguards the interests of other stakeholders with differing desires and purposes for water use [18].
The efficient and equitable water allocation between farmers at the head-end and tail-end of an irrigation network is crucial to the livelihoods and sustainability of the farming community along the irrigation network [19]. This is of particular concern as the farmlands near the head-end of an irrigation network normally benefit from the constant supply of irrigated water, whereas those towards the tail-end are often faced with irregular water supply. In fact, efficient irrigation practices have contributed to an increase in paddy yields [20,21,22,23,24,25]. In Thailand, rice is the essence of life. It permeates all aspects of the lives of people from all walks of life. The influence of rice is not only felt at the level of ordinary citizens, it also prescribes the roles and responsibilities of government leaders [26]. However, increasing population and consumer demand places more burden upon the world’s small-scale rice farmers. Rice production could be increased through better understanding of input-use efficiency and effectiveness [27]. Existing research on the relationship between equitable water distribution, participation in the local irrigation operation, and improved economic well-being of Thai farmers is very limited.
Therefore, this research investigates the relationship between equitable irrigation water distribution, the active participation of rice farmers in the local irrigation operation, and their economic well-being. The study area was the rice-growing districts of Doi Saket and Mae On in Thailand’s northern province of Chiang Mai, where the local residents have embraced the participatory farmer-managed irrigation system. The district of Doi Saket is located at the head-end of the Mae Kuang irrigation canal, and Mae On is towards the tail-end of the irrigation system. The samples included 150 rice farmers from the Doi Saket and Mae On districts. The rice farmers were divided into four groups according to their membership (i.e., a community irrigation (CI) member or a community irrigation and enterprise (CIE) member) and farmland location (i.e., head-end or tail-end of the irrigation system).
In this study, the CI members were local farmers who had mutually agreed to a set of rules and restrictions regarding irrigation water management, and participated in local irrigation operation and management. Their single source of income was from the sale of paddy rice to the nearby rice mills. In contrast, the CIE members were local farmers participating in the running of the local irrigation operation who sold paddy seeds through the local community enterprise and the leftovers to the local rice mills. The paddy seed community enterprise is a channel through which paddy farmer-members can efficiently supply (sell) their crops to various markets. Like the CI, the CIE members have agreed on a set of protocols regarding water allocation and management. Both CI and CIE groups selected for the questionnaire were registered with the government and relied on irrigated water from the left main canal of the Mae Kuang irrigation canal. However, unlike the CI, CIE members are provided with business information and access to different markets.

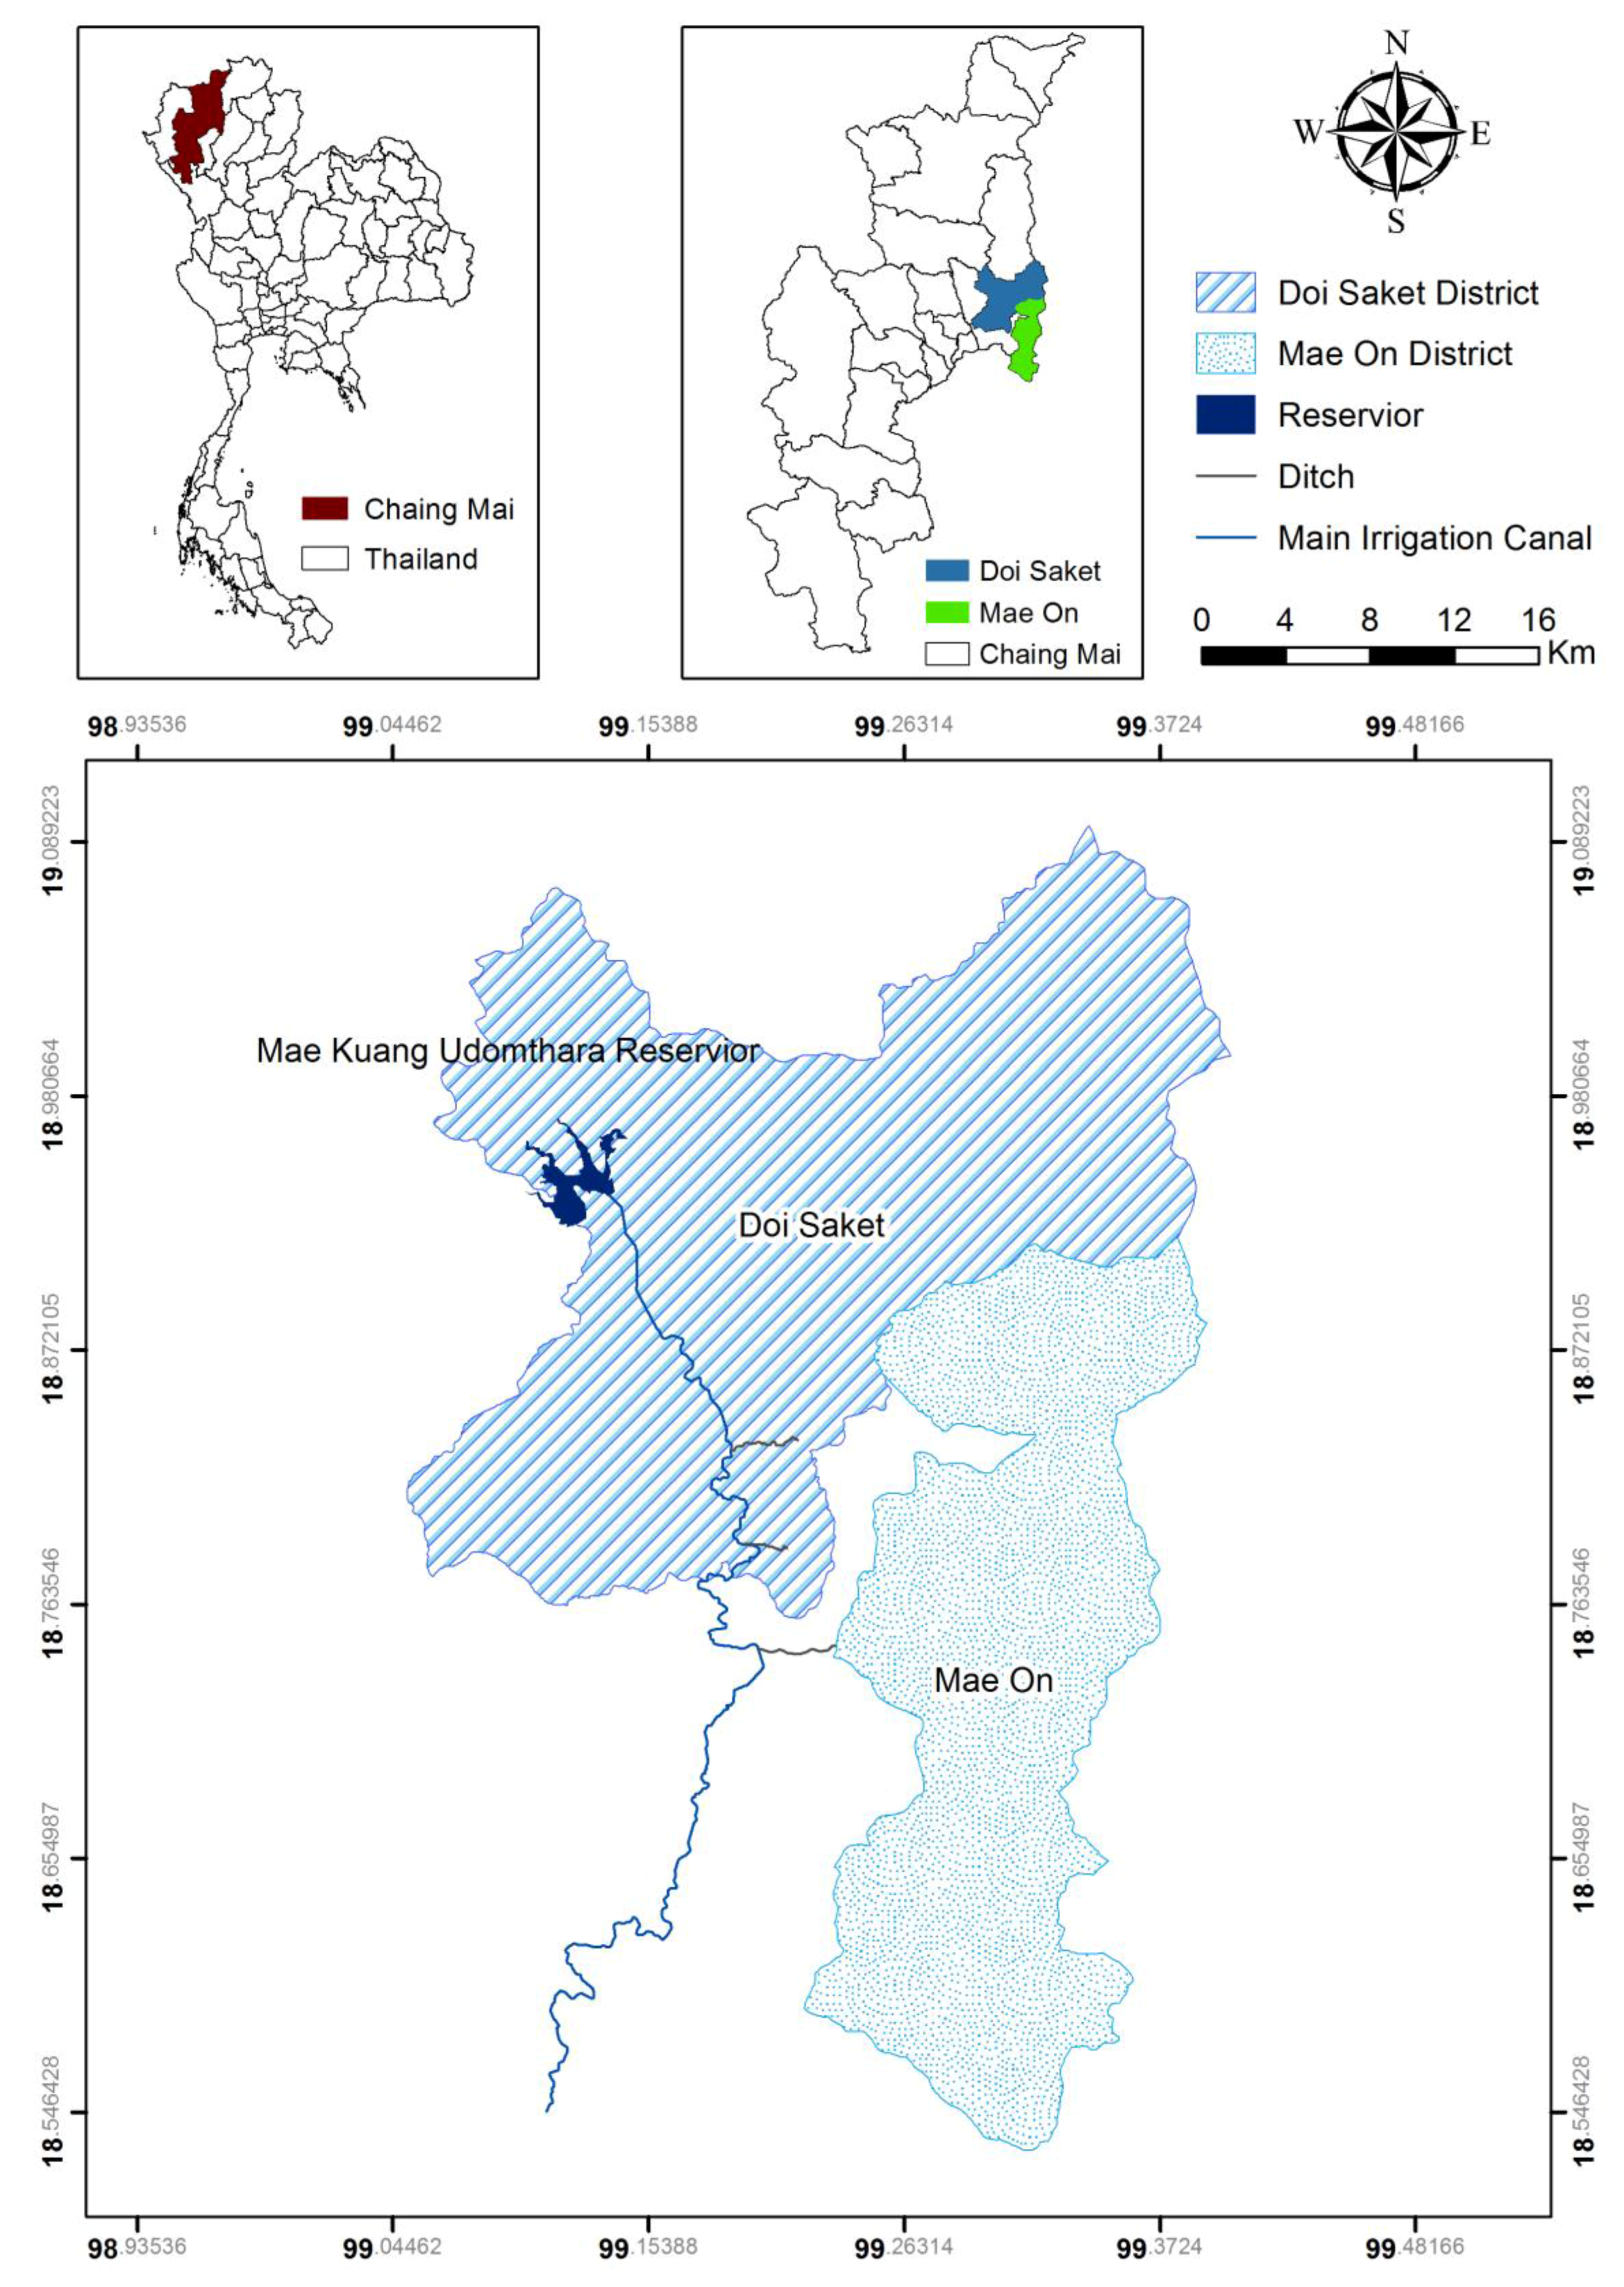
2. Materials and Methods

As stated previously, effectiveness and fairness of water allocation performance are important aspects of the economic viability of irrigation projects. The issues addressed in these performance parameters [28] include whether: (a) a sufficient volume of water is available to irrigate the crops being grown; (b) farmer groups are provided with an equitable water distribution service and their fair share of water; (c) water is delivered when it is needed, and at the required flow rate and duration; and (d) the water is effectively utilized [29]. The water-delivery-service performance measures deal with issues of water volume, flexibility (adequacy), reliability, and equity [30,31].
In this research, data collection was conducted using a questionnaire. Prior to the collection of data, a group of local farmers were informally interviewed to gather preliminary data for questionnaire development. The questionnaire included the respondents’ demographics, land use, access to irrigation, participation in the local irrigation operation, and income sources. In addition, data on farm size, paddy yields, their reactions on the current irrigation operation and practices, and the aggregate household incomes were collected. The research sample size consisted of 150 small-scale rice farmers. The participating farmers were divided into four groups consisting of 23 CI and 43 CIE head-end farmers, and 23 CI and 61 CIE tail-end farmers. The smaller sample of CI farmers (46 vs. 104) was attributed to the fact that many CI farmers travelled to the city or Bangkok to seek employment for supplementary income. The data collection was carried out from 2014–2015 through structured interview sessions using a questionnaire, and the results were aggregated based on the positive responses given by the participants [32]. The interview sessions were carried out with the assistance of the local office of the Royal Irrigation Department (RID) and Chiang Mai’s Cooperative Auditing Department (CAD).
The test statistics of the Exact Sig. (2-sided) and the Monte Carlo Sig. (2-sided) of Chi-Square, and linear regression correlations were used to analyze the relationship between the irrigation practices (i.e., equitable water allocation), the participation of the local farmers in the irrigation operation, yield and their household incomes. To examine the effectiveness and fairness of the water allocation, the research questionnaire undertook measurements along four dimensions: water volume, schedule flexibility, reliability and equality [30]. The statistical significance of the observed association was measured by the Exact Sig. (2-sided) and the Monte Carlo Sig. (2-sided) of Chi-Square test statistics. The Chi-squared test investigated differences between the population proportions for the different adaptation options. The Monte Carlo exact test was used as there were variables which had less than five responses. Regression (linear) correlation analysis was used for quantifying the general relationships between the variables. The regression analysis also examined the causal relationships between the quantitative variables.
The study area focused on the rice-growing districts of Doi Saket and Mae On in Thailand’s northern province of Chiang Mai, where the local residents have embraced the participatory farmer-managed irrigation system. Chiang Mai Province is 300 m above sea level and 700 km north of the capital, Bangkok. It is surrounded by high mountain ranges with a total area of 20,107 km2. The province consists of 25 districts, 204 sub-districts and 1915 villages. The district of Doi Saket is a rural agricultural area whose residents rely on rice growing for their livelihoods. The district is located at the head-end of the Mae Kuang irrigation canal, branching out from the Mae Kuang Udomthara reservoir. In contrast, the district of Mae On is located at the tail-end of the Mae Kuang irrigation canal. Like Doi Saket, Mae On is also a rural agricultural area with paddy fields accounting for a large proportion of land use, as shown in Figure 1.
The Mae Kuang Udomthara reservoir is an earth-compacted dam that receives water from the Mae Kuang River. The reservoir’s high, normal and low water levels are +387.80 m MSL (mean sea level), +385.00 m MSL; and +350.00 m MSL, respectively. Its normal capacity is 263 mcm and the highest and lowest capacities are 295 mcm and 114 mcm, respectively. The reservoir caters to an area of 46,880 ha [33].

3. Results

3.1. Demographics of Respondents

Table 1 tabulates the demographics and the average paddy cultivation land of the 150 sampled farmers. The majority of the respondents were male household heads with limited formal education. Despite large family sizes (family members >4); the average paddy field size was 1.92–3.04 ha per household.
Figure 2 presents the factors that the farmers perceived as causes of a yield gap (the discrepancy between the expected paddy yield and the actual yield). The farmers equally attributed the poor actual yield to the lack of community participation in the local irrigation operation and management (22%) and unfavorable weather conditions (22%), followed by sub-standard agricultural inputs (21%), the state’s inefficient operation and management of the irrigation system (19%), and harvest damage and loss (16%).
Figure 3 illustrates the participating farmers’ responses (%) on the fairness of the water allocation practice, whereby the tail-end farmers would be unable to grow rice in the dry season due to insufficient water. The results indicated that 65% and 61% of CI and CIE head-end farmers viewed the practice as unfair to their tail-end counterparts; and 44% and 53% of CI and CIE tail-end farmers regarded it as unfair. Importantly, the findings imply that most farmers were willing to resolve the issue of inequitable irrigated water distribution and restore fairness in the community.
Figure 4 presents the farmers’ perceptions regarding the predictability and adequacy of the irrigated water. The high levels of predictability contribute to better decisions in water utilization [34,35]. In Figure 4, 22% and 10% of CI and CIE tail-end farmers, despite the disadvantageous location of their farmlands, perceived that availability of the irrigated water was predictable and adequate, whereas only 9% and 7% of CI and CIE head-end farmers did. Predictability is the key to the perceived adequacy of water supply [36]. In fact, further observations revealed that the local leaders of the CI tail-end farmers played a crucial role in the allocation and scheduling of the irrigated water.

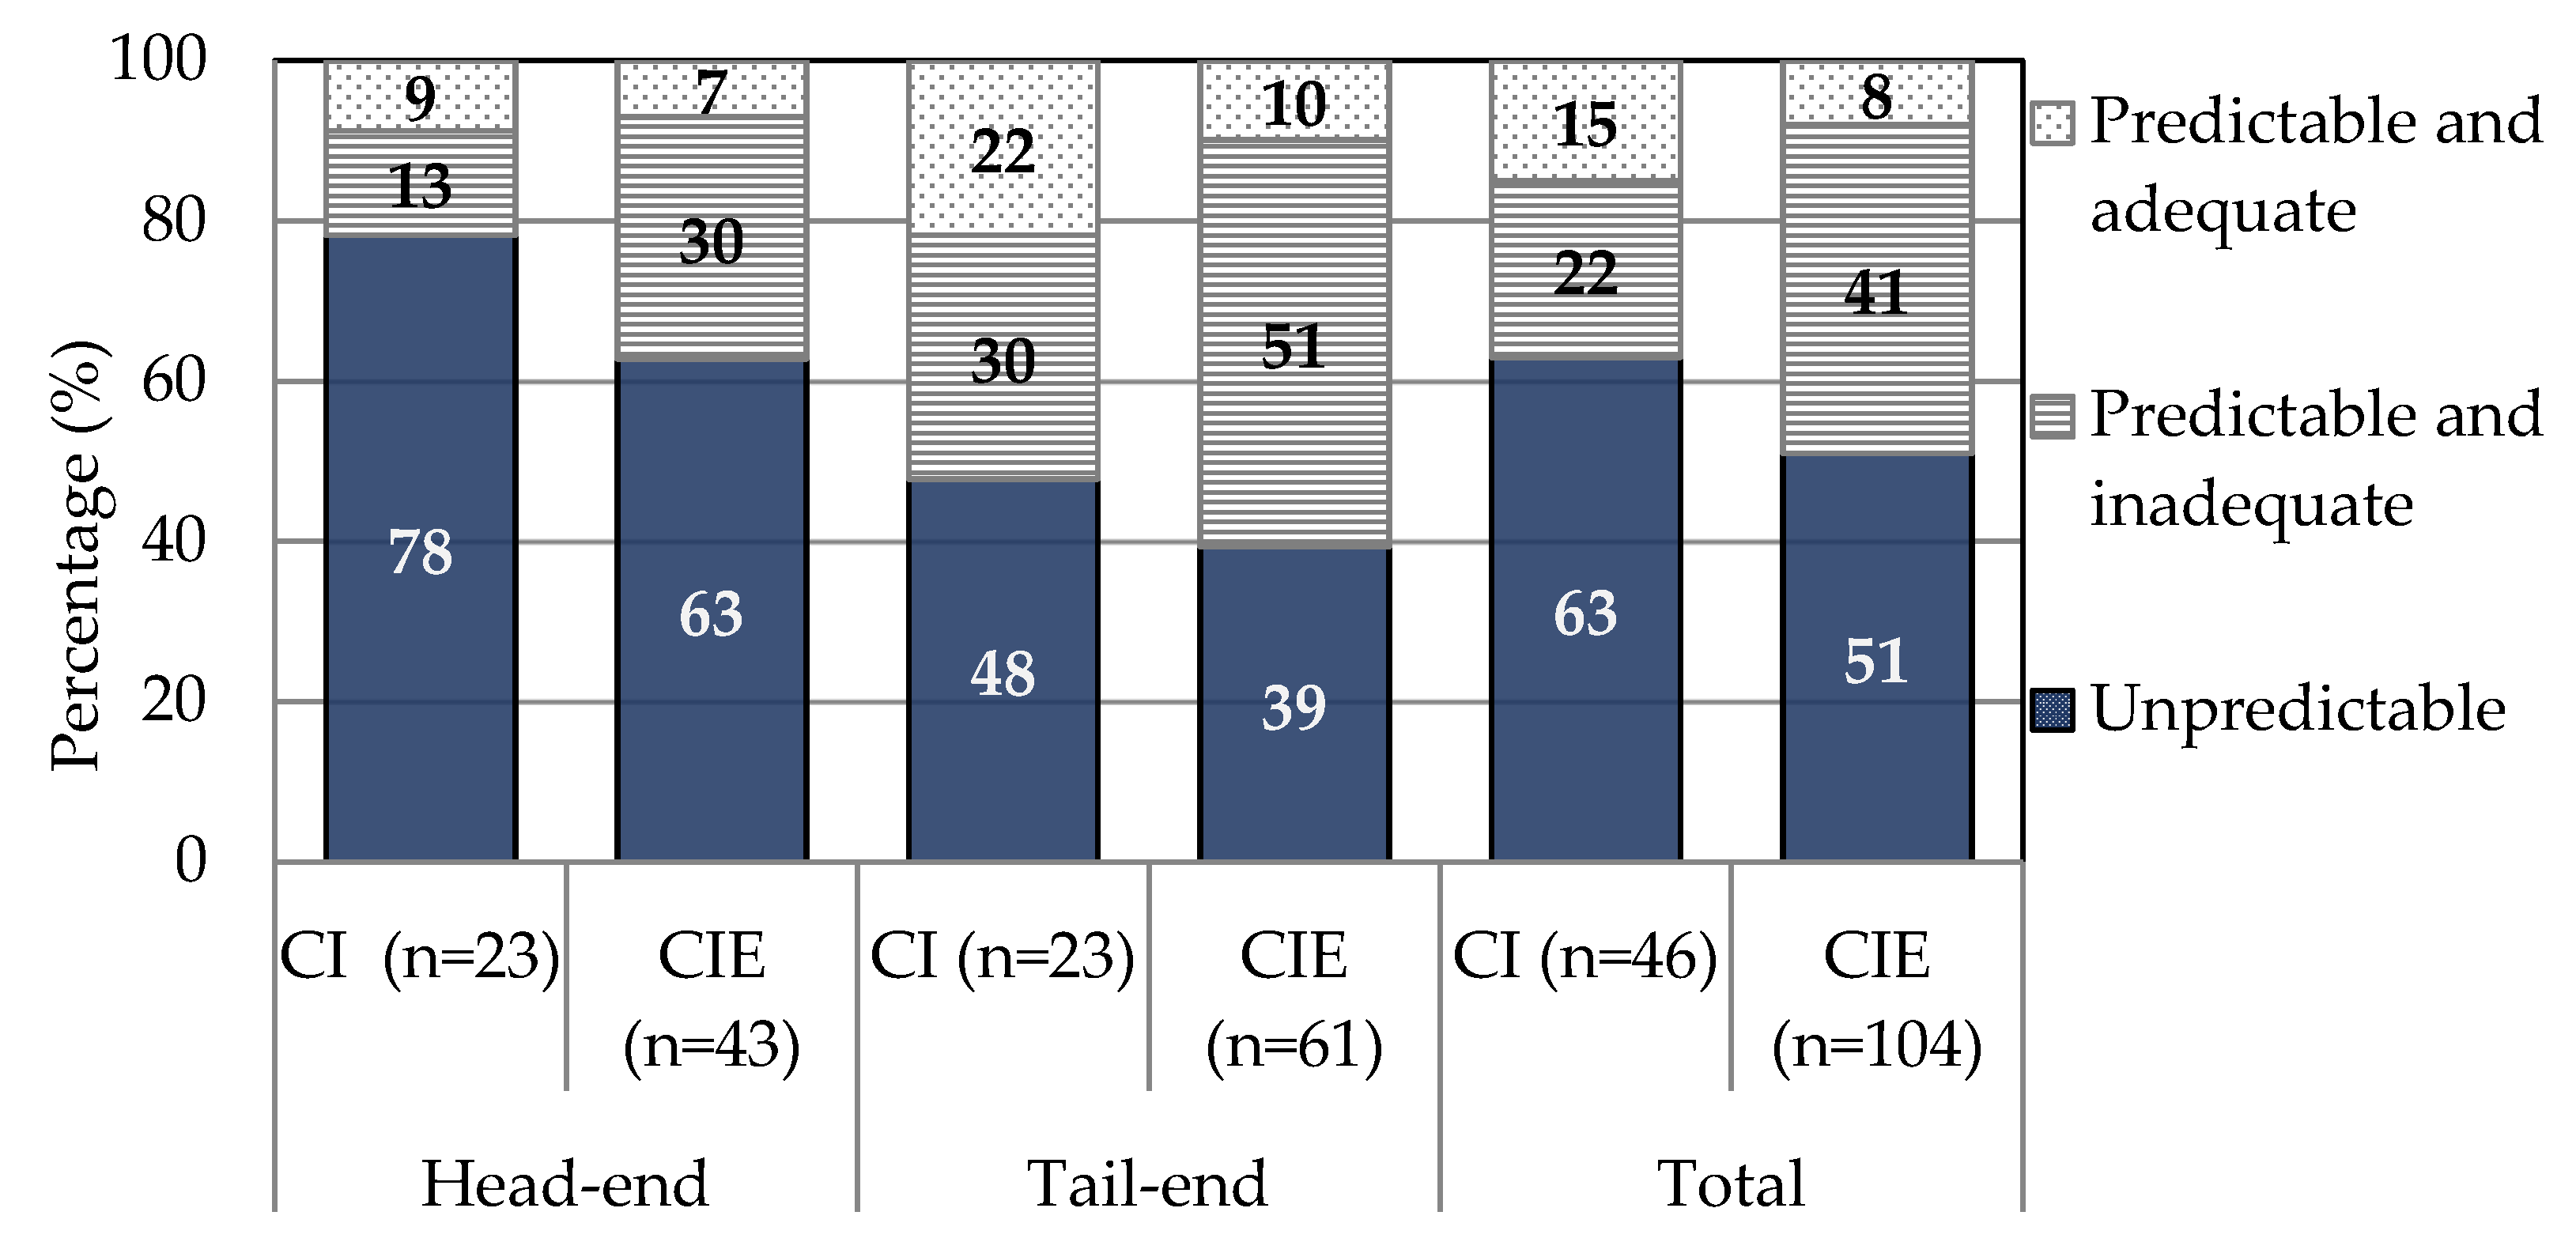
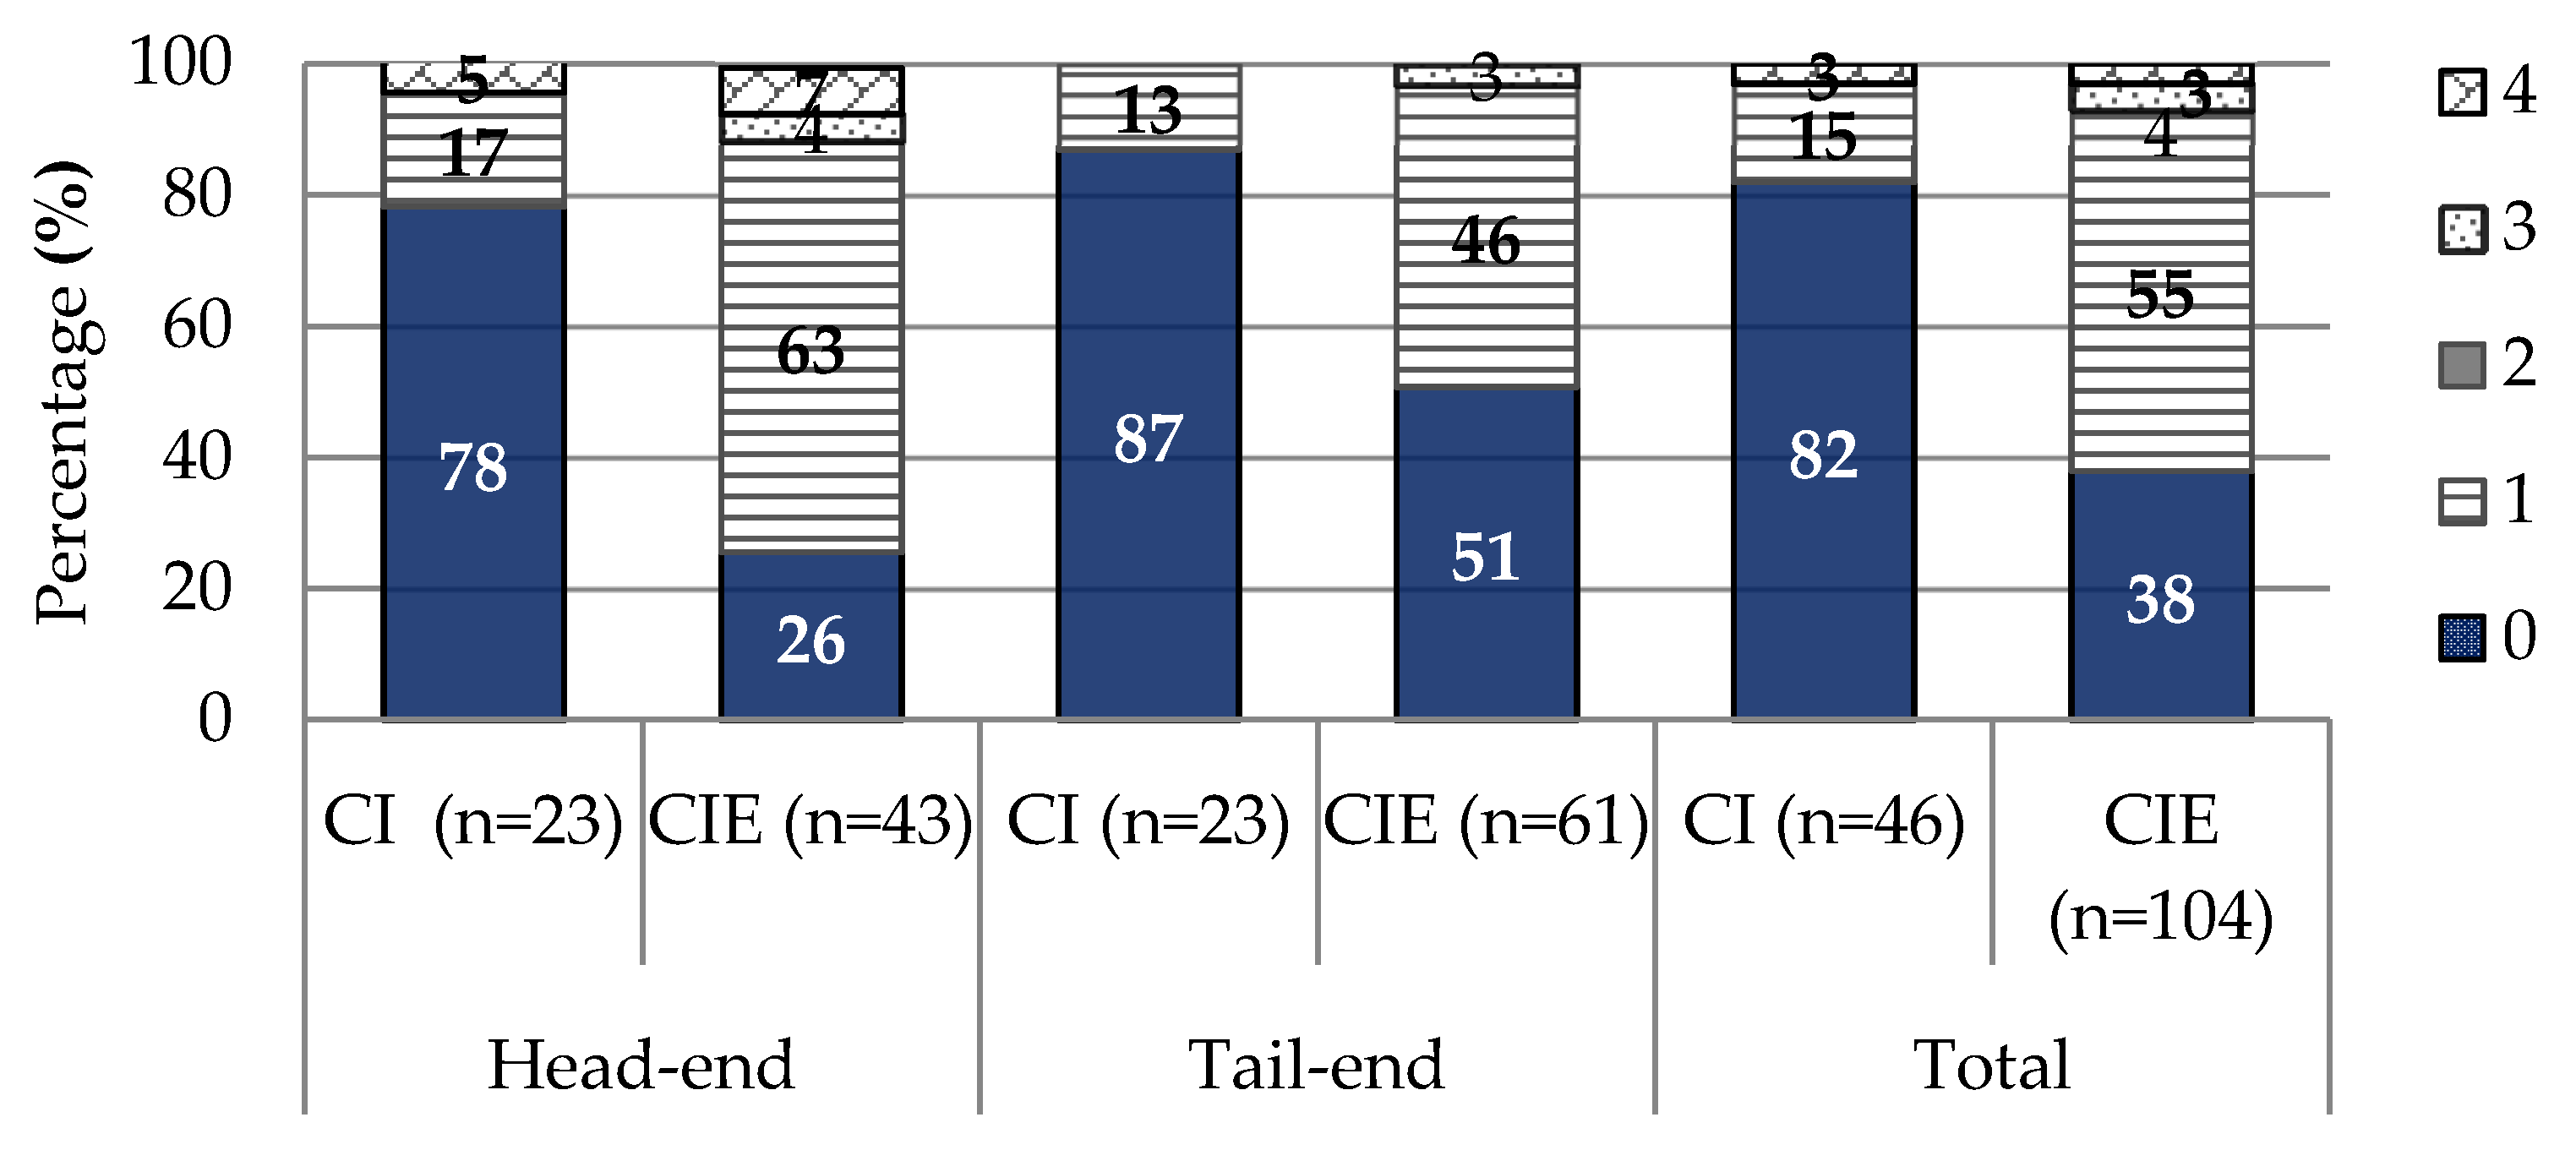
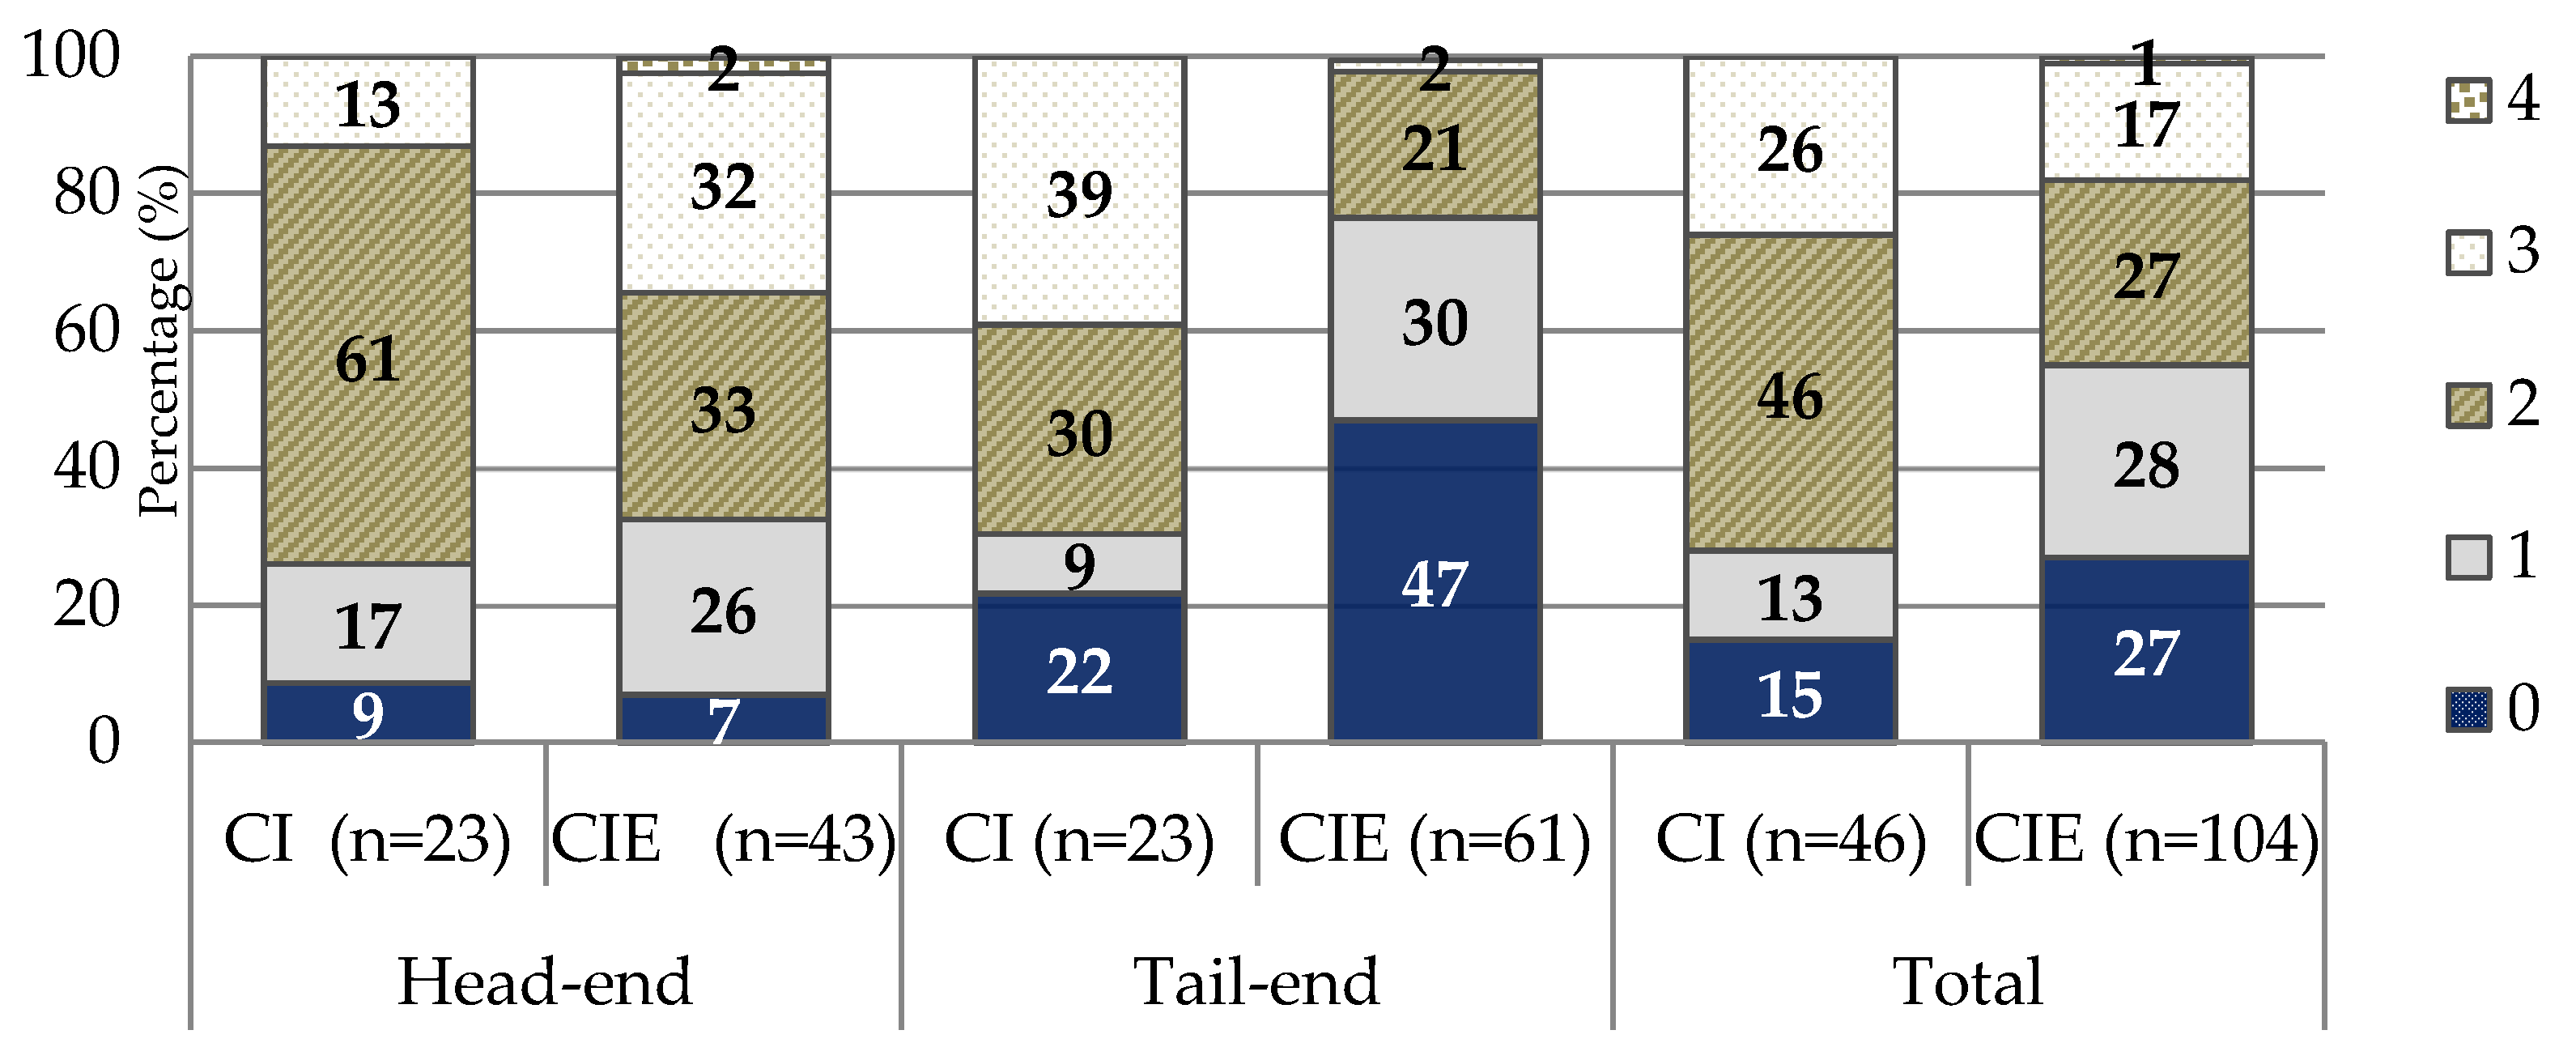
3.2. Evaluation of Water Distribution Service to Individual Farm Units

Figure 5, Figure 6, Figure 7 and Figure 8 illustrate the sampled farmers’ responses (%) on water allocation and distribution along four dimensions: water volume, schedule flexibility, reliability, and equality, respectively.
Specifically, Figure 5 compares the participating farmers’ responses (%) on their knowledge of the water volumes demanded by and supplied to their farmlands. The results showed that as many as 78% and 87% of head-end and tail-end CI farmers lacked “scientific” knowledge on water volumes as they relied on traditional wisdom. Meanwhile, 63% and 46% of head-end and tail-end CIE farmers had minimal “scientific” knowledge of water volumes.
Figure 6 illustrates the farmers’ responses on the flexibility of the water distribution schedule. The flexible irrigation system contributed to a degree of continuity in daily water distribution [37]. In Figure 6, 61% (4% + 57%), 48% (18% + 30%), and 35% (9% + 26%) of head-end CI, tail-end CIE and CI farmers rated the current irrigation scheduling as very flexible and supple, indicating their high satisfaction with the flexibility of the current water distribution schedule to matches their water demands.
Figure 7 illustrates the farmers’ responses on the reliability of water distribution to their farmlands. The findings revealed that 53% of head-end CIE farmers viewed it as unreliable; and that 61% and 66% of tail-end CI and CIE farmers perceived that the distribution of the irrigated water was relatively unreliable. The unreliable water delivery of the state-controlled irrigation system contributed to the local farmers’ inability to grow crops and hostile sentiment [38]. However, significant portions of water are absorbed by the soil or evaporated by heat, leading to significant water loss during transport. This problem could be mitigated by the construction of concrete irrigation channels [39].
In Figure 8, the farmers’ responses (%) on the equality of water allocation revealed that most farmers perceived the current water distribution practice as equitable. The results indicated that 74% (13% + 61%) and 67% (2% + 32%+ 33%) of head-end CI and CIE farmers, and 69% (39% + 30%) of tail-end CI farmers rated the current water allocation practice as equitable. Equitable water allocation and distribution is critical to the success and sustainability of the farmer-managed irrigation system [40].

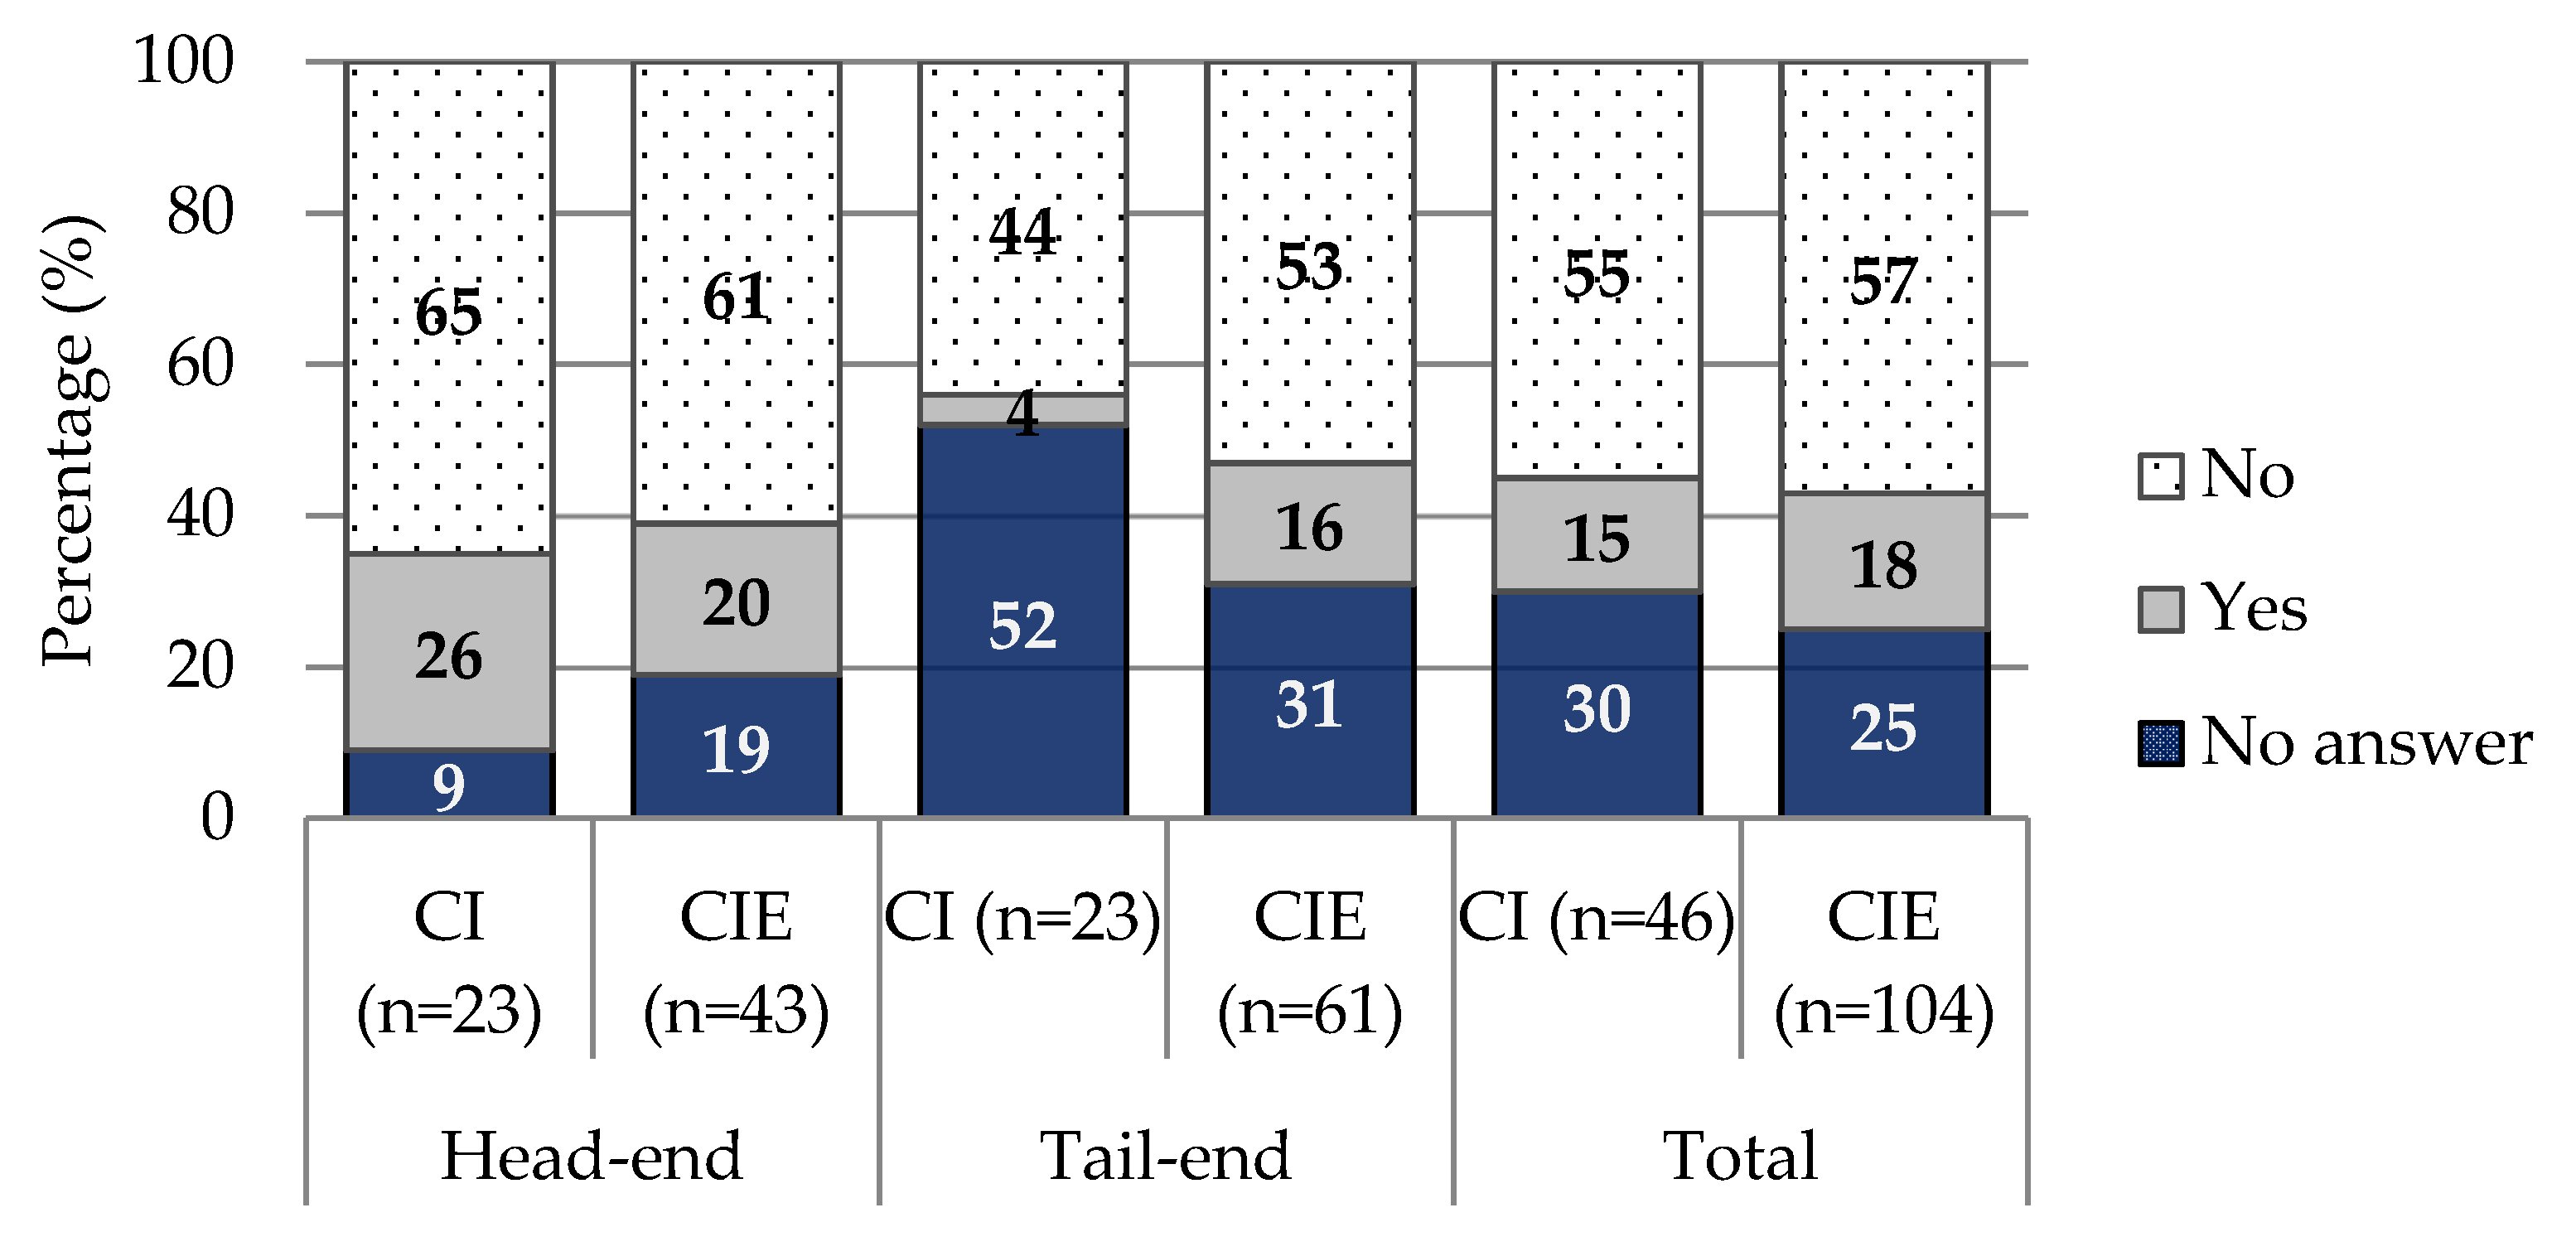
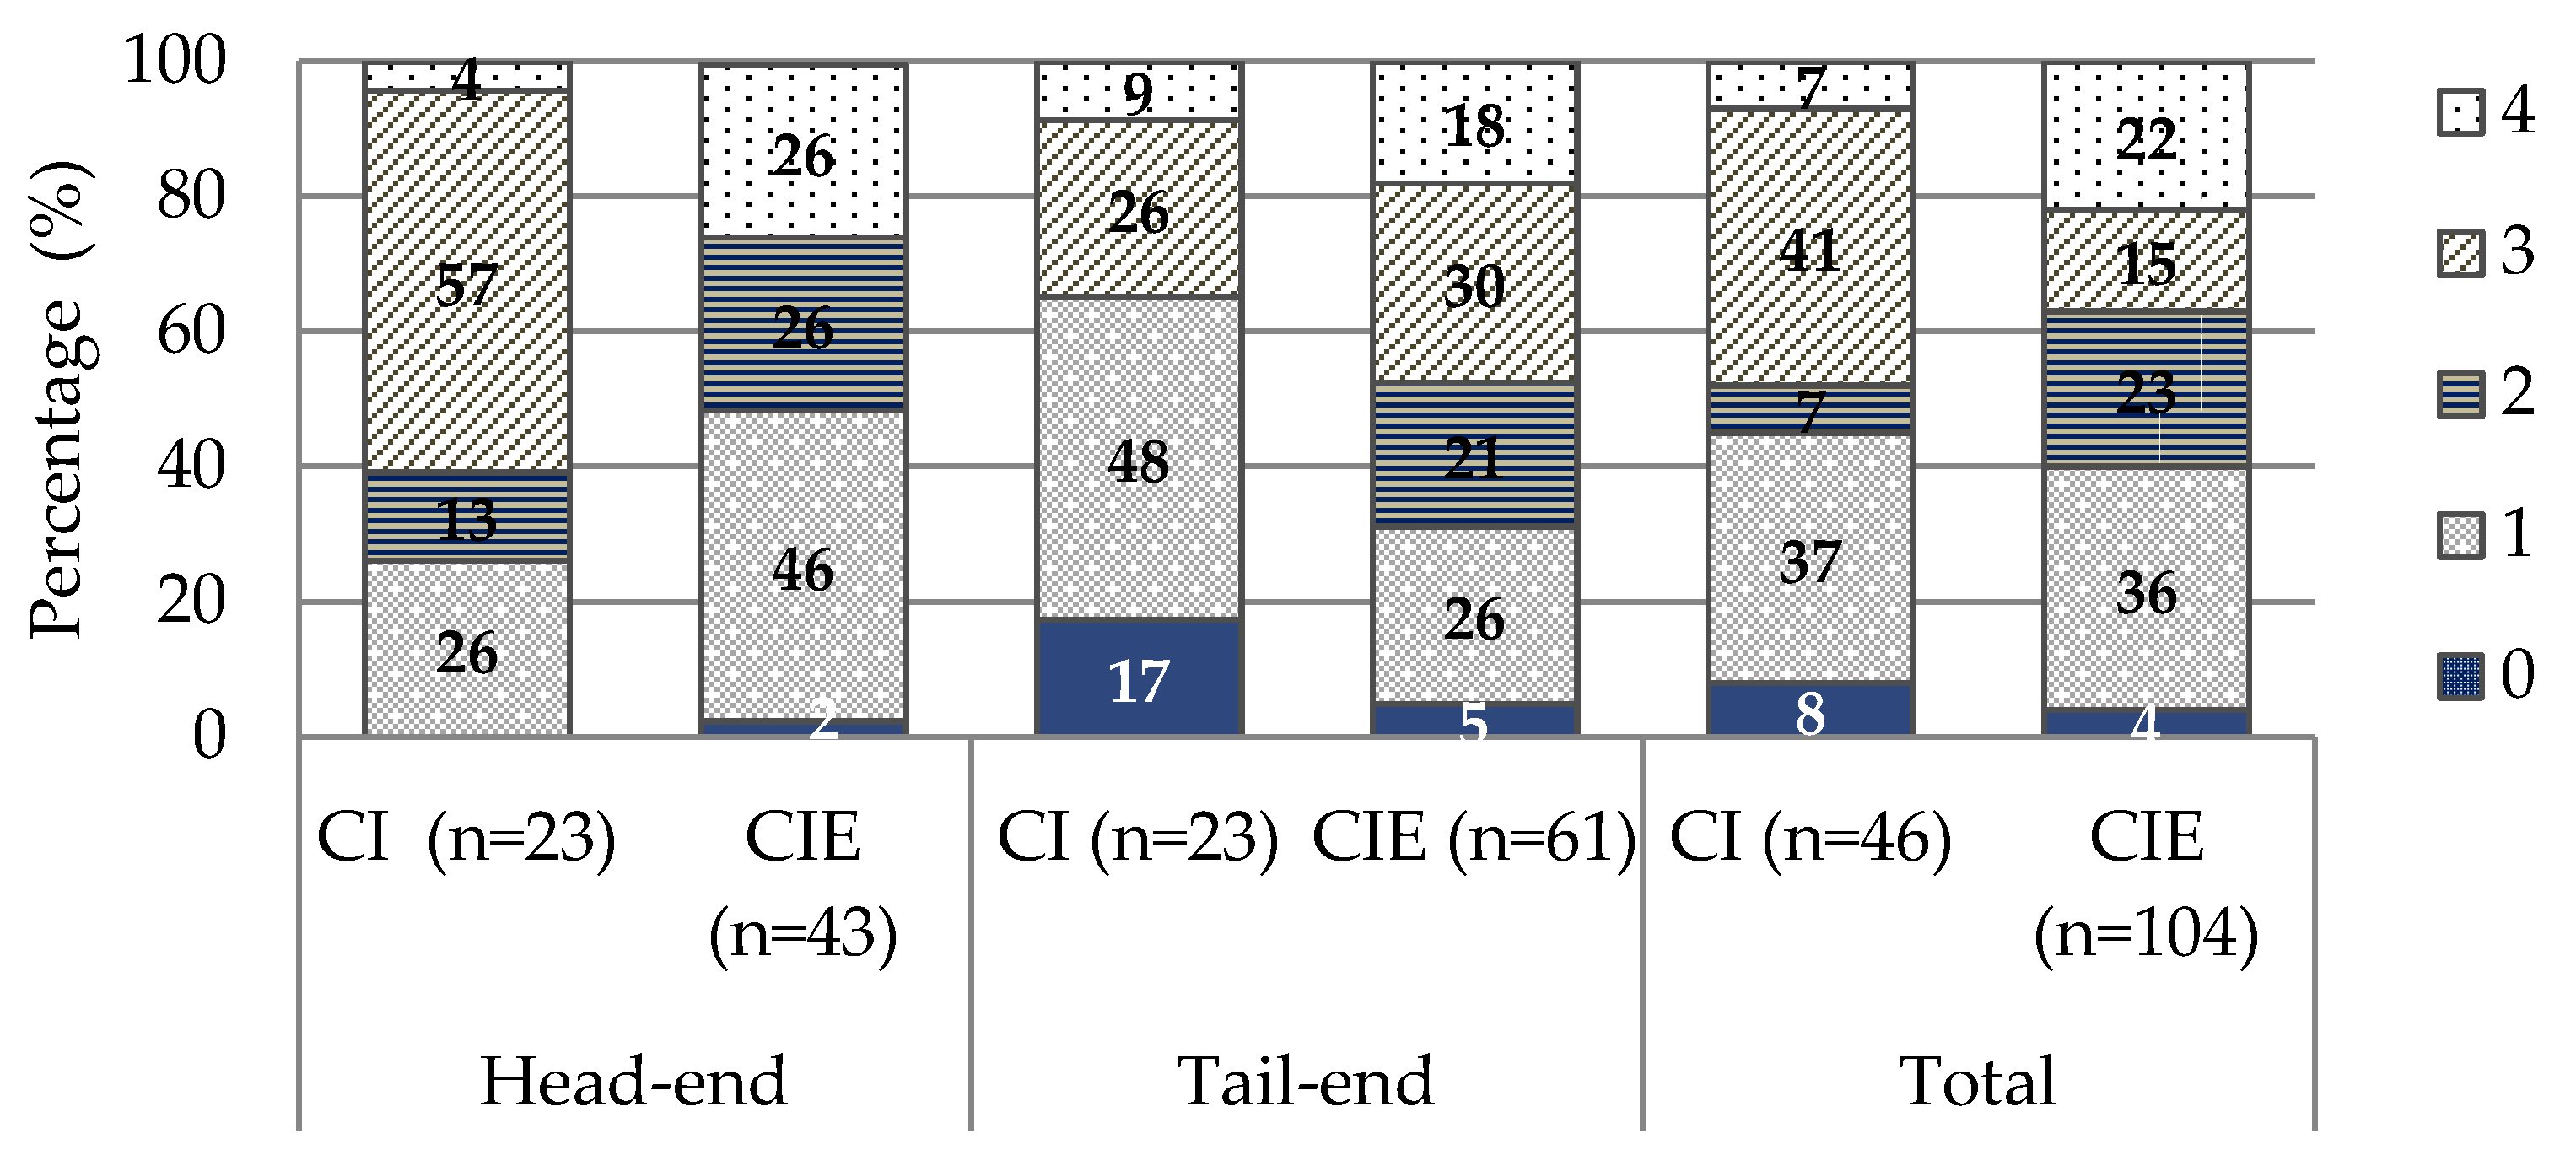
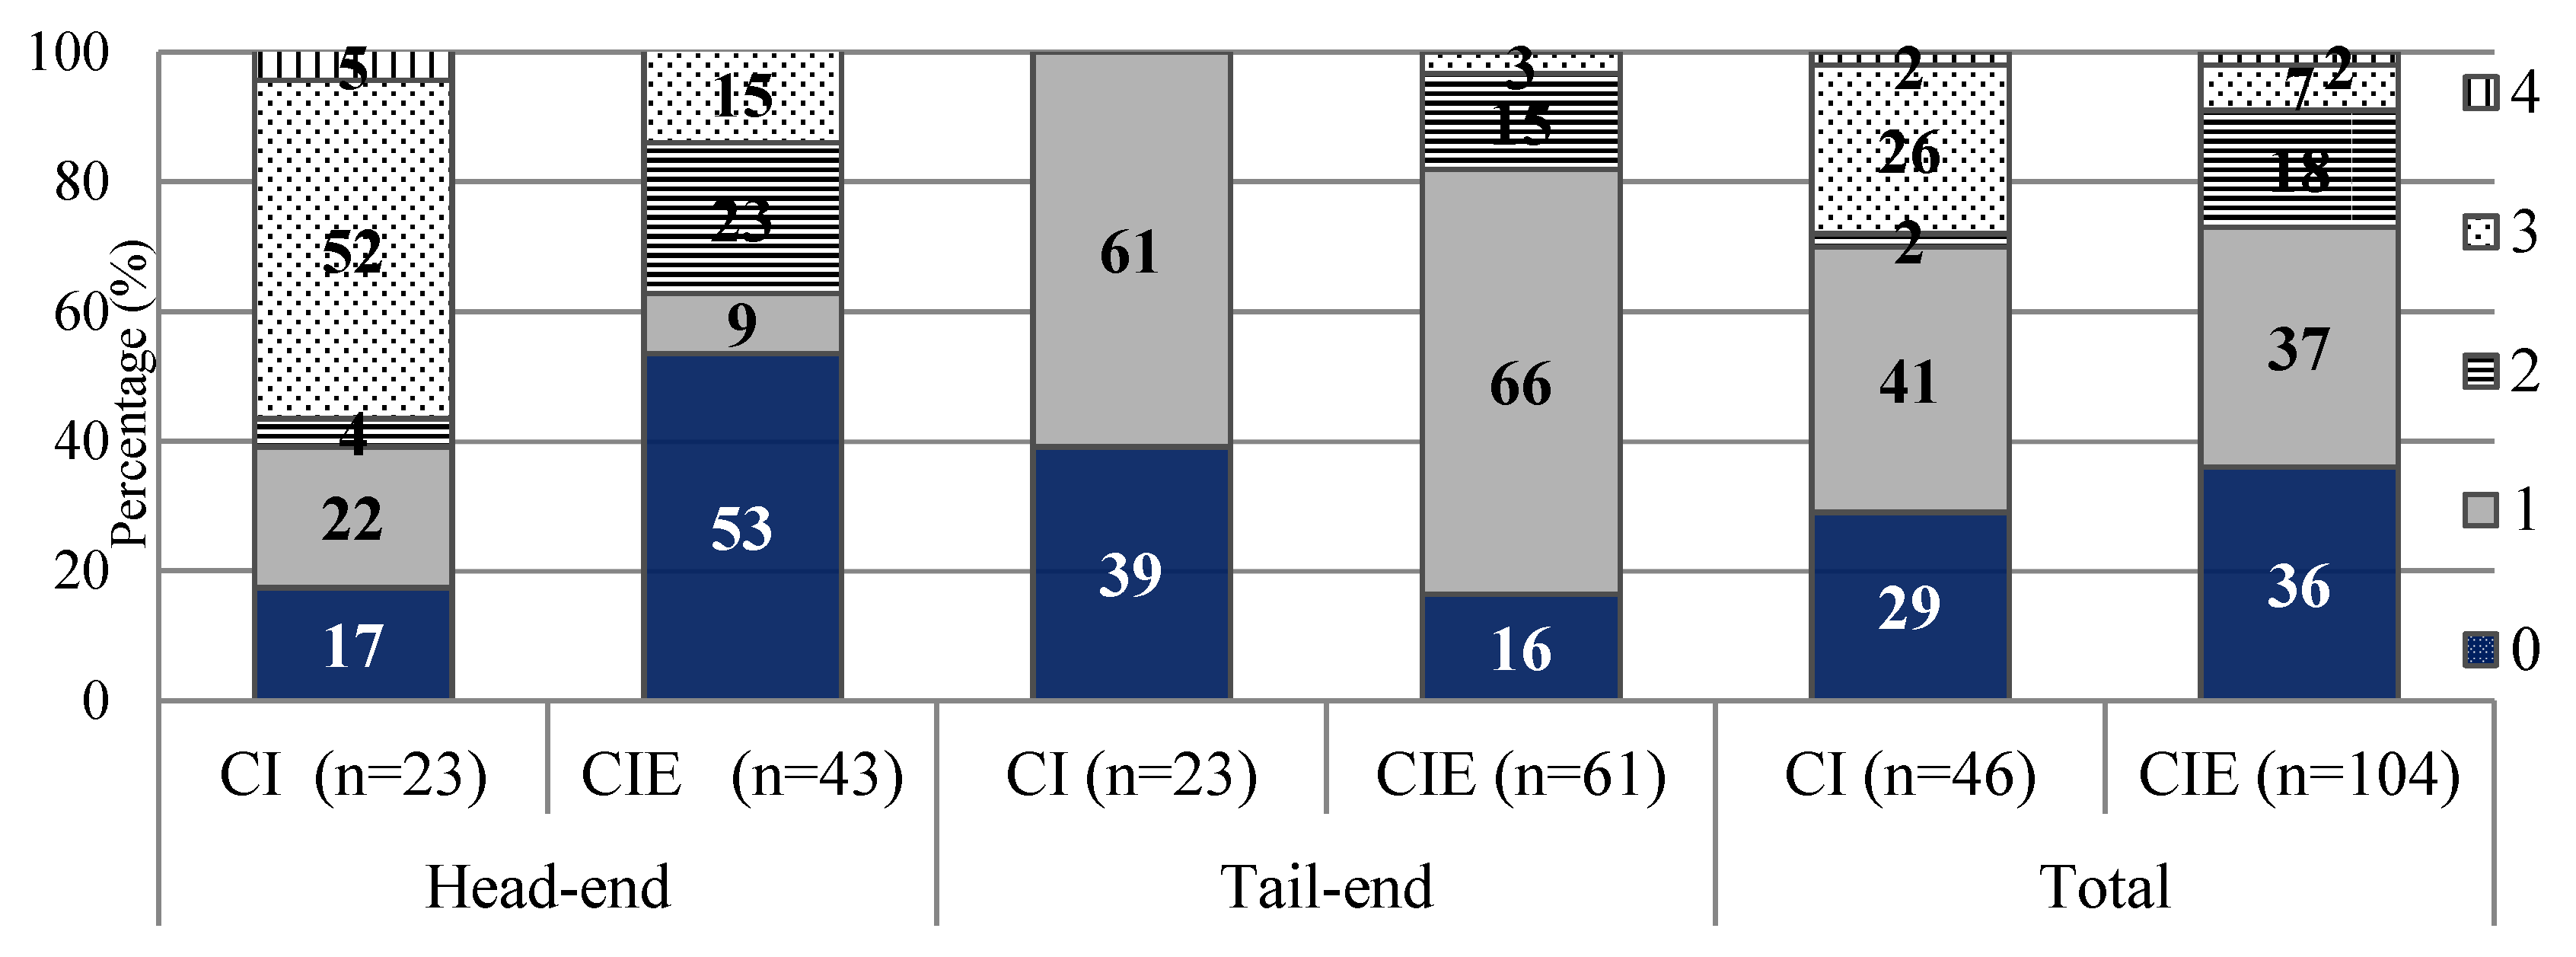
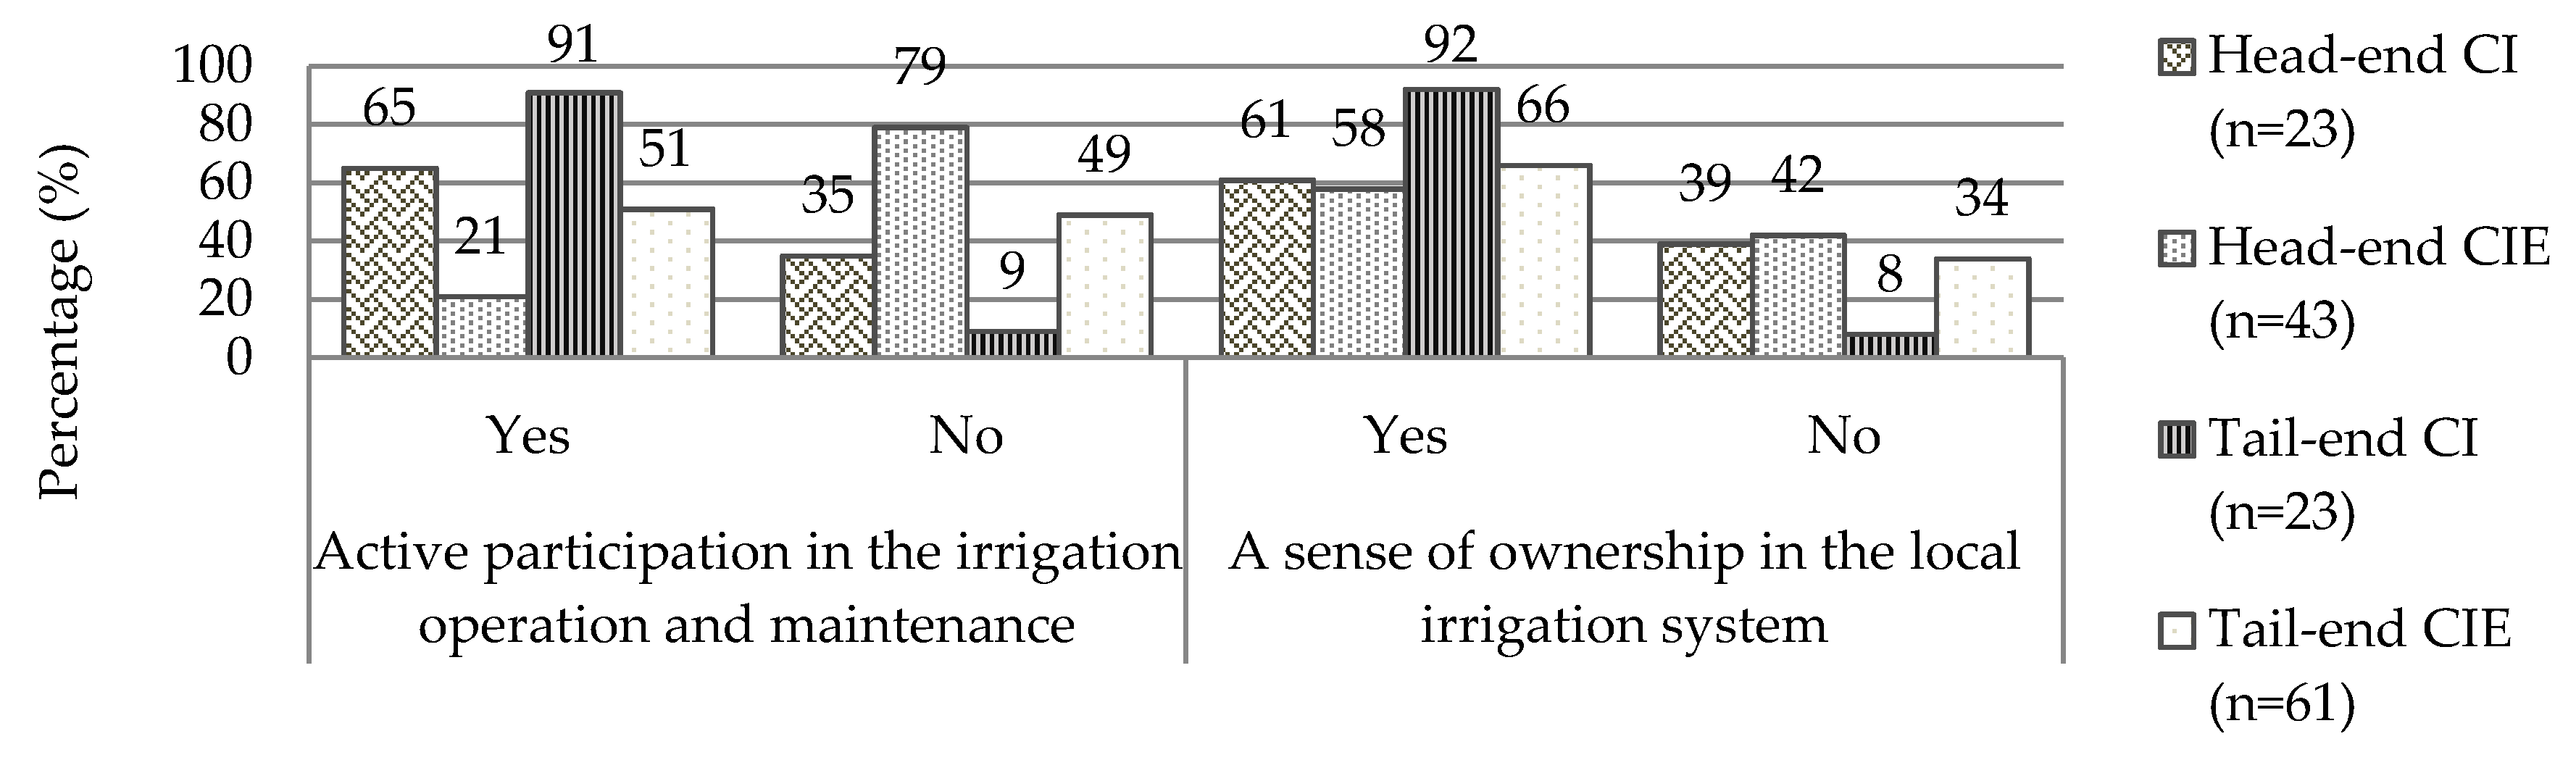
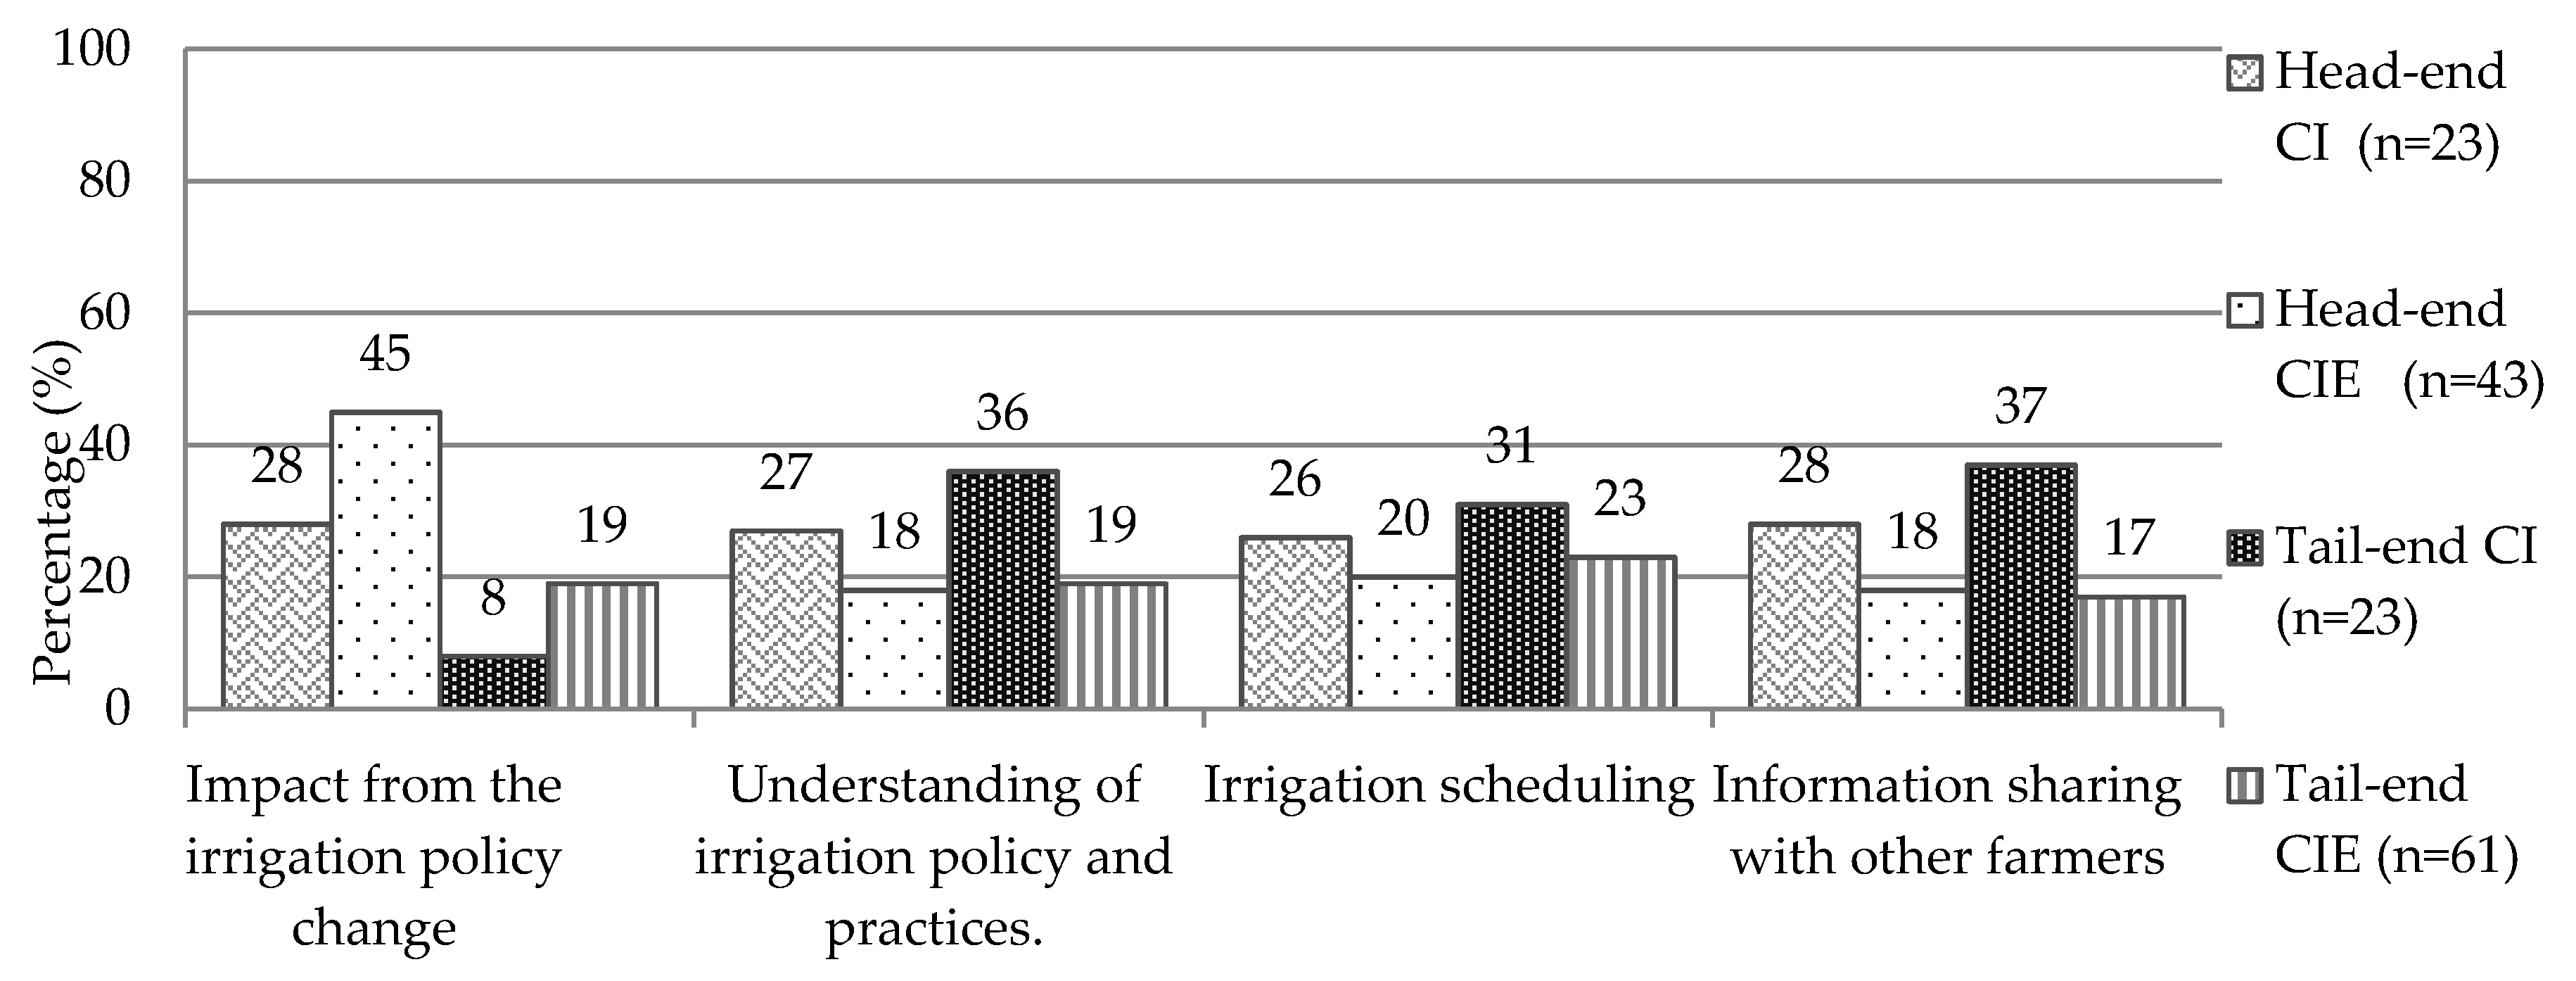
3.3. Participation in the Irrigation Operation

Figure 9 graphically presents the farmers’ participation in the local irrigation operation and maintenance and their sense of ownership in the local irrigation system. As many as 91% of tail-end CI farmers, whose paddy yields and income from the paddy sale were the highest, actively participated in the operation and maintenance of the local irrigation system, compared with 65% and 21% for head-end CI and CIE farmers.
The effective maintenance of the irrigation canals requires labor contributions from the local residents [4]. In this research, it was found that all four groups of farmers were given the responsibility by their local leaders to maintain a certain length of the irrigation canal, corresponding to the location of their farmlands. However, the head-end CI and CIE farmers contributed little to the maintenance of the irrigation system, given the advantageous location of their farmlands and the constant supply of irrigated water with minimal effort. The efficiency of an irrigation system is positively correlated to the appropriators’ self-governing abilities and their individual level of participation [41]. In addition, with regard to a sense of ownership in the local irrigation system, as many as 92% of tail-end CI farmers agreed that the long-term sustainability of the local irrigation system was the responsibility of every local resident, indicating a strong sense of ownership. Thus, a sense of ownership is the key to the success of a participatory irrigation management [42].
Figure 10 presents the farmers’ responses (%) on the issues of the impact of irrigation policy change, their understanding of irrigation policy and practices, irrigation schedule, and water allocation information sharing. On the first issue, only 8% of tail-end CI farmers were affected by changes in the irrigation policy due to their active participation in the local irrigation operation, thus enabling them to be better prepared. Meanwhile, as many as 45% of head-end CIE farmers were affected by changes in the water distribution policy, a phenomenon most likely attributable to their low participation in irrigation operation and management, making them slower to adjust. On the second issue, 36% of tail-end CI farmers were aware of current irrigation policy and practices, due largely to their active participation in the local irrigation operation and management, followed by head-end CI farmers (27%), tail-end CIE (19%) and head-end CIE farmers (18%).
On the issue of the irrigation scheduling, the four groups of farmers similarly agreed that information regarding the opening and closing of the water gates by the local irrigation office was provided in a timely manner. Specifically, 31% of tail-end CI farmers agreed on this point, followed by head-end CI (26%), tail-end CIE (23%) and head-end CIE (20%) farmers. On the last issue, as many as 37% of tail-end CI farmers frequently discussed irrigation-related problems and concerns with other farmers to find solutions, followed by head-end CI (28%) and CIE (18%), and tail-end CIE (17%) farmers.
The participation of local farmers in the maintenance and operation of the local irrigation system contributes to irrigation sustainability and the higher crop yields [43,44,45,46]. Irrigation management strategies formulated and implemented by the farmers proved more successful and sustainable than the state-initiated irrigation strategies [47]. Moreover, the statistical test results of the linear regression correlations showed that the farmers with higher paddy yields are those who actively participated in the local irrigation operation (Table 2).

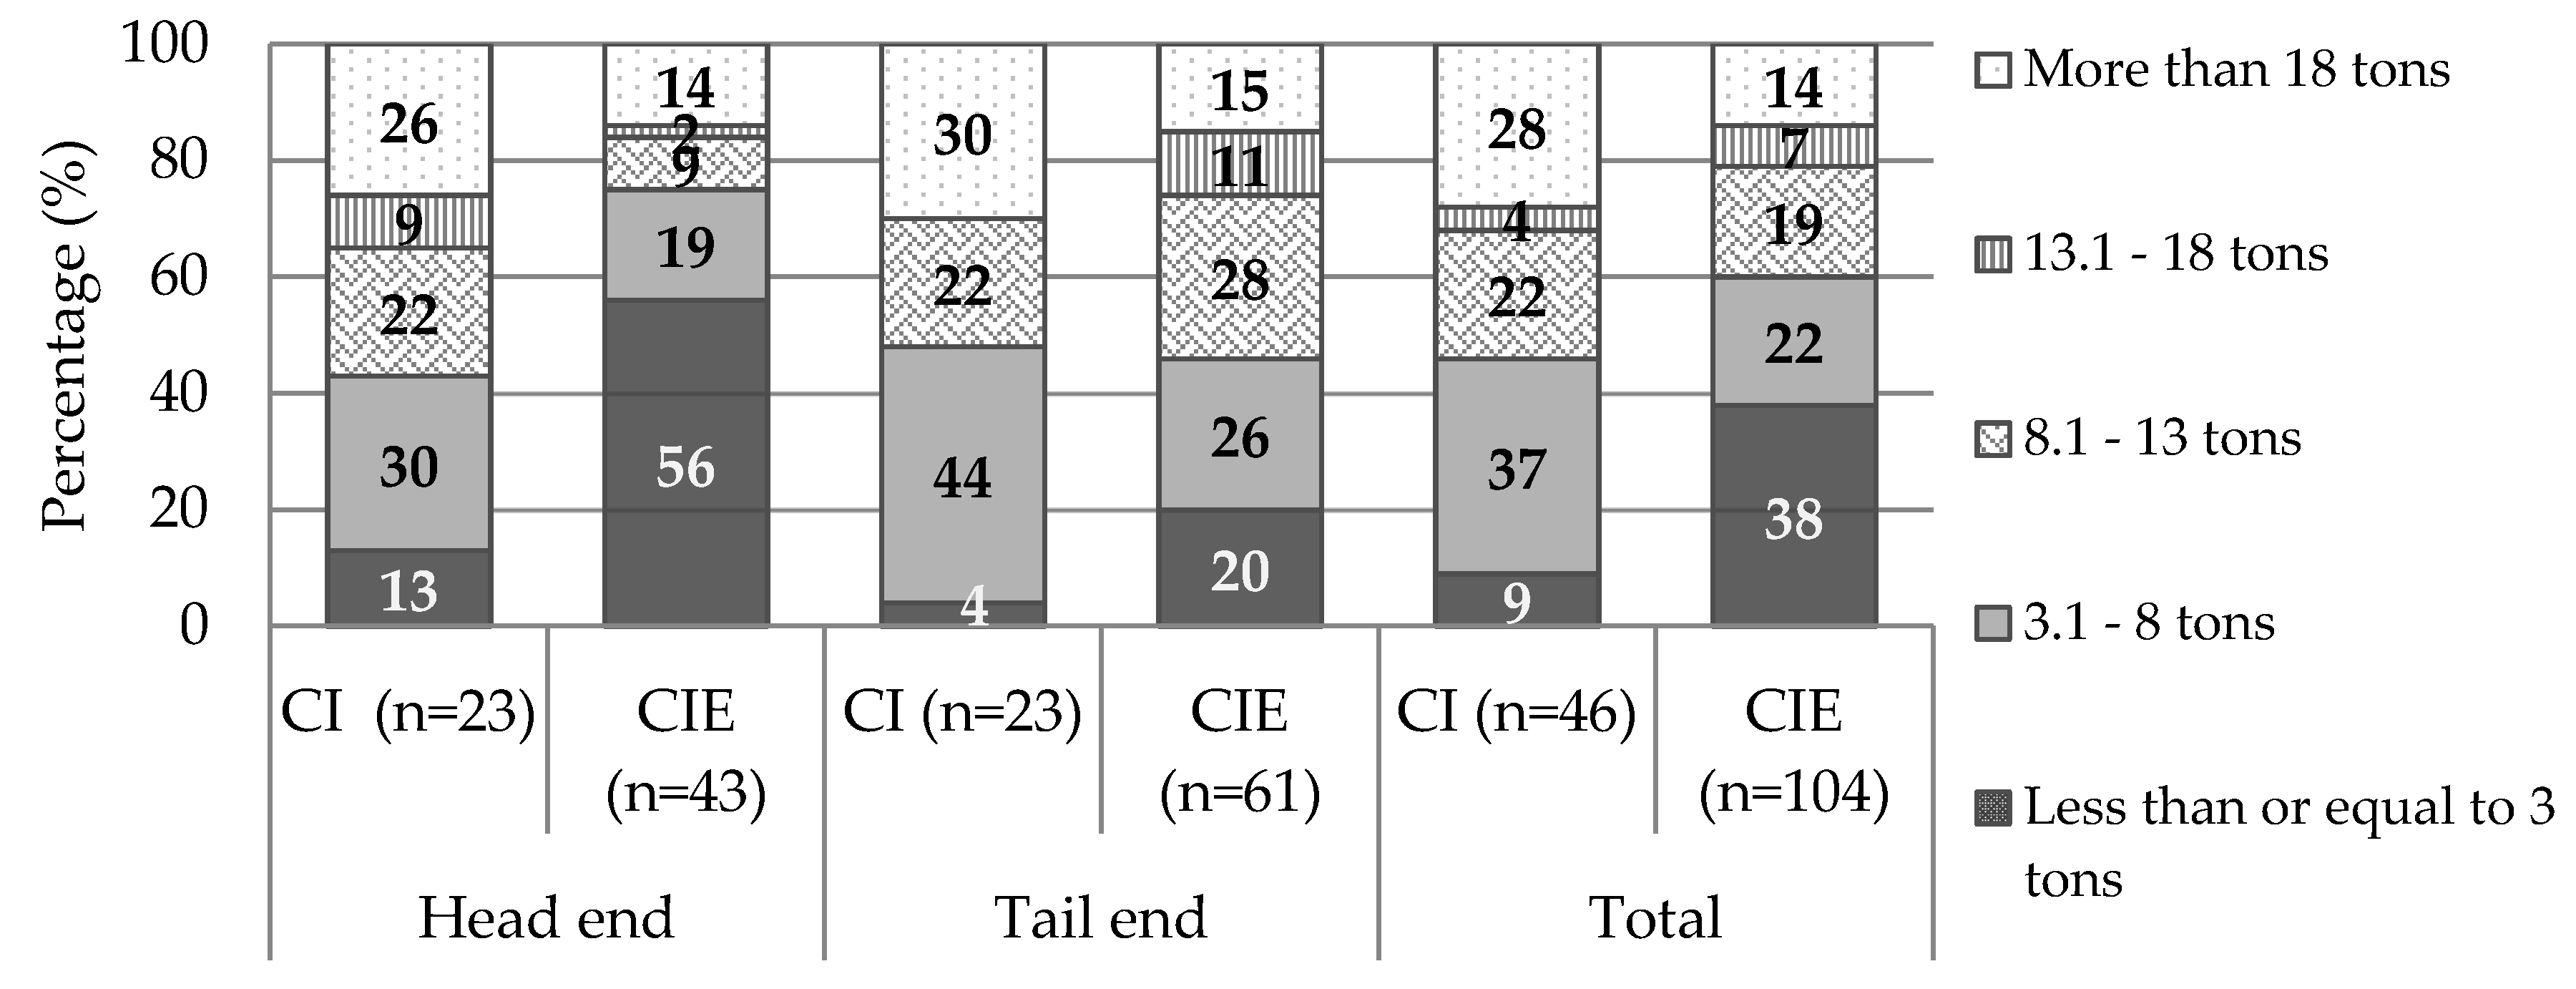
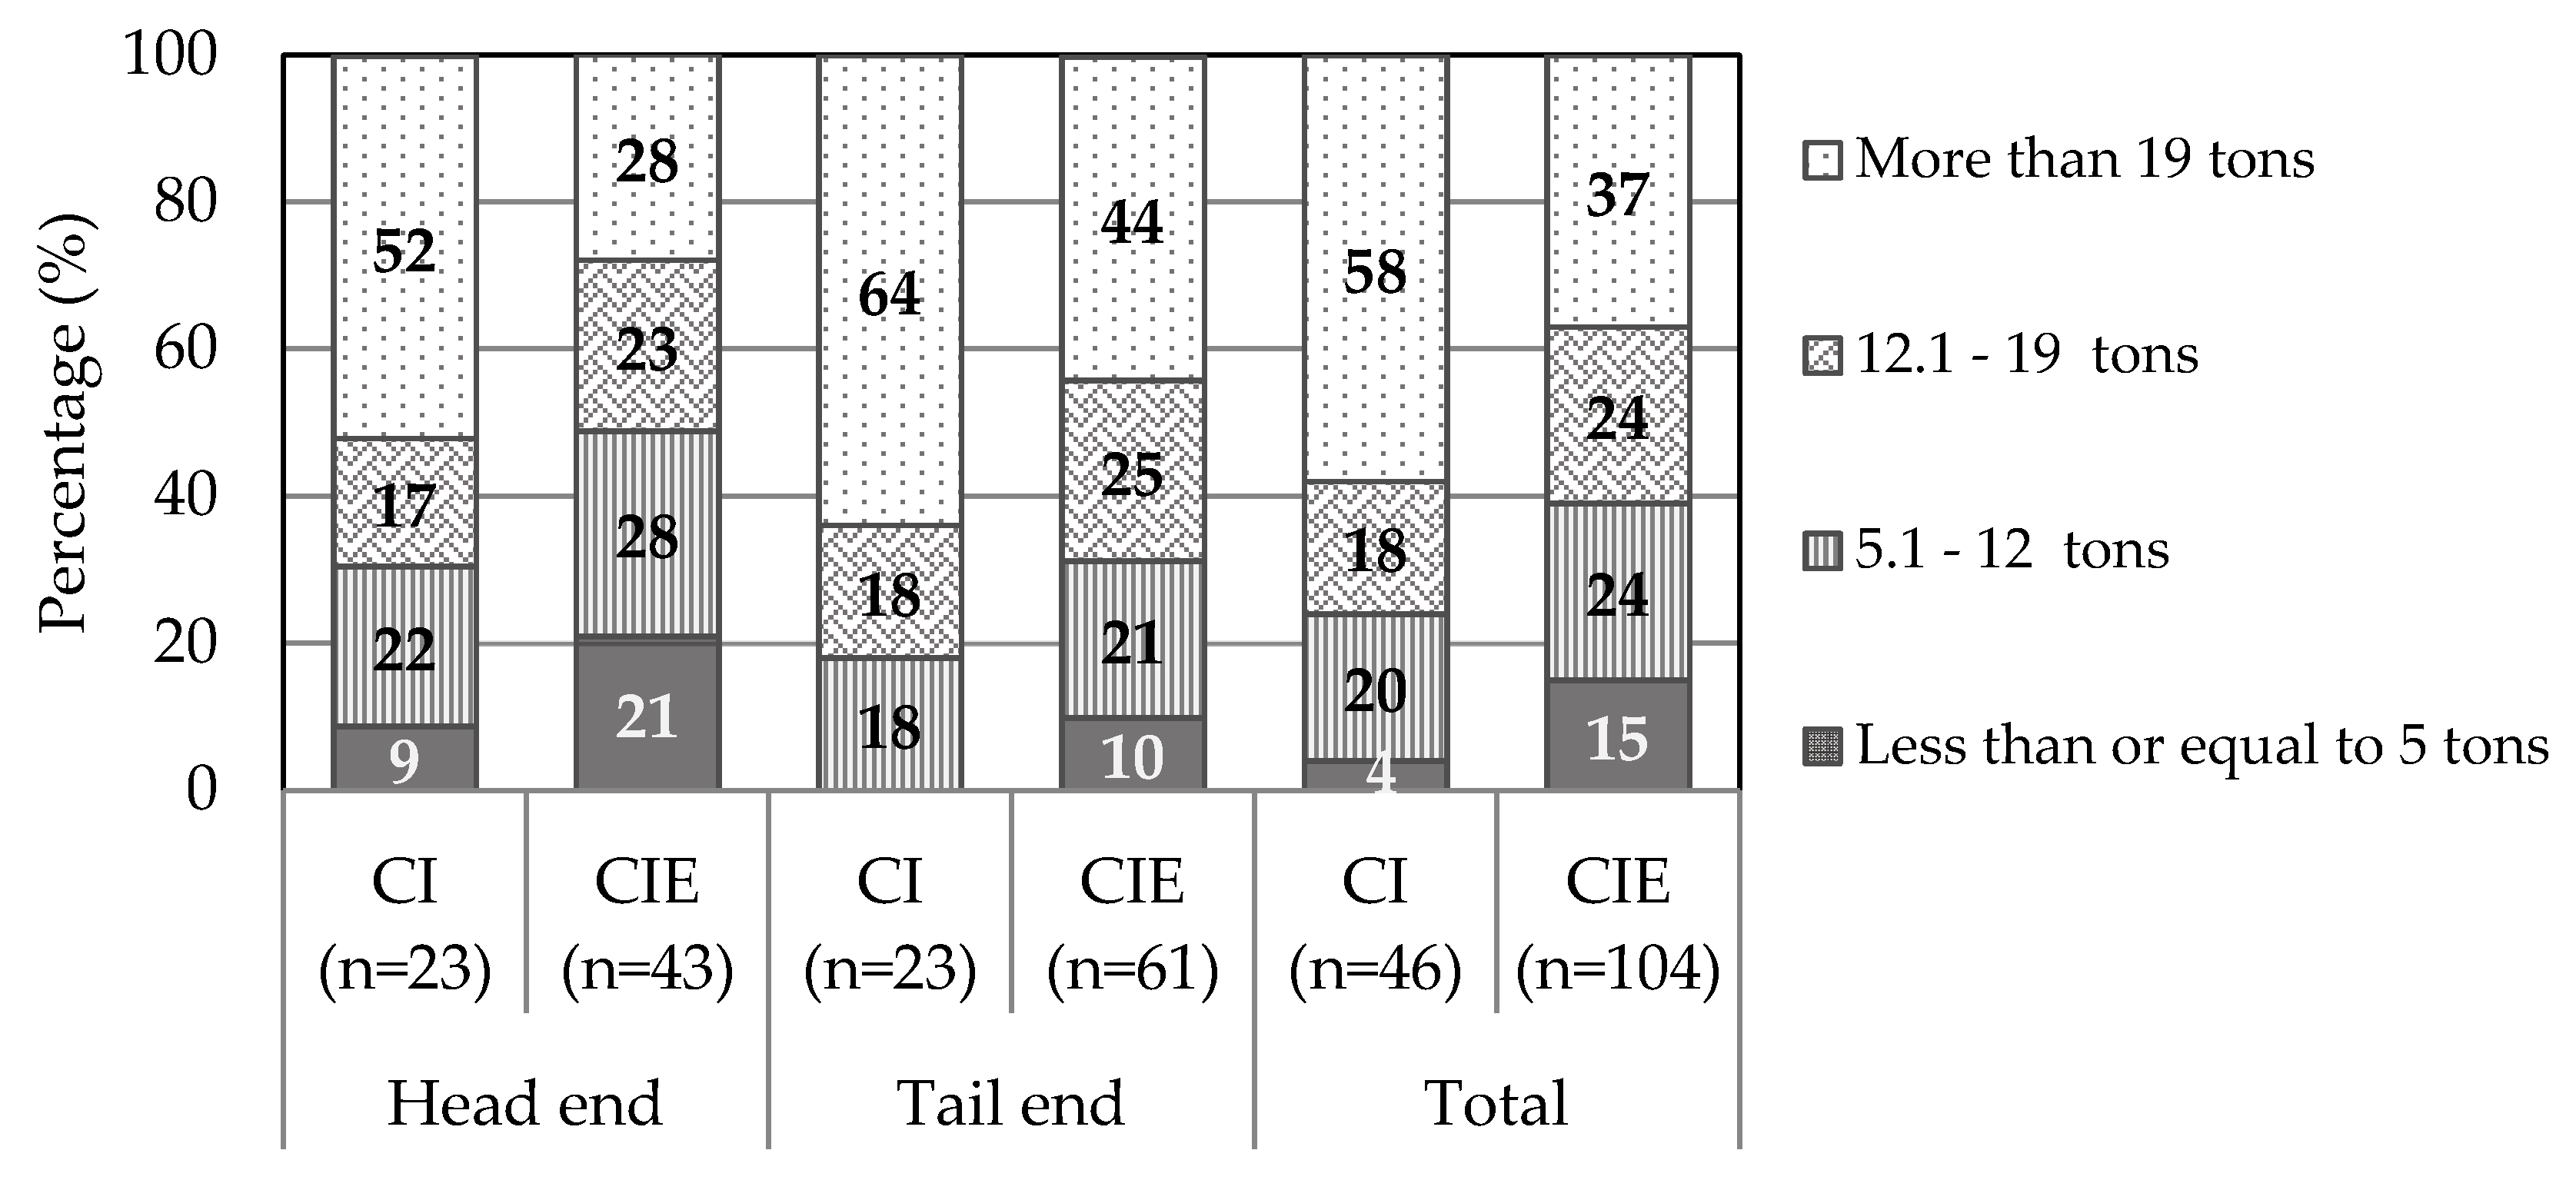
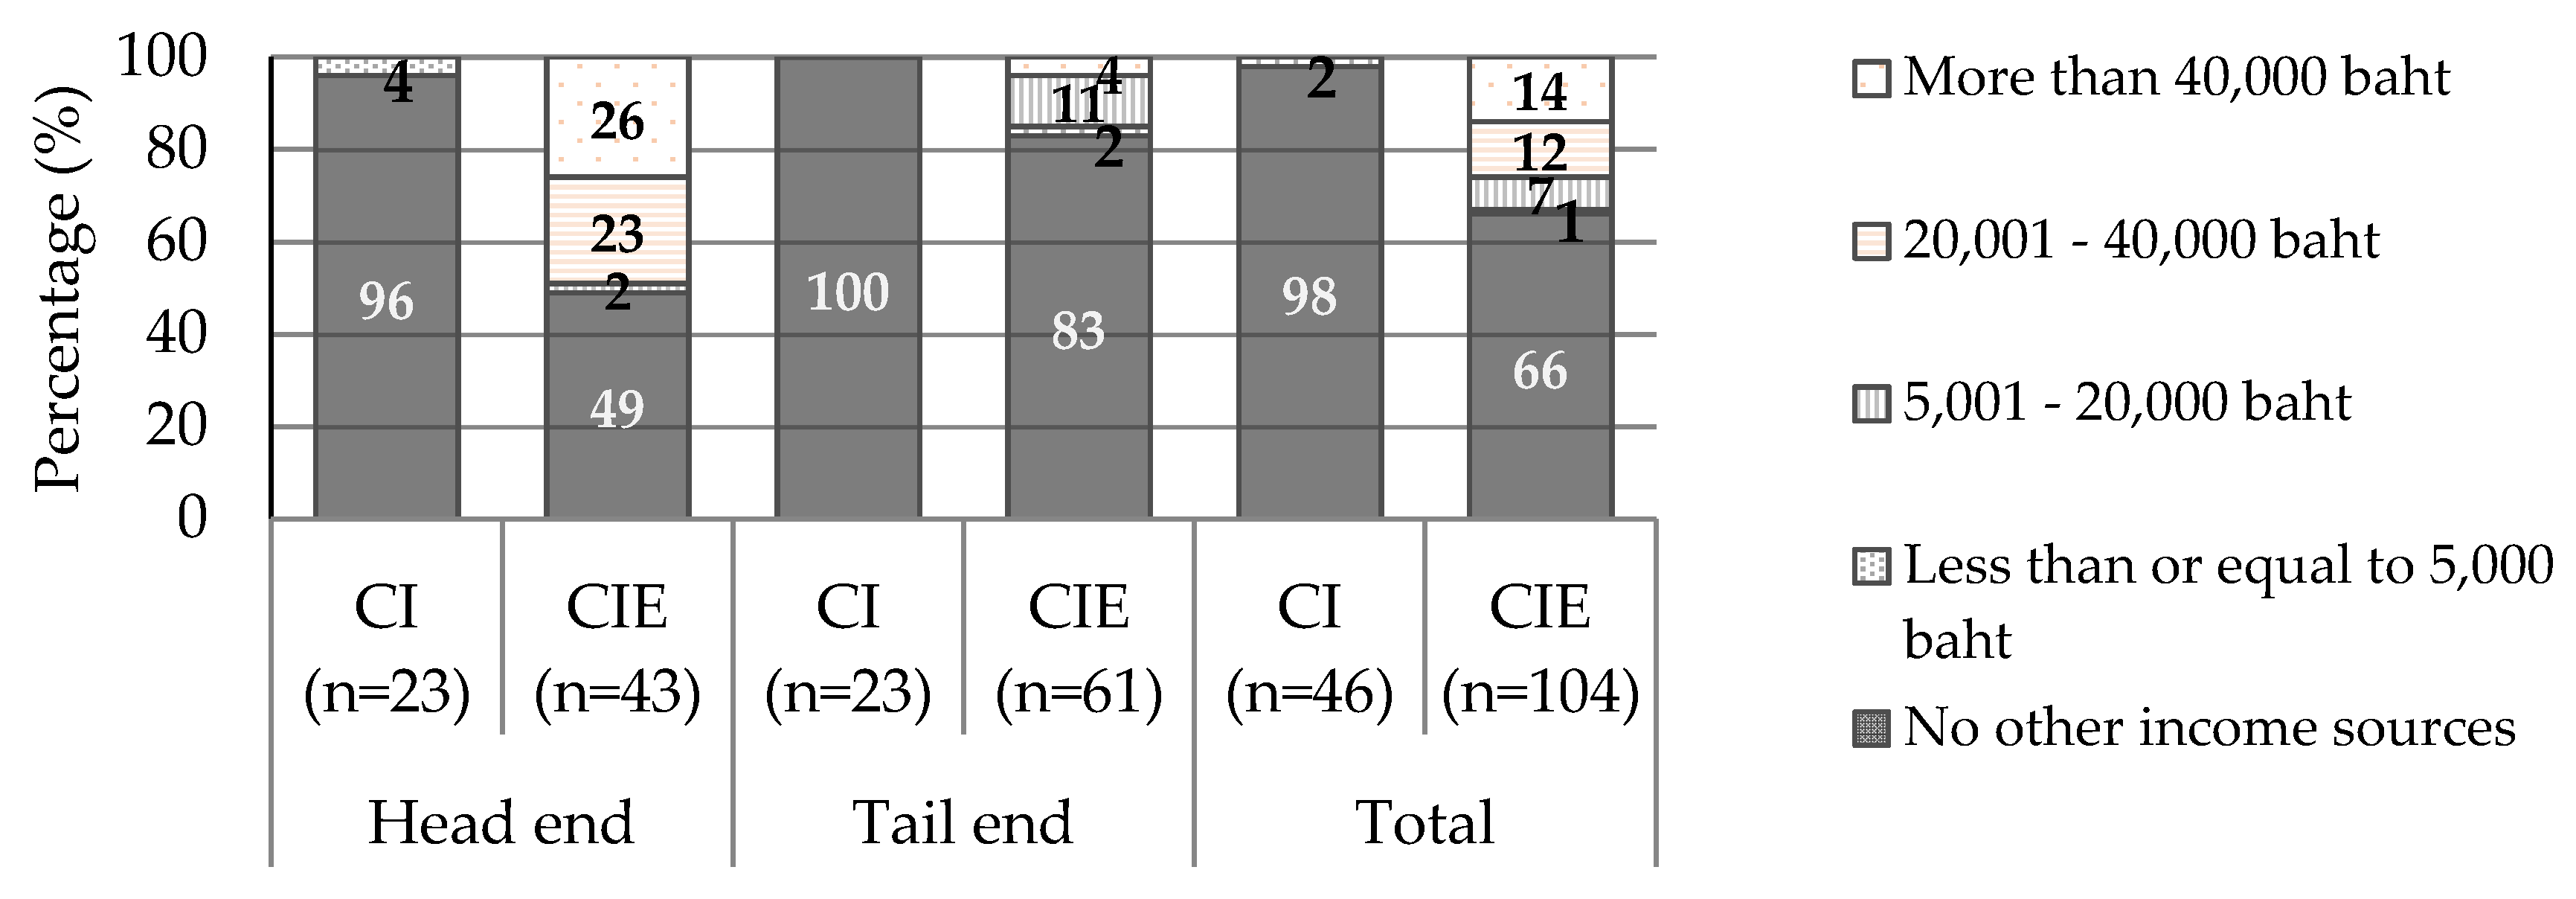
3.4. Yield Performance and Agricultural Income

Figure 11 and Figure 12 illustrate the dry season paddy yields per household and the annual paddy yields per household of the four groups of farmers, respectively. Contrary to conventional notion, the tail-end CI farmers outperformed both the head-end CI and CIE farmers in dry season paddy outputs per household (Figure 11), and entire year paddy yields per household (Figure 12).
These findings could be attributed to equitable water allocation and distribution among the tail-end CI farmers (Figure 8), which is the direct result of their active participation in the local irrigation operation and management (Figure 9). Specifically, in Figure 11, as many as 30% of tail-end CI farmers achieved an average dry season paddy yield of more than 18 tons per household, despite the less advantageous location of their farmlands. In Figure 12, nearly two-thirds (64%) of tail-end CI farmers could produce in excess of 19 tons of paddy rice per household annually.
Figure 13 illustrates the total household income from the sale of paddy rice of the participating farmers. The sale of paddy rice is the main source of income of small-scale farmers in many poor agricultural countries [48]. In Figure 13, as many as 39% of tail-end CI farmers could generate household income from the sale of paddy in excess of THB 300,000 (1 USD = THB 35).
The improved household income was attributed to effective water distribution (i.e., flexible, reliable and equitable water distribution) and their active participation in the local irrigation operation, resulting in greater paddy yields. However, despite the advantageous location of their farmlands, 9% and 5% of the head-end CI and CIE farmers earned less than THB 50,000 per household from the sale of paddy rice. It is worth noting that the family size of the head-end CIE group was relatively small, with households with fewer than four family members accounting for 40% of the total; and that their average paddy cultivation land per household was only 1.92 ha (Table 1). Higher farmland productivity contributed to higher income for the farmers, and thereby the decline in poverty [5,49].
Figure 14 presents the annual household agricultural income from other sources of the participating farmers (other than the sale of paddy rice to the local rice mills). The findings revealed that both the head-end (96%) and tail-end CI (100%) farmers hardly had any sources of income other than from the sale of their produce to the local rice mills. In contrast, the head-end (51%) and tail-end (17%) CIE farmers could earn additional income from other sources.

4. Discussion

The evaluation of the water distribution service to individual farm units demonstrated that water volume information of the respondents’ knowledge (Figure 5) was vital to rice cultivation given that it is imperative that the rice fields are adequately flooded prior to rice planting. Given the low level of education, the likelihood that the farmers’ experience-based knowledge (i.e., traditional wisdom) to be less precise was greater than if the evaluation was conducted using a rating scale [34]. Interestingly, despite a lack of scientifically measured information, the farmers’ traditional wisdom consistently proved correct. Training of local farmers as part of the process is crucial [50]. The respondents’ responses on the irrigation schedule flexibility, illustrated (Figure 6) that water distribution scheduling flexibility was important as the water flow rates vary considerably at the beginning of the planting season (the land preparation period) and once the rice has been planted [51]. Even within the same locality, rice cultivation could take place at different times during the growing season. Thus, it is necessary that schedule flexibility is integrated into irrigation operation and management to ensure consistent water supply throughout the entire irrigation system.
Furthermore, our observations also revealed that local community leaders played a vital and influential role in effective and equitable water allocation to the farmlands. The local leaders are the first contact point whom the farmers approach when a water distribution issue arises, e.g., unreliable or inadequate water volumes. When farmers are unable to agree on a mutual solution to a water distribution problem, they tend to seek interventions from the local leaders [52]. In this research, it was discovered that, upon listening to a complaint, the local leaders raise the issue with the local irrigation officials responsible for the operation of the primary irrigation canal, as the local leaders and farmers are responsible for the secondary and tertiary irrigation canals, respectively [53].
The farmer-managed irrigation system (FMIS) is efficient and can achieve equitable water distribution, as opposed to the agency-managed irrigation system (AMIS) [54]. The farmer-managed irrigation system can better serve the irrigation needs of the local residents. However, water allocation performance is better with the local government, and funds are available for customizing allocation to fit local conditions and providing irrigation advisory (extension service) to farmers [55].
Participation in agricultural water management by the local people is coordinated by government agencies at the local level. Local government agencies developed the working plan of operation and maintenance of the local irrigation system in collaboration with local leaders and farmers [11]. The farmers’ contributions to the maintenance and repair of the local irrigation system are essential to a successful participatory irrigation scheme [17]. In addition, farmers participating in the irrigation operation have greater access to farming water, and subsequently increased income [56]. These findings can be attributed to the equitable water allocation and distribution (in timely fashion) among the tail-end CI farmers (Figure 8), which are the direct result of their active participation in the local irrigation operation and management (Figure 9); on the other hand, 21% and 58% of head-end CIE farmers had less active participation and a sense of ownership, respectively. The local agency is instrumental in deciding the working days, determining the labor and cash contributions of the farmers to clean the canals and to organize making these issues routine [57]. The local agency motivates to improve participation that contributes to improving the performance of fair water allocation. Upgrading maintenance standards is also a necessary part of irrigation development.
Specifically, in Figure 11, as many as 30% of tail-end CI farmers achieved an average dry season paddy yield of more than 18 tons per household, despite the less advantageous location of their farmlands. In Figure 12, nearly two-thirds (64%) of tail-end CI farmers could produce in excess of 19 tons of paddy rice per household annually. The improved household income is attributed to the effective water distribution (i.e., flexible, reliable and equitable water distribution) and the tail-end CI farmers (mostly from higher socio-economic status) actively participating in the local irrigation operation, resulting in greater paddy yields (Figure 13). Therefore, higher farm productivity contributes to higher income for the farmers and thereby the decline in poverty.
Nevertheless, despite the advantageous location of their farmlands, 9% and 5% of head-end CI and CIE farmers earned less than THB 50,000 per household from the sale of paddy rice. The members and their community leaders have begun to explore new marketing channels and other activities to add value to their rice product (Figure 13). In comparison, the CIE farmer group could earn additional income from other sources as community enterprise membership provides CIE farmers with access to other marketing channels and new markets. The small community enterprises run by a large group of sophisticated proprietors are more successful than those endowed with a smaller stock of human capital [58,59,60].
Overall, our research findings revealed a strong relationship between effective irrigation operation, active participation by farmers in the irrigation operation, and their household earnings. The findings indicated that, by comparison, the tail-end CI farmers outperformed economically, as evident in the fact that 30% and 64% of tail-end CI farmers could produce more than 18 tons of dry season paddy, and more than 19 tons of paddy per household annually. Their improved economic well-being could be attributed to their active participation in the local irrigation operation, whereby 91% of tail-end CI farmers actively participated in the local irrigation operation and 92% expressed a sense of ownership in the system. The effective and equitable irrigation water allocation also contributed to the higher crop yields and household income as the farmers’ irrigation demands and concerns were recognized and addressed as a result of their active participation. Therefore, local policy-makers need to duly recognize the value of participation and to promote a profound change in government officers’ attitudes towards local leaders and farmers. Moreover, it is a testimonial to the possibility of collective action under self-governing institutions, and aims at a solution in the ever-increasing sector to achieve the full potential of public sector irrigation performance. Identifying the factors that contribute to effective water management by local leaders can make a valuable contribution in determining where the added efforts are needed. The implication of this study for local level participation to be more effective is organization of joint participatory training of the FMIS and AMIS farmer leaders facilitated by local agencies and irrigation officials, which eventually ensure that indigenous level management is integrated in such trainings.
The research findings are expected to shed light on the relationship between the participatory farmer-managed irrigation system, the active participation in the local irrigation operation, and the economic well-being of small-scale farmers in Thailand, in light of the fact that existing publications on this topic are mostly based in other countries. Moreover, the findings verify the effectiveness and usability of the participatory farmer-managed irrigation system in tackling the chronic problem of inequitable water allocation between head-end and tail-end farmers, given that water distribution inequality contributes to unequal household incomes. Importantly, the participatory farmer-managed irrigation scheme is readily implementable as it requires no additional financial investment and new technology, but rather the active participation of the local farmers in irrigation operation and management.
This empirical research, nevertheless, contained certain limitations. Given that the study period was limited to two years (2014–2015), the length of time needs to be extended in future research so that an understanding of the relationship between equitable water distribution, local active participation, and economic well-being can be established over a much longer timeframe. In addition, the study area was limited to one province (Chiang Mai Province), so future research should encompass several provinces in different regions of the country for inter-provincial and inter-regional comparison.

5. Conclusions

This research investigated the relationship between equitable irrigation water distribution, rice farmers’ active participation in the local irrigation operation, and their economic well-being. The research findings revealed a strong relationship between effective irrigation operation (i.e., flexible, reliable and equitable irrigation water distribution), the active participation of the rice farmers in the local irrigation operation, and their improved household earnings. Specifically, despite their less advantageous farmland location (towards the tail-end of the irrigation canal), the tail-end CI farmers outperformed other groups of farmers economically, as evidenced by the fact that as many as 30% of the tail-end CI farmers (vs. 26% for the head-end group) could produce more than 18 tons of dry season paddy per household; and that 64% of tail-end CI farmers (vs. 52% for the head-end group) could produce more than 19 tons of paddy per household annually. The higher paddy yields translated into higher household earnings for the farmers.
The improved economic well-being of the tail-end CI farmers was attributed to their active participation in the local irrigation operation and management, as evident in the findings that 91% of tail-end CI farmers actively participated in the maintenance and operation of the local irrigation system; and that 92% literally identified themselves as an owner of the irrigation system. Another contributing factor of higher paddy yields and household income was the equitable irrigation water allocation and distribution (39% of tail-end CI farmers perceived water distribution as equitable), which is was the product of the farmers’ active participation in the local irrigation operation as their irrigation demands and concerns were constantly recognized and addressed.

Acknowledgments

The authors would like to express gratitude to the officials at the Royal Irrigation Department, the Cooperative Auditing Department, and the Department of Agricultural Extension. Financial sponsorship from Thailand’s Ministry of Agriculture and Agricultural Cooperatives is gratefully acknowledged. Sincere appreciation goes to the community leaders and farmers for the interview data. Special thanks also to the journal editor and anonymous reviewers for their valuable suggestions and comments.

Author Contributions

Saowalak Kosanlawit contributed to the research design, methodology, fieldwork, analysis, and paper write-up. Peeyush Soni and Ganesh P. Shivakoti contributed to the research design, analysis, and paper write-up.

Conflicts of Interest

The authors declare no conflict of interest.

References

  1. Pradhan, P. Patterns of Irrigation Organization in Nepal. Available online: http://publications.iwmi.org/pdf/h_5910i.pdf (accessed on 15 December 2015).
  2. Benjamin, P.; Lam, W.F.; Ostrom, E.; Shivakoti, G. Institutions, Incentives, and Irrigation in Nepal. Available online: http://pdf.usaid.gov/pdf_docs/PNABT150.pdf (accessed on 25 January 2015).
  3. Vermillion, D. The Turnover and Self-Management of Irrigation Institutions in Developing Countries. Available online: http://publications.iwmi.org/pdf/H_12748.pdf (accessed on 9 October 2013).
  4. Ostrom, E.; Gardner, R. Coping with asymmetries in the commons: Self-governing irrigation systems can work. J. Econ. Perspect. 1993, 7, 93–112. [Google Scholar] [CrossRef]
  5. Shivakoti, G.; Ostrom, E. Farmer and Government Organized Irrigation Systems in Nepal: Preliminary Findings from Analysis of 127 Systems. Available online: https://dlc.dlib.indiana.edu/dlc/bitstream/handle/10535/4957/Farmer%20and%20Government%20Organized%20Irrigation%20Systems%20in%20Nepal%20Preliminary%20Findings%20From%20Analysis%20of%20127%20Systems.pdf?sequence=1&isAllowed=y (accessed on 1 April 2017).
  6. Lam, W.; Lee, M.; Ostrom, E. An Institutional Analysis Approach: Findings from the NIIS on Irrigation Performance. Available online: https://ideas.repec.org/p/iwt/bosers/h016269.html (accessed on 14 February 2014).
  7. Lam, W. Governing Irrigation Systems in Nepal: Institutions, Infrastructure, and Collective Action. Available online: https://www.cabdirect.org/cabdirect/abstract/20016785126 (accessed on 25 January 2015).
  8. Shivakoti, G. Participatory interventions in farmer-managed irrigation systems in Northern Thailand: Dynamism in resource mobilization. In Proceedings of the Eighth Conference of the International Association for the Study of Common Property, Bloomington, IN, USA, 31 May–4 June 2000. [Google Scholar]
  9. Ounvichit, T.; Satoh, M. Effects of Institutional Set-Up on Participation in Irrigation Management. Available online: https://scholar.google.co.th/scholar?hl=en&q=Khounvichit%2C+T.%3B+Satoh%2C+M.+Effects+of+institutional+set-up+on+participation+in+irrigation+management&btnG=&as_sdt=1%2C5&as_sdtp= (accessed on 1 April 2017).
  10. Tan-Kim-Yong, U.; Bruns, P.; Bruns, B. The Emergence of Polycentric Water Governance in Northern Thailand. Available online: http://www.bryanbruns.com/Ping-Yom9l.pdf (accessed on 5 March 2014).
  11. Heyd, H.; Neef, A. Public participation in water management in northern Thai highlands. Water Policy 2006, 8, 395–413. [Google Scholar] [CrossRef]
  12. Neef, A. Lost in translation: The participatory imperative and local water governance in North Thailand and Southwest Germany. Water Altern. 2008, 1, 89. [Google Scholar]
  13. Uphoff, N.; Ramamurthy, P.; Steiner, R. Managing Irrigation: Analyzing and Improving the Performance of Breaucracies. Available online: https://www.cabdirect.org/cabdirect/abstract/19921898674 (accessed on 4 February 2015).
  14. Ostrom, E.; Ahn, T.K. Foundations of Social Capital. Available online: http://era-mx.org/biblio/Ostrom_and_Ahn_2003.pdf (accessed on 22 February 2015).
  15. Marshall, G.R.; Patrick, I.W.; Muktasam, A.; Ambarawati, I.G.A.A. Alleviating Poverty by Linking Smallholders with Agribusiness: Roles of Social Capital and Common Property. In Proceedings of the 11th Biennial Conference of the International Association for the Study of Common Property, Ubud, Bali, Indonesia, 19–23 June 2006. [Google Scholar]
  16. Rockström, J. Rethinking Water Management: Innovative Approaches to Contemporary Issues; Routledge Press: London, UK, 2003. [Google Scholar]
  17. Ounvichit, T.; Wattayu, S.; Satoh, M. Participatory Management Structure of Large-Scale People’s Irrigation System: The Case of the Soprong Muang Fai System, Northern Thailand. Available online: http://repository.kulib.kyoto-u.ac.jp/dspace/bitstream/2433/66910/1/4605.pdf (accessed on 25 February 2015).
  18. Cullen, L.; Pretty, J.; Smith, D.; Pilgrim, S. Links between local ecological knowledge and wealth in indigenous communities of Indonesia: Implications for conservation of marine resources. Int. J. Interdiscip. Soc. Sci. 2007, 2, 289–299. [Google Scholar]
  19. Norton, R.D. Agricultural Development Policy: Concepts and Experiences; John Wiley & Sons Press: Chichester, UK, 2004. [Google Scholar]
  20. Kranz, W.; Eisenhauer, D.; Retka, M. Water and energy conservation using irrigation scheduling with center-pivot irrigation systems. Agric. Water Manag. 1992, 22, 325–334. [Google Scholar] [CrossRef]
  21. Food and Agriculture Organization of the United Nations (FAO). Investment in Land and Water. In Proceedings of the Regional Consultation at Bangkok, Bangkok, Thailand, 3–5 October 2001. [Google Scholar]
  22. Eching, S.; Frame, K.; Snyder, L. Role of Technology in Irrigation Advisory Services: The CIMIS Experience. Available online: https://scholar.google.co.th/scholar?hl=en&q=Eching%2C+S.%3B+FRAME%2C+K.%3B+SNYDER%2C+L.+Role+of+technology+in+irrigation+advisory+services%3A+The+CIMIS+experience.&btnG=&as_sdt=1%2C5&as_sdtp= (accessed on 19 April 2017).
  23. Ortega-Farias, S.; Acevedo, C.; Acevedo, A.; Leyton, B. Talca Irrigation Management System (TIMAS) for Grapevine; ISHS ActaHorticulturae Press: Talca, Chile, 2003; pp. 499–504. [Google Scholar]
  24. Gleick, P.; Christian-Smith, J.; Cooley, H. Water-use efficiency and productivity: Rethinking the basin approach. Water Int. 2011, 36, 784–798. [Google Scholar] [CrossRef]
  25. Cooley, H.; Christian-Smith, J.; Gleick, P.H.; Cohen, M.J.; Heberger, M. Saving Water, Energy, and Money. In California’s Next Million Acre-Feet, 2nd ed.; Ross, N., Luu, P., Eds.; Pacific Institute Press: Oakland, CA, USA, 2010. [Google Scholar]
  26. Gomez, K.A. Rice, the Grain of Culture. Available online: http://www.thairice.org/html/article/pdf_files/Rice_thegrain_of_Culture.pdf (accessed on 1 April 2017).
  27. Tanthien, B. Rice Production in Thailand. Available online: http://pdf.usaid.gov/pdf_docs/pnabe717.pdf#page=114 (accessed on 1 April 2017).
  28. Clemmens, A.J.; Molden, D.J. Water uses and productivity of irrigation systems. Irrig. Sci. 2007, 25, 247–261. [Google Scholar] [CrossRef]
  29. Burt, C.M.; Styles, S.W. Conceptualizing irrigation project modernization through benchmarking and the rapid appraisal process. Irrig. Drain. 2004, 53, 145–154. [Google Scholar] [CrossRef]
  30. Burt, C.; Styles, S. Rapid Appraisal Process (RAP) and Benchmarking Explanation and Tools. Available online: http://digitalcommons.calpoly.edu/cgi/viewcontent.cgi?article=1032&context=bae_fac (accessed on 5 March 2014).
  31. Burt, C.M.; Styles, S.W. Modern Water Control and Management Practices in Irrigation: Impact on Performance. Available online: https://pdfs.semanticscholar.org/7b87/1247a9c62c40c9f72b1457106c749251dee7.pdf (accessed on 30 March 2017).
  32. Nguyen, V. Tender evaluation by fuzzy sets. J. Constr. Eng. Manag. 1985, 111, 231–243. [Google Scholar] [CrossRef]
  33. Royal Irrigation Department (RID). Improvement Plans for Mae Kuang Operation and Maintenance Project; Ministry of Agriculture and Cooperatives Press: Bangkok, Thailand, 2012.
  34. El-Awad, O.; Gowing, J.; Mawdsley, J. An approach to multi-criterion evaluation of irrigation system performance. Irrig. Drain. Syst. 1991, 5, 61–75. [Google Scholar] [CrossRef]
  35. Sam-Amoah, L.; Gowing, J. Assessing the performance of irrigation schemes with minimum data on water deliveries1. Irrig. Drain. 2001, 50, 31–39. [Google Scholar] [CrossRef]
  36. Ghosh, S.; Singh, R.; Kundu, D. Evaluation of irrigation-service utility from the perspective of farmers. Water Resour. Manag. 2005, 19, 467–482. [Google Scholar] [CrossRef]
  37. Van der Zaag, P.; Rap, E. The pivotal role of canal operators in irrigation schemes: The case of the canalero. Irrig. Drain. 2012, 61, 436–448. [Google Scholar] [CrossRef]
  38. Operation and Maintenance Assessments. Available online: https://www.energystar.gov/ia/business/assessment.pdf (accessed on 22 February 2016).
  39. Brouwer, C.; Prins, K.; Heibloem, M. Irrigation Water Management: Irrigation Scheduling. Available online: http://s3.amazonaws.com/academia.edu.documents/33925749/Irrigation.pdf?AWSAccessKeyId=AKIAJ56TQJRTWSMTNPEA&Expires=1484821084&Signature=ozyixXntg1NriHGSRcytM%2Fpby%2BI%3D&response-content-disposition=inline%3B%20filename%3DIrrigation_Water_Management_Irrigation_S.pdf (accessed on 12 November 2015).
  40. Bahamish, A. Republic of Yemen Ministry of Agriculture and Irrigation. Available online: http://www.yemenwater.org/wp-content/uploads/2013/01/wp30-final-report-mis-gis.pdf (accessed on 3 January 2014).
  41. Ostrom, E.; Benjamin, P. Design principles and the performance of farmer managed irrigation systems in Nepal. In Performance Measurement in Farmer-Managed Irrigation Systems; Manor, S., Chambouleyron, J., Eds.; International Irrigation Management Institution: Columbo, Sri Lanka, 1993; pp. 53–62. [Google Scholar]
  42. Ghazouani, W.; Molle, F.; Rap, E. Water Users Associations in the NEN Region IFAD Interventions and Overall Dynamics. Available online: http://www.un.org/waterforlifedecade/water_cooperation_2013/pdf/water_users_associations_in_nen_region.pdf (accessed on 16 December 2014).
  43. Ahmed, A. Technology management in the Sudan: Strategic and policy challenges. Manag. Decis. 2003, 41, 267–273. [Google Scholar] [CrossRef]
  44. Abdelhadi, A.; Adam, H.; Hassan, M.; Hata, T. Participatory management: Would it be a turning point in the history of the Gezira scheme? Irrig. Drain. 2004, 53, 429–436. [Google Scholar] [CrossRef]
  45. Garces-Restrepo, C.; Vermillion, D.; Muñoz, G. Irrigation Management Transfer. Worldwide Efforts and Results. Available online: http://www.fao.org/3/a-a1520e.pdf (accessed on 12 December 2015).
  46. Gunchinmaa, T.; Yakubov, M. Institutions and transition: Does a better institutional environment make water users associations more effective in Central Asia? Water Policy 2010, 12, 165. [Google Scholar] [CrossRef]
  47. Shivakoti, G. Facilitating Policies for Improved Governance and Management of Asian Irrigation Systems. Available online: https://www.researchgate.net/profile/Ganesh_Shivakoti/publication/228763886_Facilitating_Policies_for_Improved_Governance_and_Management_of_Asian_Irrigation_Systems/links/0deec534b28ab3be22000000.pdf (accessed on 15 January 2014).
  48. Quadrini, V. Entrepreneurship, saving, and social mobility. Rev. Econ. 2000, 3, 1–40. [Google Scholar] [CrossRef]
  49. Haugh, H. A research agenda for social entrepreneurship. Soc. Enterp. J. 2005, 1, 1–12. [Google Scholar] [CrossRef]
  50. Bruns, B. Participatory Management for Agricultural Water Control in Vietnam: Challenges and Opportunities. Available online: http://www.bryanbruns.com/opportun.html (accessed on 19 April 2017).
  51. Gorantiwar, S.; Smout, I. Multilevel approach for optimizing land and water resources and irrigation deliveries for tertiary units in large irrigation schemes. II: Application. J. Irrig. Drain. Eng. 2005, 131, 264–272. [Google Scholar] [CrossRef]
  52. Badawy, H.A. Exchange of Irrigation Water between Farmers in Egypt. Available online: http://iwtc.info/2005_pdf/07-3.pdf (accessed on 10 December 2016).
  53. Shivakoti, G.; Bastakoti, R. The robustness of Montane irrigation systems of Thailand in a dynamic human-water resources interface. J. Inst. Econ. 2006, 2, 227–247. [Google Scholar] [CrossRef]
  54. Neef, A.; Bollen, A.; Sangkapitux, C.; Chamsai, L.; Elstner, P. Can Local Communities Manage Water Resources Sustainably? Evidence from the Northern Thai Highlands. Available online: http://www.tucson.ars.ag.gov/isco/isco13/PAPERS%20M-Q/NEEF%201.pdf (accessed on 11 December 2016).
  55. Levidow, L.; Zaccaria, D.; Maia, R.; Vivas, E.; Todorovic, M.; Scardigno, A. Improving water-efficient irrigation: Prospects and difficulties of innovative practices. Agric. Water Manag. 2014, 146, 84–94. [Google Scholar] [CrossRef]
  56. Ghazouani, W.; Marlet, S.; Mekki, I.; Vidal, A. Farmers’ perceptions and engineering approach in the modernization of a community-managed irrigation scheme. A case study from an oasis of the Nefzawa (South of Tunisia). Irrig. Drain. 2009, 58, 285–296. [Google Scholar] [CrossRef]
  57. Meinzen-Dick, R.; Raju, K.V.; Gulati, A. What affects organization and collective action for managing resources? Evidence from canal irrigation systems in India. World Dev. 2002, 30, 649–666. [Google Scholar] [CrossRef]
  58. Jovanovic, B. Selection and the Evolution of Industry. Econom. J. Econom. Soc. 1982, 50, 649–670. [Google Scholar] [CrossRef]
  59. Pakes, A.; Ericson, R. Empirical implications of alternative models of firm dynamics. J. Econ. Theory 1998, 79, 1–45. [Google Scholar] [CrossRef]
  60. Srivastava, A.; Tripathi, N.K.; Gokhale, K.V.G.K. Mapping groundwater salinity using IRS-1B LISS II data and GIS techniques. Int. J. Remote Sens. 1997, 18, 2853–2862. [Google Scholar] [CrossRef]
Figure 1. Location map of the study area.
Water 09 00319 g001
Figure 2. Causes of poor crop yields as perceived by the sampled farmers (% of total).
Water 09 00319 g002
Figure 3. The respondents’ responses on the water distribution practice whereby the tail-end farmers would be unable to plant the dry-season paddy, where NO = unfair and YES = fair (in % of group total). The Exact Sig. (2-sided) of the Chi-square test statistics is significant at 5% level (χ2 = 14.531, df = 6, P-value < 0.05).
Water 09 00319 g003
Figure 4. The respondents’ perception of the predictability and adequacy of the irrigated water (in % of group total). The Monte Carlo Sig. (2-sided) of the chi-squared statistic is significant at the 1% level (χ2 = 16.769, df = 6, P-value = 0.01).
Water 09 00319 g004
Figure 5. The respondents’ knowledge of water volumes demanded by and supplied to their farmlands, where 4 denotes full knowledge of the water volume whereas 0 denotes no such knowledge and instead relies on traditional wisdom (in % of group total). The Monte Carlo Sig. (2-sided) of the chi-squared statistic is significant at the 1% level (χ2 = 34.004, df = 9, P-value < 0.01).
Water 09 00319 g005
Figure 6. The respondents’ responses on irrigation schedule flexibility, where 4 denotes very flexible and 0 denotes inflexible (in % of group total). The Monte Carlo Sig. (2-sided) of the chi-squared statistic is significant at the 1% level (χ2 = 44.725, df = 12, P-value < 0.01).
Water 09 00319 g006
Figure 7. The respondents’ responses on the reliability of water distribution, where 4 denotes very reliable and 0 denotes unreliable (in % of group total). The Monte Carlo Sig. (2-sided) of the chi-squared statistic is significant at the 1% level (χ2 = 82.697, df = 12, P-value < 0.01).
Water 09 00319 g007
Figure 8. The respondents’ responses on the equality of water distribution, where 4 denotes equitable and 0 denotes inequitable (in % of group total). The Monte Carlo Sig. (2-sided) of the chi-squared statistic is significant at the 1% level (χ2 = 54.063, df = 12, P-value < 0.01).
Water 09 00319 g008
Figure 9. The respondents’ participation in the local irrigation operation and their sense of ownership (in % of group total). The Exact Sig. (2-sided) of the chi-squared statistics are significant at the 5% level (χ2 = 32.356, df = 3, P-value < 0.05 for regular irrigation maintenance and χ2 = 11.7743, df = 3, P-value = 0.05 for the sense of ownership).
Water 09 00319 g009
Figure 10. The respondents’ responses on the issues of impact from irrigation policy change, their understanding of irrigation policy and practices, irrigation schedule and information sharing (in % of group total). The Monte Carlo Sig. (2-sided) of the chi-squared statistics are significant at the 1% level (χ2 = 61.527, 50.983, 38.764 and 35.483 for the first, second, third and fourth issues, respectively; and the df and P-value are 12 and <0.01).
Water 09 00319 g010
Figure 11. The respondents’ dry-season paddy yields per household (in % of group total). The Monte Carlo Sig. (2-sided) of the chi-squared statistic is significant at the 1% level (χ2 = 36.863, df = 12, P-value < 0.01).
Water 09 00319 g011
Figure 12. The respondents’ annual paddy yields per household (in % of group total). The Monte Carlo Sig. (2-sided) of the chi-squared statistic is significant at the 1% level (χ2 = 35.665, df = 15, P-value < 0.01).
Water 09 00319 g012
Figure 13. The respondents’ annual household income from the sale of paddy rice (in % of group total, 1 US$ = THB 35). The Monte Carlo Sig. (2-sided) of the chi-squared statistic is significant at the 1% level (χ2 = 16.409, df = 12, P-value > 0.01).
Water 09 00319 g013
Figure 14. The respondents’ household agricultural income from sources other than the sale of paddy rice (in % of group total). The Monte Carlo Sig. (2-sided) of the chi-squared statistic is significant at the 1% level (χ2 = 62.696, df = 15, P-value < 0.01).
Water 09 00319 g014
Table 1. Demographics and average paddy cultivation land of the 150 sampled farmers.
FarmerGenderEducational LevelHousehold MembersStatus in FamilyAverage Paddy Cultivation Land (ha)
MaleFemaleLowMediumHigh≤4>4Household HeadResident
Head-end
CI (n = 23) (%)23 (100)0 (0)19 (83)4 (17)0 (0)6 (26)17 (74)21 (91)2 (9)2.08
CIE (n = 43) (%)38 (88)5 (12)30 (70)3 (7)10 (23)17 (40)26 (60)27 (63)16 (37)1.92
Tail-end
CI (n = 23) (%)23 (100)0 (0)17 (74)0 (0)6 (26)3 (13)20 (87)21 (91)2 (9)3.04
CIE (n = 61) (%)54 (89)7 (11)41 (67)7 (12)13 (21)21 (34)40 (66)37 (61)24 (39)2.40
Notes: The head-end and tail-end of the irrigation canal refer to the districts of Doi Saket and Mae On, respectively; and CI and CIE denote the community irrigation farmers and the community irrigation and enterprise farmers, respectively. The low, medium and high education levels denote lower than primary school, between primary and high school, and bachelor’s degree or above, respectively. The demographic values in the parentheses are the percentage of each group total.
Table 2. Relationship between farmer information sharing of water allocation/active participation in irrigation operation and agricultural yields (ha/ton).
Number of RespondentsPearson Correlations of Linear RegressionANOVA
Paddy Yield in Dry-SeasonAnnual Paddy YieldsMean SquareFSig.
Active participation in the irrigation operation and maintenance1500.37 40.2922.710.000
150 0.3315.3814.920.000
Farmer information sharing of water allocation1500.23 16.058.280.005
150 0.2712.4411.830.001

