Article

Fuzzy Comprehensive Assessment Method Based on the Entropy Weight Method and Its Application in the Water Environmental Safety Evaluation of the Heshangshan Drinking Water Source Area, Three Gorges Reservoir Area, China

1
Key Laboratory of Regional Energy and Environmental Systems Optimization, Ministry of Education, North China Electric Power University, Beijing 102206, China
2
Institute for Energy, Environment and Sustainable Communities, University of Regina, Regina, SK S4S 7H9, Canada
3
Three Gorges Cascade Dispatch and Communication Center, Yichang 443133, China
*
Author to whom correspondence should be addressed.
Water 2017, 9(5), 329; https://doi.org/10.3390/w9050329
Submission received: 14 March 2017 / Revised: 4 May 2017 / Accepted: 4 May 2017 / Published: 6 May 2017
(This article belongs to the Special Issue Modeling of Water Systems)

Abstract

:
The safety of drinking water from source areas is an important issue, and the fuzzy comprehensive assessment method is a useful evaluation approach. However, it has limitations due to its complicated calculation, as well as the effects of subjective factors on the results. The objective of the research is to develop an effective method with more objective results for tackling water environmental evaluation problems in drinking water source areas. In this study, a new method— i.e., the fuzzy comprehensive assessment method based on the entropy weight method—was proposed; a water environmental safety evaluation index system was built, and then the water environmental safety of the Heshangshan drinking water source area was evaluated. The results indicated that the water environment of the study area was substantially safe. Furthermore, water-saving measurements should be taken, the industrial structure should be optimized, investment in environmental protection should be increased, and the utilization ratio of water resources should be improved. It can be concluded that the proposed approaches were feasible and reasonable. It is the first attempt to develop such an evaluation method and index system for water environmental safety evaluation, which can provide references and decision support for the related researchers and managers.

1. Introduction

Drinking water is the most important natural resource necessary for human life and economic prosperity [1,2]. The reservoirs of drinking water are important areas for the people who depend on them. Therefore, ensuring that drinking water areas remain clean is an important issue in the field of water environmental management, ecological protection, and economic and social growth [3,4,5]. Water environmental safety evaluation is a scientific and effective approach to identifying potential risks, assessing the safety level, and determining the water supply capacity of drinking water source areas [6,7].
In recent decades, many methods have been developed for water environmental safety evaluation, such as the Bayesian discrimination (BD) [8], the artificial neural network (ANN) [9,10], the gray correlation analysis (GCA) [11,12,13], and the fuzzy comprehensive assessment method (FCA) [14,15,16]. Among them, FCA is one of the feasible approaches for tackling water environmental safety evaluation, and has been widely used in many fields, such as water resource management, water environmental protection, the safety evaluation of drinking water sources, etc. [17]. FCA is effective for resolving the problems in which the information is too fuzzy to quantify and the evaluation objective is restricted by many factors. Li et al. [18] used FCA on the basis of fuzzy mathematics and MATLAB to evaluate the Jinan urban water supply system. Moreover, the most important impact factors affecting the quality of the water supply were also obtained. Zhao et al. [19] assessed the ecological safety status of Mianyang City from 1998 to 2005 using the FCA, presenting the eco-safety level of the city, and concluding that the FCA could resolve the uncertainty in evaluating the urban eco-safety standard. As for the FCA, the weights of the indexes that indicated the impact on the evaluation objective were very important. Traditional methods of weight determination involved analytic hierarchy process (AHP) [20,21], the Delphi method [22], and principal component analysis [23]. Ma et al. [24] built an ecological evaluation index system and evaluated the ecological environment of a sand mining area in Beijing through FCA, in which weights of evaluation indexes were determined by the AHP method. However, they still have two limitations. The first one is that there are difficulties in weight determination under the condition of excessive indexes in the index system, and the second one consists of the effects of subjective factors on results. To mitigate these concerns, FCA has to be improved based on an effective method of weight determination.
The aim of this research is to develop a feasible and effective method with more objective results for tackling water environmental safety evaluation problems in drinking water source areas. Firstly, an improved FCA will be presented through integrating the entropy weight method into the original model, which can then quantify the information of each evaluation factor objectively and simplify the evaluation process. Then, a water environmental safety evaluation index system (WESEIS) will be constructed using the Heshangshan drinking water source area (HDWSA) as study area. Finally, the evaluation results of water environmental safety for HDWSA will be also obtained. The study would give researchers a referential method and an evaluation index system for evaluating the water environmental safety of drinking water source areas. Moreover, it may also provide a decision support for administrators in the field of drinking water safety, water environmental protection, and water resource utilization.

2. Materials and Methodology
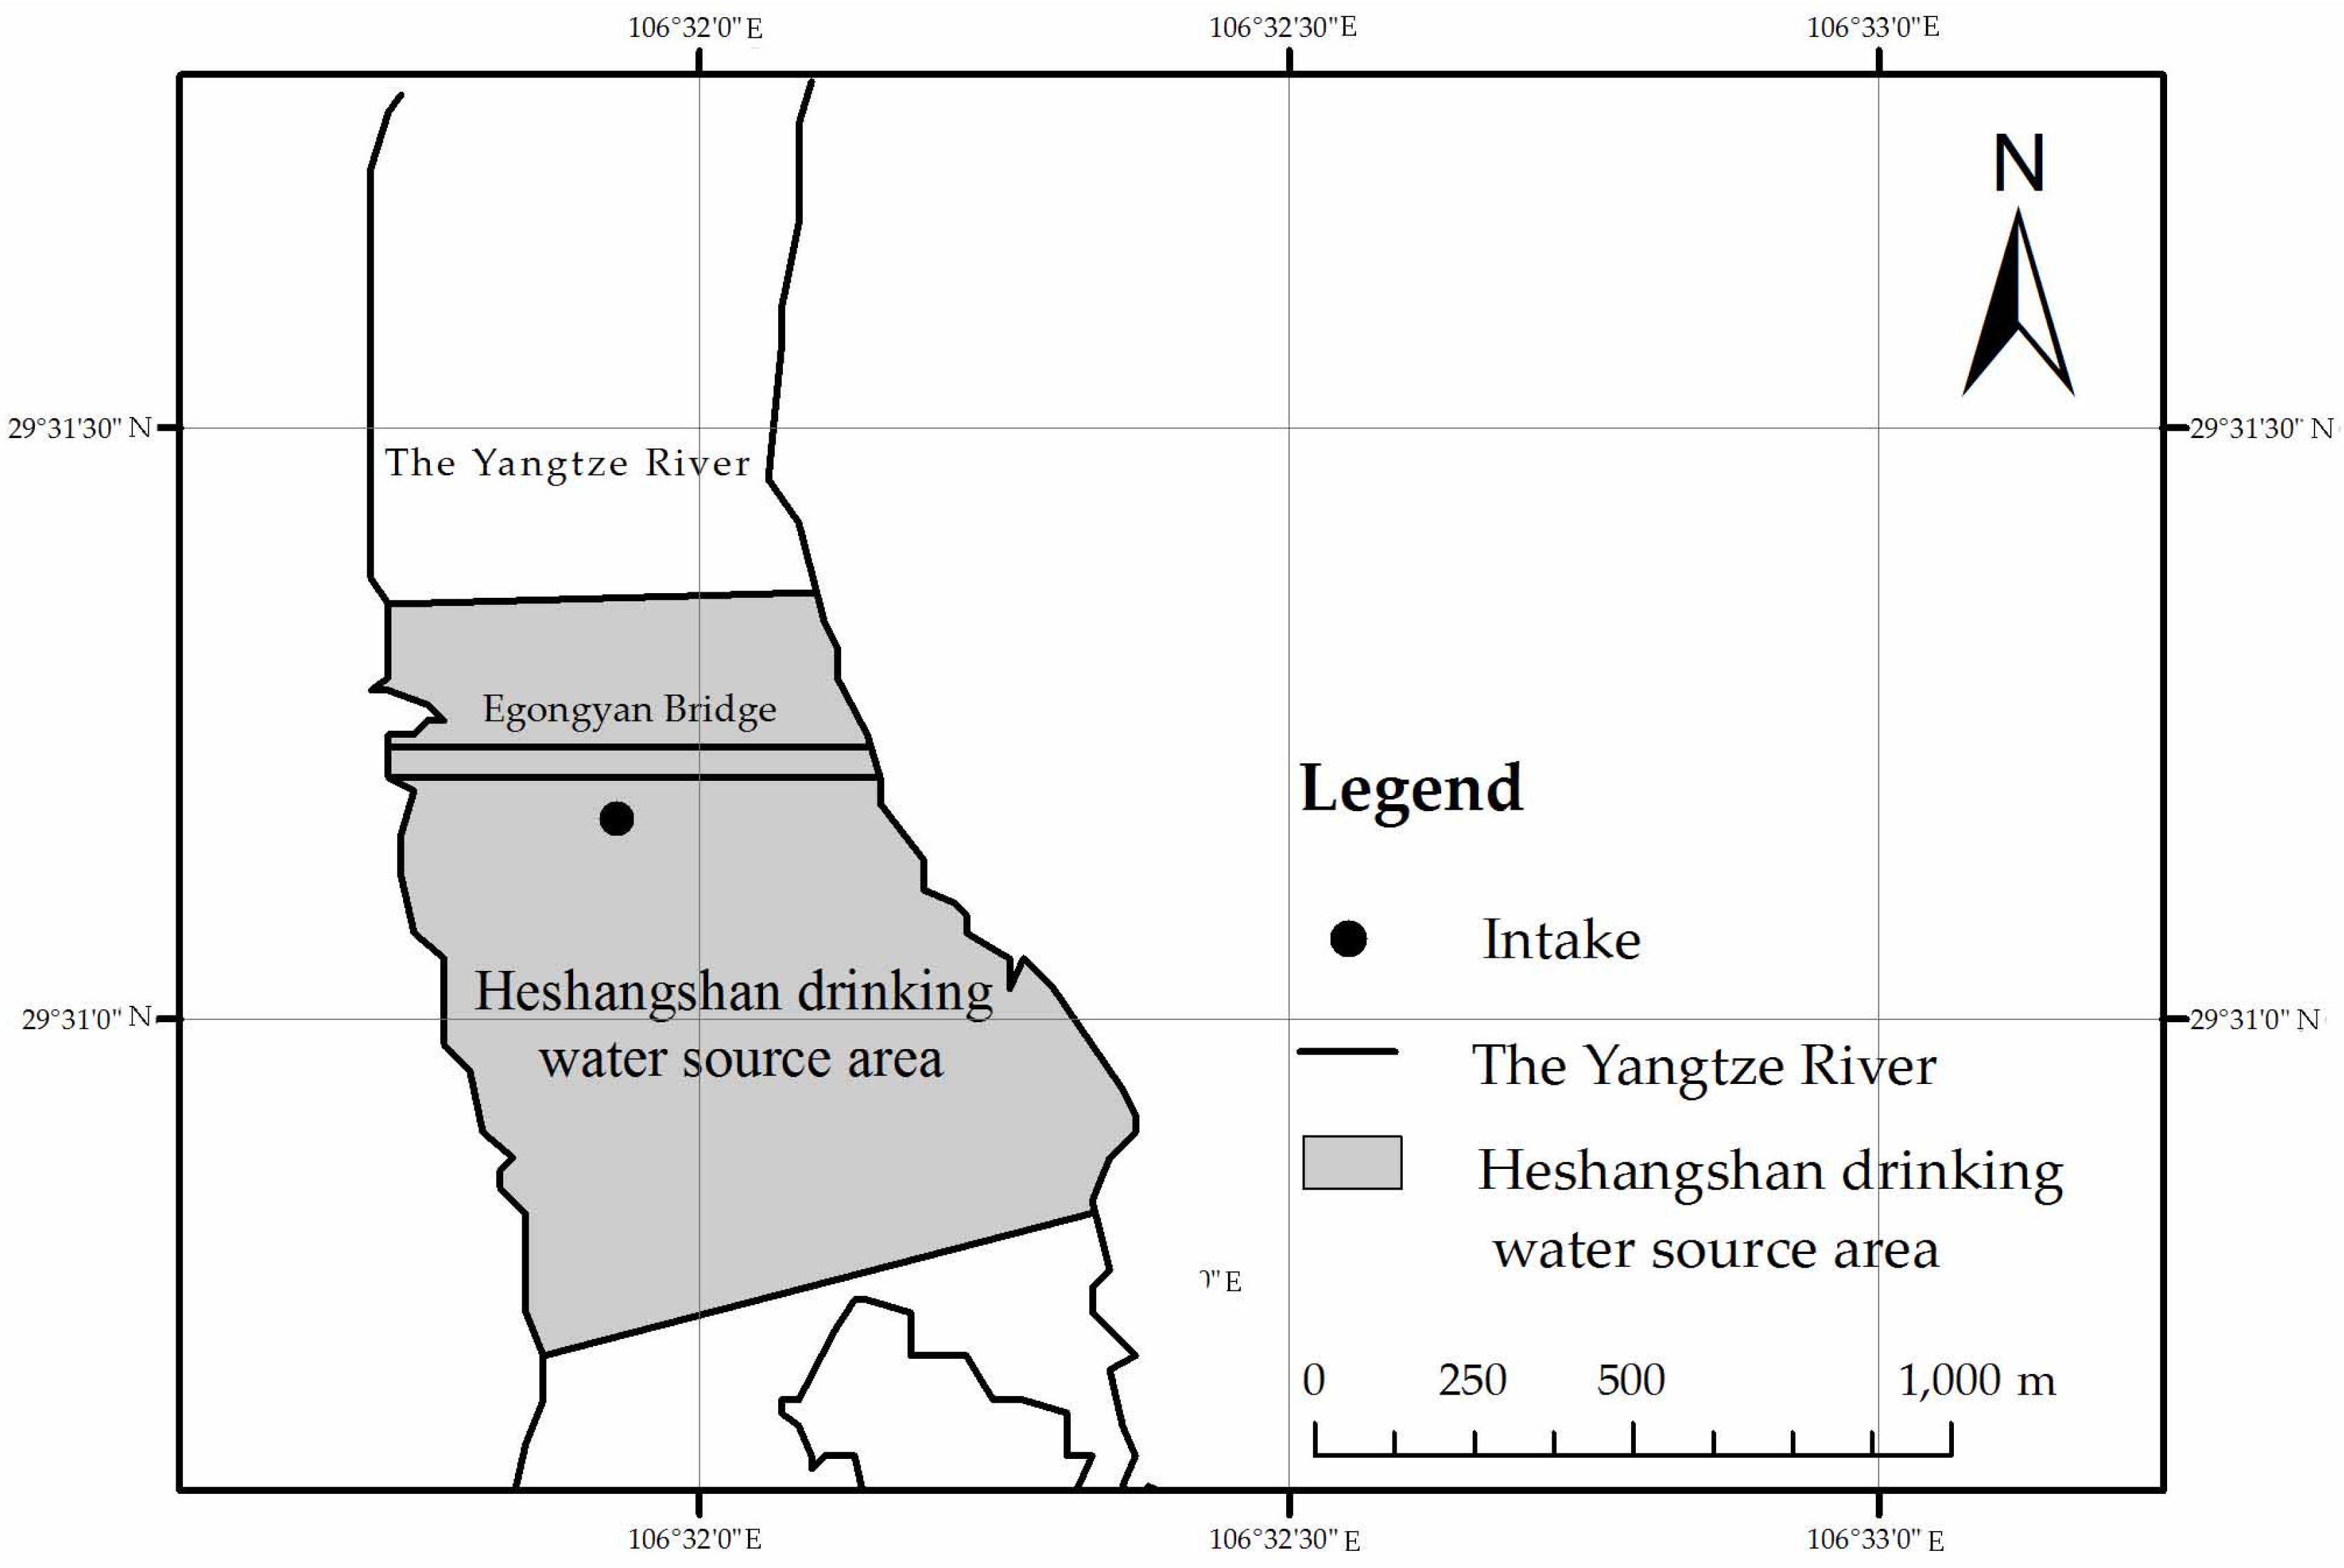
2.1. Study Area

The Yangtze River is the third longest river in the world, which stretches 6300 kilometers and flows through 16 provinces (municipality cities, autonomous regions) of China. The Three Gorges Dam, located in the Yangtze River, is the largest one in the world and plays a key role in flood control, power generation, and shipping. After the construction of the Three Gorges Dam, the channel regime of the reservoir area changed, which reduced the ability of the water bodies in Three Gorges Reservoir area for self-purification, and possibly threatened water environmental safety in general [25]. The HDWSA in Jiulongpo district of Chongqing city is one of the most important drinking water source areas of the Three Gorges Reservoir area, servicing 980,000 citizens. It covers the area from 106°31′20ʺ E to 106°32′25′′ E and 29°30′43′′ N to 29°31′22′′ N, as shown in Figure 1. Its length is 1100 m, and its width is about 1000 m, and the area is about 1.10 km2. According to the related division standard, the water quality of the HDWSA should meet the requirements of level III in environmental quality standards for surface water (GB3838-2002) [26].

2.2. Methodology

2.2.1. Fuzzy Comprehensive Assessment Method

FCA is a synthetical assessment method that applies a maximum membership degree principle and fuzzy mathematics theory to evaluate systems affected by various factors [27,28]. The specific steps of FCA are as follows:
(1)
Defining the factor set, i.e., U = {u1, u2, …, ui, …, um}, which is a set consisting of m kinds of evaluation factors, and ui is the ith evaluation factor.
(2)
Establishing the evaluation set V = {v1, v2, …, vj, …, vn}, which is a discrete set made up of n levels of evaluation results, and vj is the jth evaluation result.
(3)
Building the original matrix X,
X = [ x 11 x 12 x 1   y r x 21 x 22 x 2   y r x m 1 x m 2 x m   y r ] ,
where m is the number of indexes, yr is the year for evaluation, and xik (1 ≤ Im, 1 ≤ kyr) is the value of the ith index in the kth year.
(4)
Determining the weight matrix A = {a1, a2, …, am}, which is a set composed of m kinds of index weights which indicate the importance of various evaluation indexes.
(5)
Constructing the single factor evaluation matrix Q by membership function, where Q is a fuzzy relationship matrix that consists of the membership degrees of ui to vj. The matrix is:
Q = [ q 11 q 12 q 1   y r q 21 q 22 q 2   y r q m 1 q m 2 q m   y r ] ,
where qij is the membership degree of factor ui to vj.
(6)
Obtaining the comprehensive evaluation set B, which is a set made up of n kinds of evaluation results by fuzzy operating of the single factor evaluation matrix and weight matrix.
B = ( b 1 ,   b 2 ,   ......   , b n ) = A Q ,

2.2.2. Improved Fuzzy Comprehensive Assessment Method

As mentioned above, FCA has a complicated calculating process for determining weight under the condition of excessive indexes in an index system. Furthermore, subjective results may be obtained by FCA due to its objective in the process of weight determination. To mitigate these concerns, the entropy weight method is introduced into FCA for weight determination, considering it can utilize information of evaluation factors effectively and objectively. The existing FCA method is mainly through the subjective assignment method (such as the analytic hierarchy process) to determine the weight. The calculation is complicated on the condition of that there are too many indexes in WESEIS. However, the improved FCA used an objective, simple method (the entropy weight method) to determine the weights. As for the entropy weight method, the weights are determined based on the relationships among the indexes. It can reflect and reveal the intrinsic characteristics and relevance of the indexes, avoid the influences of subjective factors, and improve the scientificity of the evaluation result. Therefore, the improved model—i.e., fuzzy comprehensive assessment method based on the entropy weight method (EW-FCA)—could simplify and objectify the evaluation process, reflect information of the evaluation indexes more adequately, and acquire more objective results.
In the enhanced model, the weight determination of the indexes is improved as follows:
(1)
Standardizing the indexes and building the standardization matrix Y = (yij)m × yr (m is the number of indexes, yr is the year for evaluation), which will be explained specifically in Section 2.2.3. Then, the proportion of each index (pik) is determined as follows:
p i k = y i k j = 1 y r y i k   ( 1 I m ,   1 k y r ) ,
where pik is the proportion of the ith index in the kth year.
(2)
Calculating the information entropy (ei) by
e i = c j = 1 y r p i j ln p i j ,
where c = 1/lnyr. In addition, if pik = 0, then piklnpik = 0 (1 ≤ im, 1 ≤ kyr).
(3)
Obtaining the weights of indexes by
a i = 1 e i m i = 1 m e i ,
where ai is the final weight of the ith index, and the weight matrix is formed as A = {a1, a2, …, am}.
When an index has a small entropy value, it plays an important role and has a large weight value in comprehensive evaluation, and vice versa. Compared to the original model, it can be found that EW-FCA takes full consideration of information of evaluation indexes and their relationships, improves objectivity of the results, and simplifies the calculation process.

2.2.3. Standardization

In a multi-index system, dimensions as well as magnitudes of indexes are various, and therefore standardization of index values is necessary before weight determination and compressive evaluation. Standardization can eliminate the differences of dimensions and magnitudes for various indexes, and render them dimensionless. As mentioned above, there are two types of indexes (benefit and cost) in the index system for compressive evaluation. Regarding benefit index, the higher the value is, the greater the objective value is, and vice versa. For convenience, symbol “↑” is used to reflect benefit indexes, whereas symbol “↓” is adopted to express cost ones.
The standardization processes are as follows:
(1)
Building the original matrix X
X = [ x 11 x 12 x 1   y r x 21 x 22 x 2   y r x m 1 x m 2 x m   y r ] ,
(2)
For a benefit index, the standardized xik, i.e., yik is calculated as
y i k = x i k min 1 k y r x i k max 1 k y r x i k min 1 k y r x i k ,
where m is the number of indexes, yr is the year for evaluation, and xik (1 ≤ im, 1 ≤ kyr) is the value of the ith index in the kth year, yik is the standardization value of a benefit index xik.
(3)
As for a cost index, the standardization equation is
y i k = max 1 k y r x i k x i k max 1 k y r x i k min 1 k y r x i k ,
where meanings of the symbols were the same as those in Formula (8).

3. Results and Discussion

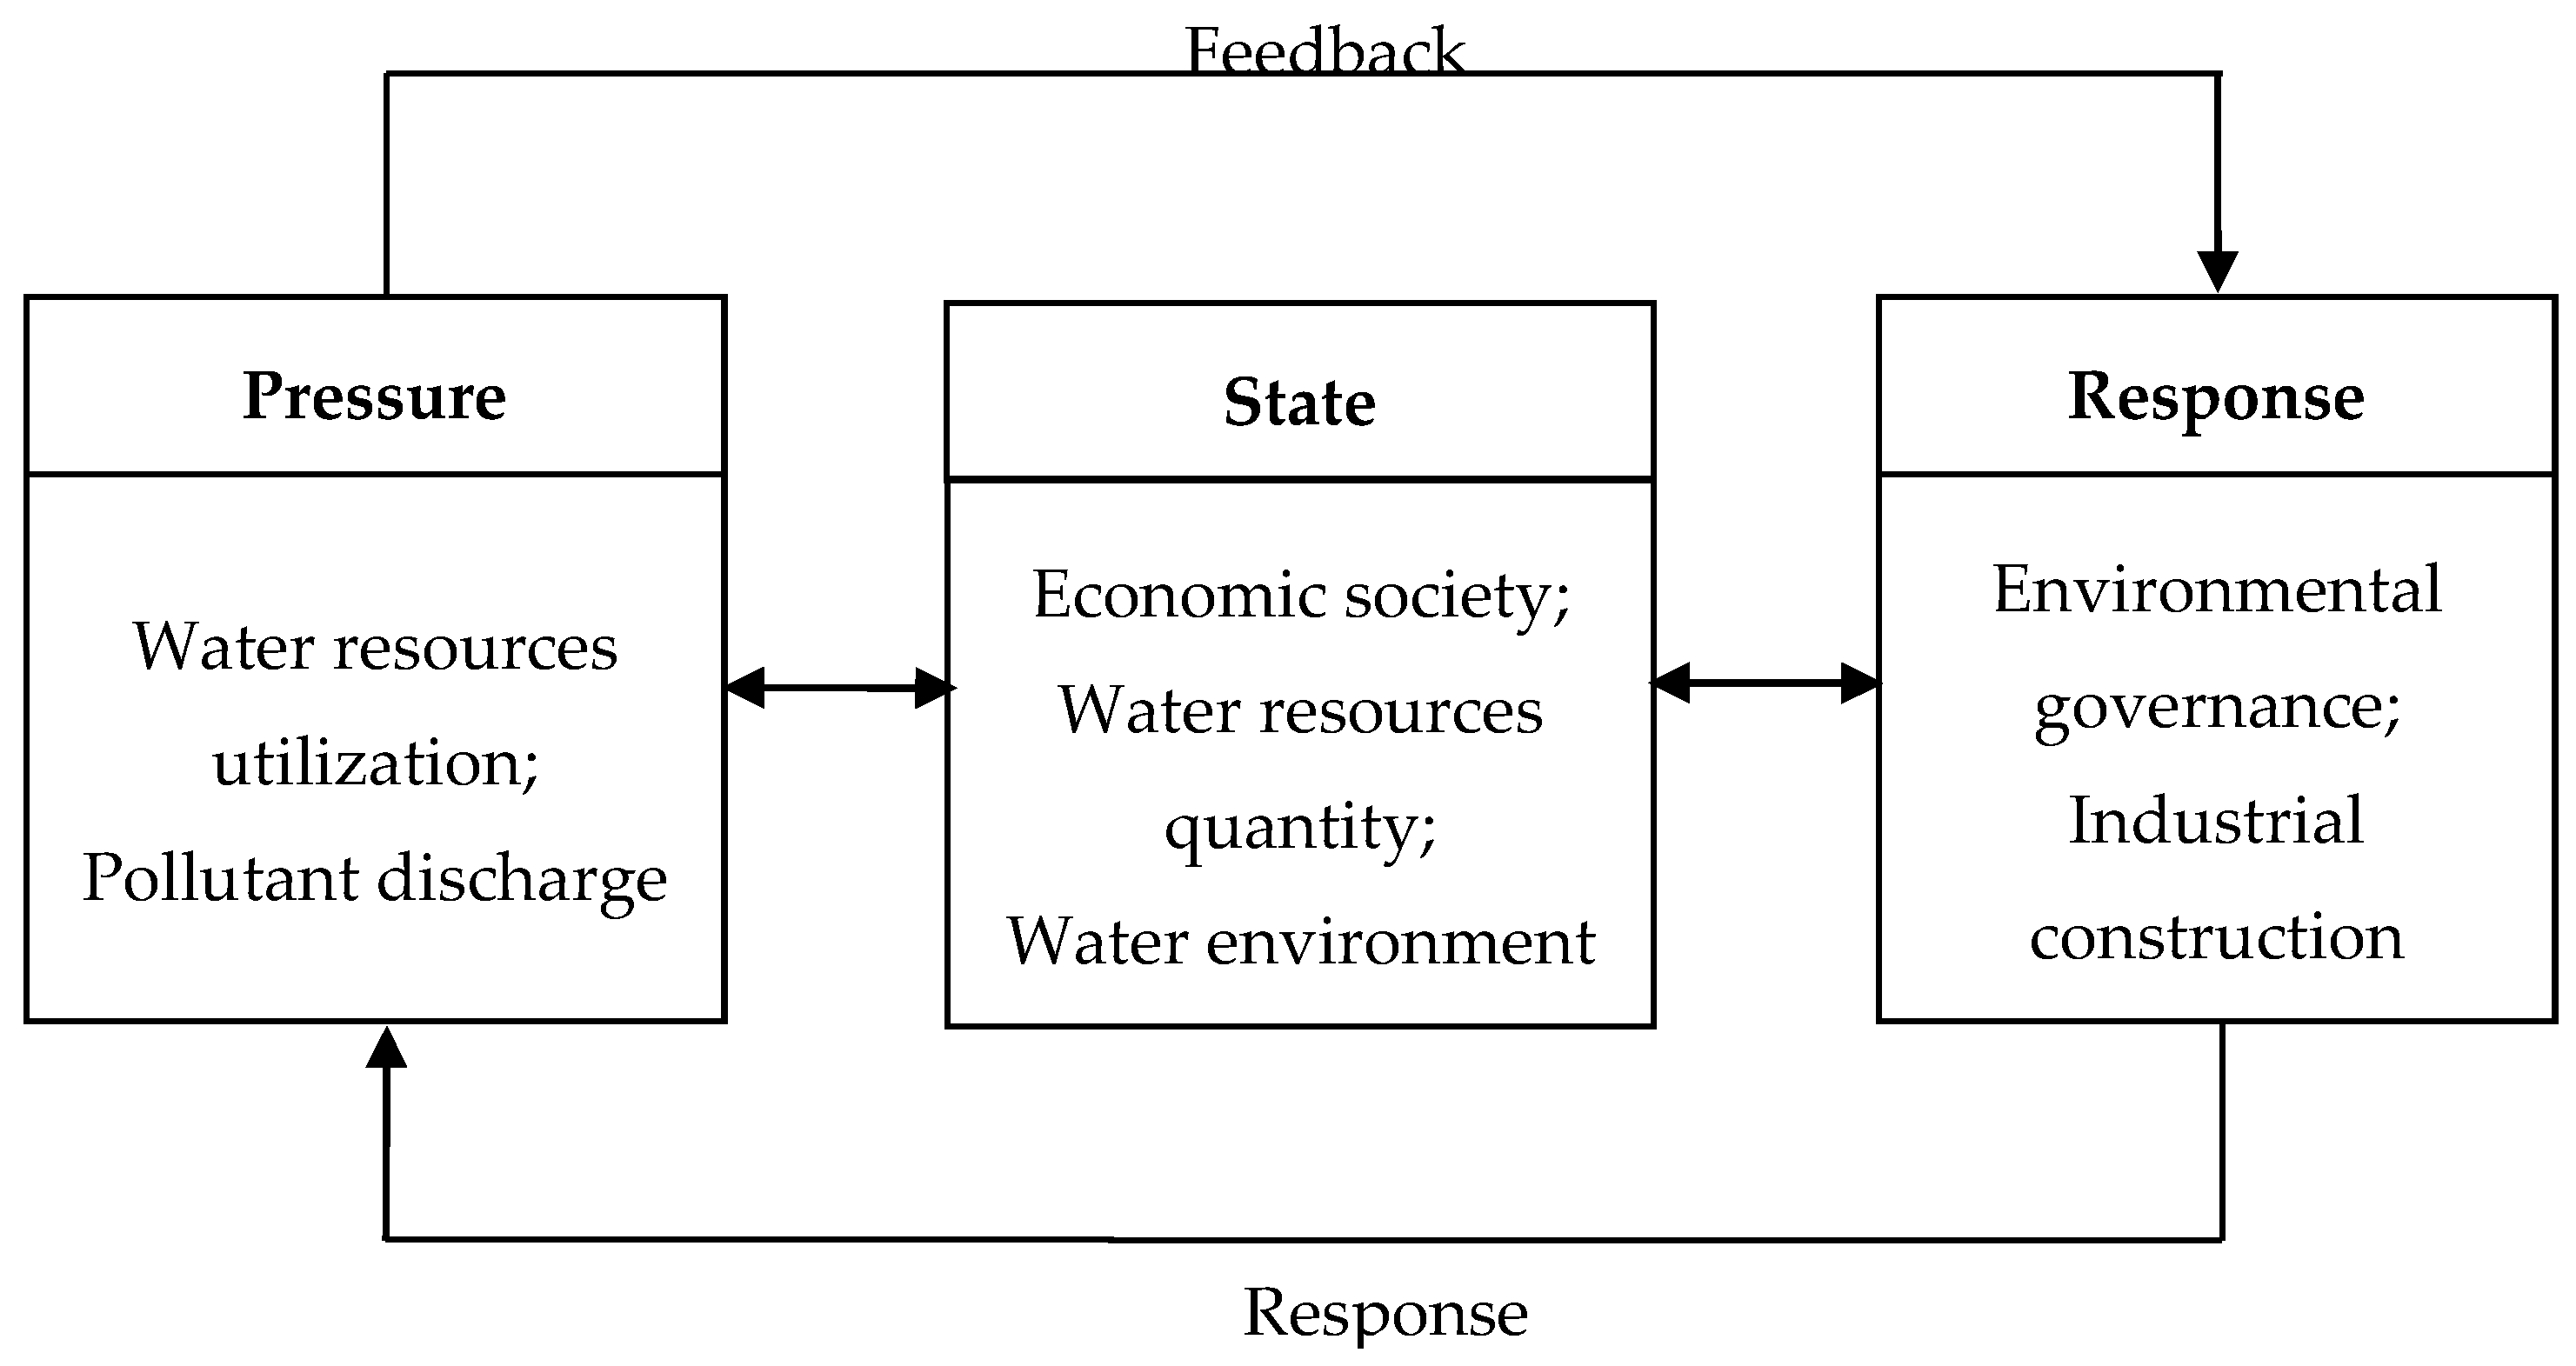
3.1. Water Environmental Safety Evaluation Index System

The PSR (Pressure–State–Response) model was an effective and popular method for dealing with environmental safety issues, such as watershed ecological safety, estuarine nutritional status, water environmental safety, and so on. Therefore, it was adopted in this research to build WESEIS of HDWSA due to its scientificity and feasibility. In the model, ‘pressure’ referred to human activities affecting the water environment, including water resource utilization, pollutant discharge and so on; ‘state’ was the system status of resources, environment, economy, and society; ‘response’ meant effective countermeasures for environmental protection. The frame of the PSR model is shown in Figure 2.
Based on field research and data collection, WESEIS, including four layers (the destination layer, criterion layer, index layer, and subindex layer) [29,30,31], was built based on the PSR model for assessing the water environmental safety status of the study area. The destination layer represented the final evaluation objective (i.e., the safety level of the water environment for HDWSA). Furthermore, the criterion layer was consisted of pressure, state, and response; the index layer included water resources, pollution source, and its discharge, social economy, water quantity, water quality, environmental protection, and industrial structure. The subindex layer was constructed based on the status of the research area and contained 21 subindexes, such as per capita water resources, per capita domestic water consumption, ammonia nitrogen discharge amount, and so on.
The WESEIS of HDWSA is shown in Table 1. The year of 2014 was chosen for evaluation, and the subindexes data are shown in Table 2. Some data used in this research, including per capita domestic water consumption, annual irrigation water consumption per hectare, daily water supply amount of a project, ratio of wastewater and runoff, annual rainfall, and industrial water consumption per 10,000 RMB (ton/10,000 RMB), were collected from the literature titled Water Resources Communique of Chongqing [32]. In addition, values of several indexes, covering per capita water resources, the number of industrial enterprises beyond designed scale, natural population growth rate, population density, per capita GDP, wastewater discharge of per unit GDP, wastewater treatment rate of sewage plants, governance rate of soil and water loss, as well as the proportion of tertiary industry, were obtained from the Chongqing Statistical Yearbook [33]. Moreover, the COD discharge amount, ammonia nitrogen discharge amount, and investment rate of environmental protection were acquired from the literature titled Chongqing Environmental Bulletin [34]. Other subindexes, (the standard-meeting rate of drinking water for drinking water source areas, eutrophication section percentage of influents in the Three Gorges reservoir area, and vegetation cover rate) were gained from the literature titled Environmental Brief Report of Chongqing [35].

3.2. Water Environmental Safety Evaluation of the Heshangshan Drinking Water Source Area

3.2.1. Construction of Factor Set U and Evaluation Set V

Subindexes listed in Table 1 were chosen as evaluation factors to build the factor set U = {u1, u2, …, u21} = {per capita water resources, per capita domestic water consumption, …, proportion of tertiary industry}. According to the national standards and the status quo of the study area, the evaluation set V of water environmental safety in the HDWSA was divided into five levels (I, II, III, IV, and V) (i.e., V = {v1, v2, v3, v4, v5}). For the destination layer, the five levels meant the water environment of the HDWSA was very safe, relatively safe, substantially safe, relatively unsafe, and unsafe, respectively. Specifically, level I stood for the safest situation, which showed that the drinking water source area had a great capacity to contain pollutants and a small risk of losing drinking water supply ability. On the contrary, level V meant the worst situation, which indicated that water resources were over-explored, that the aqueous environment was deteriorative, and that water environmental safety was under great threat. Level III was a medium state, which demonstrated that the situation of the water environment was substantially safe and there were still potential risks to water resource utilization. Furthermore, level II (between level I and level III), as well as level IV (between level III and level V), expressed relatively safe and relatively unsafe grades, respectively. As for the other layers, five levels of evaluation set V represented a criterion, index, or subindex that were excellent, good, substantially good, poor, and very poor for ensuring water environmental safety. As shown in Table 3, V for each subindex had values in five levels according to previous studies, national conditions, regional regulations, and the status quo of the study area [36].

3.2.2. Weight Determination

The original matrix X = (xik)21×5 was standardized based on Formulas (8) and (9), and then the standardization matrix Y = (yik)21×5 was obtained. According to Formulas (4)–(6), weights of the evaluation index system could be calculated as Table 4 shows. Furthermore, the index weight was the sum of those about its subindexes (e.g., the weight of P1 was the sum of weights of D1, D2, and D3), and the same was true of the criterion weight.

3.2.3. Comprehensive Evaluation

Water environmental safety was a fuzzy concept, which can be quantified by the evaluation standard, and therefore membership degree function was a feasible and reasonable method to evaluate it. To develop a comprehensive evaluation, single-factor fuzzy evaluation was carried out, and its membership degree function was determined as follows:
For a benefit subindex,
f 1 ( x ) = { 1 , x x 1 x 2 x x 2 x 1 , x 2 x < x 1 0 , x < x 2 f 2 ( x ) = { x 1 x , x x 1 1 , x 2 x < x 1 x 3 x x 3 x 2 , x 3 x < x 2 0 , x < x 3 f 3 ( x ) = { 0 , x x 1 x 2 + x 3 2 x , x 2 x < x 1 1 , x 3 x < x 2 x 4 x x 4 x 3 , x 4 x < x 3 0 , x < x 4 , f 4 ( x ) = { 0 , x x 2 x 3 + x 4 2 x , x 3 x < x 2 1 , x 4 x < x 3 x x 4 , x < x 4 f 5 ( x ) = { 0 , x x 3 x 4 x , x 4 x < x 3 1 , x < x 4
where x was the original value of the subindex, fj(x) (j = 1, 2, 3, 4, 5) was the membership degree function, x1, x2, x3,and x4 were the boundary values of evaluation set V for the evaluation subindexes.
For a cost subindex,
f 1 ( x ) = { 1 , x x 1 x 2 x x 2 x 1 , x 1 < x x 2 0 , x > x 2 f 2 ( x ) = { x x 1 , x x 1 1 , x 1 < x x 2 x 3 x x 3 x 2 , x 2 < x x 3 0 , x > x 3 f 3 ( x ) = { 0 , x x 1 2 x x 2 + x 3 , x 1 < x x 2 1 , x 2 < x x 3 x 4 x x 4 x 3 , x 3 < x x 4 0 , x > x 4 , f 4 ( x ) = { 0 , x x 2 2 x x 3 + x 4 , x 2 < x x 3 1 , x 3 < x x 4 x 4 x , x > x 4 f 5 ( x ) = { 0 , x x 3 x x 4 , x 3 < x x 4 1 , x > x 4
where meanings of the symbols were the same as those in Formula (10). Utilizing the value of each evaluation subindex and V for each subindex in Table 2, the membership degree qij was calculated on the basis of Equations (10) and (11). Moreover, each subindex had five membership degrees corresponding to five levels of evaluation set V, being excellent, good, substantially good, poor, and very poor for the water environmental safety of the HDWSA. Then, the single factor evaluation matrix Q was built, which was formed by the membership degrees of all subindexes to evaluation set V. In other words, Q reflected the evaluation results of the subindexes (Table 5). Based on Formula (3) and index weights showed in Table 4, comprehensive evaluation matrix B was obtained. Evaluation matrixes for index B1, B2, …, and B7 were calculated by Q and the weights of the subindex layer. Similarly, those for criteria Bp, Bs, and Br were determined. Comprehensive evaluation results of the index and criterion layers were shown in Table 6. The final comprehensive evaluation matrix B (the evaluation matrix of the destination layer) for the HDWSA was achieved based on the weights and evaluation results of the criterion layer. The calculation process was as follows:
B = [ 0.278 0.420 0.302 ] [ 0.093 0.453 0.382 0.072 0.000 0.250 0.257 0.212 0.129 0.152 0.048 0.228 0.361 0.272 0.091 ] ,
Through normalization, the final evaluation result can be gained;
B = [ 0.145 0.303 0.304 0.156 0.092 ] ,
Considering the principle of maximum membership degree, the water environmental safety level of the HDWSA was obtained as shown in Table 7.
As shown in Table 7, the membership degree of the destination layer to v3 0.304 was the maximum value, which indicated that the water environmental safety level of the HDWSA belonged to level III. In other words, the water environment of the HDWSA was substantially safe in 2014. As for that of v2, it equaled 0.303 and meant that some of the indexes were considered relatively safe. As far as those of v1, v4, and v5 were concerned, the value of v1 meant several indexes were good for water environmental safety, whereas values of v4, and v5 indicated that individual ones were undesired.
The evaluation result of the water environmental safety for the HDWSA can be analyzed from pressure, state, and response, each of which had different effects on the result. State had the most significant effect, followed by response and pressure, which is reflected by their respective weight values of 0.4198, 0.3025, and 0.2777. With respect to pressure in various layers of WESEIS, their comprehensive evaluation results were discussed as follows: As far as membership degrees of the P criterion to evaluation set V were concerned, those to v2, v4, and v5 were 0.453 (the maximum value), 0.072, and 0 respectively (Table 6), which indicated that the P criterion was good for the water environment of the HDWSA. According to the membership degrees of P1 and P2 to evaluation set V, P1 as well as P2 of the HDWSA were all in level II, and P2 was more beneficial for the water environmental safety. For membership degrees of the subindexes for pressure (D1–D6) to evaluation set V, they were in level II, except that of per capita water resources (D1). D1 was substantially good for the objective, and the reason was that the location area of the HDWSA has abundant water resources but a large population, meanwhile water resources per capita was not very high. In addition, comprehensive evaluation results concerning the state of various layers of the evaluation index system were discussed as follows: S was in level II and its membership degrees to v4 and v5 were small (0.129 and 0.152, respectively), which indicated that S was good for water environmental safety and there were still some aspects needed to be improved. By analyzing the membership degrees of individual subindexes for state (D7–D16) to evaluation set V, it could be found that the membership degrees of some subindexes in v4 and v5 were relatively large. Therefore, for promoting the water environmental safety of the HDWSA, more attention should be paid to those subindexes, including the natural population growth rate D7, water consumption per 10,000 yuan of value added by industry D12, and the eutrophication section percentage of influents in the Three Gorges reservoir area D16. Furthermore, the effects of R, R1, R2, as well as D17–D21 on the evaluation result were also revealed as below. As far as the response criterion was concerned, R was in level III for its membership degree to v3, in which 0.361 was the maximum. However, the membership degrees of R to v4 and v5 were 0.272 and 0.091, which meant efforts were also expected in some fields. In detail, the vegetation cover rate (D18) to v5 was 0.390, and the investment rate of environmental protection (D20), as well as proportion of tertiary industry (D21) to v4, reached 0.464 and 0.258 respectively. Hence, more work should focus on those subindexes, especially the vegetation cover rate (D18). According to the actual situation of HDWSA, a water pollution accident has not occurred in recent years. Therefore, the evaluation result, that the water environment of HDWSA was substantially safe, is reasonable and reliable.

4. Conclusions

This study developed a new model—i.e., the fuzzy comprehensive assessment method based on the entropy weight method—and built a water environmental safety evaluation index system for drinking water source areas based on the PSR model. In addition, taking the Heshangshan drinking water source area in the Three Gorges Reservoir area as the study area, the water environmental safety evaluation was advanced on the basis of the proposed model and the evaluation index system. The water environmental safety evaluation index system was a synthetic and effective one, which covered three aspects (pressure, state, and response), and consisted of 21 subindexes related to water resources; pollution source and its discharge; social economy; water quantity; water quality; environmental protection; and industrial structure. The results showed that the water environment of the drinking water source area was substantially safe, water resource exploitation was comparatively rational, and water quality—as well as quantity—could satisfy regional demands. As far as pressure was concerned, the subindex of per capita water resources was not ideal for the location of the Heshangshan drinking water source, which had abundant water resources but also a large population. As for state, there were some potential risks to the water environment in the drinking water source area and more attention should be paid to the natural population growth rate, water consumption per 10,000 yuan of value added by industry, and the eutrophication section percentage of influents in the Three Gorges reservoir area. As for response, some measures (governance of soil and water loss and wastewater treatment) had been effective, whereas several aspects should be improved, such as the vegetation cover rate, investment rate of environmental protection, and proportion of tertiary industry. Hence, measures of promoting water-saving, implementing reasonable irrigation, increasing the utilization ratio of water resources, optimizing industrial structure, and increasing investment in environmental protection should be considered effective ways to ensure the water environmental safety of the Heshangshan drinking water source area. In conclusion, the fuzzy comprehensive assessment method based on entropy weight was an effective and feasible method for determining the water environmental safety level, and the index system was a scientific and reasonable approach to the water environmental safety evaluation.
This study is the first attempt to develop a new evaluation method based on the fuzzy comprehensive assessment method and the entropy weight method, and it build a new evaluation index system for water environmental safety based on the PSR model, which can provide references and decision support for related researchers and managers. Furthermore, the new evaluation method and index system were also applied in the water environmental safety evaluation for the Heshangshan drinking water source area. In the future, a foundation database will be built and an environmental risk evaluation for drinking water source areas will be developed.

Acknowledgments

This research work was funded by the National Key Scientific and Technological Projects of the PRC (2014ZX07104-005), and the Fundamental Research Funds for the Central Universities of PRC (JB2014129). The authors gratefully acknowledge the financial support of the programs and agencies.

Author Contributions

Xiaowen Ding and Xiao Chong established the model; Zhengfeng Bao provided the data; Xiao Chong and Ying Xue analyzed the data; Shanghong Zhang drew the figures; Xiaowen Ding and Xiao Chong wrote the paper.

Conflicts of Interest

The authors declare no conflict of interest.

References

  1. Galaitsi, S.E.; Russell, R.; Bishara, A.; Durant, J.L.; Bogle, J.; Huber-Lee, A. Intermittent domestic water supply: A critical review and analysis of causal-consequential pathways. Water 2016, 8, 274–298. [Google Scholar] [CrossRef]
  2. Afonso, M.J.; Freitas, L.; Pereira, A.; Neves, L.; Guimarães, L.; Guilhermino, L.; Mayer, B.; Rocha, F.; Marques, J.M.; Chaminé, H.I. Environmental groundwater vulnerability assessment in urban water mines (Porto, NW Portugal). Water 2016, 8, 499–521. [Google Scholar] [CrossRef]
  3. Rouillard, J.; Vidaurre, R.; Brouwer, S.; Damman, S.; Ponce, A.A.; Gerner, N.V.; Riegels, N.; Termes, M. Governance regime factors conducive to innovation uptake in urban water management: Experiences from Europe. Water 2016, 8, 477–491. [Google Scholar] [CrossRef]
  4. Leong, C. The role of emotions in drinking recycled water. Water 2016, 8, 548–565. [Google Scholar] [CrossRef]
  5. Skeriotis, A.T.; Sanchez, N.P.; Kennedy, M.; Johnstone, D.W.; Miller, C.M. Long-Term comparison of disinfection by-product formation potential in a full scale treatment plant utilizing a multi-coagulant drinking water treatment scheme. Water 2016, 8, 318–335. [Google Scholar] [CrossRef]
  6. Wang, M.; Lu, B.; Wang, J.; Zhang, H.; Guo, L.; Lin, H. Using dual isotopes and a bayesian isotope mixing model to evaluate nitrate sources of surface water in a drinking water source watershed, East China. Water 2016, 8, 355–370. [Google Scholar] [CrossRef]
  7. Mavragani, A.; Sypsa, K.; Sampri, A.; Tsagarakis, K.P. Quantifying the UK online interest in substances of the EU watchlist for water monitoring: Diclofenac, estradiol, and the macrolide antibiotics. Water 2016, 8, 542–562. [Google Scholar] [CrossRef]
  8. Fassnacht, F.E.; Latifi, H.; Stereńczak, K.; Modzelewska, A.; Lefsky, M.; Waser, L.T.; Straub, C.; Ghosh, A. Review of studies on tree species classification from remotely sensed data. Remote Sens. Environ. 2016, 186, 64–87. [Google Scholar] [CrossRef]
  9. Kim, S.E.; Seo, I.W. Artificial neural network ensemble modeling with conjunctive data clustering for water quality prediction in rivers. J. Hydro-Environ. Res. 2015, 9, 325–339. [Google Scholar] [CrossRef]
  10. Csábrági, A.; Molnár, S.; Tanos, P.; Kovács, J. Application of artificial neural networks to the forecasting of dissolved oxygen content in the Hungarian section of the river Danube. Ecol. Eng. 2017, 100, 63–72. [Google Scholar] [CrossRef]
  11. Yeh, Y.L.; Chen, T.C. Application of grey correlation analysis for evaluating the artificial lake site in Pingtung Plain, Taiwan. Can. J. Civ. Eng. 2011, 31, 56–64. [Google Scholar] [CrossRef]
  12. Chen, Y.; Xu, S.; Jin, Y. Evaluation on ecological restoration capability of revetment in inland restricted channel. KSCE J. Civ. Eng. 2016, 20, 2548–2558. [Google Scholar] [CrossRef]
  13. Xia, X.; Sun, Y.; Wu, K.; Jiang, Q. Optimization of a straw ring-die briquetting process combined analytic hierarchy process and grey correlation analysis method. Fuel Process. Technol. 2016, 152, 303–309. [Google Scholar] [CrossRef]
  14. Zhou, Z.; Zhang, X.; Dong, W. Fuzzy comprehensive evaluation for safety guarantee system of reclaimed water quality. Procedia Environ. Sci. 2013, 18, 227–235. [Google Scholar] [CrossRef]
  15. Jiao, J.; Ren, H.; Sun, S. Assessment of surface ship environment adaptability in seaways: A fuzzy comprehensive evaluation method. Int. J. Nav. Archit. Ocean Eng. 2016, 8, 344–359. [Google Scholar] [CrossRef]
  16. Wang, Y.; Yang, W.; Li, M.; Liu, X. Risk assessment of floor water inrush in coal mines based on secondary fuzzy comprehensive evaluation. Int. J. Rock Mech. Min. Sci. 2012, 52, 50–55. [Google Scholar] [CrossRef]
  17. He, Y.X.; Dai, A.Y.; Zhu, J.; He, H.Y.; Li, F.R. Risk assessment of urban network planning in china based on the matter-element model and extension analysis. Int. J. Electr. Power Energy Syst. 2011, 33, 775–782. [Google Scholar] [CrossRef]
  18. Li, H.; Lv, M.; Ye, S. The research and practice of water quality safety evaluation for Jinan urban water supply system. Procedia Environ. Sci. 2011, 11, 1197–1203. [Google Scholar]
  19. Zhao, C.R.; Zhao, W.M. Application of fuzzy comprehensive evaluation to urban eco-security assessment. Environ. Sci. Technol. 2010, 33, 179–183. [Google Scholar]
  20. Shabbir, R.; Ahmad, S.S. Water resource vulnerability assessment in Rawalpindi and Islamabad, Pakistan using analytic hierarchy process (AHP). J. King Saud Univ. Sci. 2015, 28, 293–299. [Google Scholar] [CrossRef]
  21. Sutadian, A.D.; Muttil, N.; Yilmaz, A.G.; Perera, B.J.C. Using the analytic hierarchy process to identify parameter weights for developing a water quality index. Ecol. Indic. 2017, 75, 220–233. [Google Scholar] [CrossRef]
  22. Hamilton, D.; Parparov, A. Comparative assessment of water quality with the trophic level index and the Delphi method in Lakes Rotoiti and Rotorua, New Zealand. Water Qual. Res. J. Can. 2010, 45, 479–489. [Google Scholar]
  23. Peiris, R.H.; Hallé, C.; Budman, H.; Moresoli, C.; Peladszus, S.; Huck, P.M.; Legge, R.L. Identifying fouling events in a membrane-based drinking water treatment process using principal component analysis of fluorescence excitation-emission matrices. Water Res. 2010, 44, 185–194. [Google Scholar] [CrossRef] [PubMed]
  24. Ma, L.; Liu, Y.; Zhou, X.P. Fuzzy comprehensive evaluation method of F statistics weighting in identifying mine water inrush source. Int. J. Eng. Sci. Technol. 2010, 2, 123–128. [Google Scholar] [CrossRef]
  25. He, Q.; Peng, S.; Zhai, J.; Xiao, H. Development and application of a water pollution emergency response system for the Three Gorges Reservoir in the Yangtze River, China. J. Environ. Sci. 2011, 23, 595–600. [Google Scholar] [CrossRef]
  26. Environmental Quality Standards for Surface Water; Ministry of Environmental Protection of the People’s Republic of China: Beijing, China, 2002.
  27. Jiang, F.; Zheng, Q.; Shi, W. The applied research of fuzzy comprehensive evaluation on talent training mode of safety engineering. Procedia Eng. 2012, 43, 425–430. [Google Scholar] [CrossRef]
  28. Chen, X.X.; Qiu, J.; Liu, G.J. Research on the method of test-equipment selection based on analytic hierarchy process and fuzzy comprehensive assessment. Acta Armamentarii 2010, 31, 4045–4048. [Google Scholar]
  29. Fan, Z.; Song, C.X.; Li, M.J.; He, Y.L.; Tao, W.Q. Study on energy efficiency evaluation index system for fossil-fuel power plant. Energy Procedia 2014, 61, 1093–1098. [Google Scholar]
  30. Zhang, W.; Lu, J.; Zhang, Y. Comprehensive evaluation index system of low carbon road transport based on fuzzy evaluation method. Procedia Eng. 2016, 137, 659–668. [Google Scholar] [CrossRef]
  31. Zhu, Y.; Hipel, K.W.; Ke, G.Y.; Chen, Y. Establishment and optimization of an evaluation index system for brownfield redevelopment projects. Environ. Model. Softw. 2015, 74, 173–182. [Google Scholar] [CrossRef]
  32. Water Resources Communique of Chongqing. Available online: http://www.cqwater.gov.cn/slsj/szygb/Pages/Default.aspx (accessed on 13 January 2016).
  33. Chongqing Statistical Bureau. Chongqing Statistical Yearbook 2011–2015; China Statistical Press: Beijing, China, 2011–2015. [Google Scholar]
  34. Chongqing Environmental Bulletin. Available online: http://www.cepb.gov.cn/xxgk/hjzl/hjzkgb/index.shtml (accessed on 3 June 2016).
  35. Environmental Brief Report of Chongqing. Available online: http://www.cqemc.cn/download/zxjj/list.jsp?type=xxgk&type_id=169595633711000010 (accessed on 28 July 2016).
  36. Peng, J.Q.; Li, L.; Cao, W.; Gao, Y. Evaluation for Water Environment Security of Urban Lakes. Environ. Prot. Sci. 2010, 36, 62–64. (In Chinese) [Google Scholar]
Figure 1. The location of the Heshangshan drinking water source areas.
Water 09 00329 g001
Figure 2. Frame of the Pressure–State–Response (PSR) model for water environmental safety in drinking water source areas.
Water 09 00329 g002
Table 1. Water environmental safety evaluation index system of the Heshangshan drinking water source area.
Destination LayerCriterion LayerIndex LayerSubindex Layer
Water environmental safety of the Heshangshan drinking water sources areaPressure (P)Water resources P1Per capita water resources D1;
Per capita domestic water consumption D2;
Annual irrigation water consumption per hectare D3
Pollution source and its discharge P2COD discharge amount D4;
Ammonia nitrogen discharge amount D5;
The number of industrial enterprises beyond designed scale D6
State (S)Social economy S1Natural population growth rate D7;
Population density D8;
Per capita GDP D9
Water quantity S2Daily water supply amount of a project D10;
Annual rainfall D11;
Water consumption per 10,000 yuan of value-added by industry D12
Water quality S3Standard-meeting rate of drinking water for drinking water source area D13;
Wastewater discharge of per unit GDP D14;
Ratio of wastewater and runoff D15;
Eutrophication section percentage of influents in Three Gorges reservoir area D16
Response (R)Environmental protection R1Wastewater treatment rate of sewage plant D17;
Vegetation cover rate D18;
Governance rate of soil and water loss D19
Industrial structure R2Investment rate of environmental protection D20;
Proportion of tertiary industry D21
Table 2. Data for water environmental safety evaluation of the Heshangshan drinking water source area.
SubindexUnit20102011201220132014Type
D1M3/person1405.501545.371425.071412.391903.82
D2M3/person47.5149.4550.7252.6348.18
D3M3251.00291.00287.00270.00307.00
D4mg/L183.04435.53304.23274.95265.02
D5mg/L19.5157.4740.3336.6335.19
D6_896.00527.00575.00650.00734.00
D7%7.256.543.884.645.10
D8person/km2400.89404.09406.11407.57409.60
D9104 yuan2.76 3.45 3.89 4.32 4.79
D10104 m3652.66815.42833.24813.34833.34
D11108 m3872.07899.67890.45876.431046.52
D12M3128.0092.0076.0077.0071.00
D13%100.00100.00100.00100.00100.00
D14M3/104 yuan16.169.5611.6011.1510.22
D15%2.761.862.783.002.27
D16%42.2038.9025.0036.1044.40
D17%88.8692.2189.7793.2092.25
D18%6.058.455.344.875.21
D19%37.0039.0042.1042.1043.10
D20%2.932.722.102.022.06
D21%36.4036.2039.4046.7046.80
Table 3. V for subindexes in the Heshangshan drinking water source area.
SubindexesUnitsExcellentGoodSubstantially GoodPoorVery Poor
D1M3/person[3000,∞)[2000,3000)[1000,2000)[500,1000)(0,500)
D2m3/person[0,30](30,45](45,55](55,80](80,∞)
D3m3[0,200](200,300](300,360](380,500](500,∞)
D4mg/L[0,100](100,300](300,700](700,1000](1000,∞)
D5mg/L[0,15](15,30](30,60](60,100](100,∞)
D6_[0,400](400,800](800,1400](1400,2000](2000,∞)
D7%[0,0.7](0.7,1.2](1.2,3.5](3.5,5](5,∞)
D8person/km2[0,300](300,400](400,500](500,2000](2000,∞)
D9104 yuan[5,15)[3,5)[1.5,3)[1,1.5)(0.5,1)
D10104 m3[1200,∞)[900,1200)[600,900)[300,600)(0,300)
D11108 m3[1100,∞)[800,1100)[650,800)[400,650)(0,400)
D12m3[0,20](20,40](40,65](65,130](130,∞)
D13%[98,100)[96,98)[90,96)[70,90)(0,70)
D14m3/104 yuan[0,20](20,50](50.100](100,150](150,∞)
D15%[0,3](3,5.5](5.5,7.7](7.7,10](10,100)
D16%[0,5](5,10](10,15](15,45](45,∞)
D17%[98,100)[90,98)[80,90)[70,80)(0,70)
D18%[90,100)[50,90)[10,50)[4,10)(4,0)
D19%(50,100)[35,50)[20,35)[10,20)[0,10)
D20%[2.2,100)[1.7,2.2)[1.2,1.7)[0.7,1.2)(0,0.7)
D21%[70,100)[50,70)[30,50)[20,30)(0,20)
Table 4. Weights of the water environmental safety evaluation index system in the Heshangshan drinking water source area.
Destination Layer Criterion LayerIndex LayerSubindex LayerWeight
A 1.000P 0.278P1 0.182D10.111
D20.029
D30.041
P2 0.096D40.031
D50.033
D60.032
S 0.420S1 0.119D70.041
D80.043
D90.036
S2 0.162D100.027
D110.106
D120.029
S3 0.139D130.000
D140.028
D150.053
D160.058
R 0.302R1 0.150D170.040
D180.075
D190.035
R2 0.152D200.082
D210.070
Table 5. Membership degrees of the subindexes to evaluation set V.
SubindexesEvaluation Set
v1v2v3v4v5
Levels of Water Environmental Safety
IIIIIIIVV
D10.0000.3720.4120.2160.000
D20.0470.5180.4340.0000.000
D30.1360.4750.3890.0000.000
D40.2210.4900.2890.0000.000
D50.2750.4640.2610.0000.000
D60.0900.5460.3640.0000.000
D70.0000.0000.0000.0630.937
D80.0000.0320.5320.4360.000
D90.3780.4230.1990.0000.000
D100.1900.4290.3810.0000.000
D110.3270.3980.2760.0000.000
D120.0000.0000.3700.4070.222
D130.5050.4950.0000.0000.000
D140.6620.3380.0000.0000.000
D150.5690.4310.0000.0000.000
D160.0000.0000.0150.4960.489
D170.1260.4480.4260.0000.000
D180.0000.0000.1030.5080.390
D190.2480.4590.2930.0000.000
D200.0000.0570.4780.4640.000
D210.0000.3390.4030.2580.000
Table 6. Comprehensive evaluation results of the index layer and the criterion layer.
LayerEvaluation set
v1v2v3v4v5
Levels of Water Environmental Safety
IIIIIIIVV
Index layerP10.0360.4290.4250.1100.000
P20.2010.4980.3020.0000.000
S10.1700.2040.3180.0890.218
S20.2480.3330.3090.0720.039
S30.3210.2150.0070.2300.227
R10.0970.2400.2410.2390.183
R20.0000.2160.4780.3050.000
Criterion layerP0.0930.4530.3820.0720.000
S0.2500.2570.2120.1290.152
R0.0480.2280.3610.2720.091
Table 7. Evaluation result of the water environmental safety level of the Heshangshan drinking water source area.
IndicatorLevel
Water environmental safety levelIIIIIIIVV
Evaluation set Vv1v2v3v4v5
Membership degree of destination layer0.1450.3030.3040.1560.092
Evaluation result of water environmental safety level

