
Dynamics of Suspended Sediments during a Dry Season and Their Consequences on Metal Transportation in a Coral Reef Lagoon Impacted by Mining Activities, New Caledonia

 ,
,
Abstract
:1. Introduction
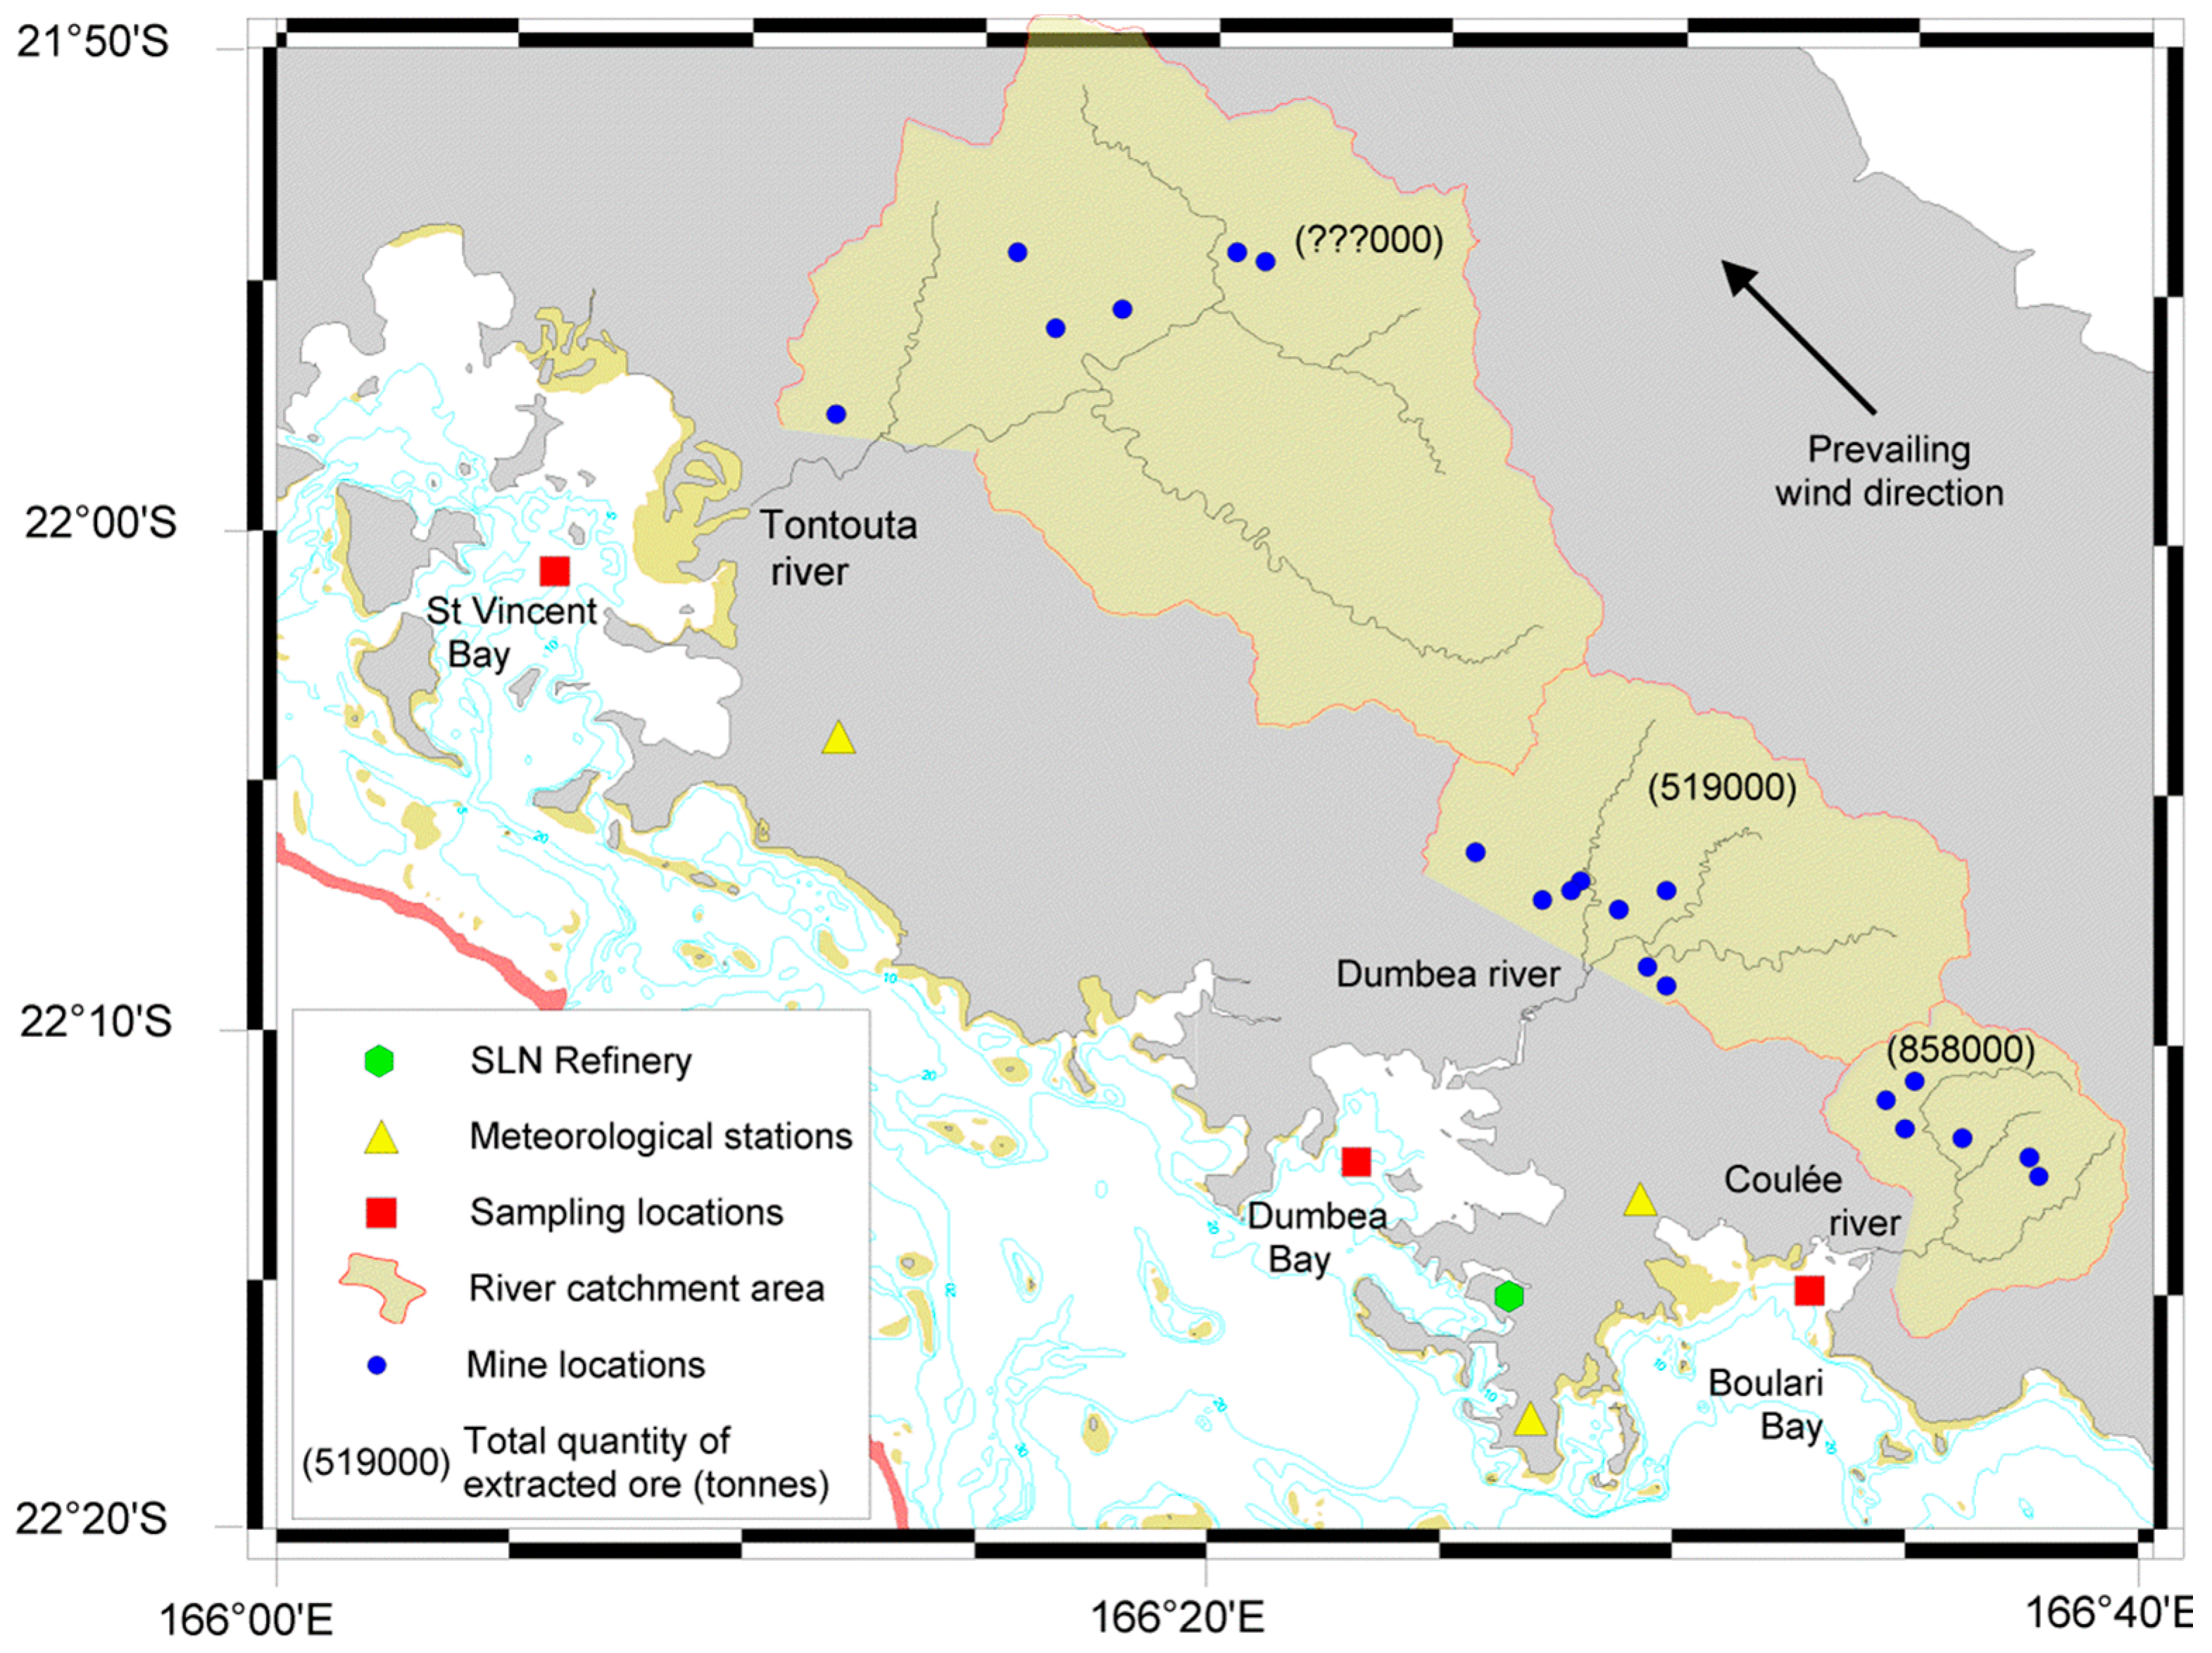
2. Study Area
2.1. Boulari Bay
2.2. Dumbéa Bay
2.3. St Vincent Bay
3. Materials and Methods
3.1. SPM Sampling
3.2. Current Measurement
3.3. In Situ Laser Grain Size and CTD Profiling
3.4. Geochemistry
3.5. Kd Calculation
3.6. Mineralogy
4. Results
4.1. Rainfall
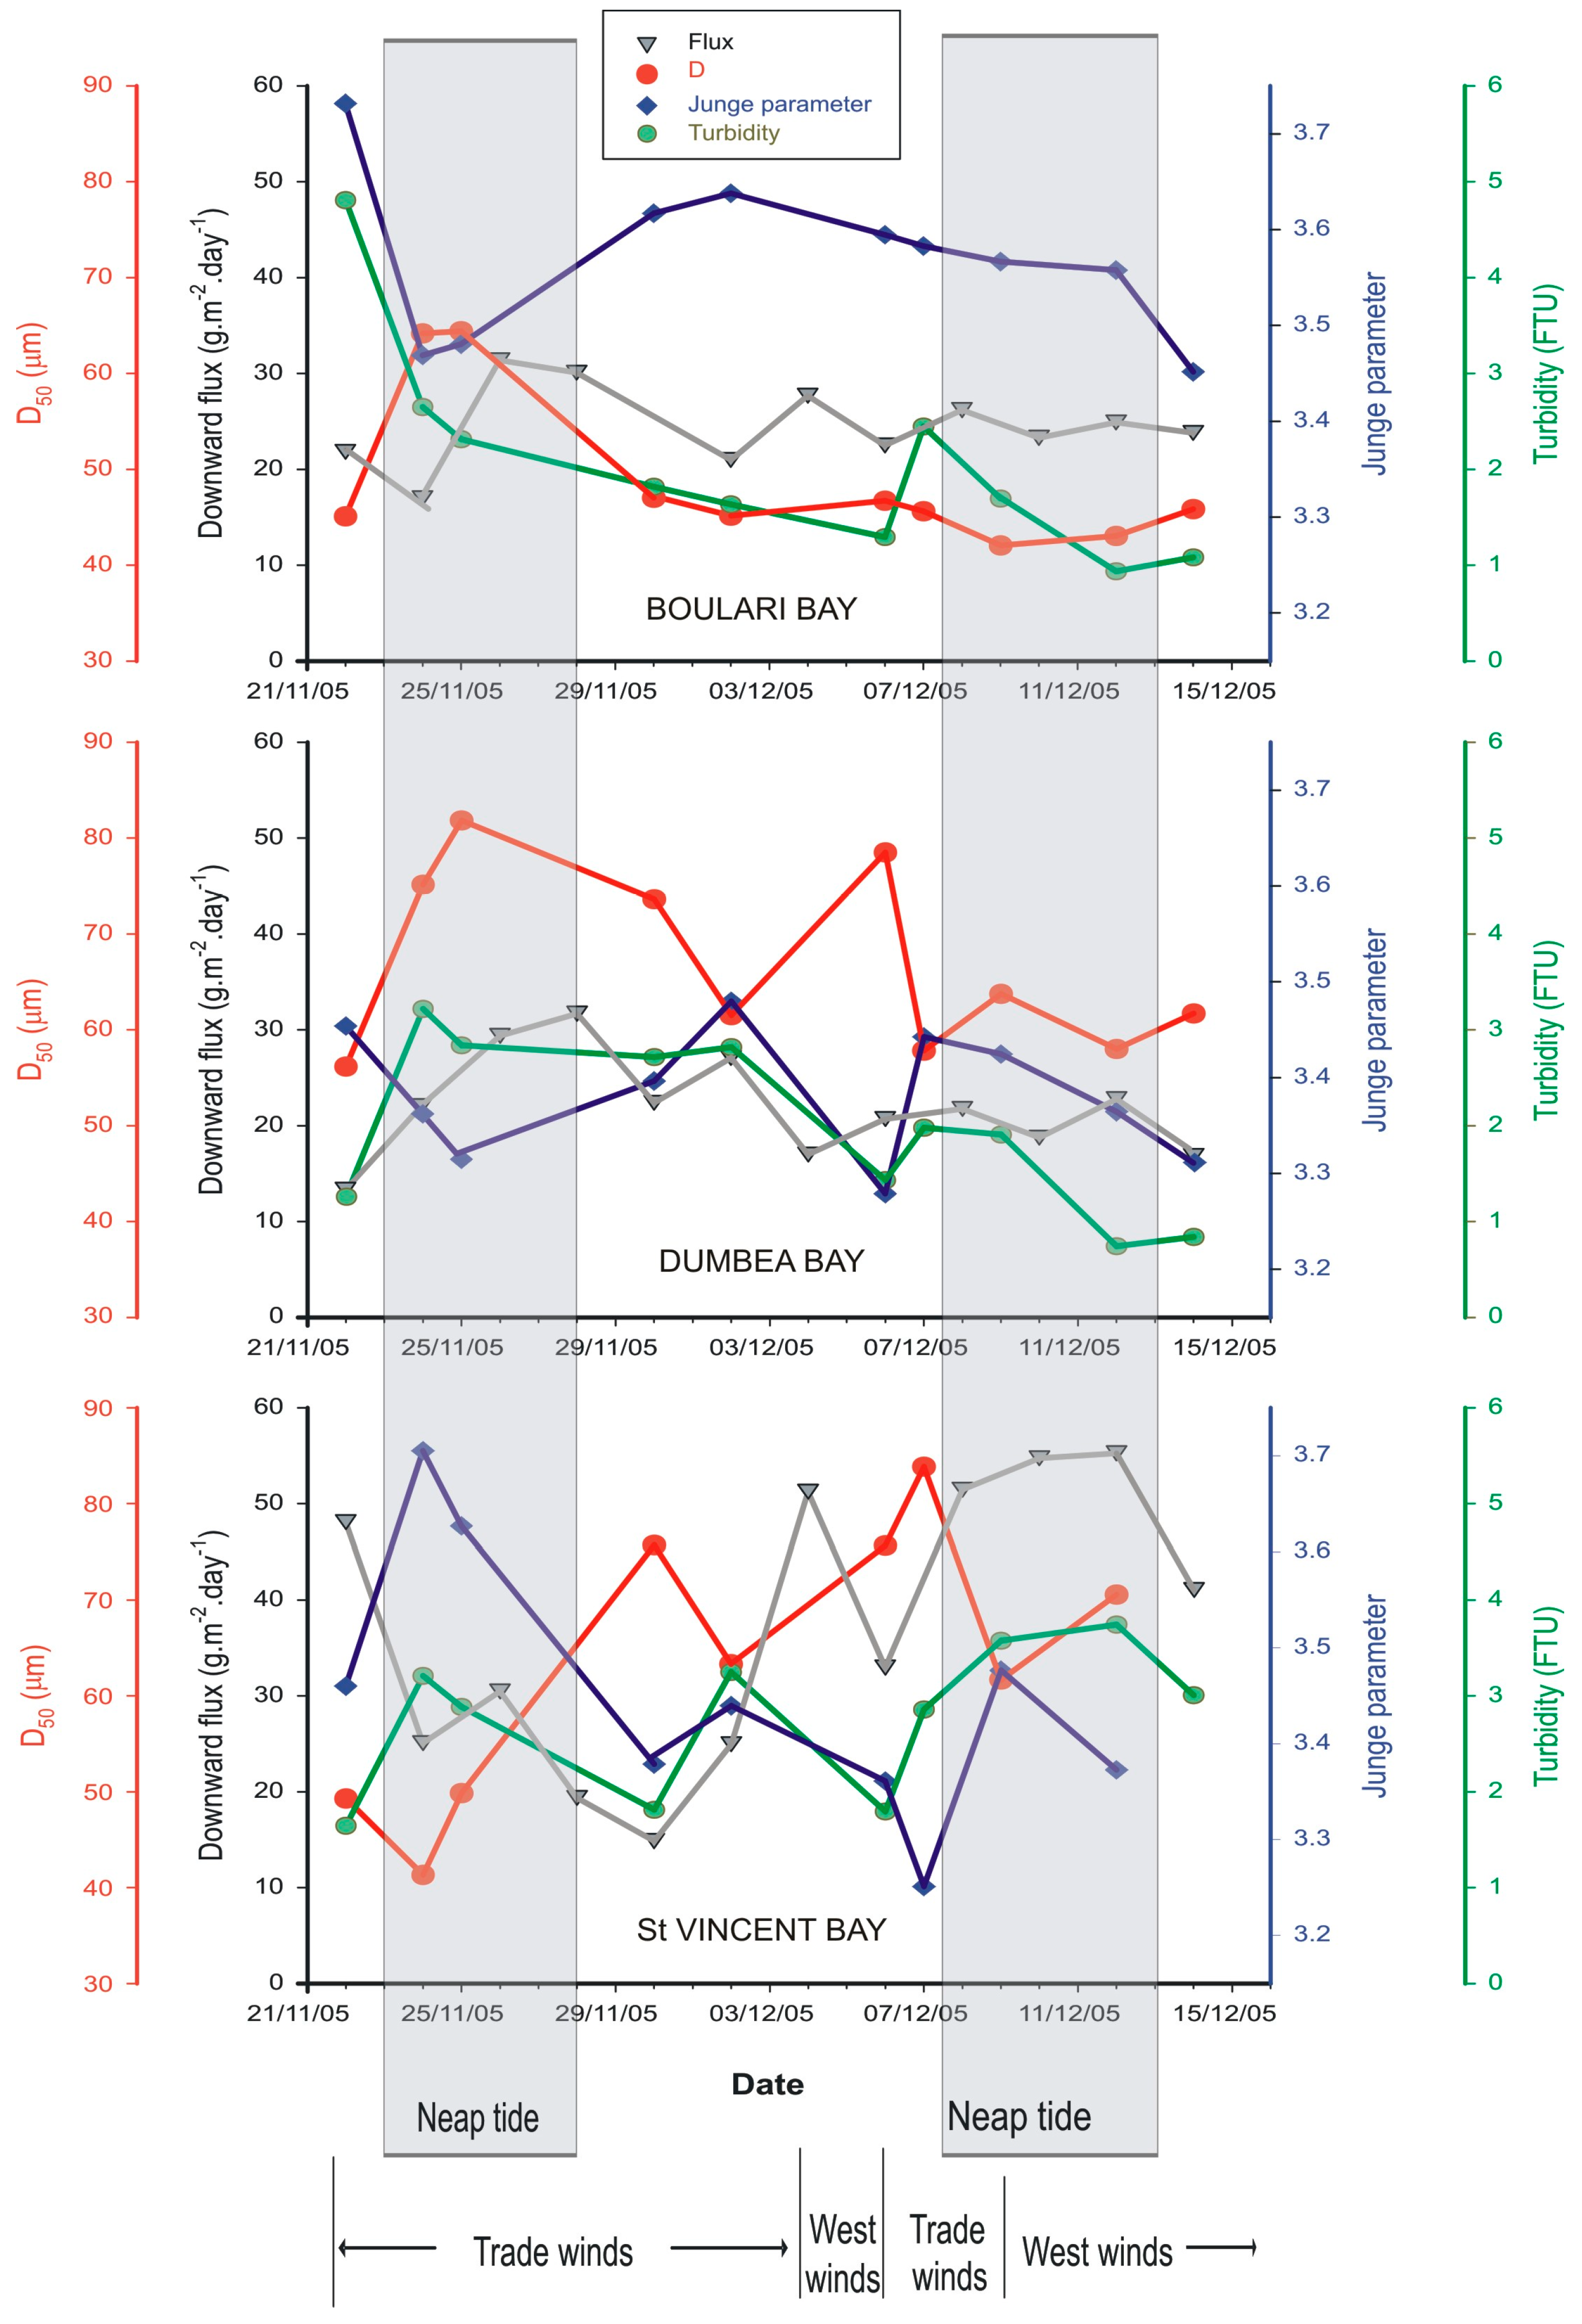
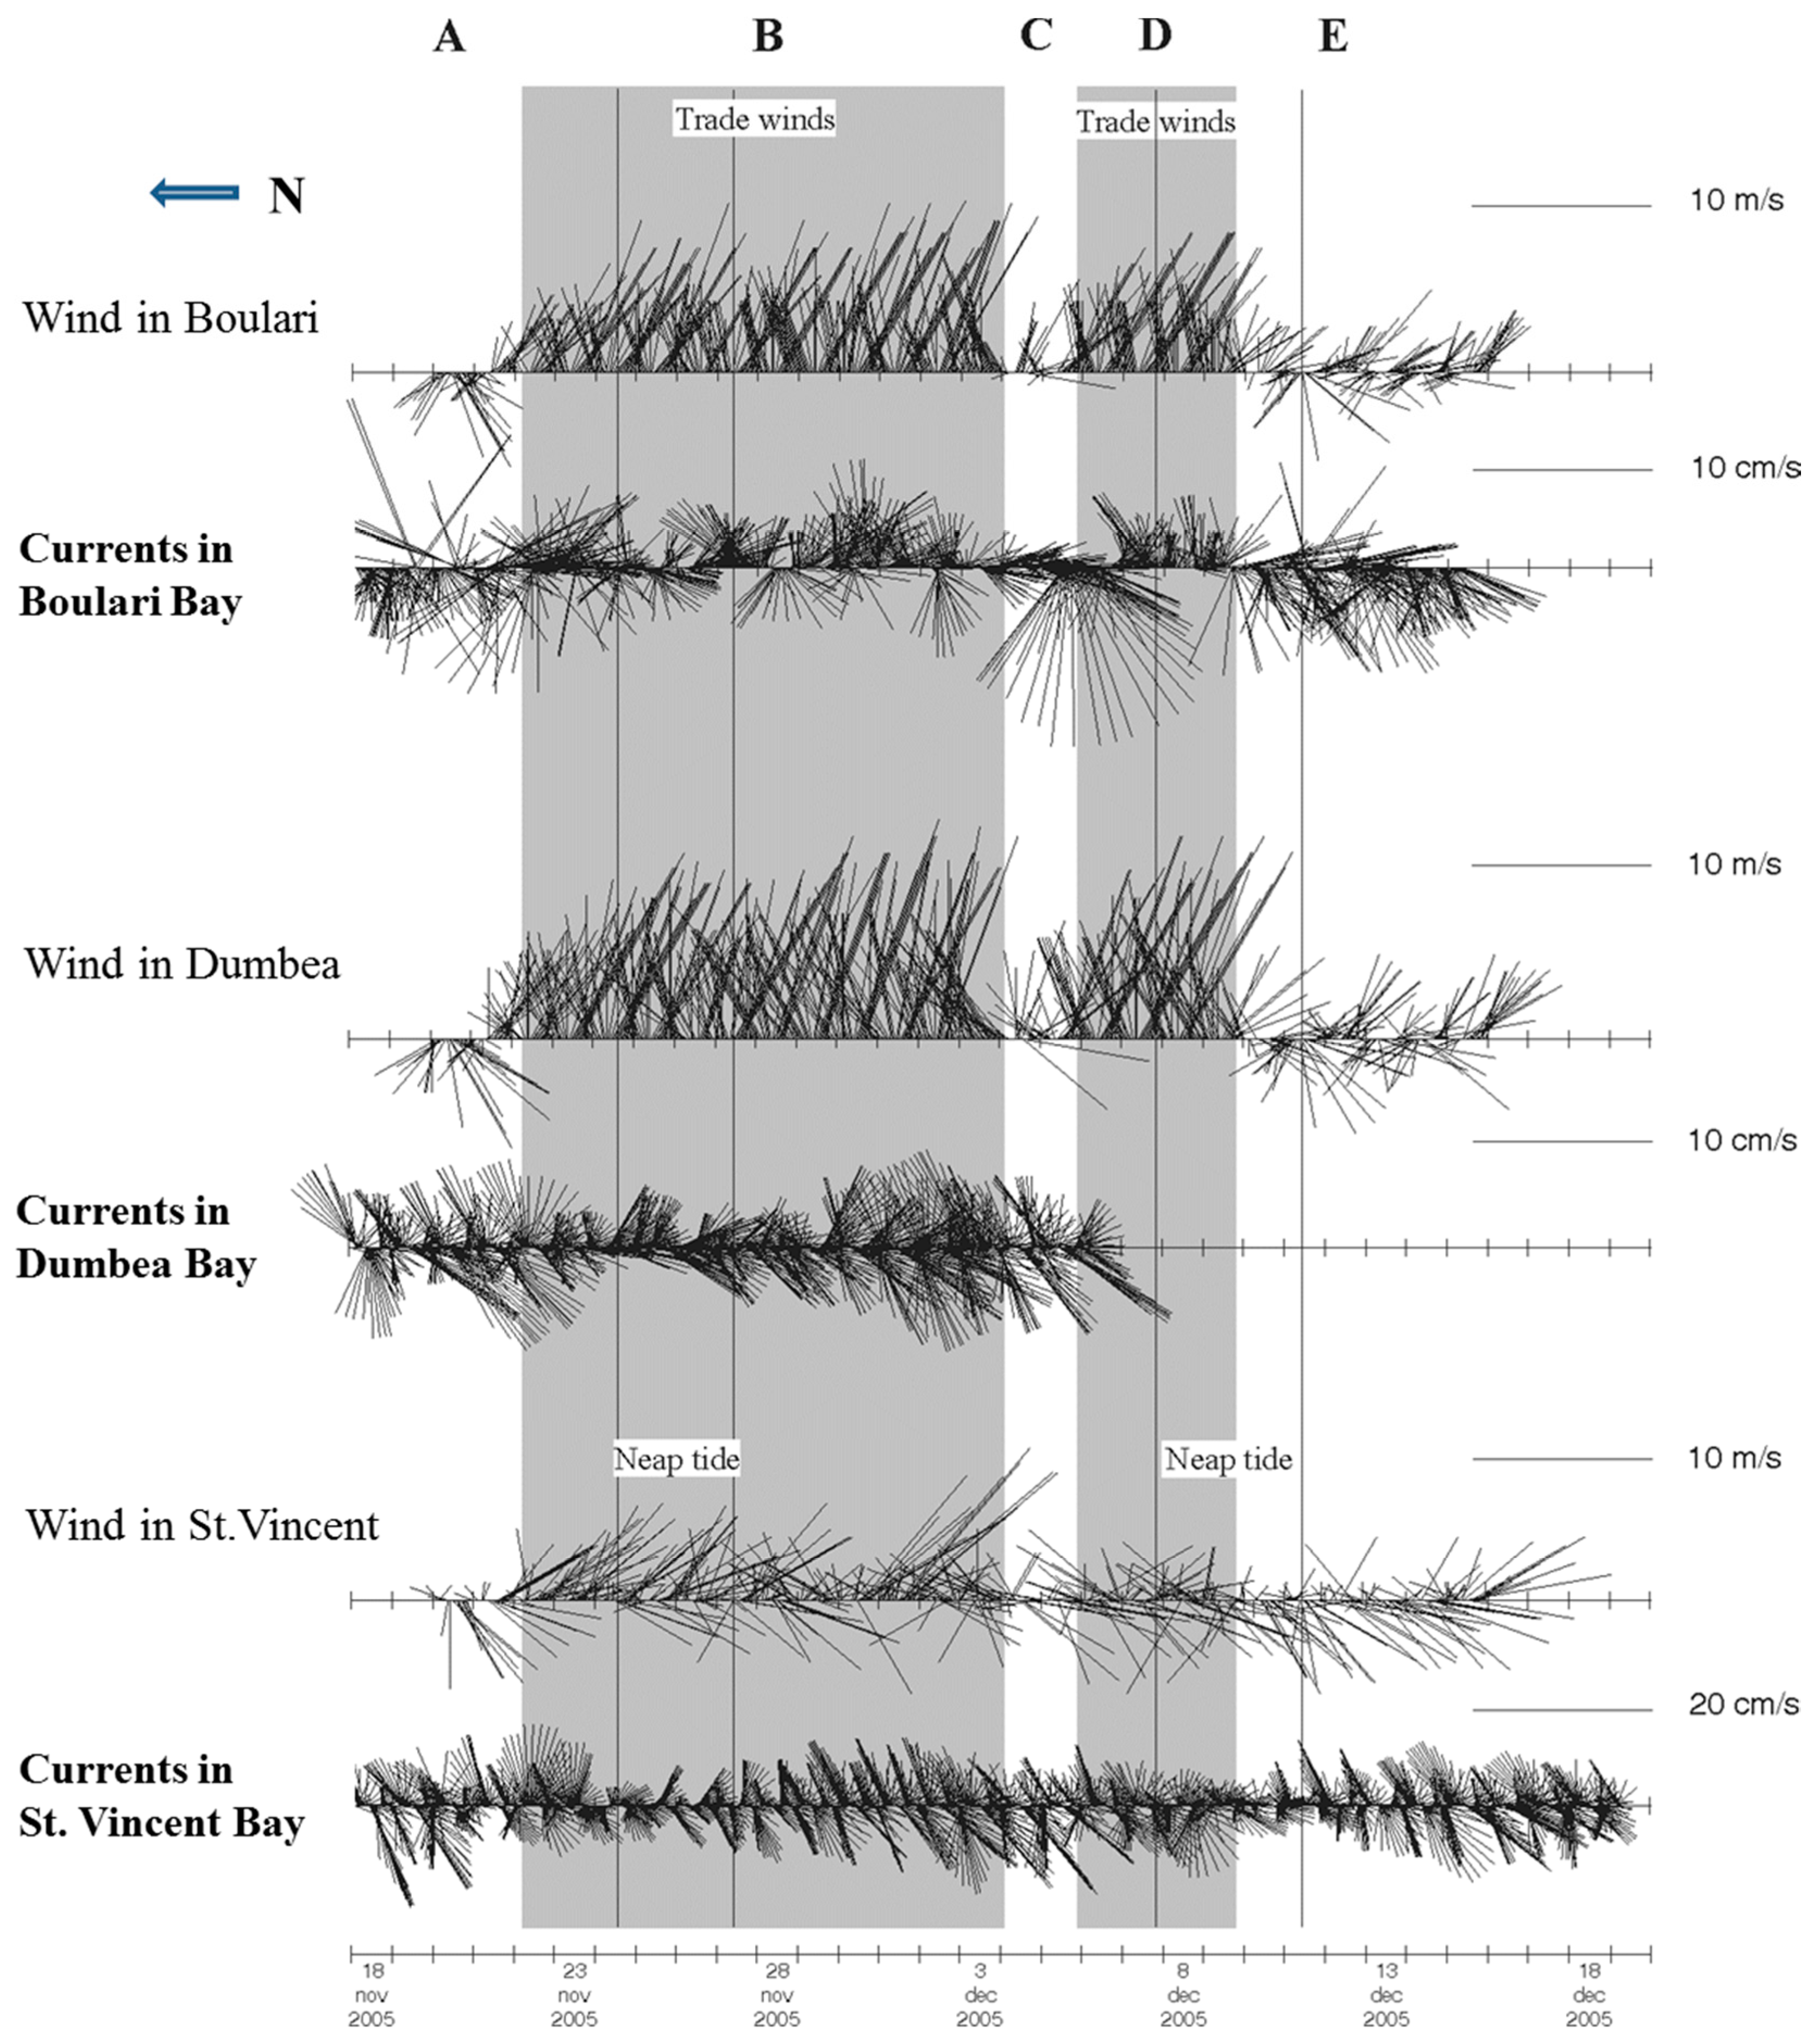
4.2. Wind
- A typical dominant trade wind regime during the study period, with the direction changing from NE during the night to SE in the day, increasing in strength until the beginning of the afternoon and reaching a maximum of 10 m·s–1 (periods B, D);
- A regime characterized by variable and weaker winds (below 5 m·s–1) (periods A, C and E).
4.3. Hydrodynamics
4.4. SPM Collection
4.5. Turbidity, Water Column Structure, and Particle Dynamics
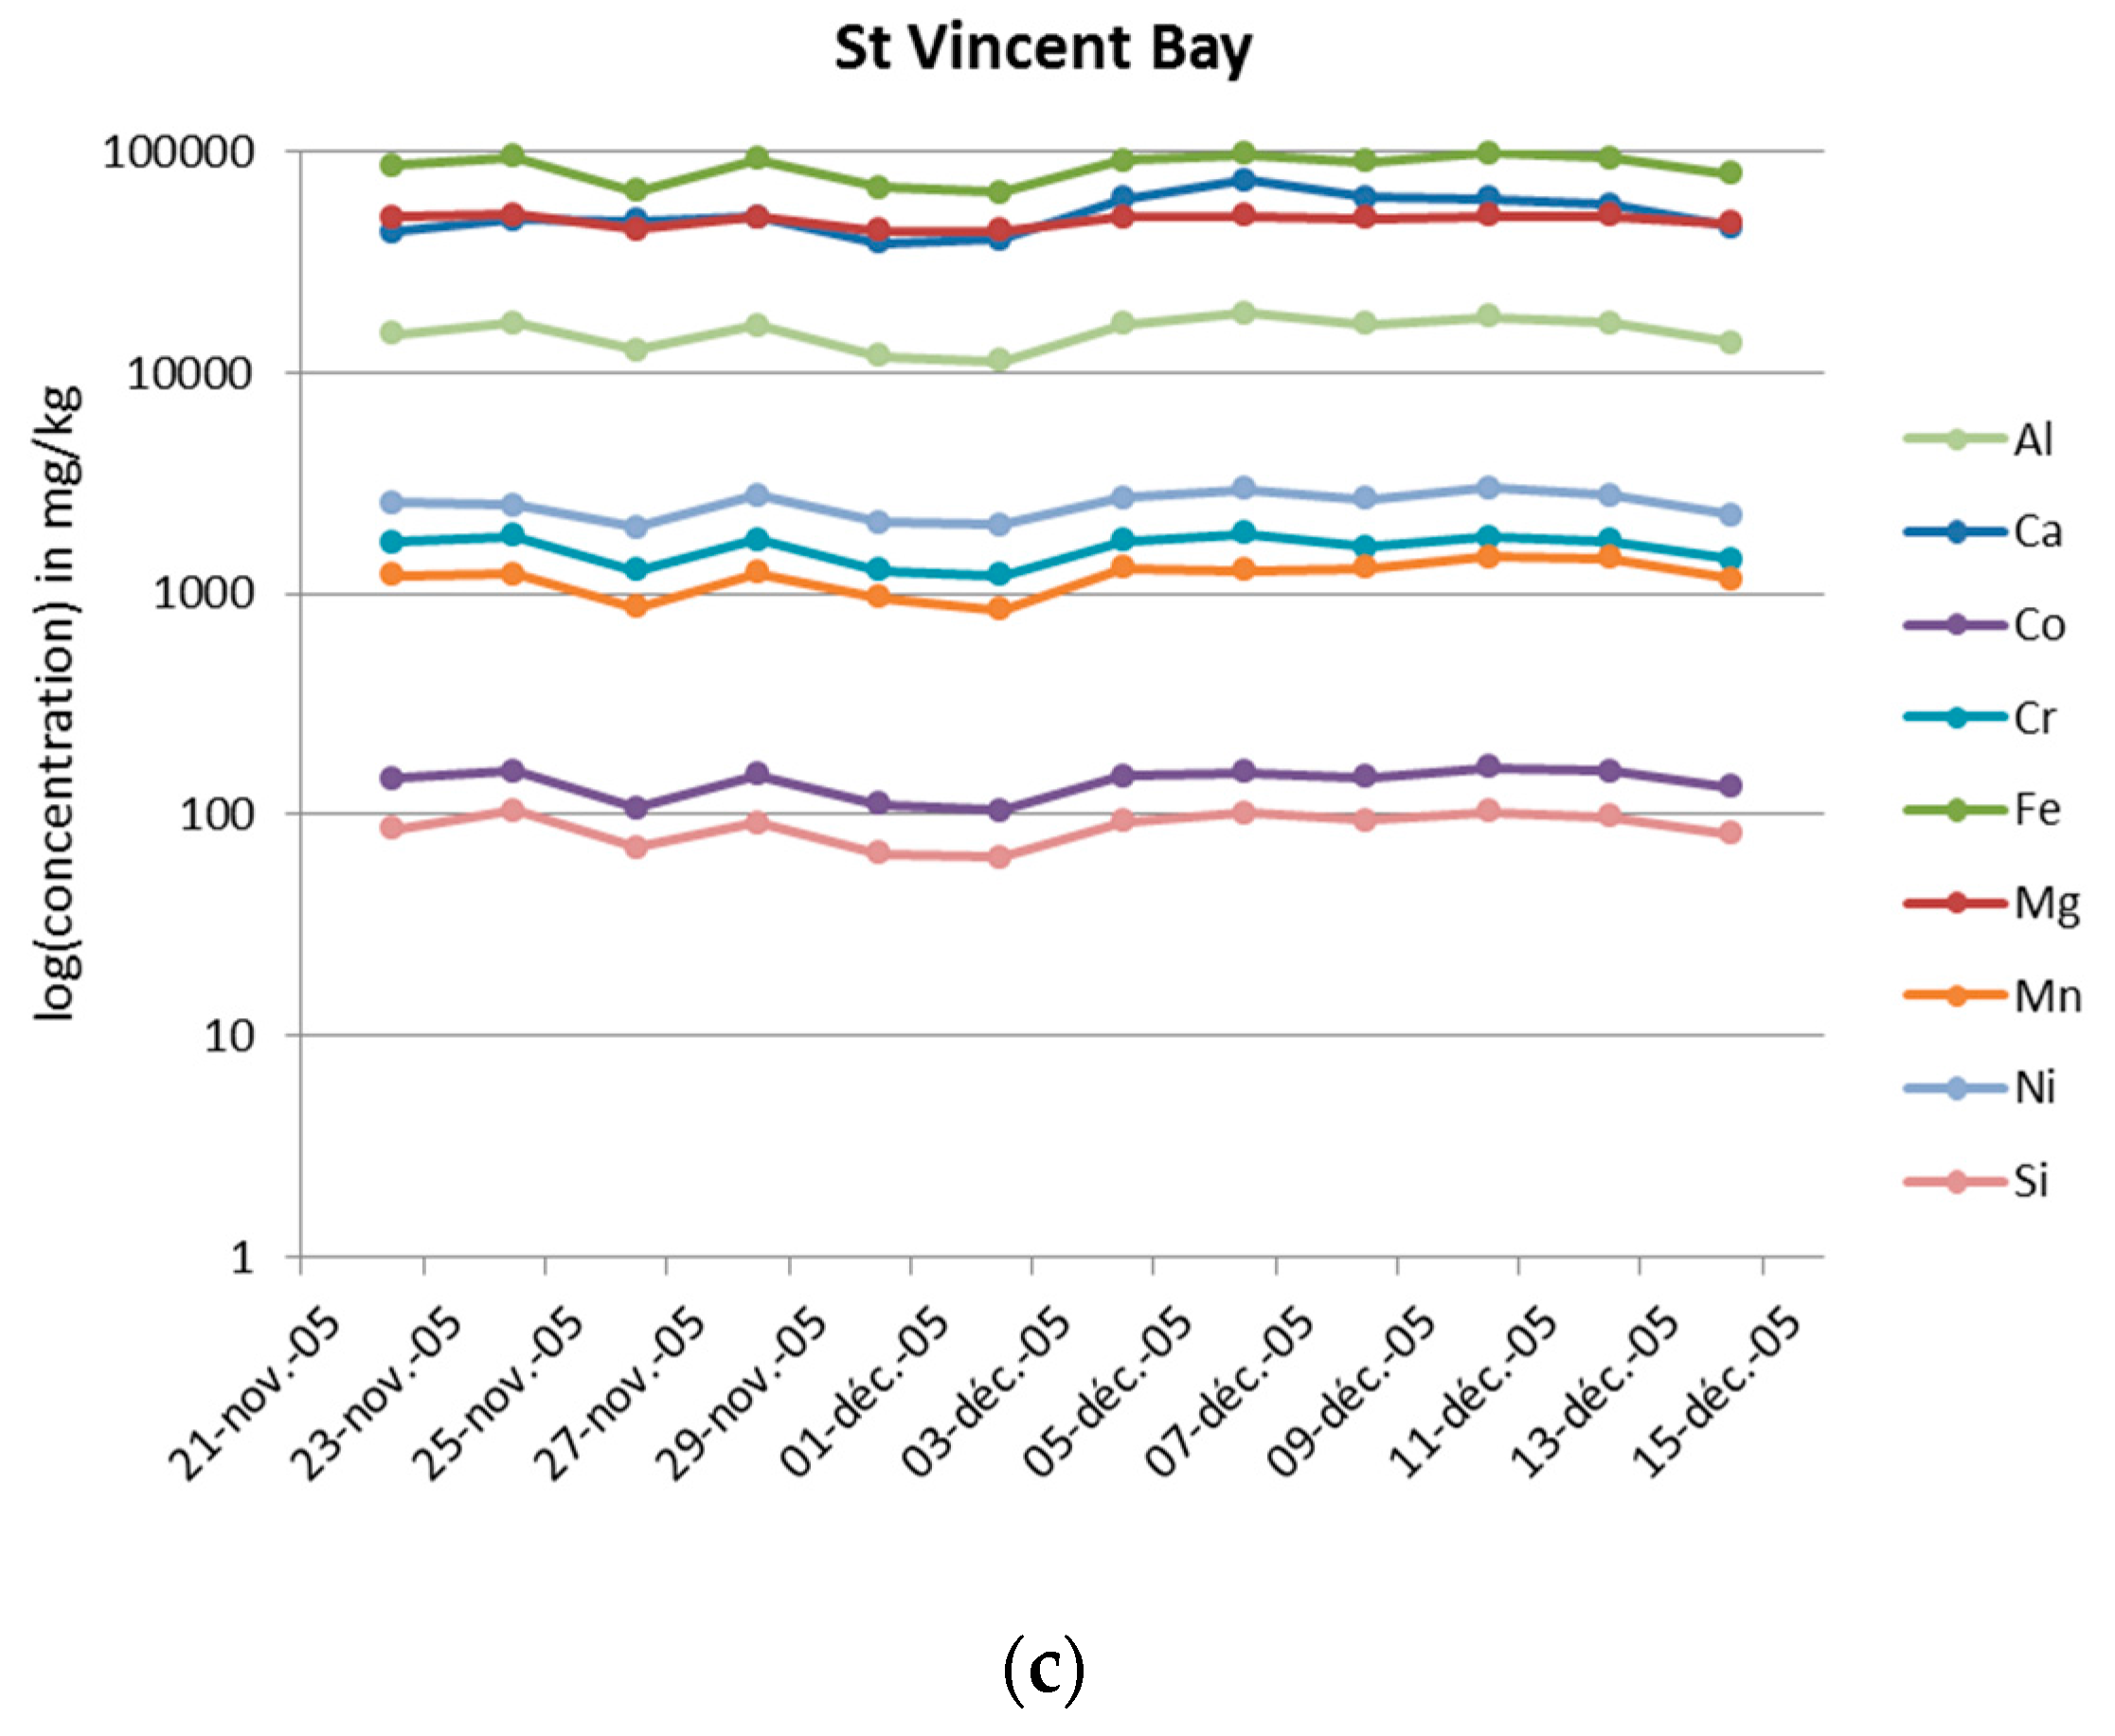
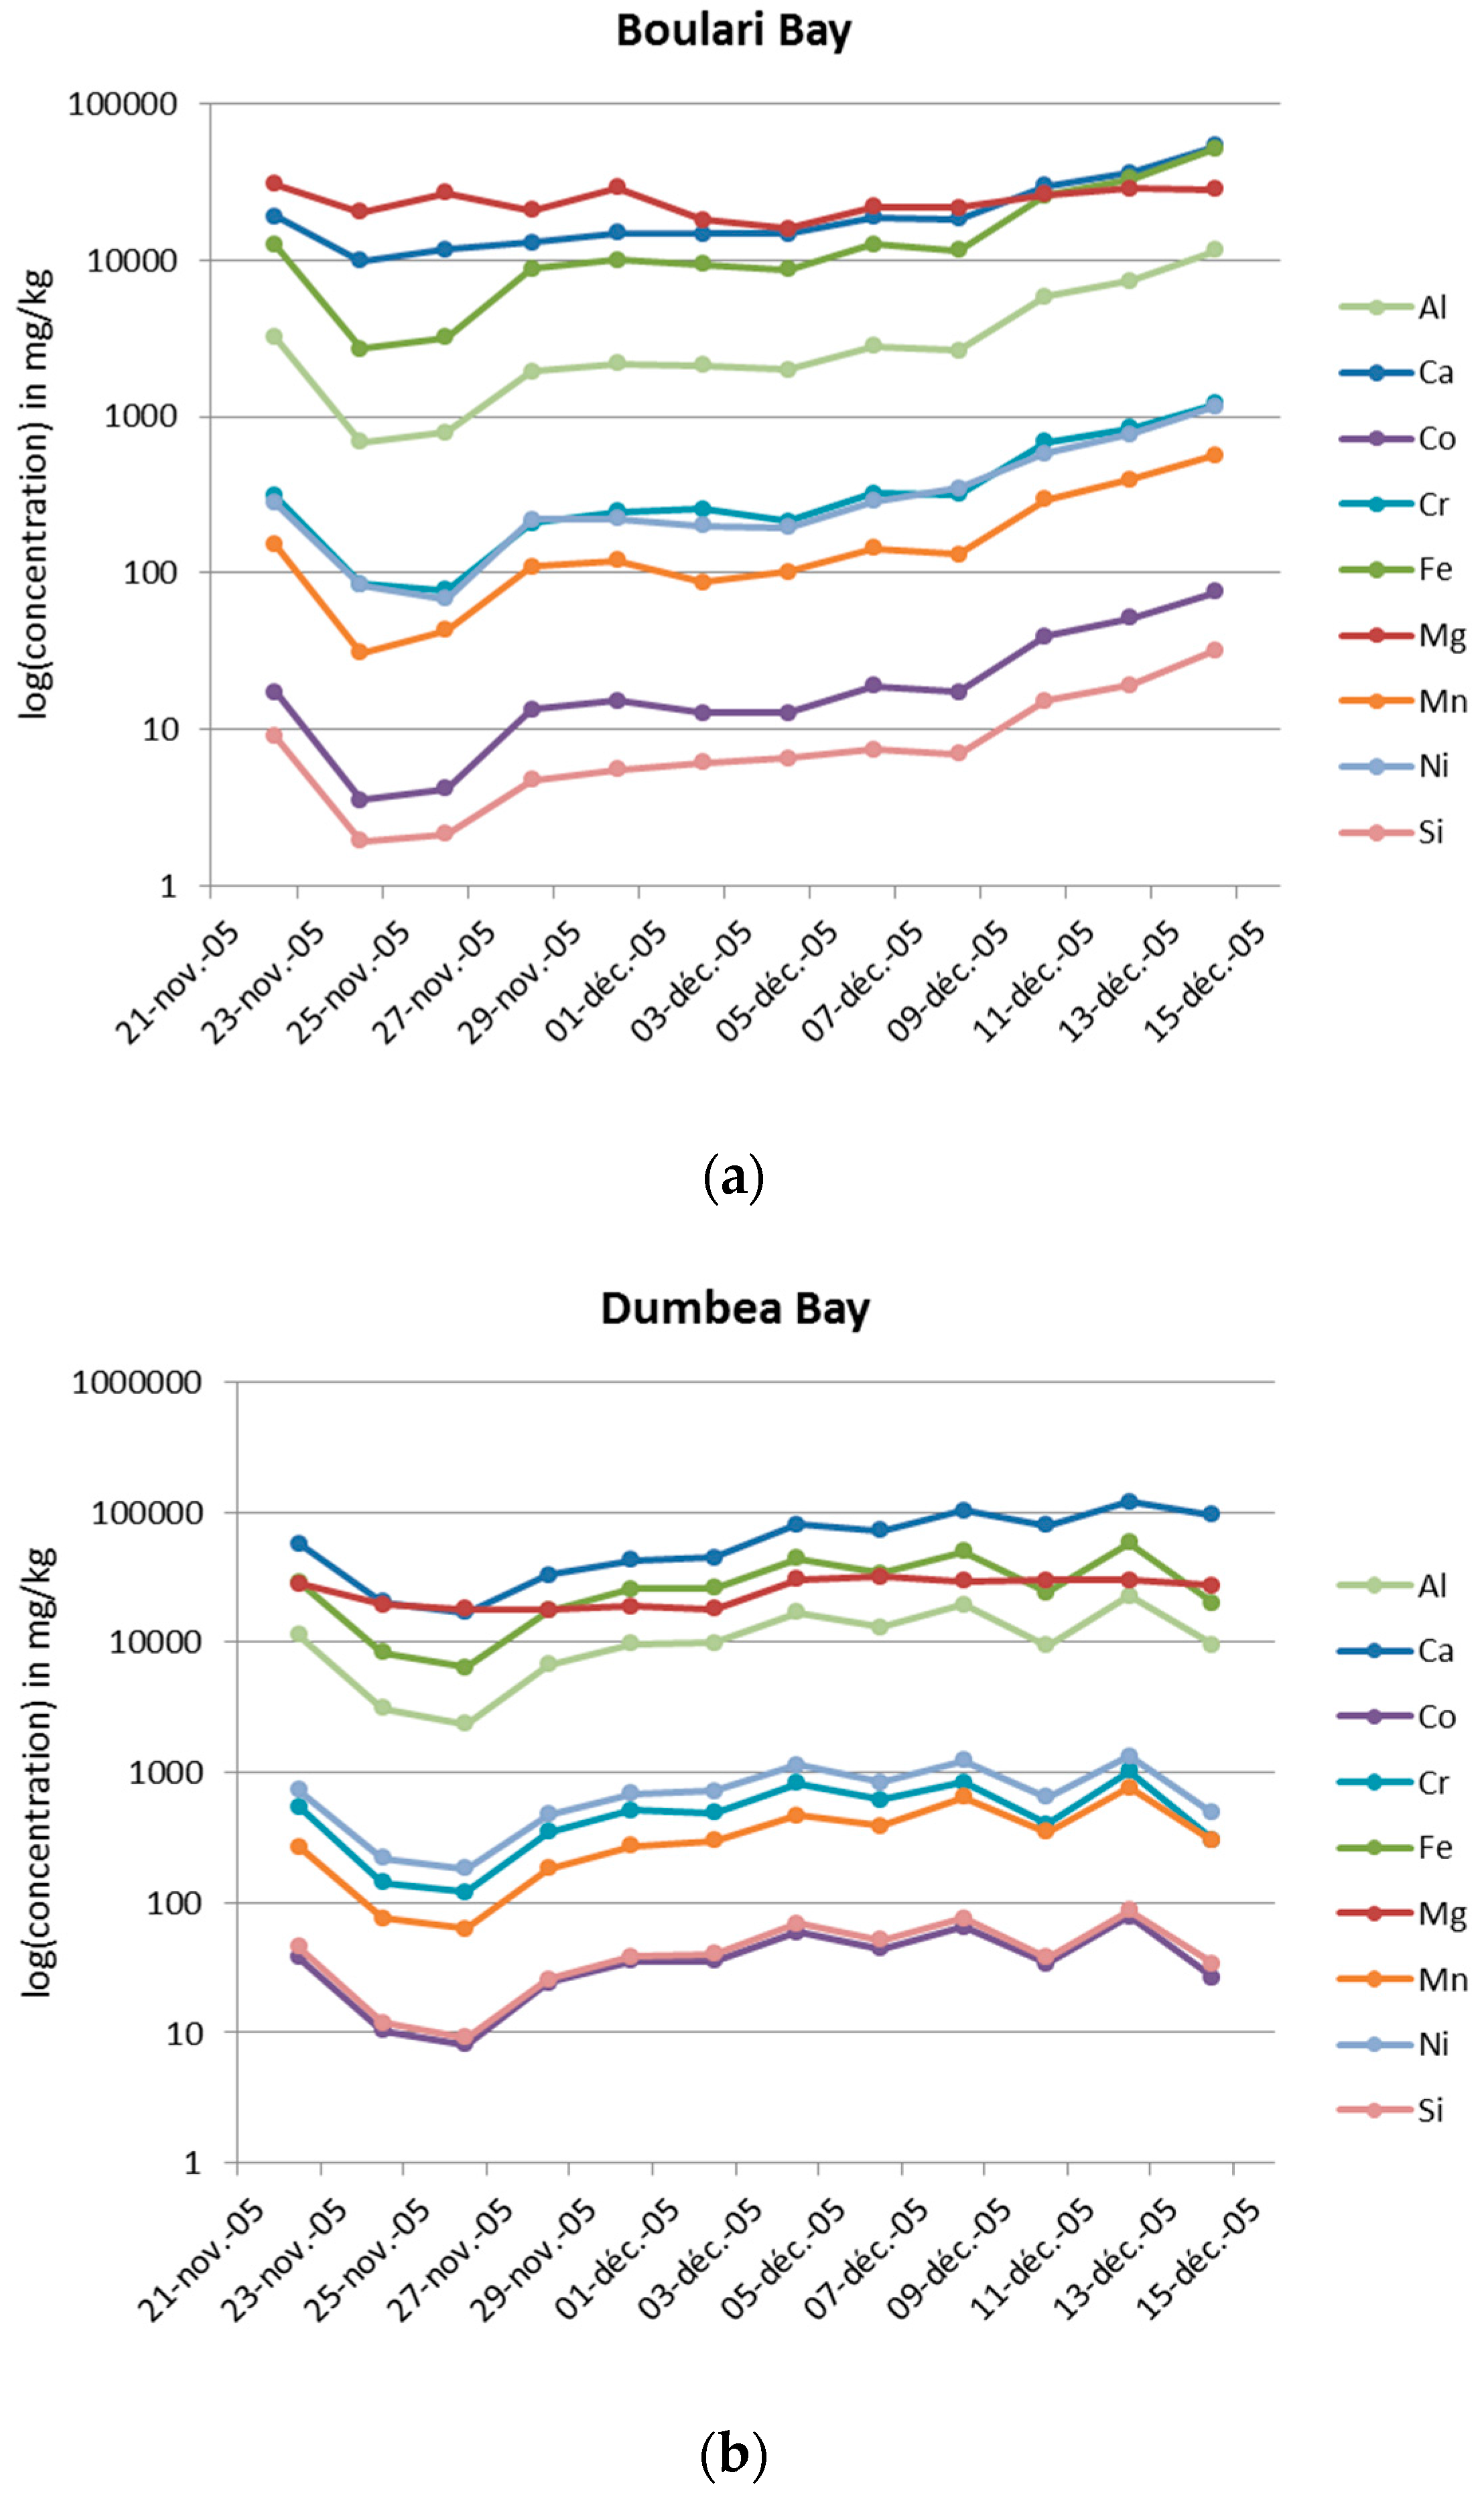
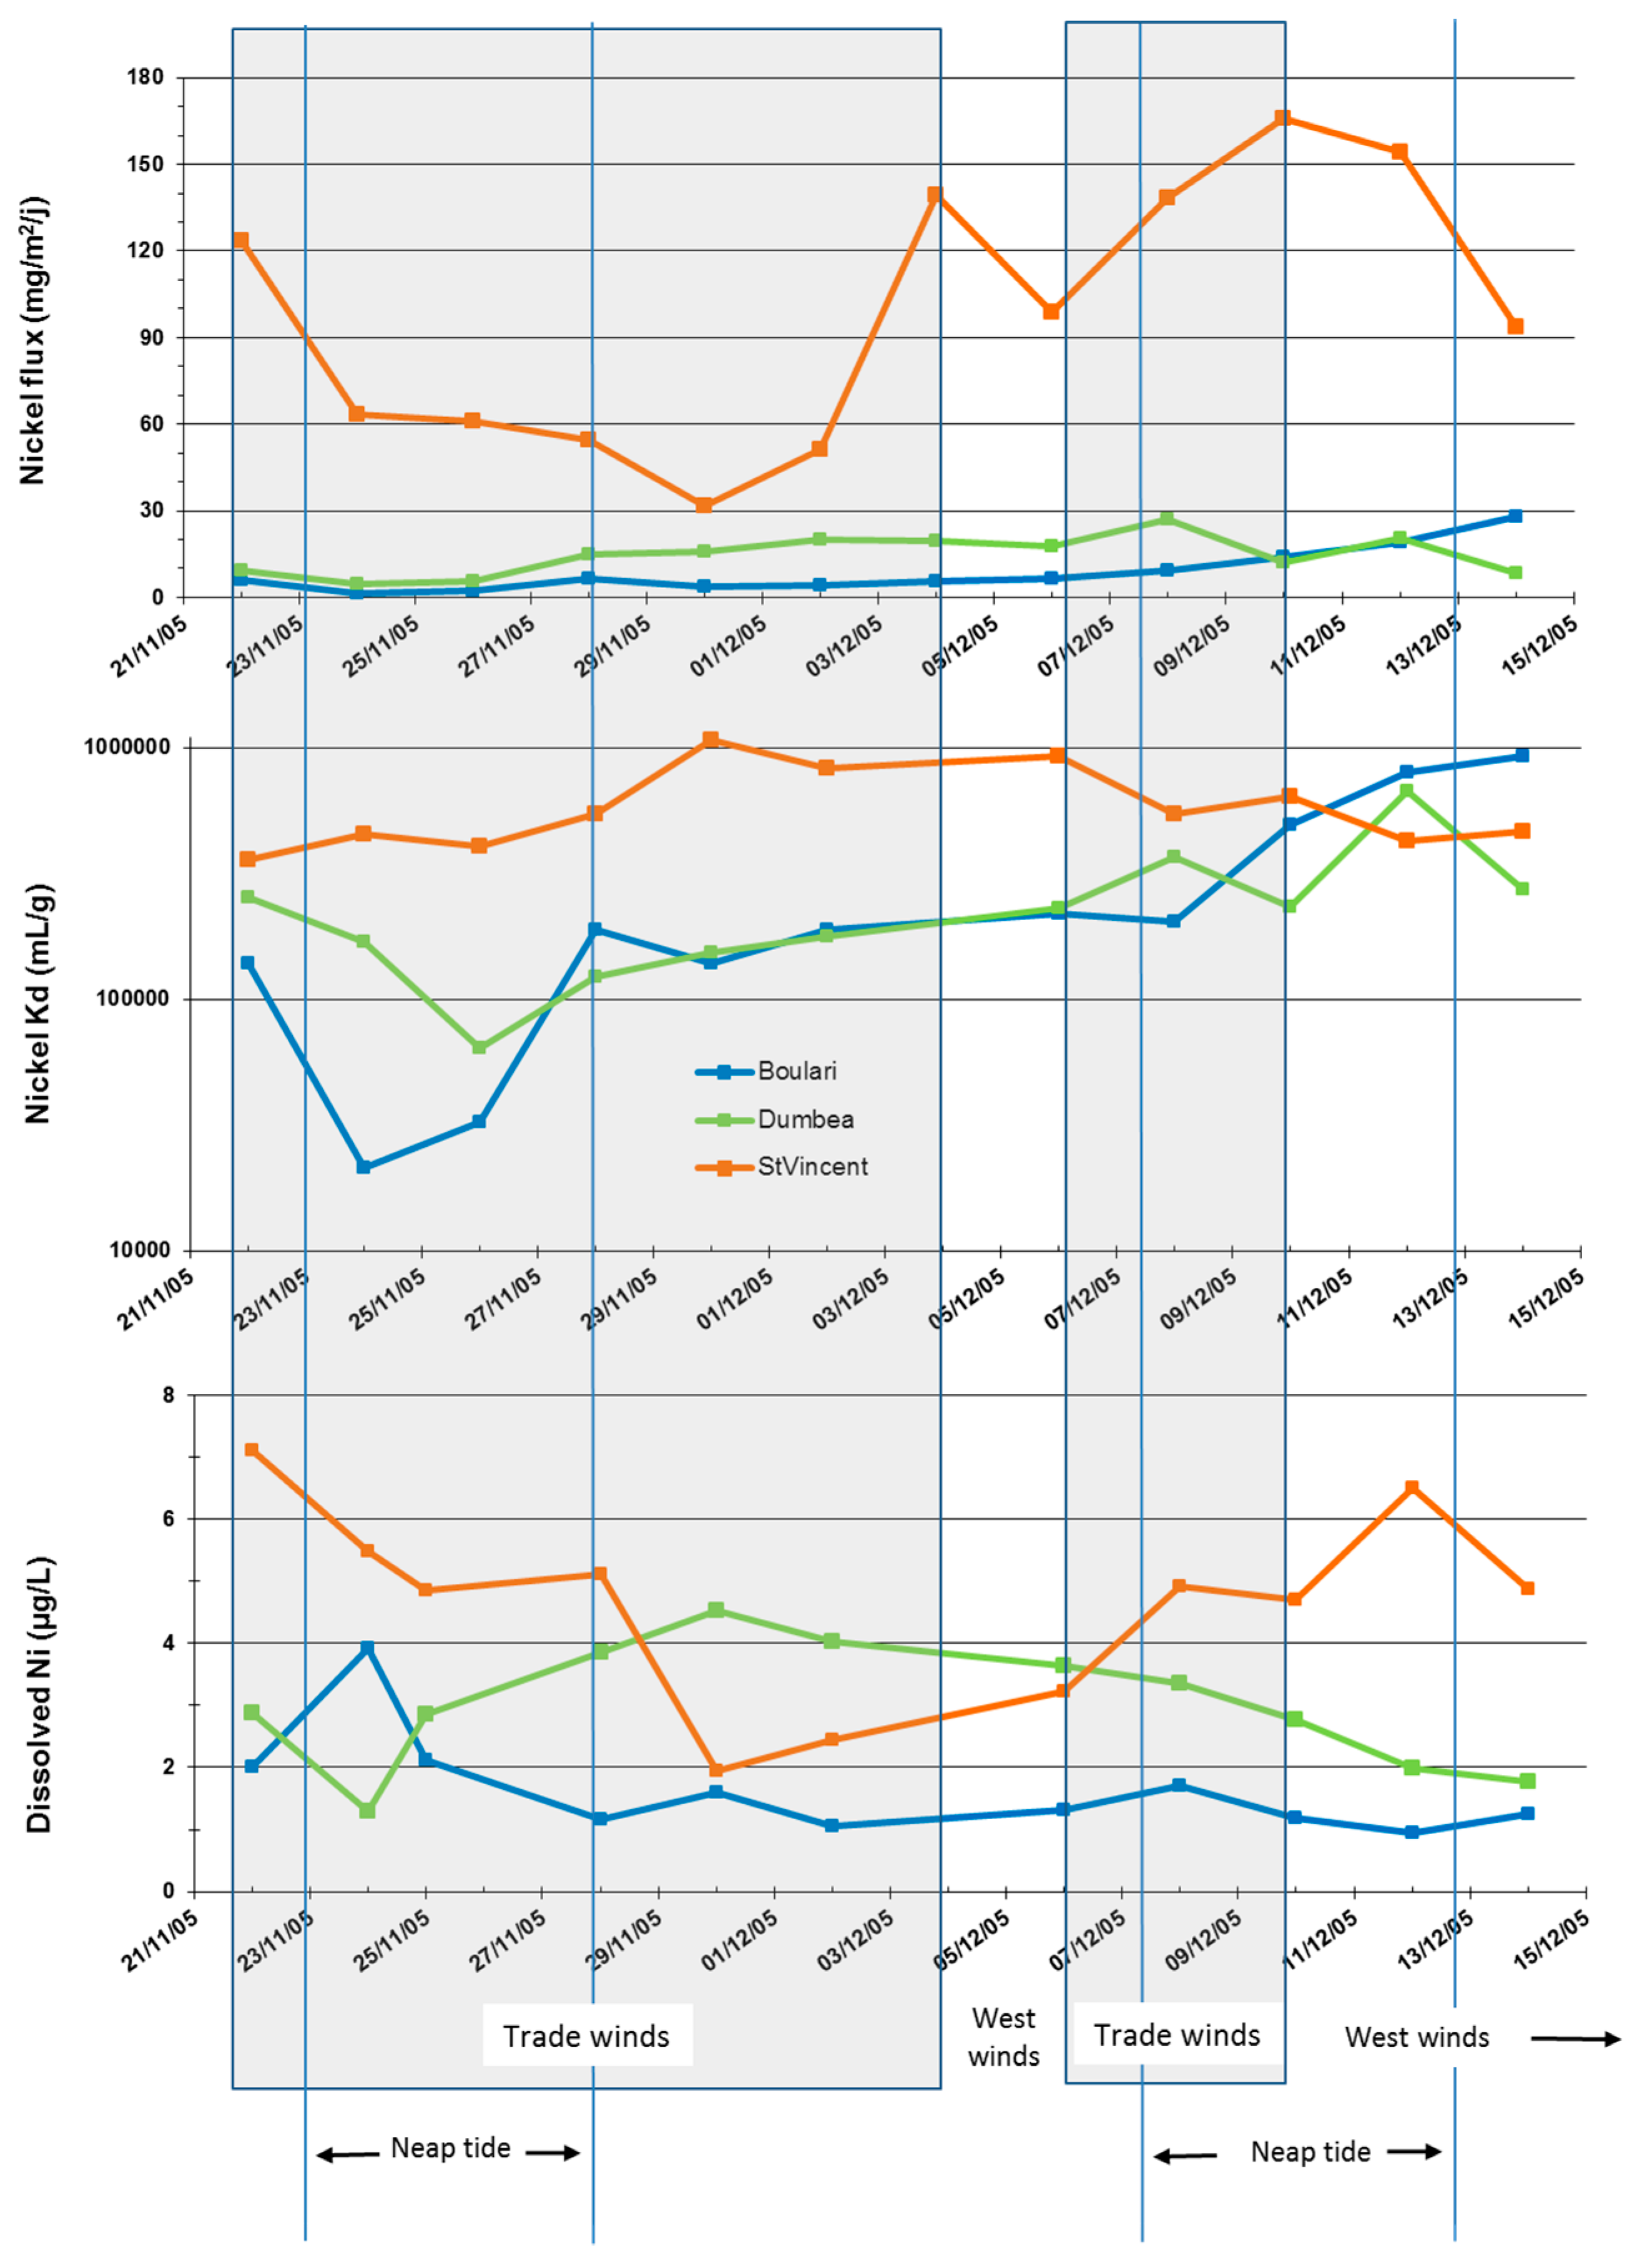
4.6. Geochemistry
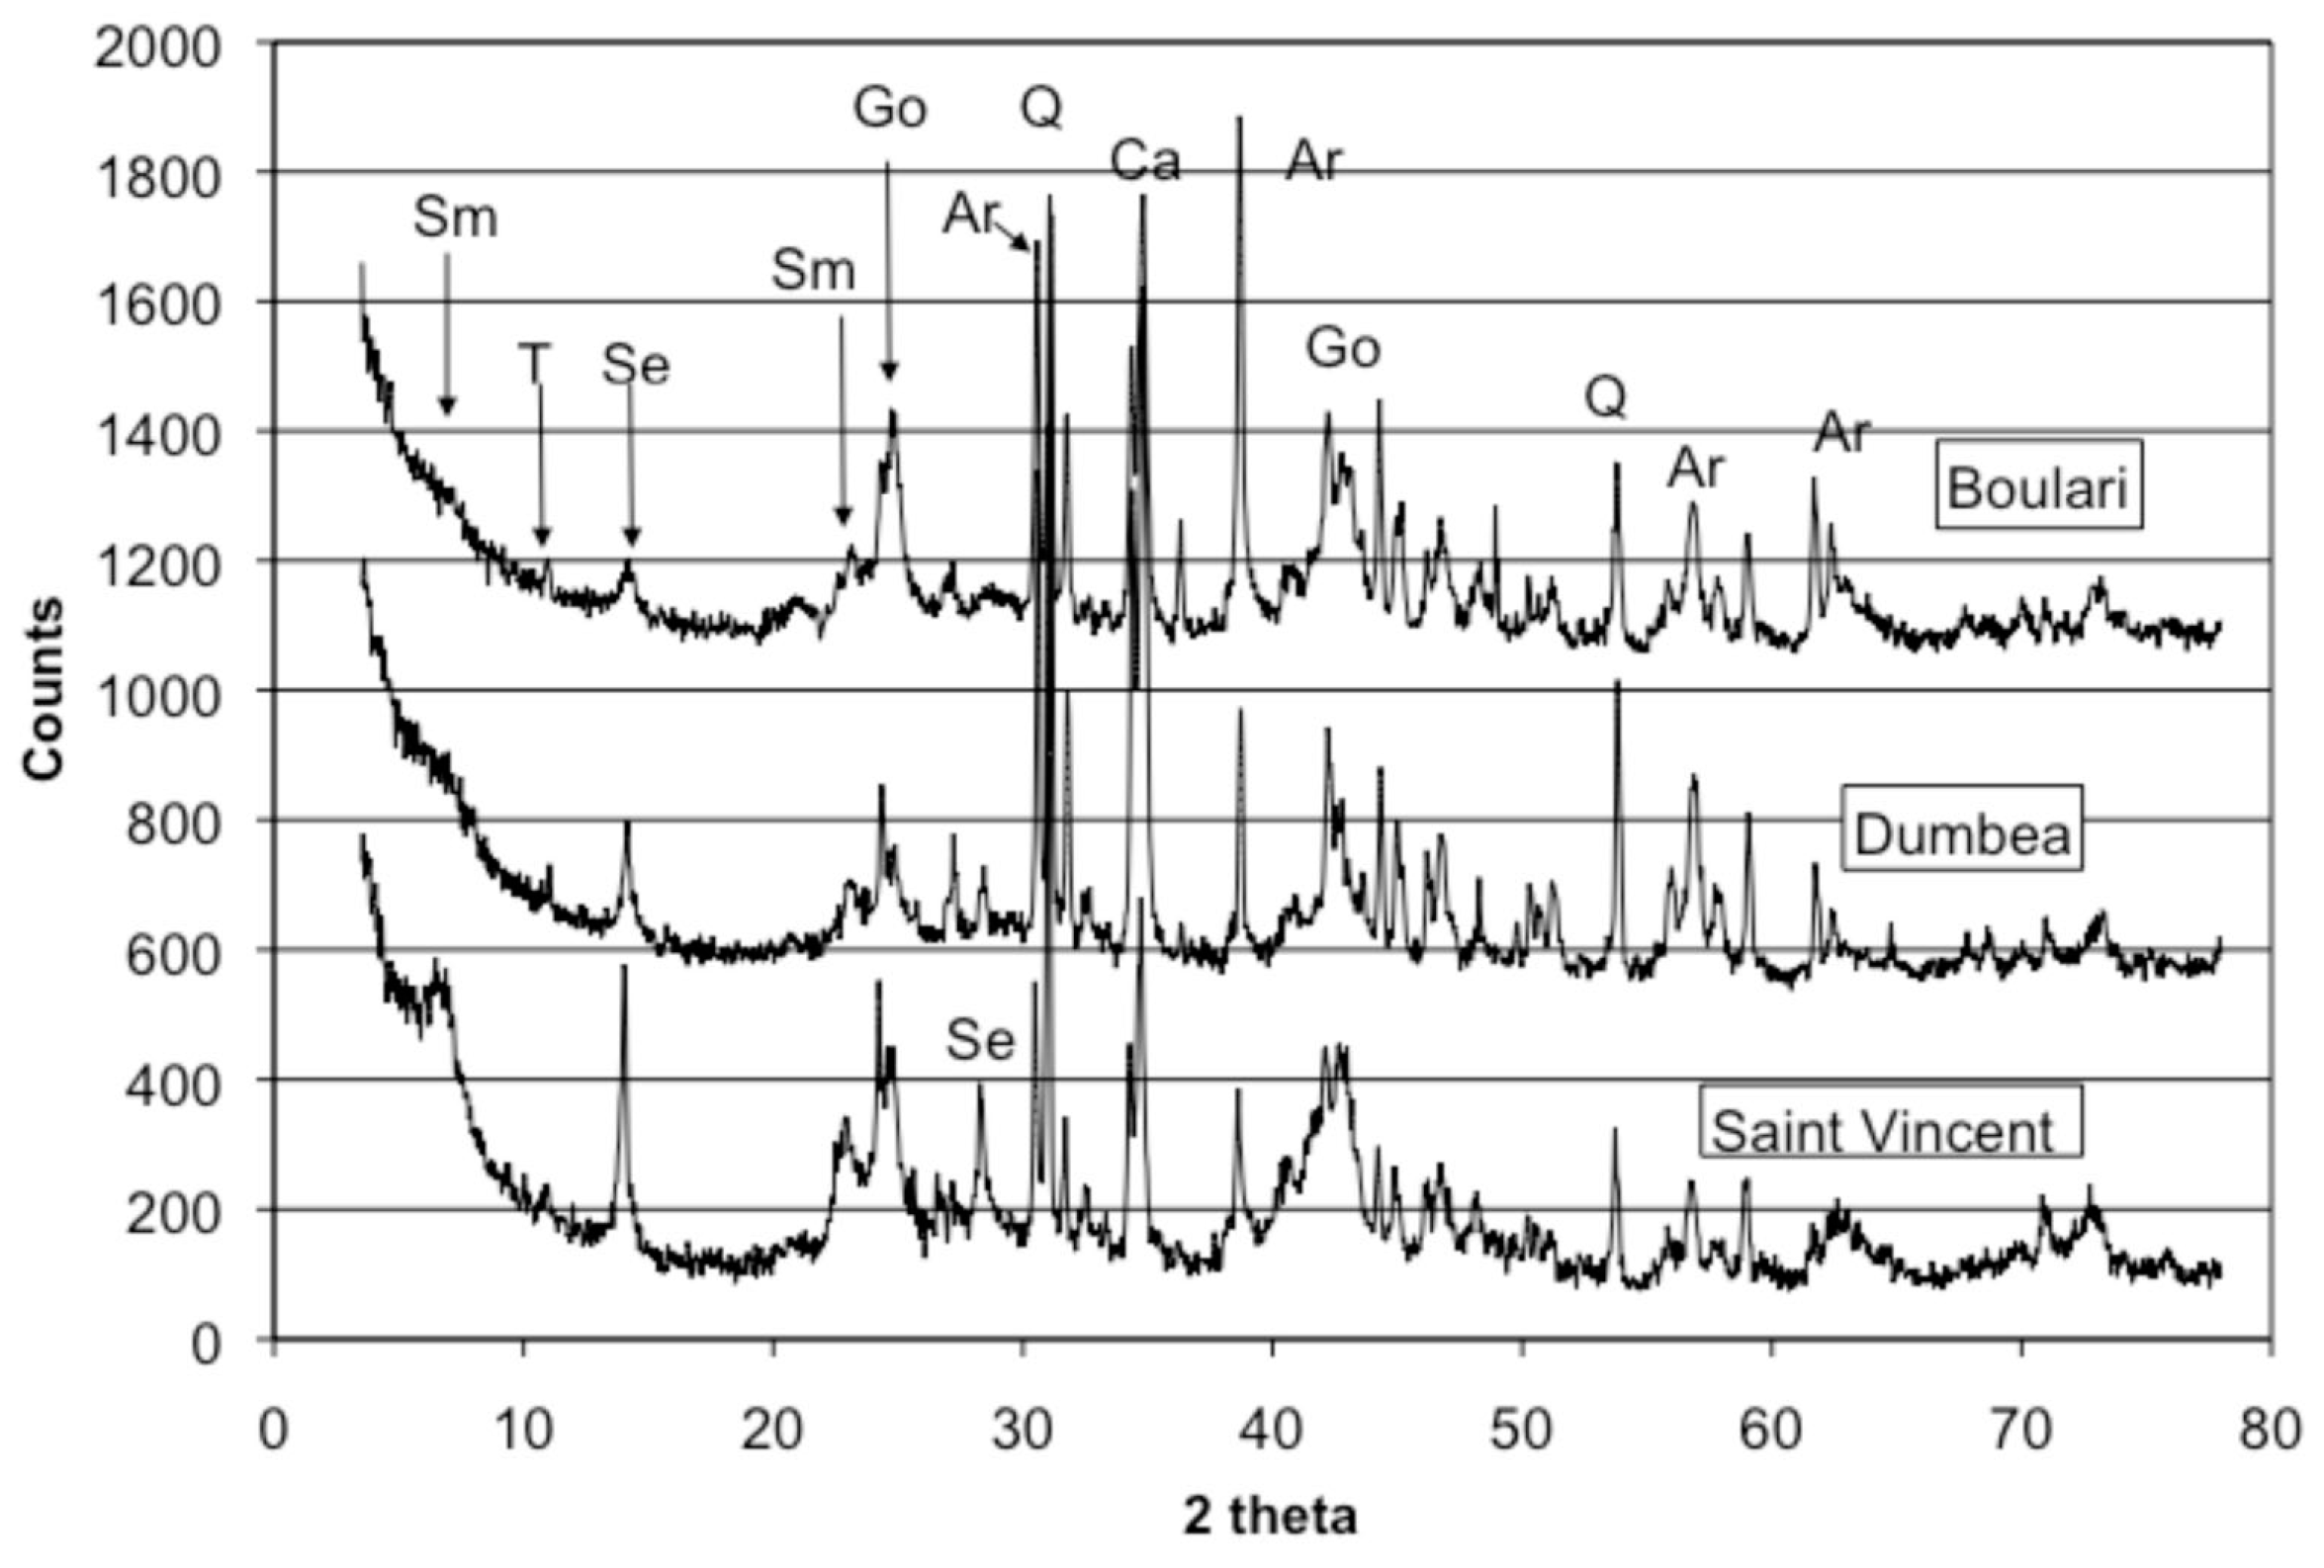
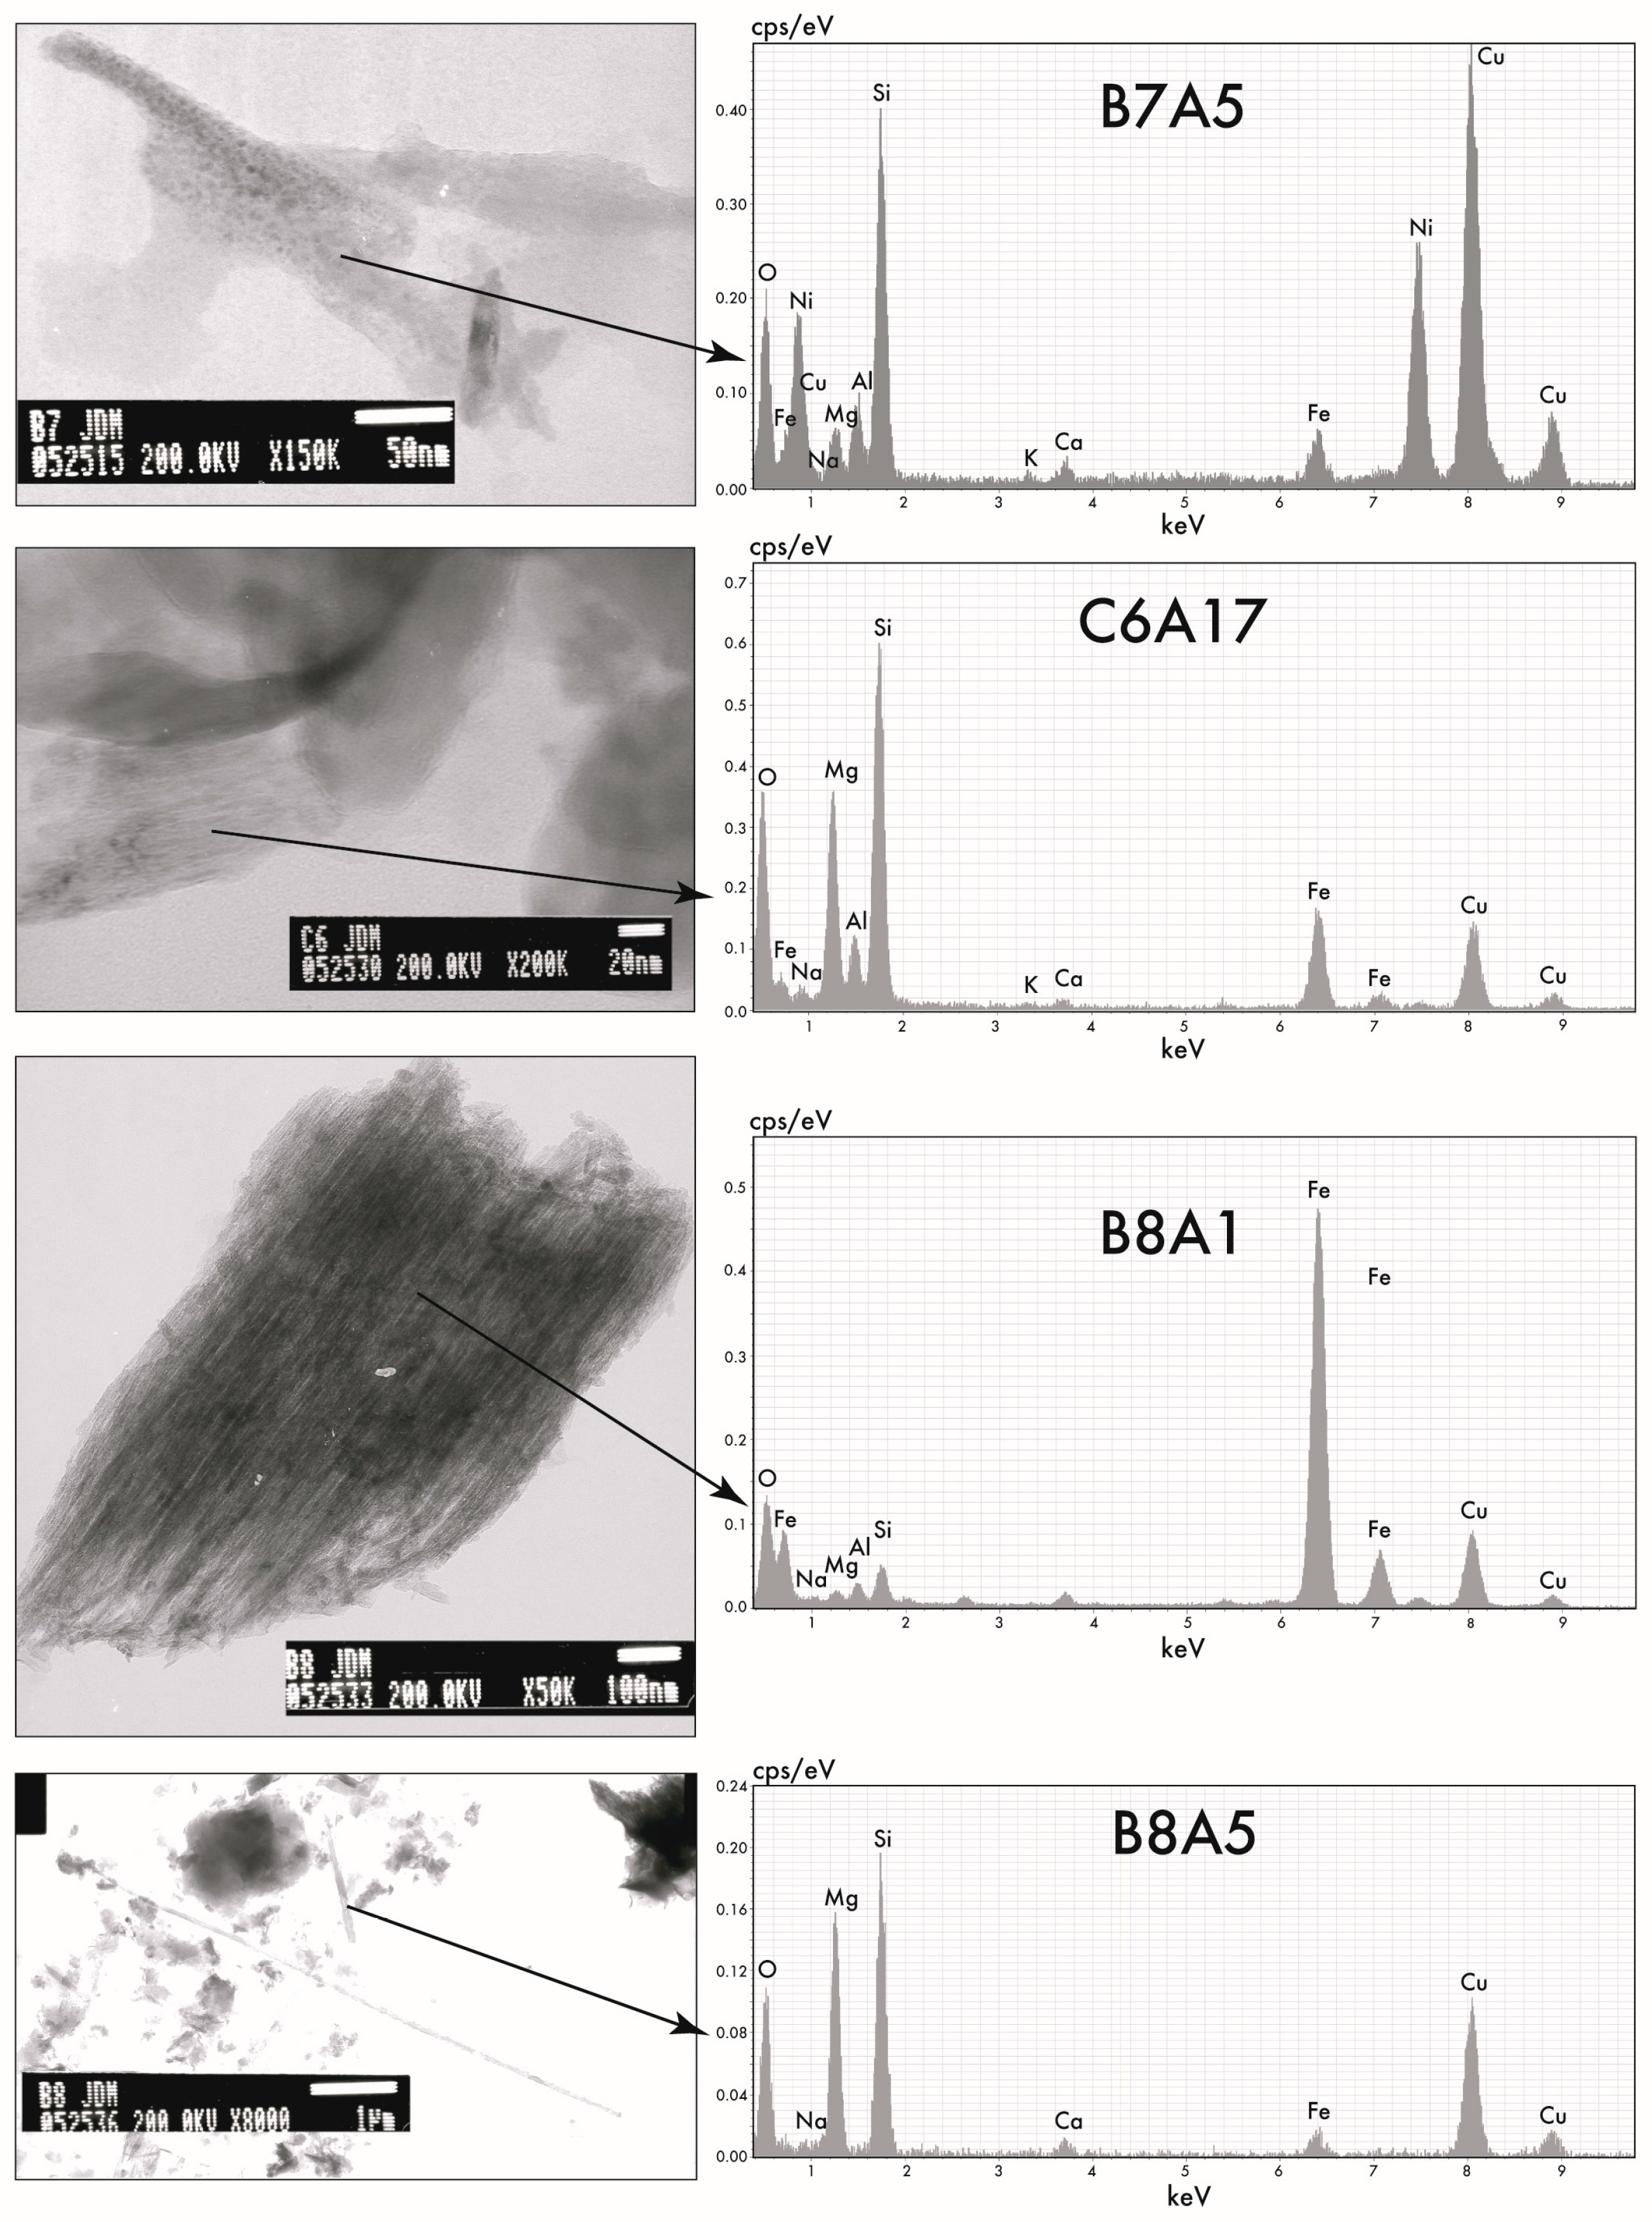
4.7. Mineralogy
5. Discussion
5.1. Impact of Mining Activities on the Suspended Sediment Composition
5.1.1. Boulari Bay
5.1.2. Dumbéa Bay
5.1.3. St Vincent Bay
5.2. Origin of the Minerals
6. Conclusions
Acknowledgments
Author Contributions
Conflicts of Interest
References
- Labrosse, P.; Fichez, R.; Farman, R.; Adams, T. New Caledonia. In Seas at the Millenium, an Environmental Evaluation; Sheppard, C., Ed.; Elsevier: Amsterdam, The Netherlands, 2000; Volume 2, pp. 723–736. [Google Scholar]
- Pandolfi, J.M.; Bradbury, R.H.; Sala, E.; Hughes, T.P.; Bjorndal, K.A.; Cooke, R.G.; McArdle, D.; McClenachan, L.; Newman, M.J.H.; Paredes, G.; et al. Global trajectories of the long-term decline of coral reef ecosystems. Science 2003, 301, 955–958. [Google Scholar] [CrossRef] [PubMed]
- Doney, S.C. The growing human footprint on coastal and open-ocean biogeochemistry. Science 2010, 328, 1512–1516. [Google Scholar] [CrossRef] [PubMed]
- Burke, L.; Reytar, K.; Spalding, M.; Perry, A. Reefs at Risk Revisited; World Resources Institute: Washington, DC, USA, 2011; Available online: http://pdf.wri.org/reefs_at_risk_revisited.pdf (accessed on 3 January 2017).
- Maina, J.; McClanahan, T.R.; Venus, V.; Ateweberhan, M.; Madin, J. Global gradients of coral exposure to environmental stresses and implications for local management. PLoS ONE 2011, 6, e23064. [Google Scholar] [CrossRef] [PubMed]
- Brodie, J.E.; Kroon, F.J.; Schaffelke, B.; Wolanski, E.C.; Lewis, S.E.; Devlin, M.J.; Bohnet, I.C.; Bainbridge, Z.T.; Waterhouse, J.; Davis, A.M. Terrestrial pollutant runoff to the Great Barrier Reef: An update of issues, priorities and management responses. Mar. Poll. Bull. 2012, 65, 81–100. [Google Scholar] [CrossRef] [PubMed]
- De’ath, G.; Fabricius, K.E.; Sweatman, H.; Puotinen, M. The 27-year decline of coral cover on the Great Barrier Reef and its causes. PNAS 2012, 109, 17995–17999. [Google Scholar] [CrossRef] [PubMed]
- Erftemeijer, P.L.A.; Riegl, B.; Hoeksema, B.W.; Todd, P.A. Environmental impacts of dredging and other sediment disturbances on corals: A review. Mar Poll. Bull. 2012, 64, 1737–1765. [Google Scholar] [CrossRef] [PubMed]
- Morrison, R.J.; Denton, G.R.W.; Bale Tamata, U.; Grignon, J. Anthropogenic biogeochemical impacts on coral reefs in the Pacific Islands-An overview. Deep-Sea Res. II 2013, 96, 5–12. [Google Scholar] [CrossRef]
- Myers, N.; Mittermeier, R.A.; Mittermeier, C.G.; da Fonseca, G.A.B.; Kent, J. Biodiversity hotspots for conservation priorities. Nature 2000, 403, 853–858. [Google Scholar] [CrossRef] [PubMed]
- Alongi, D.M. Present state and future of the world’s mangrove forests. Environ. Conserv. 2002, 29, 331–349. [Google Scholar] [CrossRef]
- Bouchet, P.; Lozouet, P.; Maestrati, P.; Heros, V. Assessing the magnitude of species richness in tropical marine environments: Exceptionally high numbers of molluscs at a New Caledonia site. Biol. J. Linn. Soc. 2002, 75, 421–436. [Google Scholar] [CrossRef]
- Nagelkerken, I.; Blaber, S.J.M.; Bouillon, S.; Green, P.; Haywood, M.; Kirton, L.G.; Meynecke, J.O.; Pawlik, J.; Penrose, H.M.; Sasekumar, A.; et al. The habitat function of mangroves for terrestrial and marine fauna: A review. Aquat. Bot. 2008, 89, 155–185. [Google Scholar] [CrossRef]
- Adjeroud, M.; Fernandez, J.M.; Caroll, A.G.; Harrison, P.L.; Penin, L. Spatial patterns and recruitment processes of coral assemblages among contrasting environmental conditions in the southwestern lagoon of New Caledonia. Mar. Poll. Bull. 2010, 61, 375–386. [Google Scholar] [CrossRef] [PubMed]
- Losfeld, G.; L’Huillier, L.; Fogliani, B.; Jaffré, T.; Grison, C. Mining in New Caledonia: Environmental stakes and restoration opportunities. Environ. Sci. Pollut. Res. 2015, 22, 5592–5607. [Google Scholar] [CrossRef] [PubMed]
- Hédouin, L.; Bustamante, P.; Fichez, R.; Warnau, M. The tropical brown alga Lobophora variegate as a bioindicator of mining contamination in the New Caledonia lagoon: A field transplantation study. Mar. Environ. Res. 2008, 66, 438–444. [Google Scholar] [CrossRef] [PubMed]
- Metian, M.; Bustamante, P.; Hédouin, L.; Warnau, M. Accumulation of nine metals and one metalloid in the tropical scallop Comptopallium radula from coral reefs in New Caledonia. Environ. Pollut. (Oxford, UK) 2008, 152, 543–552. [Google Scholar] [CrossRef] [PubMed]
- Hédouin, L.; Bustamante, P.; Churlaud, C.; Pringault, O.; Fichez, R.; Warnau, M. Trends in concentrations of selected metalloid and metals in two bivalves from the SW lagoon of New Caledonia. Ecotoxicol. Environ. Saf. 2009, 72, 372–381. [Google Scholar] [CrossRef] [PubMed]
- Debenay, J.P.; Fernandez, J.M. Benthic foraminifera records of complex anthropogenic environmental changes combined with geochemical data in a tropical bay of New Caledonia. Mar. Poll. Bull. 2009, 59, 311–322. [Google Scholar] [CrossRef] [PubMed]
- Bonnet, X.; Briand, M.; Brischoux, F.; Letourneur, Y.; Fauvel, T.; Bustamante, P. Anguilliform fish reveal large scale contamination by mine trace elements in the coral reefs of New Caledonia. Sci. Total Environ. 2014, 470–471, 876–882. [Google Scholar] [CrossRef] [PubMed]
- Cuif, M.; Kaplan, D.M.; Lefèvre, J.; Faure, V.M.; Caillaud, M.; Verley, P.; Vigliola, L.; Lett, C. Wind-induced variability in larval retention in a coral reef system: A biophysical modelling study in the South-West Lagoon of New Caledonia. Prog. Oceanogr. 2014, 122, 105–115. [Google Scholar] [CrossRef]
- Gilbert, A.; Heintz, T.; Hoeksema, B.W.; Benzoni, F.; Fernandez, J.M.; Fauvelot, C.; Andrefouet, S. Endangered New Caledonian endemic mushroom coral Cantharellus noumeae in turbid, metal-rich, natural and artificial environments. Mar. Poll. Bull. 2015, 100, 359–369. [Google Scholar] [CrossRef] [PubMed]
- Heintz, T.; Haapkylä, J.; Gilbert, A. Coral health on reefs near mining sites in New Caledonia. Dis. Aquat. Org. 2015, 115, 165–173. [Google Scholar] [CrossRef] [PubMed]
- Dugas, F. La sedimentation en baie de St Vincent (Côte ouest de la Nouvelle-Caledonie). In Cah. ORSTOM, ser. Géol.; Office de la recherche scientifique et technique outre-mer (ORSTOM): Paris, France, 1974; Volume VI, pp. 41–62. [Google Scholar]
- Bird, E.C.F.; Dubois, J.P.; Iltis, J.A. The Impact of Opencast Mining on the Rivers and Coasts of New Caledonia; The United Nation University: Shibuya, Japan, 1984; Available online: http://archive.unu.edu/unupress/unupbooks/80505e/80505E00.htm (accessed on 9 May 2017).
- Ambatsian, P.; Fernex, F.; Bernant, M.; Parron, C.; Lecolle, J. High metal inputs to close seas: The New-Caledonia Lagoon. J. Geochem. Explor. 1997, 59, 59–74. [Google Scholar] [CrossRef]
- Fernandez, J.-M.; Ouillon, S.; Chevillon, C.; Douillet, P.; Fichez, R.; Le Gendre, R. A combined modelling and geochemical study of the fate of terrigenous inputs from mixed natural and mining sources in a coral reef lagoon (New Caledonia). Mar. Poll. Bull. 2006, 52, 320–331. [Google Scholar] [CrossRef] [PubMed]
- Fichez, R.; Adjeroud, M.; Bozec, Y.M.; Breau, L.; Chancerelle, Y.; Chevillon, C.; Douillet, P.; Fernandez, J.M.; Frouin, P.; Kulbicki, M.; et al. A review of selected indicators of particle, nutrient and metal input in coral reef lagoon systems. Aquat. Living Res. 2005, 18, 125–147. [Google Scholar] [CrossRef]
- Grenz, C.; Le Borgne, R.; Fichez, R.; Torreton, J.P. Tropical lagoon multidisciplinary investigations: An overview of the PNEC New Caledonia pilot site. Mar. Poll. Bull. 2010, 61, 267–268. [Google Scholar] [CrossRef] [PubMed]
- A collective of 75 authors. Atlas de la Nouvelle Calédonie, IRD ed.; Institut de Recherche pour le Développement (IRD): Marseille, France, 2013; ISBN 978-2-7099-1740-7. [Google Scholar]
- Breau, L. Extractions Séquentielles et Analyses de Métaux dans une Carotte de Sédiments Lagonaires Datée: Mise en Evidence de L’évolution des Apports Terrigènes Liée aux Activités Humaines au Cours des 150 Dernières Années. Master’s Thesis, University Aix-Marseille II, Marseille, France, 1998. [Google Scholar]
- Magand, O. Contribution à la Modélisation du Transport de la Matière Particulaire dans le Lagon Sud-Ouest de Nouvelle-Calédonie: Etude des flux, Détermination des Signatures Minéralogiques et Evolution Spatiale. Master’s Thesis, University Perpignan, Perpignan, France, 1998. [Google Scholar]
- Magand, O. Recherche et Définition des Signatures Géochimiques (Métaux Lourds et Lanthanides) des Sources Terrigènes du Lagon Sud-Ouest de Nouvelle-Calédonie. Master’s Thesis, University Aix-Marseille II, Marseille, France, 1999. [Google Scholar]
- Fernandez, J.-M.; Moreton, B.; Fichez, R.; Breau, L.; Magand, O.; Badie, C. Advantages of combining 210Pb and geochemical signature determinations in sediment record studies, application to coral reef lagoon environments. In Environmental Changes and Radioactive Tracers, IRD ed.; Fernandez, J.-M., Fichez, R., Eds.; Institut de Recherche pour le Développement (IRD): Paris, France, 2002; pp. 187–200. [Google Scholar]
- Moreton, B.M.; Fernandez, J.-M.; Dolbecq, M.B.D. Development of a field preconcentration/elution unit for routine determination of dissolved metal concentrations by ICP-OES in marine waters: Application for monitoring of the New Caledonia lagoon. Geostand. Geoanal. Res. 2009, 33, 205–218. [Google Scholar] [CrossRef]
- Ouillon, S.; Douillet, P.; Lefebvre, J.P.; Le Gendre, R.; Jouon, A.; Bonneton, P.; Fernandez, J.M.; Chevillon, C.; Magand, O.; Lefèvre, J.; et al. Circulation and suspended sediment transport in a coral reef lagoon: The southwest lagoon of New Caledonia. Mar. Poll. Bull. 2010, 61, 269–296. [Google Scholar] [CrossRef] [PubMed]
- Fichez, R.; Chifflet, S.; Douillet, P.; Gérard, P.; Gutierrez, F.; Jouon, A.; Ouillon, S.; Grenz, C. Biogeochemical typology and temporal variability of lagoon waters in a coral reef ecosystem subject to terrigeneous and anthropogenic inputs (New Caledonia). Mar. Poll. Bull. 2010, 61, 309–322. [Google Scholar] [CrossRef] [PubMed]
- Douillet, P. Tidal dynamics of the south-west lagoon of New Caledonia: Observations and 2D numerical modelling. Oceanol. Acta 1998, 21, 69–79. [Google Scholar] [CrossRef]
- Douillet, P.; Ouillon, S.; Cordier, E. A numerical model for fine suspended sediment transport in the south-west lagoon of New-Caledonia. Coral Reefs 2001, 20, 361–372. [Google Scholar] [CrossRef]
- Jouon, A.; Lefebvre, J.P.; Douillet, P.; Ouillon, S.; Schmied, L. Wind wave measurements and modelling in a fetch-limited semi-enclosed lagoon. Coast. Eng. 2009, 56, 599–608. [Google Scholar] [CrossRef]
- Andréfouët, S.; Cabioch, G.; Flamand, B.; Pelletier, B. A reappraisal of the diversity of geomorphological and genetic processes of New Caledonian coral reefs: A synthesis from optical remote sensing, coring and acoustic multibeam observations. Coral Reefs 2009, 28, 691–707. [Google Scholar] [CrossRef]
- Lillie, A.R.; Brothers, R.N. The geology of New-Caledonia. N. Zeal. J. Geol. Geophys. 1970, 13, 159–167. [Google Scholar] [CrossRef]
- Paris, J.P. Les Ressources Minérales de Nouvelle-Calédonie; Mémoire 113, Bureau de Recherches Géologiques et Minières (BRGM): Orléans, France, 1981. [Google Scholar]
- Antheaume, B. Chronique de l’Atlas de la Nouvelle-Calédonie, un bilan méthodologique et critique. Cahiers ORSTOM. Série Schum 1981, 18, 389–398. [Google Scholar]
- Paris, J.P. Gîtes minéraux et substances utiles. In Atlas de Nouvelle-Calédonie; Sautter, G., Ed.; ORSTOM: Paris, France, 1981. [Google Scholar]
- Perrier, N.; Ambrosi, J.P.; Colin, F.; Gilkes, R.J. Biogeochemistry of a regolith: The new Caledonian Koniambo ultramafic massif. J. Geochem. Explor. 2006, 88, 54–58. [Google Scholar] [CrossRef]
- Dublet, G.; Fandeur, D.; Juillot, F.; Morin, G.; Ambrosi, J.P.; Fritsch, E.; Brown, G.E., Jr. Ni speciation in a New Caledonian lateritic regolith: A quantitative X-ray absorption spectroscopy investigation. Geochim. Cosmochim. Acta 2012, 95, 119–133. [Google Scholar] [CrossRef]
- Dublet, G.; Juillot, F.; Morin, G.; Fritsch, E.; Noel, V.; Brest, J.; Brown, G.E., Jr. XAS evidence for Ni sequestration by siderite in a latéritic Ni-deposit from New Caledonia. Am. Miner. 2014, 99, 225–234. [Google Scholar] [CrossRef]
- Dublet, G.; Juillot, F.; Morin, G.; Fritsch, E.; Fandeur, D.; Brown, G.E., Jr. Goethite aging explains Ni depletion in upper units of ultramafic lateritic ores. Geoch. Cosmoch. Acta 2015, 160, 1–15. [Google Scholar] [CrossRef]
- Trescases, J.J. L’évolution Geochimique Supergène des Roches Ultrabasiques en Zone Tropicale. Formation des Gisements Nickélifères de Nouvelle-Calédonie. Ph.D. Thesis, University Louis Pasteur, Strasbourg, France, 1973. [Google Scholar]
- Pesin, E.; Blaize, S.; Lacoste, D. Atlas Climatique de la Nouvelle Calédonie; Météo France: Nouméa, New Caledonia, 1995. [Google Scholar]
- Baltzer, F.; Trescases, J.J. Erosion, transport et sédimentation liés aux cyclones tropicaux dans les massifs d’ultrabasites de Nouvelle-Calédonie. Cahiers ORSTOM Série Géologie III 1973, 2, 221–244. [Google Scholar]
- Dugas, F.; Debenay, J.P. Carte Sédimentologique et carte Annexe du Lagon de Nouvelle Calédonie au 1/50000—Mont Dore, Tontouta, Prony, Nouméa; Notices explicatives n° 76, 86, 91 and 95; ORSTOM: Paris, France, 1982. [Google Scholar]
- Heussner, S.; Ratti, C.; Carbonne, J. The PPS3 times series sediment trap and the trap sample processing techniques used during the ECOMARGE experiment. Cont. Shelf Res. 1990, 10, 943–958. [Google Scholar] [CrossRef]
- Jouon, A.; Ouillon, S.; Douillet, P.; Lefebvre, J.P.; Fernandez, J.-M.; Mari, X.; Froidefond, J.M. Spatio-temporal variability in suspended particulate matter concentration and the role of aggregation on size distribution in a coral reef lagoon. Mar. Geol. 2008, 256, 36–48. [Google Scholar] [CrossRef]
- Lefebvre, J.-P.; Ouillon, S.; Vinh, V.D.; Arfi, R.; Panche, J.-Y.; Mari, X.; Thuoc, C.V.; Torreton, J.P. Seasonal variability of cohesive sediment aggregation in the Bach Dang-Cam Estuary, Haiphong (Vietnam). Geo-Mar. Lett. 2012, 32, 103–121. [Google Scholar] [CrossRef]
- Mobley, C.D. Light and Water Radiative Transfer in Natural Water; Academic Press: San Diego, CA, USA, 1994. [Google Scholar]
- Pinet, S.; Martinez, J.-M.; Ouillon, S.; Lartiges, B.; Villar, R.E. Variability of apparent and inherent optical properties of sediment-laden waters in large river basins—Lessons from in situ measurements and bio-optical modeling. Opt. Express 2017, 25, A283–A310. [Google Scholar] [CrossRef] [PubMed]
- Cliff, G.; Lorimer, G.W. The quantitative analysis of thin specimens. J. Microsc. 1975, 103, 203–207. [Google Scholar] [CrossRef]
- Manceau, A.; Calas, G. heterogneous distribution of nickel in hydrous silicates from New Caledonia ore deposits. Am. Miner. 1985, 70, 549–558. [Google Scholar]
- Pelletier, B. Serpentines in Nickel Silicate Ore from New-Caledonia. In Proceedings of the Publications-Australasian Institute of Mining and Metallurgy, Kalgoolie, Australia, 27–29 November 1996; Volume 27–29, pp. 197–206. [Google Scholar]
- Wartel, M.; Skirer, M.; Auger, T.; Boughriet, A. Interaction of manganese II with carbonates in sea water: Assessment of the solubility product of MnCO3 and Mn distribution coefficient between the liquid phase and CaCO3 particles. Mar. Chem. 1990, 29, 99–117. [Google Scholar] [CrossRef]
- Jouon, A.; Douillet, P.; Ouillon, S.; Fraunié, P. Calculations of hydrodynamic time parameters in a semi-opened coastal zone using a 3D hydrodynamic model. Cont. Shelf Res. 2006, 26, 1395–1415. [Google Scholar] [CrossRef]
- Clavier, J.; Chardy, P.; Chevillon, C. Sedimentation of particulate matter in the South-west lagoon of New Caledonia: Spatial and Temporal Patterns. Est. Coast. Shelf Sci. 1995, 40, 281–294. [Google Scholar] [CrossRef]
- Baltzer, F. Géodynamique de la Sédimentation et Diagénèse Précoce en Domaine Ultrabasique, Nouvelle-Calédonie; ORSTOM: Paris, France, 1982. [Google Scholar]
- Odin, G.S. Green Marine Clays; Elsevier: Amsterdam, The Netherlands, 1988. [Google Scholar]
- Michalopoulos, P.; Aller, R.C. Rapid clay mineral formation in Amazon delta sediments: Reverse weathering and oceanic elemental cycles. Science 1995, 270, 614–617. [Google Scholar] [CrossRef]


| Site | Longitude | Latitude | Depth (m) |
|---|---|---|---|
| Boulari Bay | E 166°32.126 | S 22°15.355 | 13.2 |
| Dumbéa Bay | E 166°23.243 | S 22°12.291 | 13.0 |
| St Vincent Bay | E 166°06.635 | S 22°00.561 | 12.8 |
| Metal | Reference Material SLEW-3 (µg·L–1) | LQ (µg·L–1) | |
|---|---|---|---|
| Analysed (n = 1) | Certified | ||
| Fe | 0.32 | 0.57 ± 0.06 | 0.068 |
| Mn | 1.92 | 1.61 ± 0.22 | 0.028 |
| Ni | 1.17 | 1.23 ± 0.07 | 0.022 |
| Reference Material MESS-3 (mg·kg−1·dw) | ||
|---|---|---|
| Metal | Analyzed | Certified |
| Al | 90,053 | 85,900 ± 2300 |
| Ca | 13,746 | 14,700 ± 600 |
| Co | 15.2 | 14.4 ± 2.0 |
| Cr | 97 | 105 ± 4 |
| Fe | 37,815 | 32,400 ± 1200 |
| Mg | 16,905 | 16 |
| Mn | 308 | 324 ± 12 |
| Ni | 40.6 | 46.9 ± 2.2 |
| Si | 232,765 | 270,000 * |
| Date | Boulari Bay | Dumbéa Bay | St Vincent Bay |
|---|---|---|---|
| 21–22 November | 2.21 | 1.29 | 4.83 |
| 23–24 November | 1.72 | 2.16 | 2.53 |
| 25–26 November | 3.16 | 2.84 | 3.07 |
| 27–28 November | 3.03 | 3.19 | 1.96 |
| 29–30 November | 1.74 | 2.26 | 1.51 |
| 1–2 December | 2.12 | 2.78 | 2.52 |
| 3–4 December | 2.79 | 1.95 | 5.15 |
| 5–6 December | 2.27 | 2.09 | 3.32 |
| 7–8 December | 2.64 | 2.20 | 5.17 |
| 9–10 December | 2.35 | 1.90 | 5.50 |
| 11–12 December | 2.51 | 2.30 | 5.55 |
| 13–14 December | 2.40 | 1.71 | 4.12 |
| Site | Statistics | Temperature (°C) | Salinity (‰) | Turbidity (FTU) |
|---|---|---|---|---|
| Boulari Bay | Mean ± Std Dev. Min.–Max. | 26.0 ± 0.6 25.3–27.5 | 35.9 ± 0.3 35.4–36.9 | 2.1 ± 1.1 0.5–7.6 |
| Dumbéa Bay | Mean ± Std Dev. Min.–Max. | 26.5 ± 0.5 24.8–27.6 | 36.1 ± 0.1 35.3–36.6 | 2.0 ± 0.9 0.5–5.5 |
| St Vincent Bay | Mean ± Std Dev. Min.–Max. | 26.9 ± 1.0 25.3–28.8 | 36.1 ± 0.1 35.2–36.5 | 2.8 ± 0.8 1.4–7.8 |
| Sampling Date | Boulari Bay | Dumbea Bay | StVincent Bay | ||||||
|---|---|---|---|---|---|---|---|---|---|
| Fe (µg·L−1) | Mn (µg·L−1) | Ni (µg·L−1) | Fe (µg·L−1) | Mn (µg·L−1) | Ni (µg·L−1) | Fe (µg·L−1) | Mn (µg·L−1) | Ni (µg·L−1) | |
| 22 November 2005 | 0.58 | 0.66 | 2.00 | 0.73 | 0.56 | 2.87 | 1.09 | 0.73 | 7.10 |
| 24 November 2005 | 1.19 | 0.40 | 3.92 | 0.74 | 0.59 | 1.30 | 1.33 | 0.80 | 5.49 |
| 26 November 2005 | 0.70 | 0.48 | 2.11 | 1.41 | 0.46 | 2.87 | 1.43 | 1.07 | 4.86 |
| 28 November 2005 | 0.24 | 0.45 | 1.17 | 0.64 | 0.49 | 3.84 | 1.59 | 1.24 | 5.11 |
| 30 November 2005 | 1.38 | 0.35 | 1.60 | 1.07 | 0.57 | 4.52 | 2.51 | 0.96 | 1.95 |
| 2 December 2005 | 0.69 | 0.33 | 1.06 | 1.07 | 0.55 | 4.04 | 1.87 | 0.96 | 2.45 |
| 6 December 2005 | 0.32 | 0.45 | 1.31 | 0.77 | 0.55 | 3.65 | 1.43 | 0.67 | 3.23 |
| 8 December 2005 | 0.55 | 0.60 | 1.70 | 1.30 | 0.58 | 3.35 | 2.65 | 1.06 | 4.92 |
| 10 December 2005 | 0.40 | 0.53 | 1.18 | 0.91 | 0.57 | 2.77 | 1.99 | 0.88 | 4.71 |
| 12 December 2005 | 0.30 | 0.46 | 0.95 | 0.23 | 0.73 | 1.99 | 0.71 | 0.40 | 6.50 |
| 14 December 2005 | 0.28 | 0.69 | 1.24 | 0.30 | 0.57 | 1.78 | 0.95 | 0.61 | 4.87 |
| Min | 0.24 | 0.33 | 0.95 | 0.23 | 0.46 | 1.30 | 0.71 | 0.40 | 1.95 |
| Max | 1.38 | 0.69 | 3.92 | 1.41 | 0.73 | 4.52 | 2.65 | 1.24 | 7.10 |
| Location | Fe (µg·L−1) | Mn (µg·L−1) | Ni (µg·L−1) |
|---|---|---|---|
| Bays (n = 288) | 0.241 ± 0.444 | 4.565 ± 9.802 | 2.904 ± 4.700 |
| Intermediate (n = 315) | 0.123 ± 0.095 | 0.422 ± 0.659 | 0.322 ± 0.423 |
| Reef (n = 362) | 0.058 ± 0.061 | 0.103 ± 0.095 | 0.115 ± 0.100 |
| Concentration (mg kg–1) | Al | Ca | Co | Cr | Fe | Mg | Mn | Ni | Si | |
|---|---|---|---|---|---|---|---|---|---|---|
| Boulari bay | Min | 1930 | 12,990 | 13 | 208 | 690 | 15,874 | 87 | 195 | 4750 |
| Max | 11,520 | 53,710 | 76 | 1209 | 51,820 | 29,169 | 568 | 1157 | 31,850 | |
| Dumbéa bay | Min | 6740 | 33,060 | 24 | 306 | 17,420 | 17,672 | 183 | 473 | 25,830 |
| Max | 22,740 | 119,600 | 78 | 1025 | 58,190 | 32,064 | 765 | 1332 | 86,590 | |
| StVincent bay | Min | 11,220 | 38,360 | 105 | 1204 | 64,670 | 43,684 | 844 | 2033 | 63,780 |
| Max | 18,440 | 73,950 | 164 | 1856 | 97,900 | 51,051 | 1459 | 3012 | 102,940 | |
| Boulari Bay | |||||||||
| Ca | Mg | Fe | Co | Cr | Mn | Ni | Al | Si | |
| Ca | 1 | 0.236 | 0.994 | 0.989 | 0.987 | 0.988 | 0.988 | 0.995 | 0.993 |
| Mg | 1 | 0.221 | 0.223 | 0.217 | 0.248 | 0.209 | 0.233 | 0.212 | |
| Fe | 1 | 0.998 | 0.994 | 0.995 | 0.993 | 0.999 | 0.993 | ||
| Co | 1 | 0.996 | 0.998 | 0.994 | 0.995 | 0.986 | |||
| Cr | 1 | 0.992 | 0.992 | 0.993 | 0.983 | ||||
| Mn | 1 | 0.991 | 0.994 | 0.984 | |||||
| Ni | 1 | 0.991 | 0.982 | ||||||
| Al | 1 | 0.996 | |||||||
| Si | 1 | ||||||||
| (a) | |||||||||
| Dumbéa Bay | |||||||||
| Ca | Mg | Fe | Co | Cr | Mn | Ni | Al | Si | |
| Ca | 1 | 0.688 | 0.702 | 0.701 | 0.604 | 0.826 | 0.655 | 0.772 | 0.734 |
| Mg | 1 | 0.484 | 0.468 | 0.419 | 0.497 | 0.461 | 0.514 | 0.516 | |
| Fe | 1 | 0.998 | 0.985 | 0.946 | 0.988 | 0.992 | 0.997 | ||
| Co | 1 | 0.986 | 0.948 | 0.990 | 0.989 | 0.994 | |||
| Cr | 1 | 0.888 | 0.986 | 0.962 | 0.977 | ||||
| Mn | 1 | 0.912 | 0.962 | 0.945 | |||||
| Ni | 1 | 0.971 | 0.988 | ||||||
| Al | 1 | 0.995 | |||||||
| Si | 1 | ||||||||
| (b) | |||||||||
| St Vincent Bay | |||||||||
| Ca | Mg | Fe | Co | Cr | Mn | Ni | Al | Si | |
| Ca | 1 | 0.438 | 0.542 | 0.448 | 0.483 | 0.450 | 0.634 | 0.725 | 0.552 |
| Mg | 1 | 0.953 | 0.958 | 0.961 | 0.808 | 0.813 | 0.878 | 0.920 | |
| Fe | 1 | 0.986 | 0.963 | 0.869 | 0.905 | 0.954 | 0.963 | ||
| Co | 1 | 0.941 | 0.903 | 0.866 | 0.904 | 0.949 | |||
| Cr | 1 | 0.754 | 0.853 | 0.922 | 0.932 | ||||
| Mn | 1 | 0.833 | 0.796 | 0.806 | |||||
| Ni | 1 | 0.908 | 0.803 | ||||||
| Al | 1 | 0.948 | |||||||
| Si | 1 | ||||||||
| (c) | |||||||||
| Concentration (mg·kg–1) | Al | Ca | Co | Cr | Fe | Mg | Mn | Ni | Si |
|---|---|---|---|---|---|---|---|---|---|
| Mean | 26,566 | 117 | 437 | 19,677 | 586,760 | 2560 | 3887 | 5760 | 6920 |
| StDev | 3170 | 69 | 21 | 1309 | 46,928 | 381 | 221 | 939 | 1803 |
| Sample | SiO2 (%) | Al2O3 | Fe2O3 | MgO | Cr2O3 | TiO2 | CaO | Na2O | K2O | NiO |
|---|---|---|---|---|---|---|---|---|---|---|
| B7(A5) | 42.22 | 7.11 | 6.93 | 4.82 | 0.21 | 0.00 | 1.77 | 0.17 | 0.44 | 36.33 |
| B8(A1) | 5.77 | 1.95 | 86.84 | 0.58 | 0.98 | 0.00 | 1.75 | 0.00 | 0.00 | 2.14 |
| B8(A5) | 51.58 | 0.12 | 4.95 | 39.31 | 0.29 | 0.00 | 2.33 | 0.42 | 0.25 | 0.7 |
| C6(A17) | 48.57 | 7.4 | 16.11 | 25.49 | 0.49 | 0.00 | 0.84 | 0.13 | 0.26 | 0.72 |
| Goethite * | 4.86 | 3.62 | 88.53 | 1.69 | 0.47 | 0.00 | 0.00 | 0.00 | 0.00 | 0.83 |
| Lizardite ** | 42.20 | 0.15 | 2.57 | 35.00 | 0.00 | 0.00 | 0.00 | 0.00 | 0.00 | 4.50 |
| Antigorite * | 49.84 | 0.26 | 2.04 | 46.65 | 0.64 | 0.00 | 0.13 | 0.00 | 0.00 | 0.45 |
| Talc * | 66.39 | 0.00 | 0.00 | 32.98 | 0.00 | 0.00 | 0.63 | 0.00 | 0.00 | 0.00 |
| CryptoNont * | 51.58 | 8.42 | 24.21 | 12.63 | 0.00 | 0.00 | 0.00 | 0.00 | 0.00 | 3.16 |
| CryptoSapo * | 50.53 | 10.53 | 13.68 | 25.26 | 0.00 | 0.00 | 0.00 | 0.00 | 0.00 | 0.00 |
| Nontronite * | 55.67 | 4.26 | 33.02 | 3.65 | 0.23 | 0.00 | 0.26 | 0.00 | 0.00 | 2.91 |
| Smectite * | 55.59 | 3.87 | 33.96 | 6.58 | 0.00 | 0.00 | 0.00 | 0.00 | 0.00 | 0.00 |
| Bay | Trade Wind Regime (5–10 Knots) | Light West Wind Regime (<5 Knots) | Coastal Breeze Regime (<5 Knots) |
|---|---|---|---|
| Boulari Bay | Off-shore water inputs, resuspension of SPM transported eastwards and blocked, settling in-shore | Drainage of blocked coastal waters toward off-shore (westward), SPM aggregation and sedimentation | Settling of a benthic turbid layer and westwards transport of SPM: increase in metal fluxes (dissolved and particulate) |
| Dumbéa Bay | Resuspension of SPM rich in carbonates debris, followed by sedimentation | Off-shore water inputs low both in SPM and metal content | Sedimentation of SPM and reduction in metal fluxes (dissolved and particulate) |
| St Vincent Bay | Intense resuspension of SPM by the tide and winds over shallow water, then settling and high particulate metal flux | Sedimentation of a small fraction of SPM, reduction in metal fluxes | Important persistence of resuspension of SPM: high metal fluxes (dissolved and particulate) |
© 2017 by the authors. Licensee MDPI, Basel, Switzerland. This article is an open access article distributed under the terms and conditions of the Creative Commons Attribution (CC BY) license (http://creativecommons.org/licenses/by/4.0/).
Share and Cite
Fernandez, J.-M.; Meunier, J.-D.; Ouillon, S.; Moreton, B.; Douillet, P.; Grauby, O. Dynamics of Suspended Sediments during a Dry Season and Their Consequences on Metal Transportation in a Coral Reef Lagoon Impacted by Mining Activities, New Caledonia. Water 2017, 9, 338. https://doi.org/10.3390/w9050338
Fernandez J-M, Meunier J-D, Ouillon S, Moreton B, Douillet P, Grauby O. Dynamics of Suspended Sediments during a Dry Season and Their Consequences on Metal Transportation in a Coral Reef Lagoon Impacted by Mining Activities, New Caledonia. Water. 2017; 9(5):338. https://doi.org/10.3390/w9050338
Chicago/Turabian StyleFernandez, Jean-Michel, Jean-Dominique Meunier, Sylvain Ouillon, Benjamin Moreton, Pascal Douillet, and Olivier Grauby. 2017. "Dynamics of Suspended Sediments during a Dry Season and Their Consequences on Metal Transportation in a Coral Reef Lagoon Impacted by Mining Activities, New Caledonia" Water 9, no. 5: 338. https://doi.org/10.3390/w9050338