
Effect of Sewage and Industrial Effluents on Bacterial and Archaeal Communities of Creek Sediments in the Taihu Basin

1
Division of Groundwater and Soil Environment, School of Environment, Tsinghua University, Beijing 100084, China
2
State Key Laboratory of Environmental Criteria and Risk Assessment, Chinese Research Academy of Environmental Science, Beijing 100012, China
3
Institute of Wetland Research, Chinese Academy of Forestry, Beijing 100091, China
*
Author to whom correspondence should be addressed.
Water 2017, 9(6), 373; https://doi.org/10.3390/w9060373
Submission received: 9 March 2017
/
Revised: 5 May 2017
/
Accepted: 16 May 2017
/
Published: 25 May 2017
Abstract
:Different characteristics of wastewater have different effects on the diversity and abundance of bacteria and archaea in rivers. There are many creeks around Taihu Lake, and they receive a large volume of industrial wastewater and domestic sewage, which is discharged into these creeks, and finally into Taihu Lake. The present study determined Illumina reads (16S rRNA gene amplicons) to analyze the effects of industrial wastewater and domestic sewage on the bacterial and archaeal communities at the different sampling sites along two creeks. The bacterial and archaeal diversity of the creek receiving sewage was higher than that of the creek receiving industrial waste. Proteobacteria dominated the microbial communities of all samples in both creeks. Betaproteobacteria dominated in the sewage creek, and its abundance declined along the creek. Certain pollutant-resistant classes were more abundant at the site near to the pollution source of the industry creek (e.g., Epsilonproteobacteria and Flavobacteria). Halobacteria belonging to the phylum Euryarchaeota was the dominant archaea at all sites in both creeks, while Methanobacteria was more abundant in the industry creek. The bacterial community was more affected by the distance between the sampling site and the pollutant source than the archaeal community, indicating that bacterial diversity and abundance could be a good index to distinguish domestic and industrial pollution, especially when the main pollution sources are difficult to identify.
1. Introduction
Microbes are an important part of the ecological system, and the population structure of microorganisms changes with variations in the environment. Previous studies of microbes in the environment have mainly been conducted using culture-based technique, but most microorganisms cannot be purified and separated in the laboratory, making it difficult to understand the differences in the microbial population structure under different habitats [1]. With the rapid development of molecular biotechnology, PLFA (phospholipid fatty acids), spectrogram analysis of phospholipid fatty acids [2,3], the Biolog method [4], polymerase chain reaction denaturing gradient gel electrophoresis(PCR-DGGE) [5,6], and high-throughput sequencing [7], have been widely applied to investigate microbial communities. Because of its high efficiency and accuracy, as well as its other characteristics [8], high-throughput sequencing has been widely used in the study of microbial communities in soil [9], freshwater ecosystems [10], and marine ecosystems [11]. Some studies have shown that the microbial community changed in soil polluted by heavy metals [12]. Moreover, changes in the microbial community were reported in tropical river sediment with the duration of pollution [13]. The river ecological system is an important component of the surface-water environment, however, economic development has led to increased amounts of pollutants being discharged into rivers [14]. Such pollutants mainly originate from synthetic nitrogenous fertilizers, animal manure, sewage, and industrial wastewater [15]. At present, constructed wetland systems are one of the main technologies for pollution control along rivers, and many studies have focused on the microbial communities of these systems [16,17,18]. Because of the high technical requirements and large areas that they require, constructed wetland systems cannot be widely applied to controlling river pollution. Indeed, rivers are fed by many small streams in their basins, and these are often impacted by large numbers of residents and factories along their banks. The wastewater produced by these local residents and factories is directly discharged into creeks, and the concentrations of contaminants decrease as they travel through the creeks because of retention and self-purification. However, changes in the microbial population structures of creeks receiving different pollutant sources are not well understood. Zhihugang River, which is located in the Taihu Lake basin, has a total length of 20.1 km, an average width at the bottom of 30 to 40 m, an average velocity of 0.1 m/s, and an average flow rate of 10 m3/s. In 2007, the population around Zhihugang River was 399,000, including an urban population of 151,000 people, and there were a total of 2476 factories around the river [19] The industrial facilities around Zhihugang River primarily include the chemical industry, printing and dyeing, electroplating, food, and paper factories. In recent years, Chinese researchers have studied the pollution sources [20,21], nutrient inputs [22], and the distribution of heavy metals in the sediments of rivers flowing into Taihu Lake [23]. Additionally, some researchers have focused on the macrobenthos, phytoplankton [24], and zooplankton [25,26] populations of Taihu Lake. However, no studies have investigated the microbial population structures of the creeks around Zhihugang River, or changes in the microbial population structure of creeks caused by different pollution sources.
To explore the differences in the microbial communities caused by the sewage and industrial effluents, two creeks located around Zhihugang River were investigated in this study. Samples were collected from 21 to 25 September, 2014, and the bacterial and archaeal community structures were analyzed by Illumina Miseq.
2. Materials and Methods
2.1. Study Area
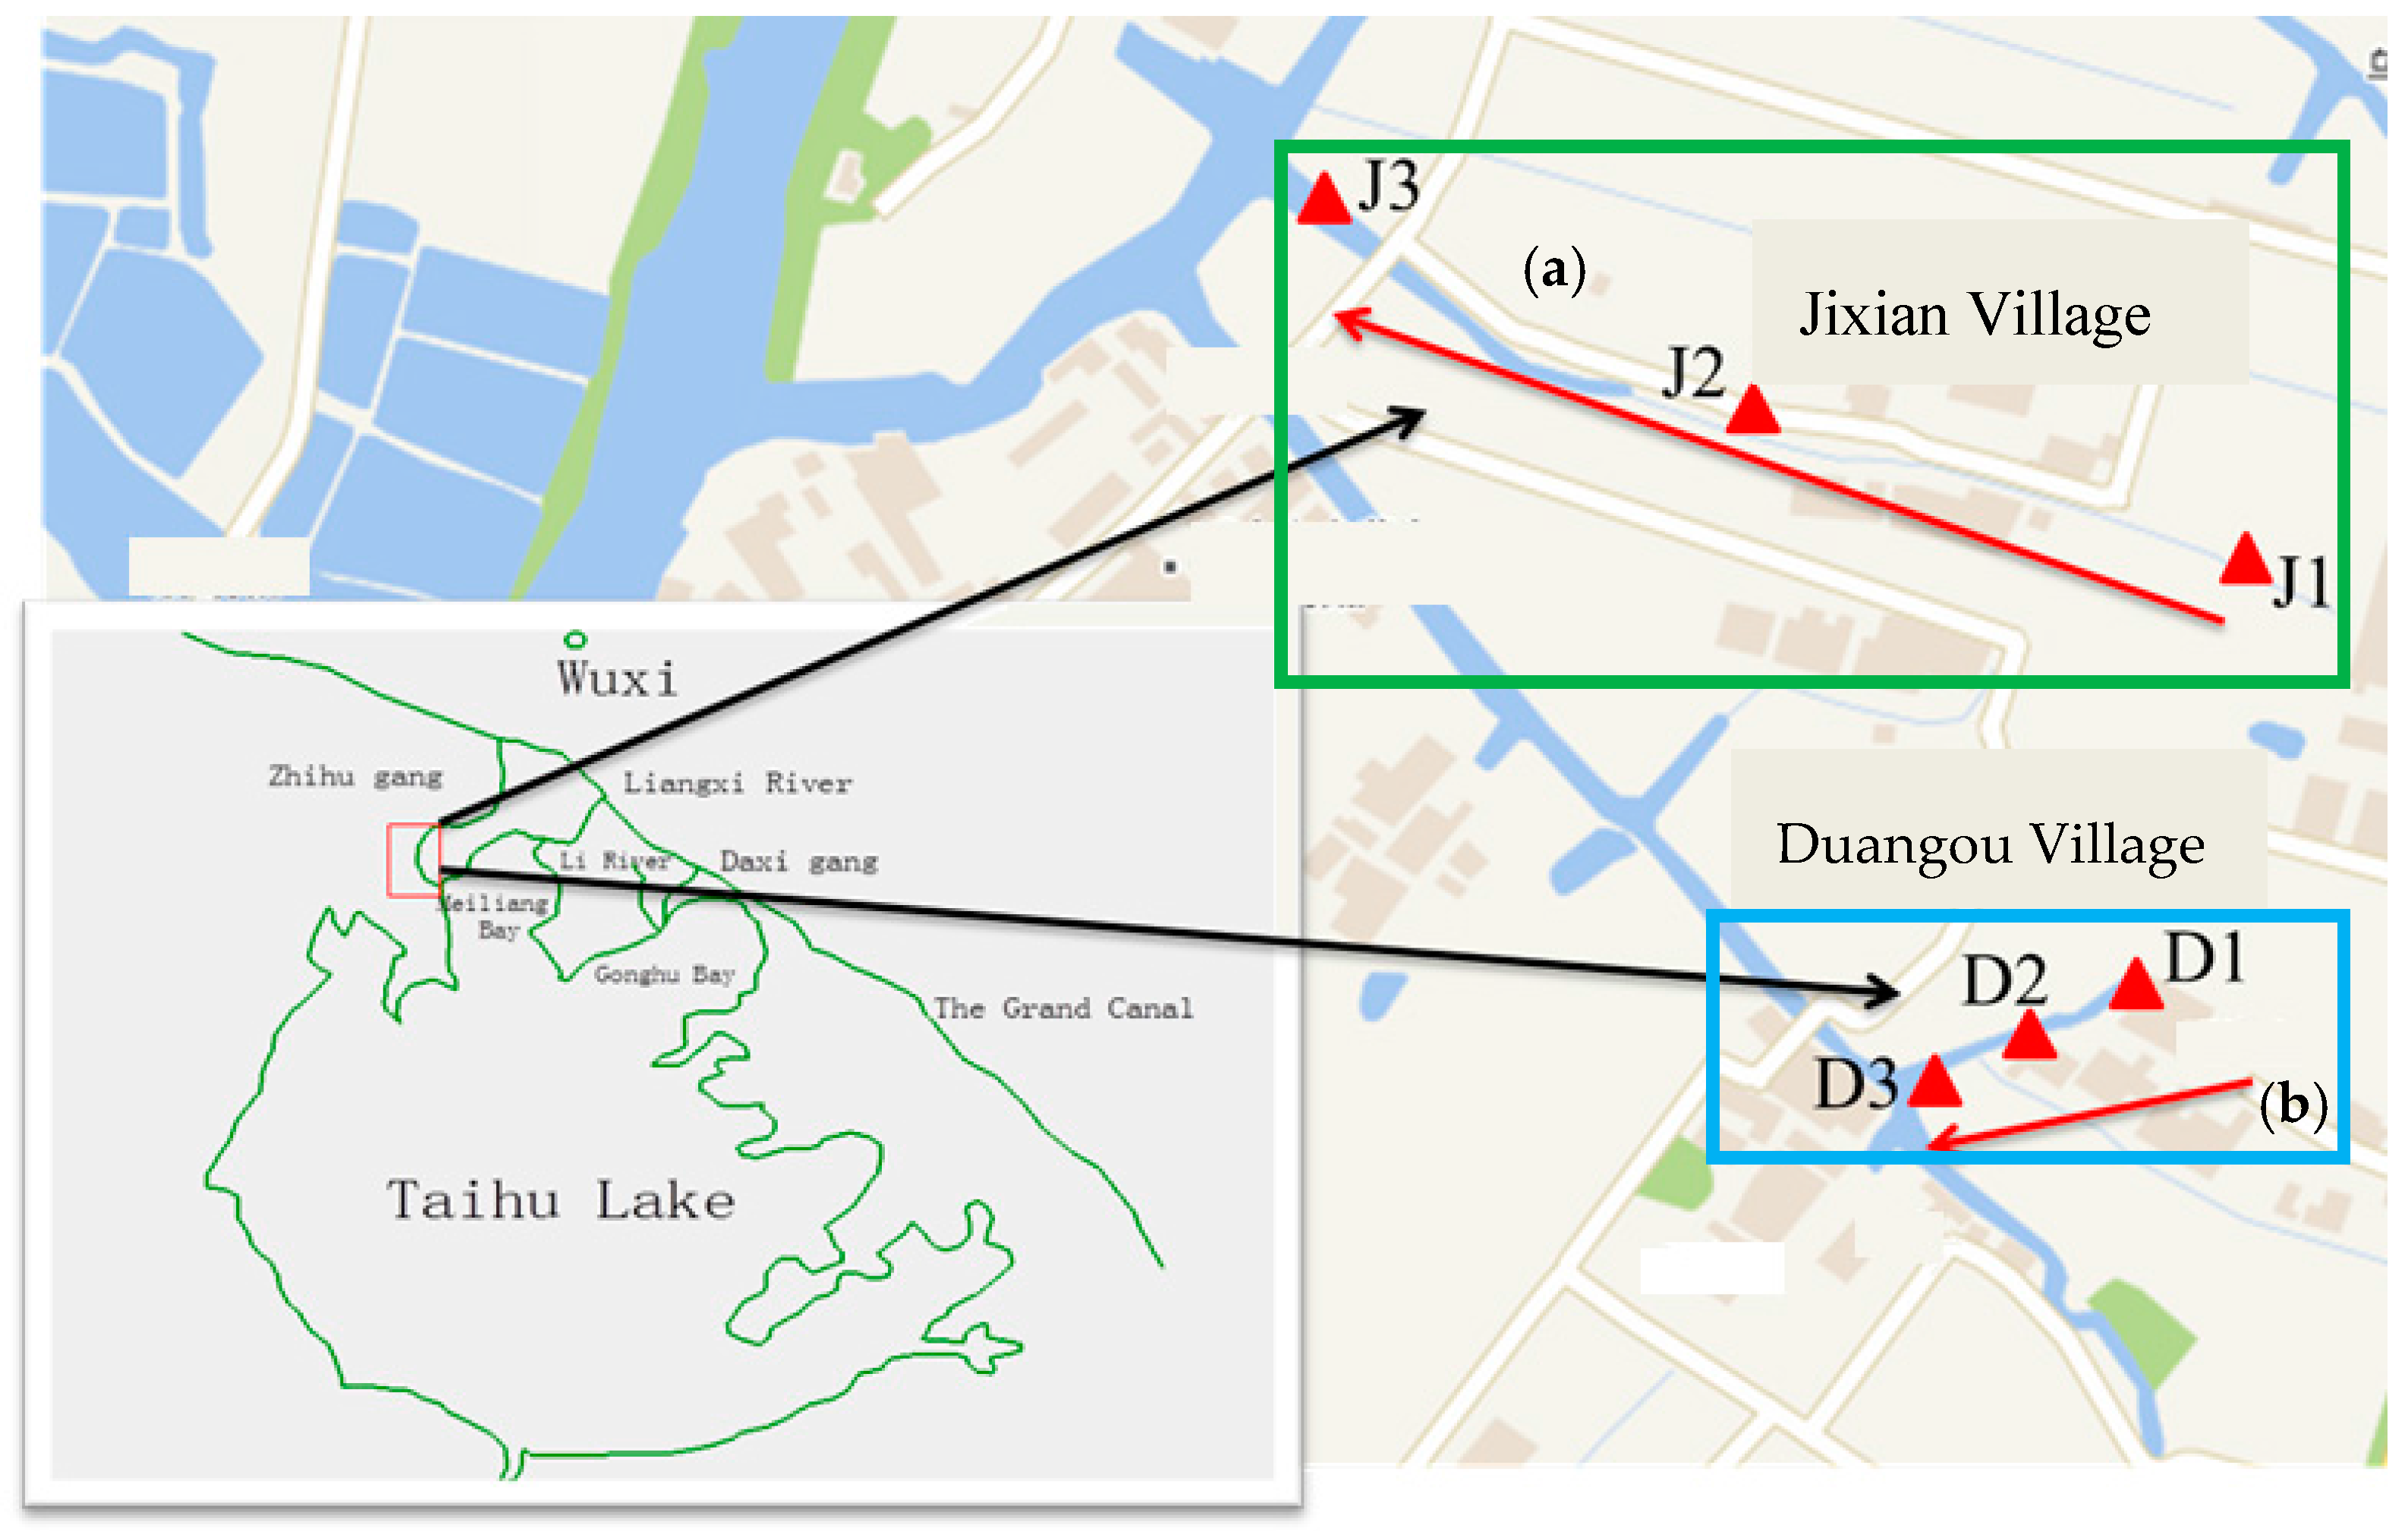
A creek located in Duangou and another in Jixian were investigated. The creek in the Duangou village is mainly polluted by domestic sewage (hereafter referred to as the sewage creek), while the one in Jixian is primarily polluted by industrial effluents (hereafter referred to as the industry creek) from a machinery factory and a chemical fiber factory. The machinery factory is primarily engaged in the production and processing of all kinds of mechanical parts. The chemical fiber factory is mainly engaged in the production of high-emulation chemical fiber. The locations of the two creeks are shown in Figure 1. Water with pollutants flows from each pollutant source to D1/J1, D2/J2, and then D3/J3. The distances between the pollutant source of domestic sewage and D1, D2, and D3 were 10 m, 85 m, and 160 m, respectively. The distances between the industrial pollution sources and J1, J2, and J3 were 10 m, 160 m, and 560 m, respectively. Hydrological data of the two creeks are shown in Table 1.
2.2. Sample Collection and Measurement
About 1 L of overlying water was collected using an organic glass hydrophore, and the temperature (T), pH, and dissolved oxygen (DO) were determined directly in situ using a multi-parameter water quality monitoring instrument (Mettler Toledo, SevenGo Duo pro, SG68, SC, USA). All sensors were calibrated before taking measurements. Ammonium (NH4+-N) was measured with Nessler’s reagent, while nitrate nitrogen (NO3−-N) and total nitrogen (TN) were determined by ultraviolet spectrophotometry and the alkaline potassium persulfate oxidation-UV spectrophotometric method, respectively. Total Organic Carbon (TOC) concentrations were determined using a TOC-V Analyzer (Shimadzu-TNM-1, Kyoto, Japan), with an estimated detection limit of 0.05 μg/L. Chemical oxygen demand (COD) was measured using the alkaline potassium permanganate method, while TP was measured using the potassium persulfate oxidation method. About 500 g of surface sediment samples were collected from all sites using a surface sediment sampler (Van Veen, HYDRO-BIOS, Kiel, Germany), and were then stored at −70 °C until use. The concentrations of Cr, Ni, Cu, Zn, As, Cd, and Pb in sediments were measured as previously described [27]. Water transparency (SD) was determined using a Secchi disk (diameter = 20 cm). The Chla was determined using the standard methods [28]. Chloride (Cl−) was measured by silver nitrate titration. Sulfate (SO4−) was measured using the spectrophotometric method [29].
2.3. DNA Extraction and Illumina MiSeq Sequencing
The DNA was extracted from 0.5 g samples of wet sediment using a Power soil DNA isolation kit according to the manufacturer’s protocols (Mo Bio, Carlsbad, CA, USA). The bacterial and archaeal 16S rRNA genes of all samples were amplified by barcoded primers to construct a community library by high-throughput pyrosequencing. The primers and amplification conditions are shown in Table 2. PCR amplification was conducted using an ABI9700 thermocycler (ABI, Foster City, CA, USA) with TransStart Fastpfu DNA polymerase (TransGen, Beijing, China). Technically triplicate positive PCR products were purified with an AxyPrep DNA Gel Extraction Kit (Axygen, Tewksbury, MA, USA). DNA concentrations of the purified PCR products were measured using QuantiFluor™-ST (Promega, Madison, WI, USA). The Illumina Miseq platform was used to sequence the 16S rRNA gene fragments of the bacterial and archaeal communities at Personalbio (Beijing Haocheng Mingtai Technology Co. LTD, Beijing, China).
2.4. Sequencing Data Processing and Statistical Analysis
All raw paired-end reads of samples were merged using Fast length adjustment of short reads FLASH [32], and the low quality reads were removed by Trimmomatic [33]. After strict filtration, the remaining 16S rRNA sequences were clustered into operational taxonomic units (OTUs) by setting 97% similarity, after which classification of the taxonomic groups was assigned using the Ribosomal Database Project (RDP) classifier Bayesian Algorithm via the Silva database with a confidence threshold of 0.7 [34,35,36]. The diversity statistics, including library coverage, Chao 1 value, Shannon index, and abundance-based coverage estimator (ace), were obtained for each sample after OTUs had been clustered using Mothur [37]. Based on the Bray–Curtis distances, principal coordinate analysis (PCoA), nonmetric multidimensional scaling (NMDS), and hierarchical clustering were determined and plotted using the R program [38]. Hierarchical cluster analysis was performed using the squared Euclidean distance with Ward’s method to evaluate the pollution intensity of nutrients and heavy metals in the two creeks. Because the longest detrended correspondence analysis (DCA) eigenvalues of bacteria and archaea (0.360 and 0.388), respectively were <3, the correlations between environmental factors and microbial OTUs composition were analyzed by redundancy analysis (RDA) using CANOCO 4.5 [39]. Monte Carlo permutations were used to construct the models of the microbe-environment relationships. All reads have been archived at the NCBI Sequence Read Archive (SRA) under accession number SRR5246806 for bacteria and SRR5247037 for archaea.
3. Results
3.1. Water Quality and Sediment Heavy Metal
The water quality of the two creeks is shown in Table 3. The pH of the sewage creek and industry creek ranged from 7.13 to 7.26 (mean 7.17) and from 7.35 to 7.65 (mean 7.48), respectively. The DO of the sewage creek and industry creek ranged from 5.66 to 6.97 mg/L (mean 6.10 mg/L) and 7.27 to 8.06 mg/L (mean 7.26 mg/L), respectively. The concentrations of inorganic phosphorus (IP), total phosphorus (TP), NH4+-N, NO3−-N, and total nitrogen (TN) declined by 86.8%, 69.3%, 41.7%, 41.1%, and 64.7% in the sewage creek, and by 30.7%, 47.4%, 14.4%, 4.3%, and 3.6% in the industry creek, respectively. These results indicate that the self-purification ability of the sewage creek was stronger than that of the industry creek because the hydraulic staying time of the sewage creek was shorter (Table 1).
The concentrations of heavy metals in the sediments of the two creeks are shown in Table 4. The concentrations of Cr, Cu, As, Cd, and Pb in the sediments of the industry creek were higher than those of the sewage creek and the background values of the rivers around Taihu Lake [40,41,42].
As shown in Table 3, a tropic state index (TSI) was used to evaluate the tropic state of the two creeks. The TSI of each site was calculated based on the method described by Wang et al. [43]. TSI < 30 indicates an oligotrophic, 30 ≤ TLI ≤ 50 a mesotropher, TLI > 50 a eutropher, 50 < TLI ≤ 60 a light eutropher, 60 < TLI ≤ 70 a middle eutropher, and TLI > 70 a Hyper eutropher. As shown in Table 4, the potential ecological risk (RI) was used to evaluate the degree of heavy metal pollution in the sediment of the two creeks. The RI of each site was calculated based on the method described by Hakanson [44]. RI < 150 indicates slight risk, 150 < RI < 300 a middle risk, 300 ≤ RI < 60 a high risk, and RI ≥ 600 an extraordinary risk. The result of the TSI and RI values are shown in Table 5.
The order of the TSI of the two creeks was D1 > D2 > D3 > J1 > J2 > J3. The potential contribution to eutrophication of Taihu Lake was higher for the sewage creek than for the industry creek. The order of RI was J1 > J2 > J3 > D2 > D3 > D1, and the potential ecological risk of heavy metals in the sediment of the industry creek was higher than that of the sewage creek. These findings indicated that the heavy metals pollution of the sediment in the industry creek posed a greater ecological risk to Taihu Lake than that of the sewage creek.
3.2. Bacterial Diversity of the Creeks
Using Illumina MiSeq pyrosequencing, six libraries of bacterial 16S rRNA genes were constructed. A total of 18,265–47,498 high quality reads for the six samples of the two creeks were obtained from 263,713 raw reads of bacteria after filtering the low quality reads. After trimming adaptor and barcode primers, an average sequence length of 440–444 nt was obtained. The number of OTUs, ACE, Chao1, Coverage, and Shannon indices were estimated for the six samples (Table 6). The Coverage of the six samples ranged from 98 to 99%, indicating that the libraries of the six samples could cover the diversity of the bacterial community well. The Shannon indices ranged from 5.12 to 5.96 for the six samples from the two creeks, with the highest diversity being found at D3 of the sewage creek and J3 of the industry creek. Based on an independent T-test, the Shannon indices between D2 and D3 had no significant difference, but there were significant differences between D1 and D2 (p < 0.05), and D1 and D3 (p < 0.05). The Shannon indices between J2 and J3 has no significant difference, but significant differences were observed between J1 and J2 (p < 0.05) and between J1 and J3 (p < 0.05). Therefore, the diversity of each creek was D3 ≈ D2 > D1 and J3 ≈ J2 > J1, respectively. Additionally, the diversity of the two creeks was D3 ≈ D2 > J3 ≈ J2 > J1 > D1. The Shannon indices of sediment in the same creek increased as the distance from the pollution source increased.
There are 41 phyla in the filtered sequences across six samples in total, including 31 at D1, 34 at D2, and 39 at D3 of the sewage creek, and 33 at J1, 39 at J2, and 37 at J3 of the industry creek. The relative abundance of sequences could be classified into known groups, but those with a relative abundance <1% were assigned to ‘others’. The bacterial phyla of the samples are shown in Figure 2a. The dominant phyla of the two creeks were Proteobacteria, Firmicutes, Bacteroidetes, and Chloroflexi, which were present with average percentages of 39%, 24%, 13%, and 8.1% in the sewage creek and 42%, 20%, 13%, and 9.1% in the industry creek, respectively. The classes of each sample in the phylum Proteobacteria were different. Betaproteobacteria in the Proteobacteria phylum was the dominant class in all samples of the sewage creek, but the dominant classes of different samples from the industry creek were different. The dominant class was Epsilonproteobacteria at J1, which was the site nearest to the industrial pollution sources, while Betaproteobacteria and Deltaproteobacteria were dominant at J2 and J3, respectively, which were farthest from the industrial pollution source. Nitrospira was found in all three samples of the sewage creek, with a relative abundance of more than 1%, but at J1 and J2 of the industry creek, the relative abundance of Nitrospira was less than 1%.
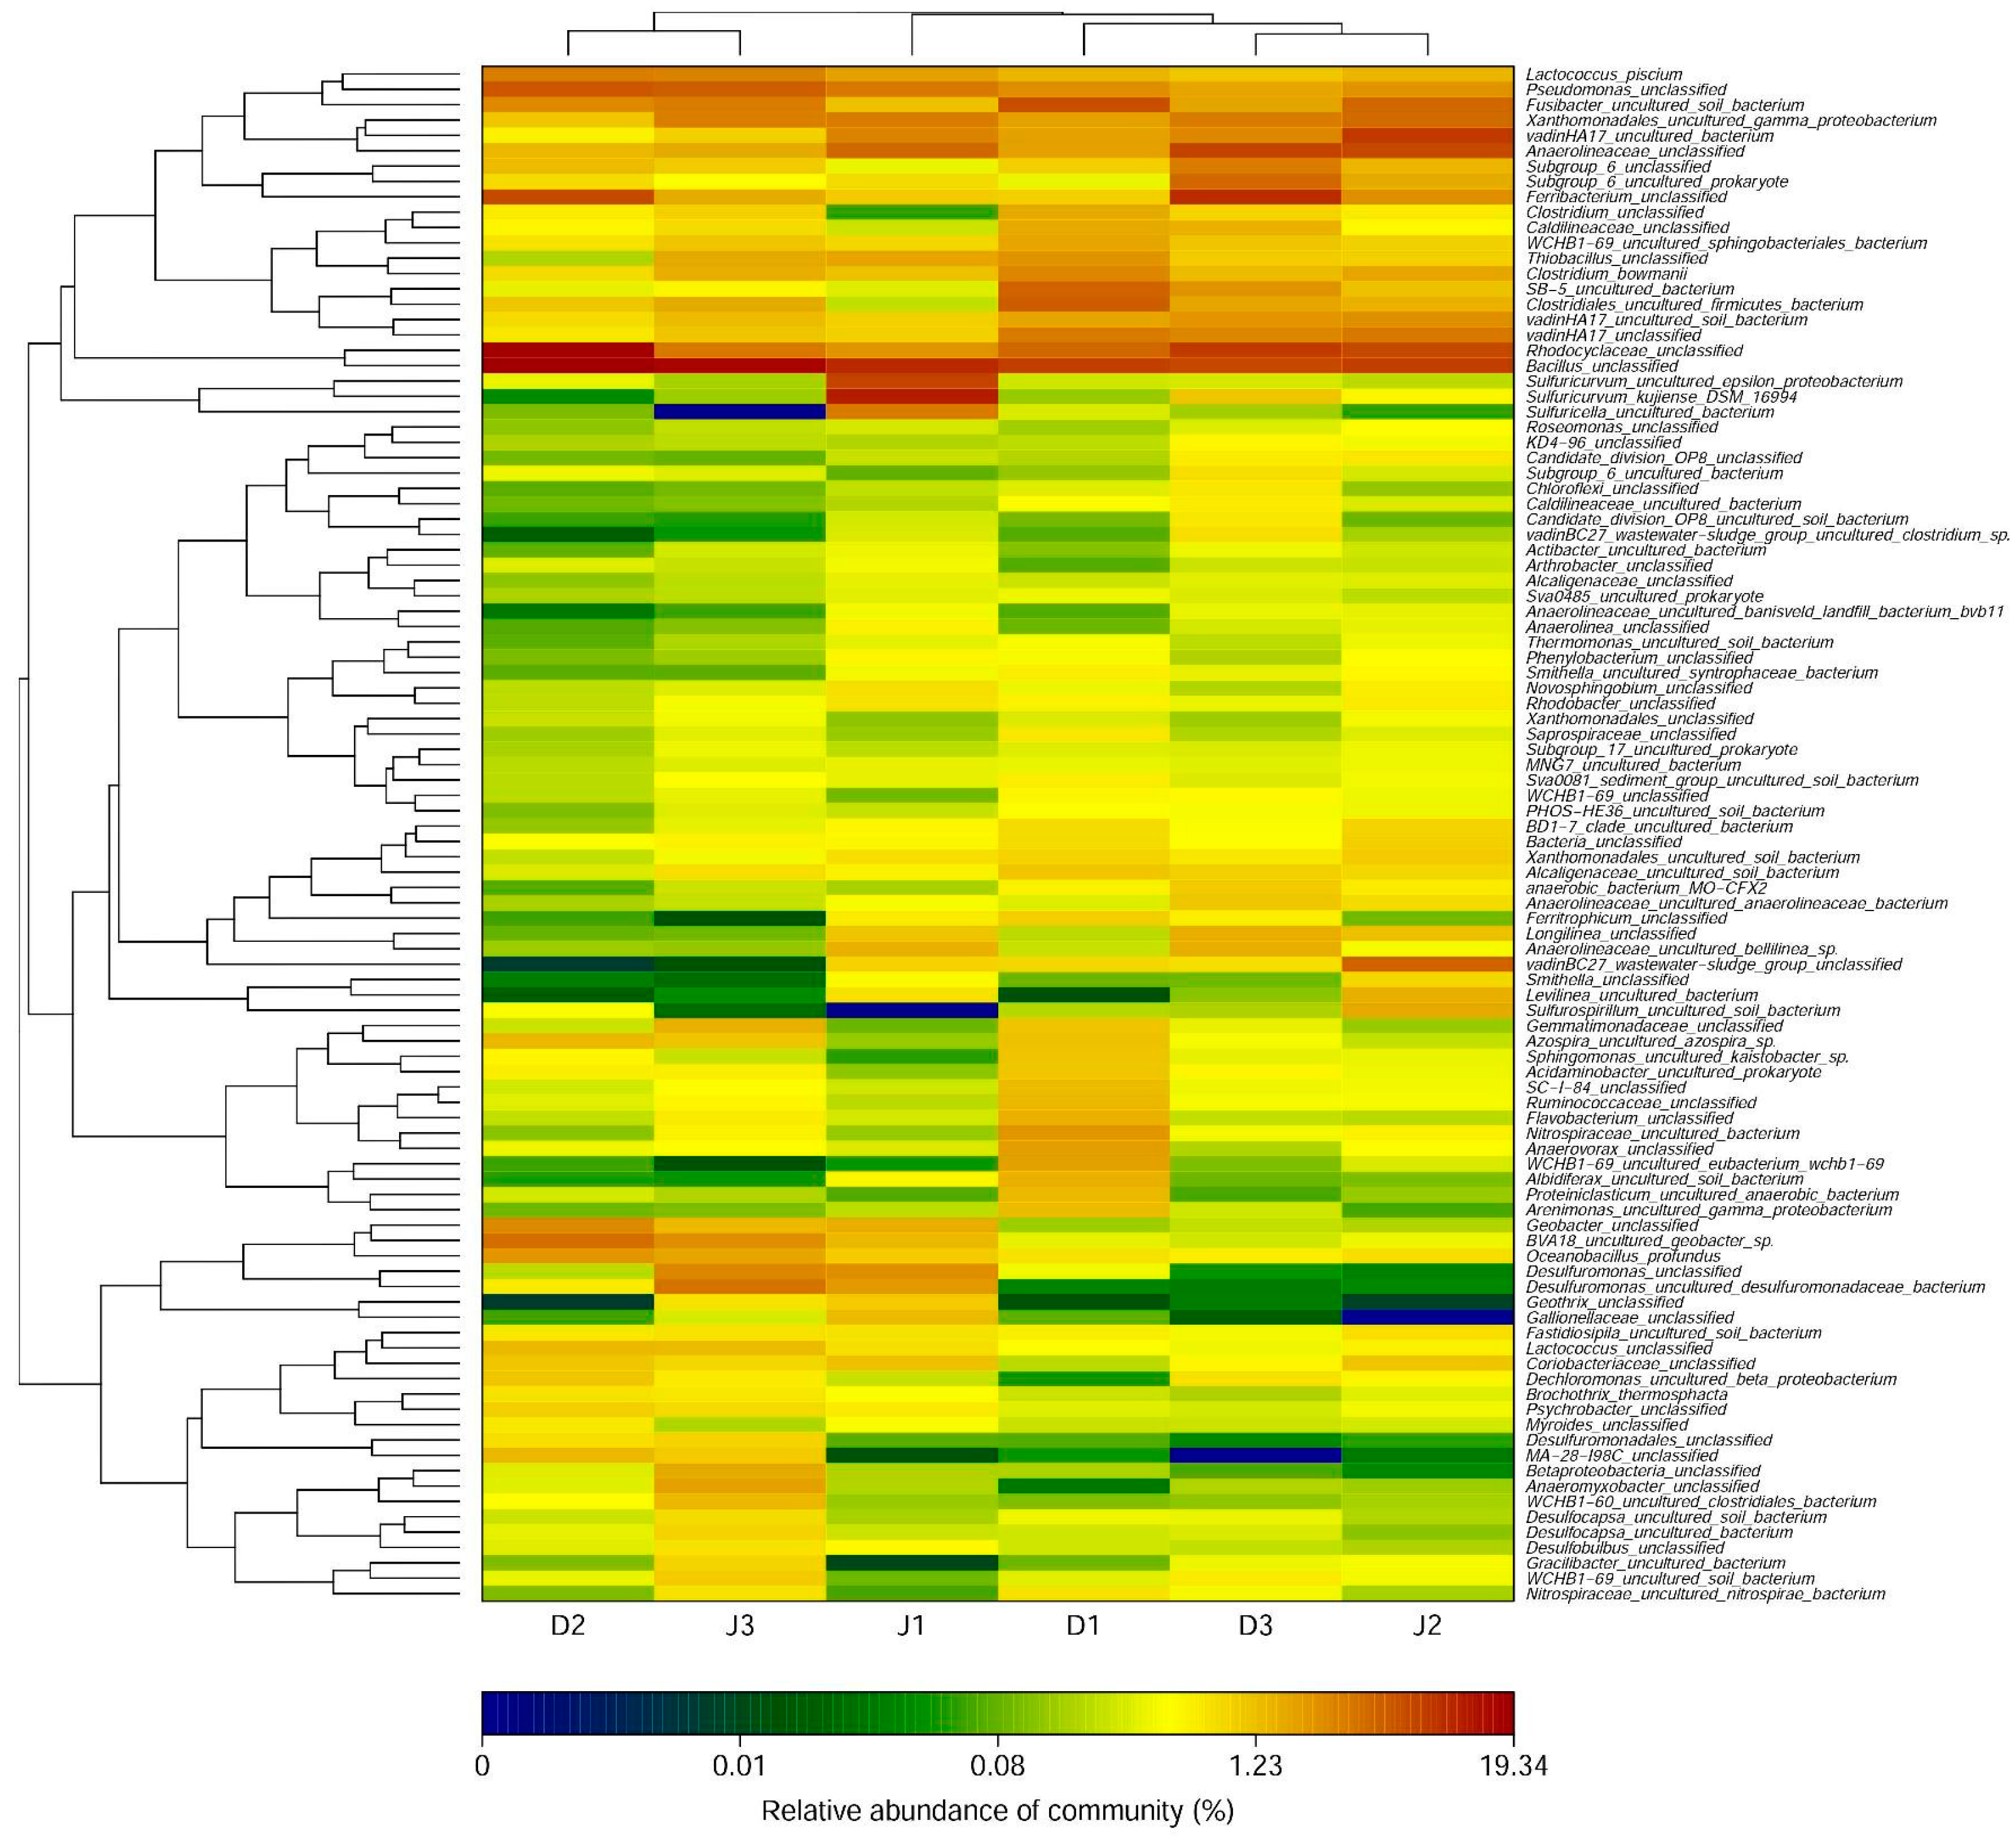
As shown in Figure 3, the number of detected bacterial genera was 381 at D1, 396 at D2, and 406 at D3 of the sewage creek, and 391 at J1, 414 at J2, and 391 at J3 of the industry creek. The bacterial genera are shown in Figure 3 (with an abundance of more than 0.01%). The number of detected genera with an abundance of more than 1% in the sewage creek was 19 at D1, 27 at D2, and 22 at D3, while it was 21 at J1, 22 at J2, and 29 at J3 of the industry creek, respectively. The dominant genera of sites nearest to the sewage source were Bacillus, Rhodocyclaceae, and Ferribacterium, while Anaerolineaceae was dominant at sites far away from the pollution source. The dominant genera of sites nearest to the industrial source was Sulfuricurvum, but Bacillus, Desulfuromonas, and Pseudomonasat were dominant at sites far away from the pollution source.
Clustering of the samples from the two creeks is shown in Figure 4a. The result showed that clusters reflecting sites nearest to the pollution source (D1 and J1) were farthest away from each other, indicating that the different pollution sources had different effects on microbial diversity. The NMDS (see Supplementary Materials, Figure S1a) illustrated that J1 was far from J2 and J3, indicating a lower similarity of bacterial communities between these three sites and that the bacterial community was determined by the distances from the pollution source.
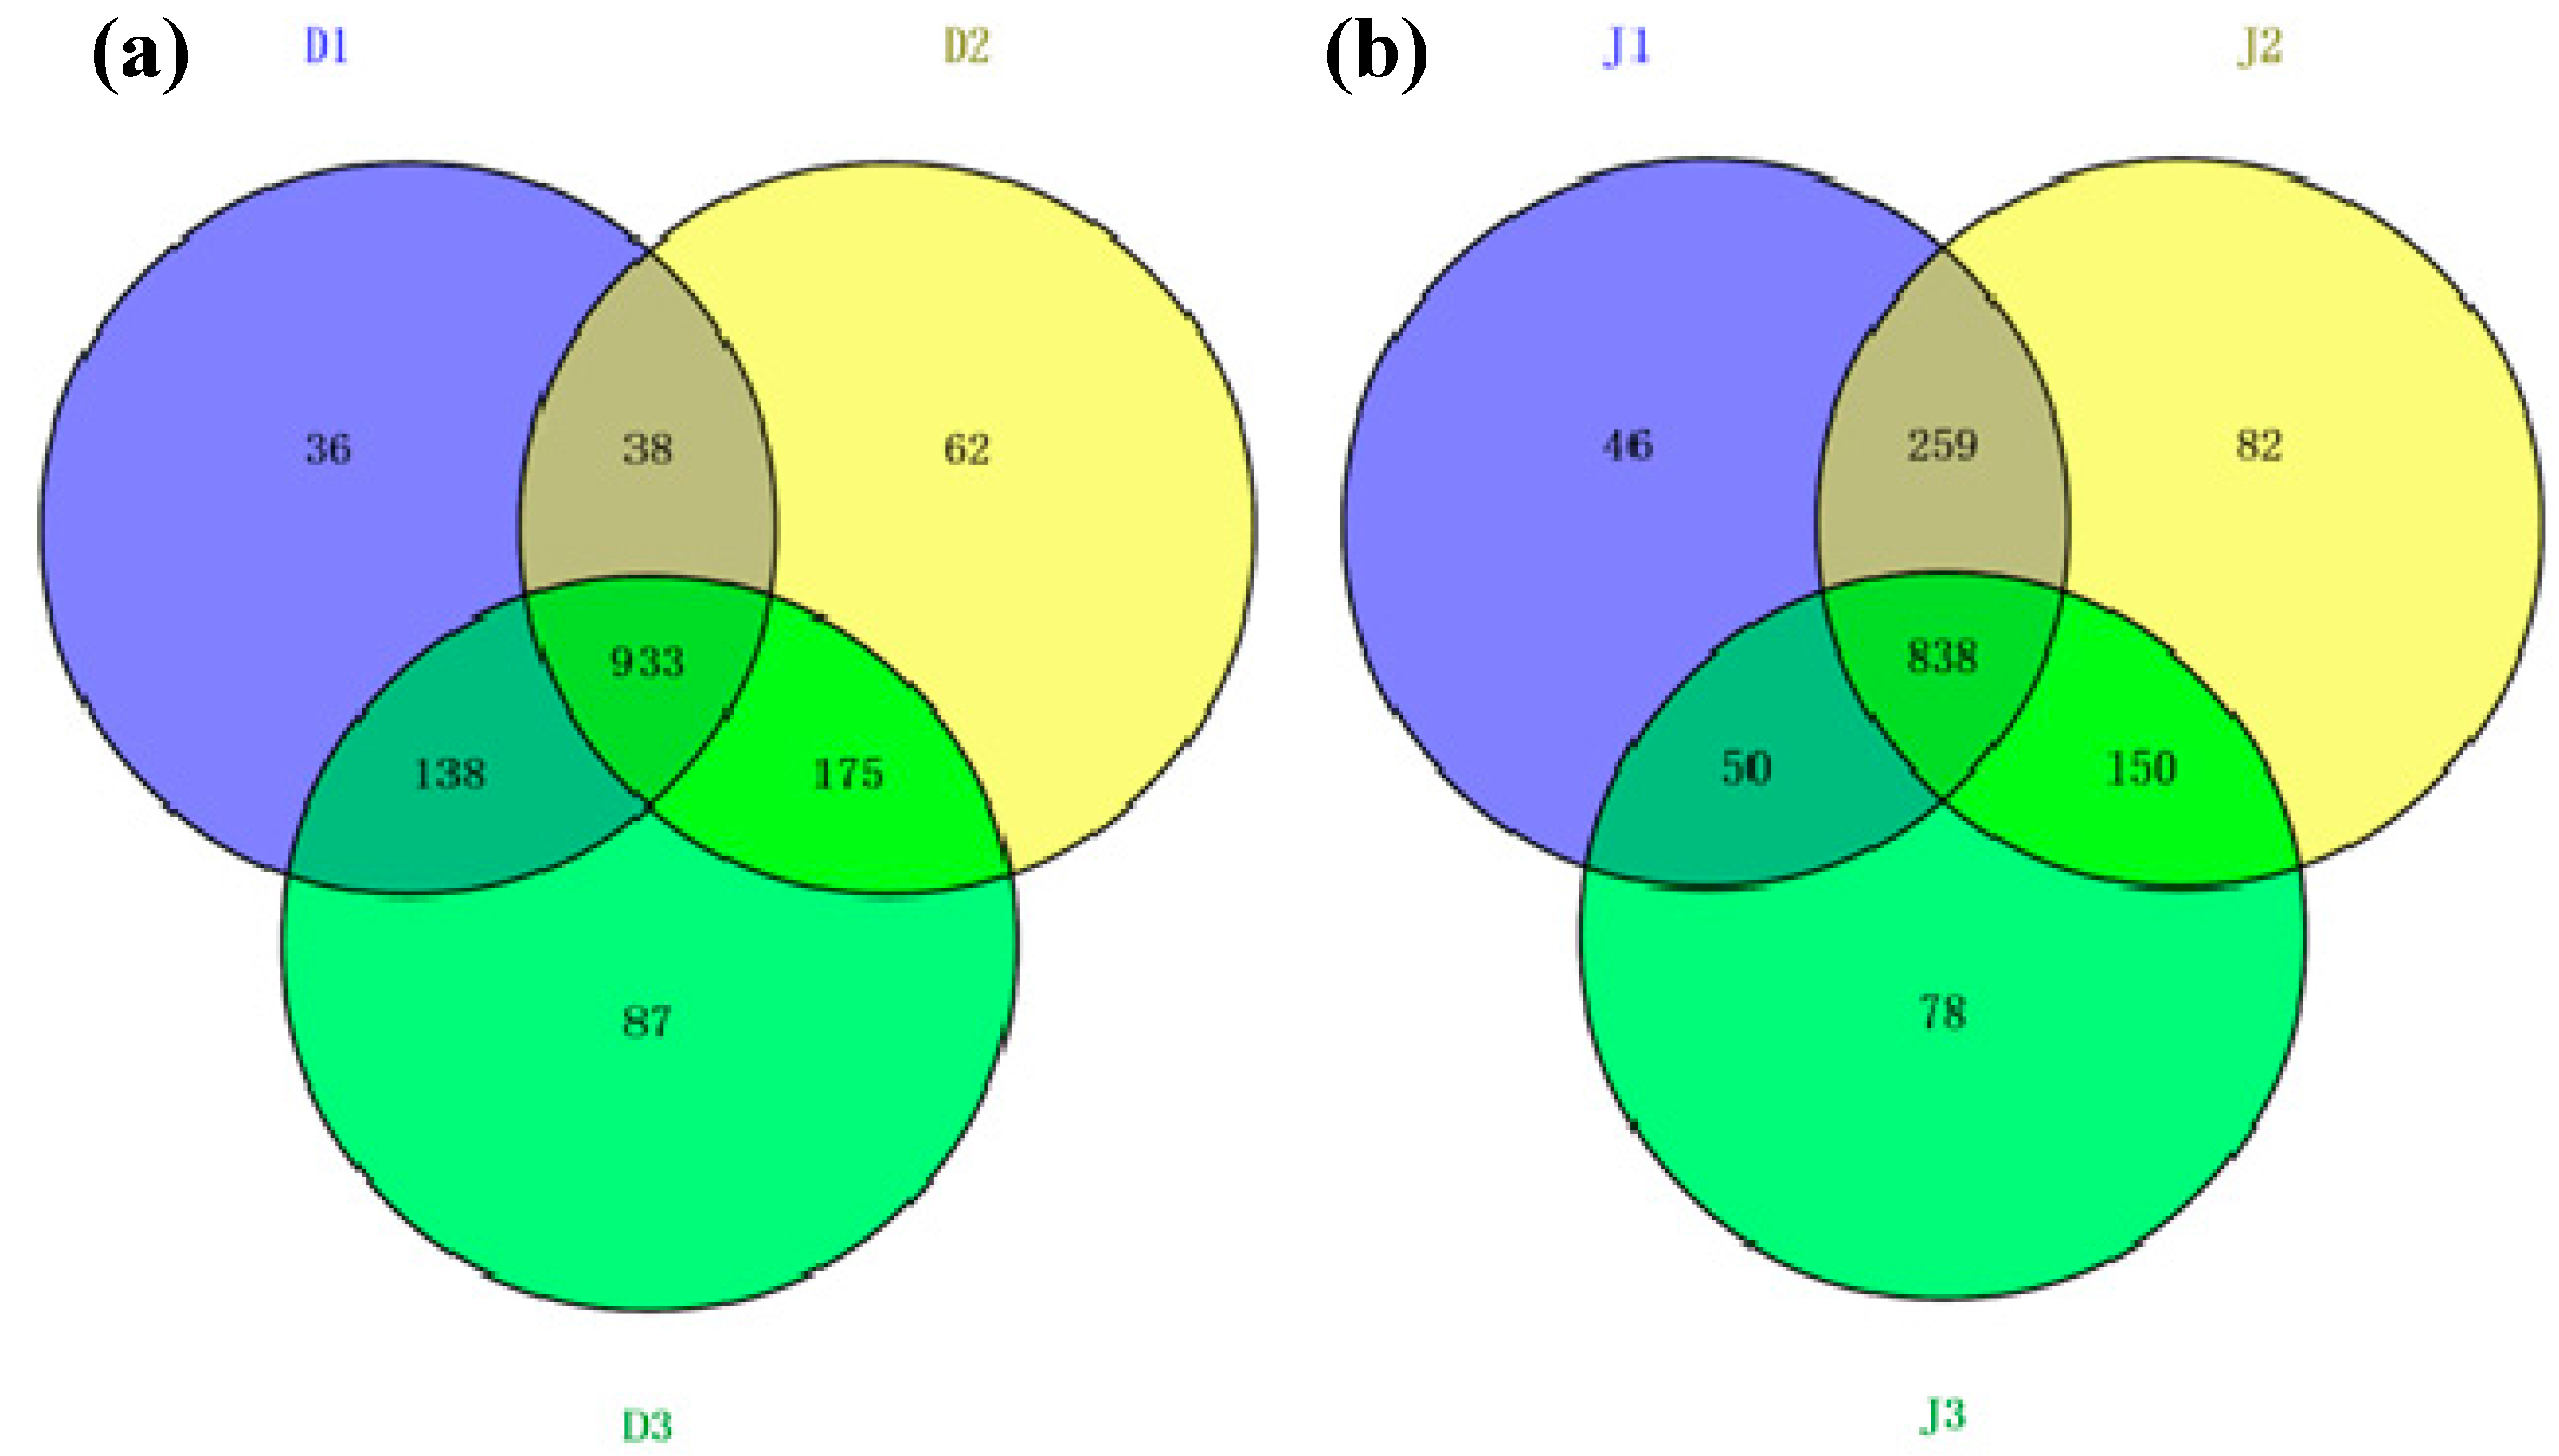
The shared OTUs of the samples from the same creek were analyzed using a Venn diagram (Figure 5a,b). Reads in the shared OTUs of genes among the three samples from the same creek are summarized in Table S1 (see Supplementary Materials). Anaerolineae shared the most OTUs among the six sites, and the reads of OTUs were more than 1%. The number of shared OTUs of the sewage creek was 933, while that of the industry creek was 838, indicating that the similarity of the bacterial community of the industry creek was lower among sites. The unique OTUs of each sample from the same creek were analyzed using a Venn diagram. At D1 there were 36 OTUS, while there were 62 at D2, 87 at D3, 46 at J1, 82 at J2, and 78 at J3. Sites further from the pollution source had more unique OTUs, indicating that the microbial communities changed with the distance from a pollution source.
3.3. Archaeal Diversity of the Creeks
Six libraries of archaeal 16S rRNA genes were constructed using Illumina MiSeq pyrosequencing. A total of 32,255–61,300 high quality reads for the six samples of the two creeks were obtained from 334,439 raw reads of bacteria after filtering the low quality reads. After trimming the adaptor and barcode primers, an average sequence length of 399–403 nt was obtained. The number of OTUs, as well as the ACE, Chao1, Coverage, and Shannon indices were estimated for the six samples (Table 6). The Coverage of the six samples ranged from 98 to 99%, indicating that the libraries of the six samples could cover the diversity of the archaeal community well. As shown in Table 6, the Shannon indices ranged from 3.54 to 4.27 for the six samples from the two creeks, and the bacterial diversity of the two creeks was not significantly different. The highest level of diversity was found at D1 of the sewage creek and J3 of the industry creek. Independent T-tests revealed that were no significant differences in Shannon indices between D2 and D3, while those between D1 and D2 (p < 0.05) and D1 and D3 (p < 0.05) differed. The Shannon indices of J2 and J3, as well as those of J1 and J3 (p < 0.05) also differed significantly (p < 0.05), while there was no significant difference between J1 and J2. These findings indicated that the diversity was similar between D2 and D3, as well as between J1 and J2. The order of diversity of each creek was D1 > D2 ≈ D3 and J3 > J2 ≈ J1, respectively, indicating that the Shannon indices of the samples in the sewage creek decreased with increasing distance from the pollution source, while they increased with distance from the pollution source in the industry creek. The results of the independent T-test showed that the influence of sewage pollution on archaeal diversity was higher than that of industrial pollution. The Shannon index between D1 and D3 was significantly different, but no significant difference was observed between J1 and J2, and for the same distance between J1 and J2 as D1 and D3 (160 m away from the pollution source).
There were three phyla including 19 classes in the filtered sequences across six samples in total, including 17 at D1, 15 at D2, and 15 at D3 of the sewage creek, and 15 at J1, 15 at J2, and 15 at J3 of the industry creek. The relative abundance of sequences could be classified into known groups, and those with a relative abundance <0.04% were assigned to ‘others’. The archaeal phyla of the samples are shown in Figure 2b. The dominant phyla of the two creeks were Euryarchaeota, Thaumarchaeota, and Crenarchaeota, which were present with average percentages of 70.4% and 1.9% in the sewage creek, and 67.3%, 31.8%, and 0.77% in the industry creek, respectively. Halobacteria from the Euryarchaeota phylum was dominant in all the samples. Additionally, Soil_Crenarchaeotic_GroupSCG belonging to the Thaumarchaeot phylum was the second most abundant class at sites D1 and D2, which were near the sewage source. Furthermore, Miscellaneous_Crenarchaeotic_Group in the Thaumarchaeot phylum was the second most abundant class at site D3, which was far away from the pollution source. In the industry creek, the Miscellaneous_Crenarchaeotic_Group belonging to the Thaumarchaeot phylum was the second most abundant class at J1, which was closest to the pollution source, while Soil_Crenarchaeotic_GroupSCG of Thaumarchaeot phylum was the second most abundant class at D3, which was far away from the pollution source. Miscellaneous_Crenarchaeotic_Group was one of the most abundant microbial groups in the environment, such as lakes [45] and terrestrial hot springs [46].
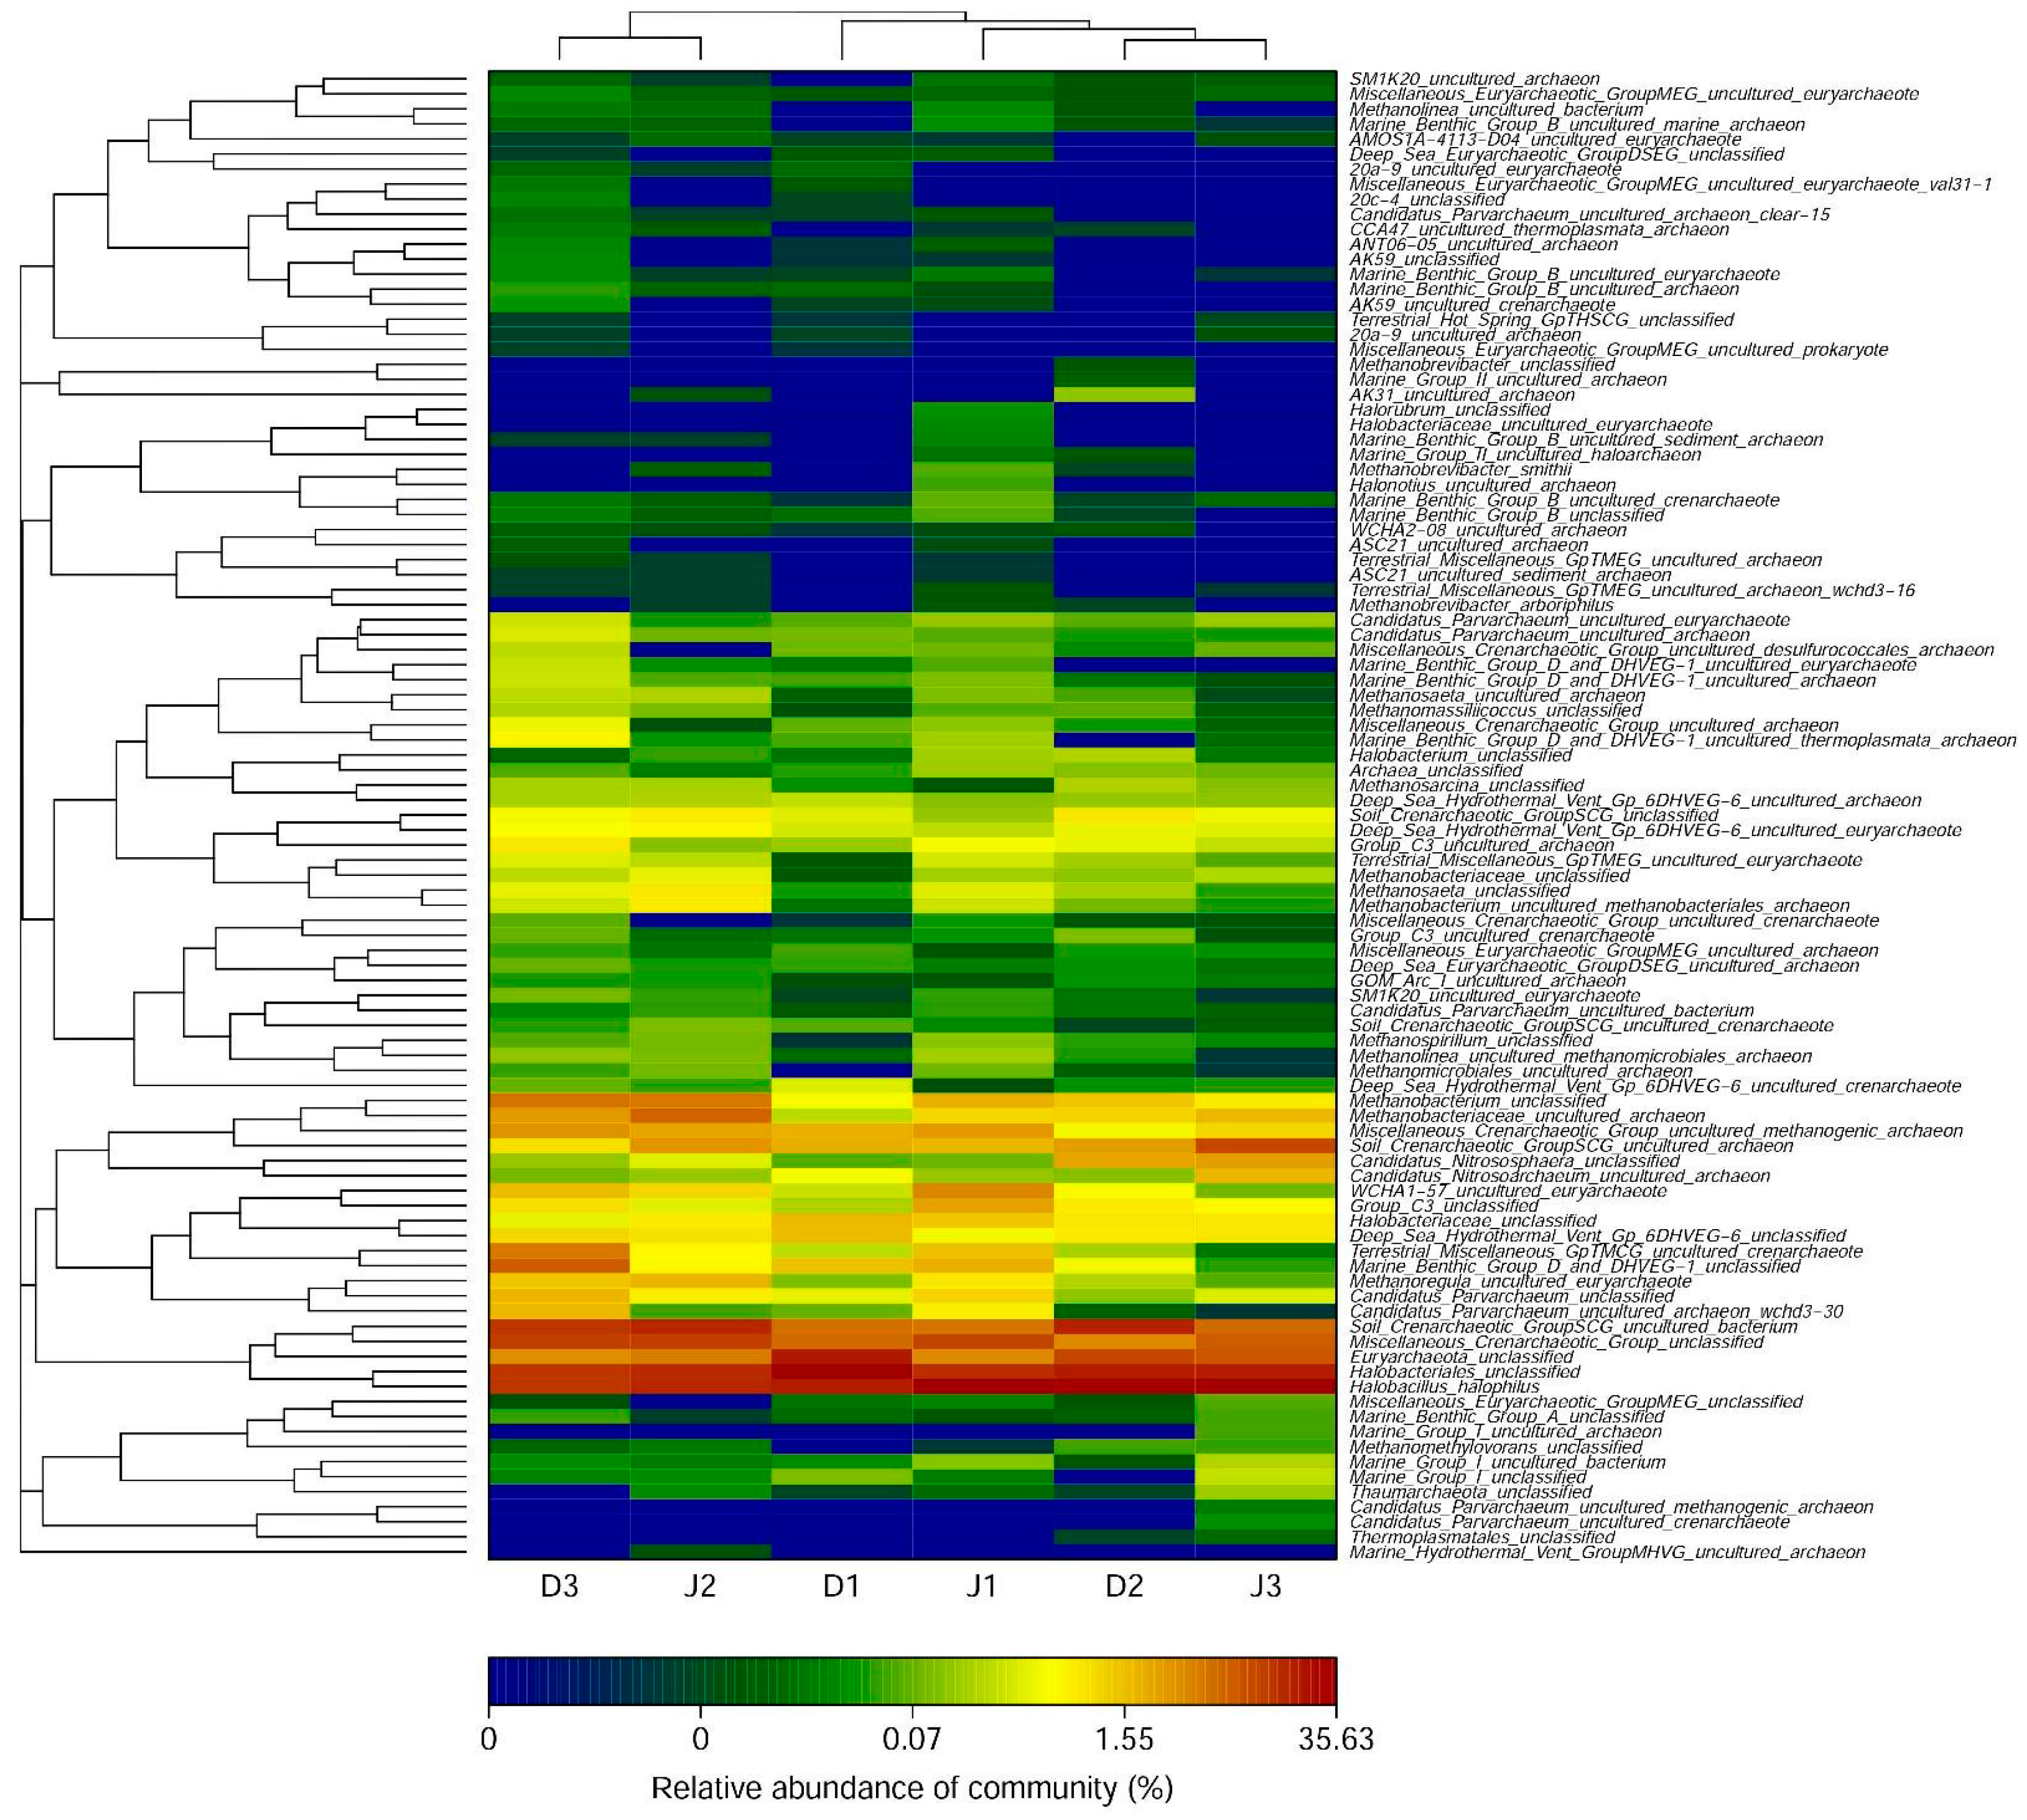
At the genus level, the number of detected archaeal genera was 42 at D1, 43 at D2, and 46 at D3 of the sewage creek and 48 at J1, 45 at J2, and 41 at J3 of the industry creek. The archaeal genera are shown in Figure 6. The dominant genera in all the sites were significantly different. The number of detected genera with an abundance >1% was 8 at D1, 10 at D2, and 14 at D3 in the sewage creek, but 14 at J1, 13 at J2, and 9 at J3 in the industry creek. The dominant genus was Halobacterium in all the samples. The main genera of sites nearest to the sewage source were Candidatus_Nitrososphaera, Methanobacterium, and Methanobacteriaceae, while they were Candidatus_Parvarchaeum and Methanobacterium at sites far away from the pollution source. The main genera of sites nearest to the industrial source were Methanobacterium (at J1 and J2), while they were Candidatus_Nitrososphaera and Candidatus_Nitrosoarchaeum at sites far away from the pollution source.
As shown in Figure 4b, clear clustering of the samples from the two creeks was observed. The result showed that the sites (D1) nearest to the pollution source were far away from the other sites in the same creek, but the distance of the sites of the industry creek was closer than that of the sewage creek, indicating that the sewage and industrial effluents had different effects on the archaeal diversity. The MNDS analysis (see Supplementary Materials, Figure S1b) illustrated that the site of the same creek located in different quadrants, indicating a lower similarity of the archaeal community among three sites and the distances from a pollution source, determined the archaeal community.
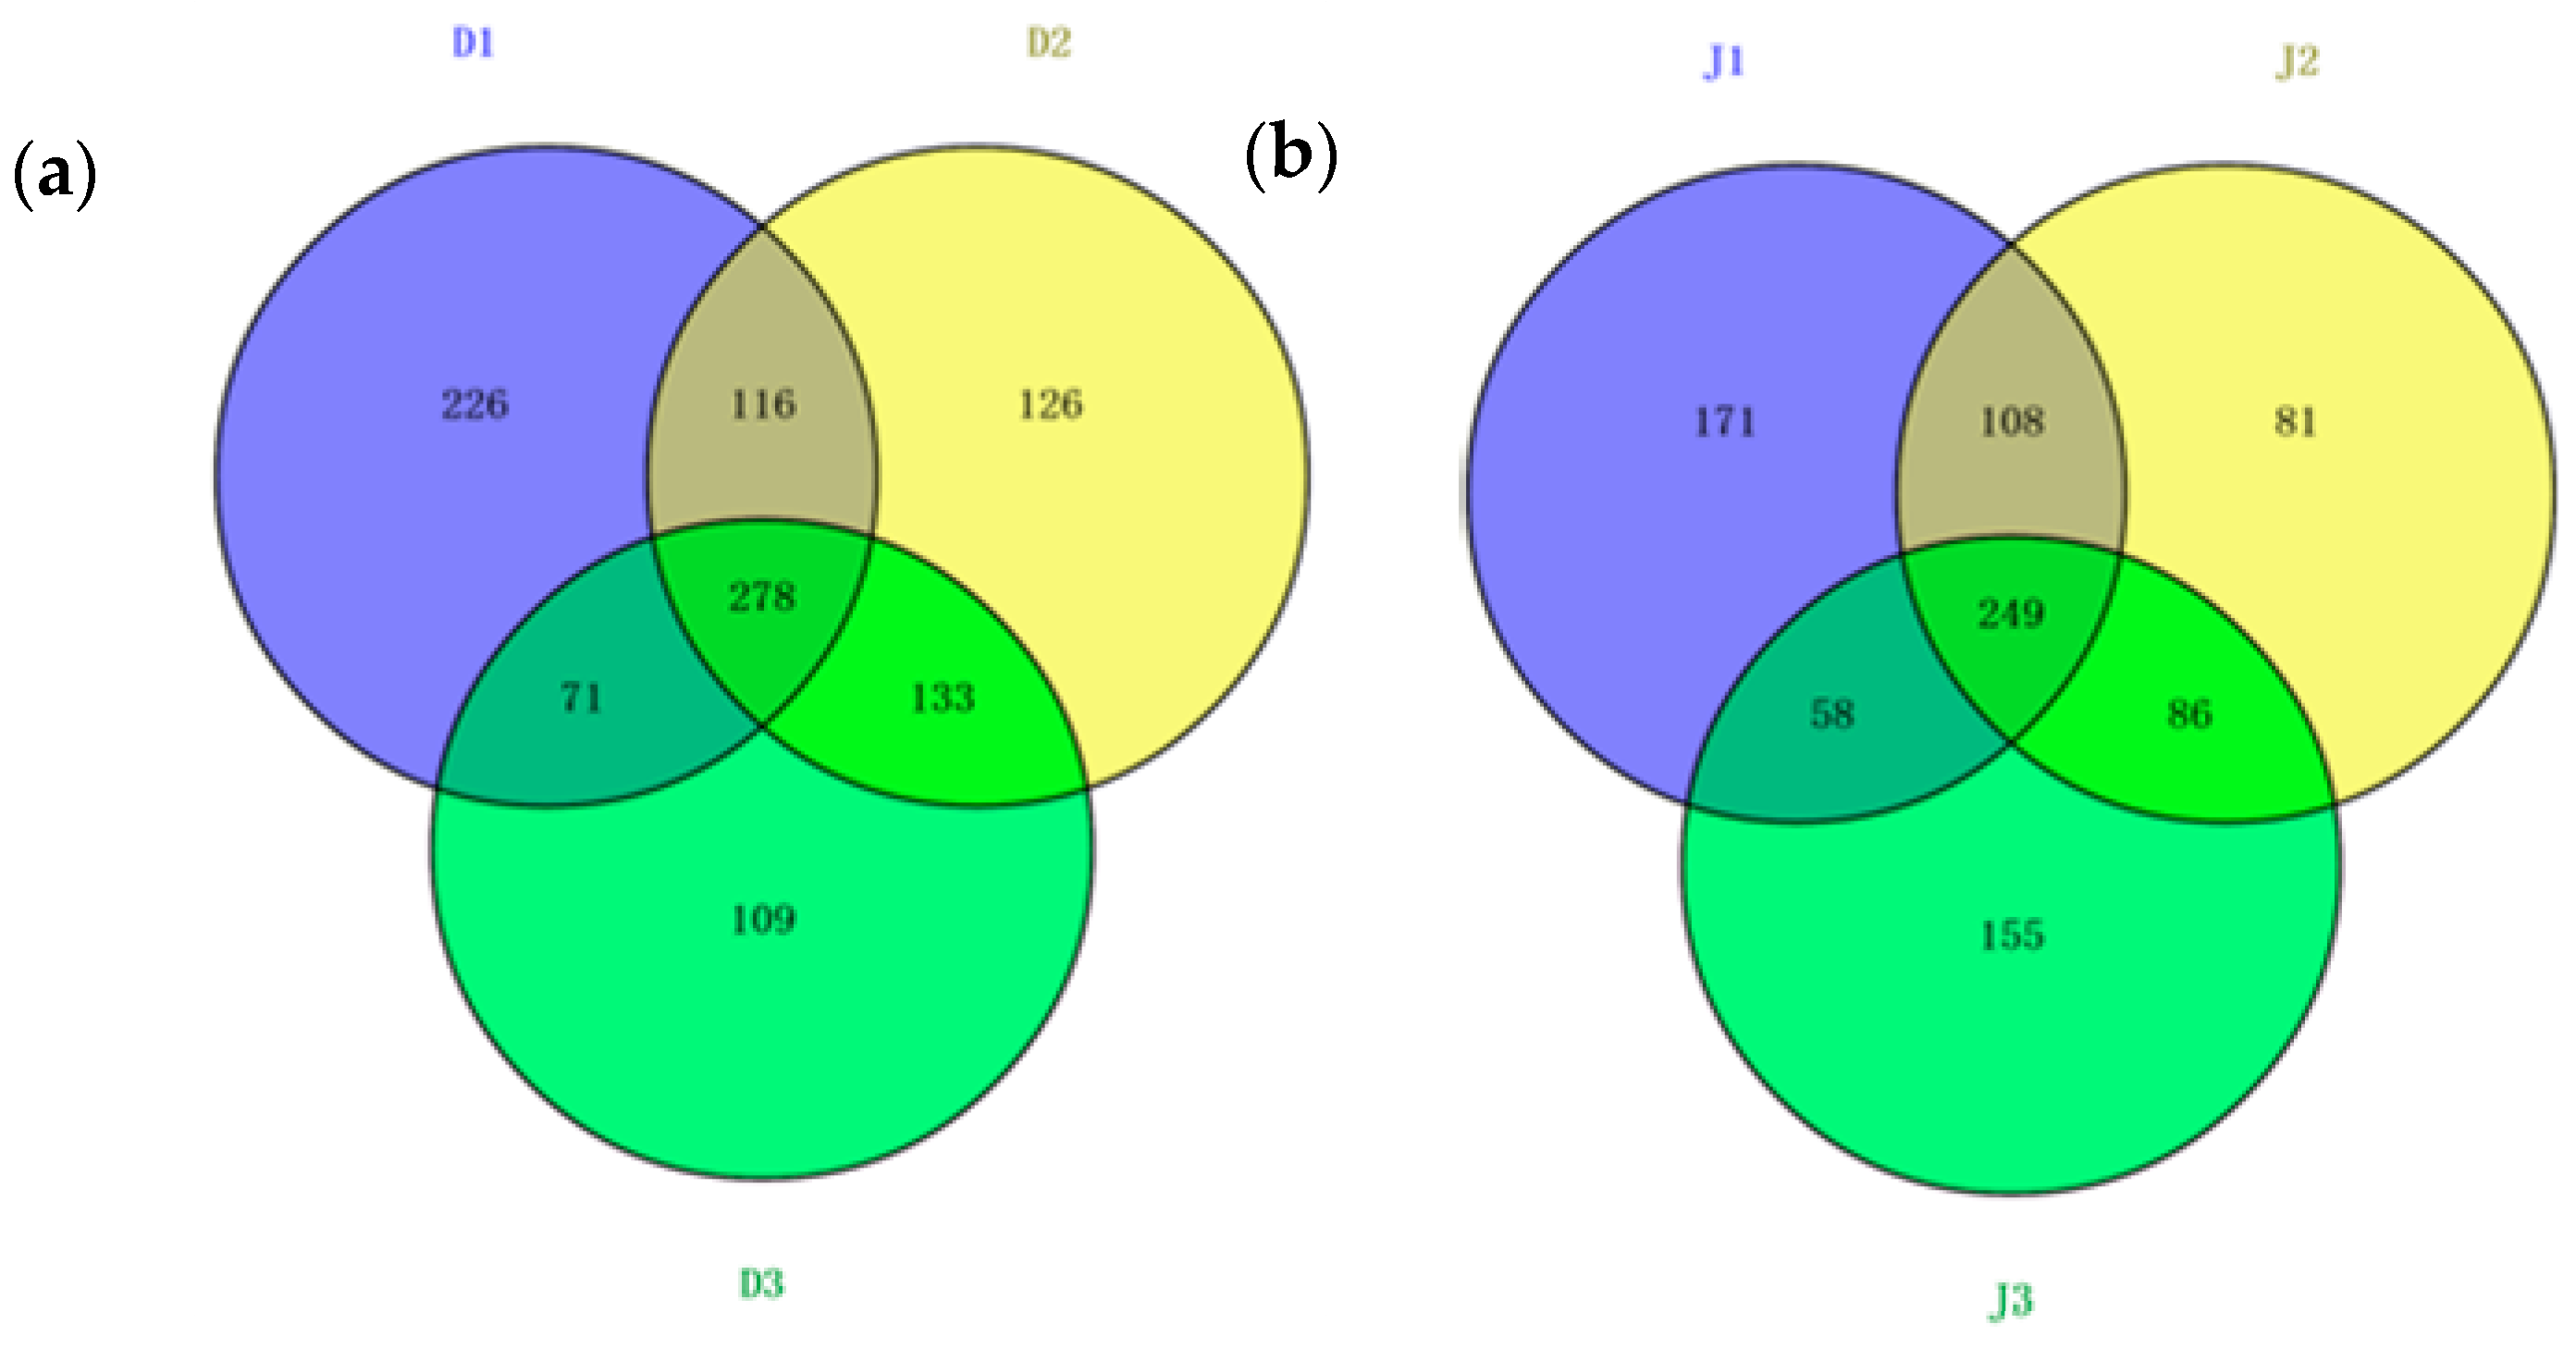
The shared OTUs of the samples from the same creek were analyzed using a Venn diagram (Figure 7). The reads in the shared OTUs of genes among the three samples of the same creek are summarized in Table S2. Halobacteria shared the most OTUs among the six samples, and the reads of the OTUs were more than 30% in the sewage creek and 40% in the industry creek. The number of shared OTUs of the sewage creek was 278, while it was 249 for the industry creek, indicating that the similarity of the archaeal community in the industry creek was lower than that of the sewage creek. The unique OTUs of each sample from the same creek were analyzed via a Venn diagram. The unique OTUs at D1 were 226, while they were 126 at D2, 109 at D3, 171 at J1, 81 at J2, and 155 at J3, respectively. Sites further from the pollution sources had less unique OTUs, indicating that the distance from a pollution source had an effect on the archaeal communities in the environment.
4. Discussion
Human activities generally decrease environmental quality, diversity, and microbial abundance. Because of the different physicochemical properties and toxicity of sewage and industrial effluents, they have different impacts on microbial diversity and microbial abundance [47,48].
The six sampling sites were classified into four distinct clusters based on RI, TSI, SO42−, Cl−, NH4+-N, and NO3−-N (Figure 8). Cluster 1 was formed by D2 and D3, cluster 2 by D1, and cluster 3 by J3, while J2 and J3 were included in cluster 4. The clusters were recognized to have hypereutrophic, moderate eutrophic, light eutrophic, and high heavy metal pollution risk. The deterioration of water quality in this basin mainly resulted from domestic sewage and industrial wastewater [49,50], which was consistent with the results of the present study. Moreover, hierarchical cluster analysis showed that the pollution types of the two creeks were significantly different. Previous studies indicated that the nutrients and heavy metals might alter microbiological processes (e.g., decomposition of organic matter) and lead to changes in the microbial density and composition [51,52].
As shown in Table 6, the wastewater entering the creek in Duangou Village was mainly sewage, and the primary pollutants were nitrogen and phosphorus. The wastewater discharging into the creek in Jixian Village was mainly from a chemical fiber factory and iron foundry. The concentration of nitrogen and phosphorus in the water in the industry creek was lower than that of the sewage creek. As shown in Table 2, the concentration of heavy metals (Cr, Cu, As, Cd and Pb) in the sediment of the industry creek was higher than that of the sewage creek. The microbial community of the sewage creek was more abundant than that of the industry creek, and the abundance of the microbial diversity increased with increased distance of the sampling sites from the pollutant source. It is interesting that the order of bacterial diversity in both creeks was D3 ≈ D2 > D1, but D1 > D2 ≈ D3 for archaea, which indicated that water quality was the main factor for determining the microbial community of both creeks.
As shown in Figure 3 and Figure 4, the microbial community composition of the two creeks between D2 and J3, as well as that of D3 and J2 were classified into the same cluster, which was inconsistent with the result of the hierarchical cluster analysis (Figure 8). This may indicate that the heat map reflected the classification of OTUs of the microbial communities, but could not accurately reflect the effects of environmental factors on the microbial structure and relationship between microbial abundance and environment factors. Moreover, the physiochemical properties of sediment could have had some impact on the microbial community structure as indicated in the previous studies [53].
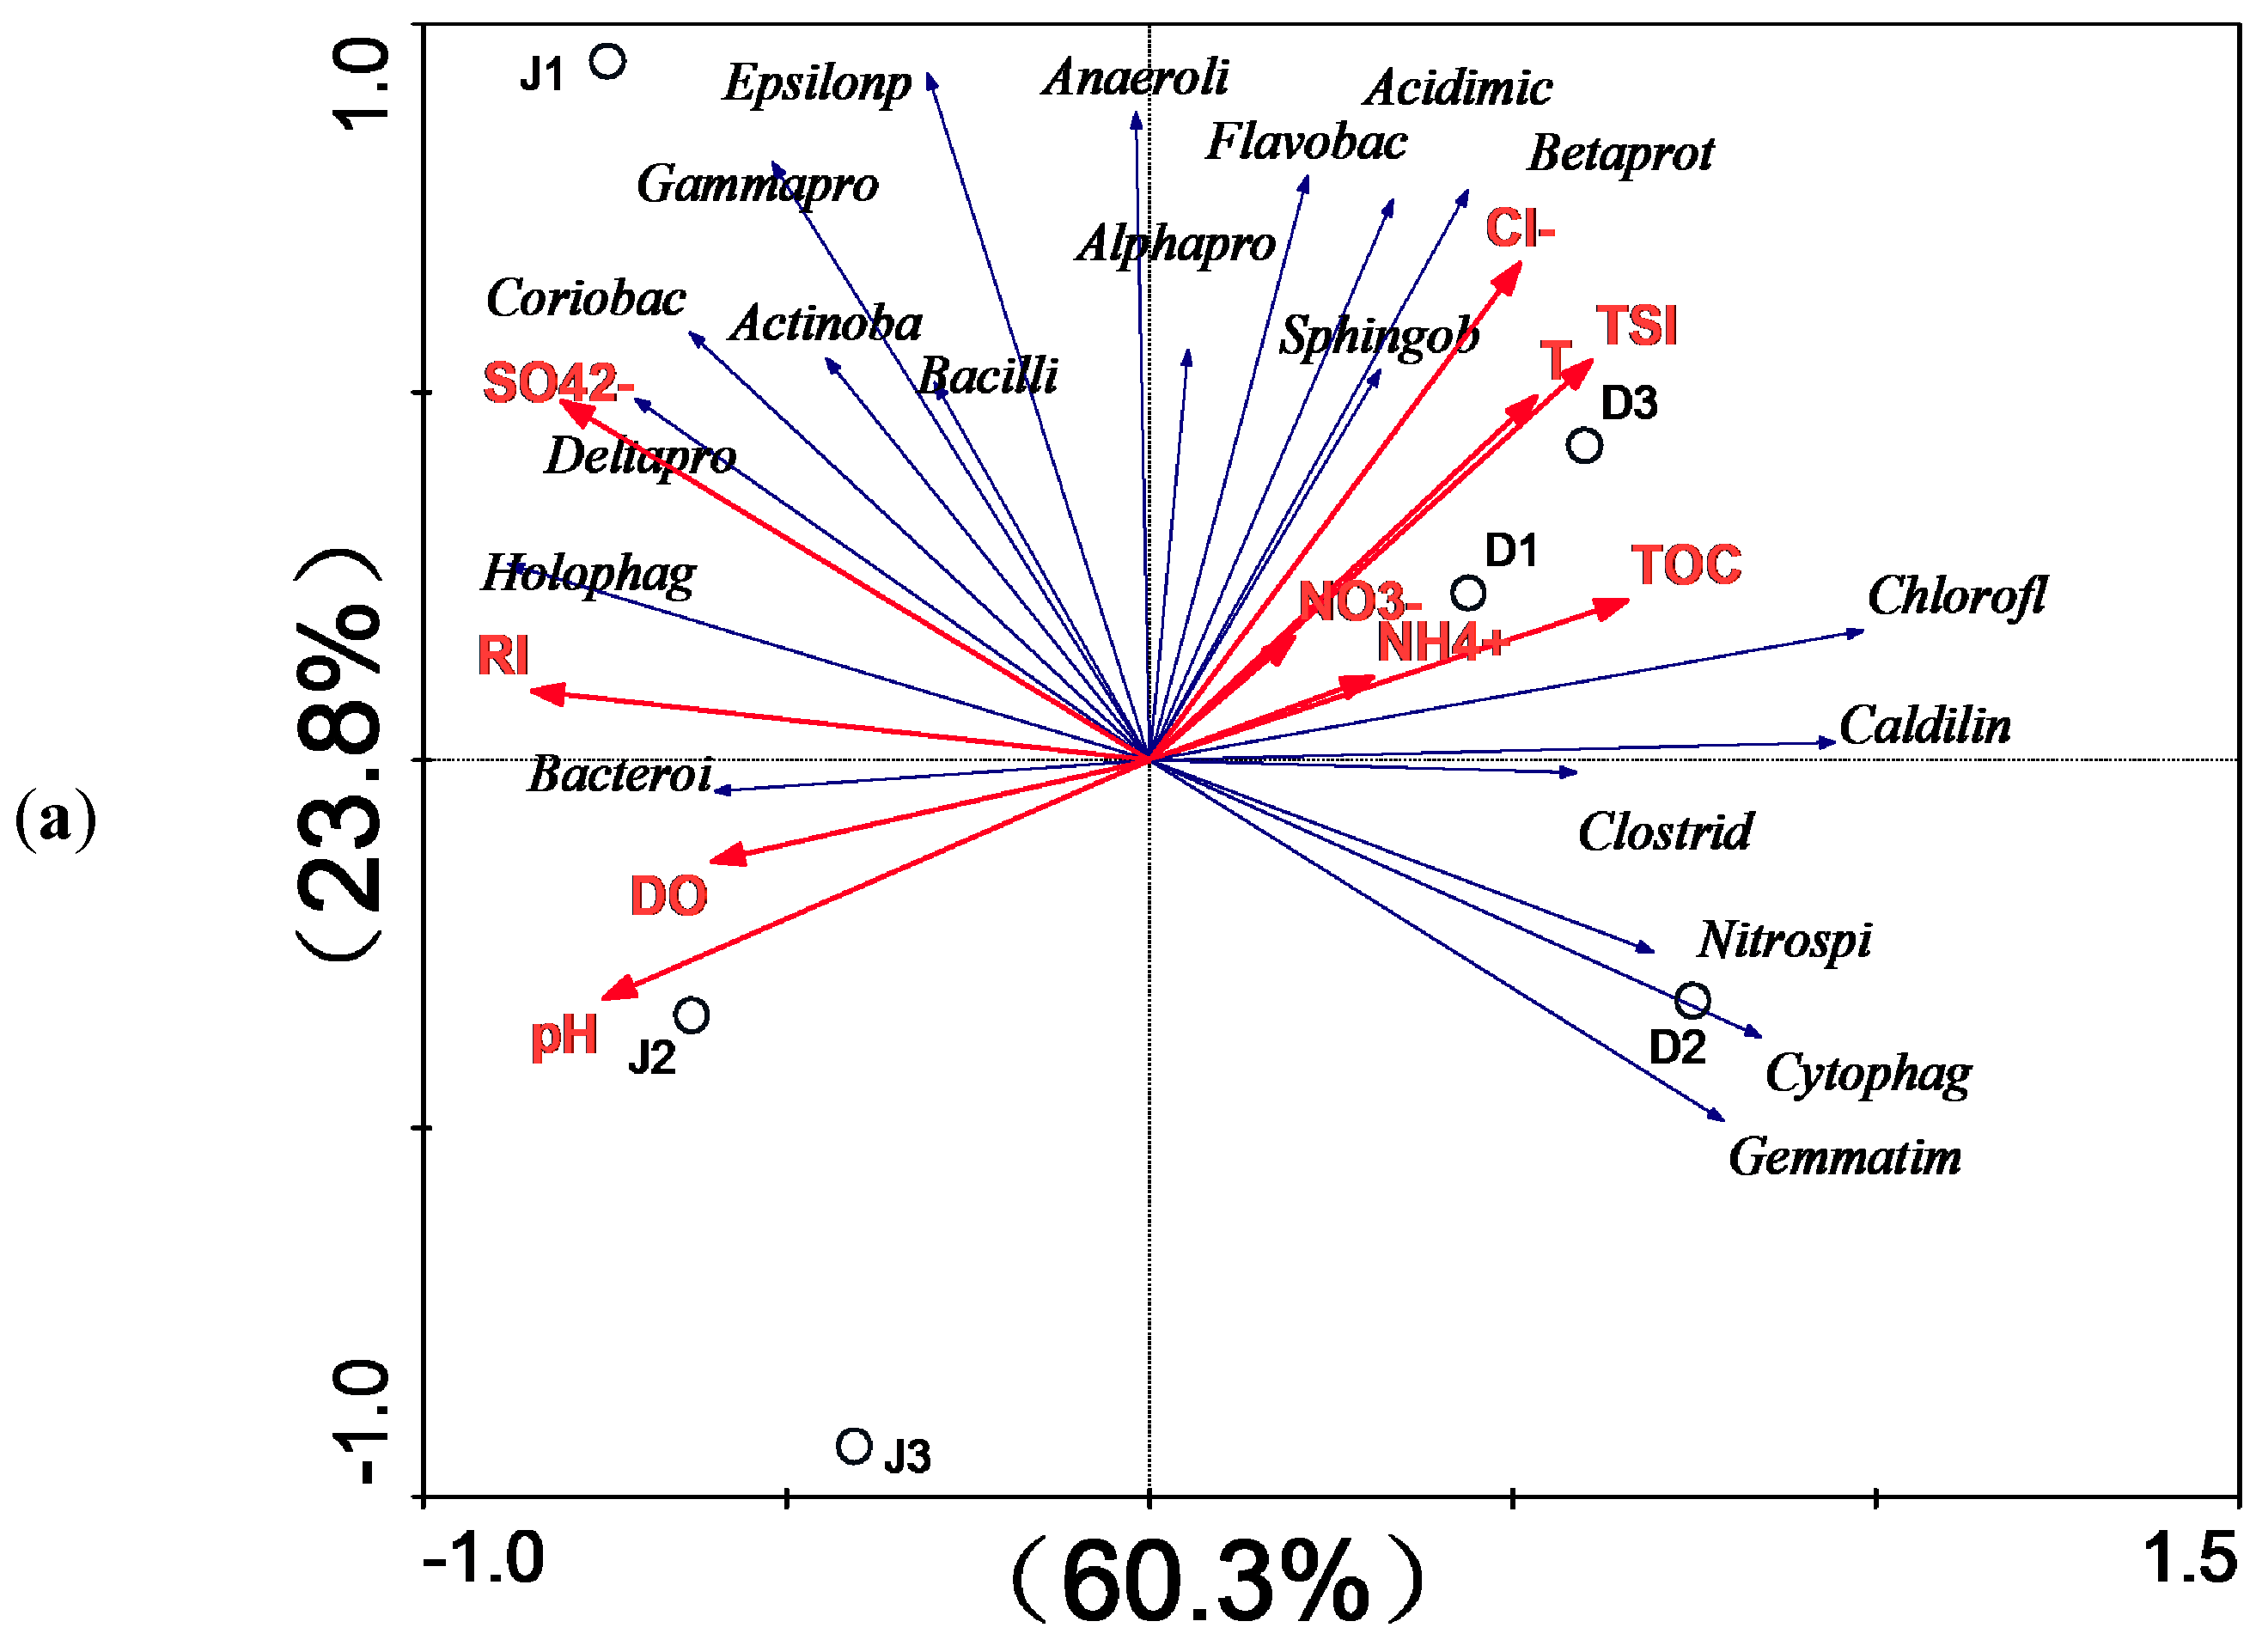
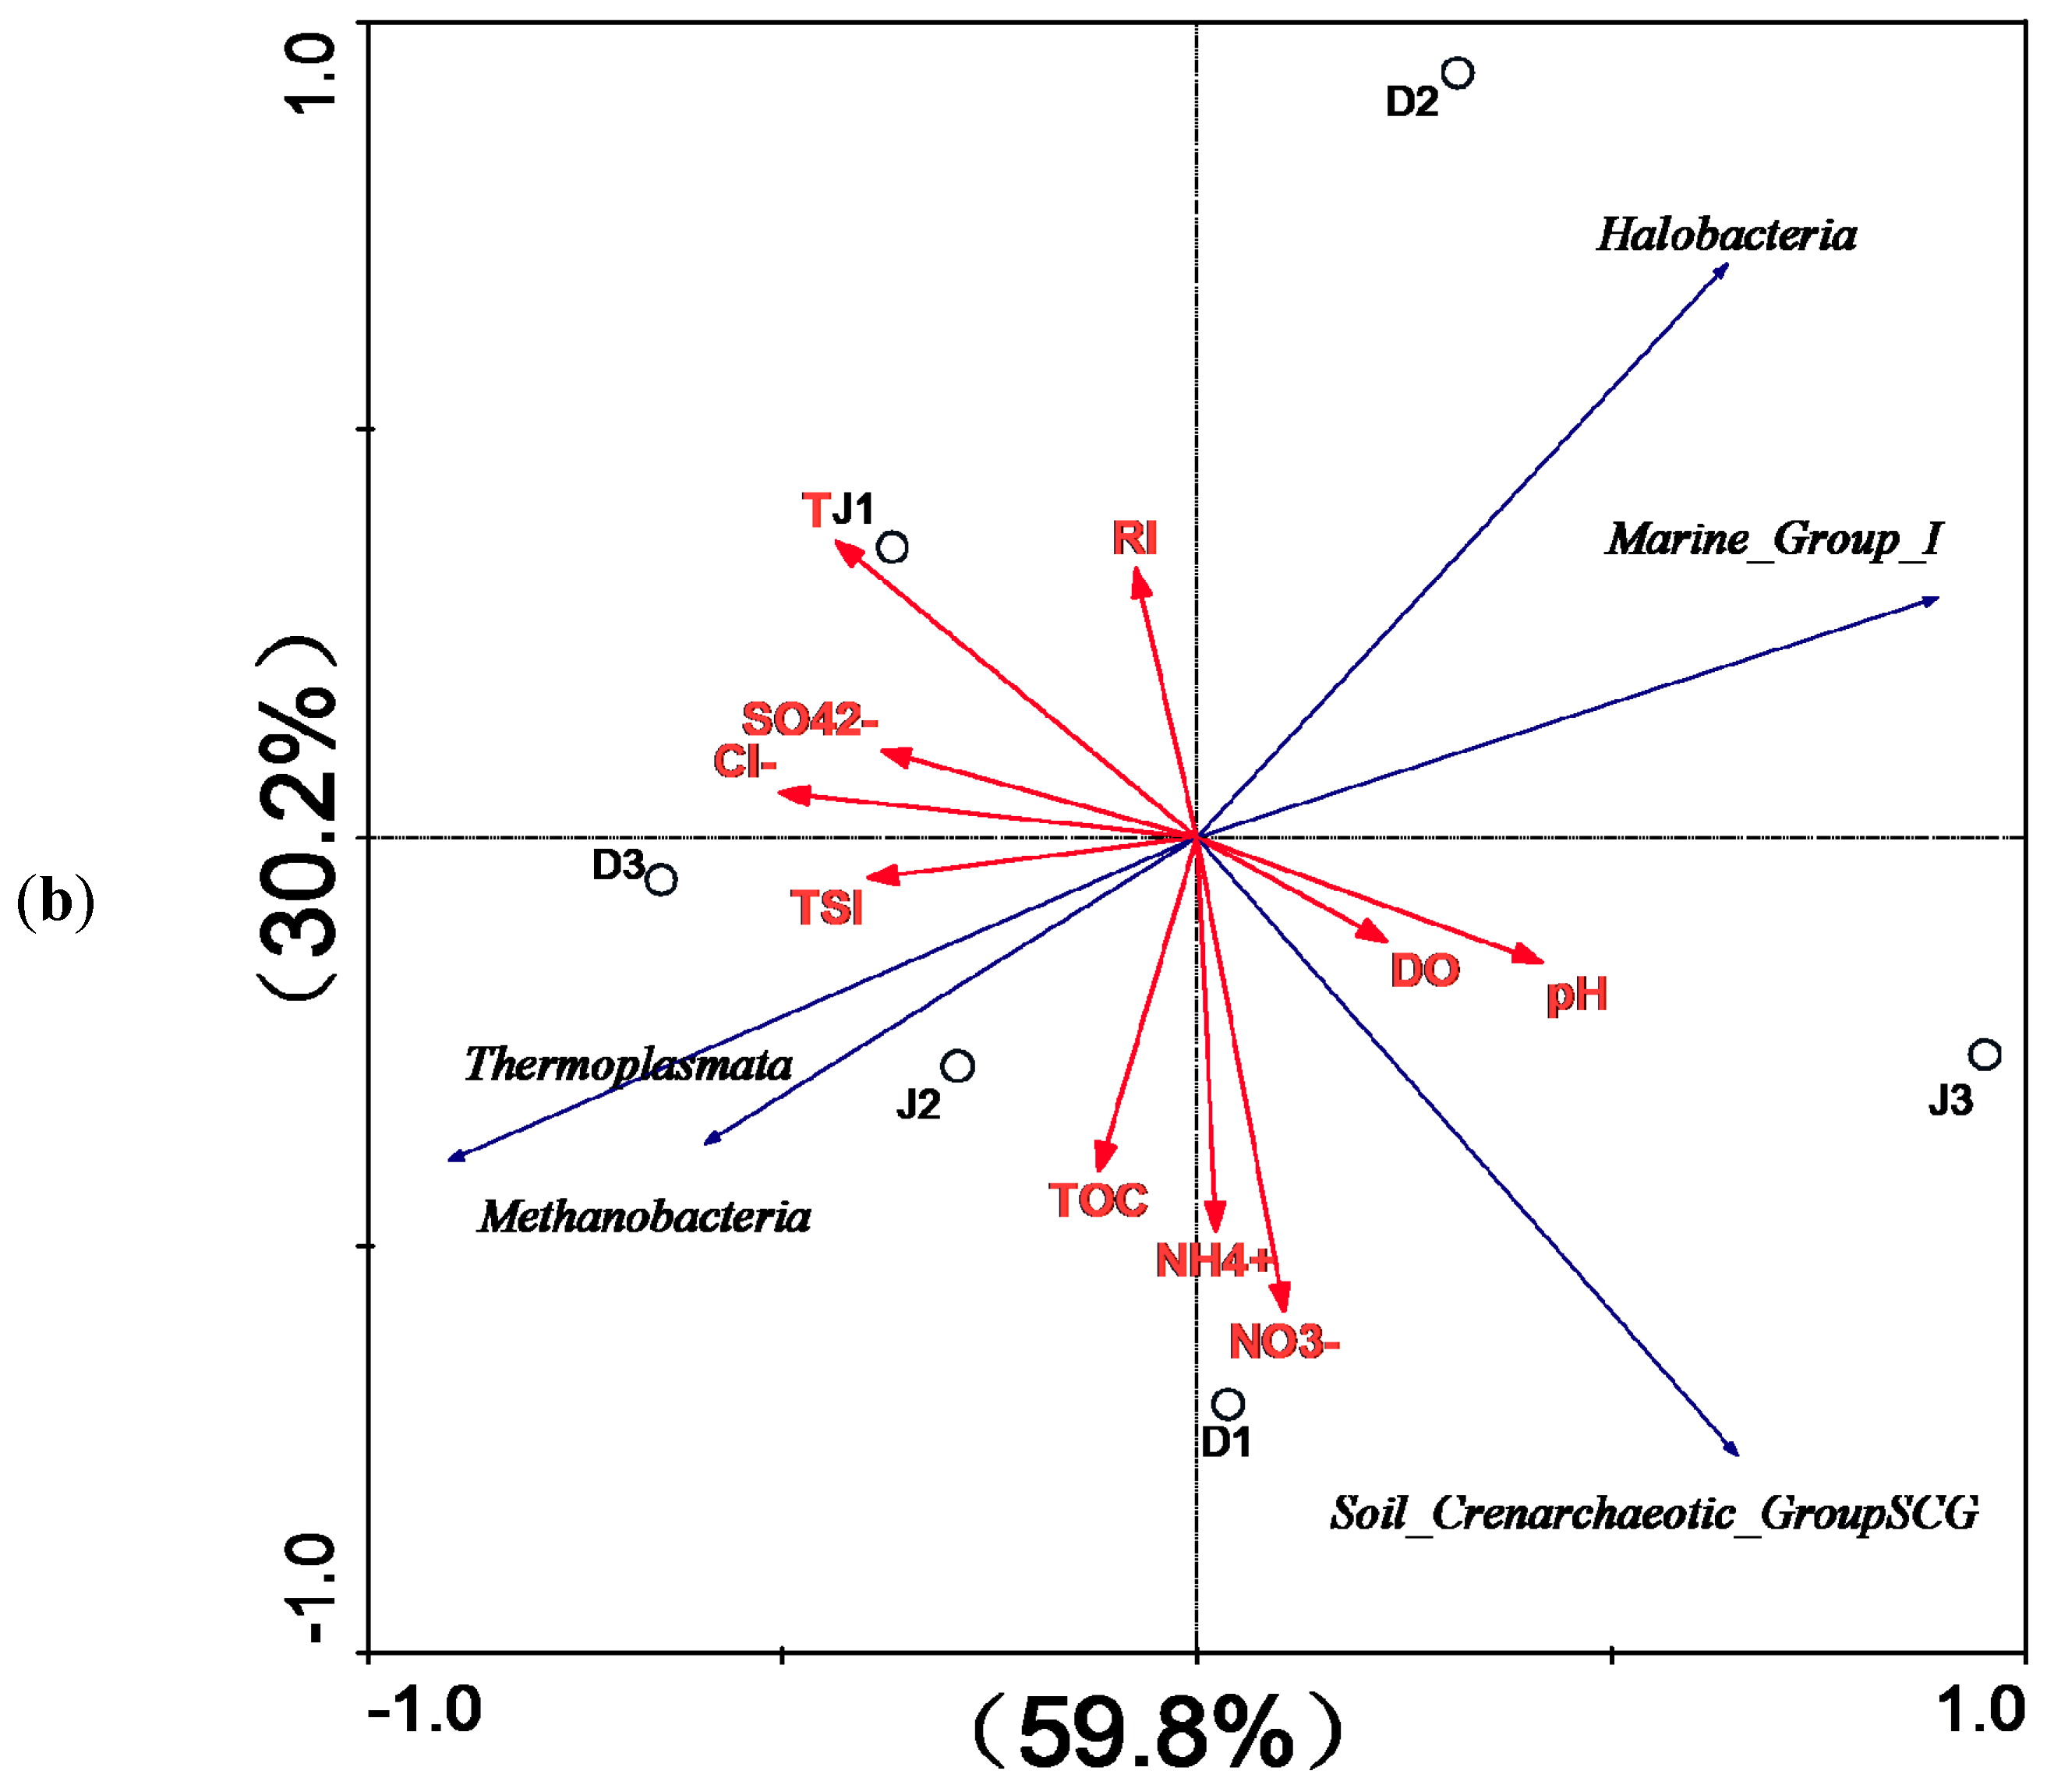
According to RDA, the environmental factors in the first two axes explained 60.3 and 23.8% of the total variance in bacterial composition, as well as 59.8% and 30.2% of that of the archaeal composition in the sediment of the two creeks. However, only SO42− (p = 0.009, F = 3.34, 999 Monte Carlo permutations) significantly contributed to the bacterial assemblage-environment relationship, while no other factors passed the Monte Carlo significance test. These findings indicate that the archaeal population was less influenced by environmental factors.
Among bacteria, Proteobacteria was the main phylum in the sediment at all six sites in both creeks, which was consistent with the results of previous studies of freshwater systems [10,22,54], including Taihu Lake and the Yangtze River estuary [55,56]. As shown in Table S1, Betaproteobacteria was dominant in the sediment of the sewage creek, and the abundance of Betaproteobacteria at the site D1 was higher than at sites D2 and D3. Betaproteobacteria was positively correlated with nitrogen nutrients and TSI, which was consistent with the results of previous studies that found that the abundance of Betaproteobacteria was correlated with nutrient concentrations and cellulose decomposition [57,58]. Epsilonproteobacteria and Deltaproteobacteria were dominant in the sediment at the site (J1), which was close to the industrial effluents’ source, where the concentrations of heavy metals and sulfate ions were higher than at other sites. Previous studies indicated that Epsilonproteobacteria was abundant in the animals' digestive tracts and near undersea hydrothermal vents, and that it exhibited good resistance to toxicity [59,60] and the ability to degrade some toxic substances [61]. However, Epsilonproteobacteria has rarely been detected in the sediments in the Taihu Basin [62]. Previous studies indicated that Deltaproteobacteria was ubiquitous in the environment, and closely related to the sulfur cycle between the water and sediment [63]. According to the RDA, Epsilonproteobacteria and Deltaproteobacteria were positively correlated with SO42− concentration and RI. Previous studies showed that some Epsilonproteobacteria have the ability to oxidize sulfur and sulfide into sulfate, as well as the ability to degrade some toxic substances [64,65]. Additionally, Deltaproteobacteria were shown to be closely related to sulfate reduction in sediment [66]. Further analysis found that the main genera belonging to Epsilonproteobacteria at J1 were Sulfurovum, Sulfurimonas, Sulfurospirillum, and Sulfuricurvum, which was similar to the results of previous studies of a submarine hydrothermal spring [67], marine surface sediment [68], and pond sediments [69]. Moreover, some researchers found that these bacterial genera could utilize elemental sulfur, sulfite, arsenate, or nitrate as electron acceptors [70]. The main bacterial genera of Deltaproteobacteria at J1 were Desulforhabdus amnigena, Desulfobacterium, and Desulfobacteraceae, which have been shown to use acetate as a substrate, as well as to strongly degrade organic pollutants [71]. Flavobacteria belonging to Bacteroidetes was more abundant at sites near the pollution source than at other sites in the same creek, and was positively correlated with Cl−, TSI, and nutrients (Figure 9a). These findings were consistent with the results reported by Abell et al. [72]. Previous studies indicated that Flavobacteria was dominant in a coking wastewater treatment system [73], alkaline environment system [74], and a highly saline environment [75]. Chloroflexia, which was found to be ubiquitous in Taihu Lake [76], was only detected in the sediment of the sewage creek. Chloroflexia was positively correlated with Cl−, TSI, TOC, and nutrients, but negatively correlated with RI (Figure 9a). Previous studies indicated that Chloroflexia is a photosynthetic bacteria that cannot live without light [77]. The Secchi-depth of the industry creek was low (mean (SD) = 0.24 m), indicating that light does not reach the bottom; therefore, the environment was unfavorable for the survival of Chloroflexi. Previous studies indicated that Chloroflexia was suited to live under brackish, nutrient-rich conditions [78]. Nitrospira, which was found to be more abundant at sites far away from the pollution source (D2, D3, J2, and J3), has often been found in freshwater ecosystems [79,80], sewage treatment systems [81], and anoxic environments as nitrite oxidizers [82]. Based on the results of RDA (Figure 9a), Nitrospira was positively correlated with NH4+-N, NO3 Cl−-N, TOC, and TSI, but negatively correlated with RI. Previous studies indicated that heavy metals might lead to a decline in the population of Nitrospira [83,84], but an increase in the population of Nitrospira with a low concentration of NH4+ (10 mg/L) in water [85].
Fewer phyla of archaea than bacteria were found in all samples of both creeks. Moreover, the effects of water quality of different pollution sources on archaeal diversity were not as obvious as those on bacterial diversity. Most archaeal sequences from the sediment of both creeks were affiliated with Euryarchaeota, which was consistent with the results reported by Liu et al. [86]. Halobacteria belonging to the phylum Euryarchaeota was dominant at all sites of both creeks, and showed no significant positive correlation with the environmental factors. However, previous studies indicated that Halobacteria exists in highly saline aquatic environments [87,88]. The second most abundant archaea in the sediment of the two creeks belonged to Thaumarchaeota. These previous studies indicated that Thaumarchaeota have been linked to methanogenic activities and ammonia oxidation in the environment [89,90]. The relative abundance of Methanobacteria was slightly higher in the sediment of the industry creek than that of the sewage creek. RDA analysis showed that Methanobacteria was positively correlated with TSI, NH4+-N, NO3−, Cl−-N, TOC, Cl−, and SO42+, but not with RI. Previous studies have shown that Methanobacteria was often found in sewage treatment facilities and some freshwater environments [91,92], and exhibited good resistance to toxicity [93].
5. Conclusions
The analysis of the diversity of bacteria and archaea in creeks influenced by sewage and industrial waste revealed that domestic and industrial pollution had different effects on the diversity and microbial abundance of the creeks. The influence of domestic and industrial pollution on the diversity and microbial abundance was dependent on the distances between the sampling sites and their pollution sources. A higher diversity and similarity among the sites was observed for bacteria in the sewage impacted creek than for that in the industrial waste impacted creek. Additionally, the water quality and diversity and abundance of both bacteria increased with the distance from the pollutant source in both creeks. The diversity and abundance of bacteria were more heavily influenced by the distance between the sampling sites and the pollutant source than those of archaea; therefore, the bacterial diversity and abundance could be a better index of ecological changes in creeks affected by domestic and industrial pollution than the archaeal diversity and abundance.
Supplementary Materials
The following are available online at www.mdpi.com/2073-4441/9/6/373/s1.
Acknowledgments
We thank Zhongqi Song and Caiyun Zhang for their help during the sample collection. We also thank Beijing Haocheng MingTai Technology Co. LTD, (Beijing, China) for their help with the sample analysis. We greatly appreciate the comments from the three anonymous reviewers. This study was financially supported by the Major Science and Technology Program for Water Pollution Control and Treatment (2012ZX07101-001), China.
Author Contributions
Da Li, Xia Jiang and Binghui Zheng conceived, designed, conducted and analyzed experimental data of this research; Da Li wrote the paper. Jinzhi Wang and Kun Wang polished the paper.
Conflicts of Interest
The authors declare no conflict of interest. The founding sponsors had no role in the design of the study; in the collection, analyses, or interpretation of data; in the writing of the manuscript, and in the decision to publish the results.
Ethical Statement
In this paper, we guarantee that the information we provide above has not been published or reviewed elsewhere, and that we did not violate ethical standards. There is no plagiarism in this study.
References
- Baken, L.R. Separation and purification of bacteria from soil. Appl. Environ. Microbiol. 1983, 49, 1482–1487. [Google Scholar]
- Medeirospm, M.; Fernandes, M.F.; Dick, R.P.; Simoneit, B.R.T. Seasonal variations in sugar contents and microbial community in a ryegrass soil. Chemosphere 2006, 65, 832–839. [Google Scholar] [CrossRef] [PubMed]
- Syakti, A.D.; Mazzella, N.; Nerini, D.; Guiliano, M.; Bertrand, J.C.; Doumenq, P. Phospholipid fatty acids of a marine sedimentary microbial community in a laboratory microcosm: Responses to petroleum hydrocarbon contamination. Org. Geochem. 2006, 37, 1617–1628. [Google Scholar] [CrossRef]
- Mondini, C.; Insam, H. Community level physiological profiling as a tool to evaluate compost maturity: A kinetic approach. Eur. J. Soil Biol. 2003, 39, 141–148. [Google Scholar] [CrossRef]
- Princic, A.; Mahne, I.; Megusar, F.; Paul, E.A.; Tiedje, J.M. Effects of pH and oxygen and ammonium concentrations on the community structure of nitrifying bacteria from wastewater. Appl. Environ. Microbiol. 1998, 64, 3584–3590. [Google Scholar] [PubMed]
- McCaig, A.E.; Phillips, C.J.; Stephen, J.R.; Kowalchuk, G.A.; Harvey, S.M.; Herbert, R.A.; Embley, T.M.; Prosser, J.I. Nitrogen cycling and community structure of proteobacterial β-subgroup ammonia-oxidizing bacteria within polluted marine fish farm sediments. Appl. Environ. Microbiol. 1999, 65, 213–220. [Google Scholar] [PubMed]
- Luo, C.W.; Tsementzi, D.; Kyrpides, N.; Read, T.; Konstantinidis, K.T. Direct comparisons of Illumina vs. Roche 454 sequencing technologies on the same microbial community DNA sample. PLoS ONE 2012, 7, e30087. [Google Scholar]
- Schuster, S.C. Next-generation sequencing transforms today’s biology. Nat. Methods 2008, 5, 16–18. [Google Scholar] [CrossRef] [PubMed]
- Zhou, J.; Guan, D.W.; Zhou, B.K.; Zhao, B.S.; Ma, M.C.; Qin, J.; Jiang, X.; Chen, S.F.; Cao, F.M.; Shen, D.L.; et al. Influence of 34-years of fertilization on bacterial communities in an intensively cultivated black soil in northeast China Soil. Soil Biol. Biochem. 2015, 90, 42–51. [Google Scholar] [CrossRef]
- Bai, Y.; Shi, Q.; Wen, D.; Li, Z.; Jefferson, W.A.; Feng, C.; Tang, X. Bacterial communities in the sediments of Dianchi Lake, a partitioned eutrophic waterbody in China. PLoS ONE 2012, 7, e37796. [Google Scholar] [CrossRef] [PubMed]
- Nogales, B.; Lanfranconi, M.P.; Pina-Villalonga, J.M.; Bosch, R. Anthropogenic perturbations in marine microbial communities. FEMS Microbiol. Rev. 2011, 35, 275–298. [Google Scholar] [CrossRef] [PubMed]
- Azarbad, H.; van Straalen, N.M.; Laskowski, R.; Nikiel, K.; Röling, W.F.M.; Niklińska, M. Susceptibility to additional stressors in metal-tolerant soil microbial communities from two pollution gradients. Appl. Soil Ecol. 2016, 98, 233–242. [Google Scholar] [CrossRef]
- Hamilton, S.K.; Kellndorfer, J.; Lehner, B.; Tobler, M. Remote sensing of floodplain geomorphology as a surrogate for biodiversity in a tropical river system (Madre de Dios, Peru). Geomorphology 2007, 89, 23–38. [Google Scholar] [CrossRef]
- Zhang, R.; Zhang, M.M. The analysis of govern contaminate measure about mainly pollution enter Tailake. North Environ. 2011, 23, 100–101. [Google Scholar]
- Ma, L.S.; Wang, Z.Q.; Zhang, S.M.; Ma, X.F.; Zhang, G.Y. Pollution from agricultural non point sources and its control in river system of Taihu Lake, JiangSu. Acta Sci. Circumstantiae 1997, 17, 39–47. [Google Scholar]
- Ahn, C.; Gillevet, P.M.; Sikaroodi, M. Molecular characterization of microbial communities in treatment microcosm wetlands as influenced by macrophytes and phosphorus loading. Ecol. Indic. 2007, 7, 852–863. [Google Scholar] [CrossRef]
- Shipin, O.; Koottatep, T.; Khanh, N.T.T.; Polprasert, C. Integrated natural treatment systems for developing communities: Low-tech N-removal through the fluctuating microbial pathways. Water Sci. Technol. 2005, 51, 299–306. [Google Scholar] [PubMed]
- Ligi, T.; Oopkaup, K.; Truu, M.; Preem, J.-K.; Nõlvak, H.; Mitsch, W.J.; Mander, U.; Truu, J. Characterization of bacterial communities in soil and sediment of a created riverine wetland complex using high-throughput 16S rRNA amplicon sequencing. Ecol. Eng. 2014, 72, 56–66. [Google Scholar] [CrossRef]
- Jiang, Y.; Sun, S.Y. Water environment improvement of Zhihugang River. China Water Res. 2009, 23, 35–38. [Google Scholar]
- Zhen, S.C.; Zhu, W. Analysis of isotope tracing of domestic sewage sources in Taihu Lake—A case study of Meiliang Bay and Gonghu Bay. Ecol. Indic. 2016, 66, 113–120. [Google Scholar] [CrossRef]
- Lin, L.; Wu, J.L.; Zeng, H.A.; Liu, W. Stable nitrogen isotope tracing anthropogenic influence on Lake Taihu. J. Lake Sci. 2012, 24, 546–552. [Google Scholar] [CrossRef]
- Wang, Z.; Yang, Y.Y.; He, T.; Xie, S.G. Change of microbial community structure and functional gene abundance in nonylphenol-degrading sediment. Appl. Microbiol. Biotechnol. 2015, 99, 3259–3268. [Google Scholar] [CrossRef] [PubMed]
- Fu, J.; Hu, X.; Tao, X.C.; Yu, H.X.; Zhang, X.W. Risk and toxicity assessments of heavy metals in sediments and fishes from the Yangtze River and Taihu Lake, China. Chemosphere 2013, 93, 1887–1895. [Google Scholar] [CrossRef] [PubMed]
- Ye, L.L.; Wu, X.D.; Liu, B.; Yan, D.Z.; Kong, F.X. Dynamics and sources of dissolved organic carbon during phytoplankton bloom in hypereutrophic Lake Taihu (China). Limnologica 2015, 54, 5–13. [Google Scholar] [CrossRef]
- Chen, F.Z.; Ye, J.L.; Shu, T.T.; Sun, Y.; Li, J. Zooplankton response to the lake restoration in the drinking-water source in Meiliang Bay of subtropical eutrophic Lake Taihu, China. Limnologica 2012, 42, 189–196. [Google Scholar] [CrossRef]
- Ni, J.J.; Yu, Y.H.; Feng, W.S.; Yan, Q.Y.; Pan, G.; Yang, B.; Zhang, X.; Li, X.M. Impacts of algal blooms removal by chitosan-modified soils on zooplankton community in Taihu Lake, China. J. Environ. Sci. 2010, 22, 1500–1507. [Google Scholar] [CrossRef]
- Jiang, X.; Wang, W.W.; Wang, S.H.; Zhang, B.; Hu, J.C. Initial identification of heavy metals contamination in Taihu Lake, a eutrophic lake in China. J. Environ. Sci. 2012, 24, 1539–1548. [Google Scholar] [CrossRef]
- Jin, X.C.; Tu, Q.Y. Criterion of Eutrophiction Survey on Lakes; Environmental Science Press: Beijing, China, 1998. [Google Scholar]
- Hori, T.; Sugiyama, M. Direct spectrophotometric determination of sulphate ion based on the formation of a blue molybdosulphate complex. Analyst 1998, 113, 1639–1642. [Google Scholar] [CrossRef]
- Dennis, K.L.; Wang, Y.; Blatner, N.R.; Wang, S.; Saadalla, A.; Trudeau, E.; Roers, A.; Weaver, C.T.; Lee, J.J.; Gilbert, J.A.; et al. Adenomatous polyps are driven by microbe-instigated focal inflammation and are controlled by IL-10–producing T Cells. Cancer. Res. 2013, 73, 5905–5913. [Google Scholar] [CrossRef] [PubMed]
- Thiago, M.A.; Pereira, R.V.; Caixeta, L.S.; Guard, C.L.; Bicalho, R.C. Microbial diversity in bovine papillomatous digital dermatitis in Holstein dairy cows from upstate New York. FEMS Microbiol. Ecol. 2012, 79, 518–529. [Google Scholar]
- Magoč, T.; Salzberg, S.L. FLASH: Fast length adjustment of short reads to improve genome assemblies. Bioinformatics 2011, 27, 2957–2963. [Google Scholar] [CrossRef] [PubMed]
- Bolger, A.M.; Marc, L.; Bjoern, U. Trimmomatic: A flexible trimmer for Illumina sequence data. Bioinformatics 2014, 30, 2114–2120. [Google Scholar] [CrossRef] [PubMed]
- Quast, C.; Pruesse, E.; Yilmaz, P.; Gerken, J.; Schweer, T.; Yarza, P.; Peplies, J.; Glöckner, F.O. The SILVA ribosomal RNA gene database project: Improved data processing and web-based tools. Nucl. Acids Res. 2013, 41, 590–596. [Google Scholar] [CrossRef] [PubMed]
- Cole, J.R.; Wang, Q.; Cardenas, E. The Ribosomal Database Project: Improved alignments and new tools for rRNA analysis. Nucleic. Acids. Res. 2009, 37, D141–D145. [Google Scholar] [CrossRef] [PubMed]
- Wang, Q.; Garrity, G.M.; Tiedje, J.M.; Cole, J.R. Naive Bayesian classifier for rapid assignment of rRNA sequences into the new bacterial taxonomy. Appl. Environ. Microbiol. 2007, 73, 5261–5267. [Google Scholar] [CrossRef] [PubMed]
- Schloss, P.D.; Gevers, D.; Westcott, S.L. Reducing the effects of PCR amplification and sequencing artifacts on 16S rRNA-based studies. PLoS ONE 2011, 6, e27310. [Google Scholar] [CrossRef] [PubMed]
- Wang, Y.; Sheng, H.F.; He, Y. Comparison of the levels of bacterial diversity in freshwater, intertidal wetland, and marine sediments by using millions of Illumina Tags. Appl. Environ. Microbiol. 2012, 78, 8264–8271. [Google Scholar] [CrossRef] [PubMed]
- Lepš, J.; Šmilauer, P. Multivariate Analysis of Ecological Data Using CANOCO; Cambridge University Press: New York, NY, USA, 2003. [Google Scholar]
- Chen, C.X.; Jiang, X.; Zhan, Y.Z.; Jin, X.C.; Zhao, Z. Speciation distribution and potential ecological risk assessment of heavy metals in sediments of Taihu Lake. China Environ. Sci. 2011, 31, 1842–1848. [Google Scholar]
- Liu, Y.; Xiao, L. Comprehensive evaluation of ecological risk of heavy metal pollution in the surface sediments of Taihu Lake. Environ. Prot. Sci. 2014, 40, 46–50. [Google Scholar]
- Yang, C.; Wang, P.F.; Liu, J.J.; Wang, C.; Hou, J.; Qian, J. Vertical distribution and migration of heavy metals in sediment cores of Taihu Lake. J. Agro Environ. Sci. 2016, 35, 548–557. [Google Scholar]
- Wang, S.M.; Dou, H.S. Lakes of China; Science Press: Beijing, China, 1998. [Google Scholar]
- Hakanson, L. An ecological risk index for aquatic pollution control a sedimentological approach. Water Res. 1980, 14, 975–1001. [Google Scholar] [CrossRef]
- Gagen, E.J.; Huber, H.; Meador, T. Novel cultivation-based approach to understanding the miscellaneous crenarchaeotic group (MCG) archaea from sedimentary ecosystems. Appl. Environ. Microbiol. 2013, 79, 6400–6406. [Google Scholar] [CrossRef] [PubMed]
- Kubo, K.; Lloyd, K.G.; Biddle, J.F. Archaea of the Miscellaneous Crenarchaeotal Group are abundant, diverse and widespread in marine sediments. ISME J. 2012, 6, 1949–1965. [Google Scholar] [CrossRef] [PubMed]
- Haller, L.; Tonolla, M.; Zopfi, J.; Peduzzi, R.; Wildi, W.; Poté, J. Composition of bacterial and archaeal communities in freshwater sediments with different contamination levels (Lake Geneva, Switzerland). Water Res. 2011, 45, 1213–1228. [Google Scholar] [CrossRef] [PubMed]
- Zhang, B.; Kong, W.; Wu, N. Bacterial diversity and community along the succession of biological soil crusts in the Gurbantunggut Desert, Northern China. J. Basic Microbiol. 2016, 56, 670. [Google Scholar] [CrossRef] [PubMed]
- Lin, H.Y.; Han, W.Y. Water quality assessment and analysis before and after the decade of the dry period in Lingdingyang Estuary of the Pearl River Mouth. Mar. Environ. Sci. 2001, 20, 28–31. [Google Scholar]
- Chen, Y.W.; Fan, C.X.; Katrin, T. Changes of nutrients and phytoplankton chlorophyll-a in a large shallow lake, Taihu, China: An 8-year investigation. Hydrobiologia 2003, 506, 273–279. [Google Scholar] [CrossRef]
- Pinto, A.B.; Pagnocca, F.C.; Pinheiro, M.A.A.; Fontes, R.F.; de Oliveira, A.J. Heavy metals and TPH effects on microbial abundance and diversity in two estuarine areas of the southern-central coast of São Paulo State, Brazil. Mar. Pollut. Bull. 2015, 96, 410–417. [Google Scholar] [CrossRef] [PubMed]
- Khan, A.H.A.; Anees, M.; Arshad, M.; Muhammad, Y.S.; Iqbal, M.; Yousaf, S. Effects of illuminance and nutrients on bacterial photo-physiology of hydrocarbon degradation. Sci. Total Environ. 2016, 557, 705–711. [Google Scholar] [CrossRef] [PubMed]
- Zhao, X.Q.; Yang, L.Y.; Yin, D.Q. Vertical distribution of physicochemical characteristics and the microbial diversity in different spatial sediments samples in Lake Taihu. Environ. Sci. 2008, 29, 3537–3545. [Google Scholar]
- Freitag, T.E.; Chang, L.; Prosser, J.I. Changes in the community structure and activity of betaproteobacterial ammonia-oxidizing sediment bacteria along a freshwater-marine gradient. Environ. Microbiol. 2006, 8, 684. [Google Scholar] [CrossRef] [PubMed]
- Shao, K.Q.; Gao, G.; Wang, Y.P.; Tang, X.M.; Qin, B.Q. Vertical diversity of sediment bacterial communities in two different trophic states of the eutrophic Lake Taihu, China. J. Environ. Sci. 2013, 25, 1186–1194. [Google Scholar] [CrossRef]
- Feng, B.; Li, X.; Wang, J.; Hu, Z.; Meng, H.; Xiang, L.; Quan, Z. Bacterial diversity of water and sediment in the Changjiang estuary and coastal area of the East China Sea. FEMS Microbiol. Ecol. 2009, 70, 236–248. [Google Scholar] [CrossRef] [PubMed]
- Schneider, T.; Schmid, E.; de Castro, J.V.; Cardinale, M.; Eberl, L.; Grube, M.; Berg, G.; Riedel, K. Structure and function of the symbiosis partners of the lung lichen (Lobaria pulmonaria L. Hoffm.) analyzed by metaproteomics. Proteomics 2011, 11, 2752–2756. [Google Scholar] [CrossRef] [PubMed]
- Grube, M.; Koeberl, M.; Lackner, S.; Berg, C.; Berg, G. Host-parasite interaction and microbiome response: Effects of fungal infections on the bacterial community of the Alpine lichen Solorina crocea. FEMS Microbiol. Ecol. 2012, 82, 472–481. [Google Scholar] [CrossRef] [PubMed]
- Lertsethtakarn, P.; Ottemann, K.M.; Hendrixson, D.R. Motility and chemotaxis in campylobacter and helicobacter. Annu. Rev. Microbiol. 2011, 65, 389–410. [Google Scholar] [CrossRef] [PubMed]
- Nakagawa, S.; Takaki, Y.; Shimamura, S.; Reysenbach, A.L.; Takai, K.; Horikoshi, K. Deep-sea vent epsilon-proteobacterial genomes provide insights into emergence of pathogens. Proc. Natl. Acad. Sci. USA 2007, 104, 12146–12150. [Google Scholar] [CrossRef] [PubMed]
- Grube, M.; Cernava, T.; Soh, J.; Fuchs, S.; Aschenbrenner, I.; Lassek, C.; Wegner, U.; Becher, D.; Riedel, K.; Sensen, C.W.; et al. Exploring functional contexts of symbiotic sustain within lichen associated bacteria by comparative omics. ISME J. 2015, 9, 412–424. [Google Scholar] [CrossRef] [PubMed]
- Chen, N.; Yang, J.S.; Qu, J.H.; Li, H.F.; Liu, W.J.; Li, B.Z.; Wang, E.T.; Yuan, H.L. Sediment prokaryote communities in different sites of eutrophic Lake Taihu and their interactions with environmental factors. World J. Microbiol. Biotechnol. 2015, 31, 883–896. [Google Scholar] [CrossRef] [PubMed]
- Tamaki, H.; Sekiguchi, Y.; Hanada, S.; Nakamura, K.; Nomura, N.; Matsumura, M.; Kamagata, Y. Comparative analysis of bacterial diversity in freshwater sediment of a shallow eutrophic lake by molecular and improved cultivation-based techniques. Appl. Environ. Microbiol. 2005, 71, 2162–2169. [Google Scholar] [CrossRef] [PubMed]
- Borin, S.; Brusetti, L.; Mapelli, F. Sulfur cycling and methanogenesis primarily drive microbial colonization of the highly sulfidic urania deep hypersaline basin. Proc. Natl. Acad. Sci. USA 2009, 106, 9151–9156. [Google Scholar] [CrossRef] [PubMed]
- Li, D.; Qi, R.; Yang, M. Bacterial community characteristics under long-term antibiotic selection pressures. Water Res. 2011, 45, 6063–6073. [Google Scholar] [CrossRef] [PubMed]
- Wang, X.; Hu, M.; Xia, Y. Pyrosequencing analysis of bacterial diversity in 14 wastewater treatment systems in china. Appl. Environ. Microbiol. 2012, 78, 7042. [Google Scholar] [CrossRef] [PubMed]
- Takai, K.; Suzuki, M.; Nakagawa, S.; Miyazaki, M.; Suzuki, Y.; Inagaki, F.; Horikoshi, K. Sulfurimonas paralvinellae sp. nov., a novel mesophilic, hydrogen- and sulfur-oxidizing chemolithoautotroph within the Epsilonproteobacteria isolated from a deep-sea hydrothermal vent polychaete nest, reclassification of Thiomicrospira denitrificans as Sulfurimonas denitrificans comb. nov. and emended description of the genus Sulfurimonas. Int. J. Syst. Evol. Microbiol. 2006, 56, 1725–1733. [Google Scholar] [PubMed]
- Kodama, Y.; Watanabe, K. Sulfuricurvum kujiense gen. nov., sp. nov., a facultatively anaerobic, chemolithoautotrophic, sulfur oxidizing bacterium isolated from an underground crude-oil storage cavity. Int. J. Syst. Evol. Microbiol. 2004, 54, 2297–2300. [Google Scholar] [CrossRef] [PubMed]
- Sikorski, J.; Lapidus, A.; Copeland, A.; Del Rio, T.G.; Nolan, M.; Lucas, S.; Chen, F.; Tice, H.; Cheng, J.F.; Saunders, E.; et al. Complete genome sequence of Sulfurospirillum deleyianum type strain (5175T). Stand. Genomic Sci. 2010, 2, 149–157. [Google Scholar] [CrossRef] [PubMed]
- Kodama, Y.; Ha, L.T.; Watanabe, K. Sulfurospirillum cavolei sp. nov., a facultatively anaerobic sulfur-reducing bacterium isolated from an underground crude oil storage cavity. Int. J. Syst. Evolut. Microbiol. 2007, 57, 827–831. [Google Scholar] [CrossRef] [PubMed]
- Muyzer, G.; Stams, A. The ecology and biotechnology of sulphate-reducing bacteria. Nat. Rev. Microbiol. 2008, 6, 441–454. [Google Scholar] [CrossRef] [PubMed]
- Abell, G.C.; Bowman, J.P. Ecological and biogeographic relationships of class Flavobacteria in the Southern Ocean. FEMS Microbiol. Ecol. 2005, 51, 265–277. [Google Scholar] [CrossRef] [PubMed]
- Zhu, X; Tian, J.; Liu, C.; Chen, L. Composition and dynamics of microbial community in a zeolite biofilter-membrane bioreactor treating coking wastewater. Appl. Microbiol. Biotechnol. 2013, 97, 8767–8775. [Google Scholar] [CrossRef] [PubMed]
- Bonmati, A.; Sotres, A.; Mu, Y.; Rozendal, R.; Rabaey, K. Oxalate degradation in a bioelectrochemical system: Reactor performance and microbial community characterization. Bioresour. Technol. 2013, 143, 147–153. [Google Scholar] [CrossRef] [PubMed]
- Yoshizawa, S.; Kawanabe, A.; Ito, H.; Kandori, H.; Kogure, K. Diversity and functional analysis of proteorhodopsin in marine flavobacteria. Environ. Microbiol. 2012, 14, 1240–1248. [Google Scholar] [CrossRef] [PubMed]
- Jian, H.Q.; Hong, L.Y.; Wang, E.T.; Li, C.; Huang, H.Z. Bacterial diversity in sediments of the eutrophic Guanting Reservoir, China, estimated by analyses of 16S rDNA sequence. Biodivers. Conserv. 2008, 17, 1667–1683. [Google Scholar]
- Bauld, J.; Brock, T.D. Ecological studies of Chloroflexis, a gliding photosynthetic bacterium. Arch. Microbiol. 1973, 92, 267–284. [Google Scholar] [CrossRef]
- Liu, K.; Chunbo, H.; Jiao, J.J.; Jidong, G. Bacterial Investigation of Ammonium-Rich Sediment in the Pearl River Delta, China; American Geophysical Union: Washington, DC, USA, 2011. [Google Scholar]
- Johnson, D.B.; Hallberg, K.B. Carbon, iron and sulfur metabolism in acidophilic micro-organisms. Adv. Microb. Physiol. 2009, 54, 201–255. [Google Scholar]
- Falagán, C.; Sánchez-España, J.; Johnson, D.B. New insights into the biogeochemistry of extremely acidic environments revealed by a combined cultivation-based and culture independent study of two stratifi ed pit lakes. FEMS Microbiol. Ecol. 2014, 87, 231–243. [Google Scholar] [CrossRef] [PubMed]
- Mota, C.; Head, M.A.; Ridenoure, J.A.; Cheng, J.J. Effects of aeration cycles on nitrifying bacterial populations and nitrogen removal in intermittently aerated reactors. Appl. Environ. Microbiol. 2005, 71, 8565–8572. [Google Scholar] [CrossRef] [PubMed]
- Altmann, D.; Stief, P.; Amann, R.; de Beer, D.; Schramm, A. In situ distribution and activity of nitrifying bacteria in freshwater sediment. Environ. Microbiol. 2003, 5, 798–803. [Google Scholar] [CrossRef] [PubMed]
- Wang, F.D.; Huang, Y.; Gao, H. Effect of heavy metal of A/O biological nitrogen removal system. J. Shenyang Arch. Civ. Eng. Univ. 2003, 19, 154–156. [Google Scholar]
- Ceven, F.; Semerci, N.; Geyik, A.G. Inhibition of respiration and distribution of Cd, Pb, Hg, Ag and Cr species in a nitrifying sludge. J. Hazard. Mater. 2010, 178, 619–627. [Google Scholar]
- Liu, S.; Shen, L.D.; Lou, L.P.; Tian, G.M.; Zheng, P.; Hu, B.L. Spatial distribution and factors shaping the niche segregation of ammonia-oxidizing microorganisms in the Qiantang River, China. Appl. Environ. Microbiol. 2013, 79, 4065–4071. [Google Scholar] [CrossRef] [PubMed]
- Liu, F.H.; Lin, G.H.; Gao, G.; Qin, B.Q.; Zhang, J.S.; Zhao, G.P.; Zhou, Z.H.; Shen, J.H. Bacterial and archaeal assemblages in sediments of a large shallow freshwater lake Lake Taihu as revealed by denaturing gradient gel electrophoresis. J. Appl. Microbiol. 2009, 106, 1022–1032. [Google Scholar] [CrossRef] [PubMed]
- Dorador, C.; Vila, I.; Remonsellez, F.; Imhoff, J.F.; Witzel, K.-P. Unique clusters of archaea in salar de huasco, an athalassohaline evaporitic basin of the Chilean Altiplano. FEMS Microbiol. Ecol. 2010, 73, 291–302. [Google Scholar] [CrossRef] [PubMed]
- Ciobanu, M.C.; Rabineau, M.; Droz, L. Sedimentological imprint on subseafloor microbialcommunities in Western Mediterranean Sea Quaternary sediments. Biogeosciences 2012, 9, 3491–3512. [Google Scholar] [CrossRef]
- Jung, M.Y.; Park, S.J.; Kim, S.J.; Kim, J.G.; Sinninghe Damsté, J.S.; Jeon, C.O.; Rhee, S.K. A mesophilic, autotrophic, ammonia-oxidizing archaeon of thaumarchaeal group I.1a cultivated from a deep oligotrophic soil horizon. Appl. Environ. Microbiol. 2014, 80, 3645–3655. [Google Scholar] [CrossRef] [PubMed]
- Poulsen, M.; Schwab, C.; Jensen, B.B.; Engberg, R.M.; Spang, A.; Canibe, N.; Højberg, O.; Milinovich, G.; Fragner, L.; Schleper, C.; et al. Methylotrophic methanogenic Thermoplasmata implicated in reduced methane emissions from bovine rumen. Nat. Commun. 2013, 4, 66–78. [Google Scholar] [CrossRef] [PubMed]
- Shi, R.; Zhang, Y.; Yang, W.; Xu, H. Microbial community characterization of an UASB treating increased organic loading rates of vitamin C biosynthesis wastewater. Water Sci. Technol. 2012, 65, 254–261. [Google Scholar] [CrossRef] [PubMed]
- Zhang, G.S.; Tian, J.Q.; Jiang, N.; Guo, X.P.; Wang, Y.F.; Dong, X.Z. Methanogen community in Zoige wetland of Tibetan plateau and phenotypic characterization of adominant uncultured methanogen cluster ZC-1. Environ. Microbiol. 2008, 10, 1850–1860. [Google Scholar] [CrossRef] [PubMed]
- Gorra, R.; Webster, G.; Martin, M.; Celi, L.; Mapelli, F.; Weightman, A.J. Dynamic microbial community associated with iron–arsenic co-precipitation products from a groundwater storage system in Bangladesh. Microb. Ecol. 2012, 64, 171–186. [Google Scholar] [CrossRef] [PubMed]
Figure 1.
Map of the creeks and sample sites. (a) Creek polluted by sewage (in blue rectangle); (b) creek polluted by industrial effluent (in green rectangle).
Figure 1.
Map of the creeks and sample sites. (a) Creek polluted by sewage (in blue rectangle); (b) creek polluted by industrial effluent (in green rectangle).

Figure 2.
Phylum distribution of sediment bacteria (a) and archaea (b) in the creeks (with relative abundance >1%).
Figure 2.
Phylum distribution of sediment bacteria (a) and archaea (b) in the creeks (with relative abundance >1%).
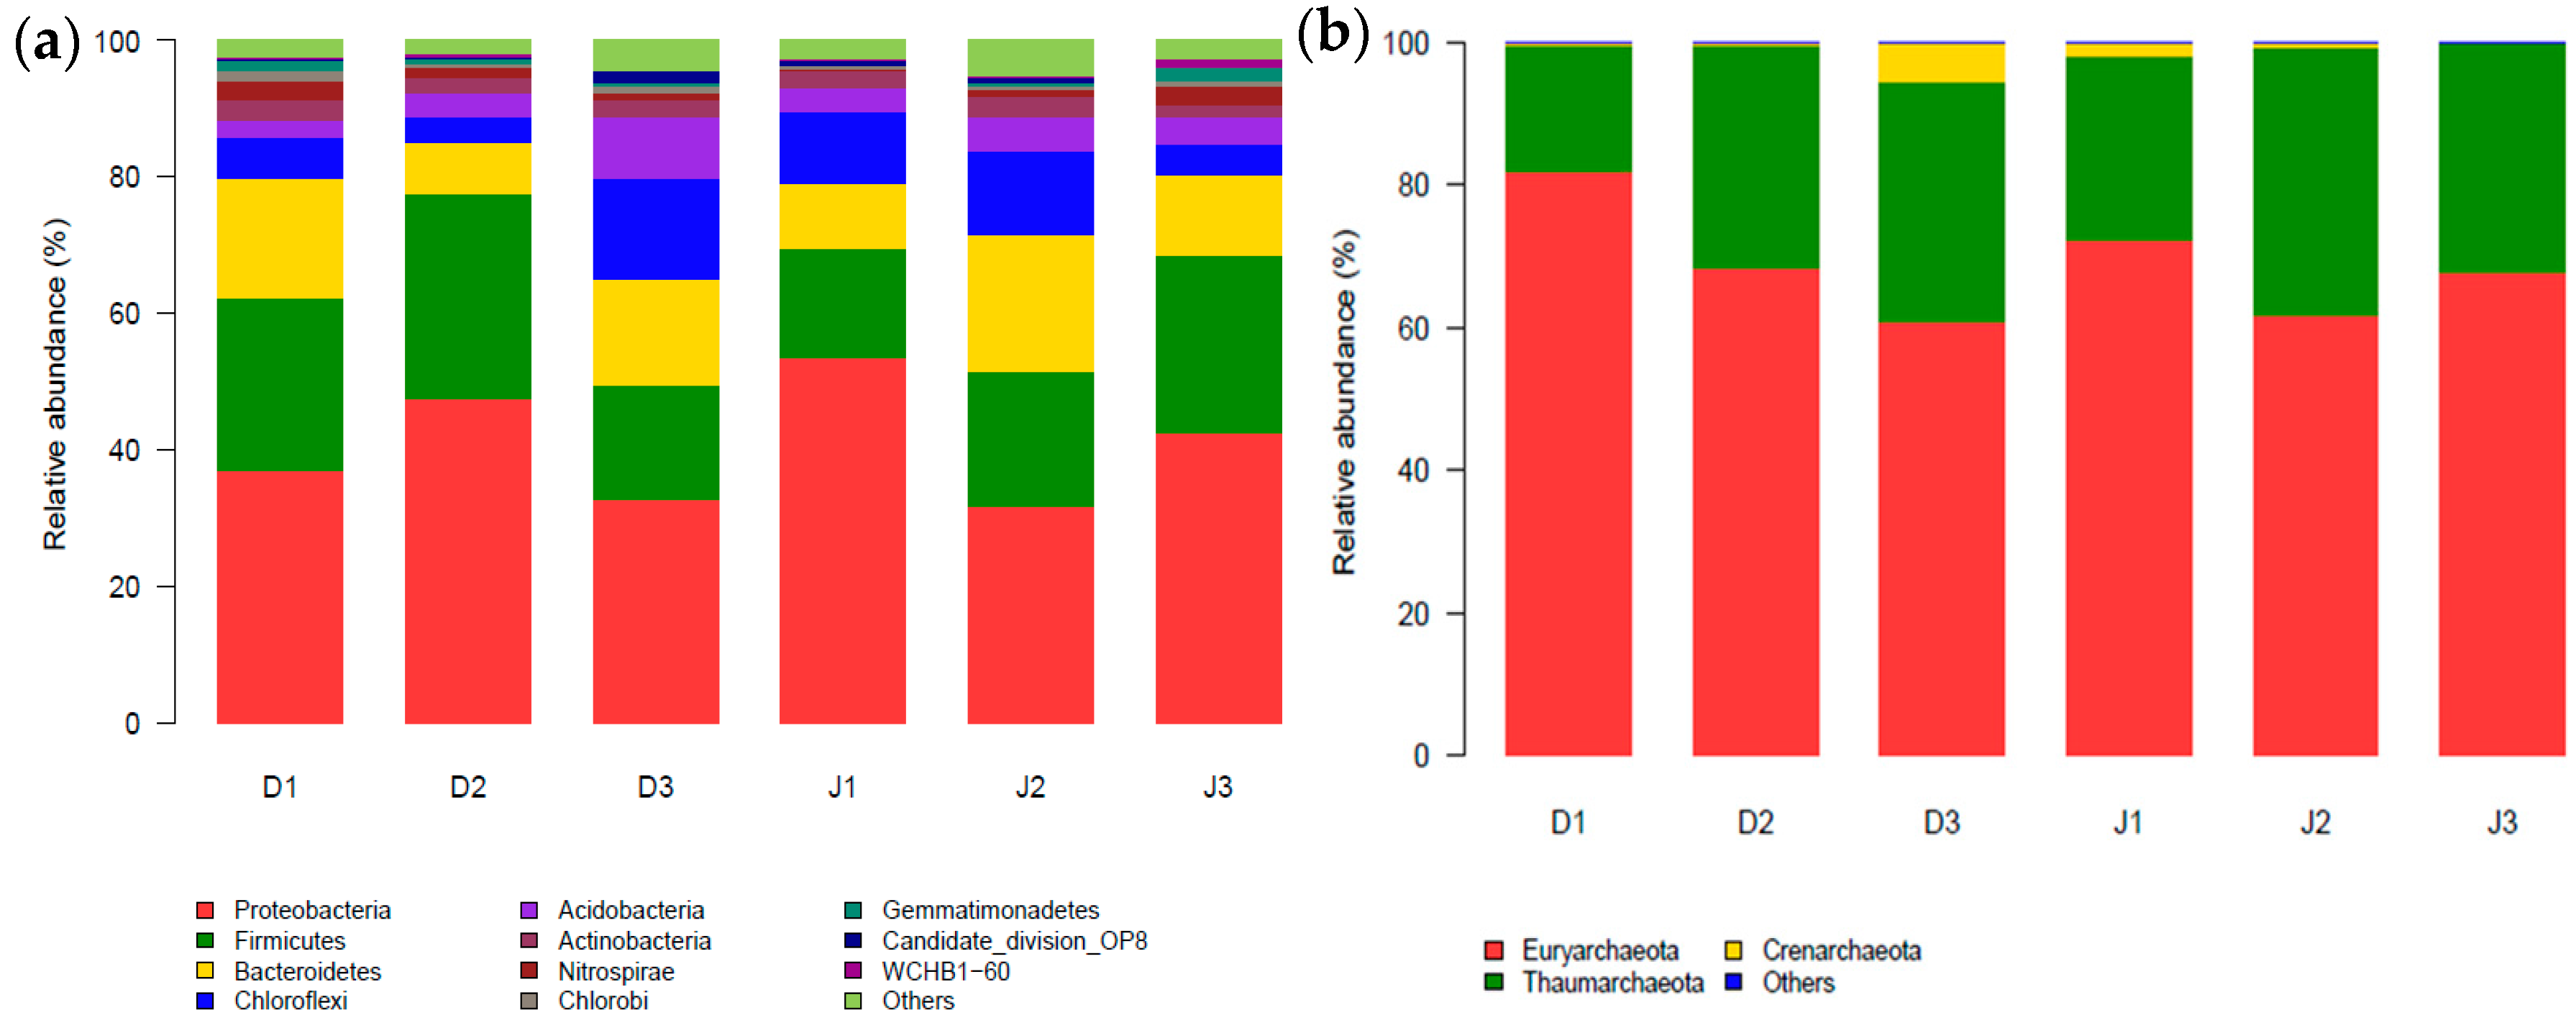
Figure 3.
Bacterial genera of samples in the creeks (with relative abundances >0.01%). The heat map was plotted using the R program.
Figure 3.
Bacterial genera of samples in the creeks (with relative abundances >0.01%). The heat map was plotted using the R program.

Figure 4.
Community analysis based on PCoA on the Bra—Curtis distances of bacteria. (a) Bacterial genes; (b) Archaeal genes.
Figure 4.
Community analysis based on PCoA on the Bra—Curtis distances of bacteria. (a) Bacterial genes; (b) Archaeal genes.
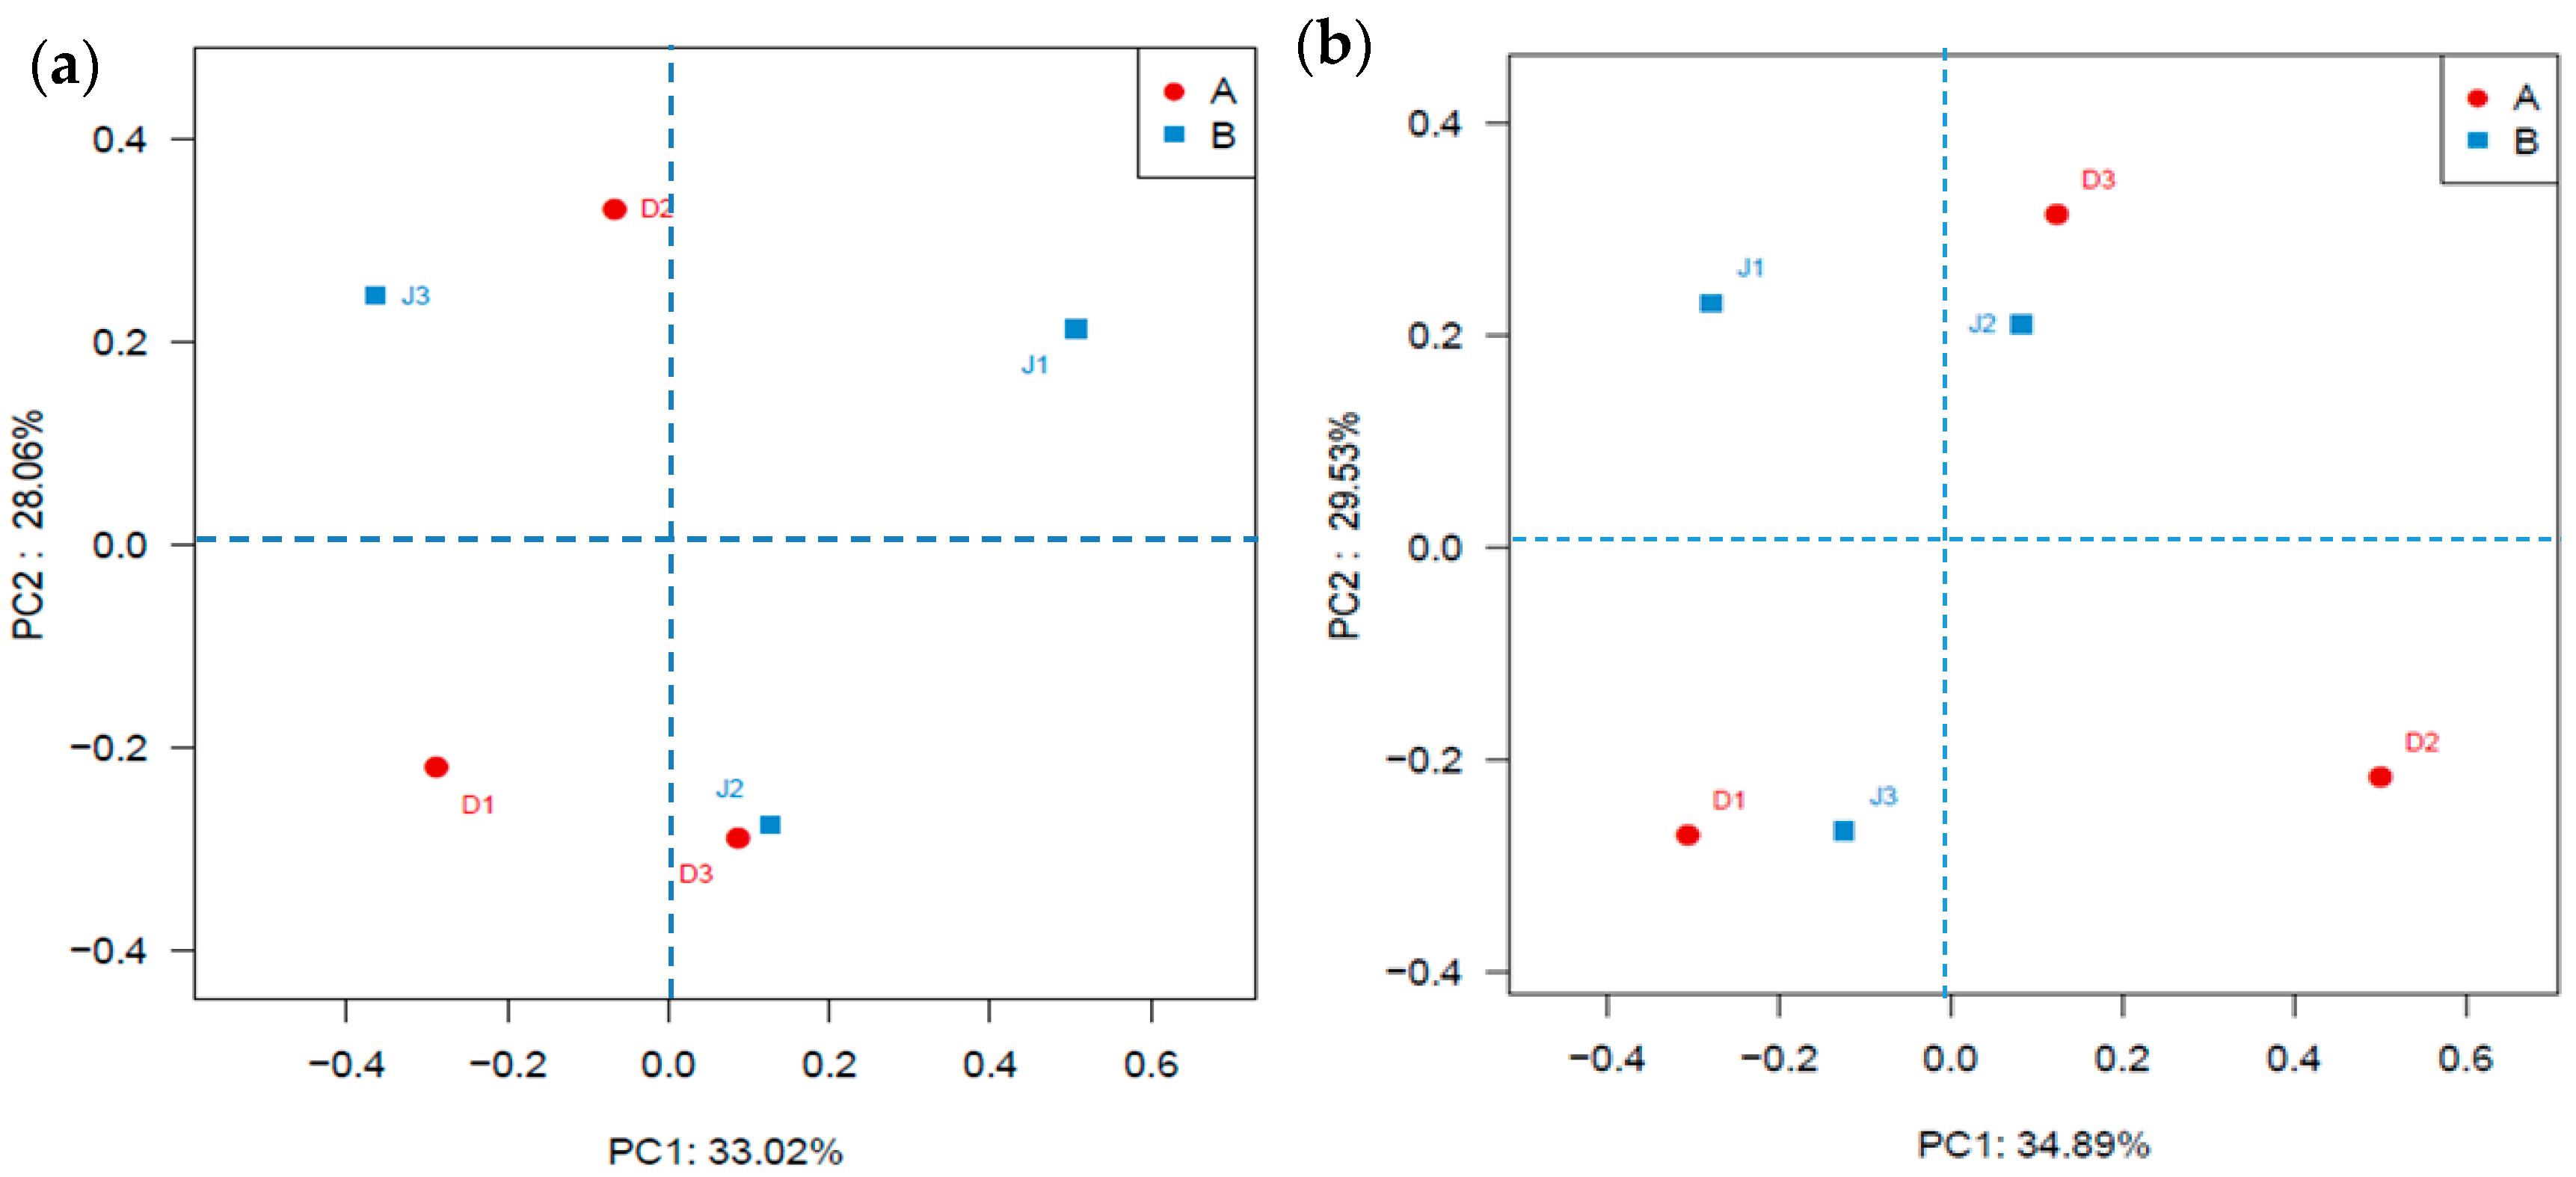
Figure 5.
Shared OTUs analysis of bacterial 16S rRNA gene libraries of the samples in (a) sewage creek; (b) industry creek.
Figure 5.
Shared OTUs analysis of bacterial 16S rRNA gene libraries of the samples in (a) sewage creek; (b) industry creek.

Figure 6.
Archaeal genera of samples in the creeks (with relative abundances >0.01%). The heat map was plotted using the R program.
Figure 6.
Archaeal genera of samples in the creeks (with relative abundances >0.01%). The heat map was plotted using the R program.

Figure 7.
Shared OTUs of the archaeal 16S rRNA gene libraries of samples from (a) sewage creek; (b) industry creek.
Figure 7.
Shared OTUs of the archaeal 16S rRNA gene libraries of samples from (a) sewage creek; (b) industry creek.

Figure 8.
Cluster dendrogram showing the grouping of sampling sites based on RI, TSI, and concentrations of SO42−, Cl−, NH4+-N, and NO3−-N.
Figure 8.
Cluster dendrogram showing the grouping of sampling sites based on RI, TSI, and concentrations of SO42−, Cl−, NH4+-N, and NO3−-N.
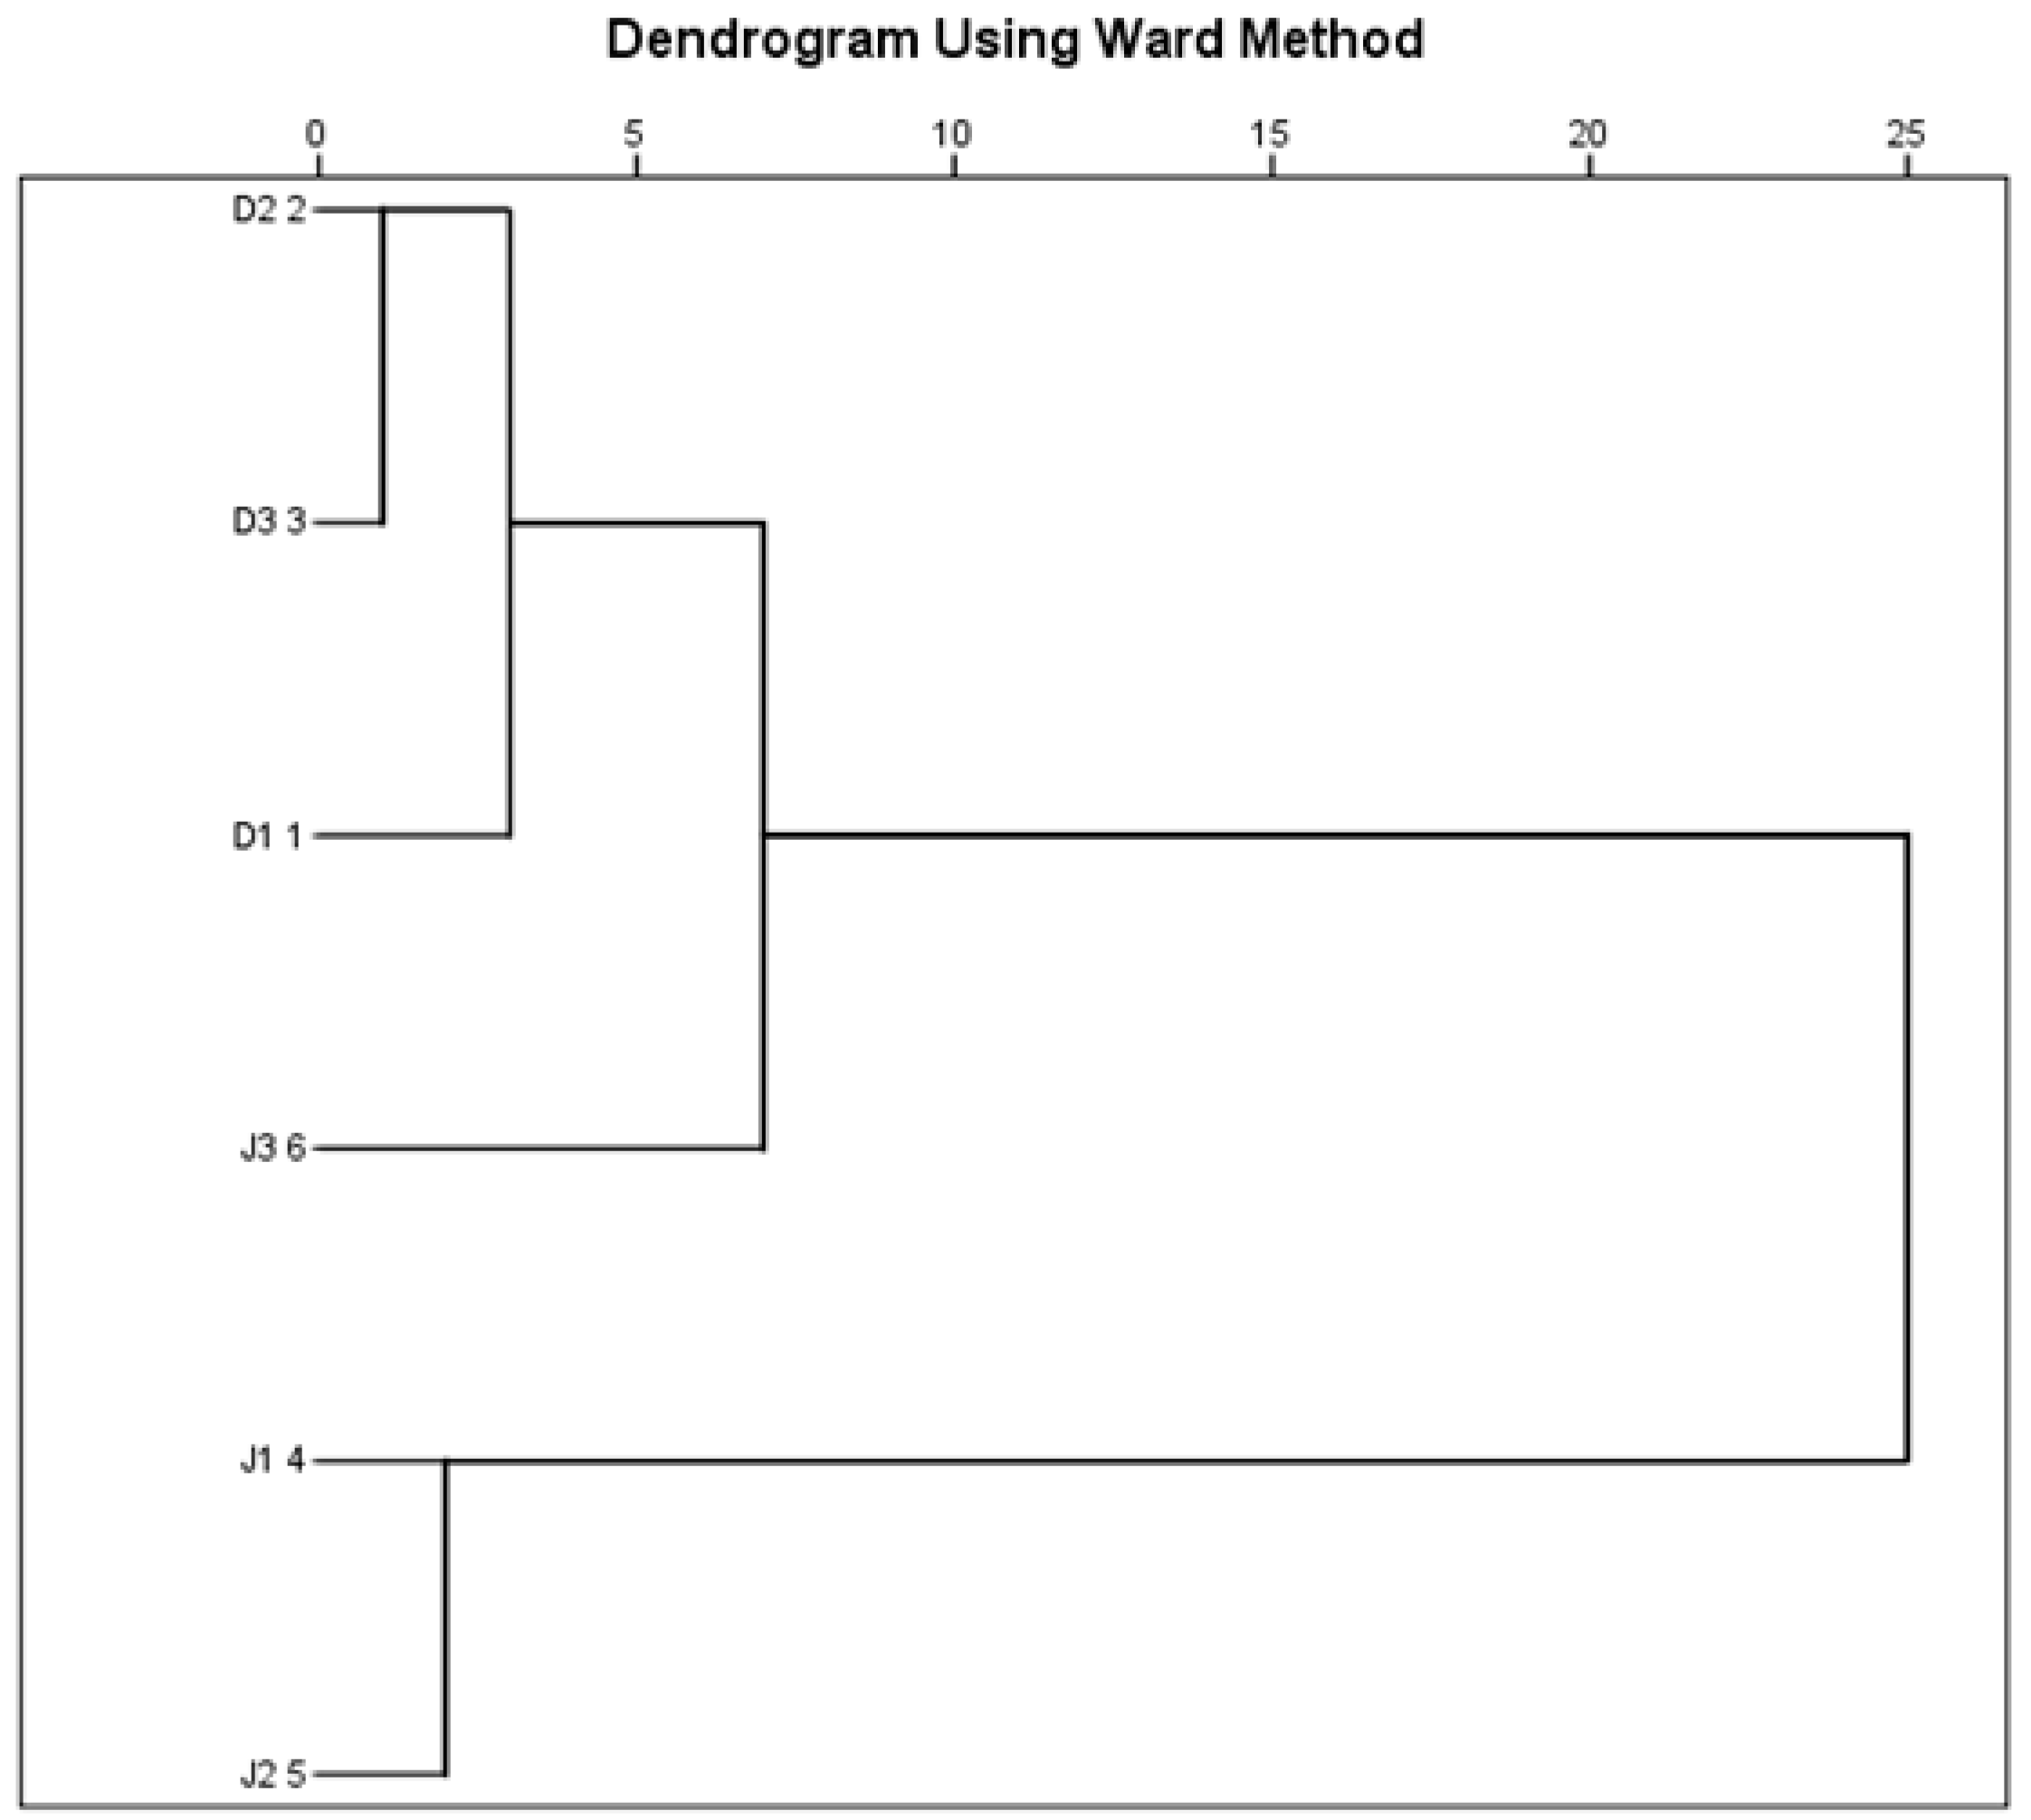
Figure 9.
RDA for the first two principal dimensions of the relationship between (a) bacterial and (b) archaeal OTUs and environmental factors.
Figure 9.
RDA for the first two principal dimensions of the relationship between (a) bacterial and (b) archaeal OTUs and environmental factors.


Table 1.
Hydrological data of two creeks.
| Creek Name | Length (m) | Width (m) | Depth (m) | Sediment (m) | SD (m) | Flow (m3/s) |
|---|---|---|---|---|---|---|
| Sewage creek | 150 | 8.4 | 0.68 | 0.10 | 0.56 | 0.026 |
| Industry creek | 560 | 6.7 | 0.72 | 0.10 | 0.24 | 0.026 |
Table 2.
PCR primers and amplification conditions.
| Target Gene | Primer Sequence (5′-3′) | Thermal Programme | Reference |
|---|---|---|---|
| Archaeal 16S rRNA | Arch519F: CAGCCGCCGCGGTAA Arch 915R: GTGCTCCCCCGCCAATTCCT | 5 min at 98 °C, 28 cycles at 98 °C for 30 s, 55 °C for 45 s, 72 °C for 1 min, and a final extension at 72 °C for 5 min. | [30] |
| Bacterial 16S rRNA | 338F: ACTCCTACGGGAGGCAGCA 806R: GGACTACHVGGGTWTCTAAT | 5 min at 95 °C, 30 cycles of 95 °C for 1 min, 55 °C for 1 min, 72 °C for 1 min, and a final extension at 72 °C for 7 min | [31] |
Table 3.
Water quality of the creeks (mg/L).
| Sample Site | DO | T | pH | Chla | TP | TOC | COD | NH4+-N | NO3−-N | TN | SO42− | Cl− |
|---|---|---|---|---|---|---|---|---|---|---|---|---|
| Sewage Creek | ||||||||||||
| D1 | 5.66 | 19.6 | 7.13 | 0.075 | 0.49 | 22.2 | 22.3 | 2.28 | 3.36 | 7.14 | 66.7 | 166.1 |
| D2 | 5.68 | 19.8 | 7.14 | 0.023 | 0.18 | 16.9 | 23.0 | 1.05 | 1.37 | 4.51 | 59.2 | 133.5 |
| D3 | 6.97 | 20.2 | 7.26 | 0.020 | 0.15 | 17.4 | 21.7 | 0.68 | 1.21 | 2.52 | 55.6 | 123.7 |
| Mean | 6.10 | 19.9 | 7.17 | 0.039 | 0.27 | 18.8 | 22.3 | 1.33 | 1.98 | 4.72 | 60.5 | 141.1 |
| Industry Creek | ||||||||||||
| J1 | 7.27 | 19.8 | 7.44 | 0.003 | 0.19 | 14.7 | 6.33 | 0.83 | 1.60 | 3.36 | 176.8 | 131.2 |
| J2 | 6.47 | 19.4 | 7.35 | 0.003 | 0.15 | 15.1 | 5.55 | 1.06 | 1.38 | 3.66 | 129.6 | 100.5 |
| J3 | 8.06 | 19.6 | 7.65 | 0.006 | 0.10 | 14.6 | 4.79 | 0.71 | 1.53 | 3.24 | 66.5 | 60.7 |
| Mean | 7.26 | 19.6 | 7.48 | 0.004 | 0.15 | 14.8 | 5.56 | 0.86 | 1.50 | 3.42 | 124.3 | 97.4 |
Table 4.
Content of heavy metals in the creek sediments (mg/kg).
| Sample Site | Cr | Ni | Cu | As | Cd | Zn | Pb |
|---|---|---|---|---|---|---|---|
| Sewage Creek | |||||||
| D1 | 44.17 | 30.83 | 38.12 | 9.04 | 0.62 | 131.78 | 102.58 |
| D2 | 41.46 | 24.78 | 29.51 | 8.22 | 1.06 | 116.21 | 53.13 |
| D3 | 40.45 | 24.89 | 30.98 | 7.35 | 0.91 | 137.92 | 10.25 |
| Mean | 42.02 | 26.83 | 32.87 | 8.20 | 0.86 | 128.63 | 55.32 |
| Industry Creek | |||||||
| J1 | 45.82 | 29.68 | 51.13 | 12.79 | 1.55 | 197.35 | 92.51 |
| J2 | 45.47 | 25.82 | 47.82 | 10.46 | 0.38 | 115.14 | 89.32 |
| J3 | 41.99 | 23.10 | 21.75 | 10.14 | 1.21 | 70.70 | 52.96 |
| Mean | 44.42 | 26.20 | 40.23 | 11.13 | 1.05 | 127.73 | 78.26 |
Table 5.
Tropic state index and ecological risk of the two creeks.
| Sample site | TSI | Level | RI | Level |
|---|---|---|---|---|
| Sewage Creek | ||||
| D1 | 76 | Hyper | 189 | Middle |
| D2 | 69 | Middle | 277 | Middle |
| D3 | 68 | Middle | 234 | Middle |
| Industry Creek | ||||
| J1 | 67 | Middle | 409 | High |
| J2 | 63 | Middle | 364 | High |
| J3 | 57 | Light | 310 | High |
Table 6.
Diversity indices of bacteria and archaea of the two creeks.
| Sample | Reads | OTUs | Ace | Chao1 | Coverage | Shannon |
|---|---|---|---|---|---|---|
| Bacterial 16S rRNA | ||||||
| D1 | 34,091 | 1207 | 1302 | 1302 | 0.99 | 5.12 |
| D2 | 21,115 | 1144 | 1248 | 1275 | 0.99 | 5.91 |
| D3 | 34,233 | 1332 | 1382 | 1391 | 0.99 | 5.96 |
| J1 | 47,498 | 1192 | 1301 | 1320 | 0.99 | 5.32 |
| J2 | 31,031 | 1328 | 1402 | 1421 | 0.99 | 5.85 |
| J3 | 18,265 | 1115 | 1256 | 1273 | 0.98 | 5.75 |
| Archaeal 16S rRNA | ||||||
| D1 | 32,255 | 690 | 748 | 733 | 0.98 | 4.27 |
| D2 | 61,300 | 652 | 735 | 750 | 0.99 | 3.79 |
| D3 | 36,363 | 590 | 721 | 703 | 0.99 | 3.86 |
| J1 | 46,435 | 585 | 614 | 608 | 0.99 | 3.54 |
| J2 | 39,875 | 523 | 679 | 694 | 0.98 | 3.53 |
| J3 | 52,445 | 547 | 619 | 615 | 0.99 | 3.63 |
© 2017 by the authors. Licensee MDPI, Basel, Switzerland. This article is an open access article distributed under the terms and conditions of the Creative Commons Attribution (CC BY) license (http://creativecommons.org/licenses/by/4.0/).
Share and Cite
MDPI and ACS Style
Li, D.; Jiang, X.; Wang, J.; Wang, K.; Zheng, B. Effect of Sewage and Industrial Effluents on Bacterial and Archaeal Communities of Creek Sediments in the Taihu Basin. Water 2017, 9, 373. https://doi.org/10.3390/w9060373
AMA Style
Li D, Jiang X, Wang J, Wang K, Zheng B. Effect of Sewage and Industrial Effluents on Bacterial and Archaeal Communities of Creek Sediments in the Taihu Basin. Water. 2017; 9(6):373. https://doi.org/10.3390/w9060373
Chicago/Turabian StyleLi, Da, Xia Jiang, Jinzhi Wang, Kun Wang, and Binghui Zheng. 2017. "Effect of Sewage and Industrial Effluents on Bacterial and Archaeal Communities of Creek Sediments in the Taihu Basin" Water 9, no. 6: 373. https://doi.org/10.3390/w9060373
Note that from the first issue of 2016, this journal uses article numbers instead of page numbers. See further details here.