
Verification of Calculation Method Using Monte Carlo Method for Water Supply Demands of Office Building

1
Department of Architecture and Environmental Design, College of Architecture and Environmental Design, Kanto Gakuin University, 1-50-1, Mutsuura-Higasi, Kanazawa-ku, Yokohama 236-8501, Japan
2
Department of Architecture, School of Science and Technology, Meiji University, Second School Building 4-4301, 1-1-1, Higashimita, Tama-ku, Kanagawa, Kawasaki 214-8571, Japan
3
The Institute for Sustainable Science and Development, Hiroshima University, 1-3-2 Kagamiyama, Higashi-Hiroshima City Hiroshima, Hiroshima 739-8511, Japan
*
Author to whom correspondence should be addressed.
Water 2017, 9(6), 376; https://doi.org/10.3390/w9060376
Submission received: 7 February 2017
/
Revised: 18 May 2017
/
Accepted: 19 May 2017
/
Published: 26 May 2017
(This article belongs to the Special Issue Water Supply and Drainage for Sustainable Built Environment)
Abstract
:In Japan, there are four methods of calculating water supply demands for office buildings based on SHASE-S 206 and two methods based on the design standard of Ministry of Land, Infrastructure, Transport and Tourism (MLIT). However, these methods were found to produce overestimated values when applied to recent sanitary fixtures with advanced water saving features. To cope with this problem, Murakawa’s Simulation for Water Consumption (MSWC), which utilizes the Monte Carlo method to calculate water usage dynamically has been developed. In this study, we evaluated the validity of MSWC on water consumption of an office building. Actual water consumption data were collected from a six story office building. Water consumption estimates calculated by the six conventional methods and MSWC were compared with the actual measurement values. Though the calculations based on the conventional methods significantly deviated from the actual measurement values, those made by MSWC closely resembled them.
1. Introduction
In Japan, the design standard of Ministry of Land, Infrastructure, Transport and Tourism (MLIT) [1] (referred to as “the Design Standard”) and The Society of Heating, Air-Conditioning and Sanitary Engineers of Japan Standard 206 [2] (referred to as “SHASE-S 206”) have been used since the 1970s as water load calculation methods. However, the traditional water load calculation methods such as the Design Standard and SHASE-S 206, especially the worldwide used Hunter-based method, was proved with a risk of overestimation if they are applied to modern sanitary fixtures with advanced water-saving features, mentioned by Murakawa (1985) [3] and Wu (2013) [4].
On the other hand, Murakawa et al. (1976) mentioned a method to calculate the water supply load based on Monte-Carlo simulation [5,6], and with the known probability of demand and demand flow rate in every hour, daily demand time series can be obtained by Monte-Carlo simulations mentioned by Holmberg (1987) [7], the Monte-Carlo simulations for the calculation of water supply load was considered provide more accurate results. According to that, more research was taken on the Monte-Carlo simulations for water supply loads. Murakawa et al. (2005) [8] developed the simulation tool Murakawa’s Simulation for Water Consumption (MSWC), which is based on the Monte-Carlo simulation, enabled to dynamically calculate various water usages in buildings by applying them to probability models. Blokker et al. (2011) [9] developed Simulation of water Demand, an End-Use Model (SIMDEUM) based on probability distribution functions for occupancy, frequency of use, duration and flow per water-use event, occurrence over the day for end-uses such as flushing the toilet, doing the laundry, washing hands, etc. to predict water demands at 1-s time step. Wong et al. (2017) [10] integrated a Monte-Carlo simulated demand time series for optimized inflow rate of tanked water supply system.
In this paper, we take up and evaluated the MSWC tool. The former researches discussed the using case of MSWC on apartment houses by S. Murakawa (2002, 2003) [11,12] on restaurants by D. Takahashi (2004) [13], and on hotels by H. Takata (2005) [14], the result shows that the MSWC method was effective on these cases. In the case of office building, previous studies by G.Z. Wu (2014, 2015) [15,16], K. Sakamoto (2016) [17] and S. Kurisu (2016) [18] indicated that the conventional methods were found to produce overestimated values, while highly accurate calculation of water supply load is made possible by using MSWC. In this study, we measured water consumption and the number of occupants in another office building (flush valve was installed as the discharge system), and compared and analyzed daily water consumption (referred to as Qday below) and instant peak flow rate (referred to as Qmax below) in order to further examine the validity of MSWC. Lastly, we correct the basic fixture unit of conventional methods based on the measurement results, compared the calculation results with the conventional methods using conventional basic fixture unit, and the results based on MSWC.
2. The Calculation Methods for Water Supply Demands
2.1. Conventional Water Load Calculation Methods
The conventional water load calculation methods described in the Design Standard and SHASE-S 206 are listed in Table 1. Calculations were made based on two methods in the Design Standard and four methods in SHASE-S 206. Calculations based on the Design Standards included those utilizing units derived from the number of occupants in the rooms (referred to as NOR below) and water used in each sanitary fixture (referred to as Actual Basic Unit (ABU) below) in addition to the number of people obtained by multiplying effective area by personnel density (0.2 person/m2) (referred to as Personnel/Area (P/A) below), which is used in the personnel method; and those based on flow rates of sanitary fixtures and faucets (referred to as Conventional Basic Unit (CBU) below), which is used in the fixture method.
2.1.1. Facilities Design Criteria of Ministry of Land, Infrastructure, Transport and Tourism (MLIT)
The Facilities Design Criteria stipulates as a rule that water consumption shall be calculated based on the personnel to use the subject building. On the other hand, the proviso of the criteria stipulates that if calculation based on the personnel is not appropriate, the water consumption may be calculated based on a number of water supply fixtures. Figure 1 shows the calculation flow by the personnel method, and Figure 2 shows the calculation flow by the fixture-method. Table 2 and Table 3 show each parameter of the personnel method and the fixture-method.
2.1.2. SHASE-S206
Table 4 shows characteristics of each calculation method of SHASE-S206.
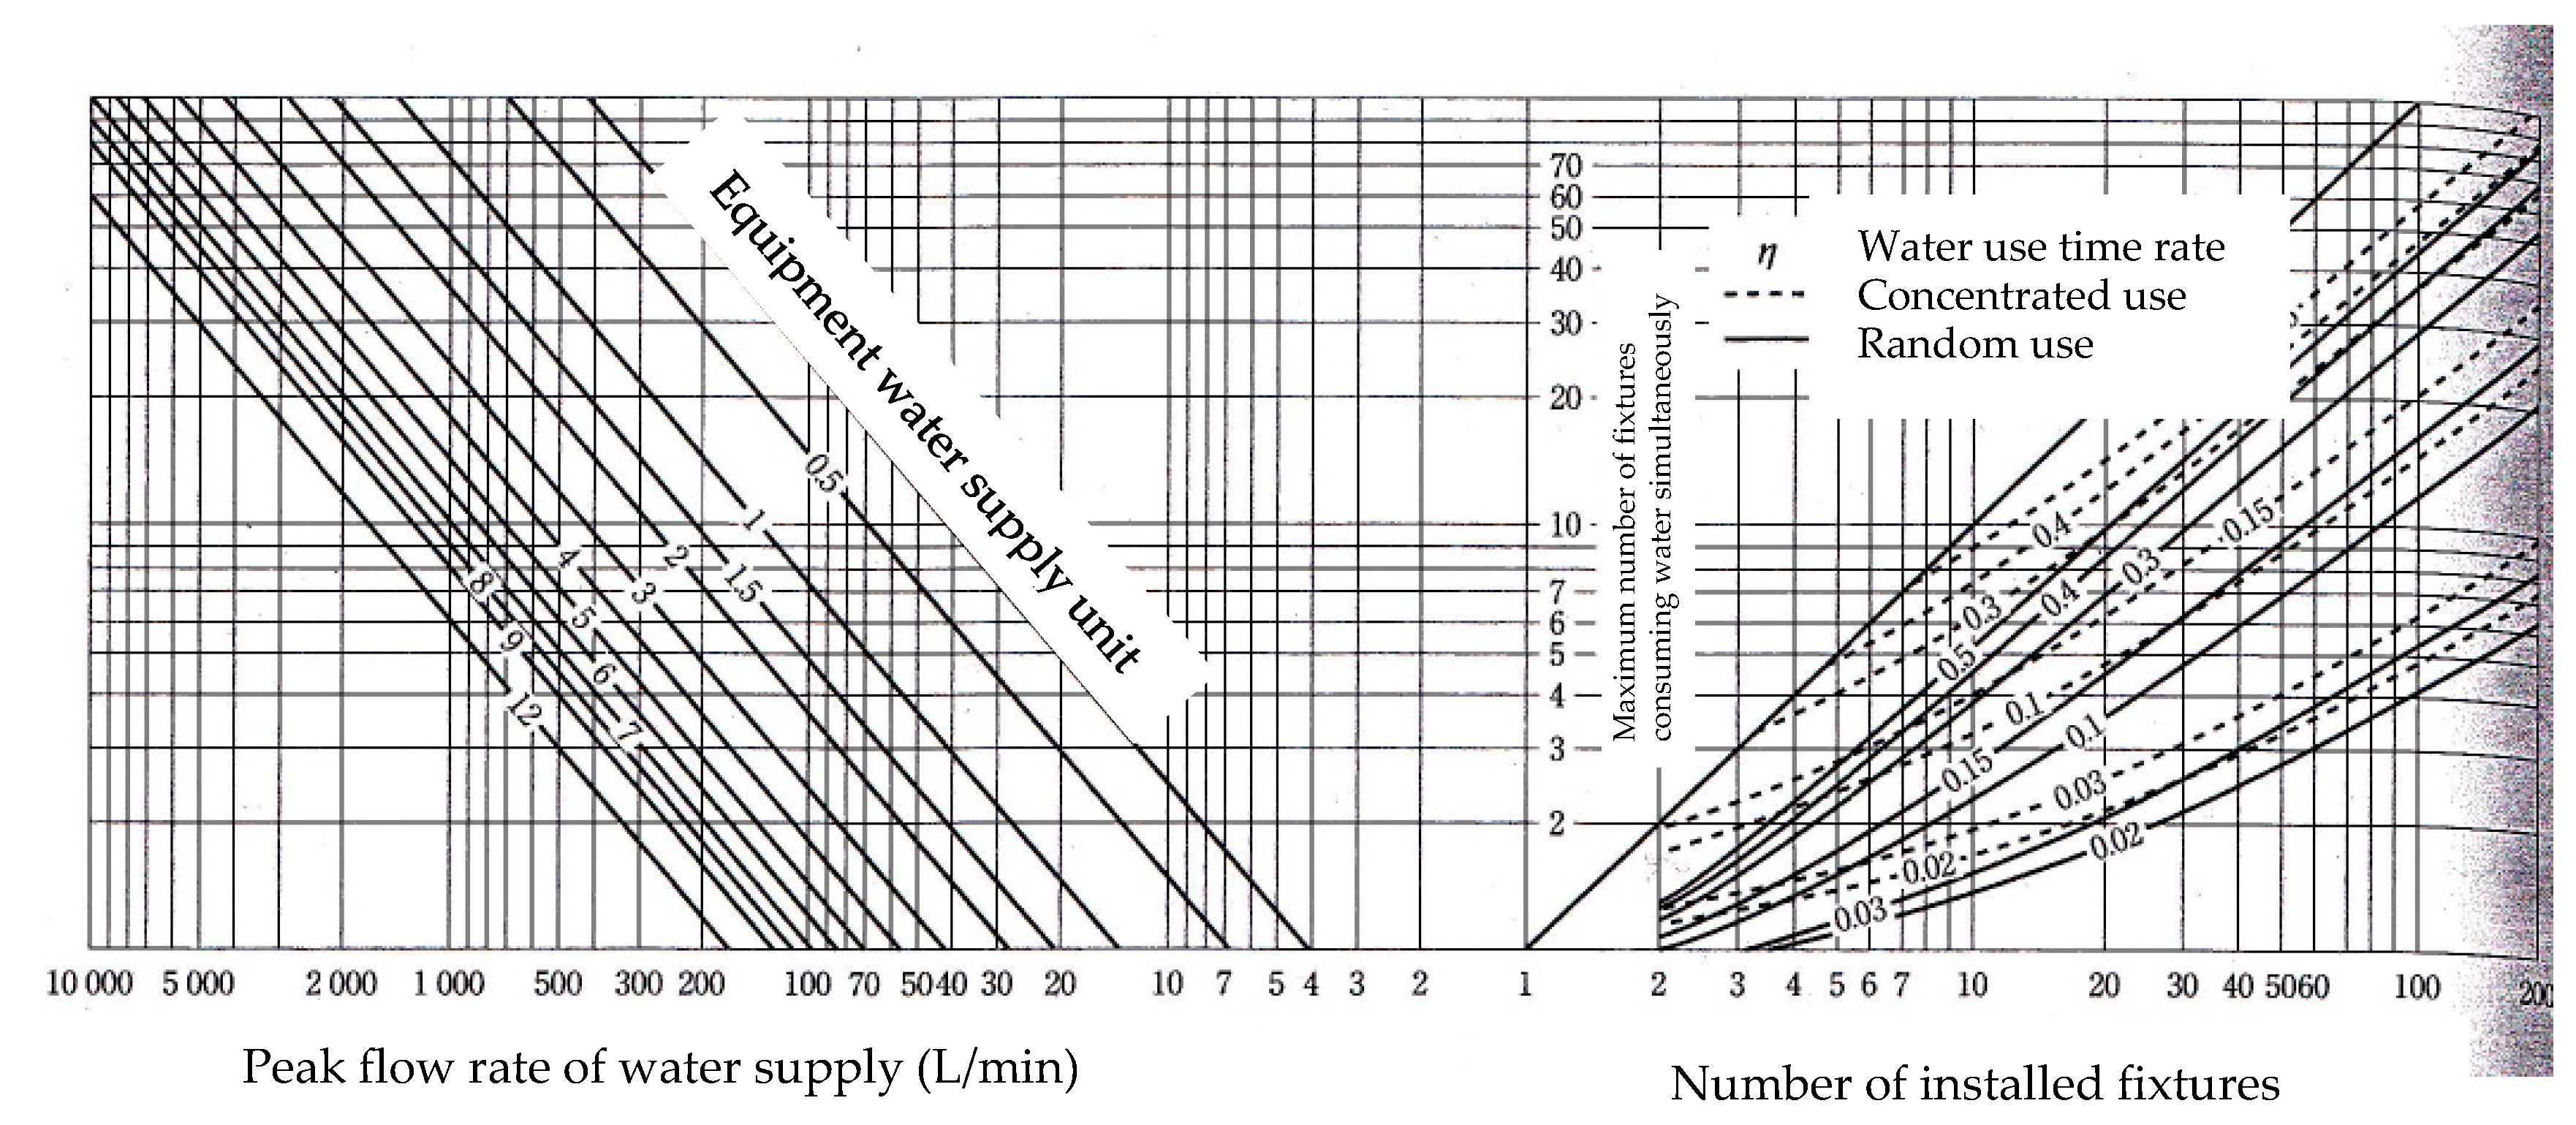
1. Calculation Method Based on Water Use Time Rate and Fixture Unit for Water Supply
Based on the number of the installed fixtures, the Formula (1) and (2) by the type of the fixture are used, or Table 4 is used to calculate Qmax. The standard value of water use time η and the fixture unit for water supply are shown in Table 5.
In addition, in the case where different types of fixtures coexist, Qmax is calculated by adding the highest value among Qmax values of each fixture to the half value of Qmax of other fixtures. However, continuous flow is to be added without halving its Qmax value.
In addition, if randomly-used fixtures are installed horizontally in 2 or more places or vertically on 2 or higher floors, the number of the fixtures is adjusted to correspond to the number of users by using Table 6.
Considering that even if the fixtures are occupied simultaneously, there is still unoccupied time for switch of users, the usage rate was specified as 0.9. Under the assumption that a slight decrease in water pressure due to the simultaneous use is acceptable, the reject rate was specified as k = 0.05, and b = 1.6 and Δ = 0.8 were employed. Figure 3 and Figure 4 and Table 7 shows relationship between the rejection rate k, and b, and Δ.
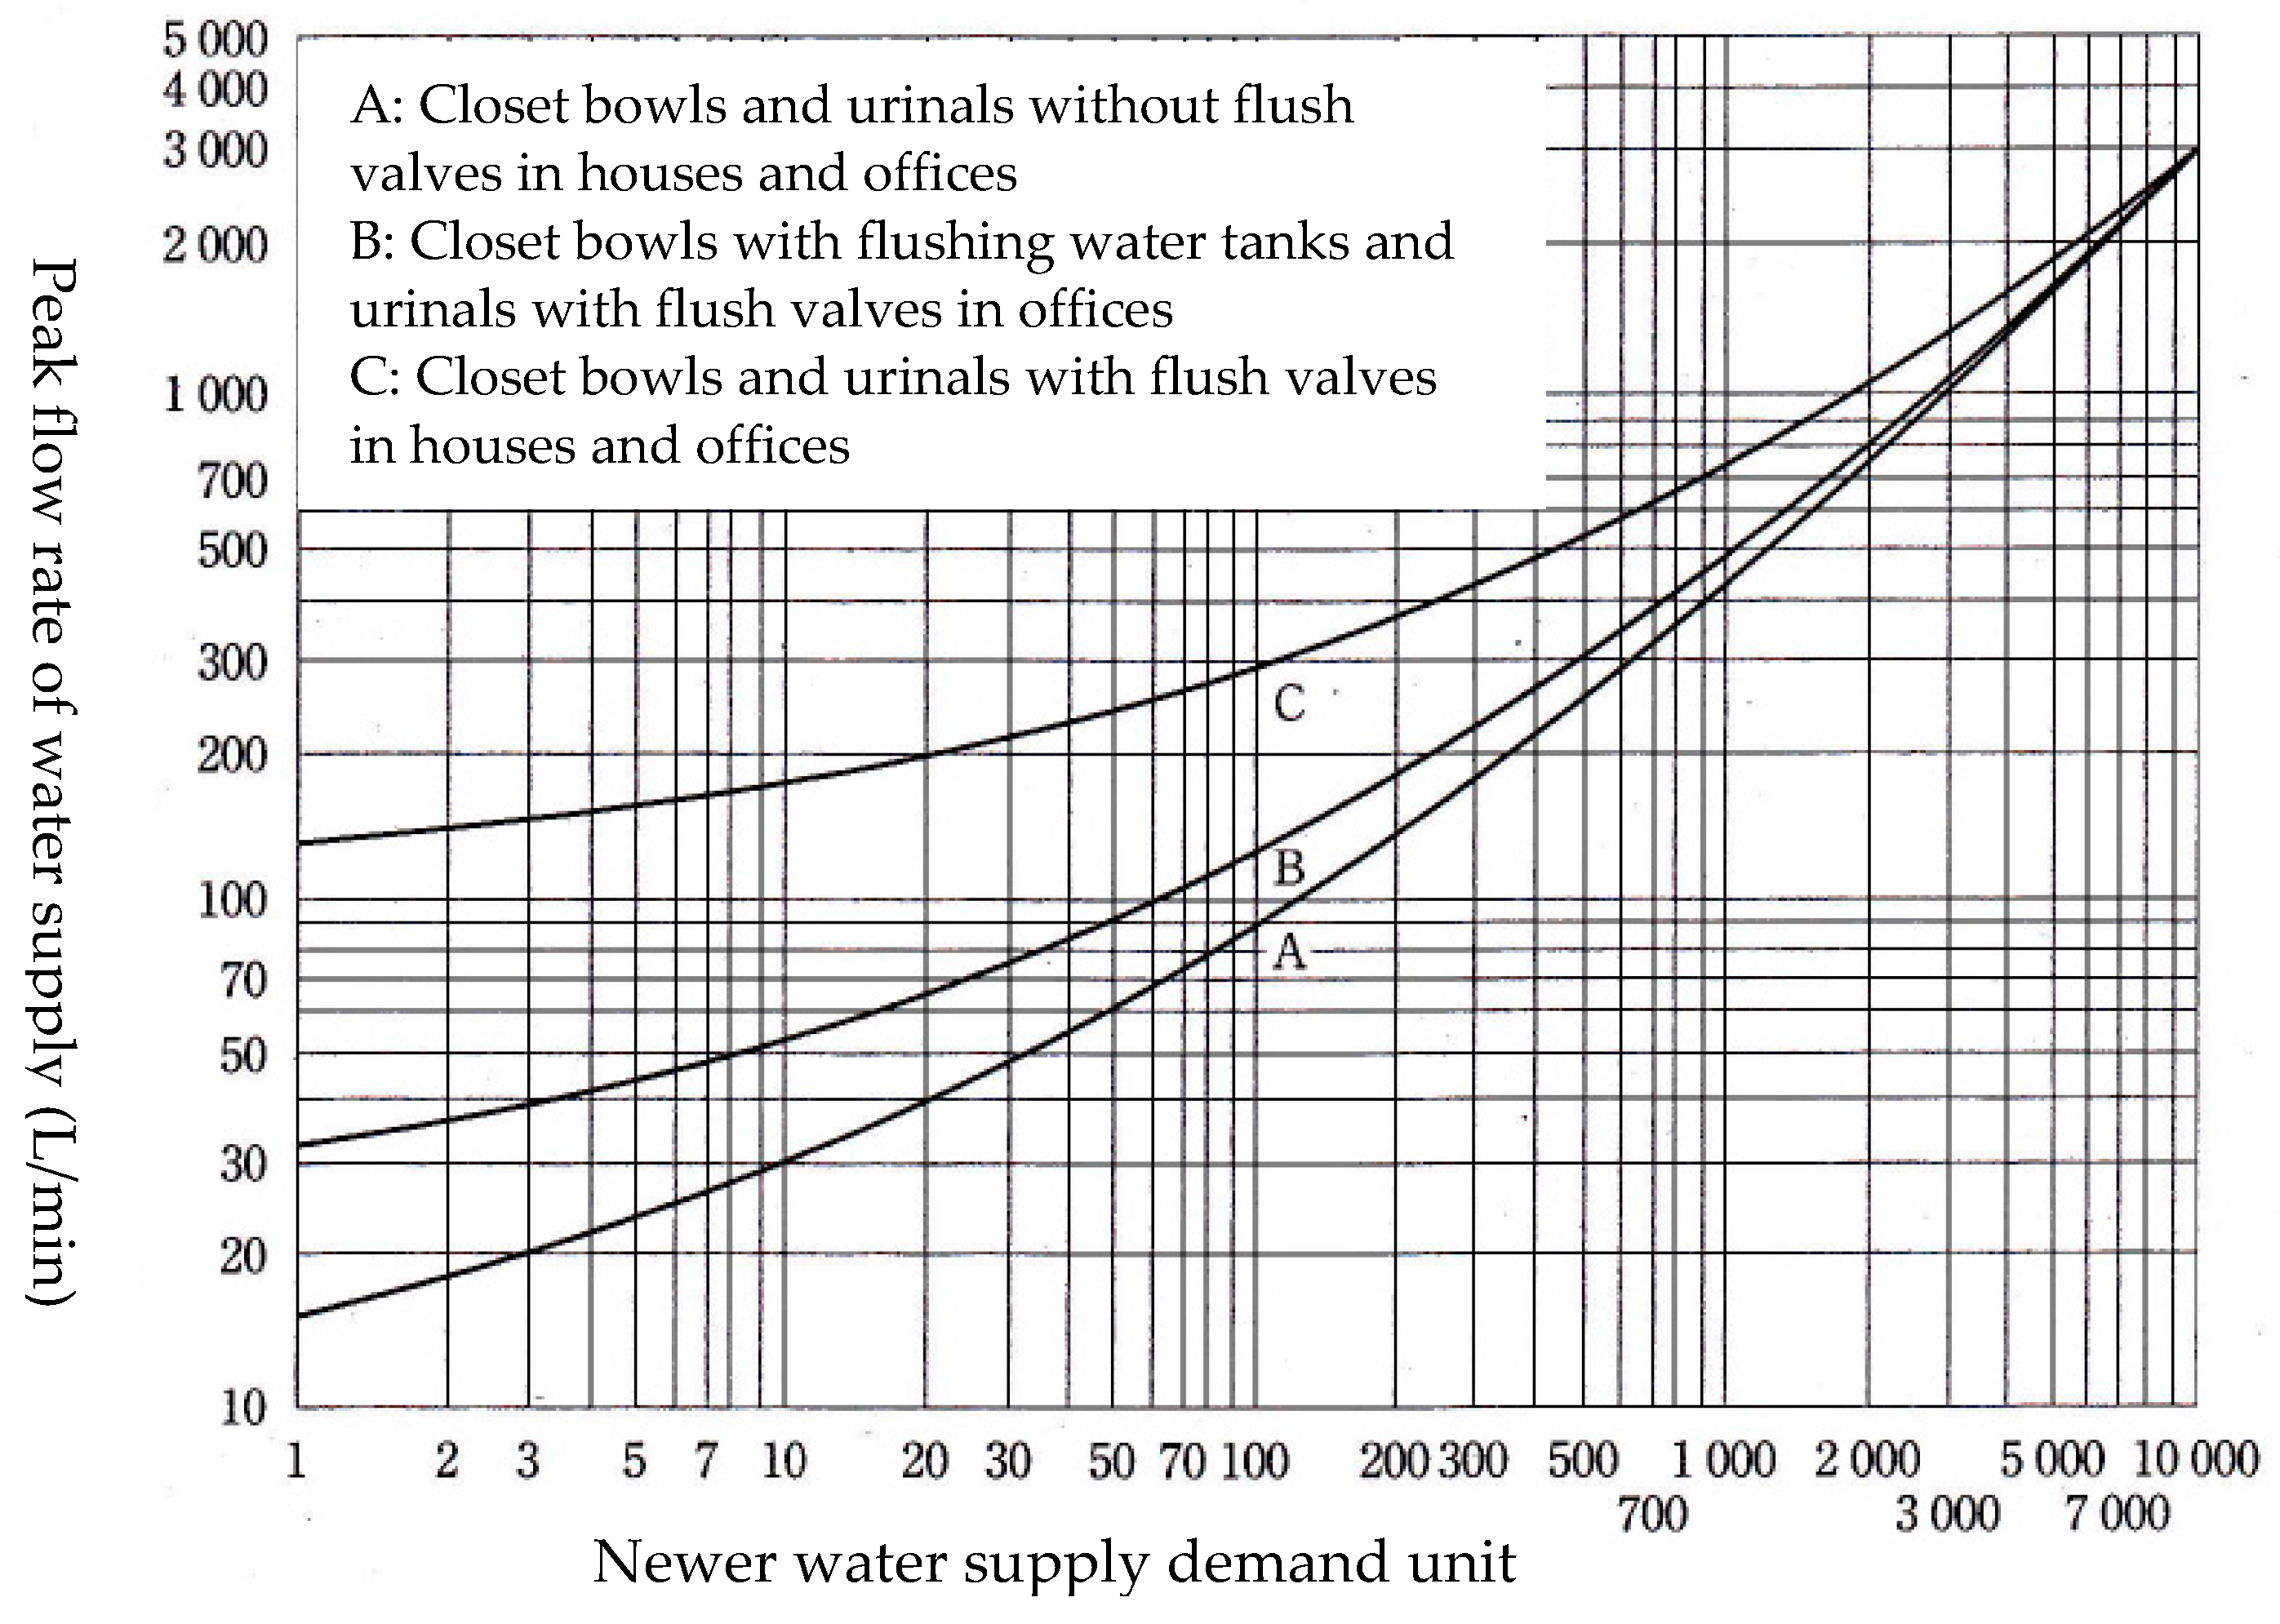
2. Method Based on Newer Water Supply Demand Unit [18]
The newer water supply demand unit of each fixture is chosen in Table 8 below, and the water load is calculated by using the sum of the newer water supply demand unit of each fixture and the load curve shown in Figure 5.
3. Method Based on Fixture Usage
The water load is calculated by choosing the number of the fixtures used simultaneously in Table 9 and the peak flow rate of water supply of each fixture in Table 10, then by multiplying the number of the fixtures with the peak flow rate. If the number of the fixtures is not indicated in Table 9, the intermediate value is obtained by proportional distribution. However, if usage of the fixture is estimated with high accuracy, the usage rate of the fixtures used simultaneously should be specifically estimated without referring to this table.
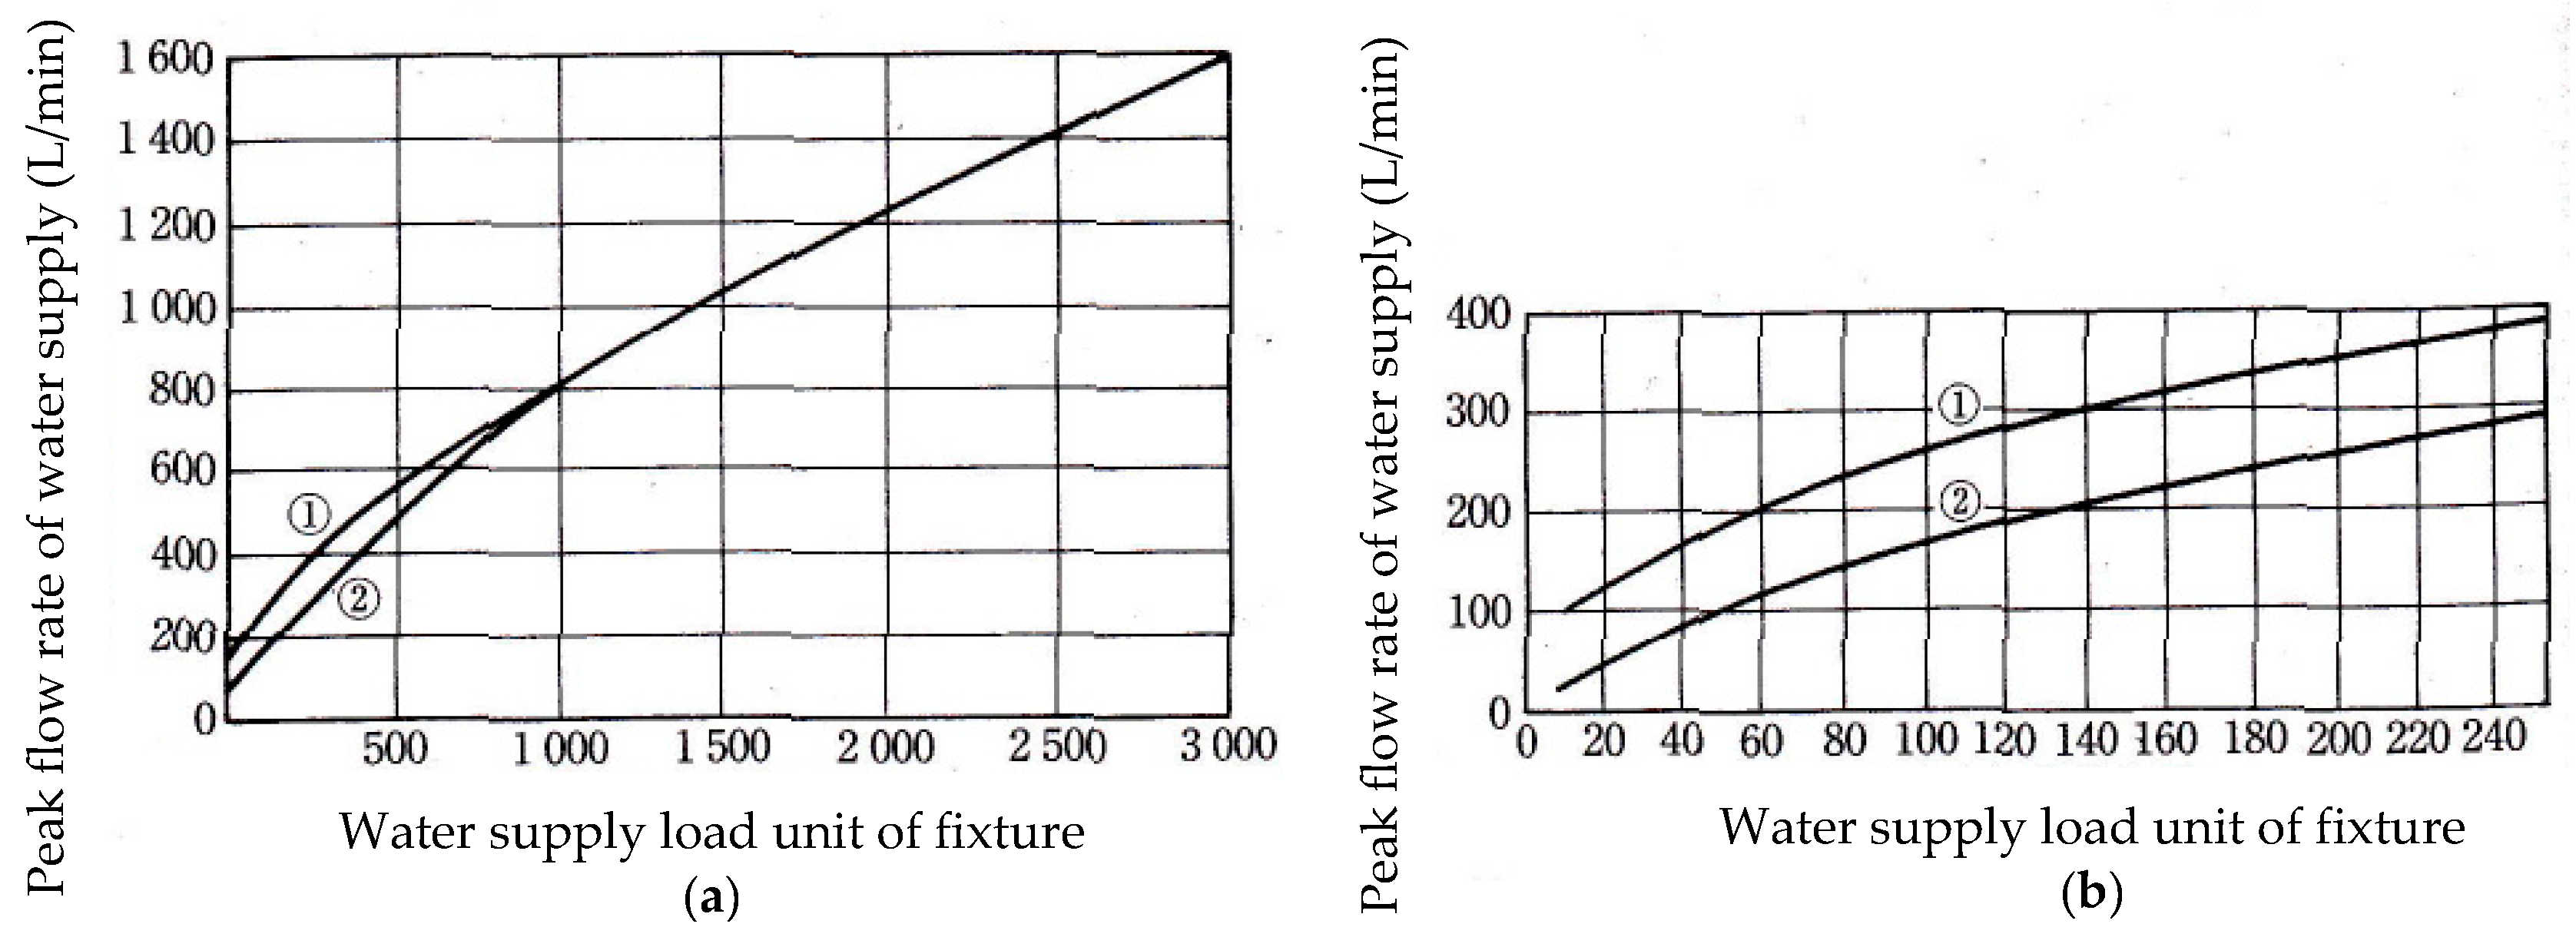
4. Method Based on Water Supply Load Unit of Fixture [19]
2.2. Water Load Calculation Method Using Murakawa’s Simulation for Water Consumption (MSWC)
2.2.1. Outline of MSWC
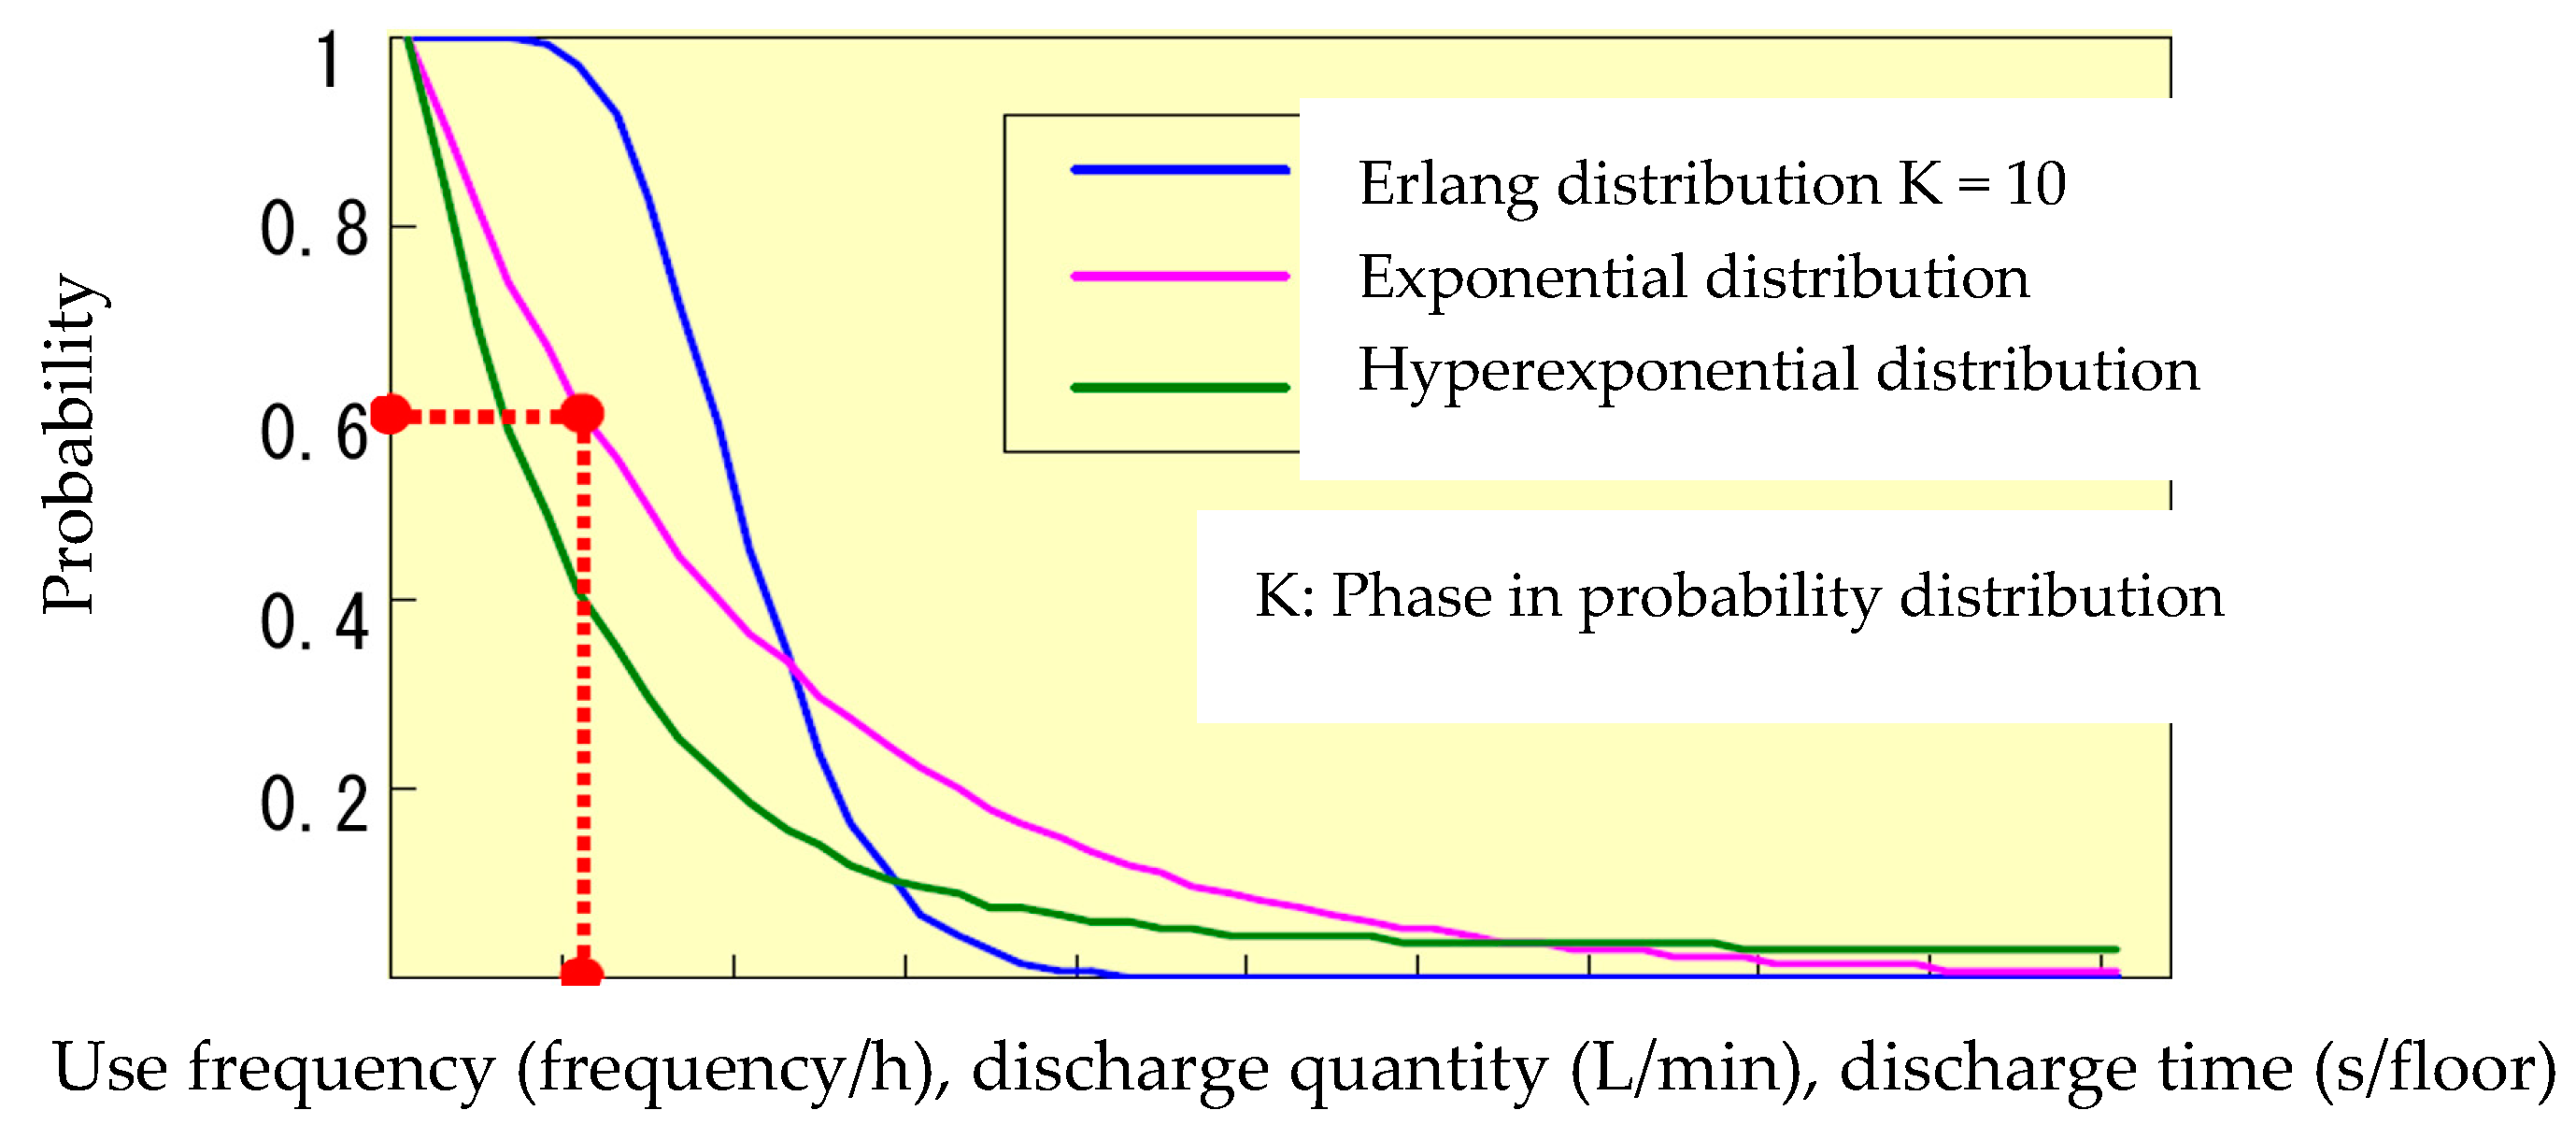
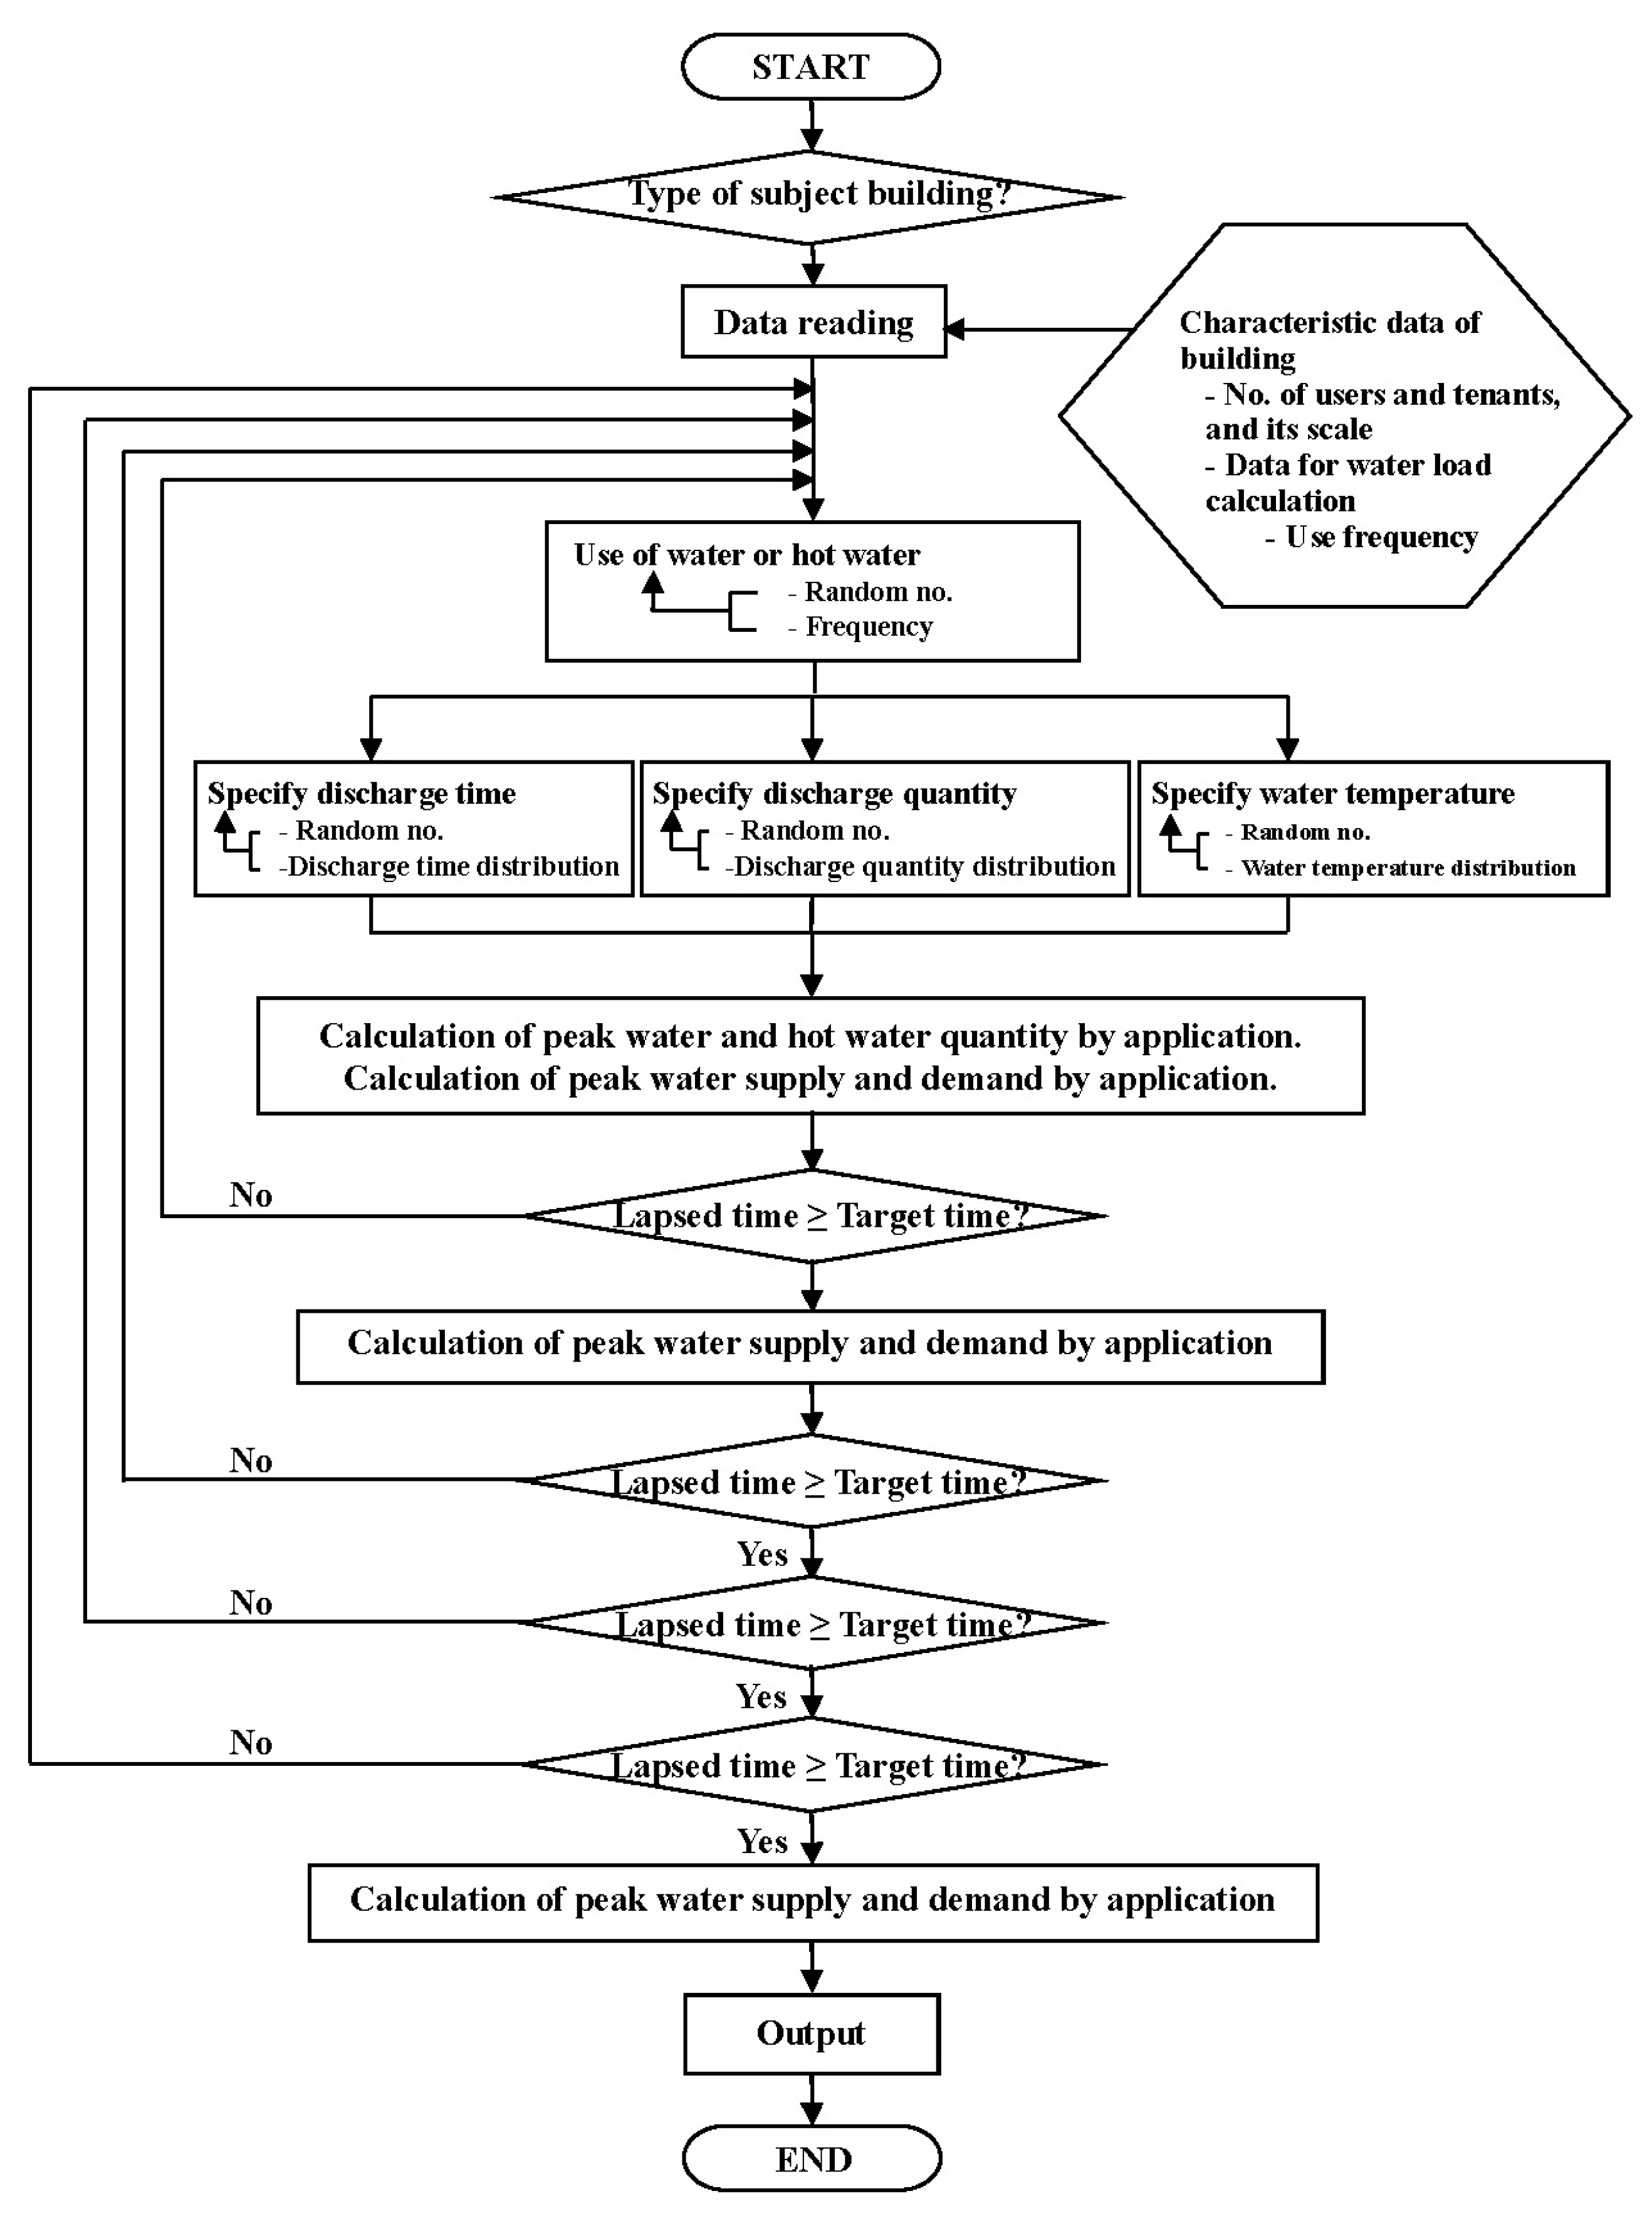
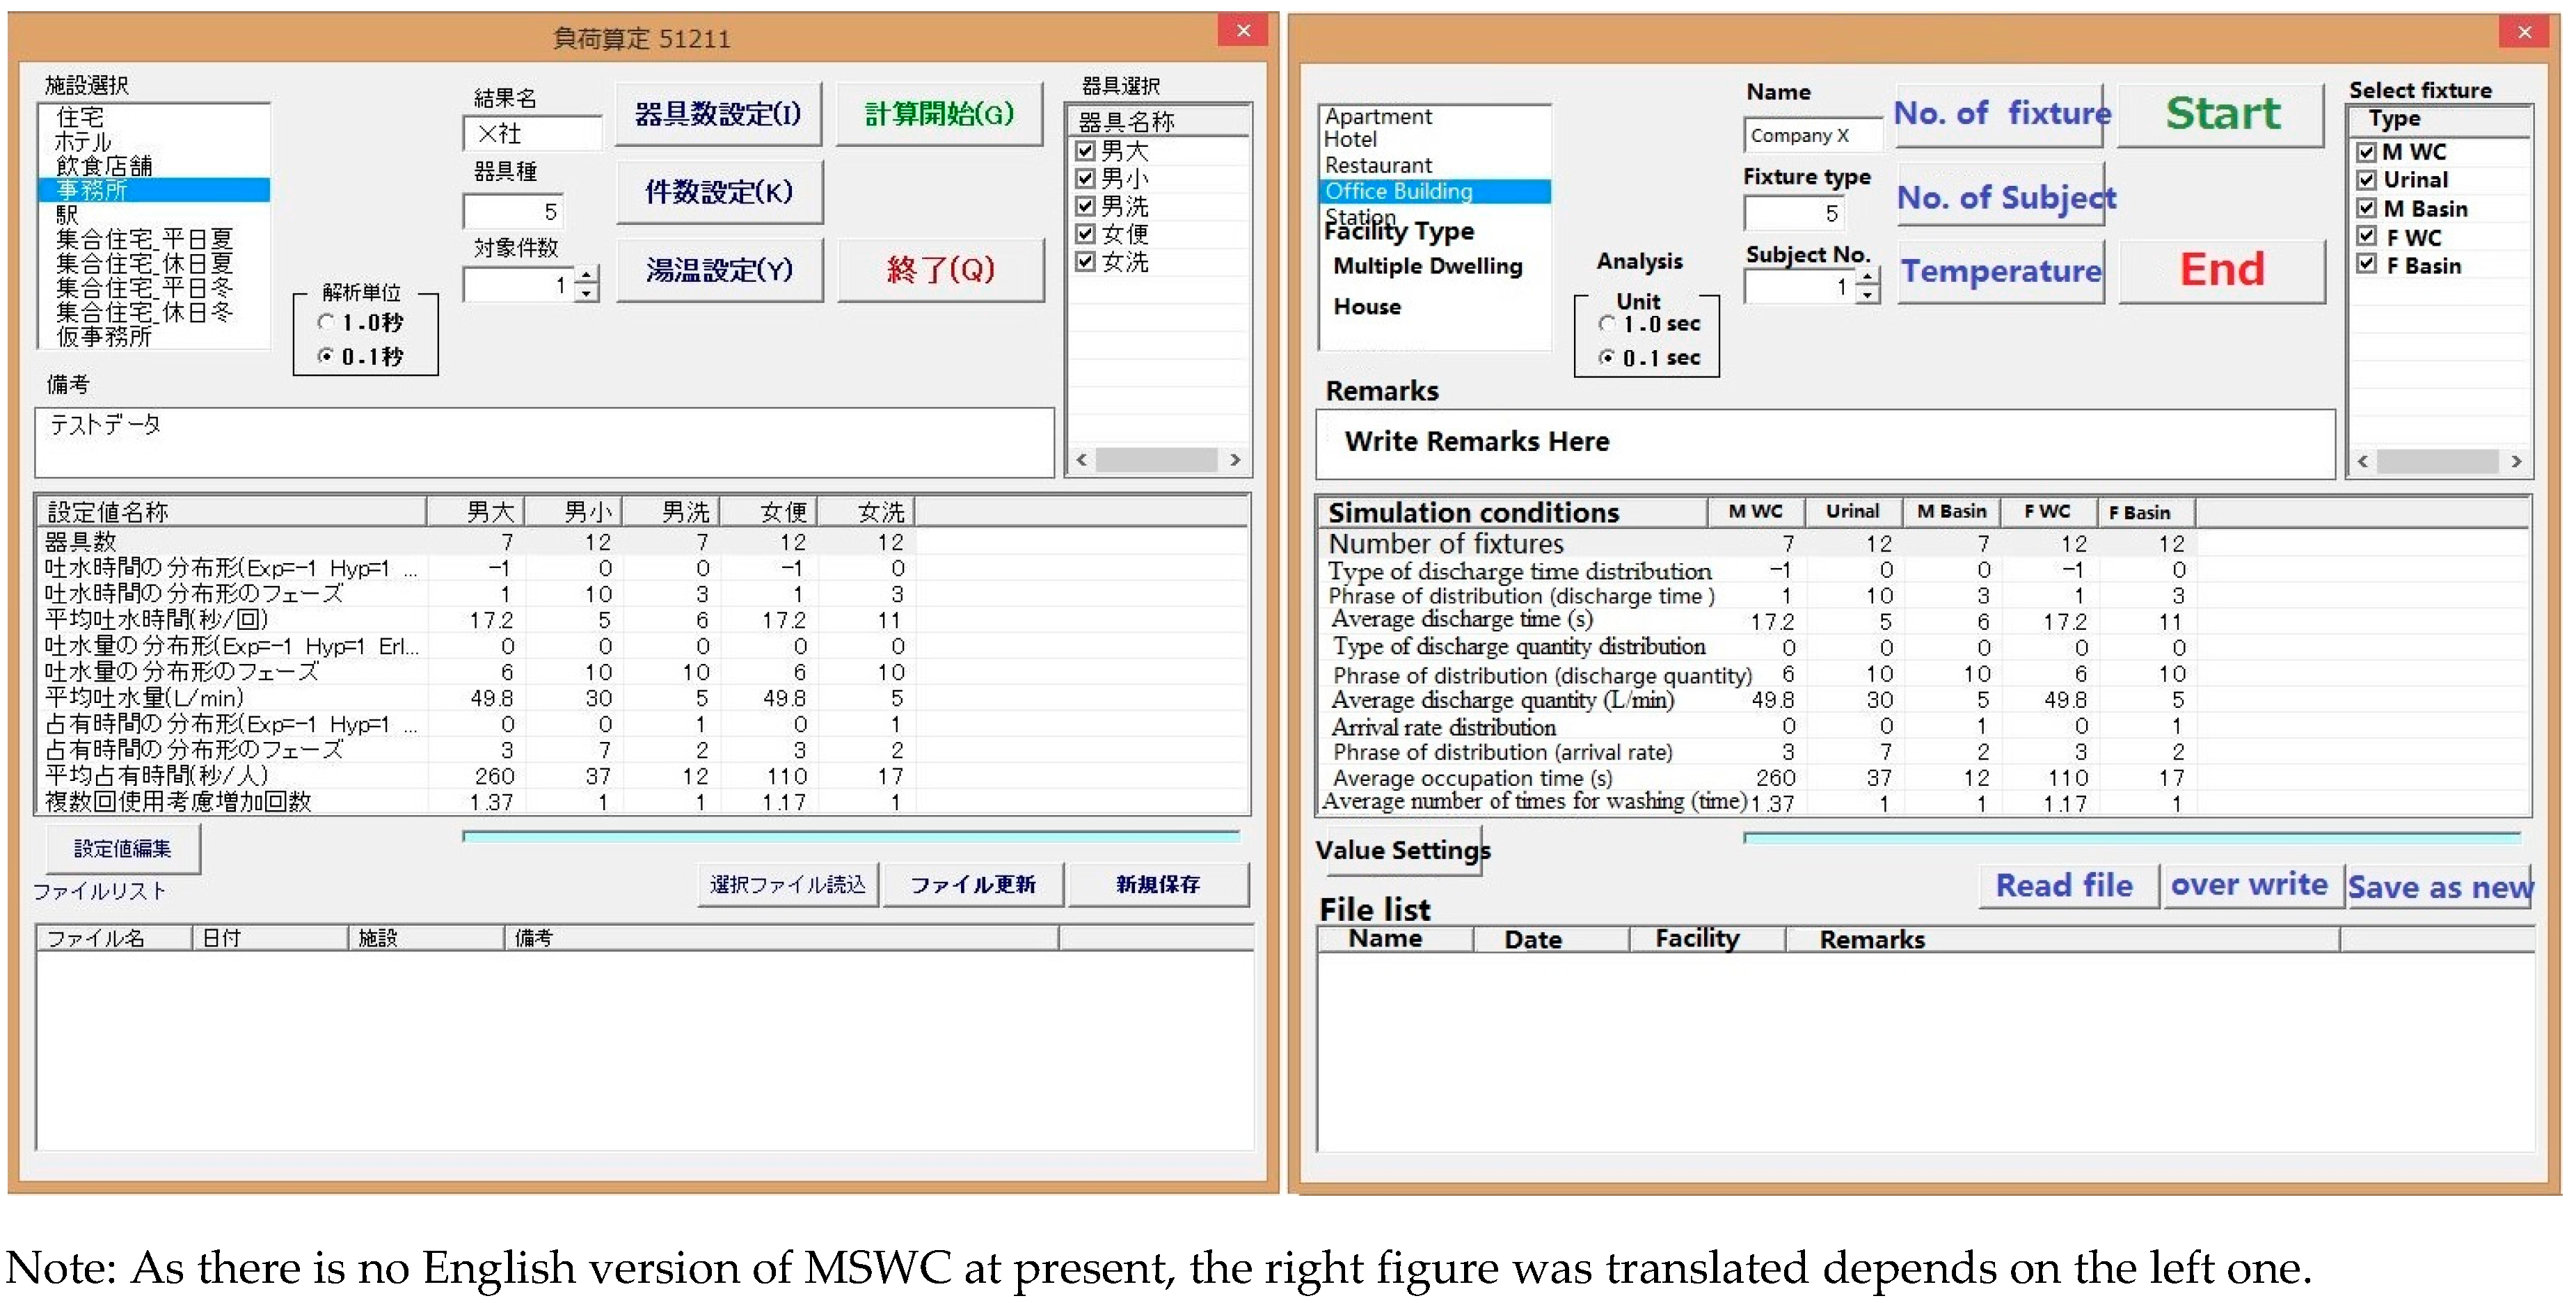
MSWC is a simulation tool that makes it possible to forecast water supply demand in chronological order by using the Monte Carlo technique. As shown in Figure 7, this method is used for plumbing fixtures, but the frequency ratio of the mean values of the simulation conditions such as use frequency [24], discharge flow rate [25], discharge time of the fixture [26,27], temperature of water to be used [8,28,29,30], and users’ occupation time of the fixture [1,31] is cumulated in a probability distribution with a mean value at 1, and can be shown by Erlang distribution, exponential distribution and hyperexponential distribution. In this method, water load can be calculated on a peak-time, hourly and daily basis by generating random numbers and determining the value of each condition with Monte Carlo technique, then by inputting a number of fixtures, average water discharge time, average water discharge quantity and subject number in the subject building used for the calculation. Figure 8 shows the procedure for water load calculation proposed by Murakawa.
2.2.2. Calculation Conditions of MSWC
Table 12 shows the simulation conditions of MSWC [4,32]. The subject number means a number respectively of male or female users. When calculating the water load of all the floors of the subject building, the number of users in the whole building is to be entered, and when calculating the water load of one floor of the subject building, the number of users on the floor is to be entered. Figure 9 shows the operation screen of MSWC.
The indication of each numbered zone on Figure 10 is as follows.
In the facility selection section in area “①”, the subject building is selected. In this research, “Office” was selected for research of an office building (the subject building can also be selected from the file list on the bottom of the screen by selecting the file and clicking “Read selected file” in area “⑪”).
Next, the condition file to be edited is selected to rewrite and store the file.
The overall conditions are described as follows.
In the “Analysis unit” section in area “②”, it is recommended to choose the 0.1-s analysis, because the 1-s analysis may cause error (taking too long time for the analysis).
In area “③”, the result name can be given to the file of the calculation result. If the number exceeding the number of the fixtures chosen in the area “⑥” on the right is entered, error will be caused during the calculation. Hence, the “Fixture type” section should not be changed. The “Subject number” should be consistent with the present condition and be set by considering the situation of the office.
The same operation with the “Set number of fixtures” in area “④” can also be performed in the “Fixture name” section in area “⑥” to change the number of the subject fixtures, as well as the “Edit setup number” section in area “⑨”. In the “Set subject number” section in area “④”, the number of users and usage of each fixture in 24 h can be changed. In the “Set water temperature” section, the temperature of supplied water as well as the water temperature at each fixture can be changed.
In the “Start calculation” section in area “⑤”, the water load calculation simulation based on any calculation condition can be performed by choosing “Rewrite”, “Store new file” and the file for the calculation before clicking the “Start”. By clicking “Finish” in area “⑤”, data entry can be finished without performing the water load calculation simulation.
In the “Remark” section in area “⑦”, DEMO on the data can be entered.
In the “Set value” section in area “⑧”, 11 calculation conditions for each fixture can be shown.
In the “Edit set value” section in area “⑨”, 11 calculation conditions for each fixture can be changed.
In the “Progress bar” in area “⑩”, progress of the calculation can be viewed.
By using the “Read chosen file” section in area “⑪”, the name of the set value can be shown in the “Set value name” section by choosing and clicking a file in the file list. By using the “Store chosen file” section, the chosen file can be stored. In the “Store new file” section, a new file can be stored in the name used in the “Set value name” section, and the file name can also be changed in this section.
In the “File list” section in area “⑫”, the calculation can be performed by checking the box on the left of each file listed as the files that can be used for the calculation.
The water load calculation simulation is conducted for 24 h for each fixture type and is aggregated every second to produce basic files for water, hot water and heat quantity. The simulation is completed, when some of such basic files are displayed.
3. Measurement
3.1. Measurement of the Water Consumption
Water consumption was measured in an office building to collect basic data, and examine the validity of MSWC and the conventional water load calculation methods.
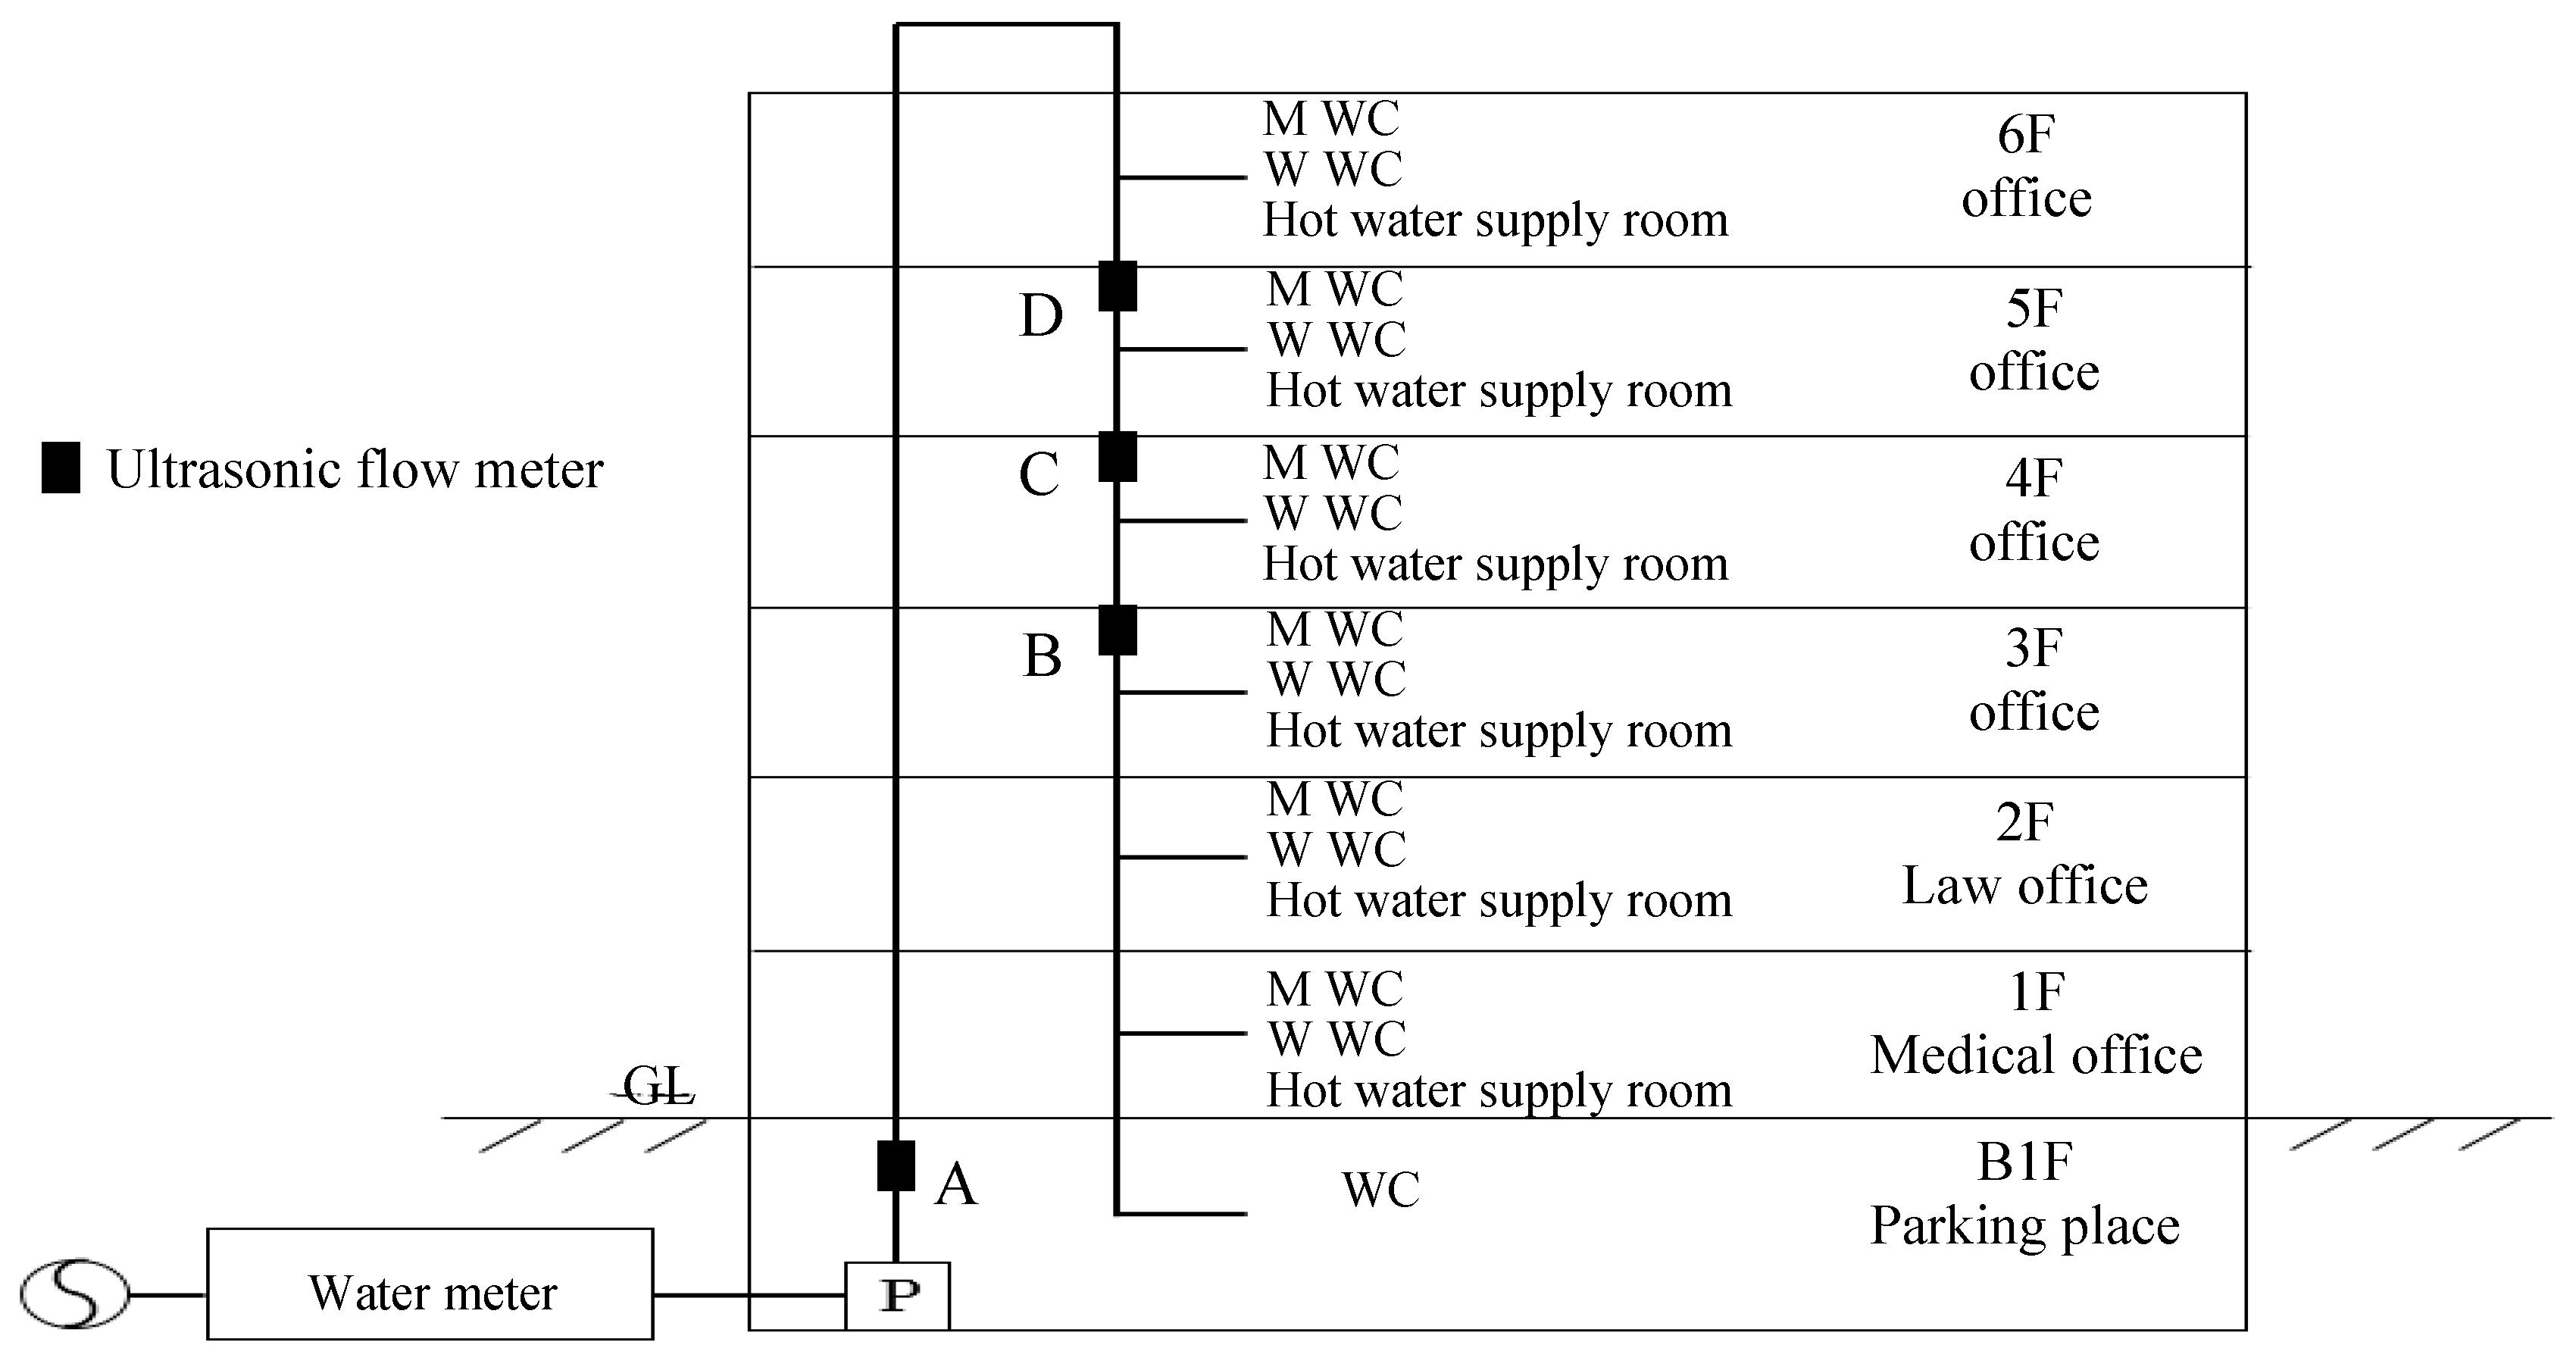
Data were collected in a 7-story (6 floors above ground and 1 below) office building (referred to as T-building) with the total floor area of 2384.4 m2 in Tokyo. Figure 11 shows the water supply lines, the locations of ultrasonic flow meters, and the type of the tenants on each floor. Water was supplied by the increase-pressure water supply system.
Ultrasonic flow meters were placed in the water supply main near the outlet of the pump (A); in the water supply main between the floors 3 and 4 (B); 4 and 5 (C); and 5 and 6 (D) from Wednesday, 5 August to Thursday, 6 August, and on Thursday, 12 November 2015, and water flow rate was measured every second.
Qday and Qmax on each floor obtained from calculation based on the measured data by ultrasonic flow meters during the measuring period: 5–6 August, and 12 November 2015 are shown in Table 13. In Chapter 5, data obtained on 6 August, when Qday calculated from the ultrasonic flow meter data were the largest were used.
3.2. The Number of Occupants
To determine the number of occupants present in the rooms in T-building during the measurement period, the occupants of T-building were asked to fill out questionnaires and their presence in the rooms every 30 min on the days’ measurements were made were investigated. To further validate the accuracy of the questionnaires, security cameras were used [15,16].
The number of occupants in the rooms by gender was counted every 30 min during the measurement period: Wednesday, 5 August to Friday, 7 August; Wednesday, 11 November to Friday, 13 November 2015.
People entering and exiting T-building were monitored by security cameras placed at the front and back entrances during the measurement period: Wednesday, 11 November to Friday, 13 November 2015; and the number of people was counted by gender every 5 min.
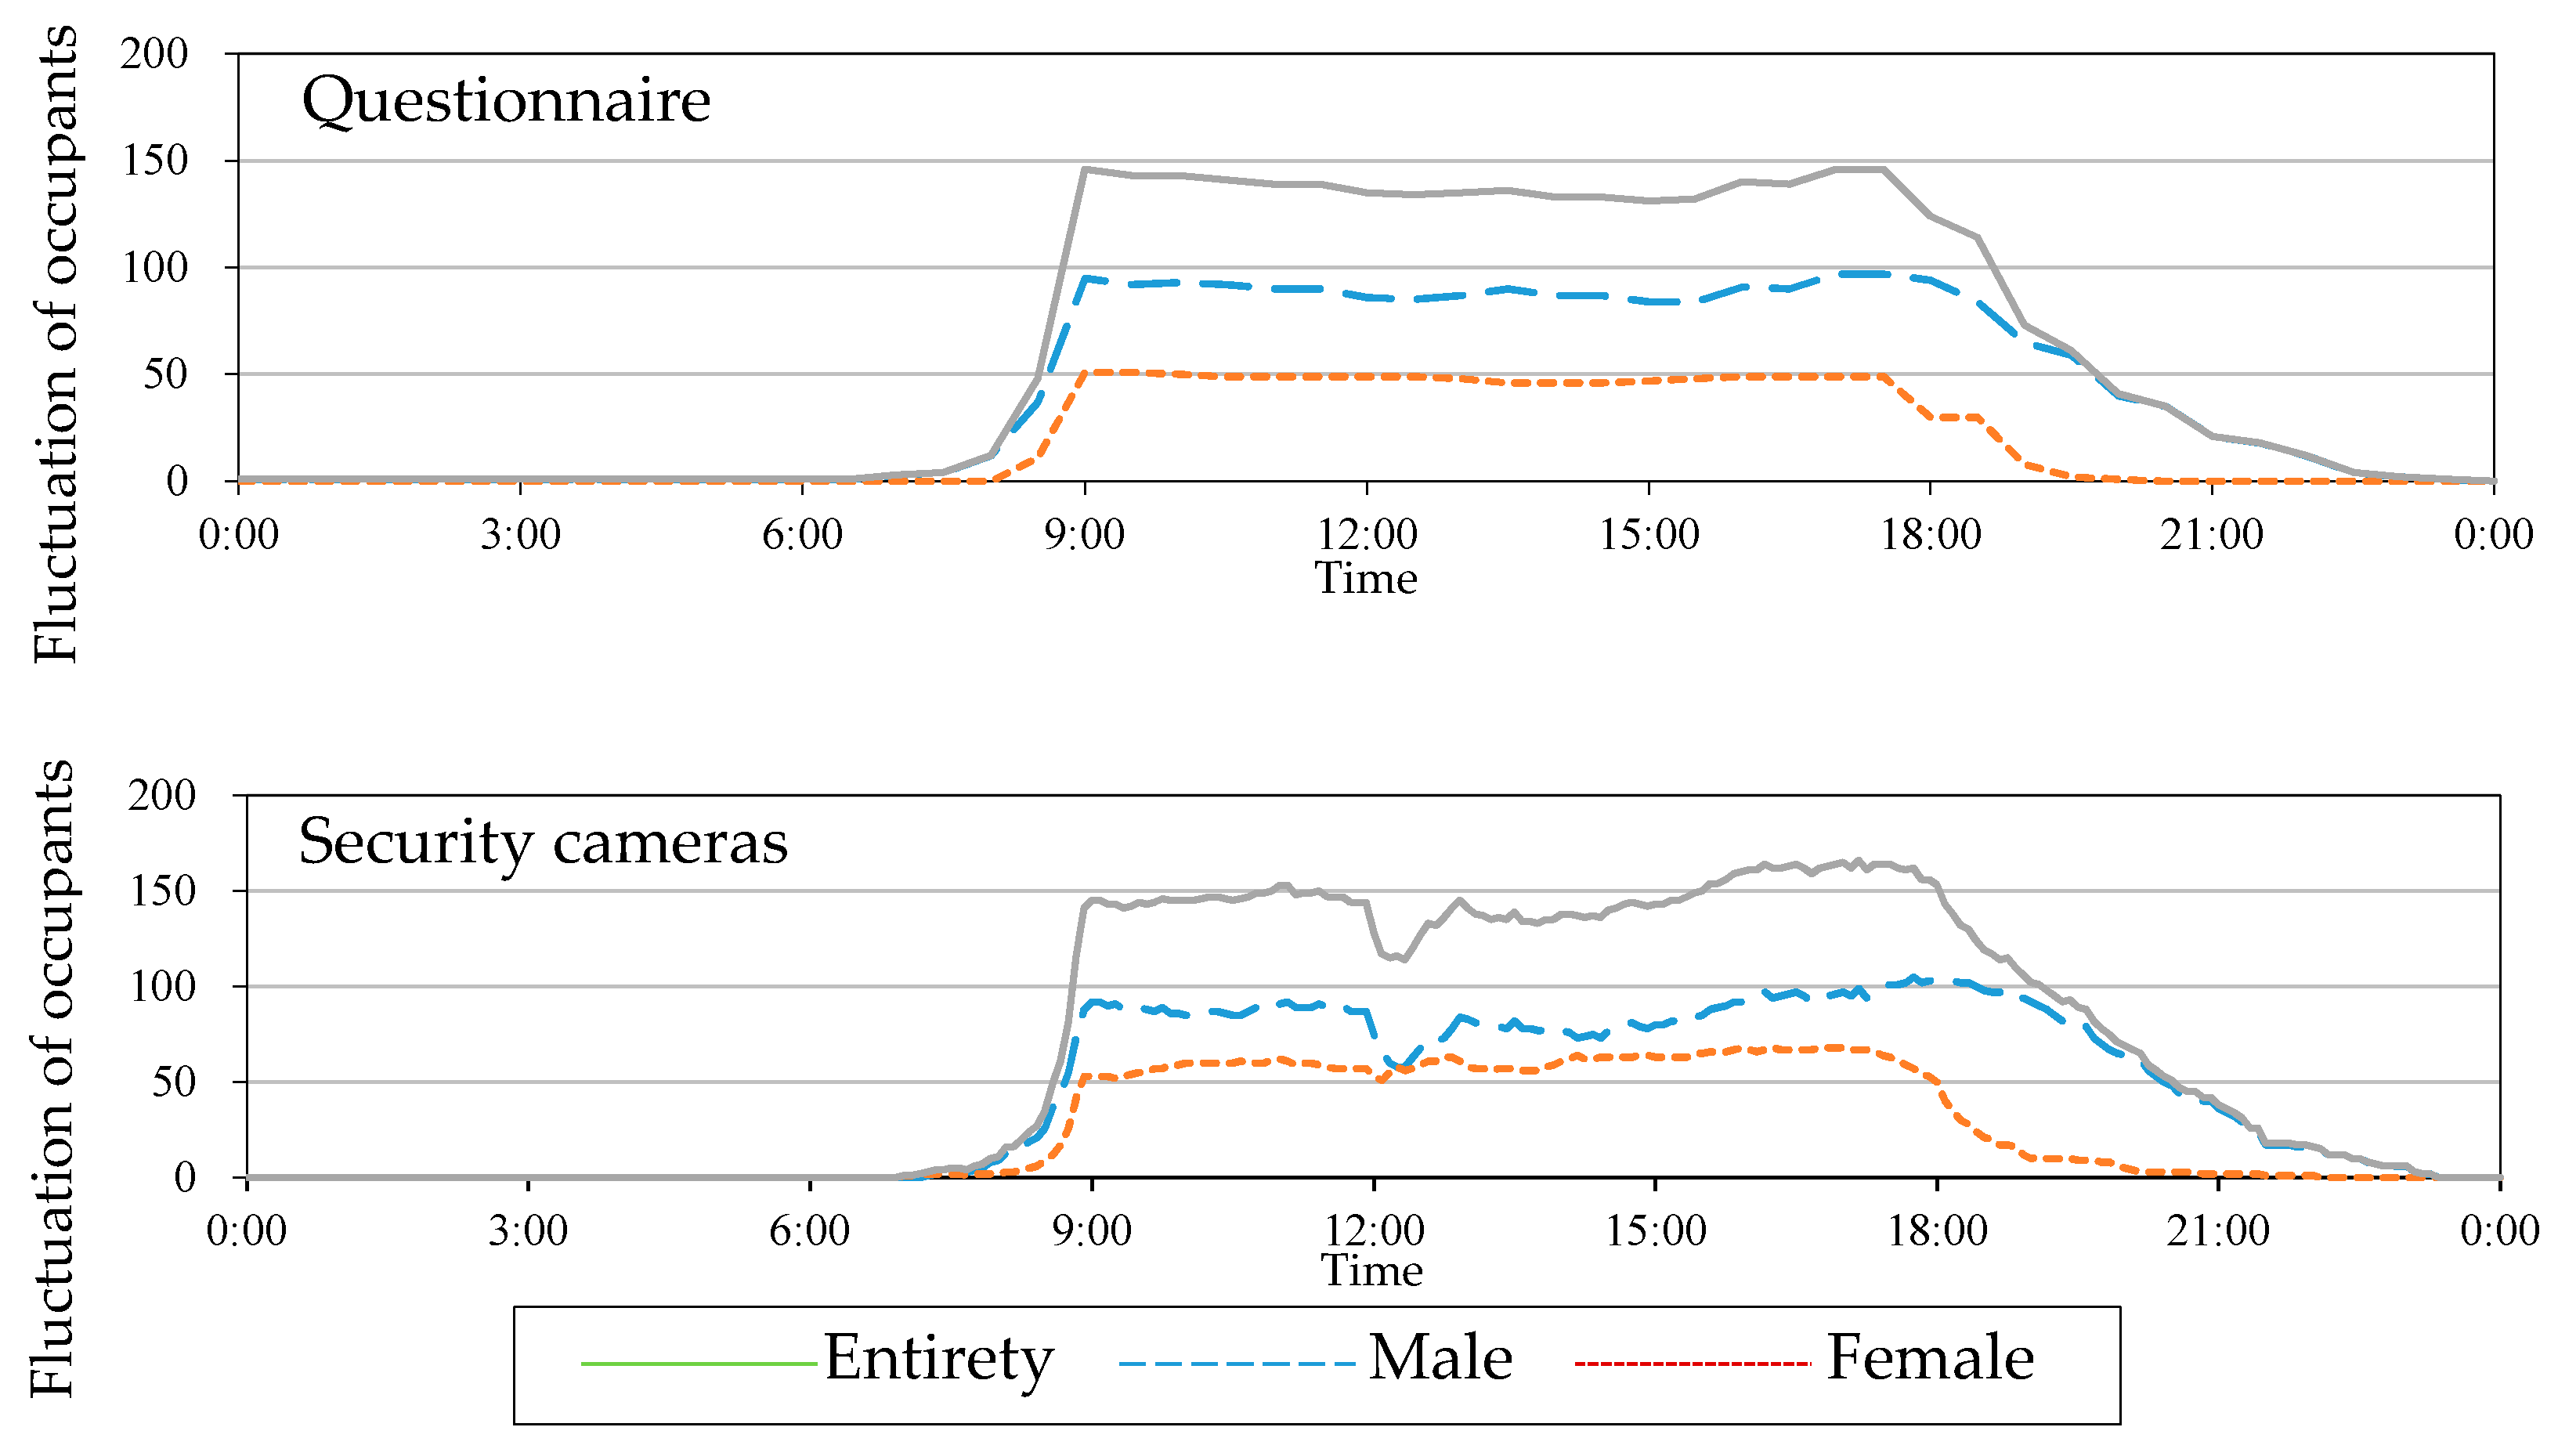
The number of occupants registered for T-building is shown in Table 14. The movements of people obtained by questionnaire on Thursday, 12 November and an example of the fluctuation of occupants captured by a security camera on Thursday, 12 November in Figure 12.
The maximum numbers of occupants by gender calculated from the data obtained from questionnaires and security cameras are shown in Table 15. Though the fluctuation of occupants was seen both in questionnaire and on security cameras, the female maximum number of occupants monitored on security cameras was about 1.3 times greater than that counted by questionnaire. This may be due to the fact that there were visitors who had not been reflected in the questionnaire.
3.3. Water Consumption Measurement
Average flush time and average flush volume are two of the simulation conditions set forth in MSWC. Therefore, WC flush time and flush volume were measured to calculate average flush time and average volume in WC in T-building.
Single WC was flushed several times and the fluctuation of flow rate was measured with an ultrasonic flow meter.
4. The Calculation of Water Load
4.1. Conventional Water Load Calculation Method
Qday and Qmax obtained from calculations for all floors, B1 to 3rd floor, 4th floor, 5th floor and 6th floor are shown in Table 17. Actual basic unit was smaller than conventional basic unit in both the personnel method and fixture method. There was a difference of 21,280 L/day in Qday for all floors in the personnel method.
4.2. Water Load Calculation Based on MSWC
The simulation conditions in T-building are shown in Table 18 [18]. The number of sanitary fixtures in the building, average flush time, average flush volume, and simulation conditions such as the target number were entered to calculate water load. Also, presence rate was calculated from the number of occupants and registrants in the questionnaire, and used as a simulation condition.
The number of registrants on each floor of T-building in August was entered as the target number, and simulations were performed for all floors, B1 to 3rd floor, 4th floor, 5th floor, and 6th floor. The actual number of female occupants multiplied by 1.3 was used as the number of female occupants in this simulation.
The results of simulations in MSWC are shown in Table 19. Except some cases, the simulation results based on personnel/area were larger than those based on the number of occupants, which confirmed that there was a difference of 8713 L/day for all floors.
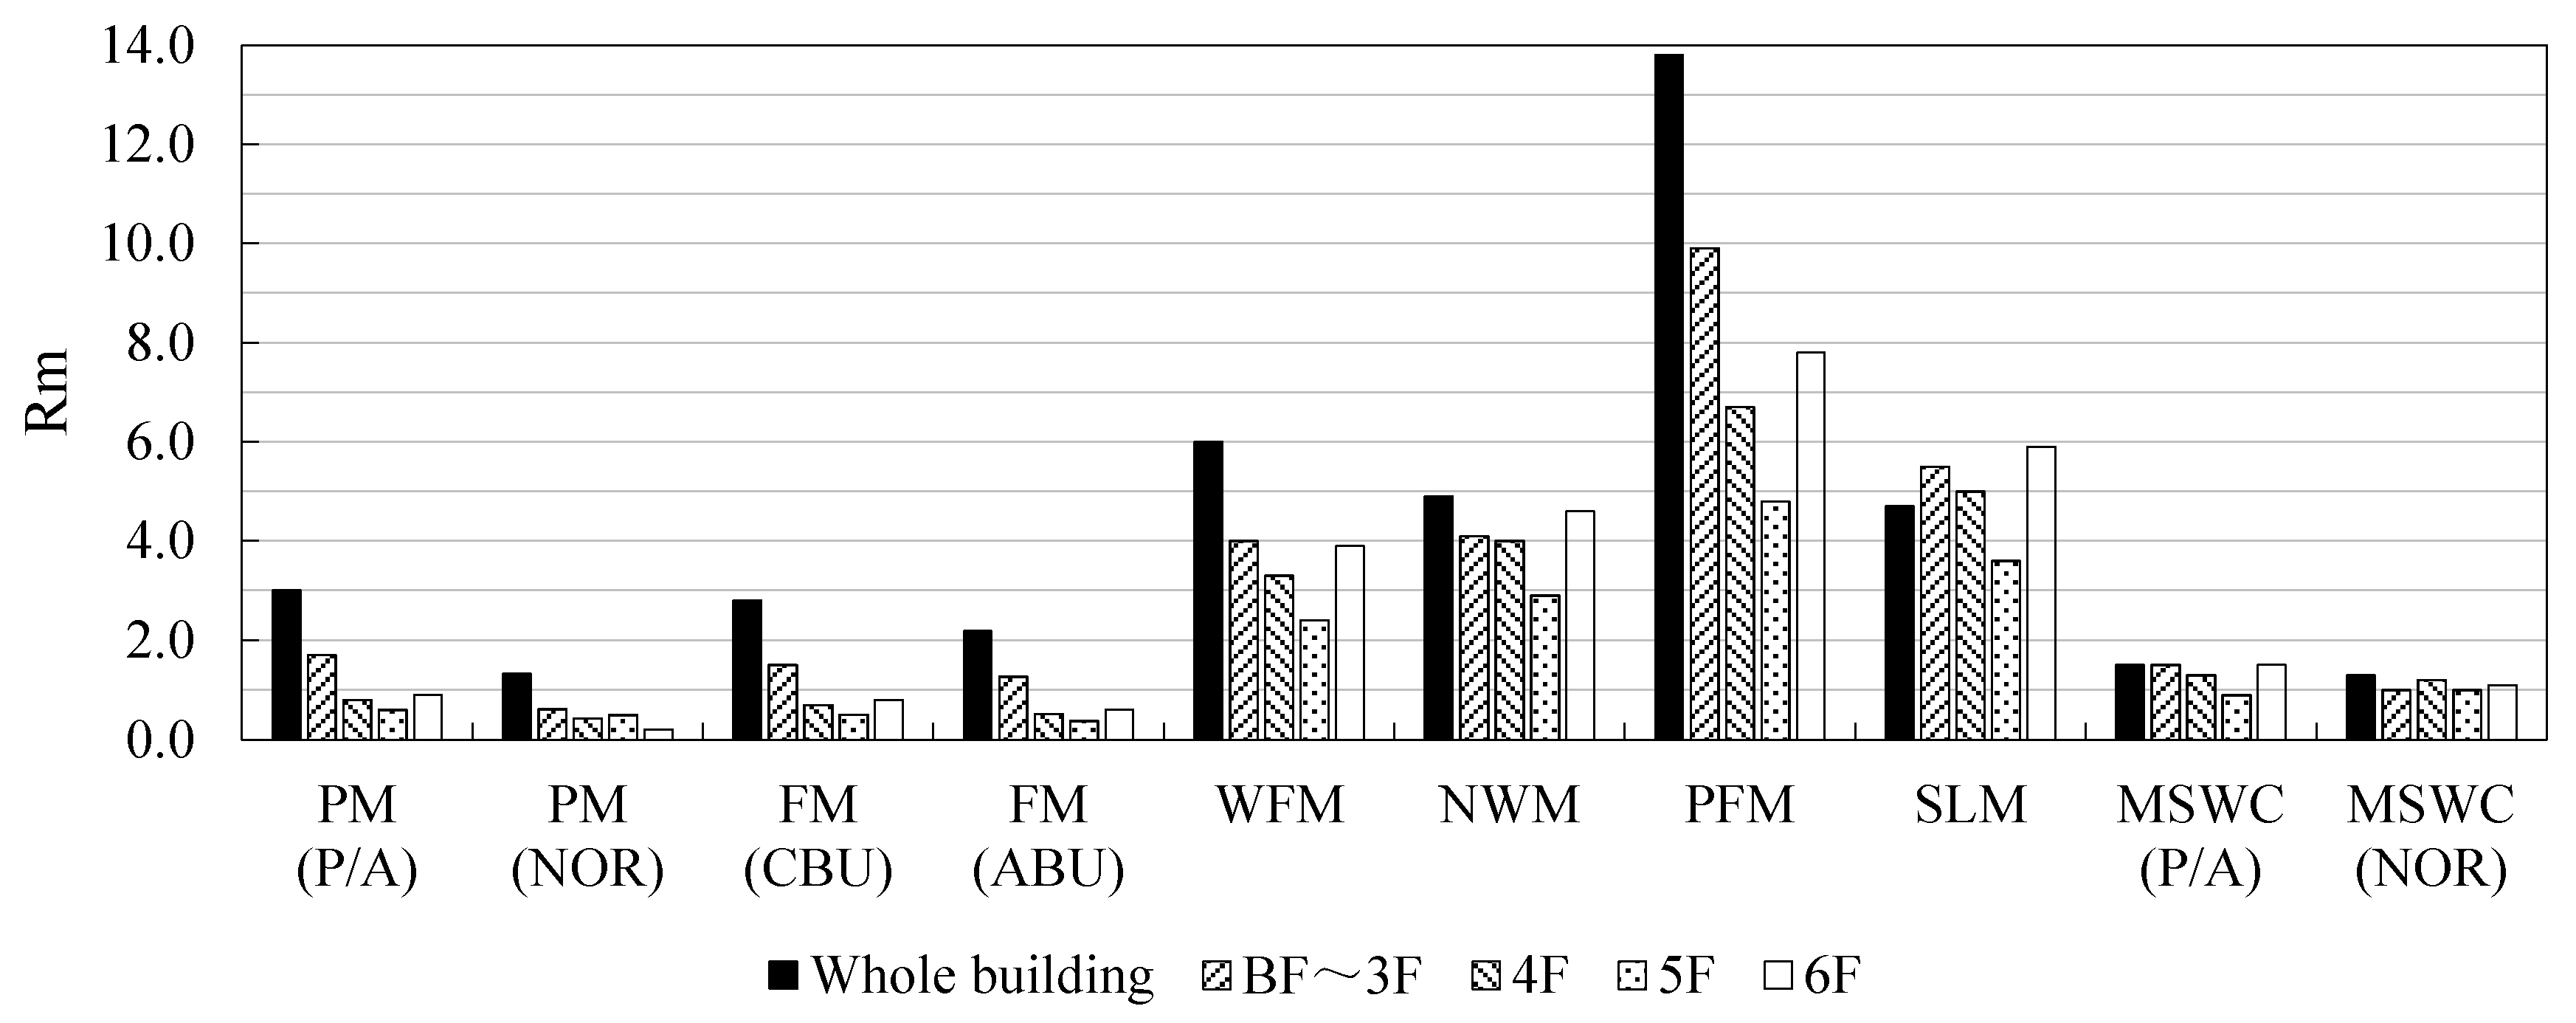
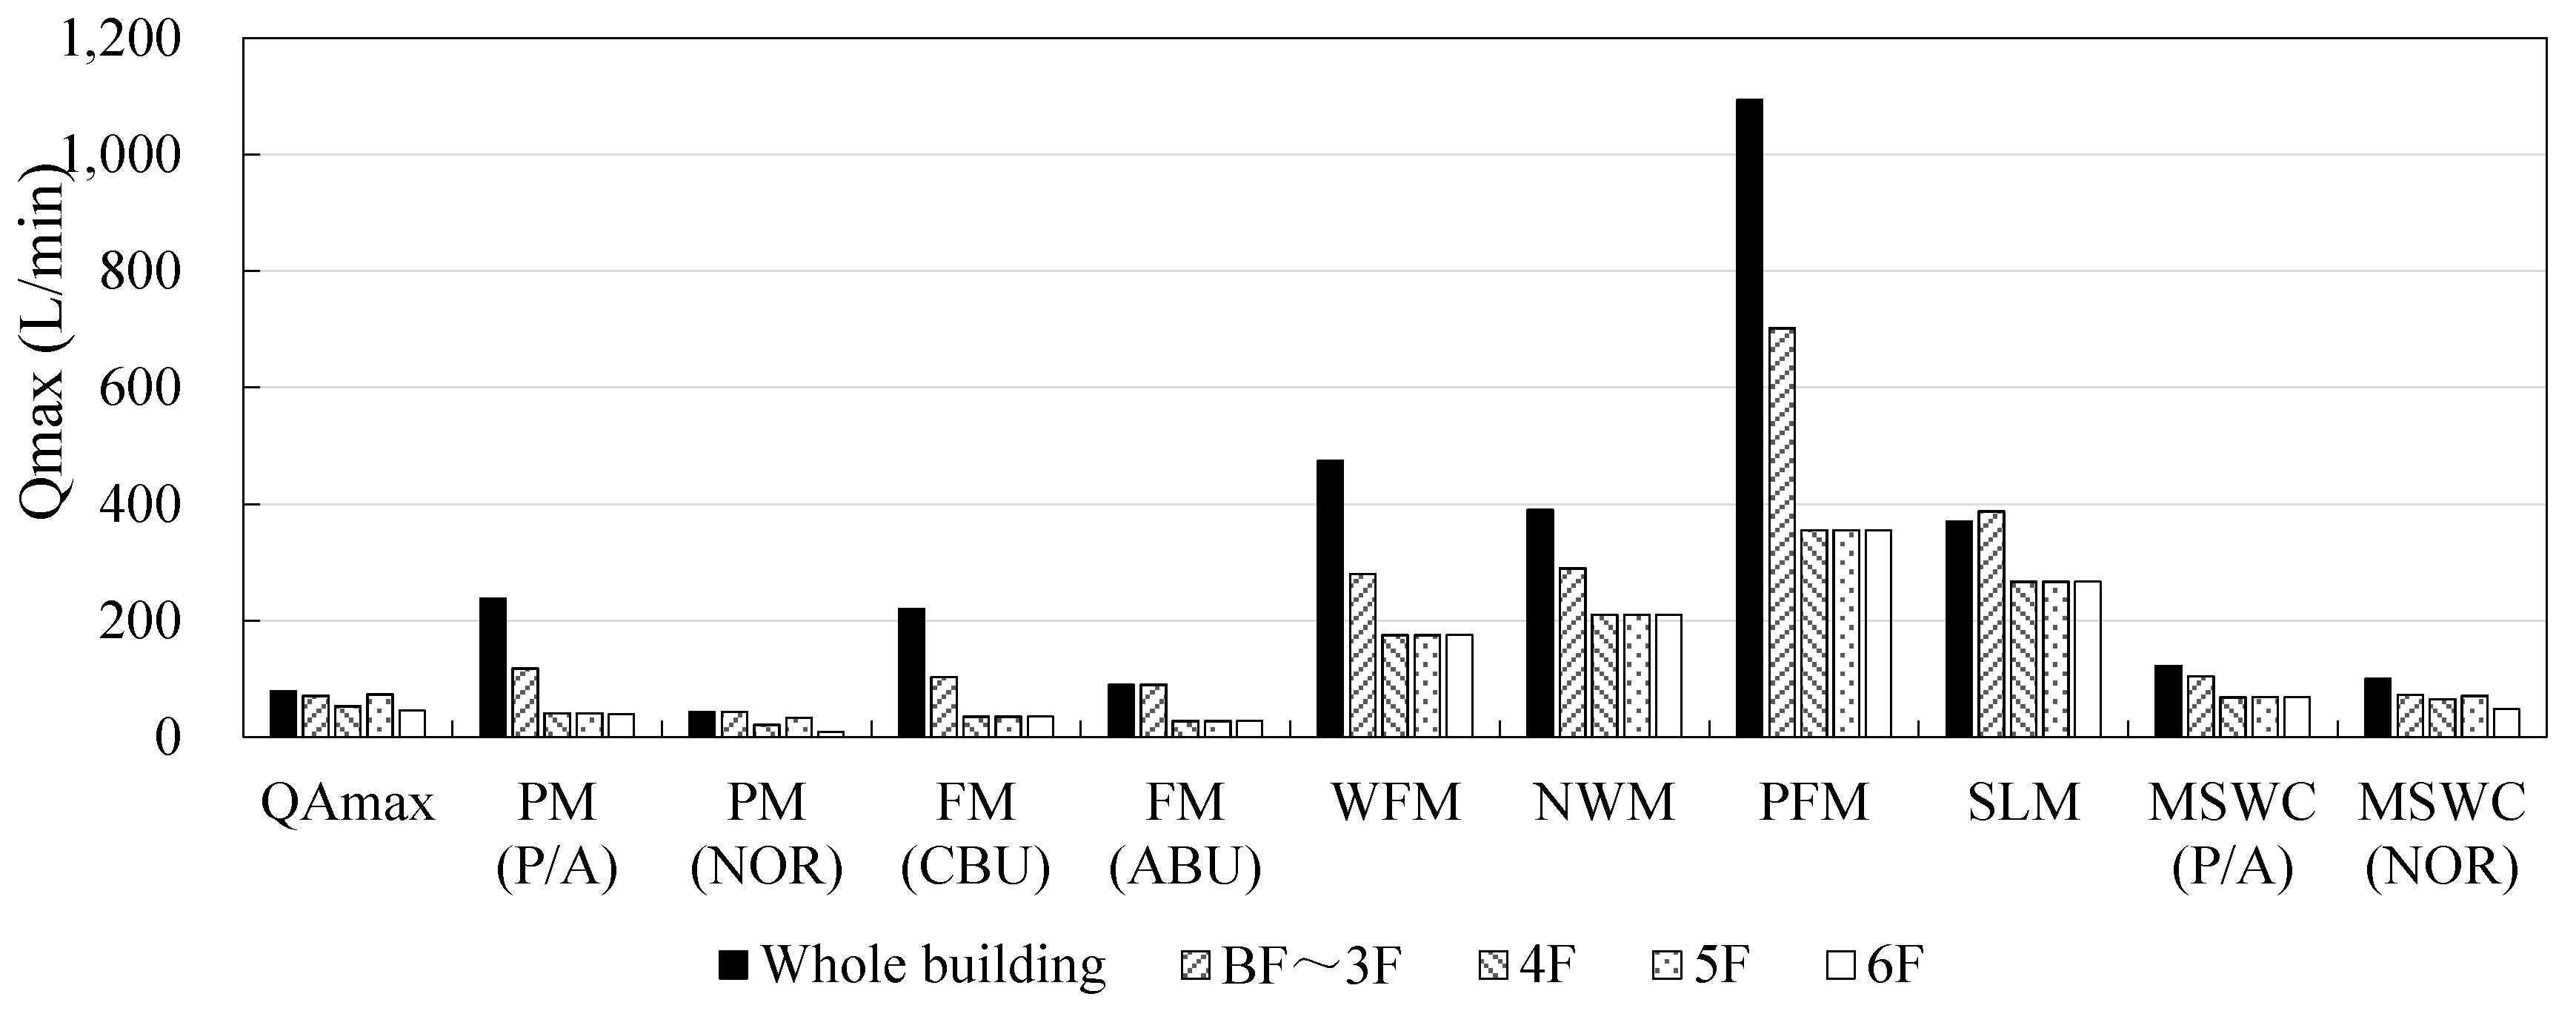
5. Comparison of Each Water Load Calculation Method
The Comparison of Qday obtained by each method is shown in Figure 13, the ratio of Qday to actual measurements in Figure 14, the comparison of Qmax obtained by each method in Figure 15, and the ratio of Qmax to actual measurements in Figure 16 (actual measurements of Qday is referred to as QAday, the ratio of Qday to QAday as Rd, actual measurements of Qmax as QAmax, and the ratio of Qmax to QAmax as Rm below). In comparison of Qday, the total figure of each floor and the figures for all floors were used in MSWC. MSWC calculations for the number of occupants were the closest to actual measurements. Compared to the conventional design standards, the personnel method based on the number of occupants and the fixture method based on actual basic unit produced figures closer to actual measurements in Qday and Qmax for all floors. However, they were smaller than actual measurements in Qmax for each floor, indicating that the personnel method and fixture method in the conventional design standards are not reliable when making calculations based on only a few sanitary fixtures installed.
6. Conclusions
In this study, the accuracy of water load calculation based on the conventional method and MSWC simulation were compared and validated.
The conventional water load calculation methods were found to overestimate water load except Qmax for each floor in the personnel method and fixture method. Qmax for all floors and Qday in the personnel and fixture methods using actual basic unit produced figures closer to actual measurements than the conventional methods did.
MSWC calculations with the number of occupants were the closest to actual measurements. It was confirmed that obtaining accurate number of people was important as the simulation based on personnel/area produced larger than actual measurements than the simulation based on the number of occupants. The comparison between the conventional methods with and without the correction of the basic fixture unit based on the measurement results proved that the conventional basic fixture unit should be modified [23].
To further refine and validate the accuracy of MSWC, our next step will be to compare the results of each water load calculation method with actual measurements based on detailed measurement of water consumption and counting of the number of people in buildings for multiple uses.
Author Contributions
Kyosuke Sakaue conceived and planned the research/measurement; Saburo Murakawa contributed the basic theory and provided the simulation tool; Guang-Zheng Wu performed the investigation, analyzed the data and wrote the paper.
Conflicts of Interest
The authors declare no conflict of interest.
References
- Ministry of Land, Infrastructure, Transport and Tourism. Facilities Design Criteria; MLIT: Tokyo, Japan, 2006; pp. 447–454.
- The Society of Heating, Air-Conditioning and Sanitary Engineers of Japan; SHASE-S206-2009; SHASE: Tokyo, Japan, 2009.
- Murakawa, S. Study on the method for calculating water consumption and water uses in multi-story flats. In Proceedings of the 13th International Symposium of CIB W062, Tokyo, Japan, 9–10 April 1985; pp. 1–19. [Google Scholar]
- Wu, G.Z.; Sakaue, K.; Kojima, K.; Fujimura, K.; Murakawa, S.; Hayakawa, K. Examinations on Water Supply Load Calculation Methods of Office Building: Comparison between Conventional Design Methods and the Simulation Methods. In Proceedings of the 39th International Symposium of CIB W062, Nagano, Japan, 17–19 September 2013; pp. 529–540. [Google Scholar]
- Murakawa, S. Investigation of the Method of calculation of Water Consumption in the Designing of Building Equipments: Part 1 The Theory of Calculation and Analyses of the Use of Water in Multi-storey Flats. Transact. Archit. Inst. Jpn. 1976, 246, 71–80. (In Japanese) [Google Scholar]
- Murakawa, S. Investigation of the Method of calculation of Water Consumption in the Designing of Building Equipments: Part 4 Calculation of Water Load and Analysis of Simultaneous Uses. Transact. Archit. Inst. Jpn. 1976, 253, 103–112. (In Japanese) [Google Scholar]
- Holmberg, S. Computer dimensioning of water supply systems with use of continuous field measurements as input data. In Proceedings of the 15th International Symposium of CIB W062, Sao Paulo, Brazil, 14–18 September 1987. [Google Scholar]
- Yamane, Y.; Murakawa, S.; Takata, H.; Sakamoto, K. Analysis on The Water Usage in Office Buildings: A study on the calculating method for cold and hot water supply demands based on the analysis of water usage in the time series (Part 2). J. Environ. Eng. Trans. AIJ 2005, 70, 65–72. (In Japanese) [Google Scholar] [CrossRef]
- Blokker, E.J.M.; Pieter-Quirijns, E.J.; Vreeburg, J.H.G.; van Dijk, J.C. Simulating nonresidential water demand with a stochastic end-use model. J. Water Res. Plan. Manag. 2011, 137, 511–520. [Google Scholar] [CrossRef]
- Wong, L.T.; Mui, K.W.; Zhou, Y. Energy Efficiency Evaluation for the Water Supply Systems in Tall Buildings. Available online: http://journals.sagepub.com/doi/abs/10.1177/0143624417699857?journalCode=bsea& (accessed on 23 May 2017).
- Murakawa, S.; Takata, H. Development of the calculating method for cold and hot water consumption based on the fixture usage in the time series through a day: A case study of apartment houses. In Proceedings of the International Symposium of CIB/W62 on Water Supply and Drainage for Buildings, Iasi, Romania, 18–19 September 2002; pp. 1–13. [Google Scholar]
- Murakawa, S.; Hiroshi, T. Development of the calculating method for the loads of clod and hot water consumption in the apartment houses. In Proceedings of the International Symposium of CIB/W62 on Water Supply and Drainage for Buildings, Ankara, Turkey, 11–12 September 2003; pp. 281–295. [Google Scholar]
- Takahashi, D.; Murakawa, S.; Nishina, D.; Takada, H. Development of the calculating method of cold and hot water consumption based on the fixture usage in the time series through a day (Part 4) Analysis on the loads of water supply demands in the restaurants of a complex commercial building. In Summaries of Technical Papers of Annual Meeting; Architectural Institute of Japan: Tokyo, Japan, 2004; Volume D-1. [Google Scholar]
- Takata, H.; Murakawa, S.; Nishina, D.; Tanaka, A. An Analysis on the Loads of Hot Water Consumption of Guest Rooms in a Hotel. In Proceedings of the International Symposium of CIB/W62 on Water Supply and Drainage for Buildings, Brussels, Belgium, 14–16 September 2005; pp. 1–9. [Google Scholar]
- Wu, G.Z.; Sakaue, K.; Hayakawa, K.; Murakawa, S. Comparison between the traditional methods and the simulation method in water supply load calculation methods for office building. In Proceedings of the 40th International Symposium of CIB W062, Sao Paulo, Brazil, 8–10 September 2014; pp. 35–44. [Google Scholar]
- Wu, G.Z.; Sakaue, K.; Hayakawa, K.; Murakawa, S.; Inada, Y. Verification of calculating method using the Monte Carlo method for water supply demands: The water consumption of mixed-use building for rent. In Proceedings of the 41th International Symposium of CIB W062, Beijing, China, 17–20 August 2015; pp. 306–318. [Google Scholar]
- Sakamoto, K.; Murakawa, S.; Takada, H.; Toyosada, K.; Yoshikawa, H. Development of the calculating method for the loads of water consumption in office buildings: Dynamic estimation for the loads of water demands for design of water supply system. Archit. Inst. Jpn. 2016, 39, 475–478. (In Japanese) [Google Scholar]
- Kurisu, S.; Sakaue, K.; Murakawa, S.; Wu, G.Z.; Fujimura, K. Verification of calculation method using Monte Carlo method for water supply demands: The water consumption of an office building. In Proceedings of the 42th International Symposium of CIB W062, Kosice, Slovakia, 29 August–1 September 2016; pp. 306–318. [Google Scholar]
- Okada, K. Some Problems on the Probability of Simultaneous Usage of Building Equipments (Scientefic Basis of Planning Building). Archit. Inst. Jpn. 1957, 57, 65–68. (In Japanese) [Google Scholar]
- Kanasaki, T.; Murakawa, S. Fundamental Study on the Appropriate Number of scale of Plumbing Fixture: Part 5 The Number of Appropriate Fixtures at Office Building. Archit. Inst. Jpn. 1983, 151. (In Japanese) [Google Scholar]
- Murakawa, S.; Yamate, T. Investigation of Calculating Method for Flow Rates Design and Water Uses in Multi-storey Flats. Soc. Heat. Air-Cond. Sanit. Eng. Jpn. 1982, 20, 11–27. [Google Scholar]
- Murakawa, S. New Design Method of plumbing and drainage systems of Revenue House. Jpn. Soc. Plumb. Eng. 1990, 7, 23–26. (In Japanese) [Google Scholar]
- Hunter, R.B. Building Materials and Structures Report No.65; U.S. Department of Commerce: Washington, DC, USA, 1940.
- Takada, H. Analysis on the Uses and Cold-Hot Water Consumption of Toilet and Hot-Water Service Room in the Office Building: Part 1 Using frequency of sanitary fixtures. Archit. Inst. Jpn. 2003, 26, 533–536. (In Japanese) [Google Scholar]
- Takada, H.; Murakawa, S.; Nishina, D.; Sakamoto, K.; Yamaoka, M.; Yamane, Y. A Study on the Cold and Hot Water Consumption based on the Time Series Analysis: Part 2 The Usage of Fixtures in the Office Building’s Toilets. In Summaries of Technical Papers of Annual Meeting; Architectural Institute of Japan: Tokyo, Japan, 2003; pp. 455–456. (In Japanese) [Google Scholar]
- Yamane, Y.; Murakawa, S.; Nishina, D.; Sakamoto, K.; Yamaoka, M.; Takada, H. A Study on the Cold and Hot Water Consumption based on the Time Series Analysis: Part 3 Analysis on the Cold-Hot Water Demands in the Office Building’s Toilets. In Summaries of Technical Papers of Annual Meeting; Architectural Institute of Japan: Tokyo, Japan, 2003; pp. 457–458. (In Japanese) [Google Scholar]
- Takada, H.; Murakawa, S.; Nishina, D.; Yamane, Y. A Study on the Cold and Hot Water Consumption based on the Time Series Analysis: Part 6 Cold Water Demands in the Office Building’s Toilets. In Summaries of Technical Papers of Annual Meeting; Architectural Institute of Japan: Tokyo, Japan, 2004; pp. 559–560. (In Japanese) [Google Scholar]
- Sakamoto, K.; Murakawa, S.; Koshikawa, Y.; Takada, H.; Yamane, Y. Development of the Calculating Method of Cold and Hot Water Consumption based on the Fixture Usage in the Time Series through a Day: Part 5 Analysis on the Loads of Water Supply Demands in the Office Buildings. In Summaries of Technical Papers of Annual Meeting; Architectural Institute of Japan: Tokyo, Japan, 2005; pp. 416–451. (In Japanese) [Google Scholar]
- Yamane, Y.; Murakawa, S.; Nishina, D.; Takada, H.; Nagae, M. Analysis on the Uses and Cold-Hot Water Consumption of Toilet and Hot-Water Service Room in the Office Building: Part 3 The usage in hot-water service room and basin. Archit. Inst. Jpn. 2004, 27, 533–536. (In Japanese) [Google Scholar]
- Takada, H.; Murakawa, S.; Yamane, Y.; Sakamoto, K. Analysis on The Water Usage in Office Buildings: A study on the calculating method for cold and hot water supply demands based on the analysis of water usage in the time series (Part 3). J. Environ. Eng. Trans. AIJ 2005, 71, 51–58. (In Japanese) [Google Scholar] [CrossRef]
- Koshikawa, Y. Analysis of the Adult’s Uses and Consciousness of Lavatories. Soc. Heat. Air-Cond. Sanit. Eng. Jpn. 1997, 65, 41–52. (In Japanese) [Google Scholar]
- Wu, G.Z.; Sakaue, K.; Fujimura, K.; Murakawa, K.; Kojima, K.; Hayakawa, K. Examinations on Water Supply Load Calculation Methods of Office Building: Comparison between Traditional Design Methods and the Simulation Tool. Tech. Pap. Annu. Meet. Soc. Heat. Air-Cond. Sanit. Eng. Jpn. 2013, 1, 1–4. (In Japanese) [Google Scholar]
Figure 1.
Calculation flow by the personnel method.
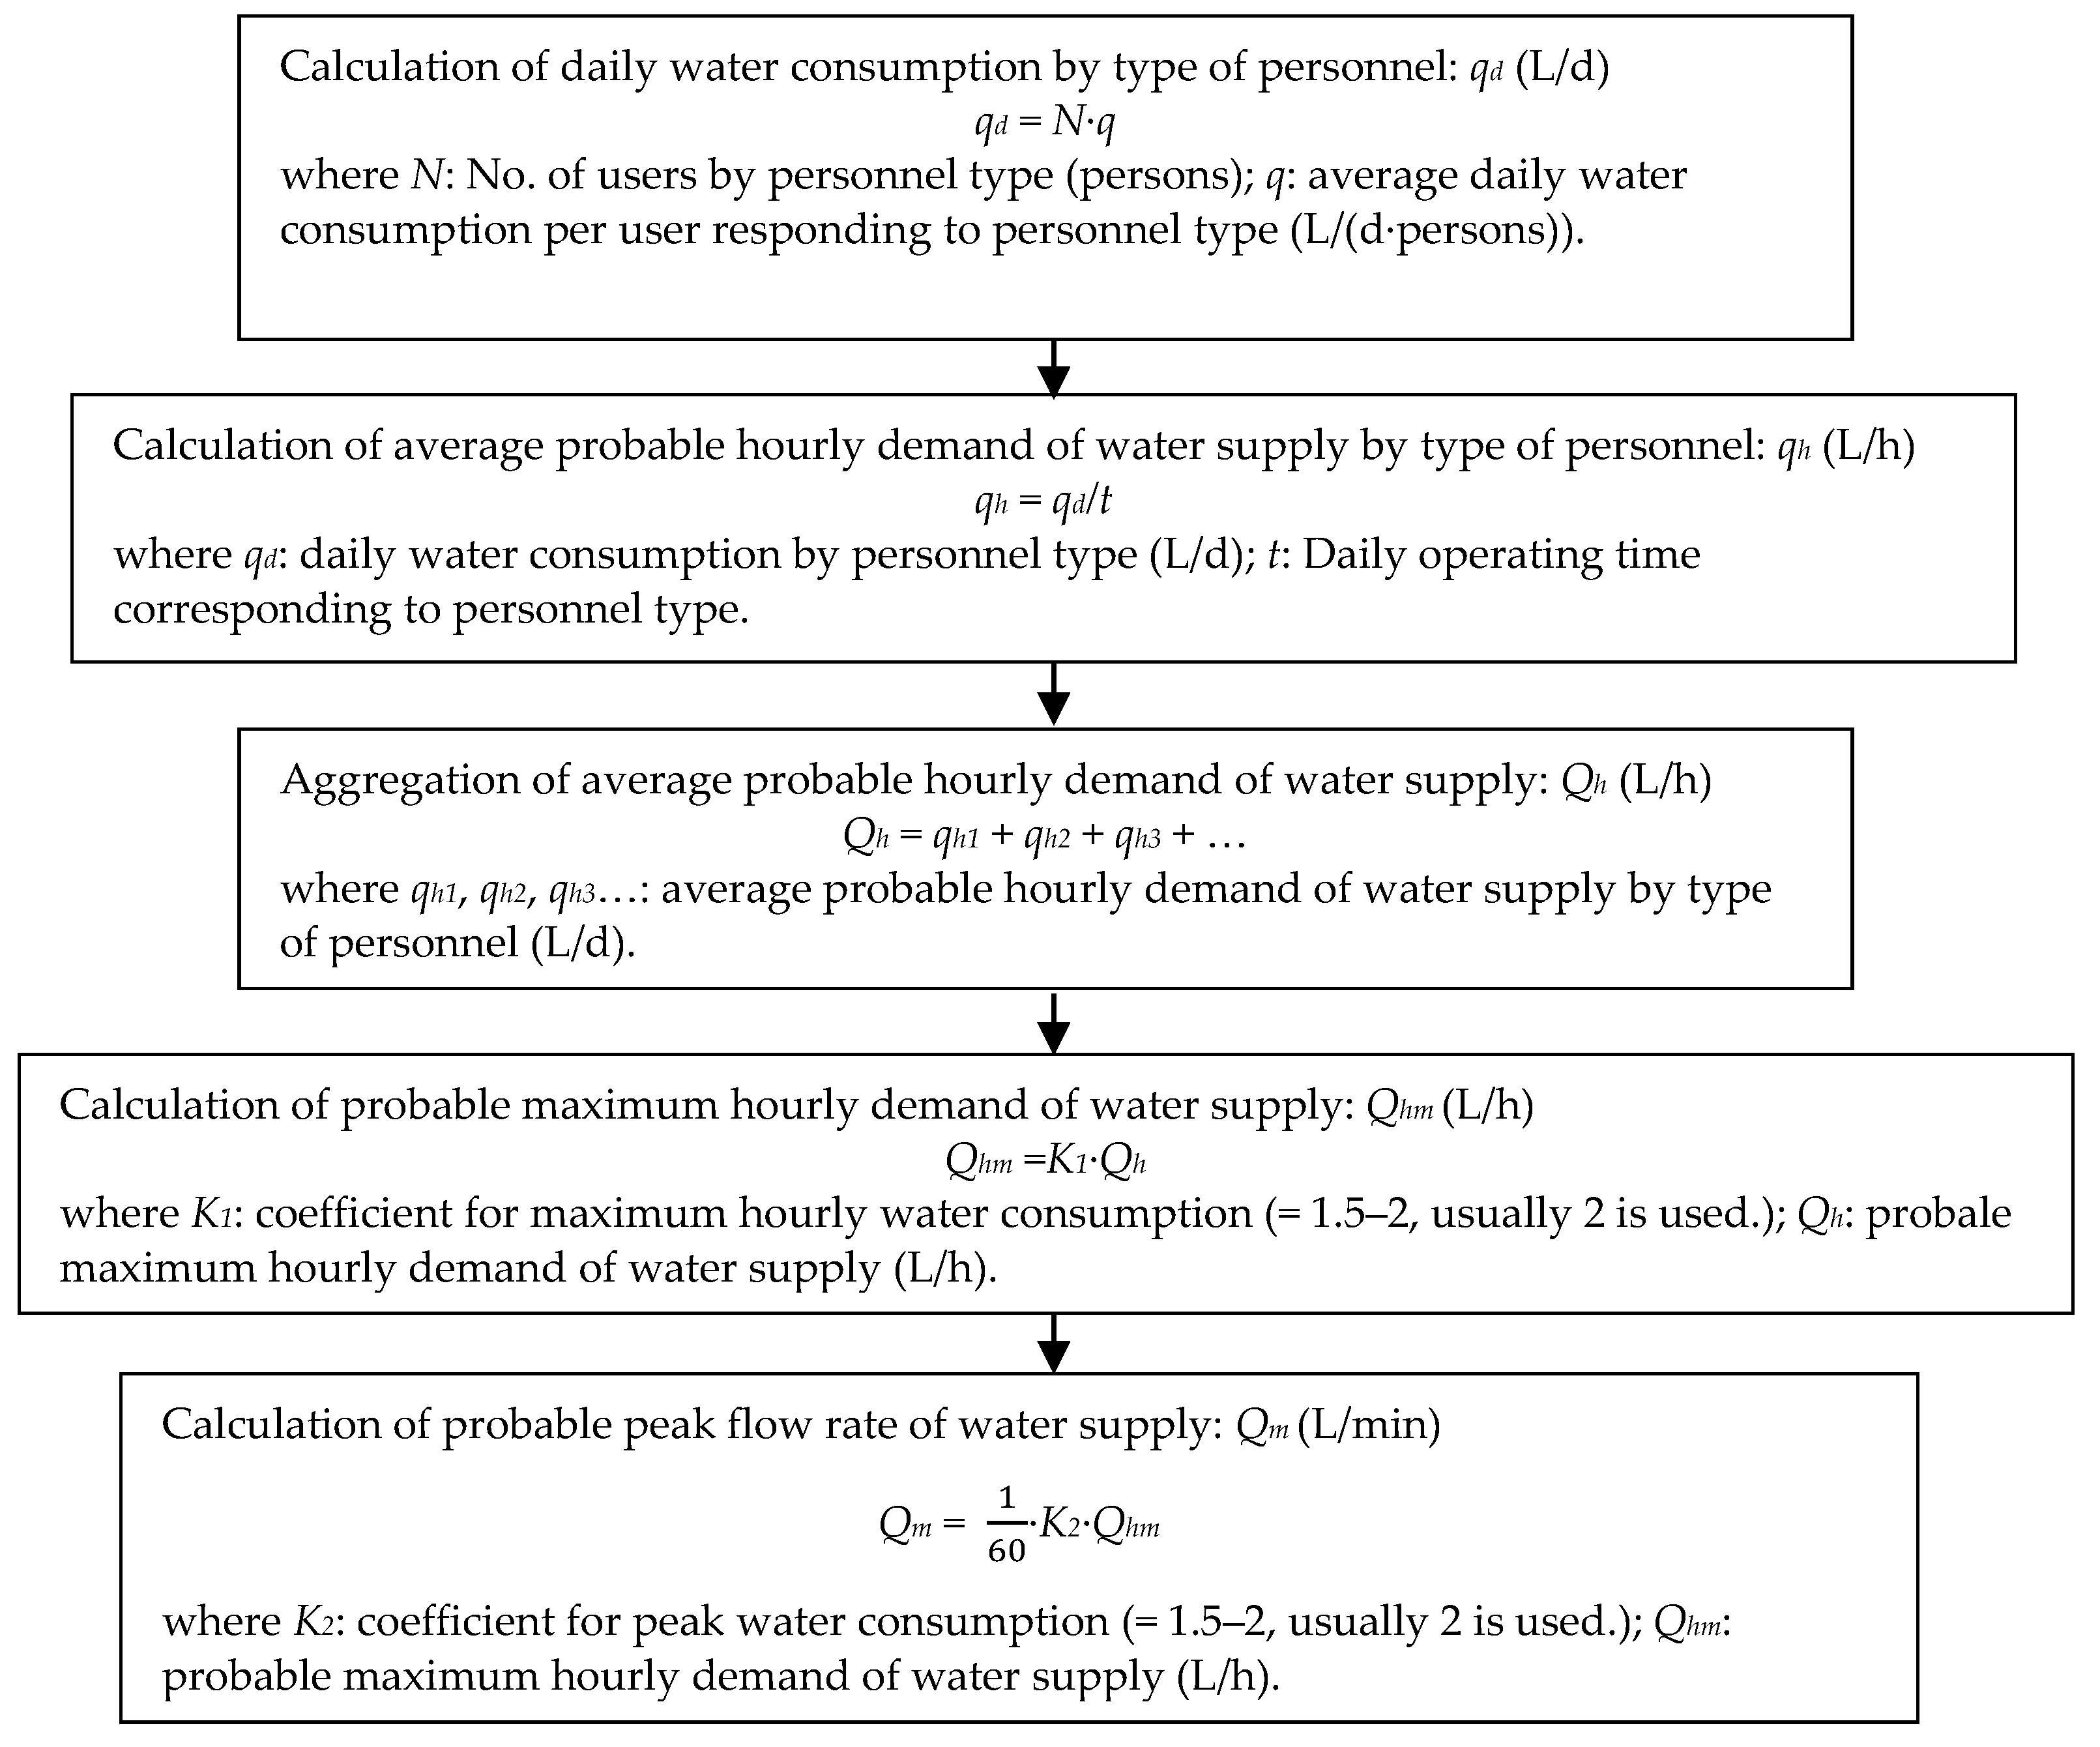
Figure 2.
Calculation flow by the fixture-method.
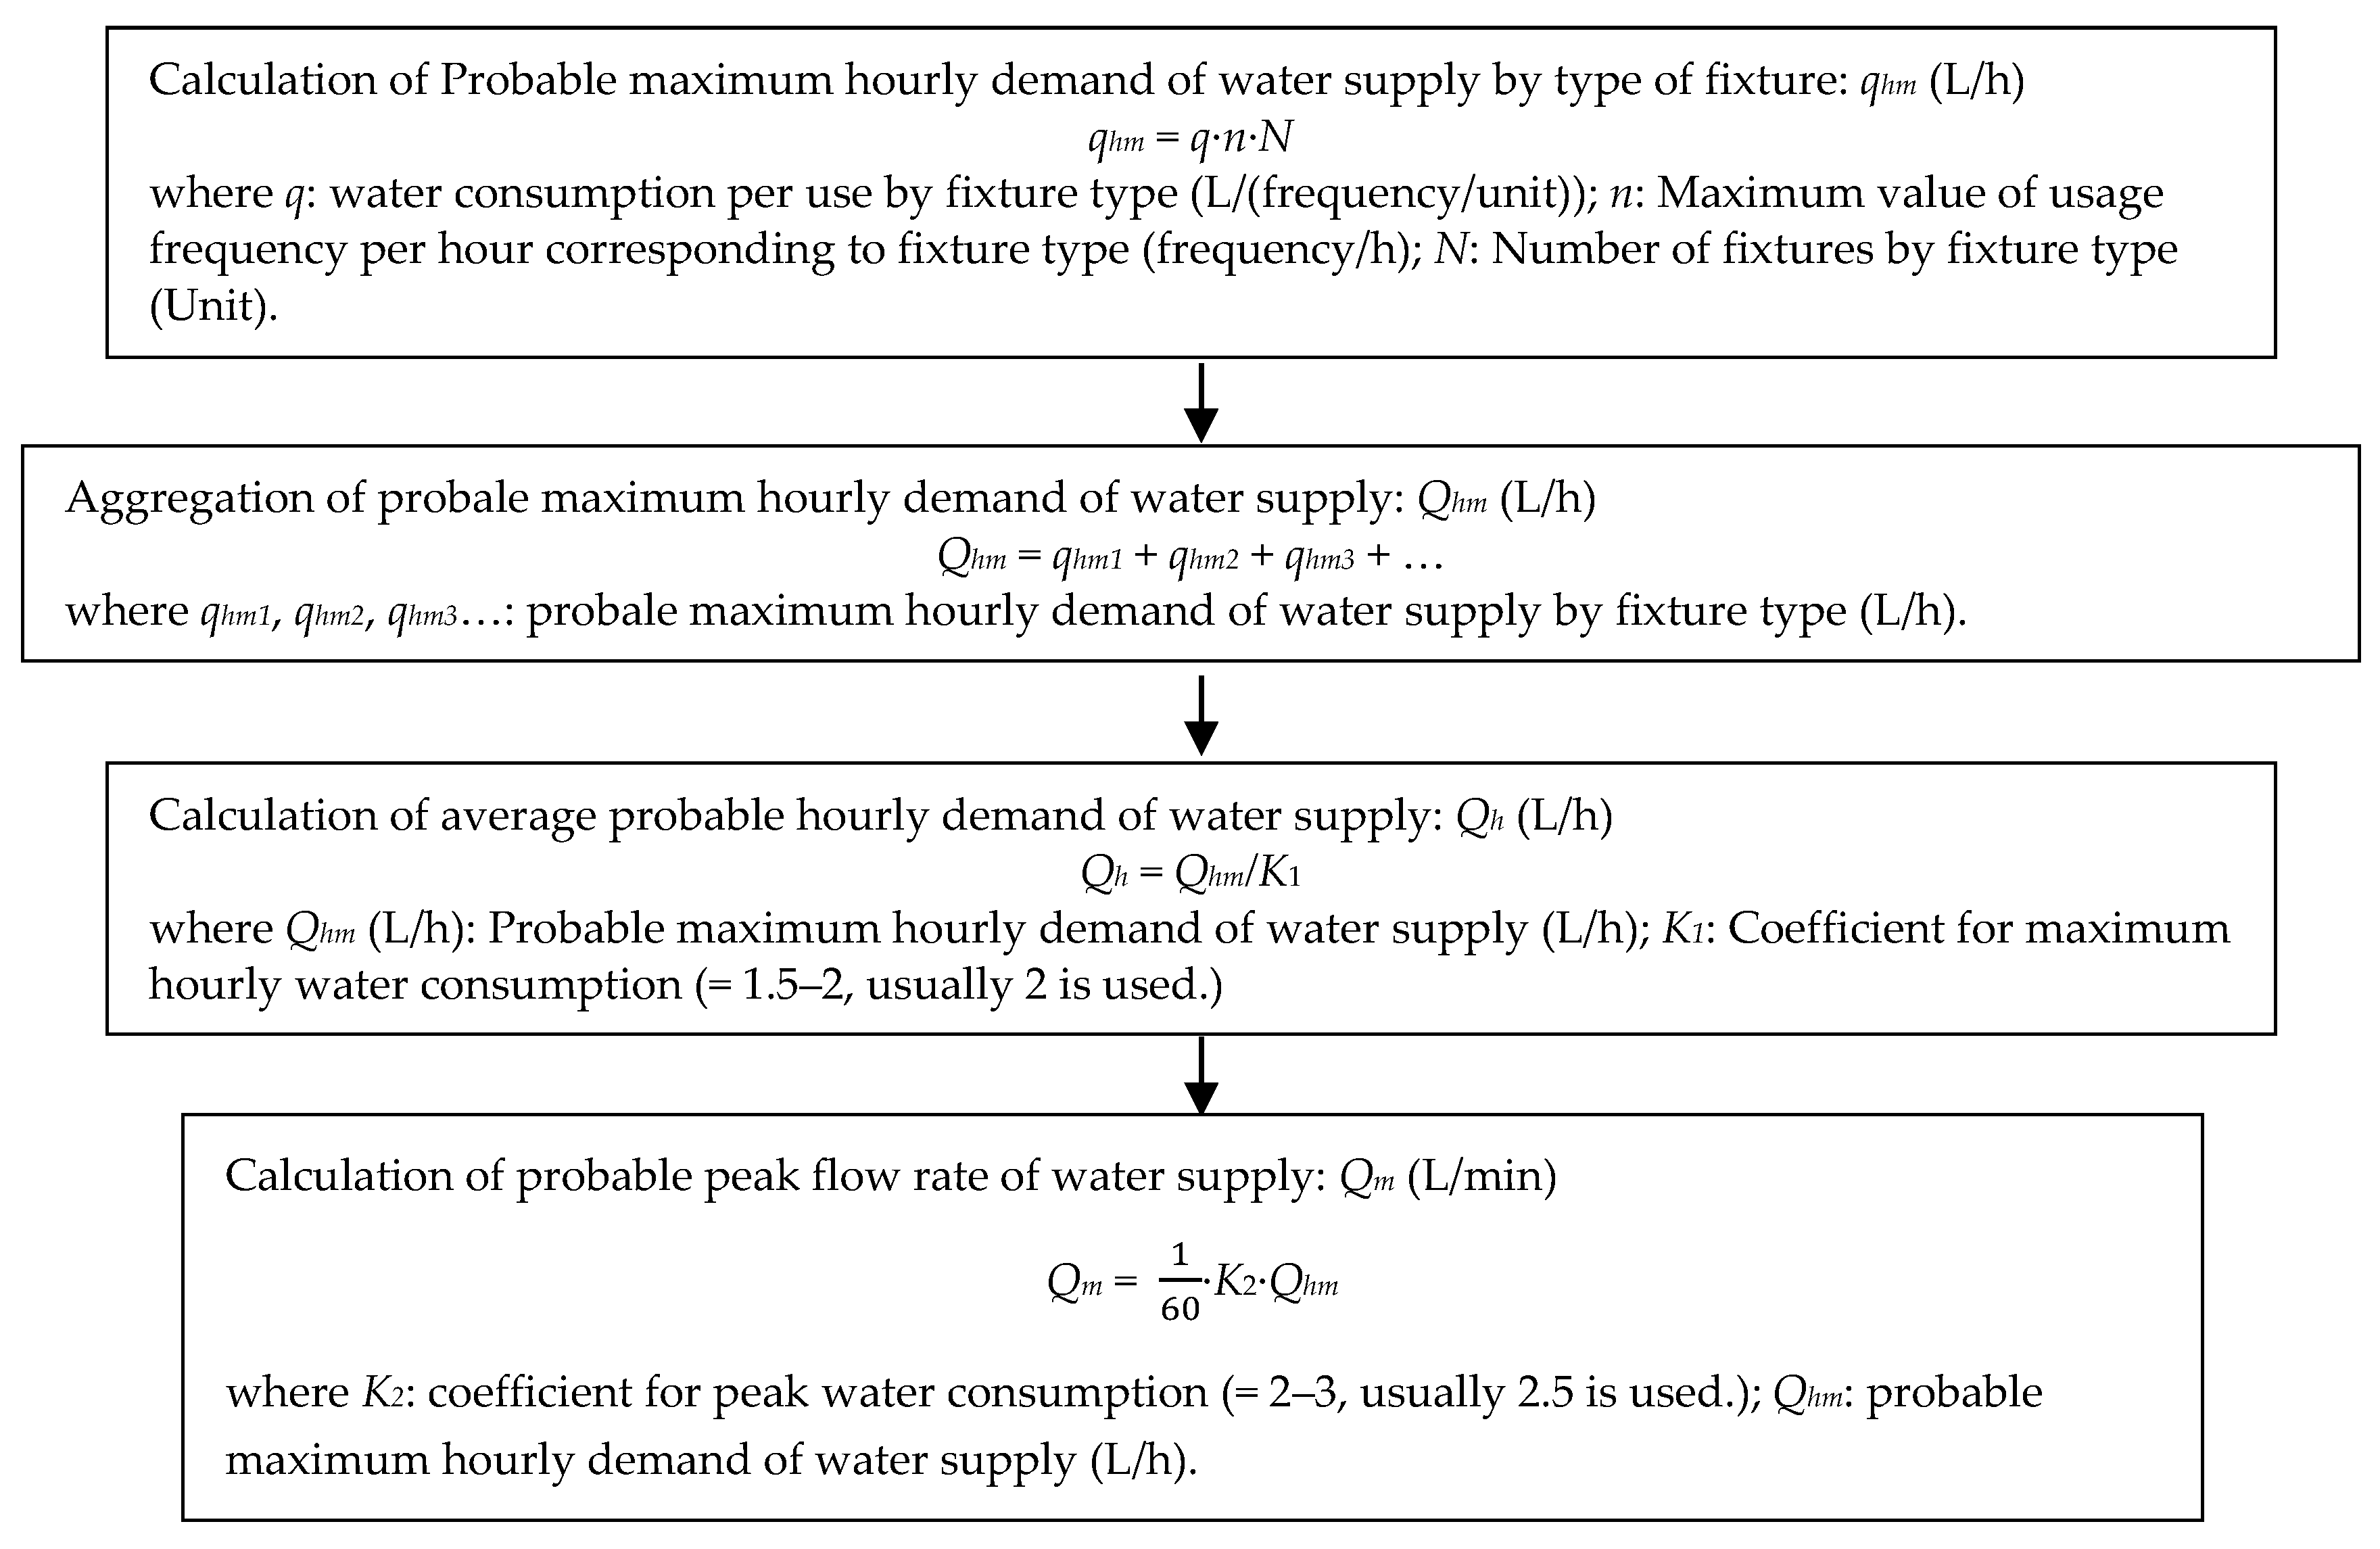
Figure 3.
Calculation of Qmax of the Calculation Method Based on Water Use Time Rate and Fixture Unit for Water Supply.
Figure 3.
Calculation of Qmax of the Calculation Method Based on Water Use Time Rate and Fixture Unit for Water Supply.

Figure 4.
Adjustment of number of fixtures (random use).


Figure 6.
Calculation of Qmax of the Method Based on Water Supply Load Unit of Fixture [2,23]. (a) Peak flow rate of water supply [L/min]; (b) Peak flow rate of water supply [L/min] (Partial expansion of (a)).

Figure 7.
Probability and frequency distribution of each item.

Figure 8.
Procedure for simulation calculation.

Figure 9.
The operation screen of Murakawa’s Simulation for Water Consumption (MSWC).

Figure 10.
The operation screen of MSWC.
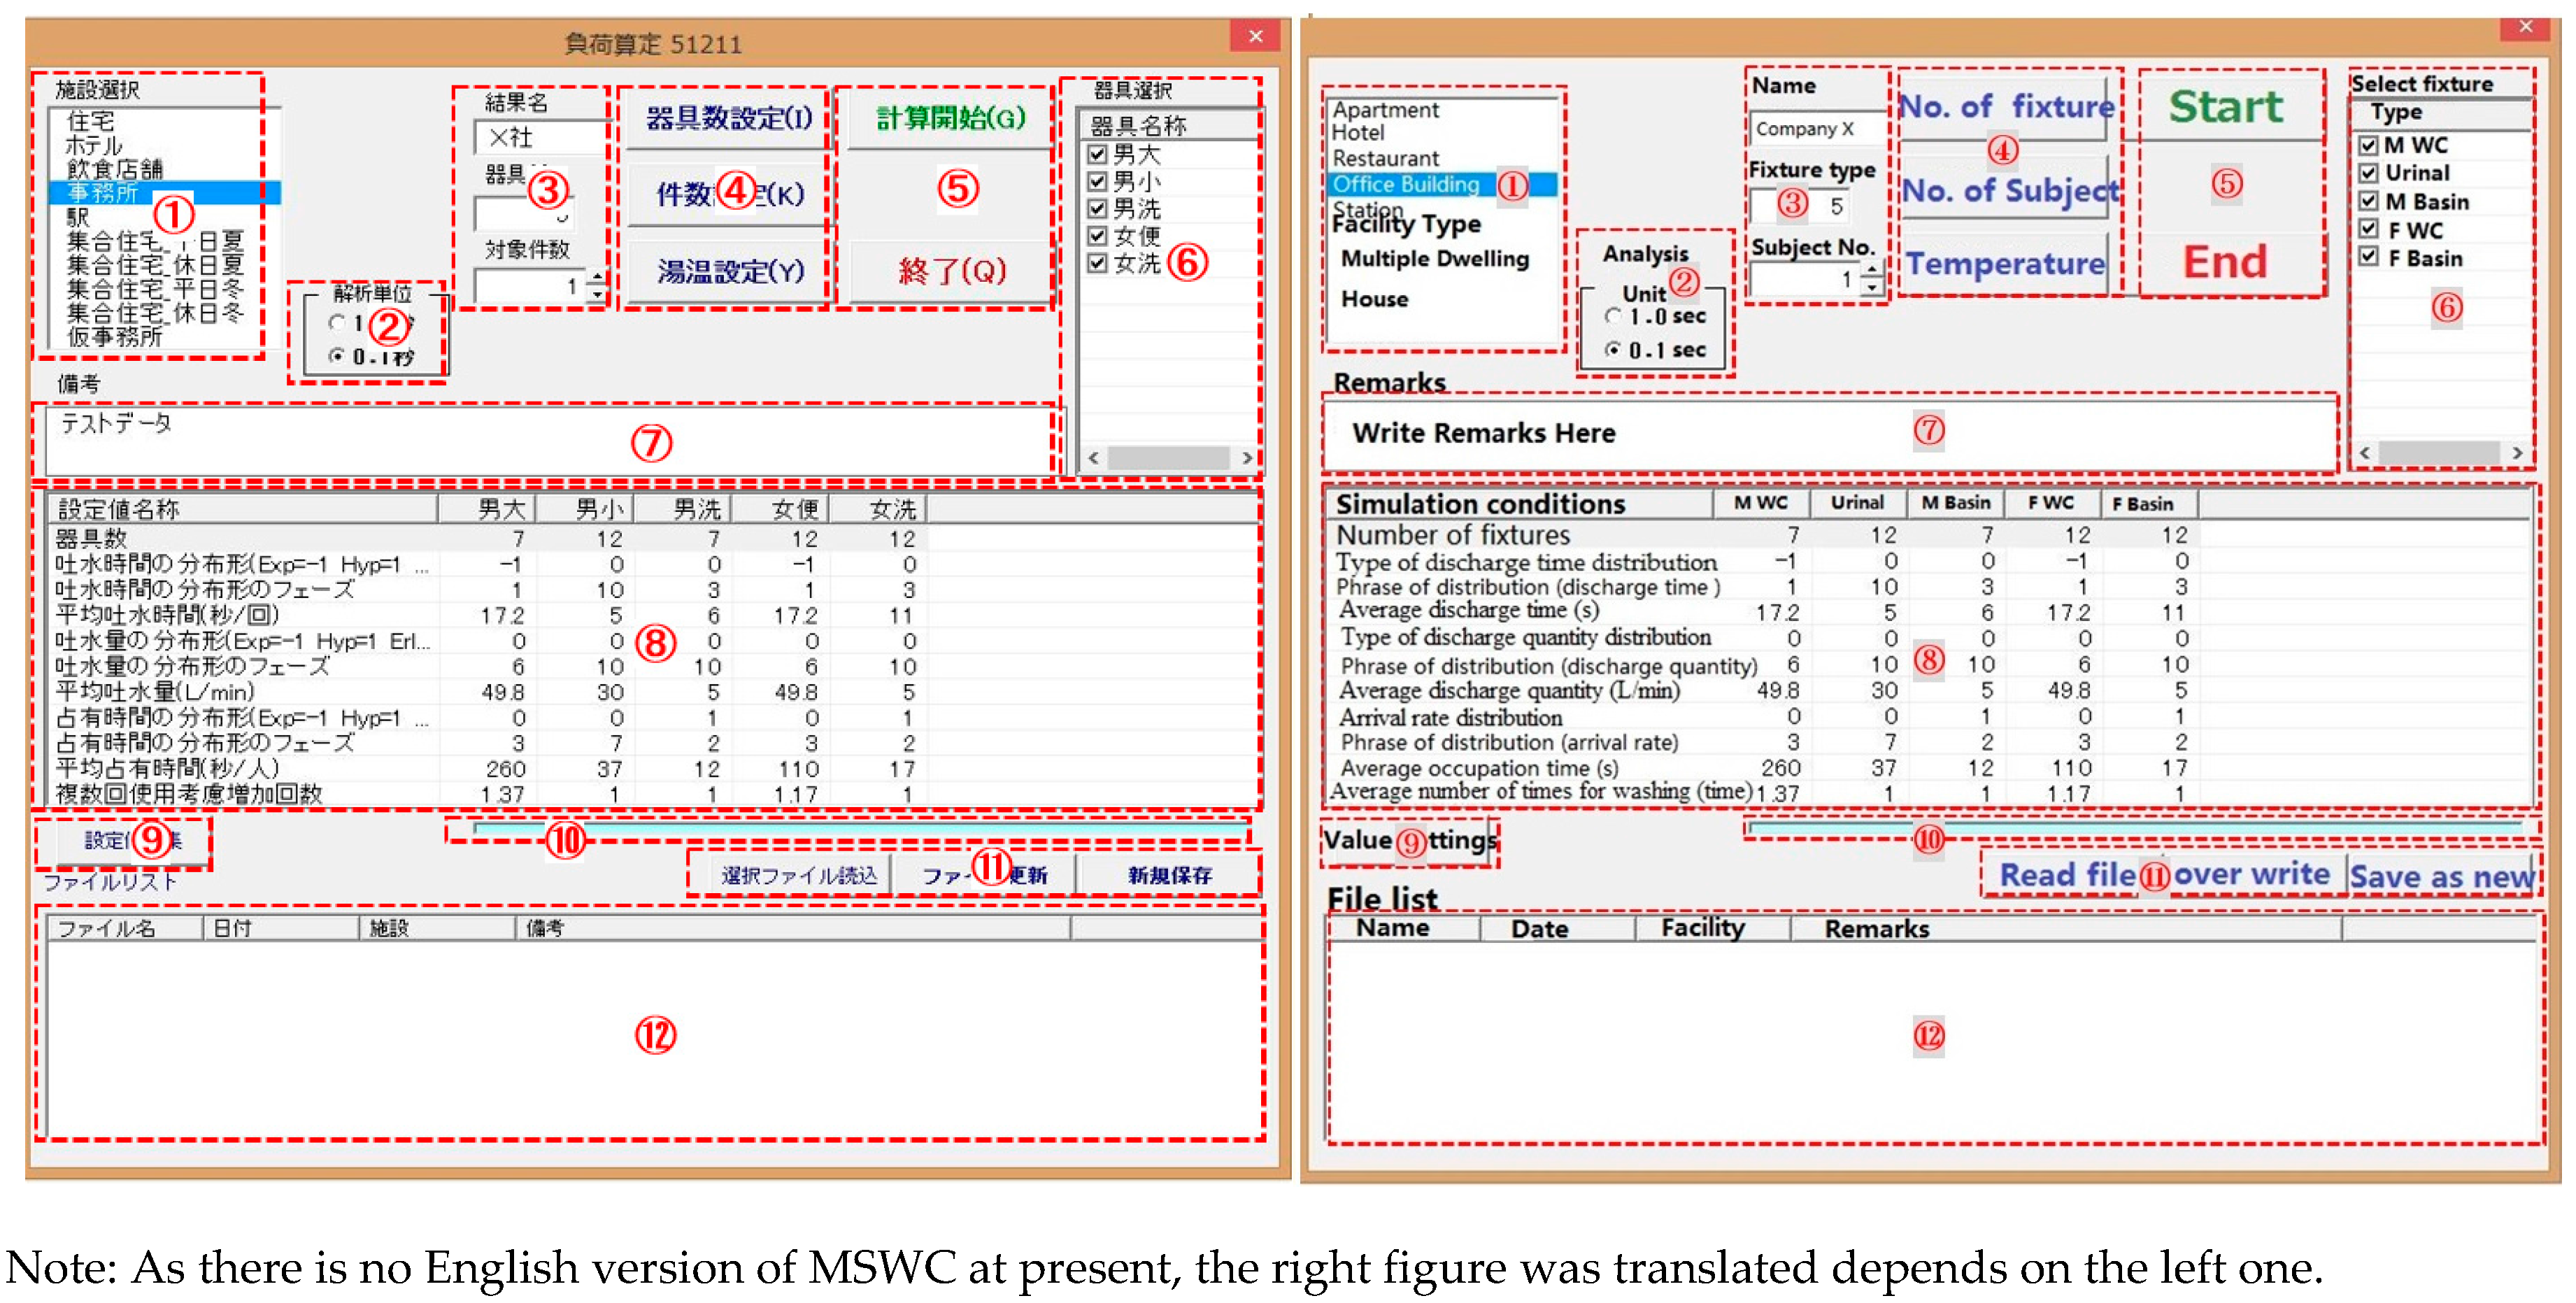
Figure 11.
Water supply system diagram.

Figure 12.
Results of the number of occupants.

Figure 13.
Comparison of Qday obtained by each method.
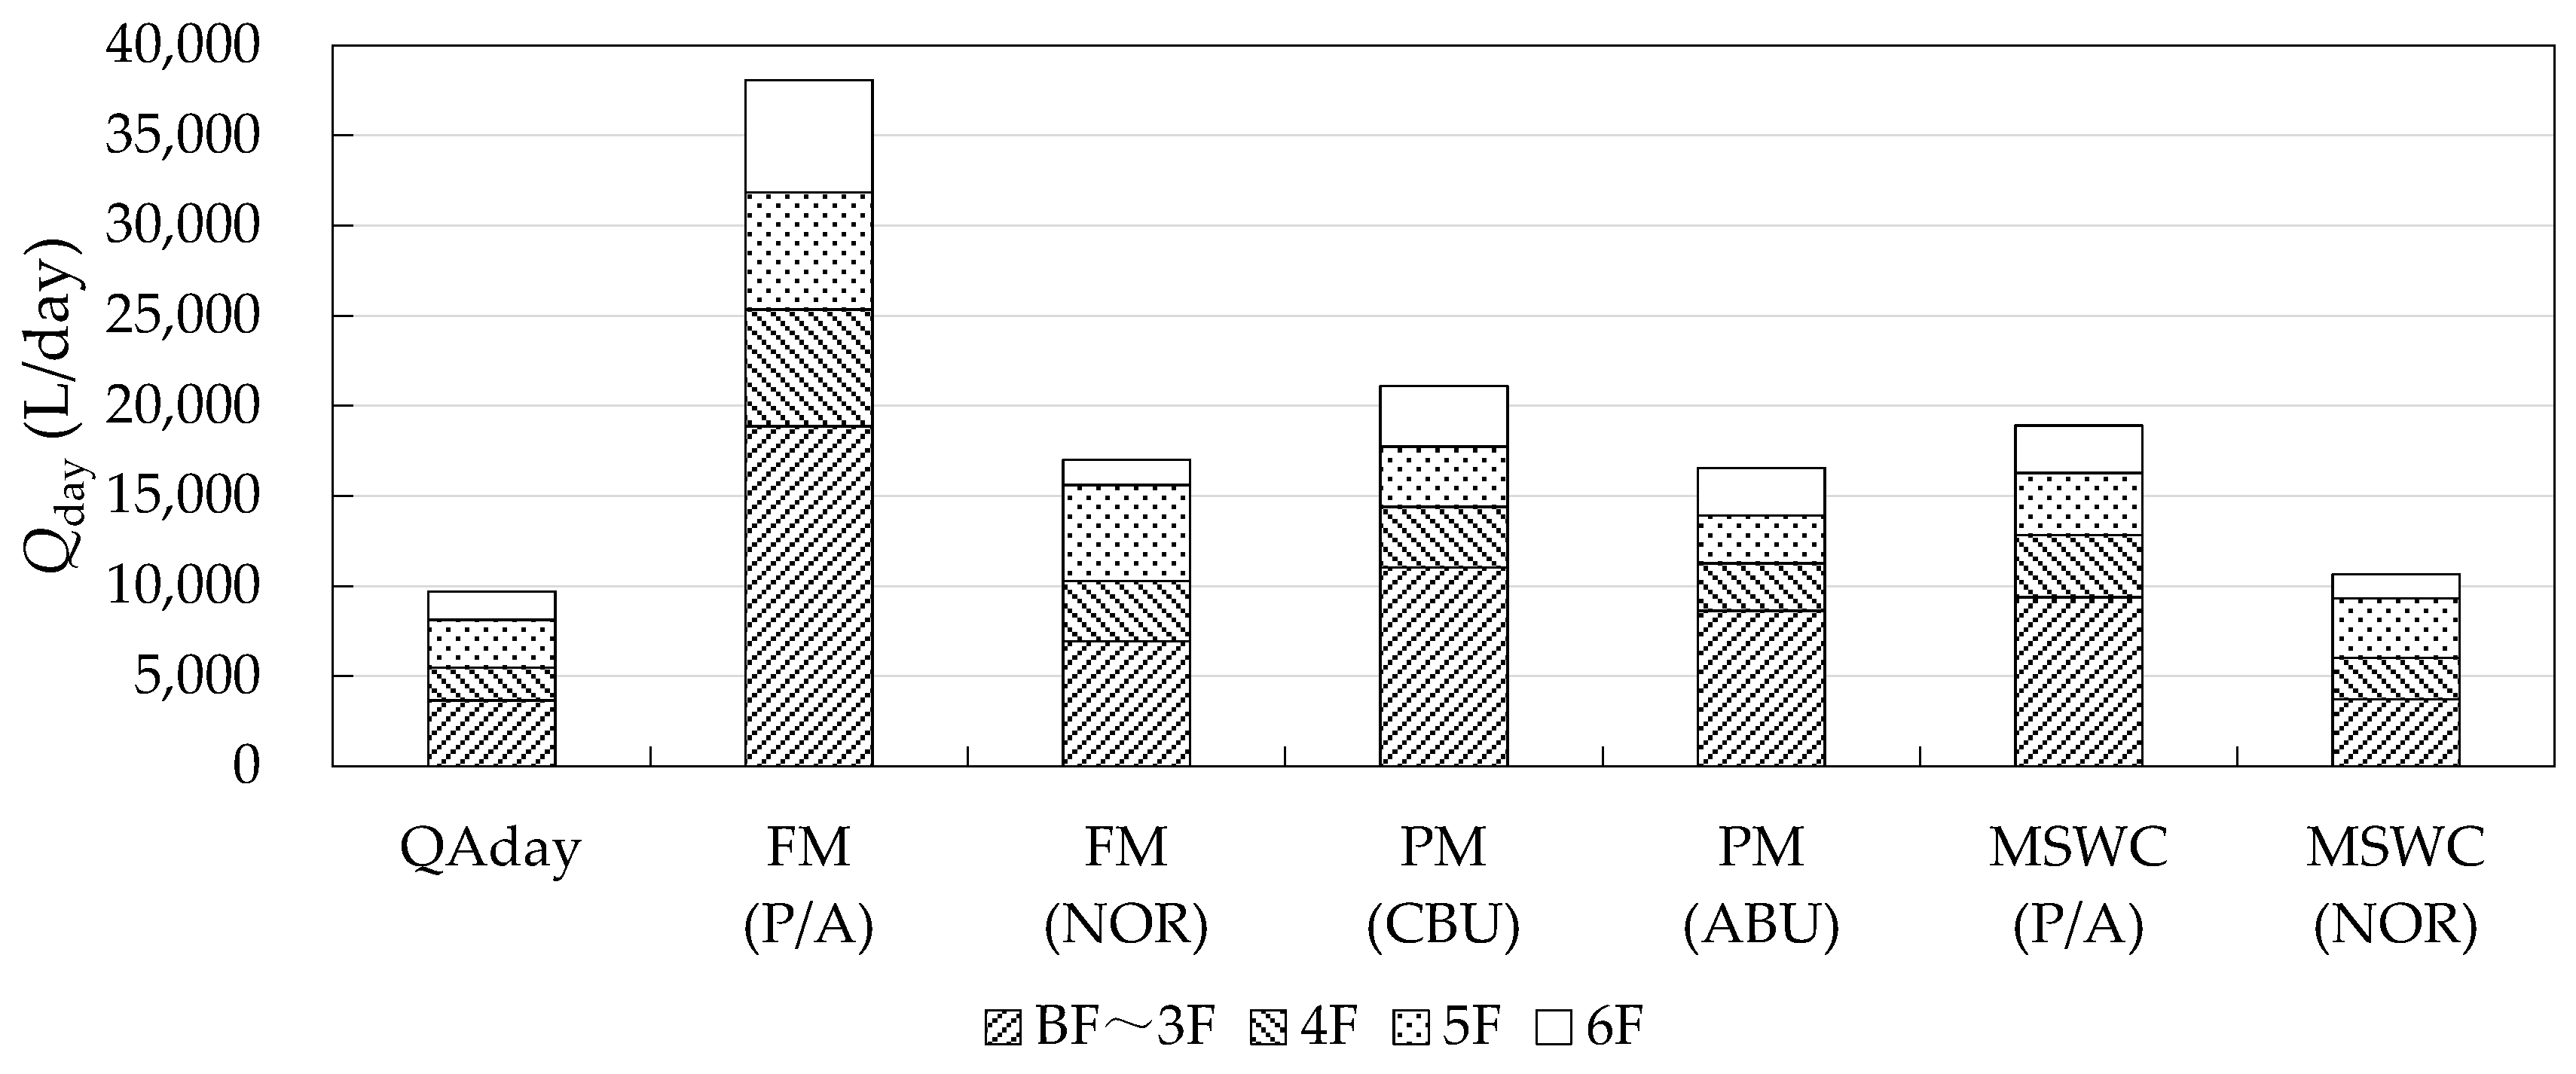
Figure 14.
Ratio of Qday to actual measurements.
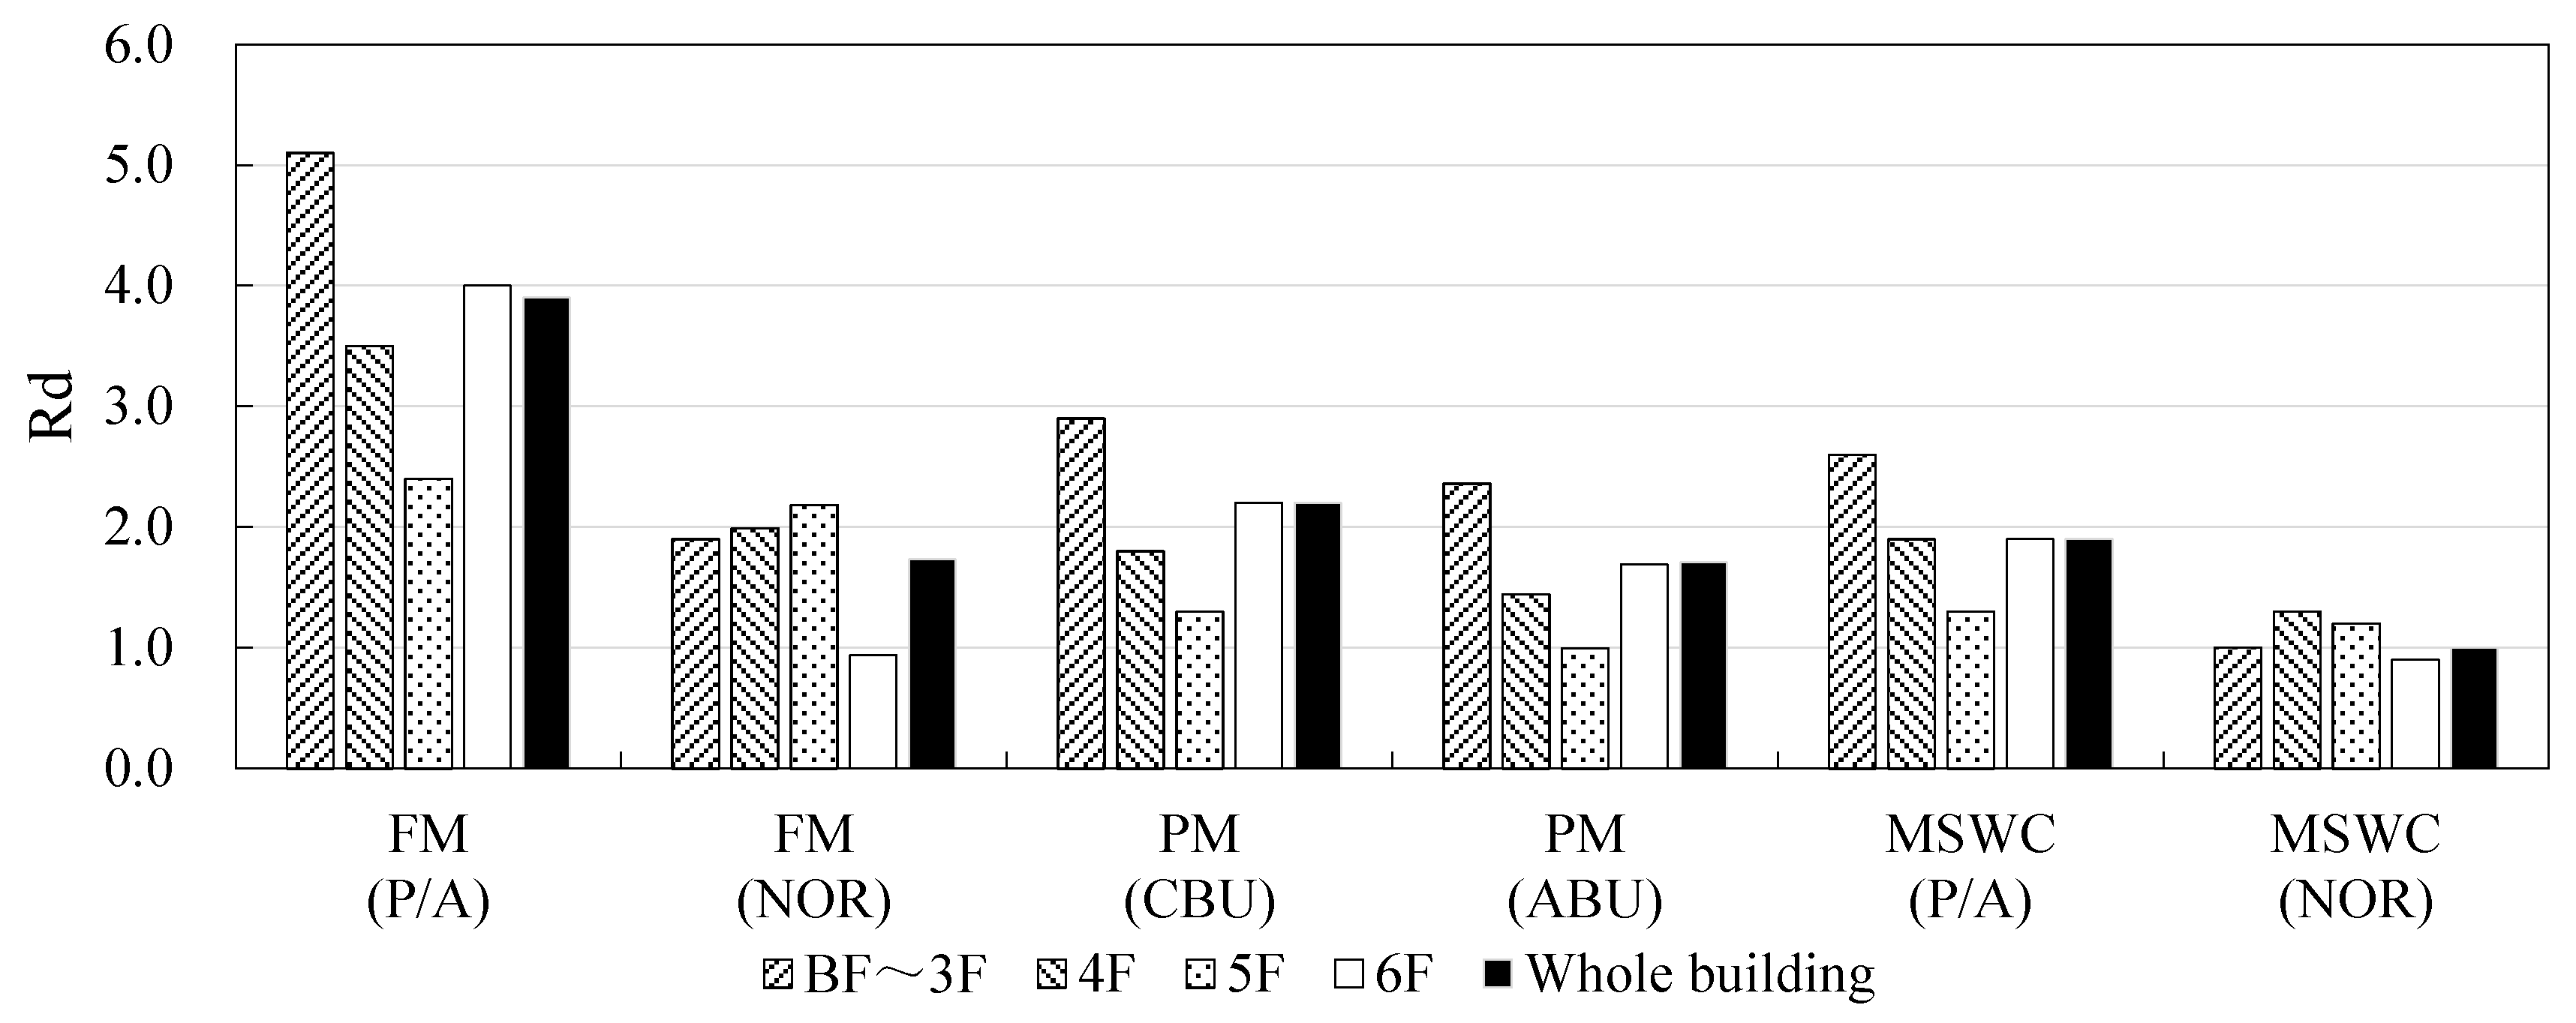
Figure 15.
Comparison of Qmax obtained by each method.

Figure 16.
Ratio of Qmax to actual measurements.

Table 1.
Conventional water load calculation method.
| Calculation Method | Abbr. | Possible Calculated Water Supply Demand | |
|---|---|---|---|
| Facilities design criteria of MLIT [1] | Calculation method based on personnel | PM | Qday |
| Calculation method based on sanitary fixture | FM | Qmax | |
| SHASE-S 206 [2] | Calculation method based on Water use time rate and Fixture unit for water supply | WFM | Qmax |
| Method based on newer water supply demand unit | NWM | ||
| prediction of fixture usage | PFM | ||
| Method based on water supply load unit of fixture | SLM | ||
Table 2.
Volume and time of water consumption per person based on intended use of building.
| Intended Use | User Type | Calculation Base for A User *1 | Daily Water Consumption Per Person (L/d·Person) | Average Daily Consumption Time (h) | Remarks |
| Office | Worker | 0.1–0.2 person/m2 (Depending of office space) *2 | 80–100 | 8 | Water consumption in workers‘ cafeteria is calculated separately. 20–30 L/(person·meal) |
Notes: *1 When the actual number is given, that number is used. However, a future increase is to be projected; *2 The office includes a president’s office, secretarial office, directors’ office, conference room and reception room. Remarks: (1) except as otherwise noted in the remarks section, make-up water in the cooling tower and water consumption in workers’ cafeteria are added separately; (2) if caretaker or other maintenance staff is permanently stationed, water consumption by him or her is added separately. For calculation of the water consumption by him or her, values for apartment houses are applied.
Table 3.
Volume and time of water consumption per person based on intended use of building.
| Fixture | Faucet | Flow Rate of Each Plumbing Fixture and Faucet | Remarks | Water Supply Load Unit of Fixture * | |||
|---|---|---|---|---|---|---|---|
| Water Consumption Per Use q (L) | Usage Frequency Per Hour (Frequency) | Peak Flow Rate qp (L/min) | Public Use | Private Use | |||
| Western style toilet | Flush valve | 10–10.5 | 6–12 | 80–150 | 70 | 10 | 6 |
| Flushing water tank | 8–10.5 | 6–12 | 10 | - | 5 | 3 | |
| Urinal | - | 2–4 | 12–20 | 20–25 | 70 | 5 | - |
| Basin | - | 10 | 6–12 | 10 | - | 2 | 1 |
Note: * when any hot water faucet is combined, the water supply load unit of fixture for one faucet is calculated as three quarters of the value indicated in this table.
Table 4.
Classification of calculation method of peak flow rate of water supply.
| Method | Application | Characteristics in Use | Concept and Flow of Calculation | Source |
| Method 1: Calculation method based on water use time rate and fixture unit for water supply | Applicable for various purposes | [Advantages] - Data has been accumulated over many years in this calculation method, which has been, as the result, used for a long time. - Architects can have many options for their judgement and can calculate pipe diameters based on actual situation. - Fixed options are established for the case where a number of users is not sufficient for a number of fixtures. [Disadvantages] - The calculation method requires complex calculation. - Many provision values are used for calculation of water use time rate η. - When combining a different type of fixtures, it is required to consider to halve the addition coefficient. - Adjustment data can be used only for closet bowls, urinals and basins, and adjustment methods for other fixtures are unclear. | (1) Reduction in number of installed fixtures → Maximum number of fixtures used simultaneously Theoretical formula: (2) Maximum number of fixtures used simultaneously and water supply unit of each fixture → peak flow rate of water supply (water consumption in simultaneous fixture use) Theoretical formula: * Standard water pressure:100 kPa, aperture: 90°–120° (3) Adjustment in number of fixtures (in case of random use) In case where fixtures are installed horizontally in 2 or more places or vertically on 2 or more floors (4) Combination of different types of fixtures Peak flow rate of fixtures + 1/2 of total flow rate of others * Simple projection (Random use and concentrated use) | Approximation by Mitsumasa Okada
Water use time = 0.5 (provisional) [19]. Table of water supply unit of fixture (Table 5). Saburo Murakawa: 10-h average Poisson distribution on assumption of use in an office with reject rate: 0.001 [20] |
| Method 2: Method based on newer water supply demand unit | Applicable only for houses, multi-family housings and offices | [Advantages] - Data has been accumulated over many years in this calculation method, which has been, as the result, used for a long time. - Calculation is simple and easy. [Disadvantages] - Applicable only for houses, multi-family housings and offices - If a house or office is also used for other application, calculation cannot be made. - If a flush valve and flushing water tank coexist, calculation cannot be made. | (1) Distribution of frequency of simultaneous water consumption: closely related to Poisson distribution or binomial distribution
(2) Calculation of newer water supply demand unit by using a basin (house) as a base (3) Newer water supply demand unit → Peak flow rate of water supply (by using diagram) (Whether or not there is a flush valve in a house or office is selected.) | Table of newer water supply demand unit (Table 8) [21,22] |
| Method 3: Calculation method based on fixture usage | Applicable at architect’s own discretion, when a small number of fixtures are used or when regularity exists in use of fixtures or water consumption | [Advantages] - Calculation is simple and easy. - For example, this method is applicable for and effective in the following cases: (1) There are some parts that are used in different time zones in a building, such as a laboratory, room for a cooking class, and students’ toilets in a school. (2) There is a place where time of use is concentrated, such as a shower room in a school. [Disadvantages] - Applicable only when only a small number of fixtures is used. | (1) Number of fixtures (closet bowls) (flush valve) (general fixtures) → Rate of simultaneous use of fixture
(2) Rate of simultaneous use of the fixture x Peak flow rate of water supply of each fixture → Peak flow rate of water supply | Quantity consumption and peak flow rate of water supply of each plumbing fixture and faucet (Table 10) |
| Method 4: method based on water supply load unit of fixture | Applicable for various purposes | [Advantages] - Calculation is simple and easy. Therefore, this method is effective for calculation of the place where time of use is concentrated. [Disadvantages] - If water supply load unit of fixture is 10 or fewer (too few fixtures) or 3000 or more (too many fixtures), calculation cannot be made (any diagram cannot be prepared). - If a flush valve and flushing water tank coexist, the method calculation is unclear. - Any consideration is not made to a decrease in the calculation result in the case where the ratio of users to the number of fixtures is low. - Its safety factor is too high. | (1) Sum of water supply load unit of fixture of each fixture (public use/private use)
(2) Sum of water supply load unit of fixture → Peak flow rate of water supply | Hunter (US)
Table of water supply unit of fixture Diagram of the water supply load unit of fixture and peak flow rate of water supply (Hunter Curve) [23] |
Table 5.
Fixture unit for water supply and standard value of water use time η.
| Fixture | Water Supply System | Connection Diameter (A) | Fixture Unit for Water Supply | Drain Cock Unit for Water Supply | Water Use Time η |
|---|---|---|---|---|---|
| Closet bowl | Siphon-type flush valve/male | 25 | 9 | - | 0.03 (10/300) |
| Siphon-type with flush valve/female | 25 | 9 | - | 0.15 (15/100) with sound imitating device: 0.1 (10/100) | |
| Washing-type flush valve/male | 25 | 6 | - | 0.03 (10/300) | |
| Washing-type flush valve/female | 25 | 6 | - | 0.15 (15/100) with sound imitating device: 0.1 (10/100) | |
| Flushing water tank/male | 13 | 1 | - | 0.15 (15/100) | |
| Flushing water tank/female | 13 | 1 | - | 0.5 (50/100) | |
| Tank-less type/male/6 L | 13 | 1.4 | - | 0.08 (22/300) | |
| Tank-less type/female/6 L | 13 | 1.4 | - | 0.33 (33/100) with sound imitating device: 0.22 (22/100) | |
| Tank-less type/male/8 L | 13 | 1.4 | - | 0.09 (27/300) | |
| Tank-less type/female/8 L | 13 | 1.4 | - | 0.41 (41/100) with sound imitating device: 0.27 (27/100) | |
| Urinal | Flush valve | 13 | 2 | - | 0.3 (13/40) |
| Flushing water tank | 13 | 0.5 | - | 1.0 (continuous flow) | |
| Basin | Lavatory faucet for water saving washing | 13 | 1 | 0.5 | 0.5 |
| Mixed use for water pouring washing | 13 | 1 | 0.5 | 0.5 | |
| Automatic faucet with continuous flow valve | 13 | 0.2 | - | 0.5 | |
| Automatic faucet without continuous flow valve | 13 | 0.5 | - | 0.5 |
Note: The flow rate for water saving washing consuming 14 L per hour in a basin with standard water pressure 100 kPa was used as the standard flow rate, and this standard flow rate was specified as one fixture unit for water supply.
Table 6.
Number of fixtures and usage rate.
| No. of Fixtures c | 1 | 2 | 3 | 4 | 5 | 7 | 10 | 15 | 20 | 50 | 100 |
|---|---|---|---|---|---|---|---|---|---|---|---|
| Usage rate ρ | 0.01 | 0.07 | 0.13 | 0.20 | 0.26 | 0.33 | 0.42 | 0.50 | 0.55 | 0.65 | 0.70 |
| Approximation of usage rate (reference) ρ = 0.1684Ln(c) − 0.0087 | 0 (a) | 0.108 | 0.176 | 0.225 | 0.262 | 0.319 | 0.379 | 0.447 | 0.496 | 0.65 | 0.767 |
Note: (a) where c = 1 in the usage rate approximation ρ = 0.1684ln(c) − 0.0087, the actual calculated figure is −0.01, but is replaced with 0 in this research.
Table 7.
Number of fixtures and usage rate.
| k | 0.1 | 0.05 | 0.02 | 0.01 | 0.005 | 0.002 | 0.001 | 0.0001 |
|---|---|---|---|---|---|---|---|---|
| b | 1.28 | 1.64 | 2.05 | 2.33 | 2.58 | 2.88 | 3.09 | 4.26 |
| Δ | 0.6 | 0.8 | 0.9 | 1.0 | 1.11 | 1.3 | 1.4 | 1.7 |
Table 8.
Newer Water Supply Demand Unit of an Office Building.
| Sex | Fixture | Newer Water Supply Demand Unit | Remarks |
|---|---|---|---|
| Male | Closet bowl | 5 | Flush valve type |
| Closet bowl | 3.5 | Tank type | |
| Urinal | 3 | Flush valve type (including automatic flush valve with sensor) | |
| Basin | 1.5 | - | |
| Female | Lavatory pan | 8 | Flush valve type |
| Lavatory pan | 5 | Tank type | |
| Basin | 1.5 | - |
Table 9.
Number of fixtures and usage rate.
| No. of Fixtures c | 1 | 2 | 4 | 8 | 12 | 16 | 24 | 32 | 40 | 50 | 70 |
|---|---|---|---|---|---|---|---|---|---|---|---|
| Closet Bowl (Flush Valve) | 100 | 50 | 50 | 40 | 30 | 27 | 23 | 19 | 17 | 15 | 12 |
| General Fixture | 100 | 100 | 70 | 55 | 48 | 45 | 42 | 40 | 39 | 38 | 35 |
Table 10.
Usage rate and Qmax of each plumbing fixture and faucet.
| Fixture | Quantity Consumption Per Use (L) | Peak Flow Rate of Water Supply (L/min) | Remarks |
|---|---|---|---|
| Closet bowl with flush valve | 6–13 | 105 | It is assumed that users wash the fixture once per use. In public toilets, males wash the fixture about 1.5 times per use, and fames wash it about 2.0 times per use. |
| Closet bowl coupled with low tank | 6–10 | 10 | |
| Closet bowl with low tank on the flat wall | 8–11 | 10 | |
| Closet bowl with low tank on corner | 8–11 | 10 | |
| Closet bowl integrated with low tank (single unit type) | 16 | 10 | |
| Closet bowl without tank | 6–8 | 20 | |
| Closet bowl without tank (small tank included) | 5–5.5 | 10–13 | |
| Urinal with flush valve | 4–6 | 30 | The required flow rate for a plunge bath is calculated based on the time spent to fill the bath tab with water. |
| Urinal with automatic Flushing water tank | 4–6 | 8–13 | |
| Basin | 10 | 10 |
Table 11.
Water supply load unit of fixture [23].
Table 11.
Water supply load unit of fixture [23].
| Fixture | Faucet | Water Supply Load Unit of Fixture | |
|---|---|---|---|
| Public Use | Private Use | ||
| Closet bowls | Flush valve | 10 | 6 |
| Closet bowls | Flushing water tank | 5 | 3 |
| Urinal | Flush valve | 5 | - |
| Urinal | Flushing water tank | 3 | - |
| Basin | Faucet | 2 | 1 |
Table 12.
Simulation conditions.
| Simulation Model | Male | Female | ||||
|---|---|---|---|---|---|---|
| Closet Bowl | Urinal | Basin | Lavatory Pan | Basin | ||
| Arrival-to-fixture model Fixture occupation time model | Arrival rate by time (person/min) | To be set by fixture and time zone | ||||
| Arrival rate distribution | Poisson distribution | |||||
| No. of fixtures to be set (unit) | To be set based on the subject building | |||||
| Average occupation time (s) | 260 | 37 | 12 | 110 | 17 | |
| Discharge quantity model | Type of occupation time distribution | Erl.3 | Erl.7 | Hyp.2 | Erl.3 | Hyp2 |
| Average discharge time (s) | 17.2 | 5 | 6 | 17.2 | 11 | |
| Fixture operation model | Type of discharge time distribution | Exp. | Exp.10 | Erl.3 | Exp. | Erl.3 |
| Average discharge quantity (L/min) | 49.8 | 30 | 5 | 49.8 | 5 | |
| Type of discharge quantity distribution | Erl.6 | Erl.10 | Erl.10 | Erl.6 | Erl.10 | |
| Average number of times for washing (time) | 1.37 | 1 | 1 | 1.17 | 1 | |
| Subject number (No. of users, tenants and rooms) | To be entered based on the subject building | |||||
Table 13.
Qday and Qmax on each floor.
| Period | Classification | Whole Building | 6F | 5F | 4F | B1F~3F |
|---|---|---|---|---|---|---|
| 8/5 (Wed.) | Qday (L/day) | 9361 | 1434 | 2357 | 2017 | 3552 |
| Qmax (L/min) | 86.7 | 28.6 | 66.2 | 85.3 | 69.5 | |
| 8/6 (Thu.) | Qday (L/day) | 9701 | 1558 | 2649 | 1827 | 3667 |
| Qmax (L/min) | 79.0 | 45.4 | 73.3 | 52.9 | 70.7 | |
| 11/12 (Thu.) | Qday (L/day) | 9493 | 1574 | 2438 | 2182 | 3298 |
| Qmax (L/min) | 67.1 | 38.1 | 58.4 | 53.7 | 67.1 | |
| Ave. | Qday (L/day) | 9518 | 1522 | 2481 | 2009 | 3506 |
| Qmax (L/min) | 77.6 | 37.4 | 66.0 | 64.0 | 69.1 |
Table 14.
The number of occupants registered for T-building.
| Floor | Tenants | Aug. | Nov. | ||
|---|---|---|---|---|---|
| Male | Female | Male | Female | ||
| 6F | Office | 20 | 6 | 22 | 4 |
| 5F | 53 | 19 | 55 | 19 | |
| 4F | 38 | 14 | 36 | 14 | |
| 3F | 53 | 10 | 51 | 12 | |
| 1–2F | Law office Medical office | 17 | 7 | 17 | 7 |
| Entirety | - | 181 | 56 | 181 | 56 |
Table 15.
The maximum numbers of occupants.
| Period | Questionnaire | Security Camera | ||
|---|---|---|---|---|
| Male | Female | Male | Female | |
| 8/5 (Wed.) | 136 | 52 | - | - |
| 8/6 (Thu.) | 142 | 52 | - | - |
| 8/7 (Fri.) | 134 | 53 | - | - |
| Aug. (Ave.) | 137 | 52 | - | - |
| 11/11 (Wed.) | 112 | 52 | 111 | 61 |
| 11/12 (Thu.) | 97 | 51 | 105 | 68 |
| 11/13 (Fri.) | 103 | 50 | 96 | 66 |
| Nov. (Ave.) | 104 | 51 | 104 | 65 |
Table 16.
Average flush time and average flush volume.
| Count | Water Supply Discharge Time (s) | Water Supply Discharge (L) | Average Water Supply Discharge Volume (L/min) |
|---|---|---|---|
| 1st | 17 | 13.8 | 48.5 |
| 2nd | 20 | 14.1 | 42.4 |
| 3rd | 16 | 14.4 | 54.0 |
| 4th | 15 | 14.4 | 57.5 |
| 5th | 18 | 14.0 | 46.7 |
| Ave. | 17.2 | 14.1 | 49.8 |
Table 17.
Qday and Qmax obtained from calculations.
| Water Consumption | MLIT | SHASE-S206 | |||||||
|---|---|---|---|---|---|---|---|---|---|
| PM | FM | WFM | NWM | PFM | SLM | ||||
| P/A | NOR | CBU | ABU | ||||||
| Whole building | Qday (L/day) | 38,080 | 16,800 | 21,120 | 16,554 | - | - | - | - |
| Qmax (L/min) | 238 | 105 | 220 | 172 | 474 | 390 | 1094 | 370 | |
| B1F~3F | Qday (L/day) | 18,880 | 6960 | 11,040 | 8650 | - | - | - | - |
| Qmax (L/min) | 118 | 43.6 | 103 | 90.0 | 280 | 290 | 702 | 380 | |
| 4F | Qday (L/day) | 6480 | 3331 | 3360 | 2635 | - | - | - | - |
| Qmax (L/min) | 41 | 20.8 | 35 | 27.4 | 175 | 210 | 355 | 257 | |
| 5F | Qday (L/day) | 6480 | 5330 | 3360 | 2635 | - | - | - | - |
| Qmax (L/min) | 41 | 33.3 | 35 | 27.4 | 175 | 210 | 355 | 257 | |
| 6F | Qday (L/day) | 6240 | 1396 | 3360 | 2635 | - | - | - | - |
| Qmax (L/min) | 39 | 8.7 | 35 | 27.4 | 175 | 210 | 355 | 267 | |
Table 18.
Simulation conditions in T-building.
| Fixture | Men’s WC | Men’s Urinal | Men’s Wash Basin | Women’s WC | Women’s Wash Basin |
|---|---|---|---|---|---|
| No. of Fixture | To be Set Based on the Subject Building | ||||
| Distribution diagram phase of average water supply discharge time | 1 | 10 | 3 | 1 | 3 |
| Average water supply discharge time (s/use) | 17.2 | 5 | 6 | 17.2 | 11 |
| Distribution form phase of average water supply discharge volume | 6 | 10 | 10 | 6 | 10 |
| Average water supply discharge volume (L/min) | 49.8 | 30 | 5 | 49.8 | 5 |
| Distribution form phase of occupancy time | 3 | 7 | 2 | 3 | 2 |
| Average occupancy time (s/person) | 260 | 37 | 12 | 110 | 17 |
| Increase of usage with multiple use taken into account | 1.37 | 1 | 1 | 1.17 | 1 |
| No. of People, House, Room | To be Set Based on the Subject Building | ||||
| Fixture usage rate (Ratio of water to hot water) | 1 | 1 | 1 | 1 | 1 |
Table 19.
Results of simulations in MSWC.
| Water Consumption | P/A | NOR | |
|---|---|---|---|
| Whole building | Qday (L/day) | 18,382 | 9669 |
| Qmax (L/min) | 122.3 | 100.3 | |
| B1F~3F | Qday (L/day) | 9402 | 3740 |
| Qmax (L/min) | 104.5 | 72.9 | |
| 4F | Qday (L/day) | 3436 | 2298 |
| Qmax (L/min) | 68.4 | 65.0 | |
| 5F | Qday (L/day) | 3450 | 3299 |
| Qmax (L/min) | 68.8 | 70.8 | |
| 6F | Qday (L/day) | 3001 | 1336 |
| Qmax (L/min) | 68.5 | 48.1 | |
© 2017 by the authors. Licensee MDPI, Basel, Switzerland. This article is an open access article distributed under the terms and conditions of the Creative Commons Attribution (CC BY) license (http://creativecommons.org/licenses/by/4.0/).
Share and Cite
MDPI and ACS Style
Wu, G.-Z.; Sakaue, K.; Murakawa, S. Verification of Calculation Method Using Monte Carlo Method for Water Supply Demands of Office Building. Water 2017, 9, 376. https://doi.org/10.3390/w9060376
AMA Style
Wu G-Z, Sakaue K, Murakawa S. Verification of Calculation Method Using Monte Carlo Method for Water Supply Demands of Office Building. Water. 2017; 9(6):376. https://doi.org/10.3390/w9060376
Chicago/Turabian StyleWu, Guang-Zheng, Kyosuke Sakaue, and Saburo Murakawa. 2017. "Verification of Calculation Method Using Monte Carlo Method for Water Supply Demands of Office Building" Water 9, no. 6: 376. https://doi.org/10.3390/w9060376
Note that from the first issue of 2016, this journal uses article numbers instead of page numbers. See further details here.