Article

Sources and Dynamics of Dissolved Inorganic Carbon, Nitrogen, and Phosphorus in a Large Agricultural River Basin in Arid Northwestern China

1
Institute of Water Sciences, College of Engineering, Peking University, Beijing 100871, China
2
Department of Geological Sciences, University of Alabama, 201 7th Ave., Tuscaloosa, AL 35487, USA
3
School of Environmental Science and Engineering, South University of Science and Technology of China, Shenzhen 518055, China
*
Author to whom correspondence should be addressed.
Water 2017, 9(6), 415; https://doi.org/10.3390/w9060415
Submission received: 9 March 2017 / Revised: 5 June 2017 / Accepted: 5 June 2017 / Published: 9 June 2017
(This article belongs to the Special Issue Sustainable Water Management within Inland River Watershed)

Abstract

:
The present study assessed the export of inorganic carbon, nitrogen, and phosphorus within a large agricultural basin in arid northwestern China. Groundwater of various depths and river water along a 160 km reach were sampled during contrasting flow conditions. Dissolved inorganic carbon (DIC) concentrations and δ13C-DIC values indicate that lithogenic carbonate weathering was the main source of DIC in the basin. Discharge played an important role in regulating the amount and flowpath of nutrients mobilized from soils to the river. Ammonium was mobilized mostly by storm flows whereas the other nutrients were exported through both storm and groundwater flows. Hydrological events, occurring on only about 10% of the days for a year, were responsible for more than 40% of annual nutrient exports. Shallow groundwater was an important source of DIC and nitrate in river water within the alluvial plain, where groundwater discharges regulated their longitudinal variability along the river. According to a mixing model using δ13C-DIC and chloride, groundwater comprised 9–34% and 39–60% of river water at high discharge and baseflow, respectively. Together, our data highlight the importance of reducing storm runoffs and monitoring nutrient pollution within this large basin.

1. Introduction

Understanding the timing, magnitude, and pathway of C, N, and P nutrients exported from watersheds to receiving streams and rivers is essential for developing sustainable management practices in agricultural basins. Dissolved inorganic carbon (DIC) is the most abundant carbon pool in many inland waterways and aquifers, being actively incorporated into aquatic food webs and playing an important part in regulating carbon fluxes between terrestrial, aquatic, and atmospheric reservoirs [1,2]. Inorganic N and P are important regulators of water and ecosystem integrity, controlling biomass abundance and biological community structures of aquatic environments [3]. Establishing a thorough understanding of nutrient fluxes linking terrestrial and aquatic systems is particularly important in large arid basins, where scarce water resources require managers to balance the needs of agricultural use versus ecosystem conservation [2,4,5]. To date, most studies on this topic have been conducted in small, humid watersheds [2,6,7,8]. Fewer studies were performed in large agricultural basins where fertilizer use and irrigation have substantial impacts on watershed-scale nutrient dynamics [1,2,5,9]. Furthermore, hydrological regimes play a pivotal role in nutrient exports. Subsurface and return flows dominate storm runoff and move nutrients from deep soils in humid watersheds. By comparison, prolonged drought periods and flashy storm events tend to activate overland flows that transmit nutrients from shallow soils under arid climate conditions.
The objective of the present study is to assess watershed exports of dissolved inorganic nutrients in a large arid basin in relation to hydrological and agricultural drivers. Our study site is the Heihe River Basin (HRB), the second largest inland river basin in China situated in the arid northwestern region. Despite water scarcity, the middle HRB supports a population of over 2 million that heavily depends on irrigated agriculture. As such, irrigation practices including diverting water from the river and pumping groundwater from aquifers, have led to basin-wide alterations in hydrological processes [10,11]. However, few data are available on how these changes impact biogeochemical processes. To date, no studies have evaluated watershed exports of C, N, and P nutrients in this economically and environmentally important basin.
In the HRB, soil nutrients have increased over the past few decades due to intensive uses of agricultural fertilizers [12,13]. The complex hydrological processes in the basin, however, is another important factor mediating watershed-river nutrient connectivity. The precipitation is usually low (approximately 140 mm) and concentrated in two to three months per year [14]. In the middle basin, river water-groundwater interactions are prevalent, characterized by high longitudinal and seasonal variability [15,16,17,18]. Based on these characteristics, we hypothesize that: (1) nutrient exports occur in an episodic, flashy fashion driven by short-lived storm events that mobilize nutrients accumulating in topsoils; and (2) an important portion of nutrients derived from topsoils have been transported downward by irrigation flows and built up in shallow aquifers during prolonged drought periods. Our results offer insights into nutrient dynamics in many large agricultural basins in arid regions. These basins share similar hydrological characteristics (e.g., originating from mountain snowmelt and influenced by flashy, short-termed storms) and human interventions (e.g., irrigated agriculture), such as the Murray River Basin (Australia), the Colorado River Basin (USA), and the Carson River Basin (USA).

2. Materials and Methods
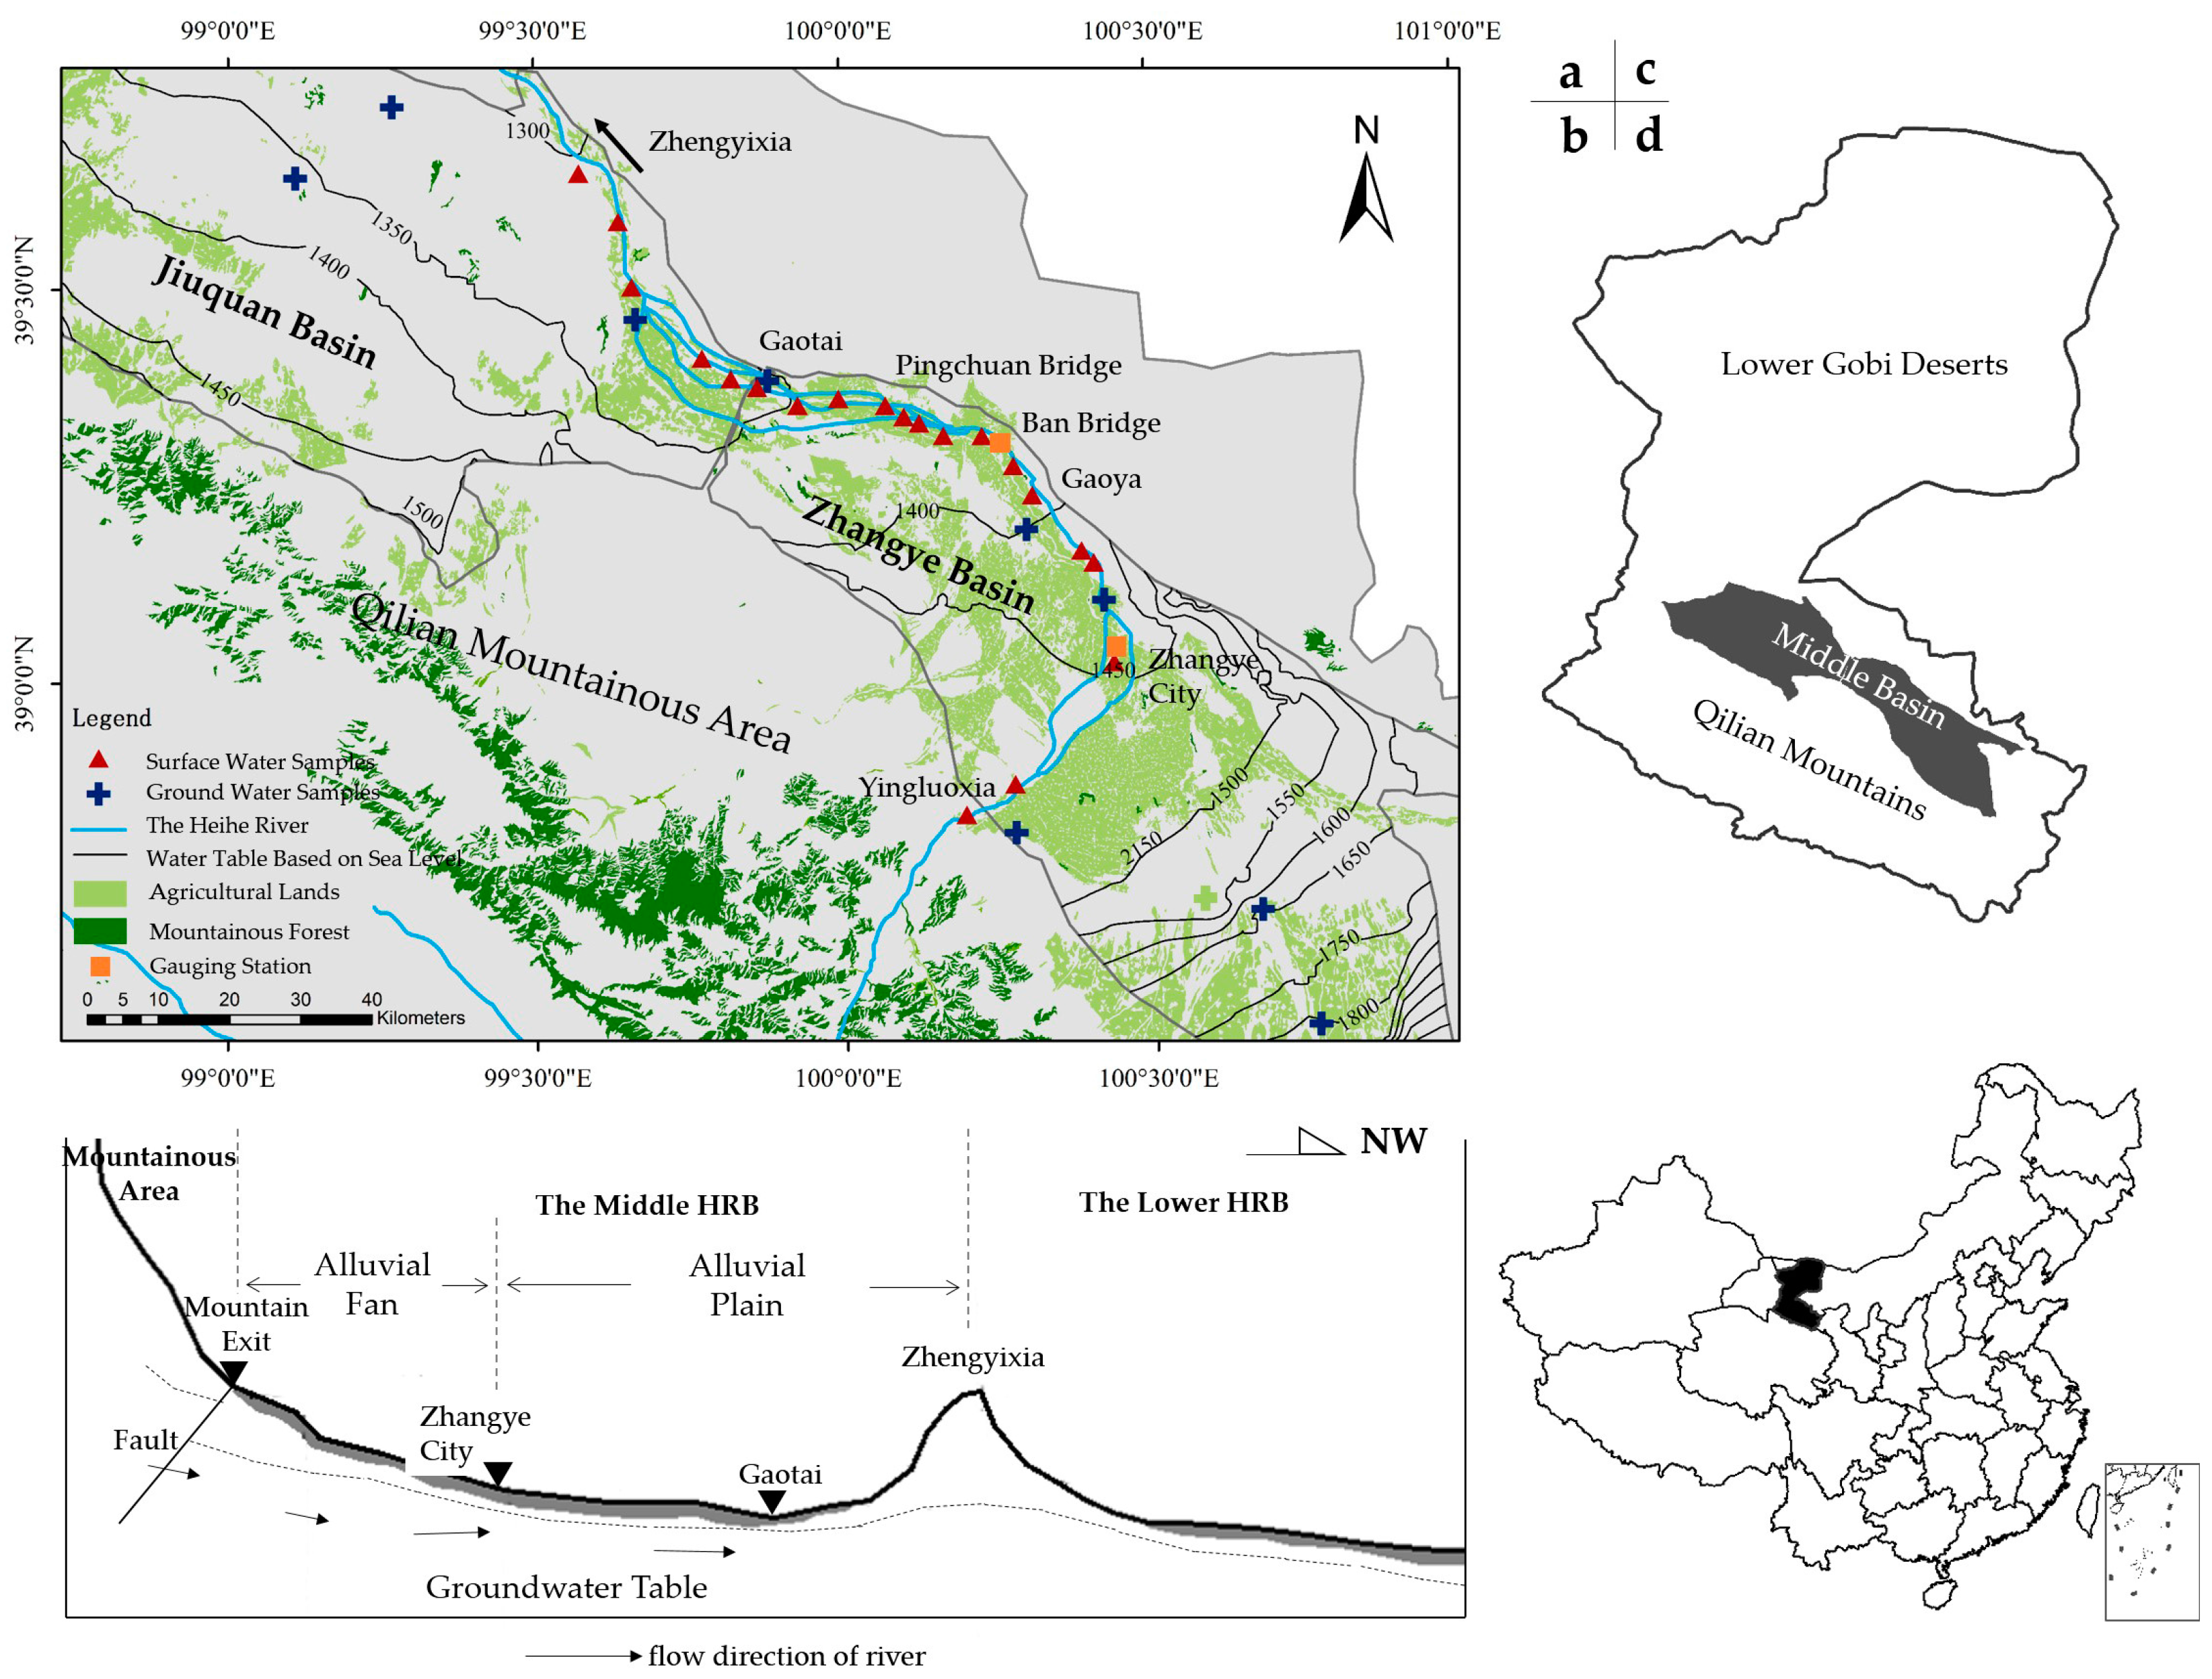
2.1. Study Sites

The Heihe River has a total length of more than 800 km with a total drainage area of 128,610 km2. It originates from the Qilian Mountains in the upper basin, flowing into the middle basin from Yingluoxia and the lower Gobi deserts from Zhengyixia (Figure 1). Picea crassifolia forests are prevalent below 3000 m in the Qilian Mountains. The middle river basin begins from the mountain exit at Yingluoxia (Figure 1a), comprising part of Hexi Corridor, and it is characterized by a landscape alternating primarily between Gobi-deserts and oases used for growing crops. The mean annual precipitation and evapotranspiration in the middle basin average approximately 140 mm and 2100 mm, respectively. Rainfall occurs mostly from June to August, accounting for 65% of annual precipitation [4]. The middle basin is underlain by Quaternary sediments. It includes the alluvial fan in the mountain front area (i.e., from the mountain exit Yingluoxia to the Zhangye City), varying between 1450 m and 1700 m in elevation, and the alluvial plain (i.e., from Gaoya and ends at Gaotai), varying from 1350 m to 1450 m (Figure 1b). The aquifer is a single, thick, coarse sandy gravel layer in the alluvial fan and gradually transforms to multiple layers composed of sandy gravels and clayey soils in the alluvial plain [18]. The groundwater table shows a dramatic shift in depths from more than 200 m below the surface at the mountain front (i.e., the starting point of the alluvial fan) to less than 20 m in the alluvial plain near the Zhangye City.

2.2. Sample Collection

We sampled at 20 stations along the main stem of the middle Heihe River for a total length of 160 km during high discharge (9–20 July 2013) and baseflow conditions (19–21 October 2013). River discharge data were continuously monitored at two gauging stations located at the Railway Bridge Station and the Ban Bridge Station, respectively (Figure 2) (see Figure 1a for the location of the gauging stations) [11]. Nine groundwater samples were collected in July from wells scattered in the middle basin (Figure 1a), with the sampling depths ranging between 20 m and 280 m. During sample collection, environmental parameters including water and air temperatures, pH, and conductivity were measured in situ using a portable water quality meter (multi 350i, WTW, Weilheim, Germany). In the field, samples were collected in duplicate and filtered through precombusted GF/F glass fiber filters (Whatman 142 mm diameter, 0.7 μm pore size) and placed on an aluminum filter holder (Geotech, Moscow, Russia). Between different sampling stations, filter devices were extensively washed using Milli-Q water. Samples for nutrient and anion measurements were stored frozen in the dark in 30 mL pre-cleaned high-density polyethylene (HDPE) bottles (soaked in 10% HCl solution for 24 h and thoroughly rinsed with Milli-Q water for nutrient bottles and soaked in Milli-Q water for 72 h for anion bottles). Samples for cation analysis were acidified with concentrated nitric acid to 2% by volume and stored at 4 °C in the dark in the same acid-washed HDPE bottles. For DIC concentration and carbon isotope (δ13C-DIC) analysis, water was stored in 15 mL airtight serum glass bottles (rinsed with Milli-Q water and combusted at 525 °C for 5 h) in the dark at room temperature prior to the analysis, which occurred within two weeks.

2.3. Sample Measurement and Data Analysis

DIC concentrations and δ13C-DIC: Samples were measured using a Gasbenchll interfaced to a Finnigan Delta V Advantage isotope ratio mass spectrometer (IRMS) using the Pee Dee Belemnite (PDB) standard at the Third Institute of Oceanography, State Oceanic Administration. All δ13C values are reported relative to PDB in standard notation as δ13C = [(Rsample/Rstandard) − 1] × 1000, where R is 13C/12C. The relative standard deviation (RSD) of DIC concentrations is within 0.8% while RSDs of δ13C-DIC are <0.5%.
Inorganic N and P nutrient concentrations: Nitrate + nitrite (NOx), ammonium, and orthophosphate were analyzed on a Kalar San + continuous flow autoanalyzer with wet chemistry modules and standard colorimetric techniques, following the US Environmental Protection Agency (EPA) test methods (method 353.2 for NO2 and NO3, 350.1 for NH4+, and 365.3 for orthophosphate). Sample runs used a five-point standard curve and were corrected for baseline drift. The SD for duplicate bottles was <56.6 μM for NOx (NO3 + NO2), <0.8 μM for ammonium, and <0.7 μM for orthophosphate.
Cation and anion concentrations: Cation concentrations including Ca2+ and Mg2+ were analyzed on an M410 flame photometer (Sherwood, UK). The concentrations of HCO3 and Cl were measured using the methods of alkalinity titration and potentiometric titration [19], respectively. The duplicate samples were run on a regular basis, yielding RSDs less than 3%.
Statistics analysis: Statistical analysis was conducted using SPSS 19.0 (Statistical Product and Service 19.0), and the level of significance, α, was set as 0.05. Because not all our data were normally distributed (Shapiro-Wilk tests, p = 0–0.99), non-parametric tests were employed. The Kendall’s coefficient of rank correlation test was performed to evaluate relations between different variables, and the Mann-Whitney U test (two-tailed) was used to compare values between different groups. The associated coefficient τ, p values, and df (degree of freedom) were reported.

3. Results

Dissolved inorganic carbon: In the Heihe River, the DIC concentrations fluctuated from 3.5 mM to 5.5 mM and the HCO3 concentrations ranged between 1.1 mM and 3.1 mM. The δ13C-DIC values of river water fell in the range between −6.5‰ and −1.8‰ (Figure 3). Relative to the river water, the shallow groundwater (<50 m) had higher DIC concentrations (15.5 ± 4.3 mM) and more depleted δ13C-DIC values (−9.3 ± 1.2‰) (Figure 3). The concentrations and δ13C values of riverine DIC did not differ as a function of discharge. At high discharge, river water DIC concentrations averaged 4.4 ± 0.5 mM (mean ± SD) and the δ13C-DIC values were −4.1 ± 0.9‰, comparable to those values at baseflow: DIC = 4.7 ± 0.4 mM and δ13C-DIC = −5.4 ± 1.2‰ (Figure 4a,b). There was an evident change in both DIC concentrations and δ13C-DIC values at the alluvial fan-alluvial plain boundary (Figure 4a,b).
Dissolved inorganic N and P: NOx (NO3 + NO2) was the principal form of inorganic nutrients for both groundwater and river water, showing values greater than ammonium and orthophosphate by up to three orders of magnitude (Figure 5a,b). The concentrations of inorganic N and P nutrients in river water varied as a function of river discharge. NOx and orthophosphate concentrations were significantly higher at baseflow (NOx: 95.9 ± 9.1 μM; orthophosphate: 2.4 ± 0.5 μM) than those at high discharge (NOx: 71.6 ± 16.9 μM; orthophosphate: 0.9 ± 0.2 μM) (Mann-Whitney U: p < 0.001) (Figure 5a,b). In contrast, NH4+ concentrations were higher at high discharge (NH4+: 3.1 ± 2.0 μM) than baseflow (NH4+: 0.6 ± 1.1 μM). Similar to the longitudinal pattern of DIC, river water NOx levels showed an apparent increase when entering the alluvial plain (from 40.3 μM to 57.0 μM at high discharge and from 75.8 μM to 99.7 μM at baseflow) (Figure 4c). In comparison with river water, groundwater had significantly higher NOx values, especially within the shallow aquifer (Figure 5a). Two extremely high NOx values (708.2 μM and 734.5 μM) were observed in shallow groundwater.
Nutrient loads: The loads of nutrients were calculated (concentrations × discharge) at the two gauging stations. Despite the differences in the nutrient concentrations between high versus low flows, the temporal variation in nutrient loads was driven primarily by water discharge. At high discharge, DIC loads were 1.9 × 10⁶ kg/day and 3.4 × 10⁶ kg/day at the Railway Bridge and Ban Bridge stations, respectively, which were about three times higher than the loads at baseflow (5.9 × 10⁵ kg/day and 1.2 × 10⁶ kg/day at the two stations, respectively) (Figure 6). The loads of N-NOx and P-orthophosphate at high discharge were higher by one order of magnitude, N-NOx: 2.7 × 10⁷ and 6.0 × 10⁷ kg/day at the two stations vs. 4.0 × 10⁶ and 2.9 × 10⁶ kg/day; P-orthophosphate: 7.2 × 10⁵ and 1.9 × 10⁶ kg/day vs. 7.8 × 10⁴ and 1.4 × 10⁵ kg/day. By comparison, the N-NH4+ loads were higher by three orders of magnitude at high discharge (N-NH4+: 1.7 × 10⁶ and 6.6 × 10⁶ kg/day vs. 7.2 × 10³ and 8.2 × 10³ kg/day). Spatially, all species showed increases from the Railway Bridge to Ban Bridge and hence a pattern of downstream accumulation (Figure 6).

4. Discussion

4.1. Sources of Dissolved Inorganic Carbon

The high DIC concentrations and δ13C-DIC values in the Heihe river water (Figure 3) indicate that carbonate mineral weathering was the primary source of DIC. The concentrations of HCO3 typically ranges from around 0.125 mM for rivers draining only silicate rocks to about 3.195 mM for those draining only carbonate rocks [22]. Furthermore, the riverine δ13C-DIC values fell in the range for lithogenic carbonate (δ13C around 0‰) weathering by CO2 from C4 plants respiration (from −13‰ to −10‰) (Figure 3) [20]. C4 plants are adapted to arid environments because of the separation of light-dependent reactions and Calvin cycles, which minimizes photorespiration and increases photosynthetic water use efficiencies [23]. C4 plants (Equisetaceae, Compositae, and Purslane) were widespread in the Qilian Mountains, where δ13C values of soil organic matter (OM) averaged around −10‰, confirming the importance of C4 biomass contributions to the soil C pool in the upper river basin [24]. Carbonate rocks of the Tertiary and Cretaceous periods including dolomite, calcite, and aragonite were widely distributed in bedrocks and aquifers in both the upper and middle HRB basin [17,25]. Our interpretation of DIC sources in the Heihe River is consistent with previous findings based on water oxygen and hydrogen isotopes, which showed precipitation and snowmelt runoff from the Qilian Mountains were the primary water source for surface water of the entire HRB [16,26].
In groundwater, there was a strong, negative correlation between DIC and δ13C-DIC (Figure 3), where deeper samples had higher DIC and lower δ13C-DIC values. This pattern indicates the importance of dedolomitization in groundwater increased with the depth, where more δ13C-enriched DIC precipitates out the solution [17,25]. The net reaction is:
CaMg(CO3)2 + CaSO4 2H2O(s) + H+ = CaCO3(s) + Ca2+ + Mg2+ + SO42− + HCO3 + 2H2O
In agreement with this process, groundwater samples fell near the theoretic dedolomitization trend line (Figure 7a). The higher DIC and δ13C-DIC values in shallow groundwater than in river water indicate an additional source of DIC for shallow groundwater (Figure 3). Based on the δ13C-DIC values, this source could be soil respiration (C4: from −13 to −10‰, C3: from −27 to −24‰) [1,18] and/or lithogenic carbonate weathering with C3 soil CO2 (around −13‰). The latter is more plausible because of the importance of carbonate mineral solution in DIC production in groundwater, as evidenced by a significant correlation between Mg2+ + Ca2+ vs. DIC (τ = 0.72, p < 0.05, df = 8) in groundwater samples. As such, the greater DIC concentrations in shallow groundwater reflect the influence of irrigation flows, that is, enhanced mineral dissolution due to increased and repeated contact between irrigation water and minerals.

4.2. Mobilization and Accumulation of Dissolved Inorganic N and P Nutrients

The higher NOx and orthophosphate concentrations of river water at baseflow than at high discharge indicate dilution effects from precipitation and overland runoff (Figure 5). This pattern suggests that groundwater and subsurface, deep flows were an important source of these nutrients in the Heihe River. By comparison, river water NH4+ concentrations showed an opposite pattern, i.e., higher concentrations at high discharge, which suggests that overland flows carrying fertilizers accumulating at top farmland soils was the primary pathway of ammonium export.
The mobilization and accumulation patterns of nutrients provide insights into their transformation processes from topsoils to groundwater. Agricultural fertilizers have been extensively applied in the middle HRB over the past four decades, leading to significant increases in the concentrations of inorganic N and P nutrients in farmland soils [9]. Due to none to low precipitation in a large part of a year, the agricultural irrigation flow is the main pathway leaching nutrients from shallow soils to deeper, saturated groundwater zones. Previous studies relating groundwater age to nutrient concentrations found that intensive irrigation using river water and local groundwater accelerated downward transports of solutes from soils to aquifers within the basin [9]. During the process of downward percolation, labile ammonium is removed either through nitrification or direct microbial and plant uptake at topsoils [27,28,29]. As such, the export of ammonium was mainly controlled by short-lived storms flushing and leaching topsoils. On the other hand, NOx levels in shallow groundwater became increasingly high as a result of the nitrification process. As for inorganic orthophosphate, it often has a low solubility in natural waters that varies largely with pH values. The lower orthophosphate concentrations in groundwater than in river water can be attributed to orthophosphate retention by soil minerals, a process that has been observed widely in soil profiles [30].

4.3. Hydrological Controls on Riverine Transport of Dissolved Inorganic C, N, and P

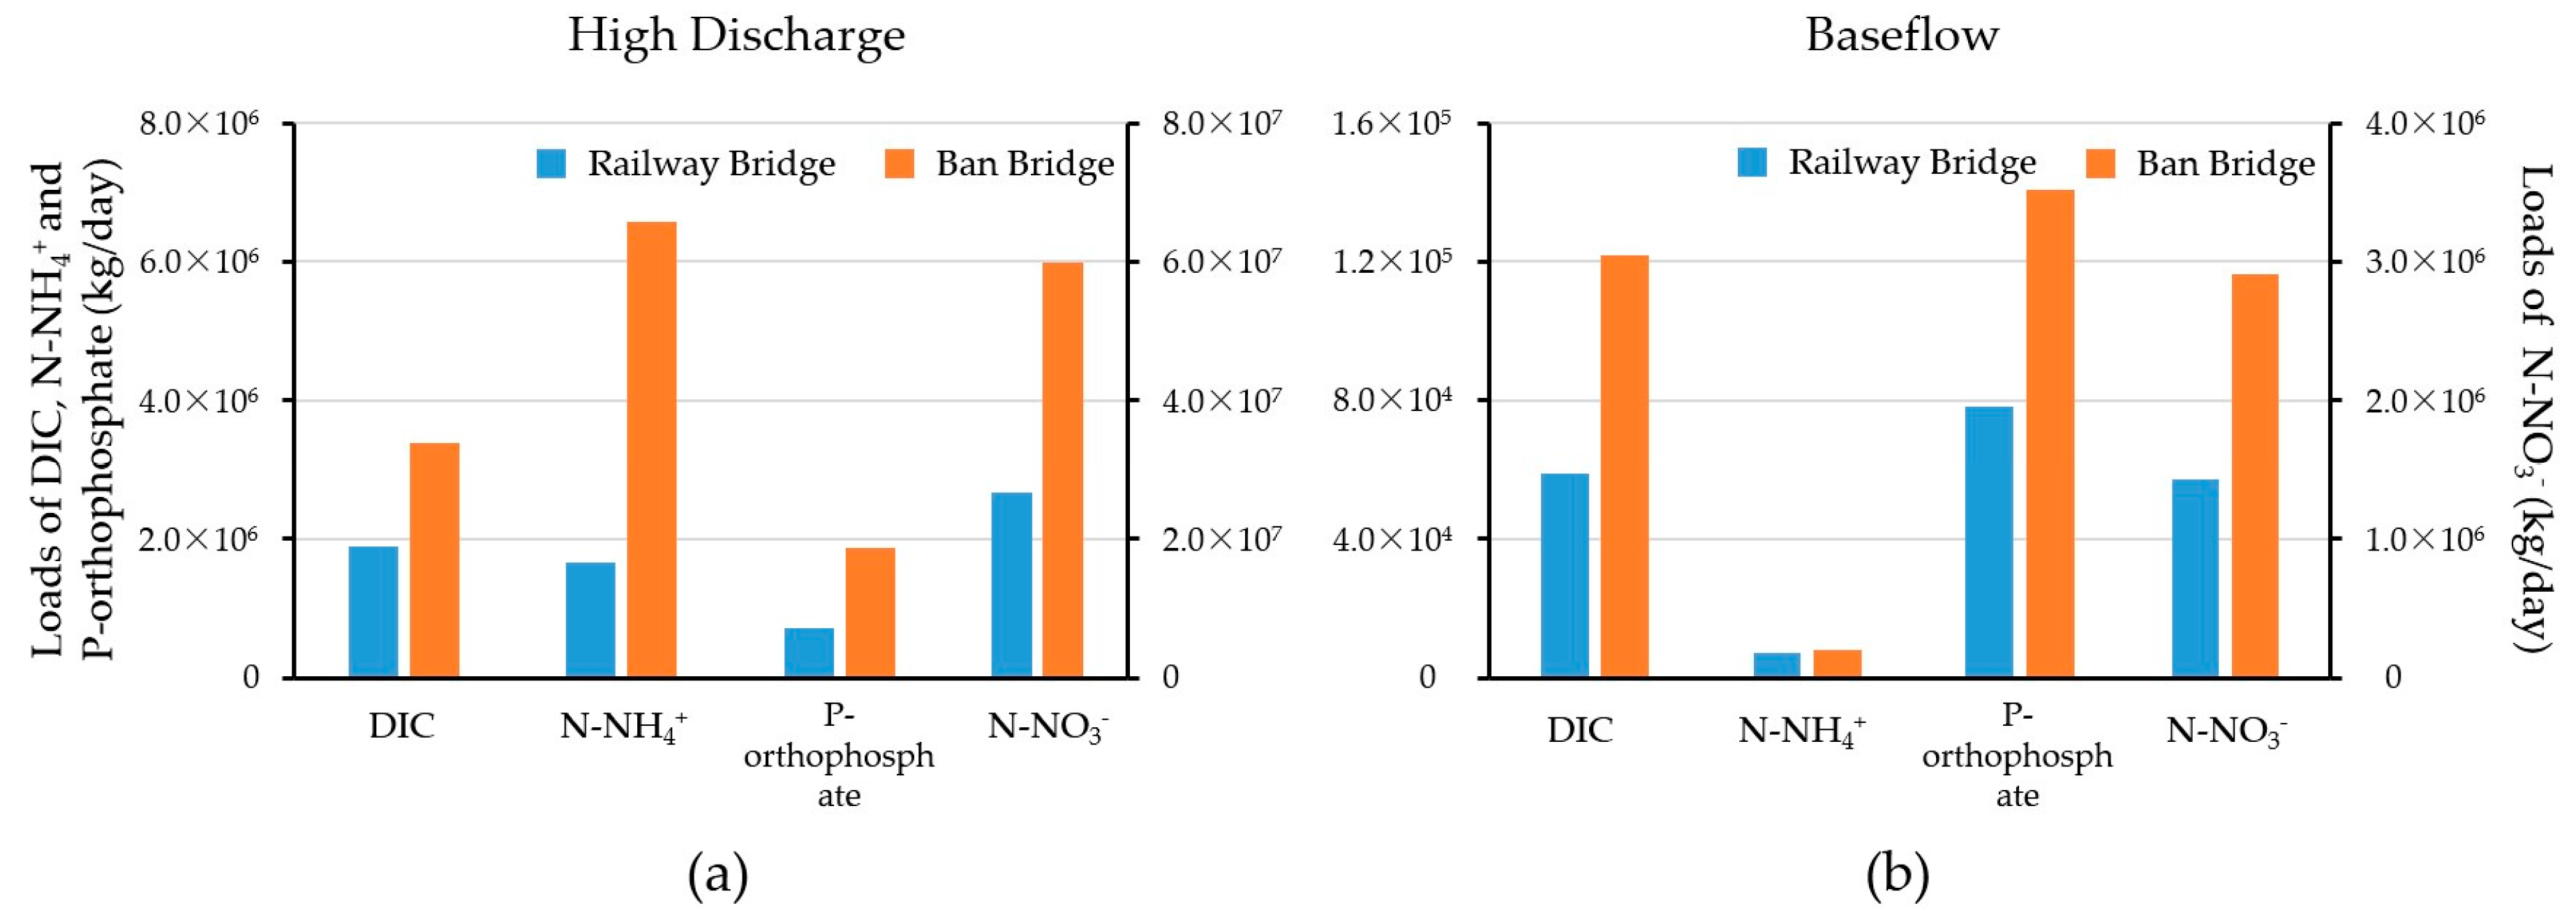
4.3.1. River Discharge Controls on Nutrient Export

We evaluated the importance of storm flows vs. baseflow in nutrient export in the HRB. Because of large differences in river discharge between storm vs. dry seasons (Figure 2), temporal changes in the watershed export of each nutrient was driven largely by discharge (Figure 6). As such, we extrapolated the load calculation to the full year, with the assumption that the concentrations measured in the present study represent typical storm flow and baseflow values for the year 2013 (Figure 8). High discharges (discharge >10 m3/s for Railway Ridge and >20 m3/s for Ban Bridge) associated with precipitation intensity >10 mm were selected to represent storm flows. We estimated that storm events, although occurring on only about 40 days in the year 2013, accounted for a disproportionally substantial fraction of annual nutrient exports, i.e., >60% of the annual loads for DIC, >90% for ammonium, >50% for NOx, and >40% for orthophosphate. These data show the importance of storm events, although infrequent, in transporting nutrients from soils to the river within the HRB. A similar pattern has been widely observed in streams and rivers in humid and arid regions [2,31], demonstrating the importance of hydrological events in mobilizing C, N, and P from land to lotic ecosystems.

4.3.2. Groundwater Discharge Controls on River Water DIC and NOx

The longitudinal changes in river water DIC and NOx concentrations reflect the influence of strong interactions between river water and shallow groundwater along the middle reach. The sudden changes across the alluvial fan-alluvial plain boundary (Figure 4) can be explained by an increase in the proportion of shallow groundwater discharging to river water when the river exited the alluvial fan. As discussed in the previous sections, shallow groundwater (<50 m) in the alluvial plain had higher DIC and NOx concentrations and lower δ13C-DIC values than that of river water due to fertilizer applications and irrigation flows. The alluvial fan was characterized by deep groundwater (>200 m at the upstream section and about 50–200 m at the central section) with the aquifers recharged by the river. The alluvial plain, however, had a much shallower groundwater table (<10 m near the river and overall shallower than 50 m) with the river gaining water from groundwater [16,26,32]. This boundary thus represents a transition point for surface water-groundwater interactions and subsequently an increase in the input of nutrients from groundwater to the river.
Within the alluvial plain, the longitudinal variability in riverine DIC and NOx continued to be mediated by the variability of groundwater discharging to the river. This is evidenced by a negative correlation in river water between δ13C-DIC values versus Ca2+ + Mg2+ concentrations (τ = −0.48, p < 0.001, df = 33) as well as a positive correlation between NOx versus Ca2+ + Mg2+ (τ = 0.40, p < 0.001, df = 32). Furthermore, δ13C-DIC negatively correlated with NOx (τ = −0.54, p < 0.001, df = 33). Given that shallow groundwater samples had higher Ca2+ + Mg2+concentrations than the river water, these patterns show that shallow groundwater acted as an important source of DIC and NOx for the river water within the alluvial plain. This finding is not surprising as a number of studies have observed frequent surface water-groundwater interactions naturally occurring within the alluvial plain and that this process has been further enhanced by irrigation return flows in recent years [9].

4.4. Water Source Mixing Analysis

Our data, along with previous studies in the HRB, have shown that groundwater-surface water interactions play a pivotal role in nutrient variability in the middle HRB. Assessing the magnitude of surface water-groundwater interactions is important in establishing a sustainable water management plan for the HRB. Previous studies mostly used 18O as the water source tracer, which yielded results showing that groundwater contributions to the river water were spatially variable along the middle reach, increasing from 20% to 45% at Gaoya (about 50 km downstream from the mountain exit) to >50% at Gaotai (about 120 km downstream) [16,18].
In the present study, we used δ13C-DIC and Cl concentrations as tracers in a two end-member mixing calculation to quantify groundwater contributions to the river [33,34]. Although biogeochemical processes may alter δ13C-DIC (e.g., CO2 degassing, OM oxidation) [2,35], the use of δ13C-DIC and the mixing calculation to reflect water sources was based on four considerations: (1) δ13C-DIC showed a strong linear correlation with Cl in river water in the alluvial plain (τ = −0.56, p < 0.001, df = 32) and Cl has been commonly used as a conservative tracer for water sources [36,37]; (2) river water and shallow groundwater in the alluvial plain fell on a linear mixing line based on δ13C-DIC vs. Cl (Figure 7b); (3) there were distinct differences in δ13C-DIC values between shallow groundwater versus river water at the mountain exit (Figure 7b); and (4) groundwater contribution appeared to be the primary control on the spatial variability in riverine DIC sources within the alluvial plain (as discussed in Section 4.3.2).
We quantified the relative contributions of groundwater to river water in the alluvial plain using a two end-member mixing model as follows:
[Cl]upfup + [Cl]gfg = [Cl]r
δ13Cupfup + δ13Cgfg = δ13Cr
fup + fg = 1
where f denotes the fractions of each water mass and footnotes ‘r’, ‘up’, and ‘g’ represent river water, upstream water, and shallow groundwater in the alluvial plain, respectively. The groundwater end-member was determined in the present study, for which the mean values of shallow groundwater (<50 m) within the alluvial plain were used (i.e., −9.3‰ for δ13Cg and 106.8 mg/L for [Cl]g). The upstream end-member values (δ13Cup and [Cl]up) and corresponding fractions (fup and fg), were unknown. In order to solve these underdetermined equations (three equations with four unknowns), the following conditions were used to constrain the unknowns:
0 < fg < 1;
0 < fup < 1;
0 < [Cl]up < 20.2 mg/L (i.e., the minimum [Cl] concentration for river water in the alluvial plain);
0 > δ13Cup > −3.5‰ (i.e., the maximum δ13C-DIC value for river water in the alluvial plain).
The equations were solved through substitution which yielded a range for fg values at both high and low discharges (Table 1).
Our results were largely consistent with those calculated from δ18O [16,18], showing higher values of fg at baseflow than at high discharge as well as an increasing trend in the contributions of groundwater as the river flowed downstream (Table 1). Compared to the literature values estimated using δ18O, our results had lower values, which could be due to uncertainty associated with end-member value assignment (e.g., shallow groundwater were sampled from different wells between this study vs. previous studies) and intrinsic limitations for each tracer. In particular, δ13C-DIC could become more positive by degassing and microbial uptake, which would lead to underestimation of groundwater contributions. Additionally, groundwater end-member values were determined only during the sampling campaign in July, as previous studies show that groundwater geochemical characteristics do not show evident seasonal variations within HRB [16,18,38].

5. Conclusions and Implications for HRB Watershed Management

Understanding fundamental ecosystem processes linking terrestrial and aquatic ecosystems is critical to establishing sustainable management practices in agricultural basins. Our study site is a large, economically important agricultural basin in arid northwestern China. Past management practices in the basin focused mostly on optimizing water storage and appropriation to meet the needs for agricultural water use. It was only recently that preserving water quality and the river ecosystem itself has been integrated into regulatory goals. This initiative requires a better understanding of biogeochemical dynamics of C, N, and P nutrients within the basin. The present study provided the first thorough assessment of nutrient variation in the river and groundwater in the middle HRB, yielding major findings:
(1)
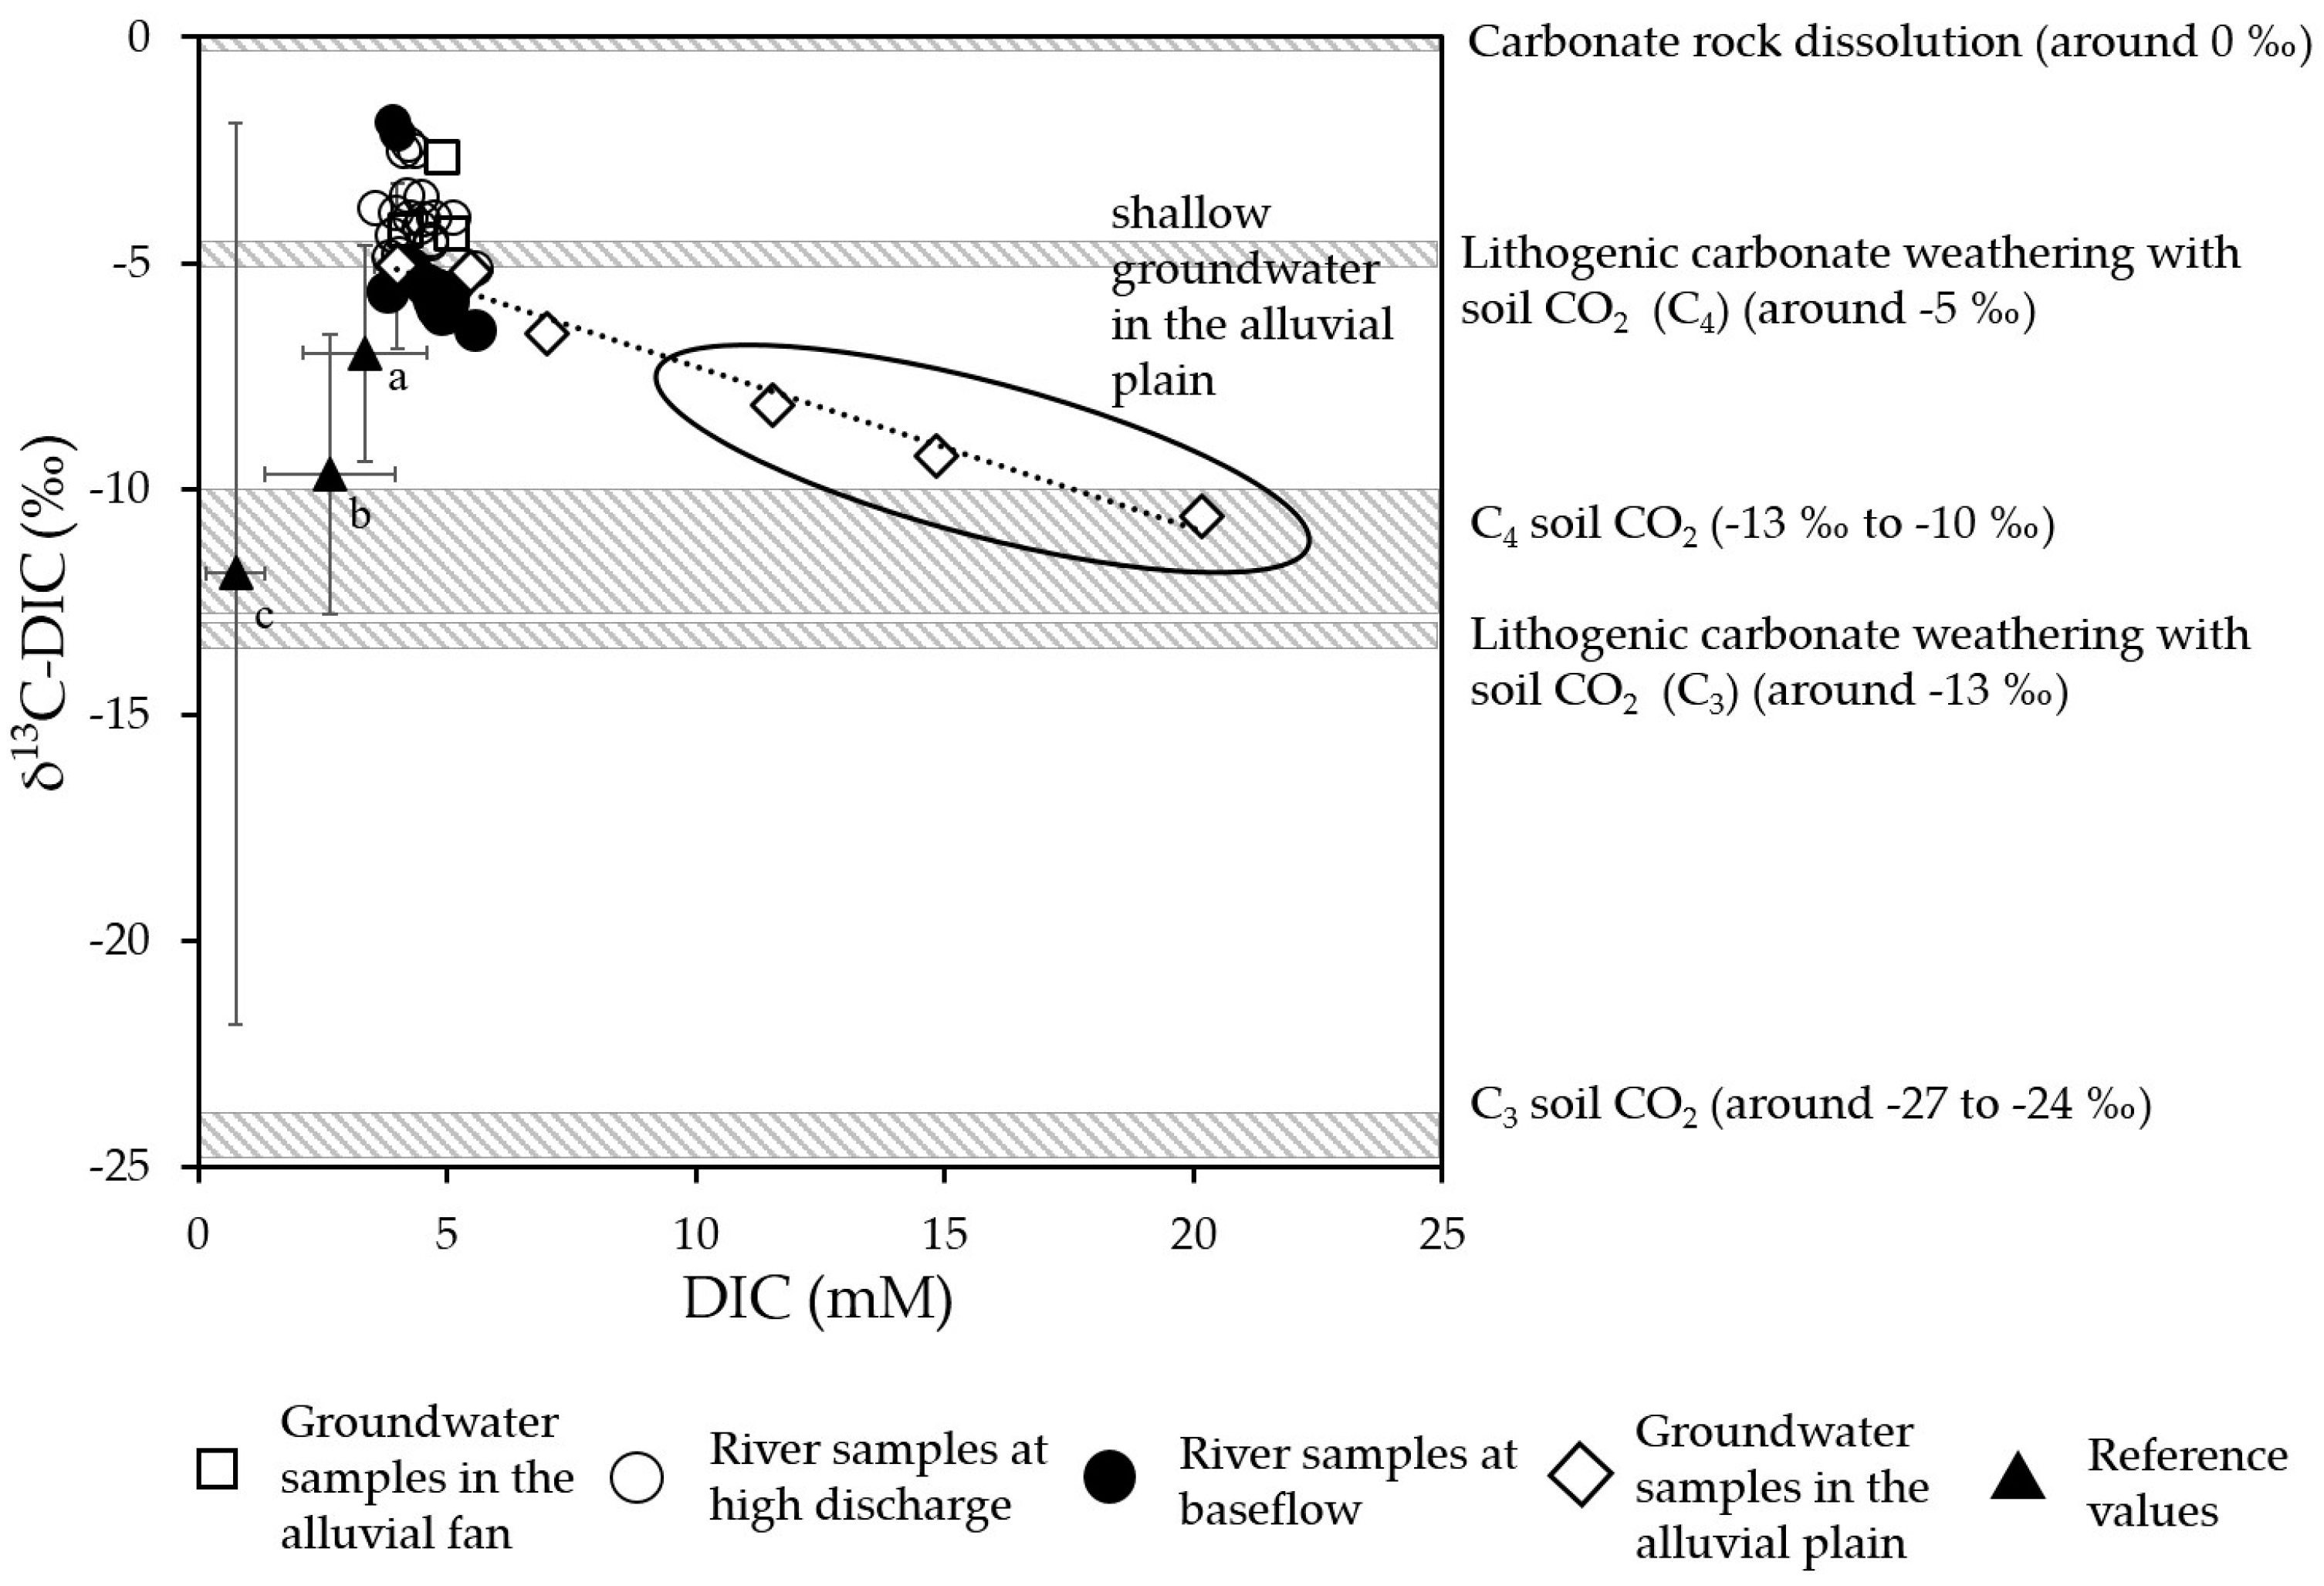
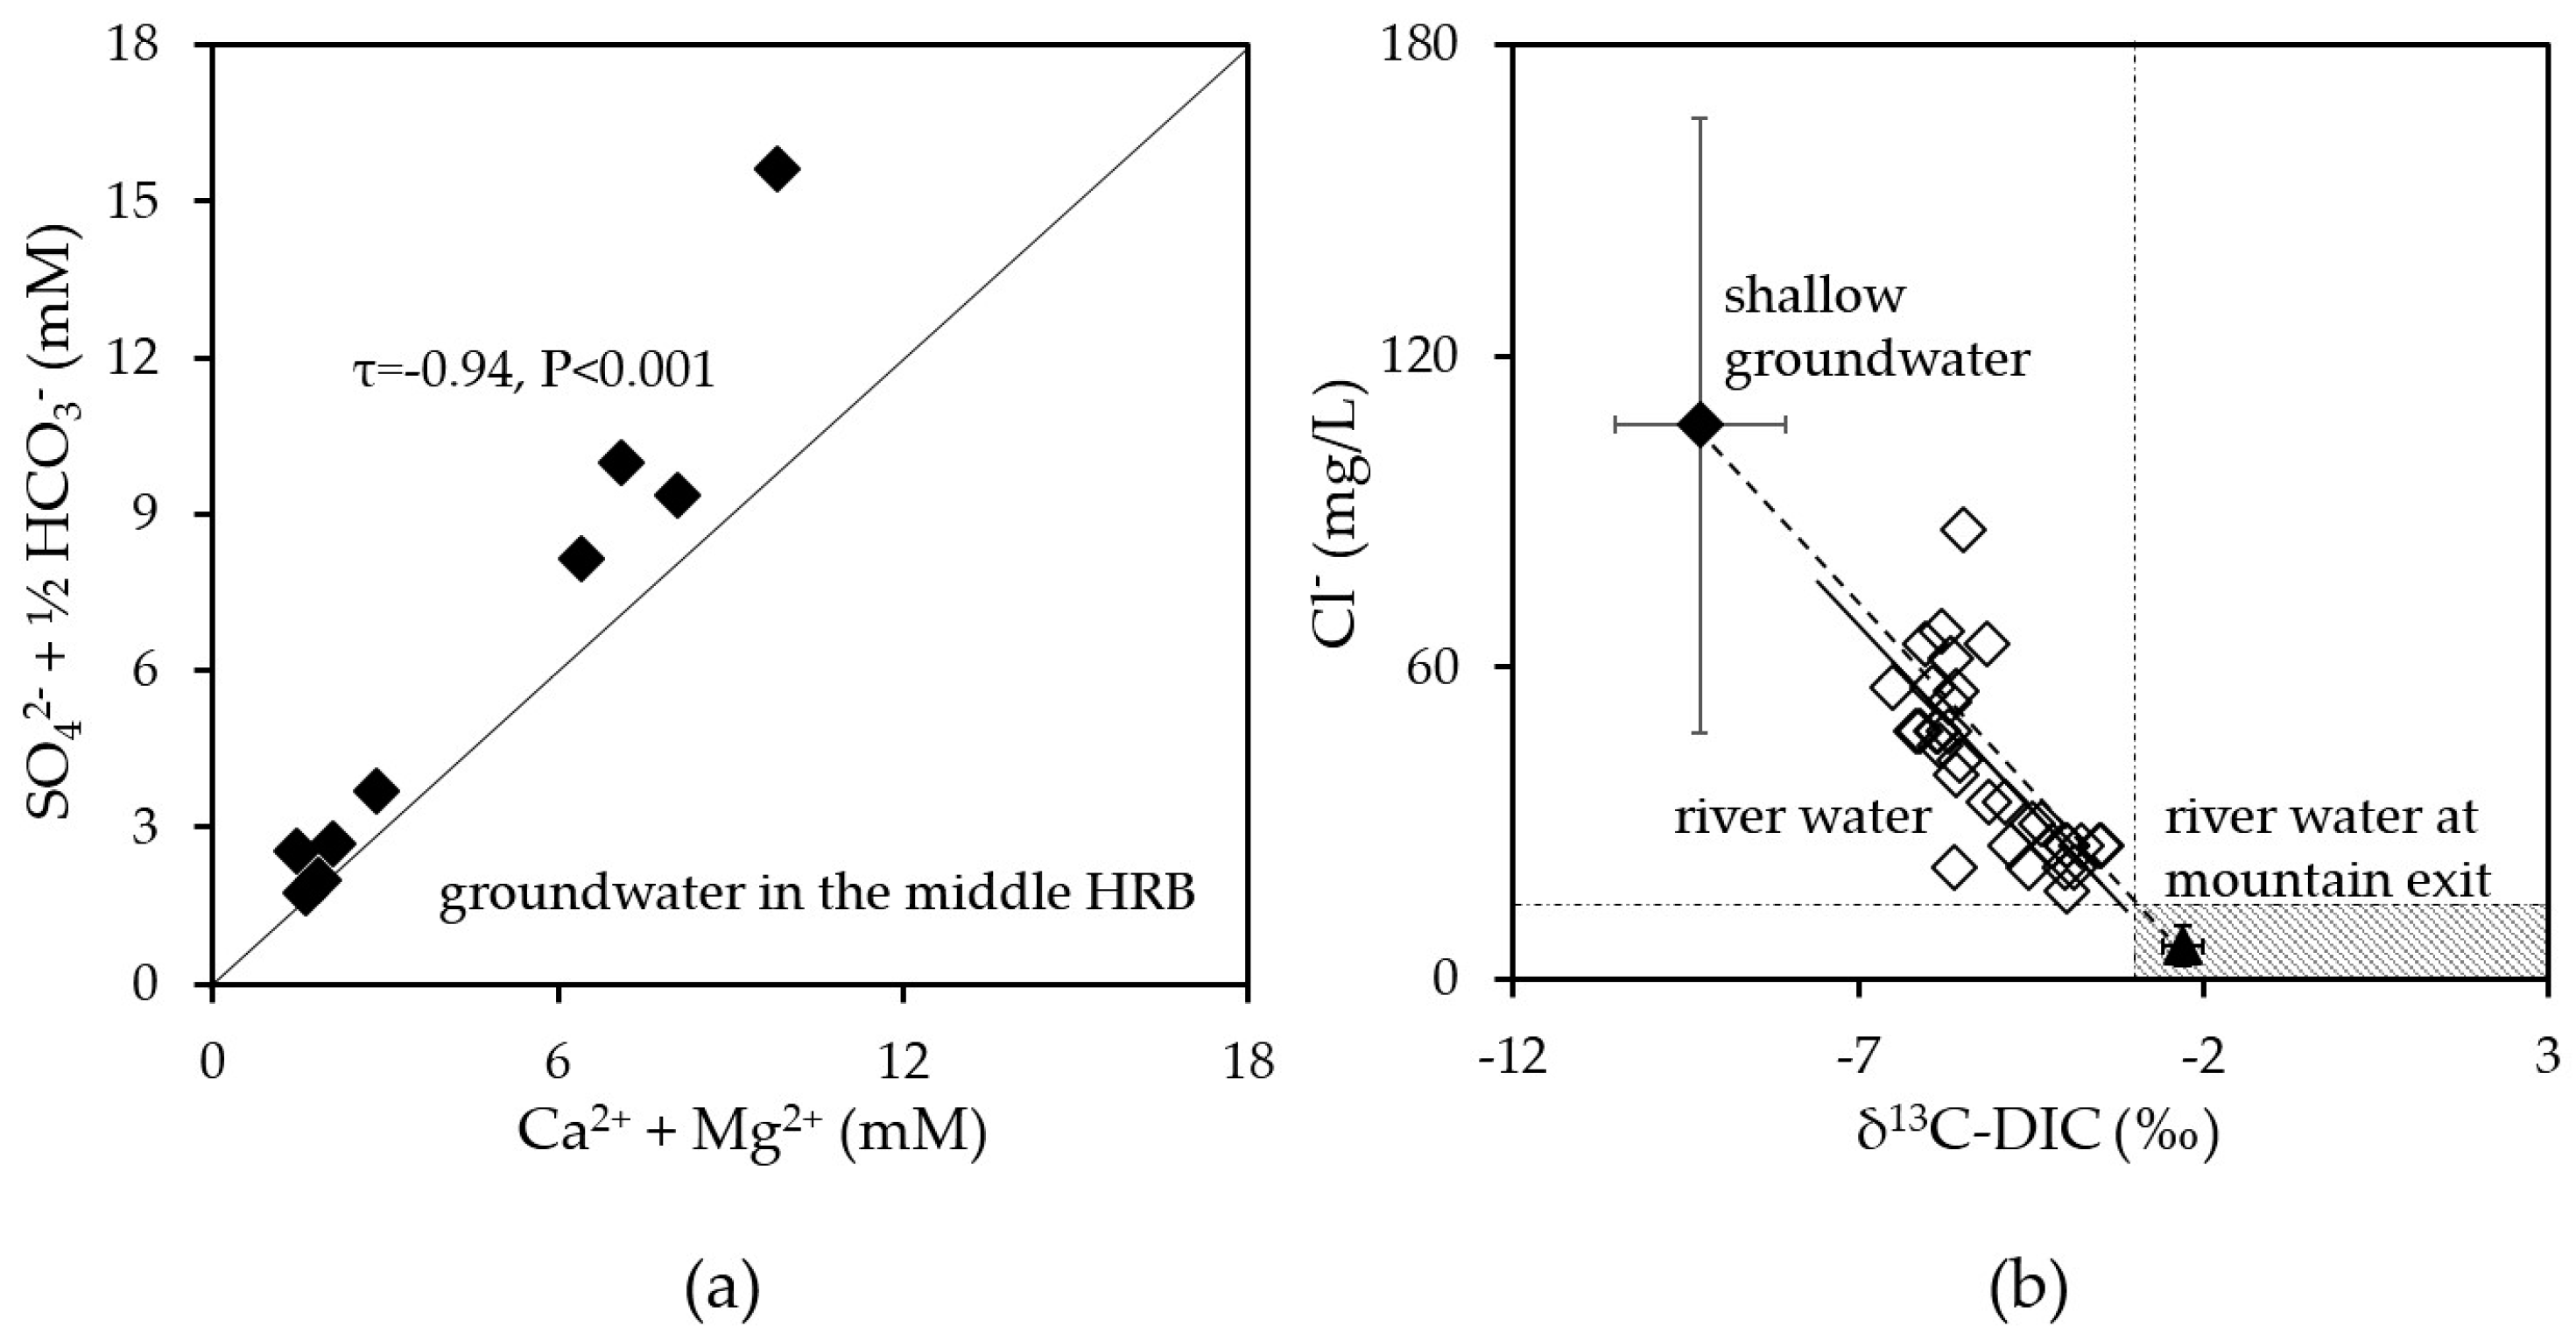
Lithogenic carbonate weathering is the primary source of DIC in the river water and groundwater.
(2)
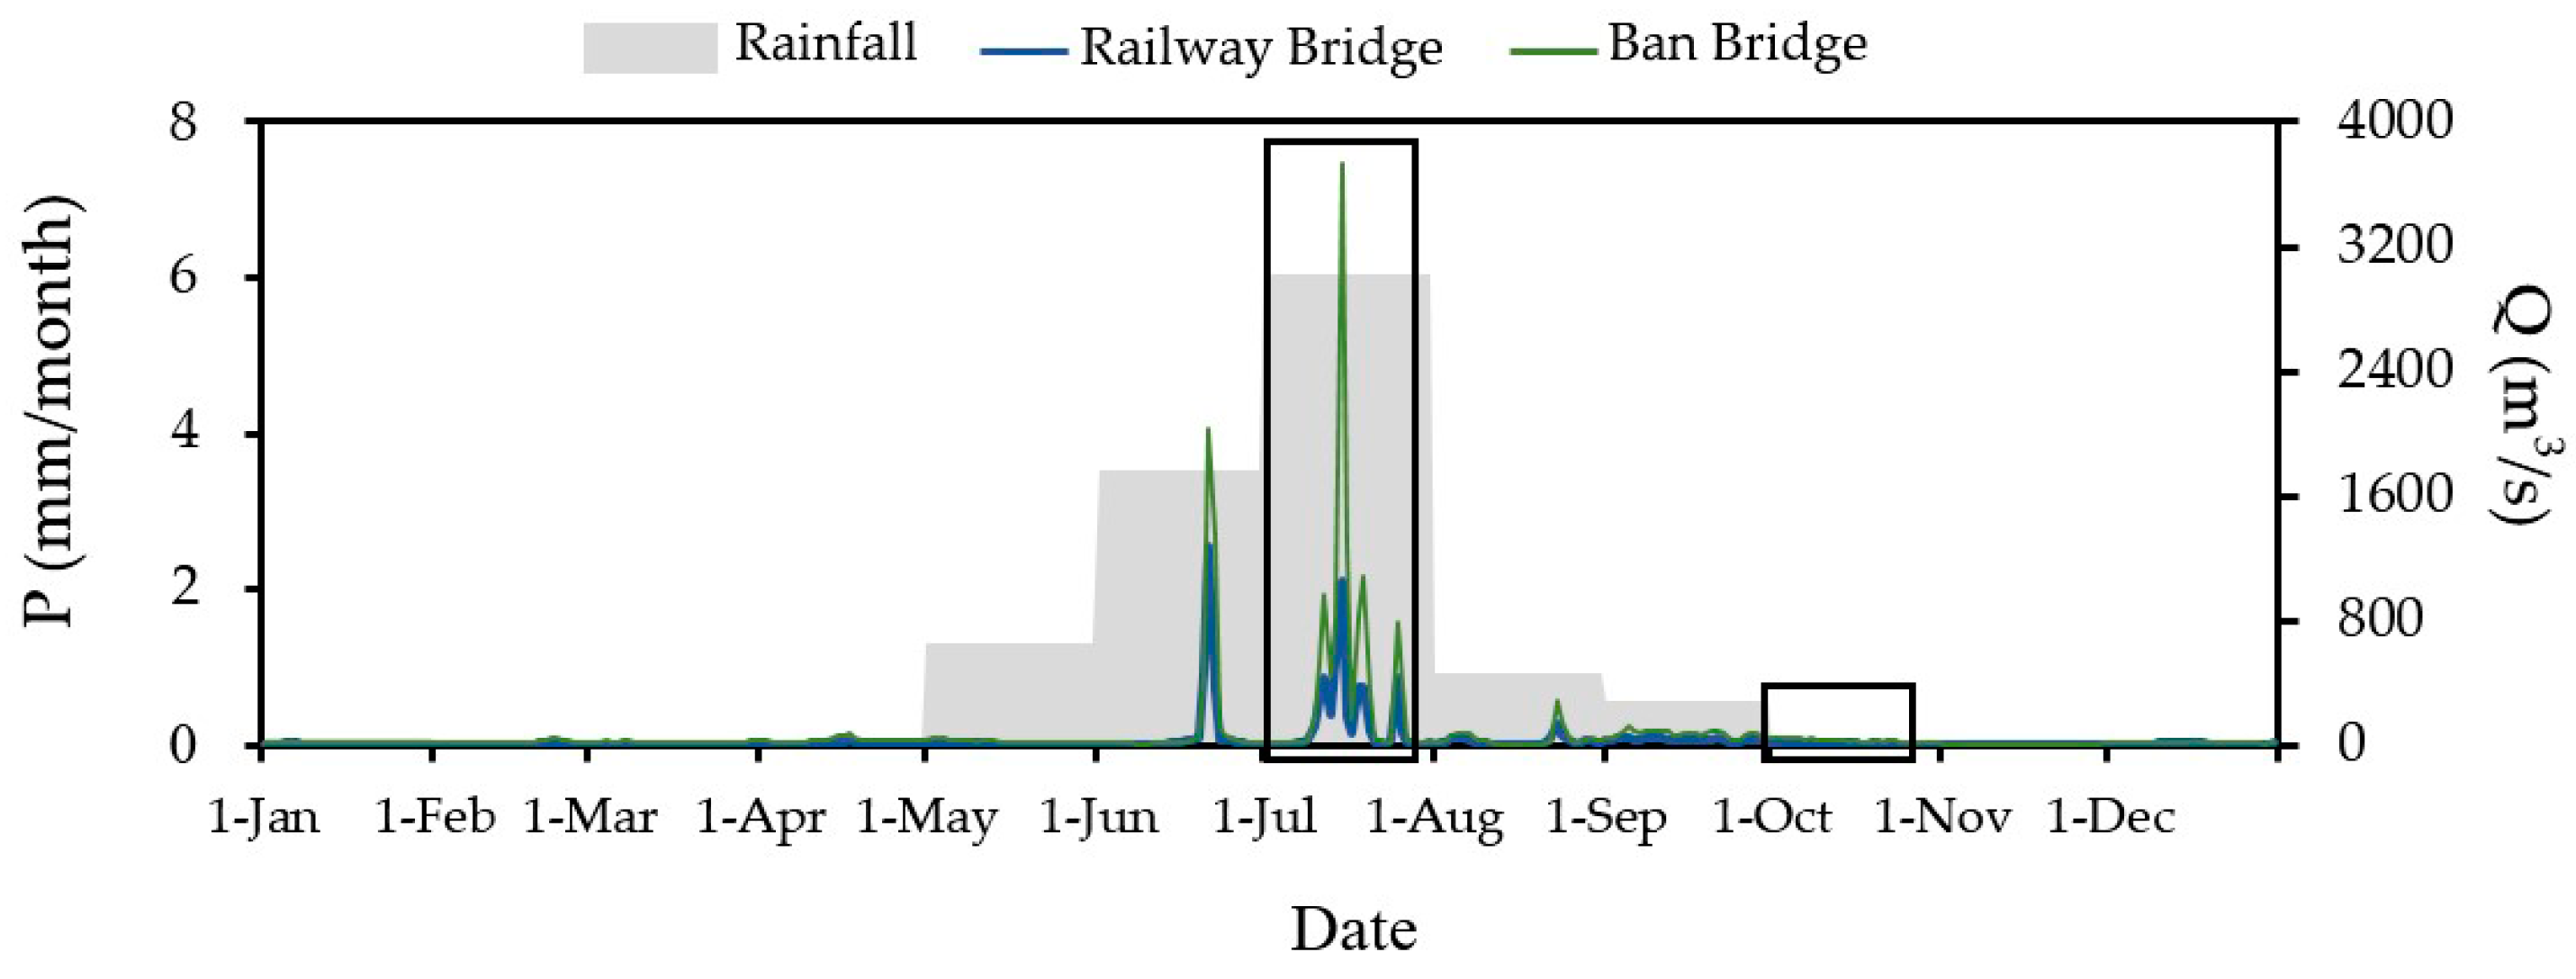
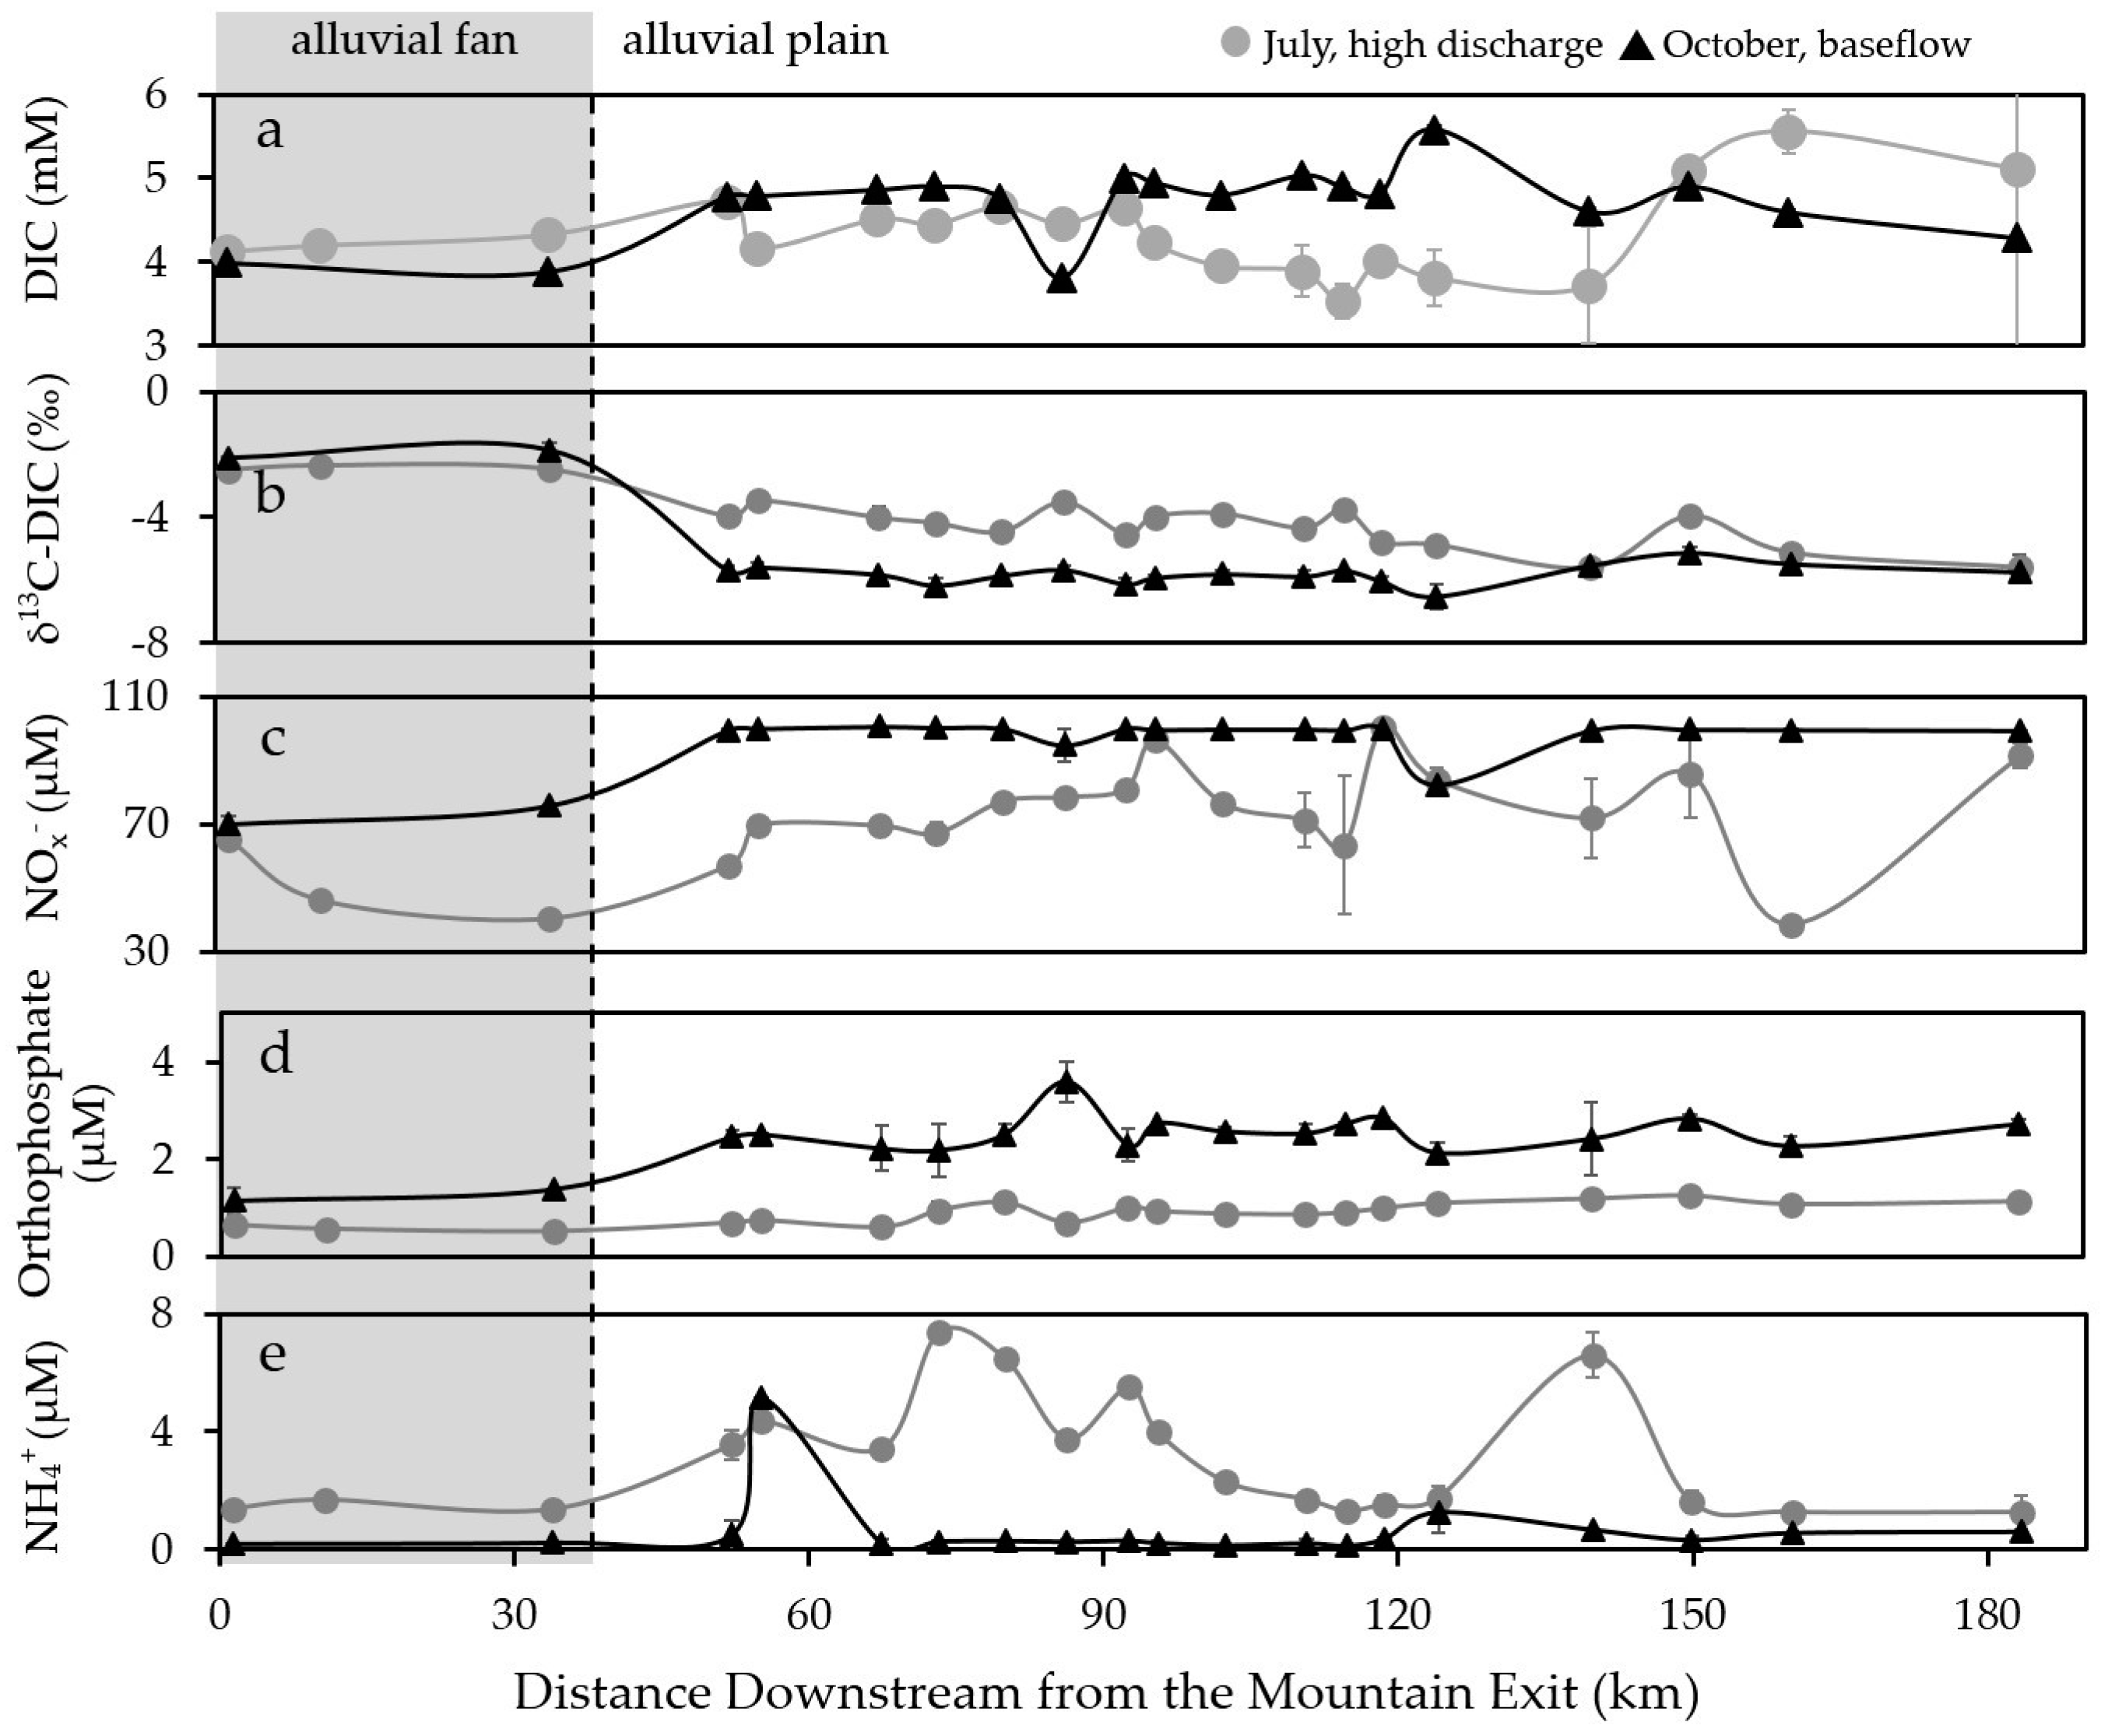
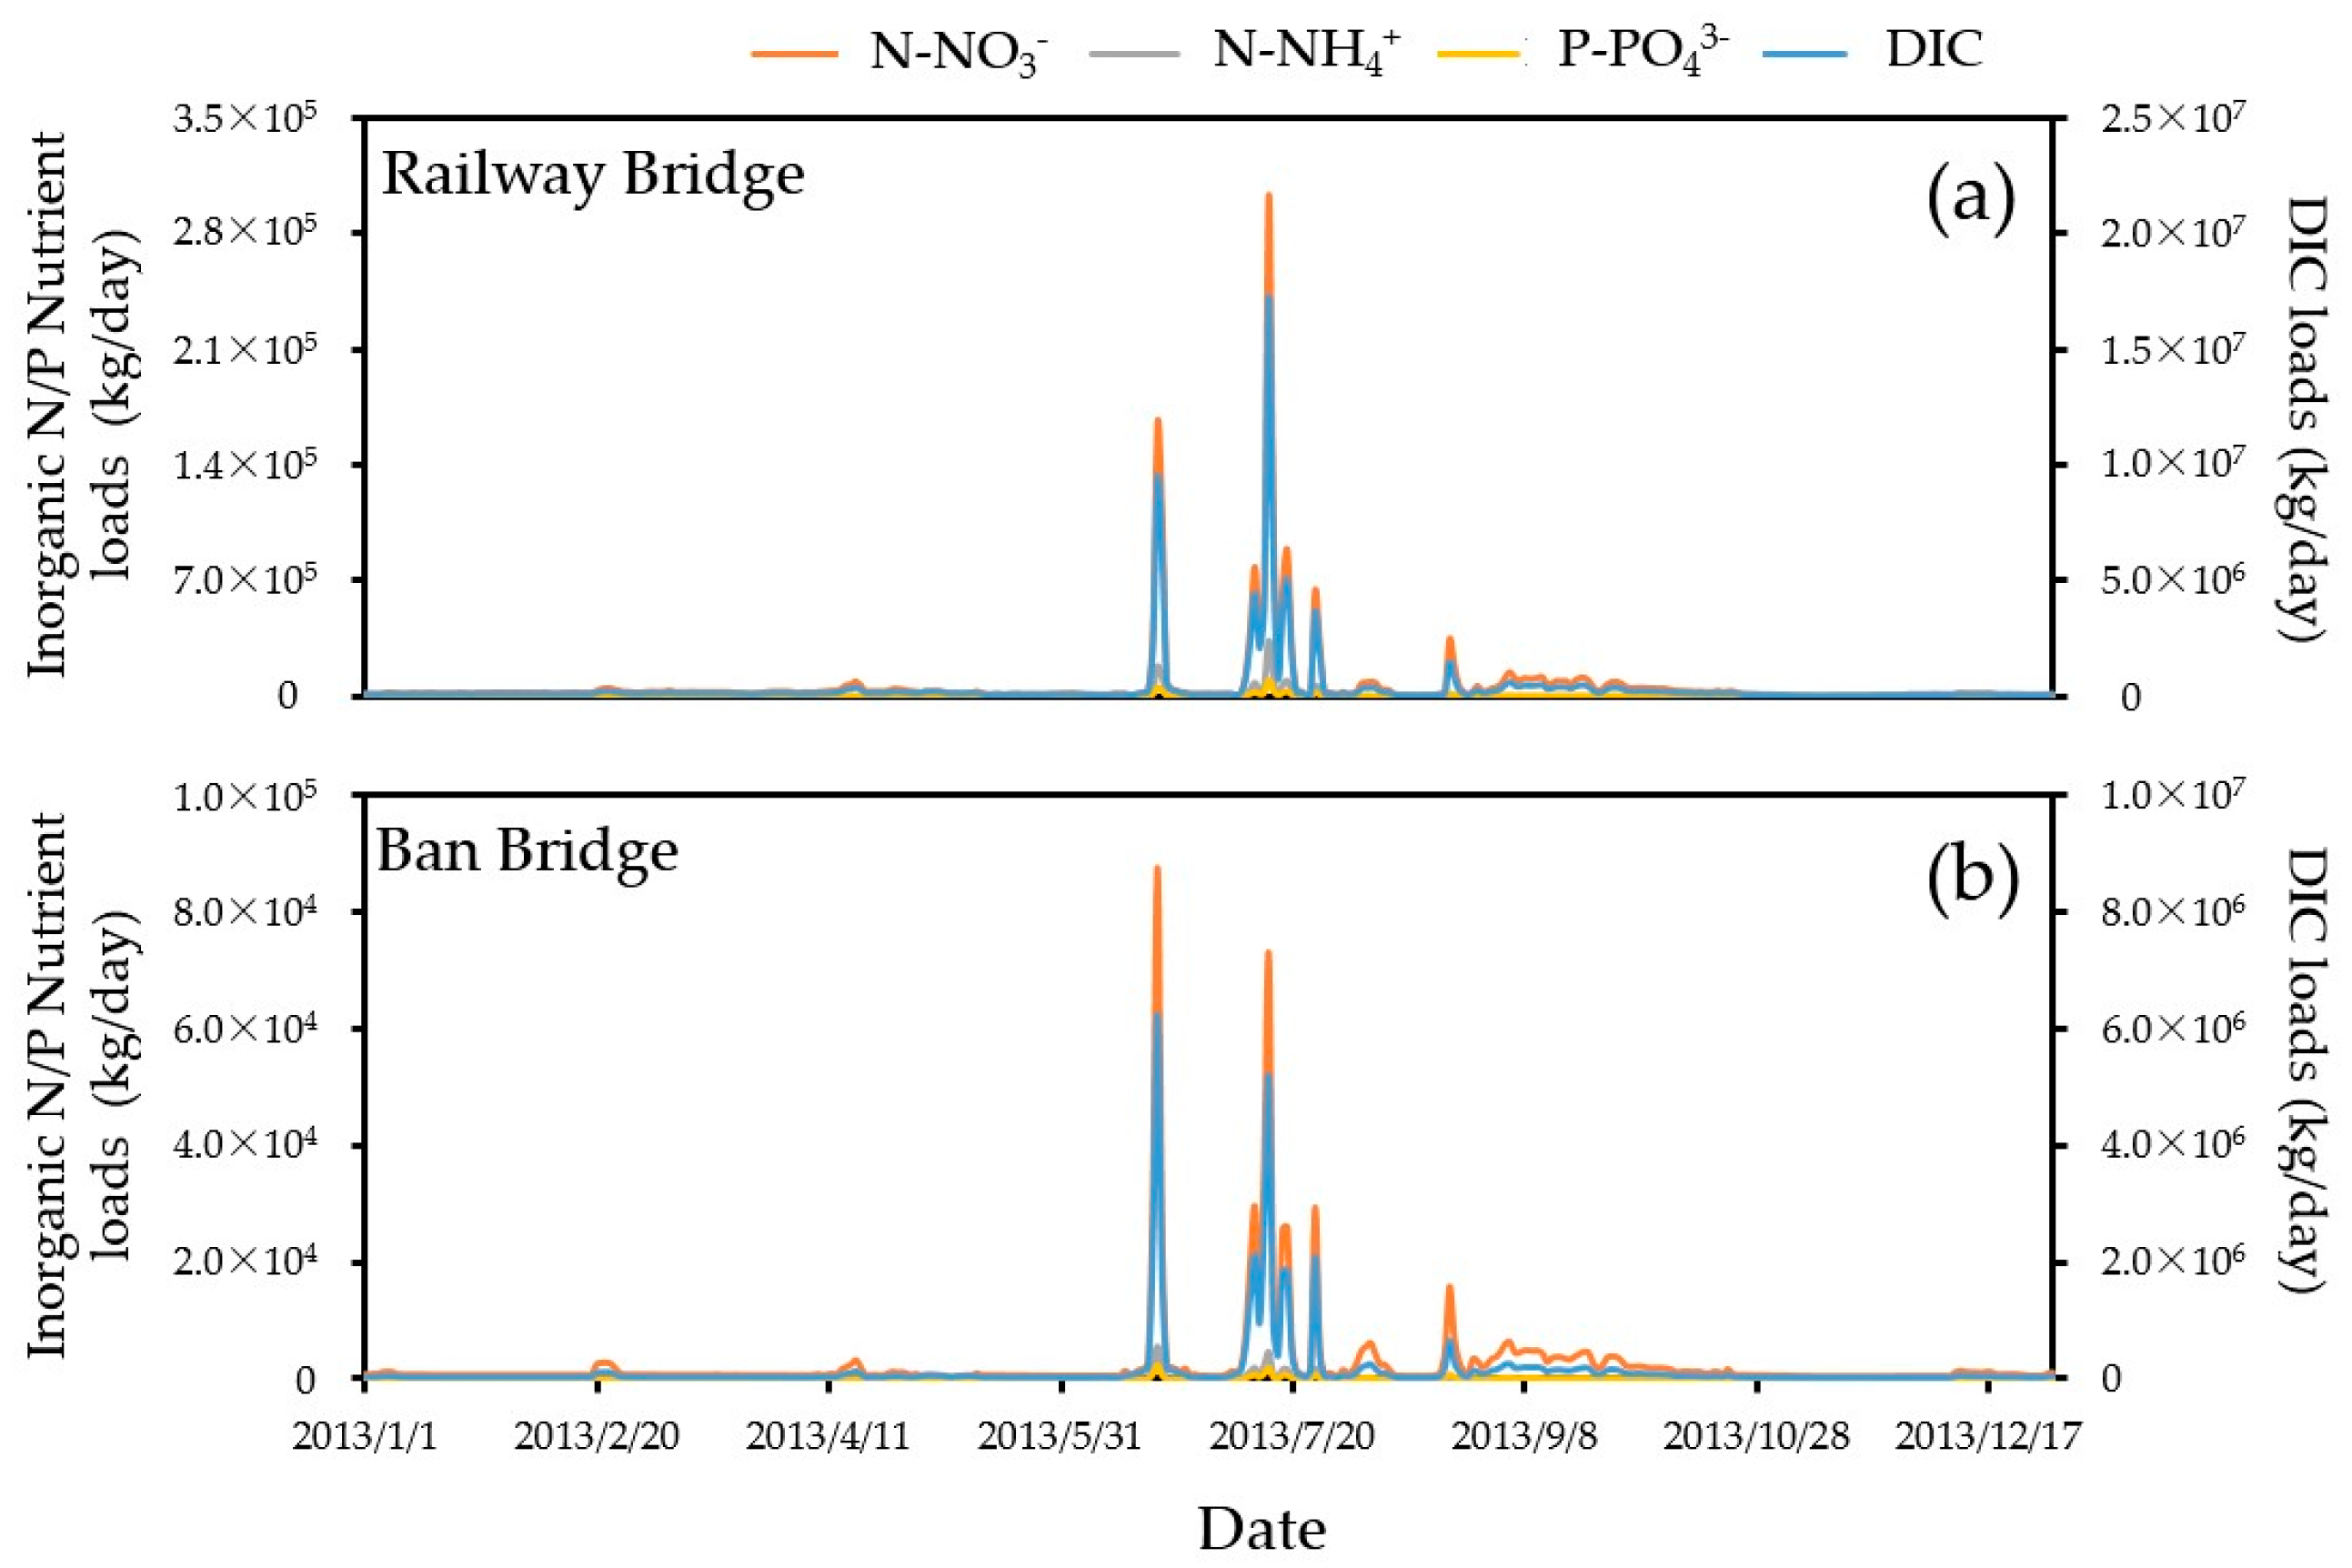
Discharge exerted an important control on the amount, source, and flowpath of inorganic C, N, and P mobilized from soils to the river in the middle basin. The majority of ammonium was transported from soils to the river by storm flows, whereas the other nutrients were mobilized through both storm flows and groundwater flows.
(3)
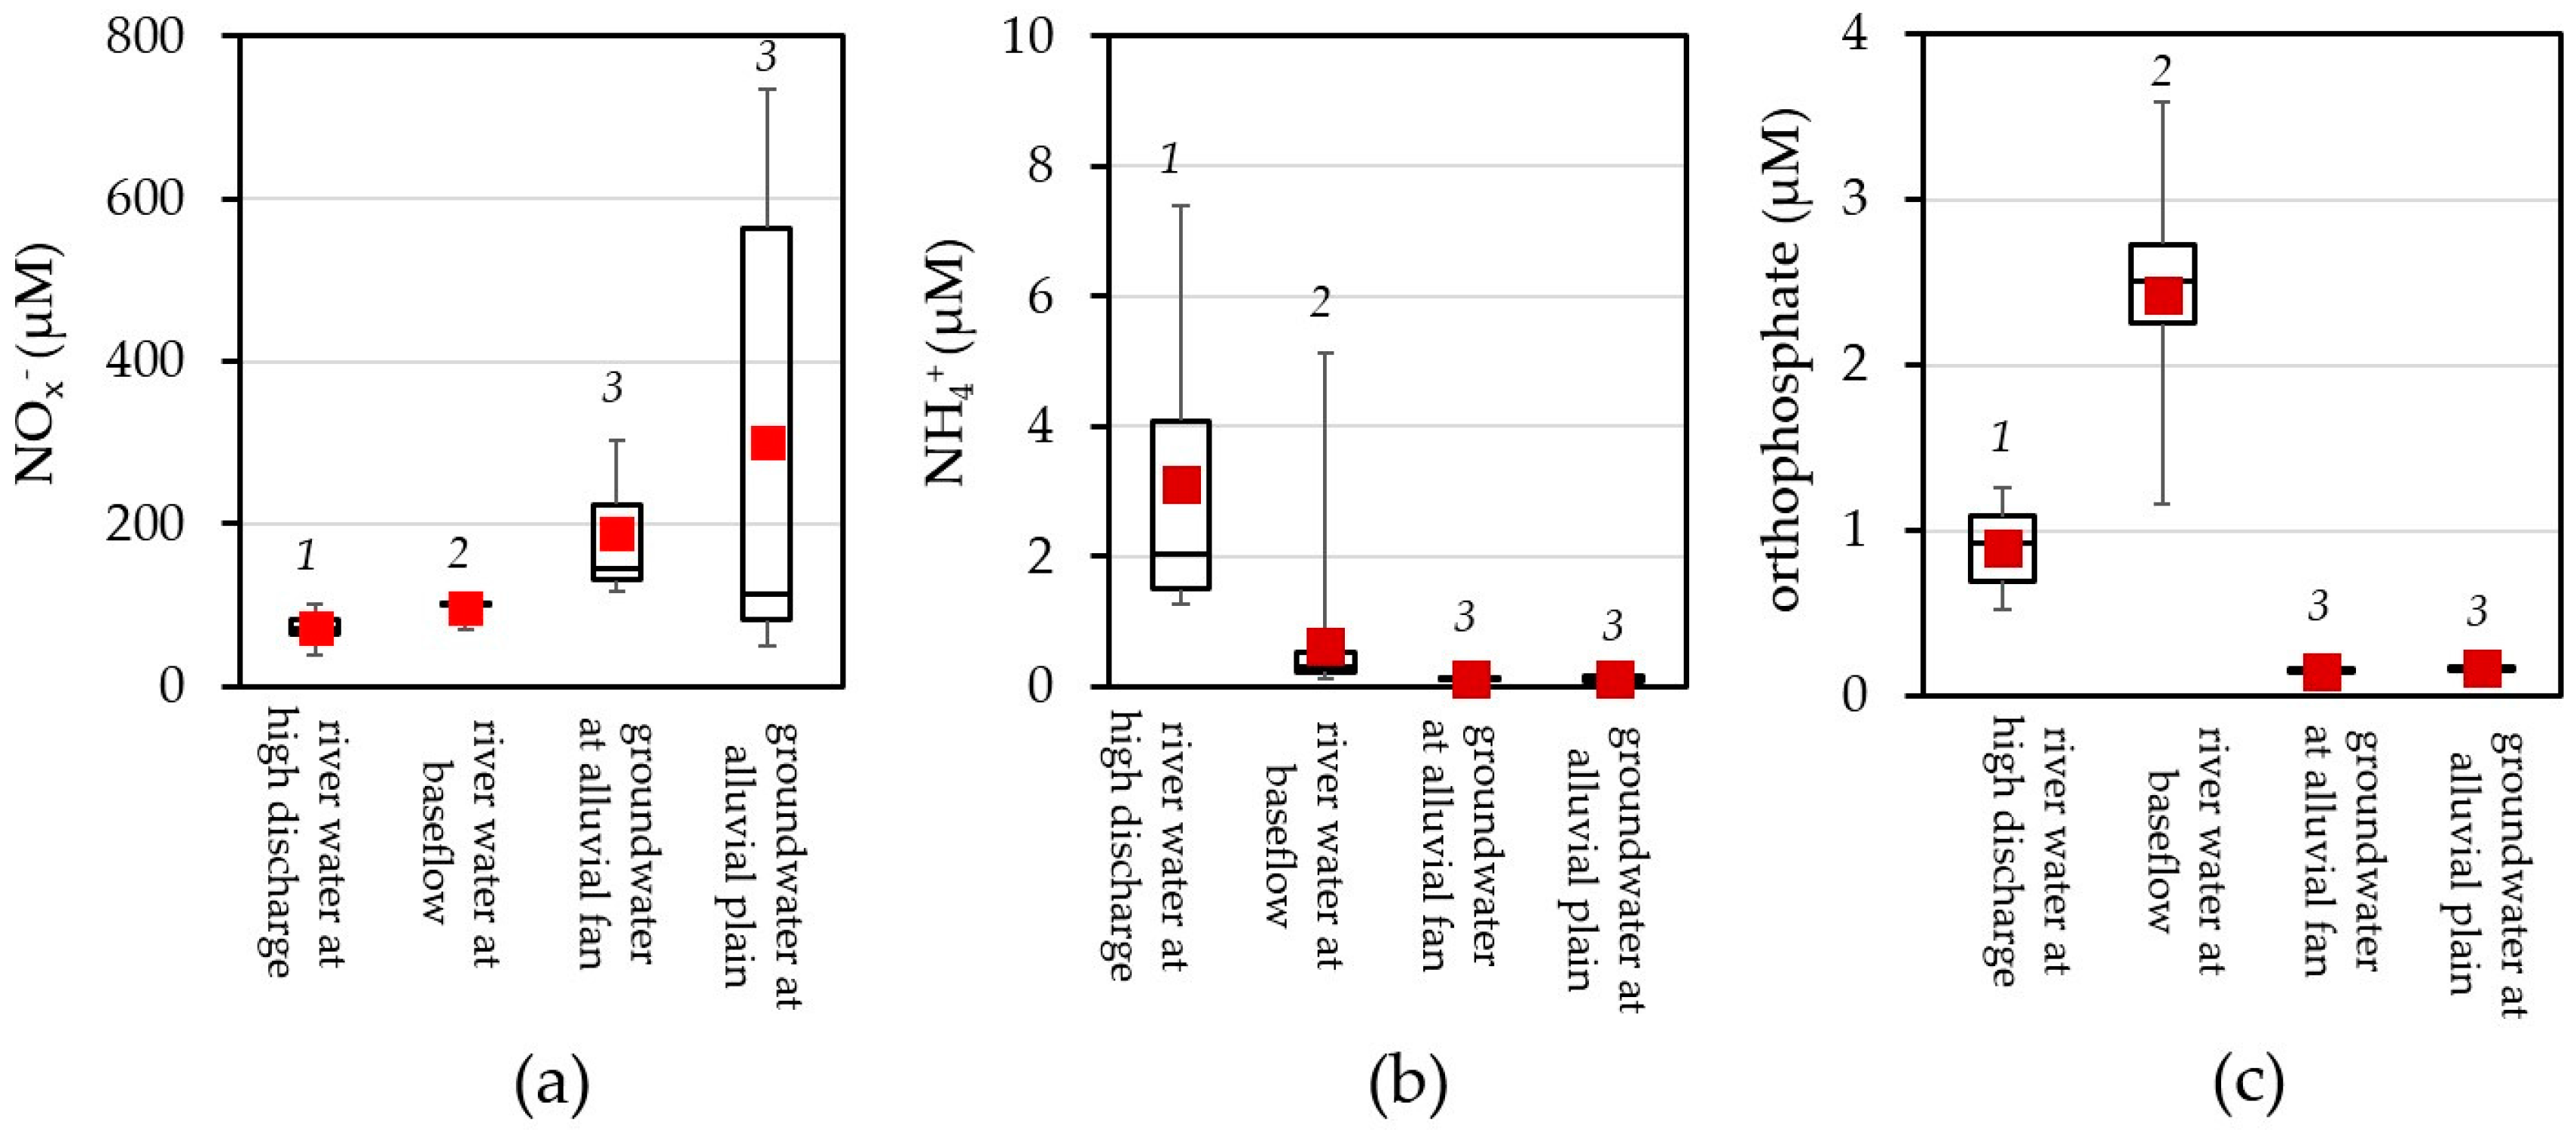
Compared with river water, shallow groundwater showed higher DIC concentrations, more negative δ13C-DIC values, and higher NOx concentrations. This character reflects enhanced carbonate weathering and NOx accumulation in shallow aquifers due to irrigation practices and fertilizer applications within the middle basin.
(4)
The DIC, NOx-rich shallow groundwater served as a source of nutrients for the Heihe River, whereby the discharge of groundwater into the river regulated the longitudinal variation in DIC and NOx along the river reach within the alluvial plain. This is because groundwater makes up a significant contribution to river water. The source mixing analysis based on δ13C-DIC and chloride shows that groundwater accounted for 9–34% at high discharge and 39–60% at baseflow.
Our data have two important implications on HRB watershed management. First, hydrological events that occur for only a brief period of a year (about 10% of the days) were a main driver of the watershed export of inorganic C, N, and P to the Heihe River. Hence, future regulatory efforts in reducing nutrient loss from soils should place priorities on mitigating runoff from agricultural fields in storm seasons (i.e., June to August). Second, the values of inorganic N and P nutrients in river water and groundwater observed in the present study are largely comparable to those reported in other large arid river basins, such as the San Joaquin River in California [39], the Murray River in Australia [40,41], and the Tigris River in Turkey [42]. These rivers have been all extensively exploited to support agricultural water use, where a significant fraction of river flows (up to 80%) can be diverted for irrigation. Another common feature is that river water and groundwater are well connected hydraulically because of local geology (e.g., gravels and sands dominate the river beds), enabling nutrient exchanges among irrigation water, groundwater, and surface water.
We observed NOx accumulation in shallow aquifers in the middle HRB, which is concerning and warrants immediate regulator attention. It should be noted that it is a common practice for local farmers drilling shallow wells to acquire water not only for irrigation but also for drinking and other household activities. Some of the shallow groundwater samples showed concentrations near the threshold values set by the world health organization (WHO) for healthy drinking water, which is 178 μM for N-NO3 concentration [43]. Another potential issue is that N-NO3 concentrations in the Heihe river water have exceeded the level with a considerable potential leading to eutrophication (21 TN μM with nitrogen as the limit factor and 3 TP μM with phosphorus as the limit factor) [44]. For the time being, eutrophication seems unlikely for the river itself, because turbidity is usually high and limits autochthonous production. However, our data show nutrient accumulation as rivers flow downstream, which likely leads to eutrophication in the two terminal lakes in the foreseeable future. For the time being, the lakes are intermittent, due to high amounts of river water being diverted and stored for agricultural needs. Current regulatory efforts are on the way of restoring them to perennial lakes with a more stable ecosystem, when they would be more susceptible to nutrient pollution and eutrophication. Imposing stricter regulations of fertilizer applications and nutrient pollution is, hence, needed to restore groundwater quality and maintain river and lake ecosystems within the HRB.

Acknowledgments

This study was supported by the National Natural Science Foundation of China (NSFC, Grant Nos: 91225301, 91025019 and 41501023). YL acknowledges the support from the US National Science Foundation (1255724), Alabama Water Resources Research Institution Grant, and the Center for Freshwater Studies at the University of Alabama.

Author Contributions

Yue Hu, Yuehan Lu, and Chunmiao Zheng conceived and designed the work plan; Yue Hu and Yuehan Lu wrote the paper; Yue Hu, Yuehan Lu, and Chuankun Liu collected the samples; Peng Shang helped with sample measurements; Peng Shang, Jie Liu and Chuankun Liu revised the manuscript. All authors have made contributions to this work.

Conflicts of Interest

The authors declare no conflict of interest.

References

  1. Cartwright, I. The origins and behaviour of carbon in a major semi-arid river, the Murray River, Australia, as constrained by carbon isotopes and hydrochemistry. Appl. Geochem. 2010, 25, 1734–1745. [Google Scholar] [CrossRef]
  2. Brunet, F.; Gaiero, D.; Probst, J.L.; Depetris, P.J.; Lafaye, F.G.; Stille, P. δ13C tracing of dissolved inorganic carbon sources in Patagonian rivers (Argentina). Hydrol. Process. 2005, 19, 3321–3344. [Google Scholar] [CrossRef]
  3. Jones, J.I.; Young, J.O.; Eaton, J.W.; Moss, B. The influence of nutrient loading, dissolved inorganic carbon and higher trophic levels on the interaction between submerged plants and periphyton. J. Ecol. 2002, 90, 12–24. [Google Scholar] [CrossRef]
  4. Hu, Y.; Lu, Y.; Edmonds, J.W.; Liu, C.; Wang, S.; Das, O.; Liu, J.; Zheng, C. Hydrological and land use control of watershed exports of DOM in a large arid river basin in northwestern China. J. Geophys. Res. Biogeosci. 2016, 121, 466–478. [Google Scholar] [CrossRef]
  5. Liu, W.; Xing, M. Isotopic indicators of carbon and nitrogen cycles in river catchments during soil erosion in the arid Loess Plateau of China. Chem. Geol. 2012, 296, 66–72. [Google Scholar] [CrossRef]
  6. Paerl, H.W.; Valdes, L.M.; Joyner, A.R.; Piehler, M.F.; Lebo, M.E. Solving problems resulting from solutions: Evolution of a dual nutrient management strategy for the eutrophying Neuse River estuary, North Carolina. Environ. Sci. Technol. 2004, 38, 3068–3073. [Google Scholar] [CrossRef] [PubMed]
  7. Doctor, D.H.; Alexander, E.C., Jr.; Petrič, M.; Kogovšek, J.; Urbanc, J.; Lojen, S.; Stichler, W. Quantification of karst aquifer discharge components during storm events through end-member mixing analysis using natural chemistry and stable isotopes as tracers. Hydrogeol. J. 2006, 14, 1171–1191. [Google Scholar] [CrossRef]
  8. Raymond, P.A.; Bauer, J.E.; Caraco, N.F.; Cole, J.J.; Longworth, B.; Petsch, S.T. Controls on the variability of organic matter and dissolved inorganic carbon ages in northeast US rivers. Mar. Chem. 2004, 92, 353–366. [Google Scholar] [CrossRef]
  9. Qin, D.; Qian, Y.; Han, L.; Wang, Z.; Li, C.; Zhao, Z. Assessing impact of irrigation water on groundwater recharge and quality in arid environment using CFCs, tritium and stable isotopes, in the Zhangye Basin, Northwest China. J. Hydrol. 2011, 405, 194–208. [Google Scholar] [CrossRef]
  10. Cheng, G.; Li, X.; Zhao, W.; Xu, Z.; Feng, Q.; Xiao, S.; Xiao, H. Integrated study of the water–ecosystem–economy in the Heihe River Basin. Natl. Sci. Rev. 2014, 1, 413–428. [Google Scholar] [CrossRef]
  11. Li, X.; Cheng, G.; Liu, S.; Xiao, Q.; Ma, M.; Jin, R.; Che, T.; Liu, Q.; Wang, W.; Qi, Y. Heihe Watershed Allied TelemetryExperimental Research (HiWATER): Scientific objectives and experimental design. Bull. Am. Meteorol. Soc. 2013, 94, 1145–1160. [Google Scholar] [CrossRef]
  12. Jiang, P.; Cheng, L.; Li, M.; Zhao, R.; Duan, Y. Impacts of LUCC on soil properties in the riparian zones of desert oasis with remote sensing data: A case study of the middle Heihe River Basin, China. Sci. Total Environ. 2015, 506, 259–271. [Google Scholar] [CrossRef] [PubMed]
  13. Wang, Q.; Li, F.; Zhao, L.; Zhang, E.; Shi, S.; Zhao, W.; Song, W.; Vance, M.M. Effects of irrigation and nitrogen application rates on nitrate nitrogen distribution and fertilizer nitrogen loss, wheat yield and nitrogen uptake on a recently reclaimed sandy farmland. Plant Soil 2010, 337, 325–339. [Google Scholar] [CrossRef]
  14. Johnson, D.; Susfalk, R.; Dahlgren, R.; Klopatek, J. Fire is more important than water for nitrogen fluxes in semi-arid forests. Environ. Sci. Policy 1998, 1, 79–86. [Google Scholar] [CrossRef]
  15. Chen, Z.; Nie, Z.; Zhang, G.; Wan, L.; Shen, J. Environmental isotopic study on the recharge and residence time of groundwater in the Heihe River Basin, Northwestern China. Hydrogeol. J. 2006, 14, 1635–1651. [Google Scholar] [CrossRef]
  16. Zhang, Y.H.; Song, X.F.; Wu, Y.Q. Use of oxygen-18 isotope to quantify flows in the upriver and middle reaches of the Heihe River, Northwestern China. Environ. Geol. 2009, 58, 645–653. [Google Scholar] [CrossRef]
  17. Yang, Q.; Xiao, H.; Zhao, L.; Yang, Y.; Li, C.; Zhao, L.; Yin, L. Hydrological and isotopic characterization of river water, groundwater, and groundwater recharge in the Heihe River Basin, Northwestern China. Hydrol. Process. 2011, 25, 1271–1283. [Google Scholar] [CrossRef]
  18. Zhang, G.; Liu, S.; Xie, Y.; Chen, Z.; Zhang, C.; Wu, Y.; Wu, Q.; Nie, Z.; Shen, J.; Xu, G.; et al. Water Circulation and Groundwater Evolution Pattern in the Endorheic Heihe River Basin, Northwestern China, 1st ed.; Geological Publishing House: Beijing, China, 2005. [Google Scholar]
  19. LaCroix, R.; Keeney, D.; Walsh, L. Potentiometric titration of chloride in plant tissue extracts using the chloride ion electrode. Commun. Soil Sci. Plant Anal. 1970, 1, 1–6. [Google Scholar] [CrossRef]
  20. Das, A.; Krishnaswami, S.; Bhattacharya, S. Carbon isotope ratio of dissolved inorganic carbon (DIC) in rivers draining the Deccan Traps, India: Sources of DIC and their magnitudes. Earth Planet. Sci. Lett. 2005, 236, 419–429. [Google Scholar] [CrossRef]
  21. Akoko, E.; Atekwana, E.A.; Cruse, A.M.; Molwalefhe, L.; Masamba, W.R. River-wetland interaction and carbon cycling in a semi-arid riverine system: The Okavango Delta, Botswana. Biogeochemistry 2013, 114, 359–380. [Google Scholar] [CrossRef]
  22. Meybeck, M. Global chemical weathering of surficial rocks estimated from river dissolved loads. Am. J. Sci. 1987, 287, 401–428. [Google Scholar] [CrossRef]
  23. Sage, R.F.; Monson, R.K. C4 Plant Biology; Academic Press: San Diego, CA, USA, 1999. [Google Scholar]
  24. Mu, C.; Zhang, T.; Wu, Q.; Cao, B.; Zhang, X.; Peng, X.; Wan, X.; Zheng, L.; Wang, Q.; Cheng, G. Carbon and nitrogen properties of permafrost over the Eboling Mountain in the upper reach of Heihe River Basin, Northwestern China. Arct. Antarct. Alp. Res. 2015, 47, 203–211. [Google Scholar] [CrossRef]
  25. Cao, G.; Zheng, C.; Simmons, C.T. Groundwater recharge and mixing in arid and semiarid regions: Heihe River Basin, Northwest China. Acta Geol. Sin. 2016, 90, 971–987. [Google Scholar]
  26. Yao, Y.; Zheng, C.; Liu, J.; Cao, G.; Xiao, H.; Li, H.; Li, W. Conceptual and numerical models for groundwater flow in an arid inland river basin. Hydrol. Process. 2014, 29, 1480–1492. [Google Scholar] [CrossRef]
  27. Sher, Y.; Zaady, E.; Ronen, Z.; Nejidat, A. Nitrification activity and levels of inorganic nitrogen in soils of a semi-arid ecosystem following a drought-induced shrub death. Eur. J. Soil Biol. 2012, 53, 86–93. [Google Scholar] [CrossRef]
  28. Robertson, G.; Groffman, P. Nitrogen transformations. In Soil Microbiology, Ecology, and Biochemistry, 4th ed.; Paul, G., Ed.; Academic Press: Burlington, MA, USA, 2007; pp. 341–364. [Google Scholar]
  29. McCarthy, J.J.; Taylor, W.R.; Taft, J.L. Nitrogenous nutrition of the plankton in the Chesapeake Bay. 1. Nutrient availability and phytoplankton preferences. Limnol. Oceanogr. 1977, 22, 996–1011. [Google Scholar] [CrossRef]
  30. Verhoeven, J.; Arts, H. Nutrient dynamics in small mesotrophic fens surrounded by cultivated land. II. N and P accumulation in plant biomass in relation to the release of inorganic N and P in the peat soil. Oecologia 1987, 72, 557–561. [Google Scholar] [CrossRef] [PubMed]
  31. Boy, J.; Valarezo, C.; Wilcke, W. Water flow paths in soil control element exports in an Andean tropical montane forest. Eur. J. Soil Sci. 2008, 59, 1209–1227. [Google Scholar] [CrossRef]
  32. Wu, B.; Zheng, Y.; Tian, Y.; Wu, X.; Yao, Y.; Han, F.; Liu, J.; Zheng, C. Systematic assessment of the uncertainty in integrated surface water-groundwater modeling based on the probabilistic collocation method. Water Resour. Res. 2014, 50, 5848–5865. [Google Scholar] [CrossRef]
  33. Lecher, A.L.; Fisher, A.T.; Paytan, A. Submarine groundwater discharge in Northern Monterey Bay, California: Evaluation by mixing and mass balance models. Mar. Chem. 2016, 179, 44–55. [Google Scholar] [CrossRef]
  34. Young, M.B.; Gonneea, M.E.; Fong, D.A.; Moore, W.S.; Herrera-Silveira, J.; Paytan, A. Characterizing sources of groundwater to a tropical coastal lagoon in a karstic area using radium isotopes and water chemistry. Mar. Chem. 2008, 109, 377–394. [Google Scholar] [CrossRef]
  35. Lu, Y.H.; Bauer, J.E.; Canuel, E.A.; Chambers, R.M.; Yamashita, Y.; Jaffé, R.; Barrett, A. Effects of land use on sources and ages of inorganic carbon in temperate headwater streams. Biogeochemistry 2014, 119, 275–292. [Google Scholar] [CrossRef]
  36. Zeng, F.W.; Masiello, C.A.; Hockaday, W.C. Controls on the origin and cycling of riverine dissolved inorganic carbon in the Brazos River, Texas. Biogeochemistry 2011, 104, 275–291. [Google Scholar] [CrossRef]
  37. Schmidt, S.; Geyer, T.; Marei, A.; Guttman, J.; Sauter, M. Quantification of long-term wastewater impacts on karst groundwater resources in a semi-arid environment by chloride mass balance methods. J. Hydrol. 2013, 502, 177–190. [Google Scholar] [CrossRef]
  38. Qian, Y.; Wang, L. Applications of Isotope Hydrology Technology in Researches of Water Cycles in the Heihe River Basin, 1st ed.; Yellow River Conservancy Press: Zhengzhou, China, 2008. [Google Scholar]
  39. Ohte, N.; Dahlgren, R.A.; Silva, S.R.; Kendall, C.; Kratzer, C.R.; Doctor, D.H. Sources and transport of algae and nutrients in a Californian river in a semi-arid climate. Freshw. Biol. 2007, 52, 2476–2493. [Google Scholar] [CrossRef]
  40. Lamontagne, S.; Leaney, F.W.; Herczeg, A.L. Patterns in groundwater nitrogen concentration in the riparian zone of a large semi-arid river (River Murray, Australia). River Res. Appl. 2006, 22, 39–54. [Google Scholar] [CrossRef]
  41. Hadwen, W.L.; Fellows, C.S.; Westhorpe, D.P.; Rees, G.N.; Mitrovic, S.M.; Taylor, B.; Baldwin, D.S.; Silvester, E.; Croome, R. Longitudinal trends in river functioning: Patterns of nutrient and carbon processing in three Australian rivers. River Res. Appl. 2010, 26, 1129–1152. [Google Scholar] [CrossRef]
  42. Varol, M. Temporal and spatial dynamics of nitrogen and phosphorus in surface water and sediments of a transboundary river located in the semi-arid region of Turkey. Catena 2013, 100, 1–9. [Google Scholar] [CrossRef]
  43. World Health Organization (WHO). Guidelines for Drinking-Water Quality, 4th ed.; WHO Press: Geneva, Switzerland, 2011. [Google Scholar]
  44. Vollenweider, R.; Kerekes, J. Eutrophication of Waters. Monitoring, Assessment and Control, 1st ed.; Organization for Economic Co-Operation and Development (OECD): Paris, France, 1982. [Google Scholar]
Figure 1. The study area and sampling sites. Panel (a) shows surface water and groundwater sampling stations in the middle Heihe River Basin (HRB), where the contour lines show the groundwater table in elevation relative to sea level; the river flows from SE to NW. Panel (b) shows a conceptual topographic profile (not true to scale) of the Heihe Basin. Panels (c) and (d) represent locations of the study area relative to the entire HRB and China, respectively.
Water 09 00415 g001
Figure 2. Time series of precipitation (P) and daily river discharge (Q) from two gauging stations along the middle Heihe River in 2013. The black rectangles indicate the periods of our two sampling campaigns.
Water 09 00415 g002
Figure 3. Carbon isotope-dissolved organic carbon (δ13C-DIC) values versus DIC concentrations of all samples. The gray rectangles with diagonal lines delineate δ13C-DIC values from various sources based on literature values [1,20]; the dashed line indicates the best-fitting line between δ13C-DIC values versus DIC for the groundwater samples in the alluvial plain. The solid triangles denote DIC characters of other arid rivers in (a) eastern Australia [1]; (b) southern Africa [21]; and (c) Chinese Loess Plateau [5]. The circle encloses shallow groundwater samples in the alluvial plain. Error bars represent the ranges of reference values and the standard deviation of samples collected in duplicate.
Water 09 00415 g003
Figure 4. Longitudinal variation in (a) DIC concentrations; (b) δ13C-DIC values; (c) NOx concentrations; (d) orthophosphate concentrations; and (e) NH4+ concentrations at high discharge and baseflow along the middle reach of the Heihe River. Error bars are the standard deviations of samples collected in duplicate. The dashed line represents the boundary between the alluvial fan and the alluvial plain in the middle HRB.
Water 09 00415 g004
Figure 5. Boxplot comparisons of (a) NOx; (b) NH4+; and (c) orthophosphate concentrations between river water and groundwater within the middle HRB. Different numbers (in italic) above the boxes signify significant differences in nutrient concentrations across water types detected by Mann-Whitney U tests. The medians are shown as the black lines across the boxes, and the means are denoted by the red squares. Boxes show the inter-quantile range (IQR) and whiskers extend to the maximum and minimum values.
Water 09 00415 g005
Figure 6. Loads of DIC, N-NH4+, P-orthophosphate, and N-NOX at gauging stations Railway Bridge and Ban Bridge in (a) July at high discharge and (b) October at baseflow. Note that N-NOX are plotted using the right y-axis.
Water 09 00415 g006
Figure 7. (a) Ca2+ + Mg2+ concentrations vs. SO42− + 1/2 HCO3 concentrations of groundwater samples in the middle HRB. The solid line represents the dedolomitization trend line. (b) The mixing diagrams of river water in the alluvial plain of the middle HRB bound by values of river water at the mountain exit and shallow groundwater (<50 m) in the alluvial plain. The dashed line represents the theoretic mixing line between the two end-members; the solid line denotes the best fitting line between Cl and δ13C-DIC for the river water in the alluvial plain. Error bars of groundwater represent the standard deviation of samples from three different sampling sites. The shaded rectangle at the right bottom represents the assumed range of the unknown upstream end-member in the water mixing analysis using chloride and δ13C-DIC as source tracers (see a further explanation in Section 4.4).
Water 09 00415 g007
Figure 8. Loads of DIC, N-NOx, N-NH4+, and P-orthophosphate in the year 2013 at (a) Railway Bridge and (b) Ban Bridge.
Water 09 00415 g008
Table 1. Comparisons of the fractions of groundwater (fg) contributing to the Heihe River in the alluvial plain using different water tracers.
Tracerfg at Gaoya * (%)fg at Gaotai * (%)Source
High Dischargeδ13C-DIC + Cl9–1824–34The present study
δ18O20–30 a; 23.6 b55–75 a; 60.3 ba Zhang et al., 2005 [18];
b Zhang et al., 2009 [16];
Baseflowδ13C-DIC + Cl39–4451–60The present study
δ18O25–45 a70–80 aa Zhang et al., 2005 [18];
b Zhang et al., 2009 [16];
* Gaoya is ca. 50 km and Gaotai is 120 km downstream from the mountain exit. Please see their locations in Figure 1.

