Advancing Water Footprint Assessment Research: Challenges in Monitoring Progress towards Sustainable Development Goal 6


1
Twente Water Centre, University of Twente, P.O. Box 217, 7500 AE Enschede, The Netherlands
2
Institute of Water Policy, Lee Kuan Yew School of Public Policy, National University of Singapore, 259770 Singapore, Singapore
3
Water Footprint Network, Bezuidenhoutseweg 2, 2594 AV The Hague, The Netherlands
4
Water Resources Management group, Wageningen University, P.O. Box 47, 6700 AA Wageningen, The Netherlands
*
Author to whom correspondence should be addressed.
Water 2017, 9(6), 438; https://doi.org/10.3390/w9060438
Submission received: 31 May 2017
/
Revised: 15 June 2017
/
Accepted: 17 June 2017
/
Published: 19 June 2017
(This article belongs to the Special Issue Water Footprint Assessment)
Abstract
:This special issue is a collection of recent papers in the field of Water Footprint Assessment (WFA), an emerging area of research focused on the analysis of freshwater use, scarcity, and pollution in relation to consumption, production, and trade. As increasing freshwater scarcity forms a major risk to the global economy, sustainable management of water resources is a prerequisite to development. We introduce the papers in this special issue by relating them to Sustainable Development Goal (SDG) number 6 of the United Nations, the goal on water. We will particularly articulate how each paper drives the understanding needed to achieve target 6.3 on water quality and pollution and target 6.4 on water-use efficiency and water scarcity. Regarding SDG 6, we conclude that it lacks any target on using green water more efficiently, and while addressing efficiency and sustainability of water use, it lacks a target on equitable sharing of water. The latter issue is receiving limited attention in research as well. By primarily focusing on water-use efficiency in farming and industries at the local level, to a lesser extent to using water sustainably at the level of total water systems (like drainage basins, aquifers), and largely ignoring issues around equitable water use, understanding of our water problems and proposed solutions will likely remain unbalanced.
1. Introduction
Water Footprint Assessment (WFA) is an emerging research field focused on the analysis of freshwater use, scarcity, and pollution in relation to consumption, production, and trade [1,2]. Such analysis can be conducted from local to global level, using multiple perspectives. It is thereby recognized that a comprehensive understanding of local situations can only be achieved by considering how local economies and their water appropriation are embedded in the global economy. Water-intensive commodities like agricultural, forestry, and mining products are internationally traded, which implies that consumers of these products have water footprints far beyond the places where they live [3]. Since freshwater renewal rates in river basins are limited, translating into an aggregated planetary boundary to freshwater availability, there are limits to our water consumption [4]. Spatial and temporal variabilities in water availability, and uncertainties on precipitation, runoff, and environmental flow requirements, make it difficult to quantify the maximum level for people’s water footprints, at the level of individual river basins and even more so at the aggregated global level. WFA typically considers both the quantitative side of water use (water consumption) and the qualitative side (water pollution), both of which are limited by the carrying capacities of water systems. A key element in WFA is supply-chain thinking, which was previously uncommon in water management. Although consumers and most businesses use modest volumes of water themselves, water use in their supply chains is often considerable; they can thus be instrumental in reducing water use in the supply chain, e.g., by consumption choices and sustainable procurement policy [5]. Since freshwater scarcity is considered a major risk to the global economy in terms of potential impact [6], sustainable management of freshwater resources is a prerequisite for development.
The Sustainable Development Goals (SDGs), adopted by the United Nations General Assembly for the period 2015–2030, as a follow-up to the Millennium Development Goals (MDGs) for the period 2000–2015, include explicit targets regarding the improvement of water quality worldwide and the increase in water-use efficiency and reduction in water scarcity. Goal 6 is fully devoted to water (Table 1).
The first two targets of SDG 6 are a sequel to the targets on improving drinking water and sanitation conditions that were already part of the MDGs. New in SDG 6 is the inclusion of additional targets on improving water quality, reducing water pollution, increasing water-use efficiency, better water management, protecting ecosystems, strengthening international cooperation, and involving local communities. Also new is that the SDGs explicitly refer to all countries in the world, while the MDGs were focused on developing countries. For water this is important, because consumers and producers in industrialized countries significantly contribute to water pollution and water overexploitation as well. Consumers in the US, for instance, have an average water footprint per capita of twice the world average [8]. Besides, as virtual water trade studies have demonstrated, many industrialized regions heavily rely on remote water resources. Three quarters of UK’s total water footprint, for example, lies outside the UK, and half of its total blue water footprint is situated in places outside the country where water consumption levels exceed sustainable levels [9]. This exemplifies the international dimension of the water challenge.
This is the fourth special issue collecting papers to show progress in the field of Water Footprint Assessment. In the years 2010–2011, the journal Water published the first special issue, titled “Water Footprint: Usefulness of the Concept from Accounting Framework to Policy Response Options in Water Resources Management”. In 2013, the journal Water Resources and Industry published the second special issue on Water Footprint Assessment [10]. The third special issue appeared in 2015, in the journal Sustainability [11]. The papers collected in the current issue appeared in 2016 and early 2017 in Water. As a way of introducing these papers, we relate them to SDG 6, the goal on water. We will particularly articulate how each paper drives the understanding needed to achieve targets 6.3 and 6.4. In the next section, we show how the water footprint indicator can be instrumental in monitoring progress towards these two targets. In the third section, we introduce the papers contained in this special issue and show how they address challenges in measuring the efficiency and sustainability of water use. The history of measuring water use, water-use efficiency and water scarcity goes back a few decades, but what is new is that we want to measure those things in relation to specific forms of production and consumption, i.e., in relation to action prospects. This is typically what WFA does: looking at water consumption and pollution in relation to what is produced, traded, and consumed. This is relevant, because, in the end, overall targets on water pollution and scarcity reduction need to be downscaled and attributed to specific (groups of) producers and consumers.
2. How the Water Footprint Can Help to Monitor Progress towards SDG Targets 6.3 and 6.4
The water footprint (WF) is a multi-dimensional indicator, measuring both water consumption (the consumptive WF) and water pollution (the degradative WF). The consumptive WF splits into a green WF, measuring consumption of rainwater, and a blue WF, measuring consumption of groundwater or surface water. Several recent studies split the blue WF up again into a groundwater footprint and a surface water footprint. The degradative WF, also called the grey WF, is a measure of how much water is needed to assimilate polluting substances from human activities. All WF components need to be specified in time and space if one wants to understand possible local implications.
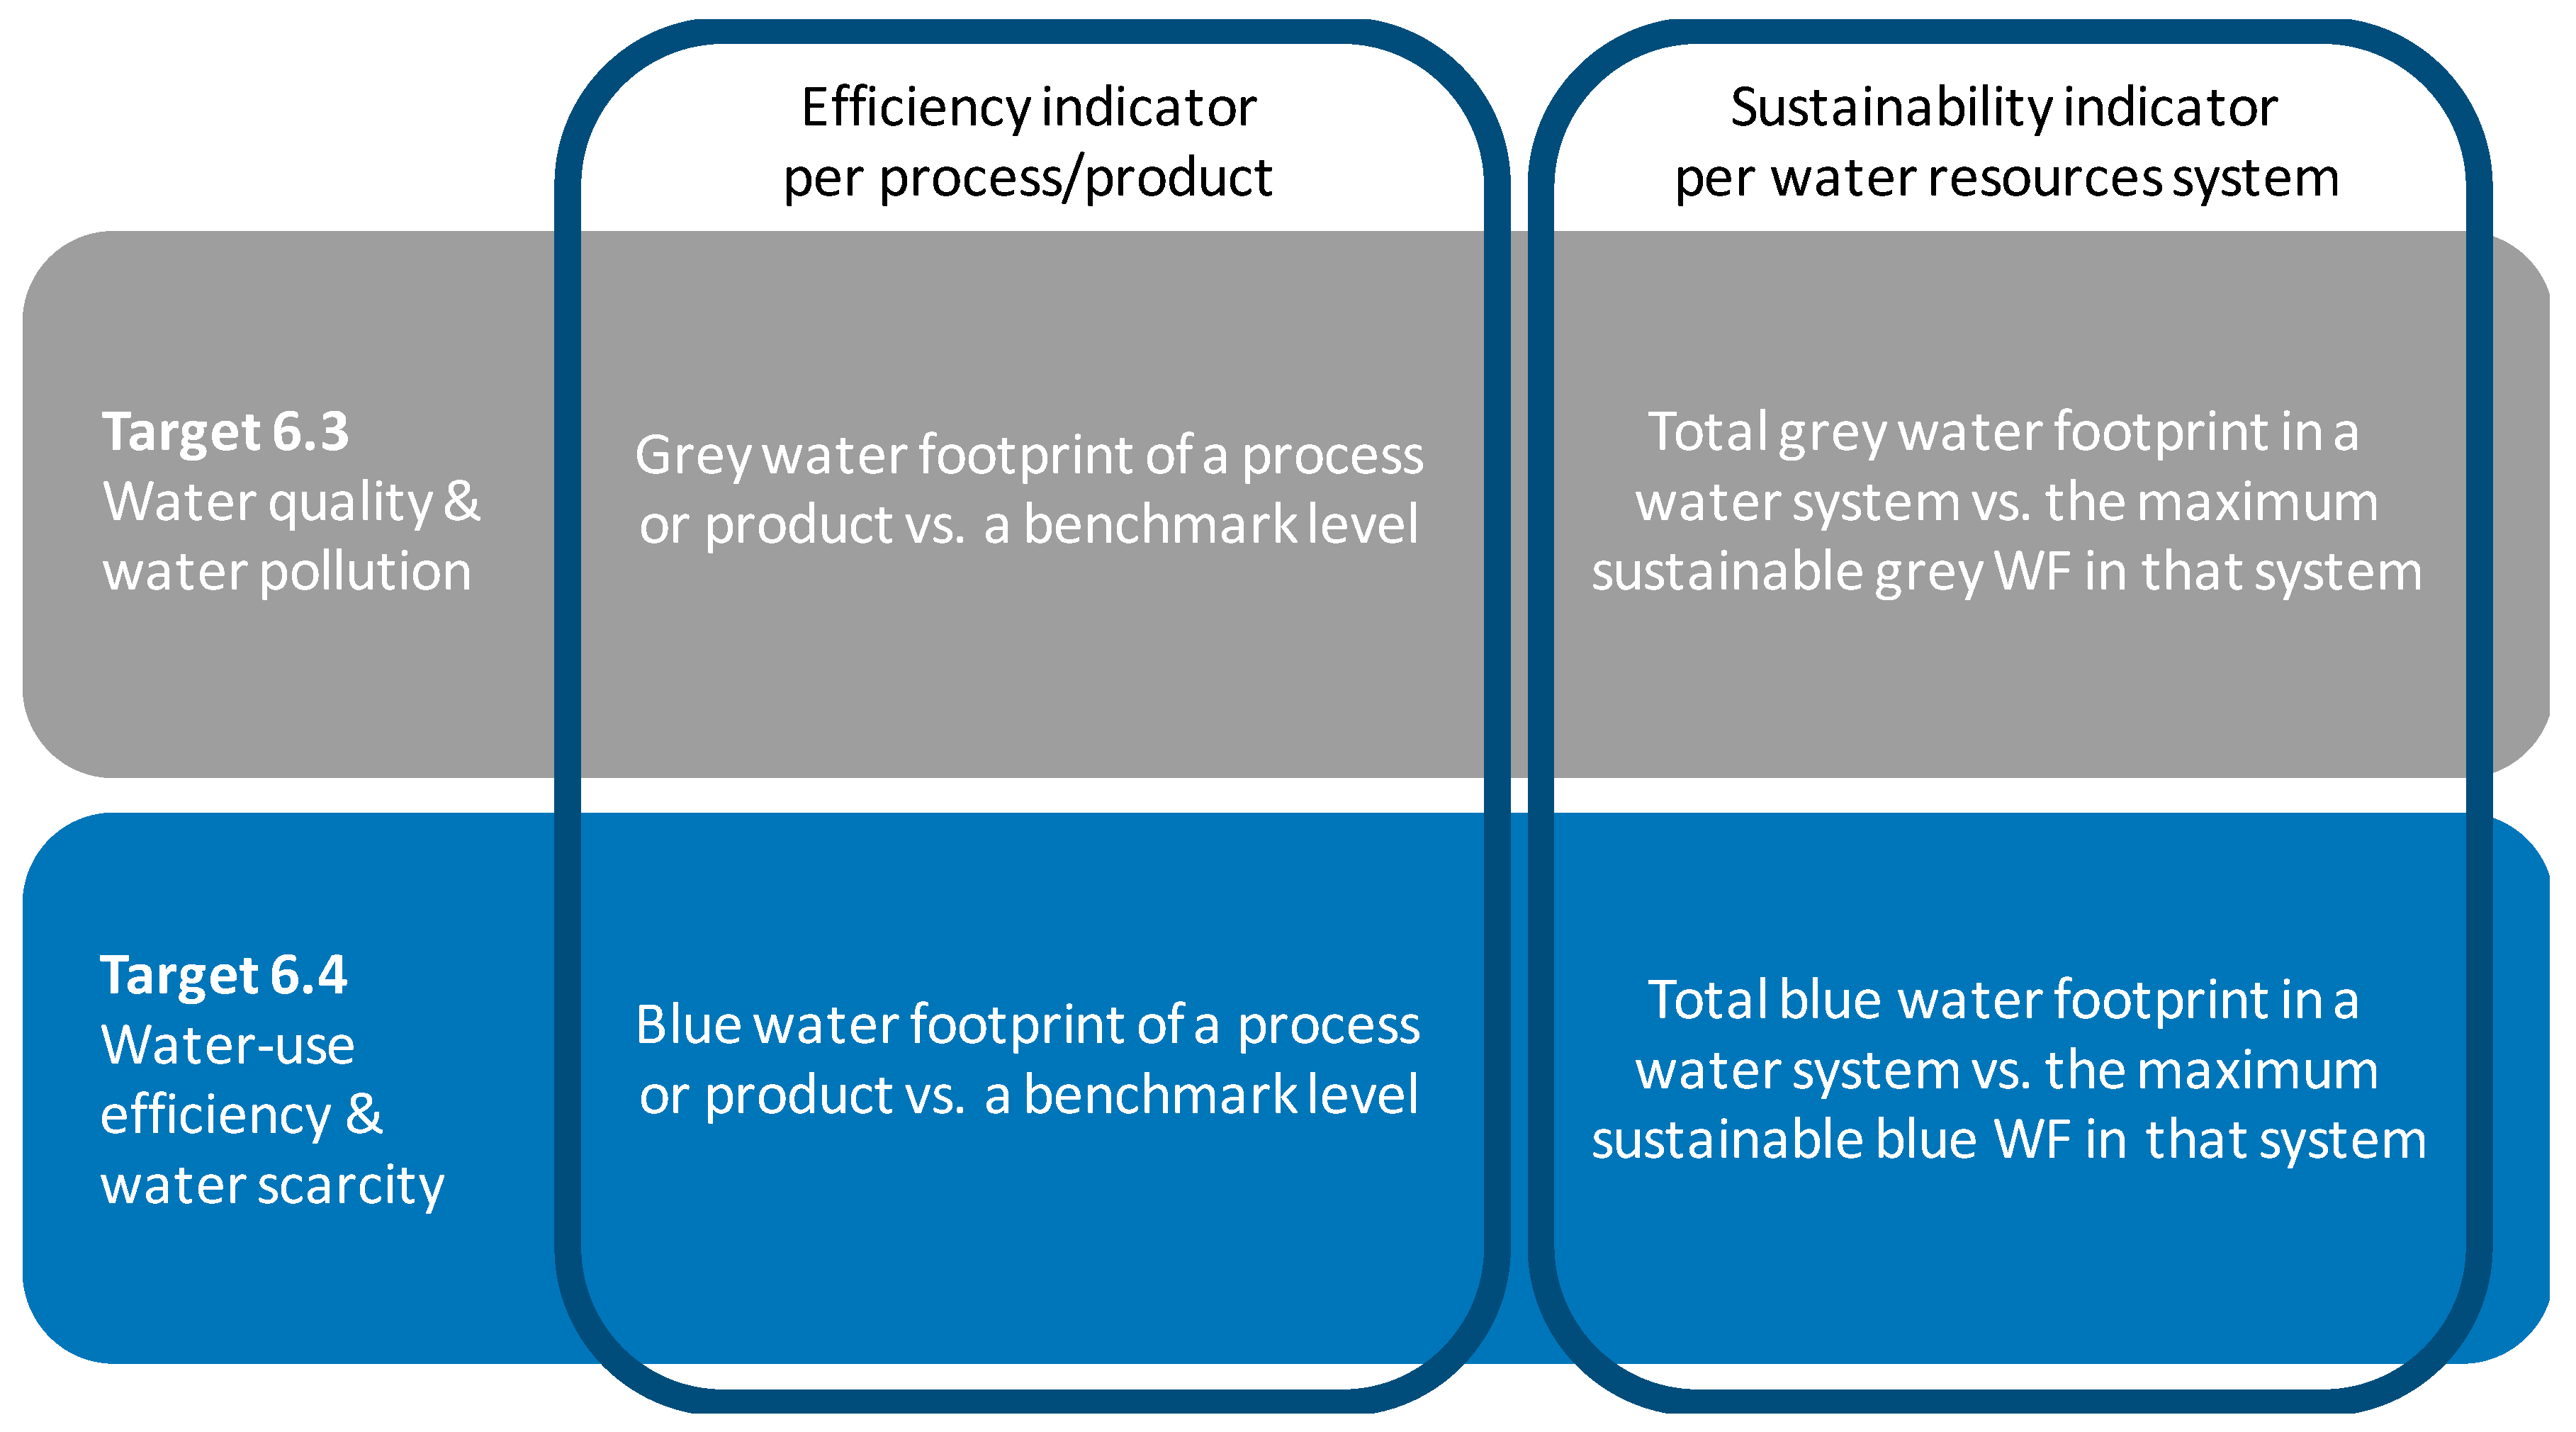
The green, blue, or grey WF of a production process or a product is a volume of water that does not tell much in isolation. Two important questions are: (1) is it a reasonable volume given the type of process or product and available best technology and practices; and (2) does the WF together with the other WFs in a certain catchment exceed the maximum level of what can still be considered sustainable. The first question relates to resource efficiency (what is the water consumption or pollution per unit of process or product), while the second question refers to the sustainability of resource use (does total water consumption exceed water availability or does the total water pollutant load exceed the assimilation capacity of the local freshwater system). Both SDG targets 6.3 and 6.4 contain an efficiency component and a sustainability component (Figure 1).
The grey WF can be a relevant indicator for measuring progress on target 6.3. The grey WF can be expressed in terms of a polluted water volume per unit of a specific process or product. For every process or product that is accompanied with a certain amount of water pollution, we could develop benchmarks that can act as reference levels for what level of pollution is reasonable given available technologies and practices [12]. In industries, where chemicals can be recovered from wastewater (and recycled as in a circular economy), the benchmark level could even be a zero or near-zero grey WF. Since reducing the grey WF in industrial production may come at an energy cost, possible trade-offs involved need to be carefully considered when setting grey WF benchmark levels. Furthermore, benchmarks can evolve over time when new technologies become available. The ultimate purpose of grey WF benchmarks for specific processes and products is to be able to measure progress in relation to certain reference levels.
When we consider the aggregated grey WF of all activities in a water resources system (like a drainage basin or aquifer), we can compare that total to the maximum sustainable grey WF in that system, which equals the amount of water flow available to assimilate waste. In order to reach environmental sustainability, the total grey WF in a catchment or aquifer should reduce over time down to the maximum sustainable level. Grey WFs are computable metrics based on measurable pollutant loads to freshwater and relate to specific processes and products. In this way, the target to improve water quality and reduce water pollution can be attributed to those that are, directly or indirectly, responsible for the pollutant load.
Similarly, the blue WF can be a relevant indicator for measuring progress on target 6.4. The blue WF can be expressed in terms of a water volume consumed per unit of a specific process or product. Given available technologies and practices, we can establish a benchmark for each process or product, which can be function of local conditions like soil or climate as well [13]. In agriculture, the first step is to develop benchmarks for the total consumptive WF, per crop, given local environmental conditions and best management practices. From that, based on available rainwater (green water), the benchmark for blue water consumption can be derived. Furthermore, we can compare the aggregated blue WF of all activities in a water system to the maximum sustainable blue WF in that system, which equals the amount of water flow available for consumption.
3. The Papers in This Special Issue: Measuring Efficiency and Sustainability of Water Use
Thirteen of the fourteen papers in this special issue consider green and blue WFs [14,15,16,17,18,19,20,21,22,23,24,25,26], while eight papers include grey WF estimation. All papers that include the grey WF specifically focus on pollution through nitrogen [14,15,17,19,21,22,25,27]. The only paper that exclusively focuses on the grey WF is the one by Brueck and Lammel [27]. In a case study for N application in winter wheat fields with different topography and soils in Germany, they show the enormous variation in grey WFs in m3 per tonne of wheat, both across the production sites and the years considered. The average WF found is close to that in earlier studies, but the large variation reconfirms that developing grey WF benchmarks (feasible reference levels) and setting practical grey WF reduction targets is highly context specific, whereby climate, soil, and other agronomic conditions need to be taken into account. The variability across growing seasons must be accounted for as well. The study by Brueck and Lammel [27] illustrates that there is the difficulty that nitrogen application to fields can both reduce and increase the grey WF per unit of crop. At low application rates, leaching-runoff rates are still low while crop yields quickly increase with growing fertilizer application, resulting in a decrease in water pollution per unit of crop. For higher application rates, nitrogen surpluses and leaching-runoff become relatively large while crop yields do not rise so much anymore, resulting in an increase in water pollution per unit of crop. Thus, the grey WF per unit of crop first decreases and then increases with growing nitrogen application rates. The grey WF per hectare, however, continuously increases with increasing application rates. This is the reason why “efficiency” and “sustainability” are two different criteria that should be applied complementarily. While “efficiency” can be measured as the WF per unit of crop, “sustainability” is better evaluated by the WF per hectare, to which there is a maximum given the maximum acceptable load in a catchment and the total cropland area.
Several papers in this special issue show the struggle to accurately quantify water consumption and pollution in crop production in practice, which particularly relates to the large variability in time and space of determining factors like weather, soils, and agricultural practices; and to the great uncertainties in data and models. Gobin et al. [14] estimate green, blue and grey WFs for 6 crops in 45 different fields in 15 different European countries over a period of 11 years. Evangelou et al. [15] estimate green, blue and grey WFs of tomato production at 24 farms in the Pinios river basin in Greece over a period of three years. Both studies show a large variability of green, blue and grey WFs across places and years. This variability is due to both differences in environmental conditions (like climate, soil, and topography) and managerial conditions (like irrigation, fertilization, tillage, and mulching practices). Future research needs to discover the contributions from the different factors. When we want to formulate WF benchmarks and set well-defined WF reduction targets for crop production, the challenge is to do so given certain environmental conditions and assuming specified good or best management practices. A complicating factor is the uncertainty in estimating WFs in crop production. This is well illustrated in the paper by Kersebaum et al. [16], who assess uncertainties in WFs of crop production using an ensemble model approach. Their study reveals that the uncertainty of crop yield prediction, arising from the use of different models, contributes more to the uncertainty in the assessment of water-use efficiency and water footprints than the estimation of evapotranspiration. Another paper that aims to better understand the intricacies involved in estimating WFs is the study by Le Roux et al. [17], who do so in a case study for vegetables grown on a water-stressed aquifer in South Africa. They analyze how WF outcomes are influenced by several factors, like natural variations in weather conditions between growing seasons and between different years, and uncertainties related to model parameterization and input data used. They also study difficulties in estimating pollutant loads to groundwater, which is necessary to estimate the grey WF of crop production. The paper by Da Silva et al. [18] on Brazil’s virtual water export and on the virtual water trade flows between states within Brazil shows another difficulty in WF studies: the precise tracing of crops. It is relatively simple to establish whether a region is a net virtual water importer or exporter, but much more difficult to know precise trade flows and thus water dependencies.
Not much used in the water resources field, but well-known in the environmental sciences, is the so-called IPAT equation (I = P × A × T). This equation hypothesizes environmental impact (I) to be the product of three factors: the population size (P), the affluence (A) reflected by the consumption per capita, and a technology factor (T) representing environmental impact per unit of consumption. Growth in P and A will increase demand for food and other goods and thus demand for water to produce those commodities. Overall water consumption and pollution can be reduced on the other hand through a reduction in T, i.e., by reducing water consumption and pollution per unit of consumer product. Whereas the combination of increasing P and A drives a growing water consumption and pollution, T reflects efficiency and can lower water consumption and pollution. In a case study for crop production in the area of Beijing, Jin et al. [19] show the changes in the total grey WF over time and attempt to find the contribution from the three factors P, A, and T. For that purpose, they employ a so-called extended stochastic impact by regression on population, affluence, and technology (STIRPAT) model. In their paper for the Yellow River Basin in China, Yin et al. [20] study the driving factors behind the WF of consumption as well, by correlating different factors representing P, A, or T to the total WF. In a scenario study for Europe, Ercin and Hoekstra [21] consider the effects of population, affluence and technology on Europe’s future water footprint. The study shows that the most critical driver of change that affects the future WF of production and consumption for Europe is the consumption pattern. In a case study comparing Mediterranean and American diets, Blas et al. [22] focus on the effect of the consumption factor, more in particular the composition of people’s diet. The paper by Marrin [23] focusses on the factor A in the IPAT equation as well, in a study on the effectiveness of changing food habits to conserve water resources in the water-scarce state of California. It considers both the shift from animal-based to plant-based foods and the reduction of food waste as ways to reduce local water use, acknowledging though that a significant part of the water footprint within California also relates to production for export, which will not become less of Californians change their food habits. Together, the four studies illustrate the limitation of looking at “efficiency” from the production perspective, because major water consumption and pollution reduction can be achieved by changing consumption patterns.
Davis et al. [24] study the option of increasing water-use efficiency through changing the spatial crop production pattern. They analyze, for the case of the United States, how consumptive water footprints can be reduced by changing where what crops are grown while making sure that current levels of calorie and protein production and income are maintained, and while staying within the currently cultivated land. Most water-use efficiency studies take the crops cultivated as given. By questioning the crops grown in different places, Davis et al. [24] analyze what water savings can be made by reconsidering spatial crop patterns. Interestingly, the study shows that by redistributing crops with the US, the greatest water savings can be achieved in water-stressed regions like California and other western states.
In a study on the water footprint of milk production in the Orange basin in South Africa, Owusu-Sekyere et al. [25] illustrate the possible tension between water-use efficiency and sustainability. In order to increase feed-conversion efficiency, milk cows are increasingly fed with concentrates and silage, derived from crops that partly depend on scarce irrigation water. While the milk production per unit of water used along the supply chain may thus increase, the specific reliance on blue water resources associated with concentrates and silage may contribute to the overexploitation of blue water resources, as is the case part of the year in the Orange basin.
Guzman et al. [26] contribute to the debate on water-use efficiency by pointing at the fact that aiming to increase efficiency by targeting the reduction of the WF of crops per kg bears the risk of damaging traditional farming systems that have been sustainable for decades. They do so by elaborating the case of mango smallholder farmers on the desert coast of Peru. The paper gives the important warning that a single focus on efficiency, without the consideration of other social or cultural factors, could lead to undesired outcomes. Efficiency increase may require intensification and upscaling, thus damaging livelihoods of traditional farmers, while it may be unsustainable as well because of the upscaling of business in an environment that does not allow for that.
4. Conclusions
Considering the papers in this special issue, we observe clear progress in terms of level of advancement. Early WF studies often focused on accounting (quantifying WFs), without adequate consideration of variabilities and uncertainties and without putting numbers in the wider environmental, economic, or social context. The studies by Gobin et al. [14] and Evangelou et al. [15] focus on showing the variability in WFs of crop production, while Kersebaum et al. [16] quantify uncertainties in WF estimations. Some of the papers focus on understanding the driving forces behind increasing WFs [19,20,21,22,23]. While a few papers primarily look at water-use efficiency of production as a way to mitigate water scarcity, a few other papers analyze the role of consumption patterns. The study by Guzmán et al. [26] explicitly points at the risk of focusing on water-use efficiency (WF per unit of product) as the sole metric, putting “inefficient” but traditionally sustainable local practices at risk.
Another observation from this special issue is that—as is generally the case in WF studies—there is more attention given to blue and green WFs than to grey WFs. Thirteen of the fourteen studies consider green and blue WFs, while eight papers cover the grey WF. This is generally the case: as Lovarelli et al. [28] showed in a review of 96 scientific studies on the WF of agricultural production published until 2015, only 46% included the grey WF. Another observation is that most grey WF studies to date refer to grey WF from nitrogen pollution; in our special issue, even all papers focus on nitrogen. We hope that future grey WF research will equally address pollution from other chemicals, like phosphorous and pesticides from crop production, pathogenic and pharmaceutical pollution from humans and livestock, and a large variety of chemicals from industries and households.
While most papers on WF include the green WF component—which makes sense, because most of the water consumption in agriculture and forestry is green water consumption—SDG 6 lacks any target on using green water efficiently. This is an omission, because efficient use of green water resources will be a key element in increasing food production in rain-fed agriculture, thus enabling the reduced food production in irrigated areas located in basins where blue water is currently used at unsustainable rates [29]. In a global analysis, Pradhan et al. [30] estimate that about 80% more crop calories can be produced compared to the total crop calorie produced in 2000 by closing the gap between potential and actual crop yields in current rain-fed croplands. In the same paper, the authors estimate that much less, 24%, increase in crop calories can be expected from irrigated croplands. The potential to use green water resources (rainwater) more productively is thus much greater than the potential to use blue water resources (irrigation water) more productively.
Another omission in SDG 6 is that it includes explicit targets on water-use efficiency and sustainable water use, but it lacks a target on fair sharing of water. This is a topic that is receiving little attention in research as well. There are exceptions, like the work by Seekell et al. [31] and Suweis et al. [32], but the number of studies in this field is relatively small given its relevance. It is easiest to carry out research on water-use efficiency, because there are various well-established metrics. Research on sustainable water use is quickly emerging after the launch of new concepts like the maximum sustainable WF and WF caps per water resources system [29] and planetary boundaries for water [33]. Research on fair or equitable water use is hampered by the fact that fairness is obviously a more normative concept than efficiency and sustainability. The primary focus on water-use efficiency of production processes at local level, however, with secondary attention to using water sustainably at the water system level, while largely ignoring issues around equitable water use, implies that our understanding of water problems and our proposed solutions will likely remain unbalanced.
Acknowledgments
We are grateful to all authors for their contributions, and to all reviewers that have helped to improve the quality of the papers.
Author Contributions
Arjen Y. Hoekstra wrote the draft; all three authors contributed equally to the finalization of the paper.
Conflicts of Interest
The authors declare no conflict of interest.
References
- Hoekstra, A.Y. Water footprint assessment: Evolvement of a new research field. Water Resour. Manag. 2017. [Google Scholar] [CrossRef]
- Zhang, Y.; Huang, K.; Yu, Y.; Yang, B. Mapping of water footprint research: A bibliometric analysis during 2006–2015. J. Clean. Prod. 2017, 149, 70–79. [Google Scholar] [CrossRef]
- Hoekstra, A.Y.; Chapagain, A.K. Water footprints of nations: Water use by people as a function of their consumption pattern. Water Resour. Manag. 2007, 21, 35–48. [Google Scholar] [CrossRef]
- Fang, K.; Heijungs, R.; Duan, Z.; De Snoo, G.R. The environmental sustainability of nations: Benchmarking the carbon, water and land footprints against allocated planetary boundaries. Sustainability 2015, 7, 11285–11305. [Google Scholar] [CrossRef]
- Hoekstra, A.Y. The Water Footprint of Modern Consumer Society; Routledge: London, UK, 2013. [Google Scholar]
- World Economic Forum (WEF). The Global Risks Report 2017, 12th ed.; World Economic Forum: Geneva, Switzerland, 2017. [Google Scholar]
- UN General Assembly. Transforming Our World: The 2030 Agenda for Sustainable Development, Resolution Adopted by the General Assembly on 25 September 2015; United Nations: New York, NY, USA, 2015. [Google Scholar]
- Hoekstra, A.Y.; Mekonnen, M.M. The water footprint of humanity. Proc. Natl. Acad. Sci. USA 2012, 109, 3232–3237. [Google Scholar] [CrossRef] [PubMed]
- Hoekstra, A.Y.; Mekonnen, M.M. Imported water risk: The case of the UK. Environ. Res. Lett. 2016, 11, 055002. [Google Scholar] [CrossRef]
- Zhang, G.P.; Hoekstra, A.Y.; Mathews, R.E. Water Footprint Assessment (WFA) for better water governance and sustainable development. Water Resour. Ind. 2013, 1–2, 1–6. [Google Scholar] [CrossRef]
- Hoekstra, A.Y.; Chapagain, A.K.; Zhang, G.P. Water footprints and sustainable water allocation. Sustainability 2016, 8, 20. [Google Scholar] [CrossRef]
- Mekonnen, M.M.; Hoekstra, A.Y. Water footprint benchmarks for crop production: A first global assessment. Ecol. Indic. 2014, 46, 214–223. [Google Scholar] [CrossRef]
- Zhuo, L.; Mekonnen, M.M.; Hoekstra, A.Y. Benchmark levels for the consumptive water footprint of crop production for different environmental conditions: A case study for winter wheat in China. Hydrol. Earth Syst. Sci. 2016, 20, 4547–4559. [Google Scholar] [CrossRef]
- Gobin, A.; Kersebaum, K.C.; Eitzinger, J.; Trnka, M.; Hlavinka, P.; Takáč, J.; Kroes, J.; Ventrella, D.; Dalla Marta, A.; Deelstra, J.; et al. Variability in the water footprint of arable crop production across European regions. Water 2017, 9, 93. [Google Scholar] [CrossRef]
- Evangelou, E.; Tsadilas, C.; Tserlikakis, N.; Tsitouras, A.; Kyritsis, A. Water footprint of industrial tomato cultivations in the Pinios river basin: Soil properties interactions. Water 2016, 8, 515. [Google Scholar] [CrossRef]
- Kersebaum, K.C.; Kroes, J.; Gobin, A.; Takáč, J.; Hlavinka, P.; Trnka, M.; Ventrella, D.; Giglio, L.; Ferrise, R.; Moriondo, M.; et al. Assessing uncertainties of water footprints using an ensemble of crop growth models on winter wheat. Water 2016, 8, 571. [Google Scholar] [CrossRef]
- Le Roux, B.; van der Laan, M.; Vahrmeijer, T.; Annandale, J.G.; Bristow, K.L. Estimating water footprints of vegetable crops: Influence of growing season, solar radiation data and functional unit. Water 2016, 8, 473. [Google Scholar]
- Da Silva, V.P.R.; de Oliveira, S.D.; Hoekstra, A.Y.; Dantas Neto, J.; Campos, J.H.B.C.; Braga, C.C.; de Araújo, L.E.; Aleixo, D.O.; de Brito, J.I.B.; de Souza, M.D.; et al. Water footprint and virtual water trade of Brazil. Water 2016, 8, 517. [Google Scholar] [CrossRef]
- Jin, C.; Huang, K.; Yu, Y.; Zhang, Y. Analysis of influencing factors of water footprint based on the STIRPAT model: Evidence from the Beijing agricultural sector. Water 2016, 8, 513. [Google Scholar] [CrossRef]
- Yin, J.; Wang, H.; Cai, Y. Water footprint calculation on the basis of input–output analysis and a biproportional algorithm: A case study for the Yellow River Basin, China. Water 2016, 8, 363. [Google Scholar] [CrossRef]
- Ercin, A.E.; Hoekstra, A.Y. European water footprint scenarios for 2050. Water 2016, 8, 226. [Google Scholar] [CrossRef]
- Blas, A.; Garrido, A.; Willaarts, B.A. Evaluating the water footprint of the Mediterranean and American diets. Water 2016, 8, 448. [Google Scholar] [CrossRef]
- Marrin, D.L. Using water footprints to identify alternatives for conserving local water resources in California. Water 2016, 8, 497. [Google Scholar] [CrossRef]
- Davis, K.F.; Seveso, A.; Rulli, M.C.; D’Odorico, P. Water savings of crop redistribution in the United States. Water 2017, 9, 83. [Google Scholar] [CrossRef]
- Owusu-Sekyere, E.; Scheepers, M.E.; Jordaan, H. Water footprint of milk produced and processed in South Africa: Implications for policy-makers and stakeholders along the dairy value chain. Water 2016, 8, 322. [Google Scholar] [CrossRef]
- Guzmán, C.D.; Verzijl, A.; Zwarteveen, M. Water footprints and ‘pozas’: Conversations about practices and knowledges of water efficiency. Water 2017, 9, 16. [Google Scholar] [CrossRef]
- Brueck, H.; Lammel, J. Impact of fertilizer N application on the grey water footprint of winter wheat in a NW-European temperate climate. Water 2016, 8, 356. [Google Scholar] [CrossRef]
- Lovarelli, D.; Bacenetti, J.; Fiala, M. Water Footprint of crop productions: A review. Sci. Total Environ. 2016, 548–549, 236–251. [Google Scholar] [CrossRef] [PubMed]
- Hoekstra, A.Y. Sustainable, efficient and equitable water use: The three pillars under wise freshwater allocation. WIREs Water 2014, 1, 31–40. [Google Scholar] [CrossRef]
- Pradhan, P.; Fischer, G.; van Velthuizen, H.; Reusser, D.E.; Kropp, J.P. Closing yield gaps: How sustainable can we be? PLoS ONE 2015, 10, e0129487. [Google Scholar] [CrossRef] [PubMed]
- Seekell, D.A.; D’Odorico, P.; Pace, M.L. Virtual water transfers unlikely to redress inequality in global water use. Environ. Res. Lett. 2011, 6, 024017. [Google Scholar] [CrossRef]
- Suweis, S.; Konar, M.; Dalin, C.; Hanasaki, N.; Rinaldo, A.; Rodriguez-Iturbe, I. Structure and controls of the global virtual water trade network. Geophys. Res. Lett. 2011, 38, L10403. [Google Scholar] [CrossRef]
- Steffen, W.; Richardson, K.; Rockström, J.; Cornell, S.E.; Fetzer, I.; Bennett, E.M.; Biggs, R.; Carpenter, S.R.; de Vries, W.; de Wit, C.A.; et al. Planetary boundaries: Guiding human development on a changing planet. Science 2015, 347, 736. [Google Scholar] [CrossRef] [PubMed]
Figure 1.
Using water footprint metrics to monitor progress towards SDG targets 6.3 and 6.4.

Table 1.
The targets of Sustainable Development Goal 6. Source: UN General Assembly [7].
Table 1.
The targets of Sustainable Development Goal 6. Source: UN General Assembly [7].
| Goal 6 | Ensure Availability and Sustainable Management of Water and Sanitation for All |
|---|---|
| Target 6.1 | By 2030, achieve universal and equitable access to safe and affordable drinking water for all |
| Target 6.2 | By 2030, achieve access to adequate and equitable sanitation and hygiene for all and end open defecation, paying special attention to the needs of women and girls and those in vulnerable situations |
| Target 6.3 | By 2030, improve water quality by reducing pollution, eliminating dumping and minimizing release of hazardous chemicals and materials, halving the proportion of untreated wastewater and substantially increasing recycling and safe reuse globally |
| Target 6.4 | By 2030, substantially increase water-use efficiency across all sectors and ensure sustainable withdrawals and supply of freshwater to address water scarcity and substantially reduce the number of people suffering from water scarcity |
| Target 6.5 | By 2030, implement integrated water resources management at all levels, including through transboundary cooperation as appropriate |
| Target 6.6 | By 2020, protect and restore water-related ecosystems, including mountains, forests, wetlands, rivers, aquifers, and lakes |
| Target 6.a | By 2030, expand international cooperation and capacity-building support to developing countries in water- and sanitation-related activities and programs, including water harvesting, desalination, water efficiency, wastewater treatment, recycling, and reuse technologies |
| Target 6.b | Support and strengthen the participation of local communities in improving water and sanitation management |
© 2017 by the authors. Licensee MDPI, Basel, Switzerland. This article is an open access article distributed under the terms and conditions of the Creative Commons Attribution (CC BY) license (http://creativecommons.org/licenses/by/4.0/).
Share and Cite
MDPI and ACS Style
Hoekstra, A.Y.; Chapagain, A.K.; Van Oel, P.R. Advancing Water Footprint Assessment Research: Challenges in Monitoring Progress towards Sustainable Development Goal 6. Water 2017, 9, 438. https://doi.org/10.3390/w9060438
AMA Style
Hoekstra AY, Chapagain AK, Van Oel PR. Advancing Water Footprint Assessment Research: Challenges in Monitoring Progress towards Sustainable Development Goal 6. Water. 2017; 9(6):438. https://doi.org/10.3390/w9060438
Chicago/Turabian StyleHoekstra, Arjen Y., Ashok K. Chapagain, and Pieter R. Van Oel. 2017. "Advancing Water Footprint Assessment Research: Challenges in Monitoring Progress towards Sustainable Development Goal 6" Water 9, no. 6: 438. https://doi.org/10.3390/w9060438
Note that from the first issue of 2016, this journal uses article numbers instead of page numbers. See further details here.