Article

Spatial Variation, Pollution Assessment and Source Identification of Major Nutrients in Surface Sediments of Nansi Lake, China

1
Key Laboratory of Water Cycle & Related Land Surface Processes, Institute of Geographic Sciences and Natural Resources Research, Chinese Academy of Sciences, 11A, Datun Road, Chaoyang District, Beijing 100101, China
2
University of Chinese Academy of Sciences, Beijing 100049, China
3
State Key Laboratory of Water Resources and Hydropower Engineering Science, Wuhan University, No. 8 Donghu South Road, Wuhan 430072, China
4
School of Resources and Environment, University of Jinan, Jinan 250022, China
*
Authors to whom correspondence should be addressed.
Water 2017, 9(6), 444; https://doi.org/10.3390/w9060444
Submission received: 12 May 2017 / Revised: 10 June 2017 / Accepted: 12 June 2017 / Published: 20 June 2017

Abstract

:
Nansi Lake has been seriously affected by intensive anthropogenic activities in recent years. In this study, an extensive survey on spatial variation, pollution assessment as well as the possible sources identification of major nutrients (Total phosphorus: TP, Total nitrogen: TN, and Total organic carbon: TOC) in the surface sediments of Nansi Lake was conducted. Results showed that the mean contents of TP, TN and TOC were 1.13-, 5.40- and 2.50- fold higher than their background values respectively. Most of the TN and TOC contents in the surface sediments of Nansi Lake were four times as high or higher and twice as high or higher than the background values except the Zhaoyang sub-lake, and the spatial distribution of TN and TOC contents were remarkably similar over a large area. Nearly all the TP contents in the surface sediments of Nansi Lake were all higher than its background values except most part of the Zhaoyang sub-lake. Based on the enrichment factor (EF) and the organic pollution evaluation index (Org-index), TP, TOC and TN showed minor enrichment (1.13), minor enrichment (2.50) and moderately severe enrichment (5.40), respectively, and most part of the Dushan sub-lake and the vicinity of the Weishan island were in moderate or heavy sediments organic pollution, while the other parts were clean. Moreover, according to the results of multivariate statistical analysis, we deduced that anthropogenic TN and TOC were mainly came from industrial sources including enterprises distributed in Jining, Yanzhou and Zoucheng along with iron and steel industries distributed in the southern of the Weishan sub-lake, whereas TP mainly originated from runoff and soil erosion coming from agricultural lands located in Heze city and Weishan island, the local aquacultural activities as well as the domestic sewage discharge of Jining city.

1. Introduction

Phosphorus, nitrogen, and carbon are the sources of nutrients that can cause eutrophication when excessive [1,2]. Because of adsorption, hydrolysis and co-precipitation, only a small part of free ions dissolved in water, and many of the pollutants settle down in the sediments [3]. Nutrients in the sediments may be released to water under certain condition and then form the endogenous load. As a result, the importance of lake sediments as a nutrient sink and source has long been recognized [3]. The analysis of nutrients in sediments is therefore a useful method to evaluate the lake pollution status in aquatic systems.
Nansi Lake is the largest freshwater lake in Shandong Province, China, which plays an important role in storage and regulation capacity of the South-to-North Water Diversion Project (eastern route). The eastern sub-catchment of the lake is for supporting industries, and the western sub-catchment has mainly been developed for agriculture, fishery and sideline production. Previous research has implied that the contents of TN, TP and TOC have been progressively augmented over time according to the analysis of sediments cores sampled in Nansi Lake [4,5,6,7]. Agricultural, aquacultural and industrial activities have been increasingly intensified at an unprecedented rate in Nansi Lake catchment since the Reform and Open Policy of China [8,9], leading to a series of environmental issues along with significant contribution to local gross domestic product. Therefore, an extensive survey on spatial variation, pollution assessment and possible sources identification of major nutrients (TP, TN and TOC) in the surface sediments of Nansi Lake was conducted.
The main objectives of this study were to: (a) characterize the spatial variation of TP, TN and TOC, (b) evaluate the degree of surface sediments organic pollution for determining key areas to be controlled in the future, and (c) identify possible sources of TN, TP and TOC for the purpose of pollution sources control.

2. Materials and Methods
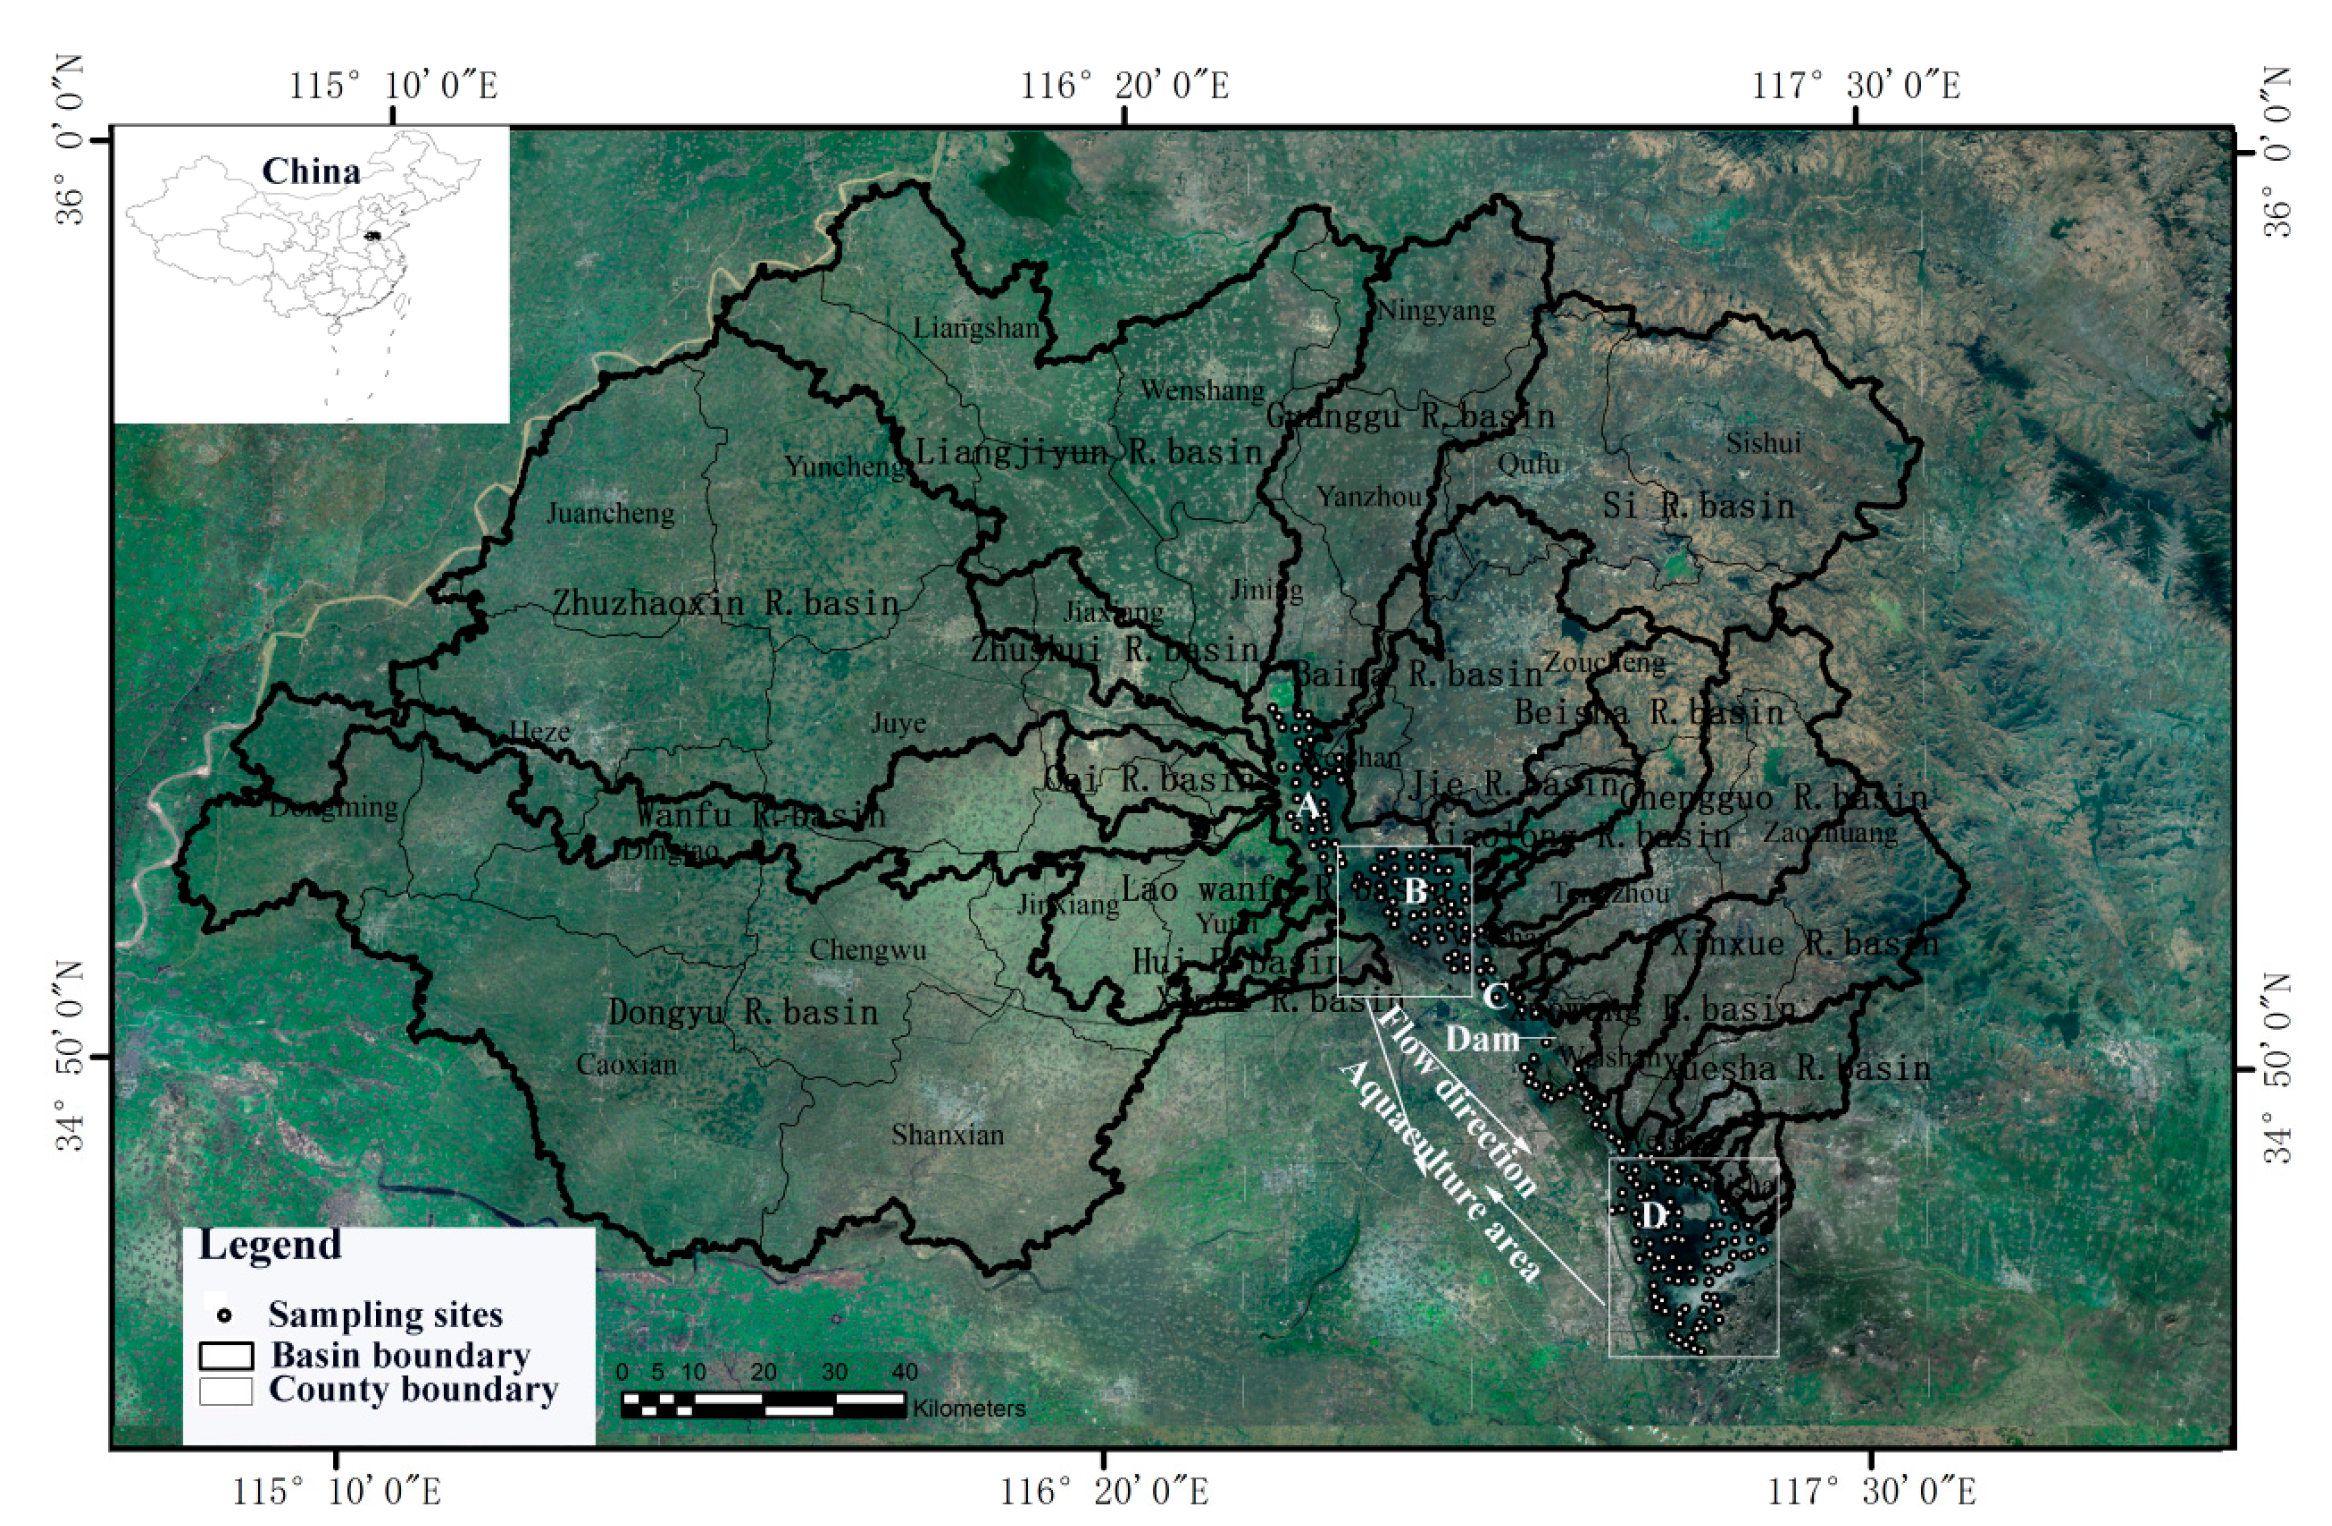
2.1. Study Area

Nansi Lake (34°27–35°20 N, 116°34–117°21 E) that consists of four sub-lakes (Nanyang, Dushan, Zhaoyang and Weishan) from north to south is situated at the southwestern part of Shandong Province, China. The total area is about 1.2 × 10³ km2 with 126 km in length from south to north and 5–25 km in width from east to west, and the average depth is 1.46 m. In 1960 when a dam was built in the middle of the Zhaoyang sub-lake, Nansi Lake was then divided into the upper lake (north part) and the lower lake (south part) (Figure 1) [10]. The whole catchment area is 30.4 × 10³ km2, among which the western sub-catchment is the Yellow River Floodplain between the course of the Yellow River and ancient Yellow River bed with flat topography, while the eastern sub-catchment is mainly composed of alluvial plain with scattered outcropping Cambrian and Ordovician calcareous hills and mountains. Nansi Lake is recharged primarily by precipitation and drains out from the south. It is growing into the main freshwater fishery production base due to its fertile water and wide lake surface [9]. The aquacultural areas are mainly distributed in the Dushan and Weishan sub-lakes (Figure 1), which potentially bring a high nutrient load into the lake.

2.2. Sediments Sampling and Elements Analysis

A total of 210 surface (0–5 cm) sediments samples were collected from Nansi Lake in June 2012 (Figure 1) using a gravity corer, and sealed in self-sealing plastic bags with marked labels and then taken to the laboratory. They were air-dried at room temperature (25–28 °C) and then passed through 10-mesh polyethylene sieve to remove stones and other debris. A portion (about 50 g) was ground in an agate grinder and sieved through 100-mesh polyethylene sieve before chemical analysis.
All analyses were completed in the lab of the Wuhan Inspection and Testing Center of Geology and Mineral Resources, which is a subordinate research institute of the Ministry of Land and Resources of China. About 0.25 g subsamples were digested in Teflon vessels with HNO3–HF–HClO4 mixture in a microwave oven, and then the sample solutions were filtered and further adjusted to a suitable volume with double deionized water. The total concentrations of Cd, Pb, Ti, V, Cu, Zn, Fe2O3, Al2O3 and Cr were analyzed using inductively coupled plasma-atomic emission spectrometry (ICP-AES, JY38S, Longumeau, France). Hg and As were analyzed by atomic fluorescence spectrometry (AFS, AFS-230E, Beijing, China) [11]. The analytical data was guaranteed using quality assurance and quality control (QA/QC), through analyzing reagent blanks, duplicate samples and standard reference materials (GSS-1, GSS-8, GSS-10 and GSS-11) for each batch of samples. TP was determined by the ascorbic acid method (HCl–HNO3–HClO4) using inductively coupled plasma-atomic emission spectrometry (ICP-OES). TN was determined using semi-micro Kjeldahl after digested by H2SO4 and HClO4. Total organic carbon (TOC) was analyzed by oil bath-K2CrO7 titration [12]. All samples were analyzed in triplicate. The analytical precision for replicate samples was within ±10% and the measurement errors between determined and certified values were less than 5%.

2.3. Exploratory Statistical Analysis and Data Transformation

The descriptive parameters of data sets were analyzed using SPSS 16.0 software, such as maximum (Max), minimum (Min), mean, median (Med), standard deviation (S.D.) and coefficient of variation (C.V.). A statistical test of the Kolmogorov–Smirnov (K-S) method was applied to evaluate the normality of data sets [13]. A normal distribution is desirable in conventional statistics and linear geo-statistics [14,15], as the high skewness and outliers can endanger the spatial continuity of the variogram function. Therefore, data transformation was necessary especially in geo-statistical analysis [14,16]. A logarithmic transformation and the Box—Cox transformation was applied in order to normalize skewed data sets in this study. The obvious outliers (extreme values) were rejected according to the PaūTa criterion, which meant the data sets should not exceed the range by its mean value with adding and subtracting three times of its standard deviation [17].

2.4. Geo-Statistical Analysis

Geo-statistics was applied to describe the spatial variation of nutrients contents and the organic pollution evaluation index in this study. It uses the technique of variogram (or semi-variogram) to measure the spatial variability of major nutrients, and provides input parameters for the spatial interpolation of kriging [18,19]. The semi-variogram can be expressed as:
γ ( h ) = 1 2 E [ z ( x ) z ( x + h ) ] 2
The usual computing equation for the variogram is
γ ( h ) = 1 2 N ( h ) i = 1 N ( h ) [ z ( x i ) z ( x i + h ) ] 2
where γ ( h ) is the semivariance at a given distance h ; z ( x i ) is the value of variable z at location x i , h is the lag distance, and N ( h ) is the number of pairs of sample points separated by h .
Among the estimation methods, ordinary kriging is the most popular one, which “is a collection of generalized linear regression techniques for minimizing and estimating variance defined from a prior model for a covariance” [20]. It can not only reveal the overall trend of the data [20,21] but also provide useful visual displays of the spatial variability [22]. A variogram plot is obtained by calculating values of the variogram at different lag distances. These values are usually fitted with a theoretical model, such as spherical or exponential models. The fitted model provides information about the spatial structure as well as the input parameters for ordinary kriging. The geo-statistical analysis was performed with the VARIOWIN 2.2 [23] program in this study.

2.5. Sediments Nutrients Pollution Evaluation

Background values play an important role in the interpretation of geochemical data. Although the average shale values or average crustal abundance are often used, the best alternative is to compare the contents of polluted and mineralogically and texturally comparable sediments with unpolluted ones [8,24]. The survey data in the main stream sediments of the Yellow River were regarded as the background levels in this study with the consideration that Nansi Lake originated from the flooding of Yellow River [9,25], which has already gained general recognition in China. The sediments nutrients pollution was then evaluated by the enrichment factor (EF) and the organic pollution evaluation index (Org-index) [26,27].
The enrichment factor is the ratio between the monitored and the background values. The EF index can be classified as no enrichment (EF < 1), minor enrichment (1 ≤ EF < 3), moderate enrichment (3 ≤ EF < 5), moderately severe enrichment (5 ≤ EF < 10), severe enrichment (10 ≤ EF < 25), very severe enrichment (25 ≤ EF < 50), and extremely severe enrichment (EF > 50) [24].
Organic matter plays an important role in the migration and transformation of nutrients. Related studies have shown that carbon, nitrogen and phosphorous could be released from the sediments in the process of organic matter mineralization when there was enough oxygen [28]. So the Org-index was used to evaluate sediments organic pollution of Nansi Lake, defined by the following equations:
Org - index = TOC ( % ) × Org - N ( % )
Org - N ( % ) = TN ( % ) × 0 . 95
where TOC (%) is the weight percentage of organic carbon; Org-N (%) is the weight percentage of organic nitrogen, which is equal to the weight percentage of TN times 0.95. The Org-index consists of four pollution levels: Org-index < 0.05, unpolluted (class 1); 0.05 < Org-index < 0.35, unpolluted to moderately polluted (class 2); 0.35 < Org-index < 0.75, moderately polluted (class 3); Org-index > 0.75, heavily polluted (class 4) [27].

2.6. Statistical Analysis

In this study, the range, quartiles (5, 25, 50, 75 and 95%), mean, and standard deviation (S.D.) of the data were calculated to characterize each index. All statistical analyses were performed by SPSS 16.0 software. Possible sources of the nutrients were identified using principle component analysis (PCA) and cluster analysis (CA) techniques.
PCA was interpreted in accordance with the hypothetical source of elements (lithogenic, anthropogenic or mixed). Varimax rotation was applied because it minimized the number of variables with a high loading on each component and facilitated the interpretation of results [29]. The contents of elements in sediments were first standardized through z-scale transformation to facilitate the interpretation of the results and avoid misclassification due to wide differences in data dimensionality [30], and then Kaiser-Meyer-Olkin (KMO) and Bartlett’s sphericity tests were performed to examine the suitability of the data for PCA [31]. A high KMO value (close to 1) generally indicated that principal components may be useful (in this study, KMO = 0.85). Bartlett’s test of sphericity indicated whether a correlation matrix was an identity matrix and thus the variables were unrelated or not. The significance level of 0 in this study (less than 0.05) indicated that there were significant relationships among the variables. PCA results would vary considerably depending on whether the covariance or correlation matrix was used. In this study, the PCA was calculated based on the correlation matrix because the contents of the elements varied by several orders of magnitude [32]. By extracting the eigenvalues and eigenvectors from the correlation matrix, the number of significant factors and the percent of variance explained by each of them were calculated.
CA classified a set of observations into two or more mutually exclusive unknown groups based on a combination of internal variables [33]. It was undertaken according to the between-groups linkage method. The results were shown in a dendrogram where steps in the hierarchical clustering solution and values of the distances among clusters (squared Euclidean distance) were represented. In order to explore the interrelationship and correlation of the data, CA was usually coupled with PCA to check the results and to group individual variables [34].

3. Results and Discussion

3.1. Nutrients Contents in the Surface Sediments of Nansi Lake

The nutrients in the surface sediments of Nansi Lake and its commonly used descriptive statistics along with the p-value of Kolmogorov-Smimov test for normality were showed in Table 1. The distributions of TP, TN and TOC were in the ranges of 0.39–1.37 g kg−1, 0.34–7.68 g kg−1 and 0.16–9.06%, respectively. The mean contents of TP, TN and TOC all exceeded the background values as high as 1.13, 5.40 and 2.50 times, respectively, besides, they were also higher than the lowest standards released by the Ministry of Environment and Energy, Ontario, Canada.
The C.V. value was usually used for describing global variability. Generally, it exhibited weak global variability if less than 0.1, moderate global variability if ranging from 0.1 to 1, and strong global variability if larger than 1 [35]. In this study, TN, TOC and TP had C.V. values of 0.63, 0.74 and 0.15, respectively, indicating moderate global variability. One would expect that the elements dominated by a natural source may have a low C.V., while the C.V. values of those influenced by anthropogenic sources would be quite high [36,37]. Therefore, the TN, TOC and TP in the surface sediments of Nansi Lake have been influenced by anthropogenic activities.
The sediments quality guidelines (SQGs) issued by the Ministry of Environment and Energy, Ontario, Canada specified three sediments pollution levels that could be expected to result in different potential effects (i.e., no effect level, the lowest effect level and severe effect level) [38]. The bulk sediments that have nutrient contents below or at the lowest effect levels (0.55 g/kg, 0.6 g/kg and 1% for TP, TN and TOC, respectively) can be regarded as “unpolluted or only marginally polluted”; sediments contents that range between the lowest and the severe effect levels (4.8 g/kg, 2 g/kg and 10% for TP, TN and TOC, respectively) correspond to “moderately polluted”, and those at or above the severe effect levels indicate “heavily polluted”. When compared with the Ontario SQGs, about 75% (TP), 95% (TN) and 80% (TOC) of the samples from Nansi Lake fell into the range between the lowest and the severe effect levels. That is, the pollution risk of Nansi Lake was probably due to the contents of TN, TP and TOC in the surface sediments, which may also threaten the health of sediments-dwelling organisms [38].

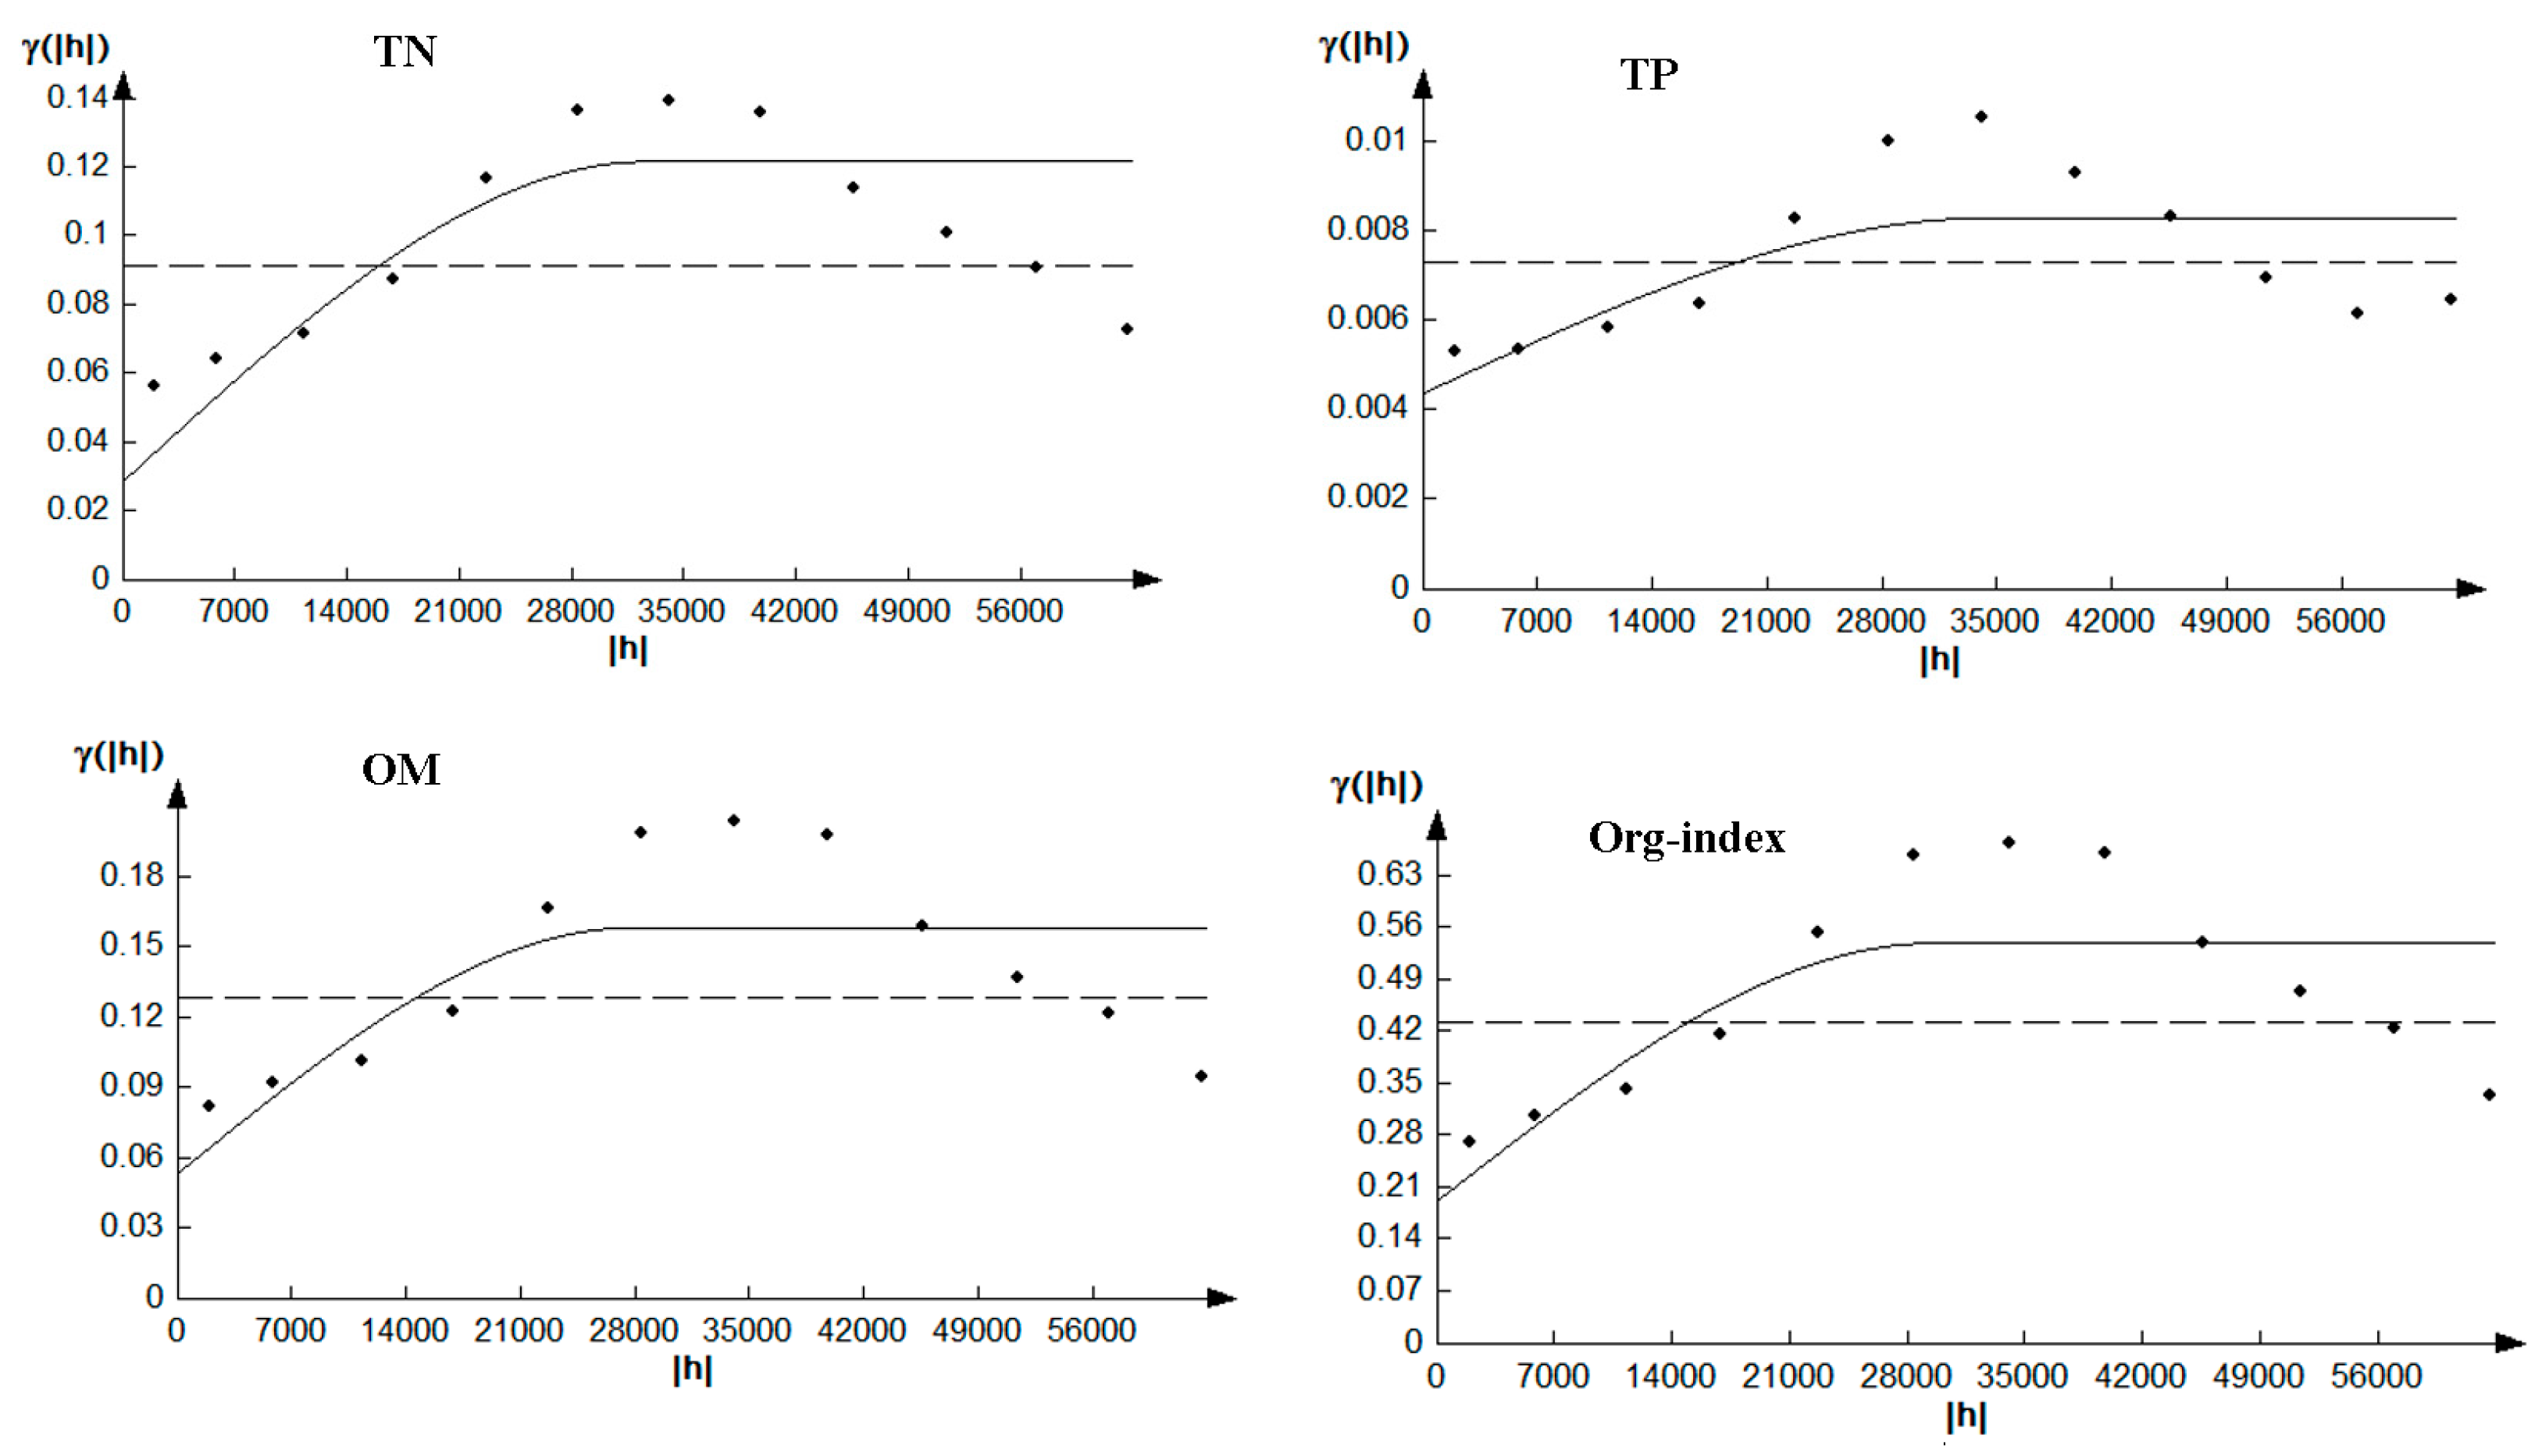
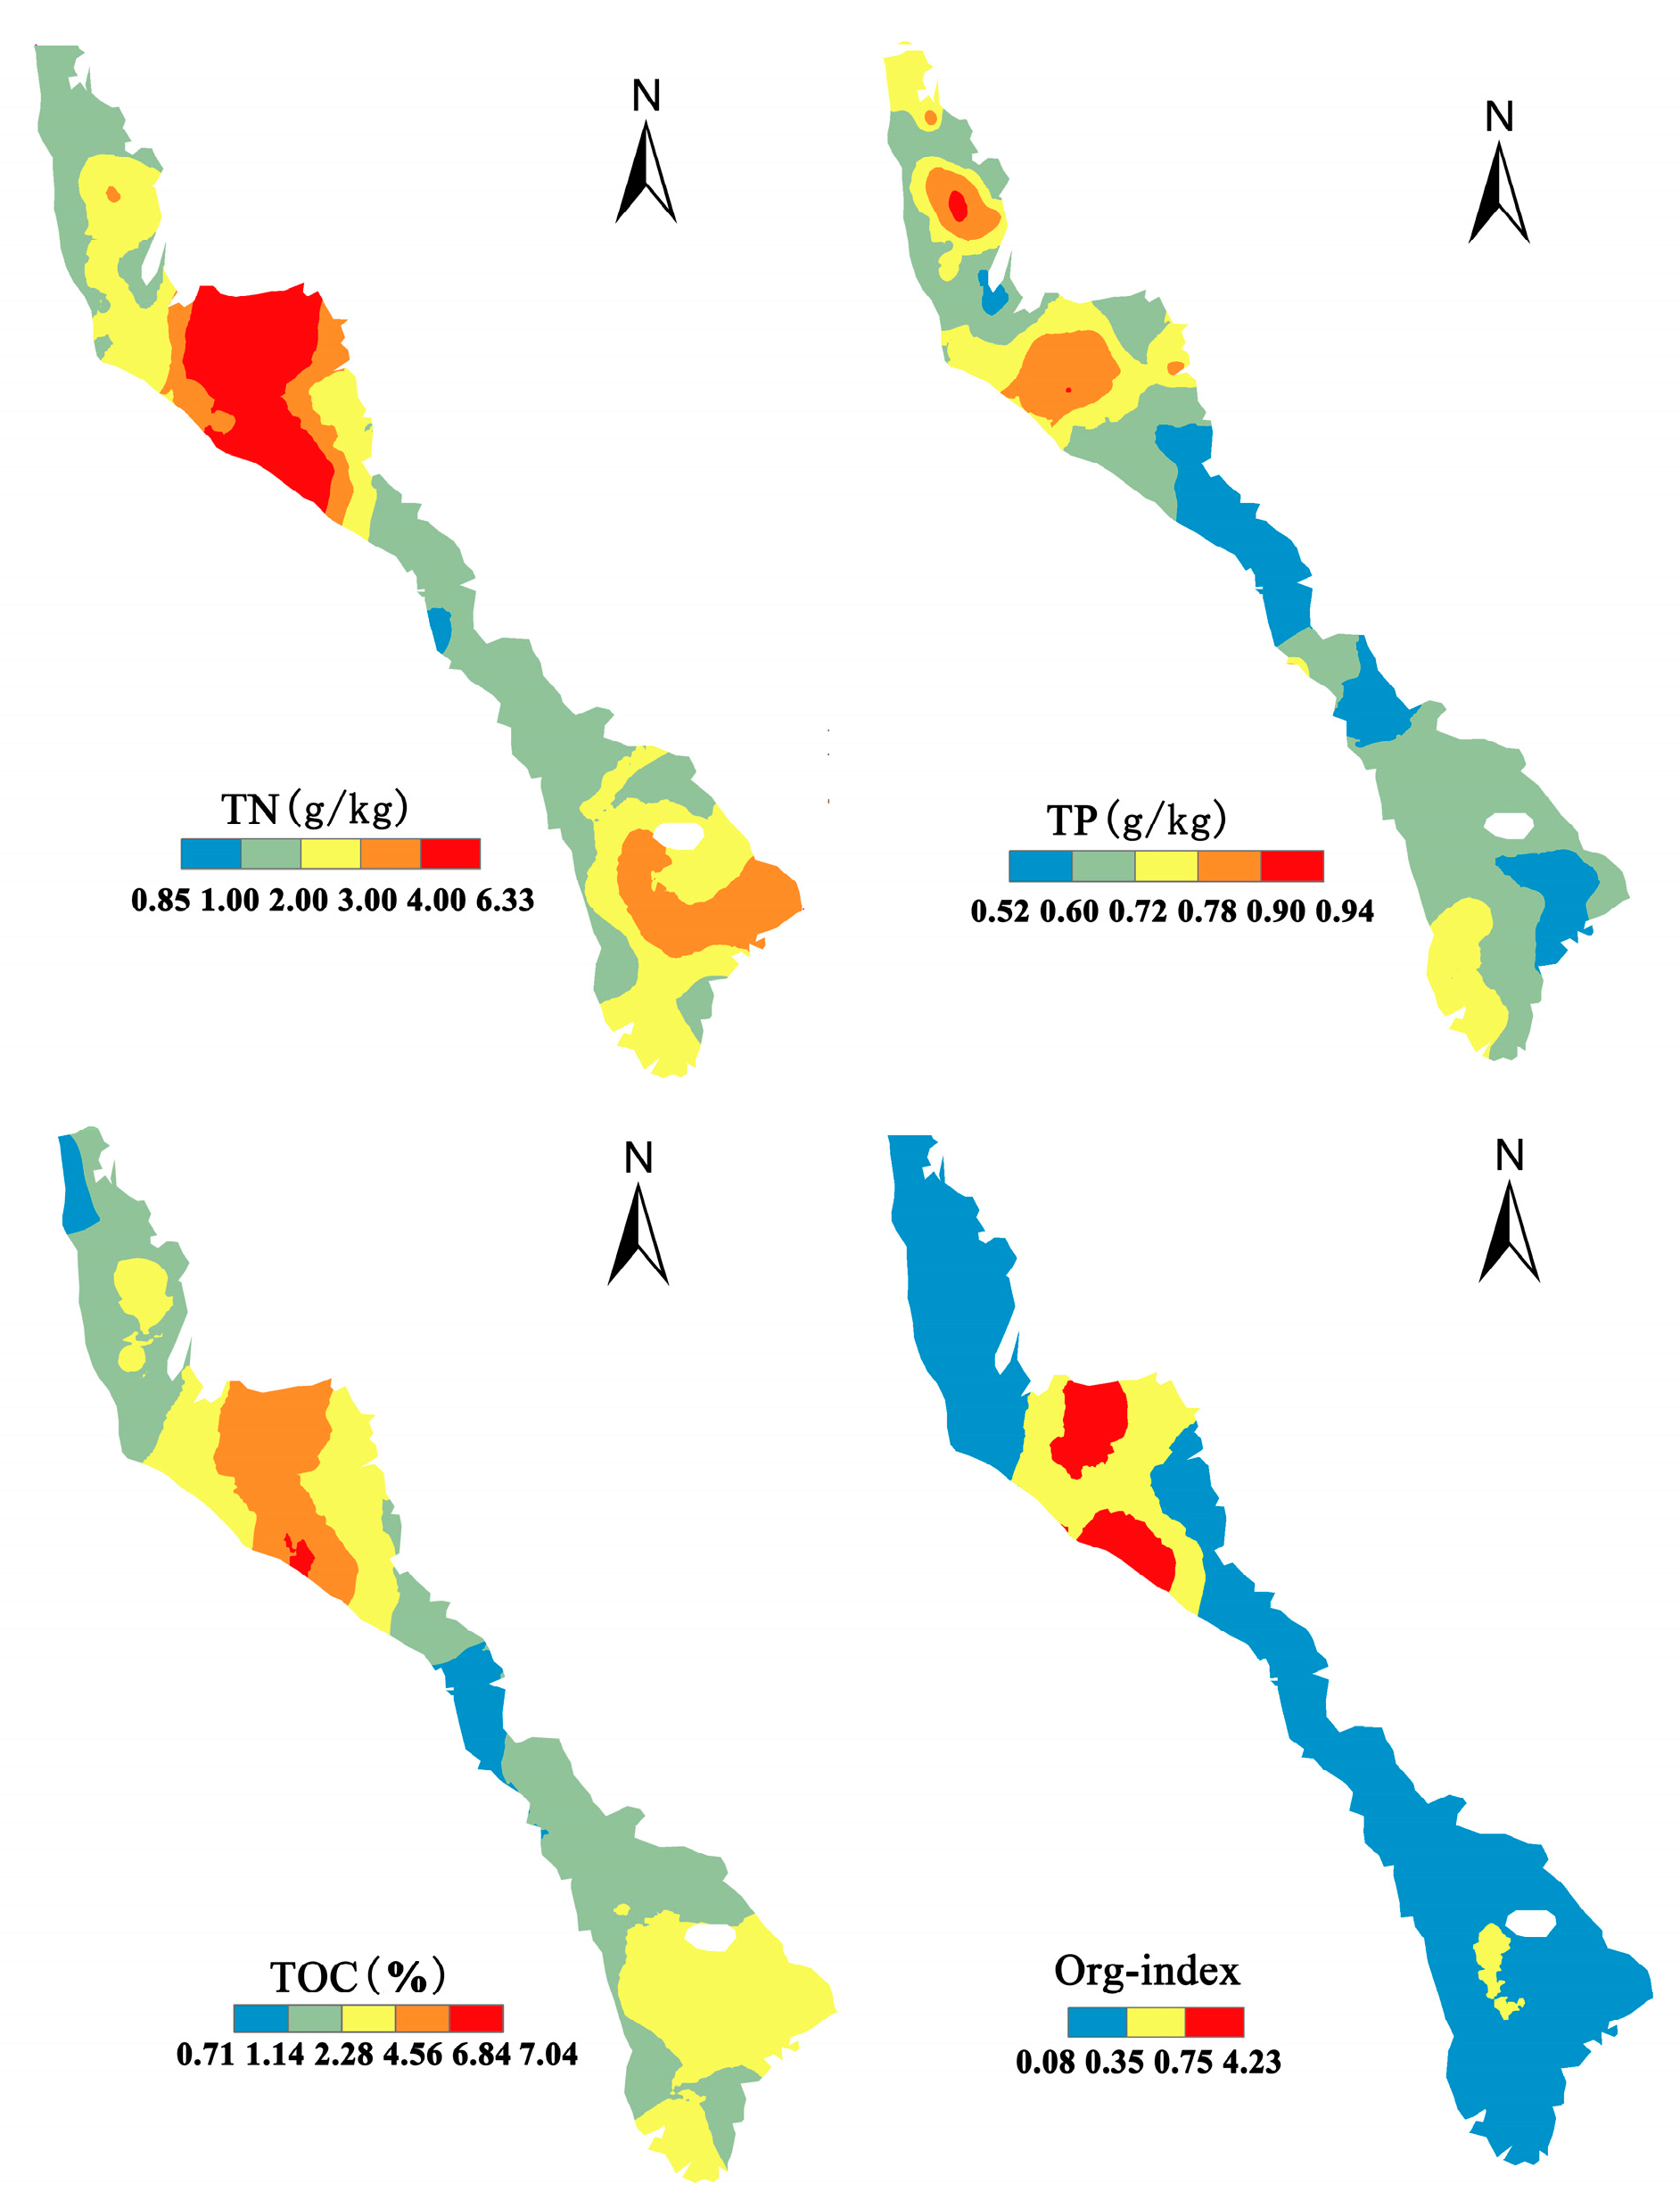
3.2. Semi-Variance Analysis and Spatial Distribution of Nutrients

The semi-variogram models and their best-fitted parameters were given in Table 2 and Figure 2. A spherical model was applied to fit the spatial structure of most indexes in sediments except TP (with an exponential model). The nugget-to-sill ratio, as a rough guideline, was widely applied to define distinctive features of spatial dependence for the variables [39,40,41]. The value of the nugget-to-sill ratio for TP, TN, TOC and Org-index were 0.45, 0.31, 0.51 and 0.56, respectively. The variable is considered to have a strong spatial dependence if the value of the “nugget-to-sill” ratio is less than 0.25, a moderate spatial dependence if the value is between 0.25 and 0.75, and a weak spatial dependence if the value is greater than 0.75. Variables that are strongly spatially dependent are controlled by intrinsic factors such as soil texture, while weak spatial dependence may be controlled by extrinsic factors such as human activities in agriculture, industry and aquaculture [42]. The semi-variograms obtained in this study implied the existence of weak spatial dependence for all the indexes, indicating that both intrinsic and extrinsic factors could influence the spatial dependence of nutrients in the surface sediments of Nansi Lake. This was also confirmed by the previous studies [4,5,7,9,43].
Based on the semi-variance analysis, the geochemical map illustrating the distinct zones of lower or higher contents of nutrients in the surface sediments of Nansi Lake was shown in Figure 3. On the whole, most of the TN and TOC contents reached four times as high or higher and twice as high or higher than the background values except the Zhaoyang sub-lake. As to TP, Nanyang, Dushan and most part of the Weishan sub-lakes reached as high as 1–1.5 times than the background value. The contents of TN and TOC in most parts of the Dushan sub-lake and south part of the Weishan sub-lake even reached 4–8 times and 2–6 times higher than the background values, moreover, their spatial distributions were remarkably similar over a large area, with the patches (representing relatively high contents) appeared in the same area.

3.3. Assessment of Sediments Pollution

The mean contents of TP, TOC and TN showed minor enrichment (1.13), minor enrichment (2.50) and moderately severe enrichment (5.40), respectively, and the enrichment factor decreased in the order of TN, TOC and TP. TN reached to moderate enrichment at 30th, and 65th percentile for TOC. The semi-variogram models and their best-fitted parameters for the Org-index were employed to determine the spatial variation by the Ordinary Kriging Method. The classification of the Org-index was used in mapping the distribution of the sediments organic pollution level of Nansi Lake (Figure 4). The spatial distribution of Org-index showed that most parts of the Dushan sub-lake were moderately or heavily polluted, and the vicinity of the Weishan island was moderately polluted, while the other parts of Nansi Lake were in a practically unpolluted state. Those polluted areas should be identified as priority regions for environmental monitoring and management in the future.

3.4. Identification of Pollution Sources

3.4.1. Principal Component Analysis

The results of PCA for TN, TP, TOC and other element contents (Cd, Hg, Pb, Ti, V, Cu, Zn, Fe2O3, Al2O3, As, Cr) were presented in Table 3. It was indicated that the PCA classified the initial dimension of dataset into four components, which explained 88.55% of the data variation. The first principal component (PC1) explained 38.53% of the total variance, and was loaded highly by Ti, V, Cu, Zn, Fe2O3, Al2O3 and Cr (0.78, 0.92, 0.76, 0.75, 0.89, 0.89 and 0.92, respectively); the second principal component (PC2) accounted for 25.34% of the total variance loaded highly by TOC, TN and Hg (0.96, 0.97 and 0.79, respectively); the third principal component (PC3) contributed to 16.82% of the total variance loaded highly by Cd, Pb and As (0.72, 0.66 and 0.84, respectively); the fourth principal component (PC4) took 7.85% of the total variance loaded highly by TP (0.91).

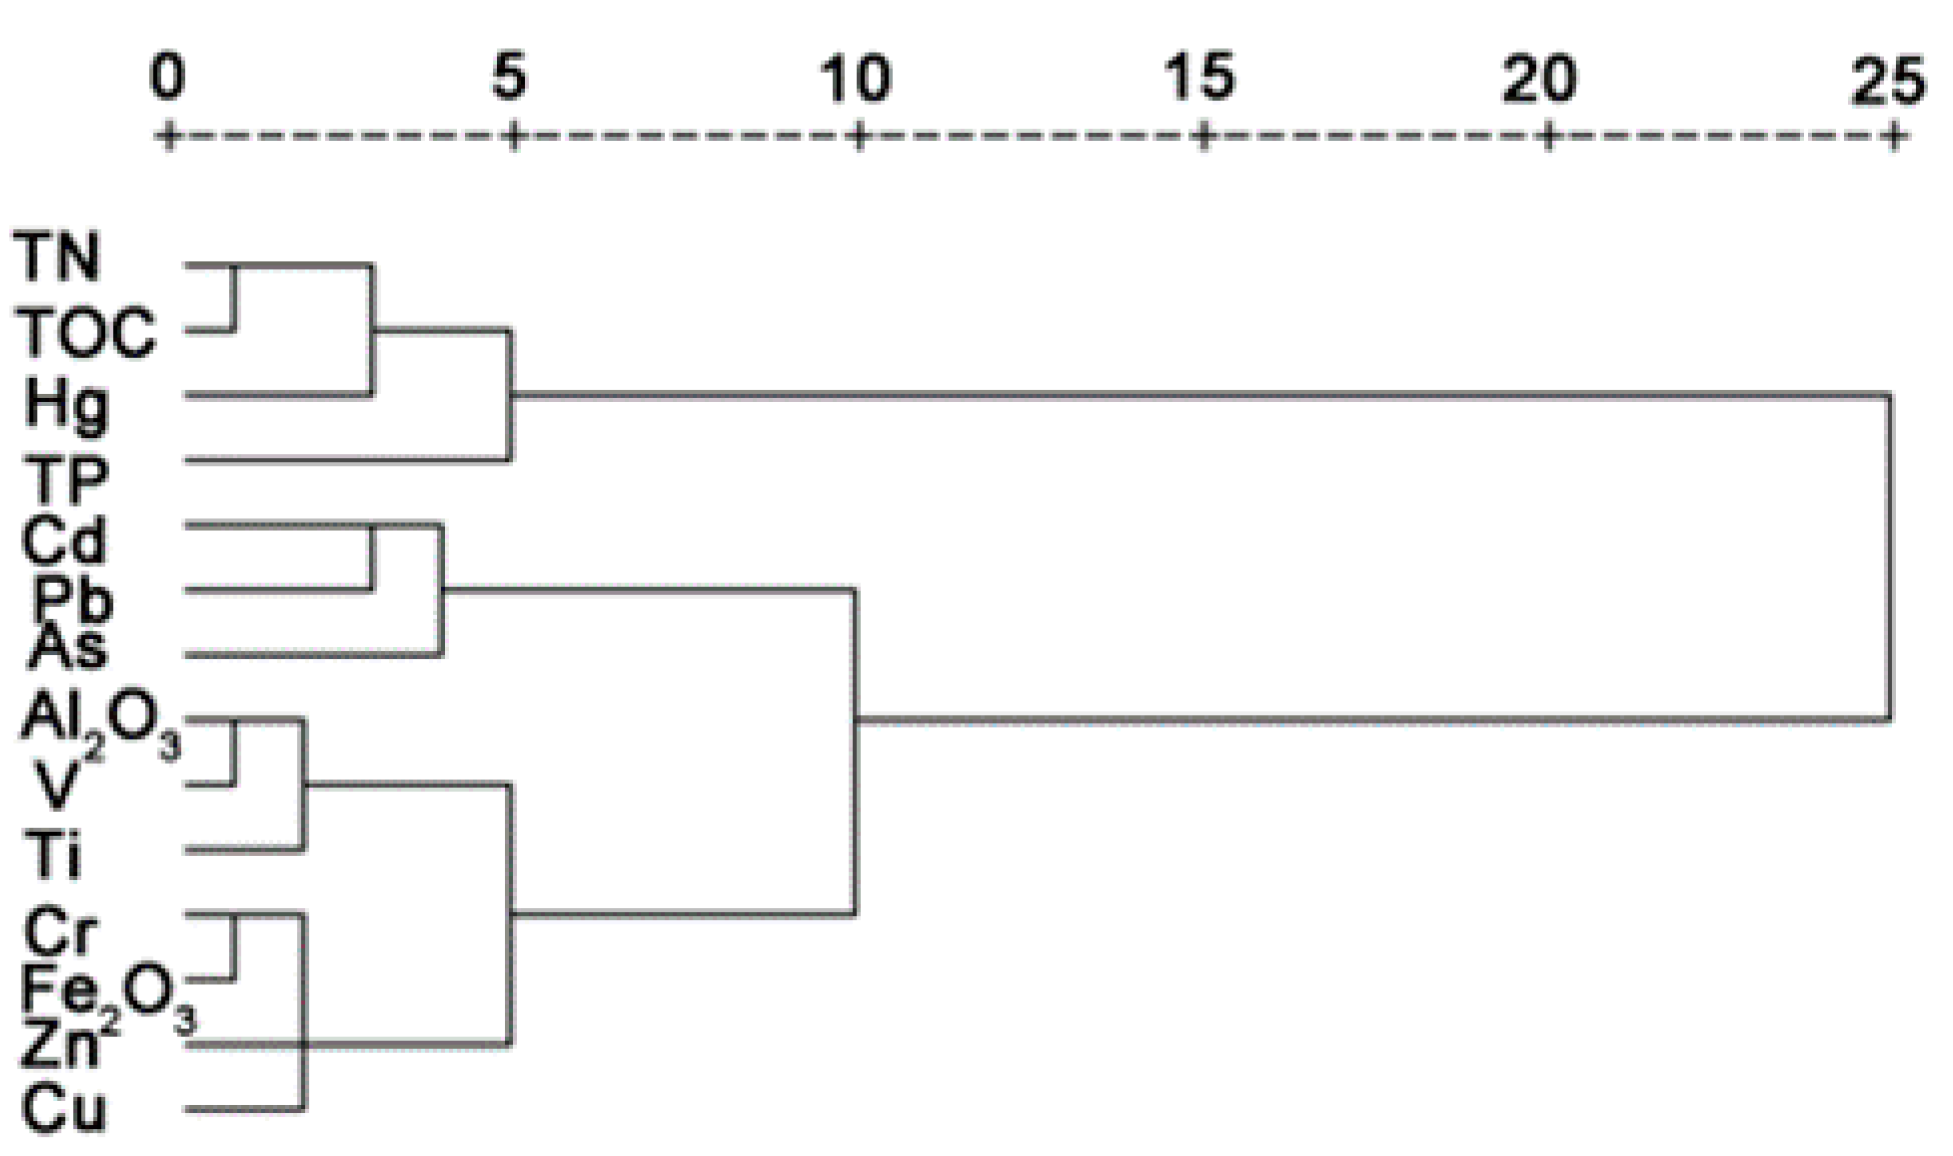
3.4.2. Cluster Analysis

According to cluster analysis, the contents of elements in sediments were Z-score standardized, and the Euclidean distance for similarities among variables was calculated. Then hierarchical clustering was performed on standardized data applying between-groups linkage (Figure 4). The results showed four statistically significant clusters: (1) TOC-TN-Hg, (2) Cd-Pb-As, (3) TP and (4) Al2O3-V-Ti-Cr-Fe2O3-Zn-Cu.

3.4.3. Sources Identification

The first principle components showed that Ti, V, Cu, Zn, Fe2O3, Al2O3 and Cr could be considered to have lithogenic control, as Fe2O3, Al2O3 and Ti were inert in the migration process and the main components of the rock for mining minerals. Ni and Cr are frequently derived from the weathering of the parent material and subsequent pedogenesis [44], which indicated that their contents in the surface sediments might be controlled by the parent rock composition. This was also proved by the previous research [8].
The second principle component loaded highly by TOC, TN and Hg. The sources of organic matter were usually predicted based on the total organic carbon and nitrogen ratio in the sediments. When TOC/TN > 10, the organic matter mainly comes from exogenous sources; when TOC/TN < 10, it is mainly endogenous organic matter; when TOC/TN ≈ 10, it reaches a balance between allochthonous and autochthonous sources [27,45]. The mean value of TOC/TN reached 10.44 in this study, which indicated that a part of the sediments organic matter of Nansi Lake may come from endogenous sources. Besides, Hg showed moderate pollution according to the previous research [8], which suggested that this principle component was related to anthropogenic inputs. The areas where geo-accumulation index >1 ( moderate or even severe polluted) for Hg mostly distributed in Dushan and Weishan sub-lakes, mainly caused by the discharge of inefficiently treated wastewater and unfiltered air pollutants emission [8]. The relatively low sediments nutrients in most parts of the Zhaoyang sub-lake may be attributed to the second dam retaining nutrients flowing from the upper lake to the lower lake. With the consideration that the agricultural practices contributed little to the Hg contents, the industrial discharge may be the common source of Hg. Moreover, TN and TOC were considered as the main organic pollutants in domestic and industrial wastewater [46]. There were three largest industrial cities (Jining, Yanzhou and Zoucheng) located in the northern part of Nansi Lake, and many iron and steel industries distributed in the southern part of the Weishan sub-lake. Therefore, we confirmed that wastewater discharge (papermaking, metallurgy as well as coals mining and washing) was the important source of TOC and TN.
The third principle component was dominated by Cd, Pb and As. The mean contents of Cd, Pb and As were 2.96, 1.91 and 2.36 times the background value, respectively, linking to an effect from human inputs [8]. The fourth principle component was dominated by TP. According to the spatial distribution conducted by Wang et al. [8], Cd, Pb and As had similar distribution with TP. The contents of Cd, Pb, As and TP in the inflow areas of the Dongyu River, Xizhi River and most parts of the Weishan sub-lake were high (Figure 3). There were many farmland, aquacultural and paddy field areas located in the western part of the Weishan sub-lake (Li et al., 2012) (Figure 1). Local famers usually applied a lot of chemical fertilizers, pesticides and cattle slurry containing As, Cd and Pb in agricultural activities to increase production and improve economic profits. It was deduced that the runoff and soil erosion coming from agricultural lands to lakes flowing through Heze city may be the main sources. Besides, the high TP contents in Dushan and Weishan sub-lakes may also be caused by the aquacultural activities as a large portion of these areas were developed for aquaculture (Figure 1). The high TP contents in the Nanyang sub-lake may be attributed to the usage of the detergent containing phosphorous by the people living in Jining. Consequently, it seemed reasonable to conclude that TP may originate mainly from agricultural, aquacultural activities and domestic sewage discharge.

4. Conclusions

The contents of studied nutrients took on different spatial variations and pollution levels in the surface sediments of Nansi Lake. The enrichment degree of nutrients increased in the order of TP, TOC and TN, and the mean contents of TP, TN and TOC were 1.13-, 5.40- and 2.50- fold higher than their background values, respectively. According to the pollution status assessed by the EF and Org-index, the pollution level of TN and TOC in the surface sediments of Nansi Lake was more serious than the TP. The moderately or heavily polluted areas only appeared in most parts of Dushan and Weishan sub-lakes. The relatively low sediments nutrients in most parts of the Zhaoyang sub-lake may be attributed to the second dam retaining nutrients flowing from the upper lake to the lower lake. Combined with the principle component and cluster analysis, we deduced that the anthropogenic TN and TOC were mainly from industrial sources coming from enterprises distributed in Jining, Yanzhou and Zoucheng, and iron and steel industries distributed in the southern of the Weishan sub-lake, whereas TP mainly originated from agricultural, aquacultural and domestic sewage sources. In a word, Dushan and Weishan sub-lakes should be identified as the priority regions for environmental monitoring and management, and the local government should supervise the industrial activities of Jining, Yanzhou and Zoucheng, the agricultural activities of Heze city and Weishan island, the aquacultural activities occurred in Dushan and Weishan sub-lakes as well as the domestic sewage discharge of Jining city.

Acknowledgments

This study was supported by the National Grand Science and Technology Special Project of Water Pollution Control and Improvement (No. 2014ZX07204-006), the National Natural Science Foundation of China (No. 41571028), the Natural Science Foundation of Shandong Province (No. ZR2016DM10) and Shandong Social Science Planning Project of Wetland Tourism Sustainable Development Research (No. 13DJJZ01). The authors are thankful to the editors and anonymous reviewers for their constructive comments on the earlier draft, which lead to a great improvement of the final paper.

Author Contributions

Longfeng Wang, Jun Xia and Jingjie Yu were responsible for the research design. Longfeng Wang and Jun Xia analyzed the data, and prepared the figures. Longfeng Wang drafted the main text. Liyuan Yang and Longfeng Wang participated in the sampling. Hongwei Lu, Chesheng Zhan and Yunfeng Qiao polished the manuscript. All authors participated in discussions and editing.

Conflicts of Interest

The authors declare no conflict of interest.

References

  1. Hilton, J.; O’Hare, M.; Bowes, M.J.; Jones, J.I. How green is my river? A new paradigm of eutrophication inrivers. Sci. Total Environ. 2006, 365, 66–83. [Google Scholar] [CrossRef] [PubMed]
  2. Jones, K.B.; Neale, A.C.; Nash, M.S.; van Remortel, R.D.; Wickham, J.D.; Riitters, K.H.; O’Neill, R.V. Predicting nutrient and sediment loadings to streams from landscape metrics: A multiple watershed study from the united states mid-Atlantic region. Landsc. Ecol. 2001, 16, 301–312. [Google Scholar] [CrossRef]
  3. Gaur, V.K.; Gupta, S.K.; Pandey, S.D.; Gopal, K.; Misra, V. Distribution of heavy metals in sediment and water of river gomti. Environ. Monit. Assess. 2005, 102, 419–433. [Google Scholar] [CrossRef] [PubMed]
  4. Yang, L.; Shen, J.; Liu, E.; Ji, J. Characteristics of nutrients distribution from recent sediment in lake Nansihu. J. Lake Sci. 2007, 19, 390–396. [Google Scholar]
  5. Yang, L.; Shen, J.; Zhang, Z.; Zhu, Y.; Sun, Q. A 40-year element geochemical record and its environment implication in lake Nansihu, Shandong Province. Geochimica 2003, 32, 453–460. [Google Scholar]
  6. Shen, J.; Zhang, Z.; Sun, Q.; Pan, H.; Xia, W.; Wu, Y.; Zhang, Z.; Niu, Z. Character and paleoenvironmental significance of the pigment and organic δ13C in sediments of nansihu lake. J. Lake Sci. 1998, 10, 17–22. [Google Scholar]
  7. Zhang, Z.; Niu, Z.; Sun, Q.; Shen, J. Pollution of sediment and it’s changing process of Nansihu lake. China Environ. Sci. 1999, 19, 29–32. [Google Scholar]
  8. Wang, L.; Yang, L.; Kong, L.; Li, S.; Zhu, J.; Wang, Y. Spatial distribution, source identification and pollution assessment of metal content in the surface sediments of Nansi lake, China. J. Geochem. Explor. 2014, 140, 87–95. [Google Scholar] [CrossRef]
  9. Shen, J.; Zhang, Z.; Yang, L.; Sun, Q. Nansi Lake: Environment and Resource Research; Seismological Press: Beijing, China, 2008. [Google Scholar]
  10. Guo, Y. On historical change of lakes in Shandong Province. Trans. Oceanol. Limnol. 1990, 3, 15–22. [Google Scholar]
  11. State Environmental Protection Administration. Water and Waste Analysis, 4th ed.; China Environmental Science Press: Beijing, China, 2002.
  12. Lu, R. Methods of Agricultural Chemical Analysis in Soil; China Agricultural Science and Technology Press: Beijing, China, 1999. [Google Scholar]
  13. Fu, W.; Zhao, K.; Zhang, C.; Tunney, H. Using moran’s I and geostatistics to identify spatial patterns of soil nutrients in two different long-term phosphorus-application plots. J. Plant Nutr. Soil Sci. 2011, 174, 785–798. [Google Scholar] [CrossRef]
  14. McGrath, D.; Zhang, C.; Carton, O.T. Geostatistical analyses and hazard assessment on soil lead in silvermines area, Ireland. Environ. Pollut. 2004, 127, 239–248. [Google Scholar] [CrossRef] [PubMed]
  15. Clark, I.; Harper, W.V. Practical Geostatistics; Ecosse North American LLC: Columbus, OH, USA, 2000. [Google Scholar]
  16. Fu, W.; Tunney, H.; Zhang, C. Spatial variation of soil nutrients in a dairy farm and its implications for site-specific fertilizer application. Soil Tillage Res. 2010, 106, 185–193. [Google Scholar] [CrossRef]
  17. Zhang, M.; Yuan, H. The pauta criterion and rejecting the abnormal value. J. Zhengzhou Univ. Technol. 1997, 1, 84–88. [Google Scholar]
  18. Goovaerts, P. Geostatistics for Natural Resources Evaluation; Oxford University Press: Oxford, UK, 1997. [Google Scholar]
  19. Webster, R.; Oliver, M.A. Geostatistics for Environmental Scientists (Statistics in Practice); Wiley: Hoboken, NJ, USA, 2001. [Google Scholar]
  20. Olea, R.A. Geostatistical Glossary and Multilingual Dictionary; Oxford University Press: Oxford, UK, 1991. [Google Scholar]
  21. Burgos, P.; Madejon, E.; Perez-de-Mora, A.; Cabrera, F. Spatial variability of the chemical characteristics of a trace-element-contaminated soil before and after remediation. Geoderma 2006, 130, 157–175. [Google Scholar] [CrossRef]
  22. Goodchild, M.; Parks, B.; Steyaert, L. Environmental Modeling with GIS; Oxford University Press: Oxford, UK, 1993. [Google Scholar]
  23. Pannatier, Y. VARIOWIN: Software for Spatial Data Analysis in 2D; Springer-Verlag: Berlin, Germany, 1996. [Google Scholar]
  24. Sakan, S.M.; Đorđević, D.S.; Manojlovic, D.D.; Predrag, P.S. Assessment of heavy metal pollutants accumulation in the tisza river sediments. J. Environ. Manag. 2009, 90, 3382–3390. [Google Scholar] [CrossRef] [PubMed]
  25. Zhao, Y.; Yan, M. The comparison of the chemical elemental abundance for the shallowsea sediment in huanghe and Changjiang, China. Chin. Sci. Bull. 1992, 13, 1202–1204. [Google Scholar]
  26. Yu, H.; Zhang, W.; Lu, S.; Yan, S.; Hu, R.; Chen, L.; Zhang, L.; Yu, J. Spatial distribution characteristics of surface sediments nutrients in lake Hongze and their pollution status evaluation. Environ. Sci. 2010, 31, 961–968. [Google Scholar]
  27. Zhang, Z.; Lv, Y.; Zhang, W.; Zhang, Y.; Sun, C.; Marhaba, T. Phosphorus, organic matter and nitrogen distribution characteristics of the surface sediments in Nansi lake, China. Environ. Earth Sci. 2015, 73, 5669–5675. [Google Scholar] [CrossRef]
  28. D’Angelo, E.M.; Reddy, K.R. Diagenesis of organic matter in a wetland receiving hypereutrophic lake water: I. Distribution of dissolved nutrients in the soil and water column. J. Environ. Qual. 1994, 23, 928–936. [Google Scholar] [CrossRef]
  29. Sun, C.; Liu, J.; Wang, Y.; Sun, L.; Yu, H. Multivariate and geostatistical analyses of the spatial distribution and sources of heavy metals in agricultural soil in Dehui, Northeast China. Chemosphere 2013, 92, 517–523. [Google Scholar] [CrossRef] [PubMed]
  30. Varol, M. Assessment of heavy metal contamination in sediments of the tigris river (Turkey) using pollution indices and multivariate statistical techniques. J. Hazard. Mater. 2011, 195, 355–364. [Google Scholar] [CrossRef] [PubMed]
  31. Varol, M.; Şen, B. Assessment of surface water quality using multivariate statistical techniques: A case study of behrimaz stream, Turkey. Environ. Monitor. Assess. 2009, 159, 543–553. [Google Scholar] [CrossRef] [PubMed]
  32. Lee, C.S.-L.; Li, X.; Shi, W.; Cheung, S.C.-N.; Thornton, I. Metal contamination in urban, suburban, and country park soils of Hong Kong: A study based on gis and multivariate statistics. Sci. Total Environ. 2006, 356, 45–61. [Google Scholar] [CrossRef] [PubMed]
  33. Lu, X.; Wang, L.; Li, L.Y.; Lei, K.; Huang, L.; Kang, D. Multivariate statistical analysis of heavy metals in street dust of baoji, nw China. J. Hazard. Mater. 2010, 173, 744–749. [Google Scholar] [CrossRef] [PubMed]
  34. Li, F.; Huang, J.; Zeng, G.; Yuan, X.; Li, X.; Liang, J.; Wang, X.; Tang, X.; Bai, B. Spatial risk assessment and sources identification of heavy metals in surface sediments from the Dongting lake, middle China. J. Geochem. Explor. 2013, 132, 75–83. [Google Scholar] [CrossRef]
  35. Zhang, X.; Sui, Y.; Zhang, X.; Meng, K.; Herbert, S.J. Spatial variability of nutrient properties in black soil of northeast China. Pedosphere 2007, 17, 19–29. [Google Scholar] [CrossRef]
  36. Han, Y.; Du, P.; Cao, J.; Posmentier, E.S. Multivariate analysis of heavy metal contamination in urban dusts of Xi’an, central China. Sci. Total Environ. 2006, 355, 176–186. [Google Scholar]
  37. Yang, Z.; Lu, W.; Long, Y.; Bao, X.; Yang, Q. Assessment of heavy metals contamination in urban topsoil from Changchun city, China. J. Geochem. Explor. 2011, 108, 27–38. [Google Scholar] [CrossRef]
  38. Persaud, D.; Jaagumagi, R.; Hayton, A. Guidelines for the Protection and Management of Aquatic Sediment Quality in Ontario; Report; Water Resources Branch, Ontario Ministry of the Environment: Toronto, ON, Canada, 1993. [Google Scholar]
  39. Cambardella, C.A.; Moorman, T.B.; Parkin, T.B.; Karlen, D.L.; Novak, J.M.; Turco, R.F.; Konopka, A.E. Field-scale variability of soil properties in central iowa soils. Soil Sci. Soc. Am. J. 1994, 58, 1501–1511. [Google Scholar] [CrossRef]
  40. Juang, K.-W.; Lee, D.-Y.; Ellsworth, T.R. Using rank-order geostatistics for spatial interpolation of highly skewed data in a heavy-metal contaminated site. J. Environ. Qual. 2001, 30, 894–903. [Google Scholar] [CrossRef] [PubMed]
  41. Tomer, M.D.; Burkart, M.R. Long-term effects of nitrogen fertilizer use on ground water nitrate in two small watersheds. J. Environ. Qual. 2003, 32, 2158–2171. [Google Scholar] [CrossRef] [PubMed]
  42. Sadeghi, A.; Graff, C.D.; Starr, J.; McCarty, G.; Codling, E.; Sefton, K. Spatial variability of soil phosphorous levels before and after poultry litter application. Soil Sci. 2006, 171, 850–857. [Google Scholar] [CrossRef]
  43. Liu, E.; Shen, J.; Yang, L.; Sun, Q.; Wang, J.; Chen, A. Occurrence of phosphorus in sediments of Nansihu lake and its main inflow rivers. Geochimica 2008, 37, 7. [Google Scholar]
  44. Proctor, J.; Baker, A. The importance of nickel for plant growth in ultramafic (serpentine) soils. In Toxic Metals in Soil Plant Systems, 1st ed.; Wiley: Hoboken, NJ, USA, 1994. [Google Scholar]
  45. Feng, F.; Wang, H.; Fang, T.; Liu, J.-T. The correlation between microbial biomass and carbon, nitrogen, phosphorus in the sediments of lake Donghu. China Environ. Sci. 2006, 26, 342–345. [Google Scholar]
  46. Tsuneda, S.; Mikami, M.; Kimochi, Y.; Hirata, A. Effect of salinity on nitrous oxide emission in the biological nitrogen removal process for industrial wastewater. J. Hazard. Mater. 2005, 119, 93–98. [Google Scholar] [CrossRef] [PubMed]
Figure 1. Location of sampling sites in Nansi Lake (A: Nanyang sub-lake; B: Dushan sub-lake; C: Zhaoyang sub-lake; D: Weishan sub-lake) and its main inflow rivers basin.
Water 09 00444 g001
Figure 2. Isotropic semi-variograms of nutrients and its pollution evaluation indexes, |h| stands for the lag distance between sampling sites, γ ( h ) stands for semi-variogram value.
Water 09 00444 g002
Figure 3. The geochemical map of nutrients and its organic pollution evaluation index in the surface sediments of Nansi Lake.
Water 09 00444 g003
Figure 4. Hierarchical agglomerative cluster (CA) of the elements contents in the surface sediments of Nansi Lake.
Water 09 00444 g004
Table 1. Summary statistics of nutrients in the surface sediments of Nansi Lake.
Min5%25%Med75%95%MaxMeanS.D.C.V.CanadaBDis.PK-S
TP0.390.490.590.640.730.951.370.680.140.150.60.6Box-cox0.19
TN0.340.681.42.23.76.37.682.70.180.630.550.5lgN0.74
TOC0.160.501.182.223.917.049.062.822.100.7411.13lgN0.94
TOC/TN4.717.358.4310.0910.5711.1711.7910.44------
Notes: Min: minimum; Max: maximum; S.D.: standard deviation; C.V.: variation coefficient; Median: Med; B: the background values of elements in Nansi Lake sediments; -: not available; K-S: Kolmogorov-Smirnov; Dis.: distribution (Box-cox: Box-cox normal, lgN: lognormal); Content: g/kg for TP, TN; % for TOC.
Table 2. Parameters of semivariagram models for studied variables.
ModelRangeNuggetSillNugget-to-Sill
TPExponential26,8192.836.280.45
TNSpherical32,6190.0290.0930.31
TOCSpherical27,7170.0540.110.51
Org-indexSpherical29,5170.190.350.56
Table 3. Principle component analysis (PCA) for elements in the surface sediments of Nansi Lake.
VariablePrinciple Loading FactorsCommunalities
PC1PC2PC3PC4
TN−0.100.970.060.110.96
TOC−0.090.960.070.070.95
TP−0.140.340.020.910.96
Cd0.010.590.720.170.89
Hg0.050.790.150.380.79
Pb0.460.210.660.080.71
Ti0.78−0.52−0.07−0.060.90
V0.92−0.210.21−0.070.94
Cu0.760.240.31−0.040.73
Zn0.750.140.560.190.92
Fe2O30.89−0.030.36−0.090.93
Al2O30.89−0.37−0.03−0.120.95
As0.33−0.070.84−0.100.83
Cr0.920.110.27−0.030.93
Eigenvalue5.393.552.361.10-
%Totalvariance38.5325.3416.827.85-
Cumulative%variance38.5363.8780.6988.55-
Notes: PC1 first principle component; PC2 second principle component; PC3 third principle component; PC4 fourth principle component; -: Not available.

