Article

Urban Flood Simulation Using MODCEL—An Alternative Quasi-2D Conceptual Model

by
Marcelo Gomes Miguez
1,*,
Bruna Peres Battemarco
2,
Matheus Martins De Sousa
2,
Osvaldo Moura Rezende
2,
Aline Pires Veról
3 and
Giancarlo Gusmaroli
4
1
Escola Politécnica & PEC-COPPE, Universidade Federal do Rio de Janeiro, Av. Athos da Silveira Ramos, 149, CT, Bl. I-206, Cidade Universitária, Rio de Janeiro 21941-909, Brazil
2
PEC-COPPE, Universidade Federal do Rio de Janeiro, Av. Athos da Silveira Ramos, 149, CT, Bl. I-206, Cidade Universitária, Rio de Janeiro 21941-909, Brazil
3
Faculdade de Arquitetura e Urbanismo & PEC-COPPE, Universidade Federal do Rio de Janeiro, Av. Pedro Calmon, 550, s.422, Prédio da Reitoria/FAU, Cidade Universitária, Rio de Janeiro 21941-901, Brazil
4
CIRF-Centro Italiano per la Riqualificazione Fluviale, Viale Garibaldi, 44/A 30173 Mestre (VE), Italy
*
Author to whom correspondence should be addressed.
Water 2017, 9(6), 445; https://doi.org/10.3390/w9060445
Submission received: 24 March 2017 / Revised: 11 June 2017 / Accepted: 13 June 2017 / Published: 21 June 2017
(This article belongs to the Special Issue Modeling of Water Systems)

Abstract

:
Urban flood modelling has been evolving in recent years, due to computational facilities as well as to the possibility of obtaining detailed terrain data. Flood control techniques have also been evolving to integrate both urban flood and urban planning issues. Land use control and flow generation concerns, as well as a set of possible distributed measures favouring storage and infiltration over the watershed, also gained importance in flood control projects, reinforcing the need to model the entire basin space. However, the use of 2D equations with highly detailed digital elevation models do not guarantee good results by their own. Urban geometry, including buildings shapes, walls, earth fills, and other structures may cause significant interference on flood paths. In this context, this paper presents an alternative urban flood model, focusing on the system behaviour and its conceptual interpretation. Urban Flood Cell Model-MODCEL is a hydrological-hydrodynamic model proposed to represent a complex flow network, with a set of relatively simple information, using average values to represent urban landscape through the flow-cell concept. In this work, to illustrate model capabilities, MODCEL is benchmarked in a test proposed by the British Environmental Agency. Then, its capability to represent storm drains is verified using measured data and a comparison with Storm Water Management Model (SWMM). Finally, it is applied in a lowland area of the Venetian continental plains, representing floods in a complex setup at the city of Noale and in its surroundings.

1. Introduction

Urban floods are complex phenomena that usually require a mathematical model to support diagnosis and design procedures. The first mathematical flood flow models that were developed tended to focus mainly on the main flow paths or on the drainage network and its hydraulic structures. In this early period, computational limitations imposed the use of one-dimensional (1D) approach. Even nowadays, it may be a possible (and useful) approach, mainly when designing storm drains and channels, once it is not expected that overflows occur in the design process. However, if a drainage system is already failing and flooding a city portion, it is very difficult to work with a 1D branched network to make it representative of the phenomenon. In this case, the use of such model may not be able to simulate the physical reality, because runoff processes cannot be represented within this approach and, in fact, the superficial flows may play a major role in the real flooding situation. Leandro et al. [1] posed that, unless in special cases where the flow remains confined within channel networks or limited by the streets, one-dimensional flow models are not applicable, and two-dimensional (2D) overland flow models should be used. These authors also recognise that overland flows in urban areas are highly complex due the interaction with manmade structures that drive flow paths.
There is a tendency nowadays to combine 1D and 2D models to take advantage of what both have to offer. Simões et al. [2] say that flooding caused by surface flows, due to intense local storms that exceed the capacity of the drainage network takes place at smaller temporal and spatial scales when compared with inundation caused by river floods. This kind of event, until recently, has not been object of great attention. These authors stated that “forecasting such events is still in its infancy” (ibid). To simulate urban flooding in a more a realistic way, urban flood models need to couple the minor and the major drainage systems, what was referred to as the “dual drainage concept” by Djordjevic et al. [3].
This type of combined problem—river flooding and urban flooding—may occur in two different scales, which makes its modelling more complex. Apel et al. [4] highlighted that studies of a combined fluvial and pluvial flood hazard are hardly available.
When observing the recent mathematical modelling trends, it is noticeable that the usage of 2D models is increasing and the detailed topographic information requested by these models is becoming easier to obtain. However, it is also perceived that a great amount of confidence is being put on these characteristics, in detriment of a soundly physical interpretation. Cunge [5] argued that, from the engineering point of view, the physical interpretation of the modelling process and consequent results is essential because computer output is bound to the simplification hypotheses introduced in the modelling phase. It is certainly desirable to have more information and the finest possible dimensional representation, but the fact is that these elements alone are not an absolute guarantee of adequate results. Except for very large urban-flooded areas, where great water depths may occur, it is difficult to observe a two-dimensional flow surface covering the entire affected area.
Abbott and Vojinovic [6] point that mathematical modelling has been changing due to how knowledge is being produced and used in our society: a shifting is occurring and we are moving from a society of knowledge providers to knowledge consumers. In this context, these authors divide numerical models in developing phases, going from numerical solutions for physical equations, interpreting the phenomenon to overcome computational limitations, passing by tailor-made models to solve practical problems, then arriving in the commercial models phase and, lately, in the software-as-a-service phase. During this process, the users distanced themselves from modellers.
This logic of knowledge consuming feeds the process of searching for more sophisticated flood models with complex and extensive topography data, even if it is not really required to solve the considered problem.
Within this regard, Neal et al. [7] posed a question arguing: “How much physical complexity is needed to model flood inundation?” In this study, these authors highlight that, besides topography information, “a number of less obvious factors also cause differences in simulations as great or greater than physical complexity”. When simulating subcritical gradually varied flows, with different models, these authors found values of flow velocities, water depths and inundated areas very similar amongst the tested models, with differences only as large as the ones caused by other modelling choices (e.g., topography sampling, recording of results, etc.).
Moreover, even with the most accurate Digital Terrain Model (DTM), built with up-to-date accurate technologies, one will never be able to identify the actual particularities/anomalies of the drainage system, such as obstructions in the manholes, blocking of box-culvert section or flap gates, presence of rubbish in the canals, and so on. Only the information gathered on the field about how the watershed performs when flooded can supplement this information gap. The strict 2D modelling (or even 3D, if possible or available) may be too vulnerable to information gaps and unavoidable imprecisions, especially if one relies exclusively in the mathematical model complexity as a guarantee of quality results.
Leandro et al. [1] also highlighted this problem, recognising that special key features found in urban areas, such as buildings and roads for example, can obstruct the expected natural flow paths and can cause sudden vertical drops, changes in the flow directions and local head losses. Thus, despite the fact that highly detailed Digital Elevation Models (DEM) may be available, containing detailed information about the morphology of such key features, they cannot be simply inserted into the 2D grid, without any further overland flow interpretations.
Considering this initial picture, this paper aims to present the use of the Urban Flood Cell Model—MODCEL, a mathematical model developed to couple with the urban diversity discussed in the previous lines, as an alternative for urban flood modelling. The early development of MODCEL started in a research about urban flood modelling developed at the Federal University of Rio de Janeiro, in Brazil. This research pointed out the importance of representing hydrologic surface processes and surface flows, jointly with storm drains, drainage channels and rivers. The main challenge was to put these demands together, giving primary importance to the physical interpretation, while maintaining data needs as simple as possible. MODCEL was developed as an interpretative conceptual model that uses a quasi-2D approach to represent physical reality to fulfil the proposed objectives of its construction. This model was presented in a first version in Mascarenhas and Miguez [8] and its evolution is shown here as an alternative tool for aiding in the process of urban water management and flood control design, especially when urban diversity and hydraulic structures play an important role in defining flood patterns.
MODCEL concept was based on the original work from Zanobetti and Lorgerè [9]. The flow cell concept was initially developed to overcome computation limitations when simulating large flood plains. However, due to a modular construction, this concept can be very useful, even nowadays, to simulate urban systems, where natural topography patterns, urban landscape, and hydraulic structures merge in a complex setting.
The modelling process partitions the watershed into a number of cells, which work as ponds (with storage capacity) interconnected by a vast array of hydraulic links, where the dynamic De Saint Venant equation occupies a prominent place.
In this work, MODCEL will be presented and applied, first in a benchmark test, then in a comparison with a storm drain model and, at last, in a complex urbanised flood plain, where the Italian city of Noale lies.

2. Urban Floods and Mathematical Modelling Importance

Urban floods are usually associated with a complex terrain set-up, where several structures take part. Urban environments may be responsible for a multitude of flow possibilities when storm drains fail. It is quite usual that water spilling out of the drainage system may cause inundation over vast areas and city structures may interact with hydraulic structures, composing an unplanned flow network that includes urban surfaces, mainly through streets acting as channels. At the same time, several undesired reservoirs are addicted to the system, with parks, public squares and buildings temporally retaining waters, without having been designed for this function (and in an undesirable way).
This situation usually demands the aid of a mathematical model to help the design team understand how the resulting system behaviour makes the drainage network interact with the urban landscape.
Another important and current aspect regarding urban drainage discussions refers to the changing paradigm associated with designing flood control alternatives. Burian and Edwards [10] reviewed the evolution of the drainage systems from 3000 BC to present days and pointed out interesting aspects:
  • The urban drainage systems often evolved through trial-and-error modifications after the systems were initially constructed;
  • Changes in perspective of urban drainage in a city were most often caused by disease outbreaks, scientific discoveries, or technical advances in planning, design, and construction.
The traditional drainage design approach works to improve channel conveyance, which often falls on the canalisation or rectifications of the watercourses (focusing on adapting the drainage net to the generated discharges). This approach arouse during the industrial city development, when the drainage systems were designed to face sanitation problems, conveying jointly storm waters and wastewaters. The urban growth of the industrial city occurred with very few controls [11], leading to several urban infrastructure gaps. Although the hygienist concept related with the traditional urban drainage design was important to equate public health problems at that time, this approach showed to be unsustainable, especially when the urbanisation process became more intense. Urbanisation itself limits river canalisation enlargements. Once city growth increases flow generation, this approach tends to transfer problems to downstream reaches of the basin.
On the other hand, Andoh [12] reviewed the urban drainage and wastewater practices, stating the need for a shift from a reactive framework of the traditional approach, which acted on the consequences of the increasing flows, to a proactive-preventative approach, centred on sustainable principles and involving the social dimension. To do this, this author discusses the adoption of distributed facilities to attenuate and/or store and manage urban waters, dealing with the problem at its early stages, near the sources of flow generation.
In this context, in the last decades, several approaches were developed to better adjust flow patterns in space and time. Among these approaches, it is possible to mention (not being exhaustive): low impact development [13,14]; sustainable urban drainage systems [15,16,17,18]; and water sensitive cities [19,20,21]; among others, with similar objectives.
Thus, the new trends in urban drainage points to distributed measures on the watershed (not only in the drainage net) intending to manage flow generation and minimising impacts of urbanisation over natural flow patterns. Once again, mathematical models arise as important tools to help in the design process of flood control alternatives, allowing to act in a distributed way over the watershed and to combine effects of the proposed measures in space and time.

3. Urban Drainage Modelling

Urban floods, as previously mentioned, involve a great variety of flow patterns over a very complex surface, passing through different hydraulic structures. Waters spilled out of the system may flow on the streets as though they were channels. Depending on water levels reached on the streets, open spaces and even buildings may store and retain waters, acting as reservoirs. Walls may work as weirs, for example, dividing a certain portion of the urban area, with different flow depths and discontinuous flow paths at each side. In such cases, flows may occur quite differently from the original (confined) expected behaviour, picturing their own patterns, in various directions and deeply influenced by interactions with local structures.
One of the most important aspects to consider in flood modelling of urban environments is the way which the resistance caused by buildings or other structures is represented in the model [22].
In this context, a model capable to fulfil the requisites for urban floods simulation should be able to represent hydrologic and hydraulic processes in a distributed way, integrating different possibilities of superficial flows and their interactions with urban landscape and with the formal drainage system.
In this situation, if the superficial flow is mainly governed by topography and urban occupation patterns, it is difficult to adequately represent the flooding behaviour with strict 2D models. High imperviousness and short time of concentration are common elements of urban hydrology. Under such conditions, sewer drainage networks play a primary role in modern cities when transporting runoff during storm events [23]. However, 1D models focused on the drainage network will also miss the representation of important superficial psychical processes.
Djordjevic et al. [3] presented the concept of dual drainage modelling, providing a more realistic alternative for representing urban flooding. In this concept, the network of storm drains is able to interact with superficial flows over open spaces, through the streets or between houses, composing a high-varied model in space and time. Besides that, underground pipes, in this case, might present free or surcharged flows. Note that, in 1999, when this work was published, this was an evolution from the simple 1D modelling, bringing 2D needs into discussion.
Following this tendency, Nasello and Tucciarelli [24] proposed a dual multilevel urban drainage model, representing the system as a double network, formed by an upper network of open channels (the street gutters) and a lower network of closed conduits (the sewer pipes), mainly focusing on this interaction. This model considered that a significant part of the flow moves along streets, until reaching an available inlet. Two overlapping cells occupy the same space location, in different levels, representing the street and the sewer network at each inlet basin, connected by a vertical link. Mass and momentum conservation laws are applied to each pipe/channel section, and the diffusive approach is used. When the sewer is under pressure, the hydrodynamic behaviour of the lower layer connects with the upper one. Leon et al. [25], for example, proposed a model to be developed in four modules: (1) hydrology; (2) street flows; (3) flow interception at inlets; and (4) storm-sewer flows in urban areas. More recently, Chang et al. [23] developed a “novel approach” to represent flow interactions between storm sewer system and overland surface flows. Noh et al. [26] compared urban flood modelling approaches with results obtained in laboratory scale experiments for the interaction of manholes, sewer pipes and surface flows. These examples show that this matter is still a current modelling challenge.
Maksimovic and Prodanovic [27] stressed that modelling improvement of surface-subsurface interactions requires not only change in the modelling concepts, but also detailed spatial data resolution. This data refers to: land use, terrain elevation and other features affecting surface runoff, available in digital form at a desirable horizontal and vertical resolution. At the time of this publication, the authors stressed that this could be a limiting fact in evolving models, once the required information could be not always easy or cheap to obtain. In fact these limitations are being surpassed, although detailed information on terrain modelling is still not cheap. Leandro et al. [28] discussed 1D/1D and 1D/2D models, respectively, for sewer and surface representations. One of the observations made is that 2D models are computationally much more expensive than 1D models, resulting in a greater computation time. In general, Leandro et al. [28] say that the choice between using a 1D surface network model or a 2D surface system model depends on the physical behaviour mapped for the case study. This choice determines the reliability of the results and the computational time required to obtain them. Considering the simplicity of 1D models, it is easy to adjust their parameters and the result may be even better than that obtained by 2D models, where the uncertainties in the required data are greater and the difficulties for calibration are higher. In the presence of major overbank flows and storm drains failure, however, the flows occurring over the urbanised flood plain may determine the use of 2D models as the best option.
The results obtained by Leandro et al. [28] showed evidence that it is possible to set up an accurate 1D/1D model, depending on the problem characteristics. To accomplish this task it is necessary to define a detailed 1D surface network of pathways and possible ponds based on the physical reality (expressed, in this case, by a digital elevation model). Manholes should be linked to pathways, pathways to ponds and ponds to ponds. The connection between sewer and surface used a multiple linking element, depending on the characteristics of the flow. This conception is similar to that of the flow cell.
If the overland flow paths are well known, 1D surface models may be built in a sound and effective way, being an economical alternative to 2D models [29].
Simões et al. [2] presented a proposal that joined the 1D/1D and the 1D/2D approaches, in a hybrid configuration, aiming to take advantage of the benefits of each one and overcoming the drawbacks. A case study was developed for the Canbrook catchment in London (United Kingdom). Several tests were performed. The 1D/1D modelling was used to represent higher areas of the basin, while 1D/2D concept was applied in the areas where larger flooded areas were expected. Results showed that the hybrid model was almost as fast as the 1D/1D model, with results similar to the 1D/2D model written to the entire area.
Eleutério and Mosé [30] compared 1D, 1D/2D and 2D modelling for mapping riverine flooding in the town of Fislis, eastern France. Complementarily, 28 scenarios were also built varying the choices made by the modeller when representing the topography of the river-floodplain system. Considering the modelled results for the flooding areas and water depths, the authors highlighted that special attention should be paid both on modelling and modeller choices for representing physical situation. Although defining the model dimensions (1D, 1D/2D and 2D) appeared to be the most important choice, the fact is that physical modelling interpretation to accommodate different information scales and detailing levels might also significantly influence the precision of the modelled results.
Abily et al. [31] raised a pertinent and important discussion about possibilities, performances and limits of the use of standard modelling tools for high-resolution runoff simulations over an industrial site as an example of a dense environment with complex aboveground structures that affect (and alter) drainage paths. These are common characteristics also found on an urban environment. This work highlights (like previously cited works) that strict 2D models are being used to represent urban areas and high-resolution topography data are becoming available to support these models. However, these authors introduce new concerns arguing that the modelling of complex sites deserves special attention on topics such as rapid changes in flow regime, small water depths and high gradient properties, and vertical effects in runoff hydrodynamics introduced by some of the aboveground components. We can add to this discussion some other potential problems such as the wetting and drying of model elements, and discontinuities in 2D flood surface moving over the urban watershed (generated by physical obstacles). Walls or earthworks may produce independent surface flows connected by weirs or orifices, for example.
In particular, Abily et al. [31] tested two 2D models and mapped some of the difficulties mentioned. The authors also stress that field measurements would have been desirable to validate models. This final remark seems to be valid in most urban cases. Although 2D modelling is becoming more common and efforts are being made to benchmark models [32,33], the lack of observed data seems to be a common problem when comparing model simulations to real floods in spatially distributed real world events (e.g., [34,35]).

4. Urban Flood Cell Model—MODCEL

MODCEL is a quasi-2D model [36], as defined in the classical literature. It represents the two-dimensional characteristics of the watershed, but uses only 1D equations. MODCEL is able to describe natural or artificial watercourses and elements of the urban fabric (streets, squares, roofs, etc.), the flow in the subterranean storm drains, and the mutual “upper layer–lower layer” connections amongst such elements, including overflows. Because it integrates an upper and a lower layer of flows (superficial flows and storm drains), MODCEL can be seen (in a particular interpretation) as a quasi-3D model. However, by doing the flow representation through 1D equations written for pre-defined possible flow paths, the model preserves simplicity and spares computational time. On the other hand, this is also one of the weaknesses of this representation, once it fails to accurately model real 2D flow surfaces by not considering the cross influences of flow velocities in x,y-Cartesian axis. MODCEL also conjugates a simple hydrological distributed representation, performing rainfall-runoff transformations in each cell.
Topographic and hydraulic representations of the physical reality are two core elements in MODCEL. It is important to point out, however, that MODCEL does not need a Digital Terrain Model (DTM) in the strict sense—it is the responsibility of the modeller to interpret terrain features to provide synthetic geometrical information characterizing each individual cell and each connection between cells to the model. This way, it is important to note that, MODCEL cannot function by a blind, automatic application of geomatics tools and the objective description of boundary conditions. It rather obliges the modeller to investigate and understand how the real system works and how can each component be represented to simulate system functioning. At a first glance, this could be seen as another weakness (because it is neither automatic nor easy), but, through this process, indeed, inevitably, the particularities of the drainage system come to light and an actual, very useful understanding of the system behaviour is gained.

4.1. Background

In the 1960s, the first relevant mathematical model capable to describe two-dimensional flow patterns was proposed and implemented. This model was constructed for the Mekong delta river area by Societé Grenobloise d'Etudes et Applications Hydrauliques (SOGREAH), in a work for UNESCO [9,37]. This model represented the basin using storage cells, which were able to connect river reaches and floodplains to simulate flow patterns in the inundated Mekong delta areas, considering both natural floods and floods modified by a regulation dam, which would act in flood damping, flow regularization for navigation purposes and irrigation. The modelled area had about 50,000 km2 and was inhabited by approximately 10 million people.
Other applications of this model can be found in several cases that followed: Mopipi marsh [38]; Mono river basin [39]; Senegal river basin [36,39]; Mfolozi river and Santa Lucia estuary [40]; upper Rhône river basin [36]; and Paraná river basin in Yacyreta/Apipe [41].
In 1990, a different kind of cell model, considering a mesh of rectangular cells, was developed for heavy floods simulation, including dam break [42]. In this latter case, zones near the dam were treated in a particular way, considering the shock wave and privileging inertia effects. Distant dam zones were considered to be characterized by great flood plains, terrain topography, land use, presence of dykes, among other factors, so the shock waves could be considered to have suffered significant dissipation. In this way, cells could represent distant flood plains.
The first version of a cell model developed in Brazil was built to represent Pantanal Matogrossense, a large marsh in west-centre region of Brazil [43]. Later, this model was adapted to an urban environment, gaining a series of new facilities, being presented by Mascarenhas and Miguez [8], in an initial version, that is in continuous improvement and which is presented in this paper on its current stage of development. This model was called MODCEL. Some applications of this model can be found in the literature (see, for instance, [44,45,46,47]).

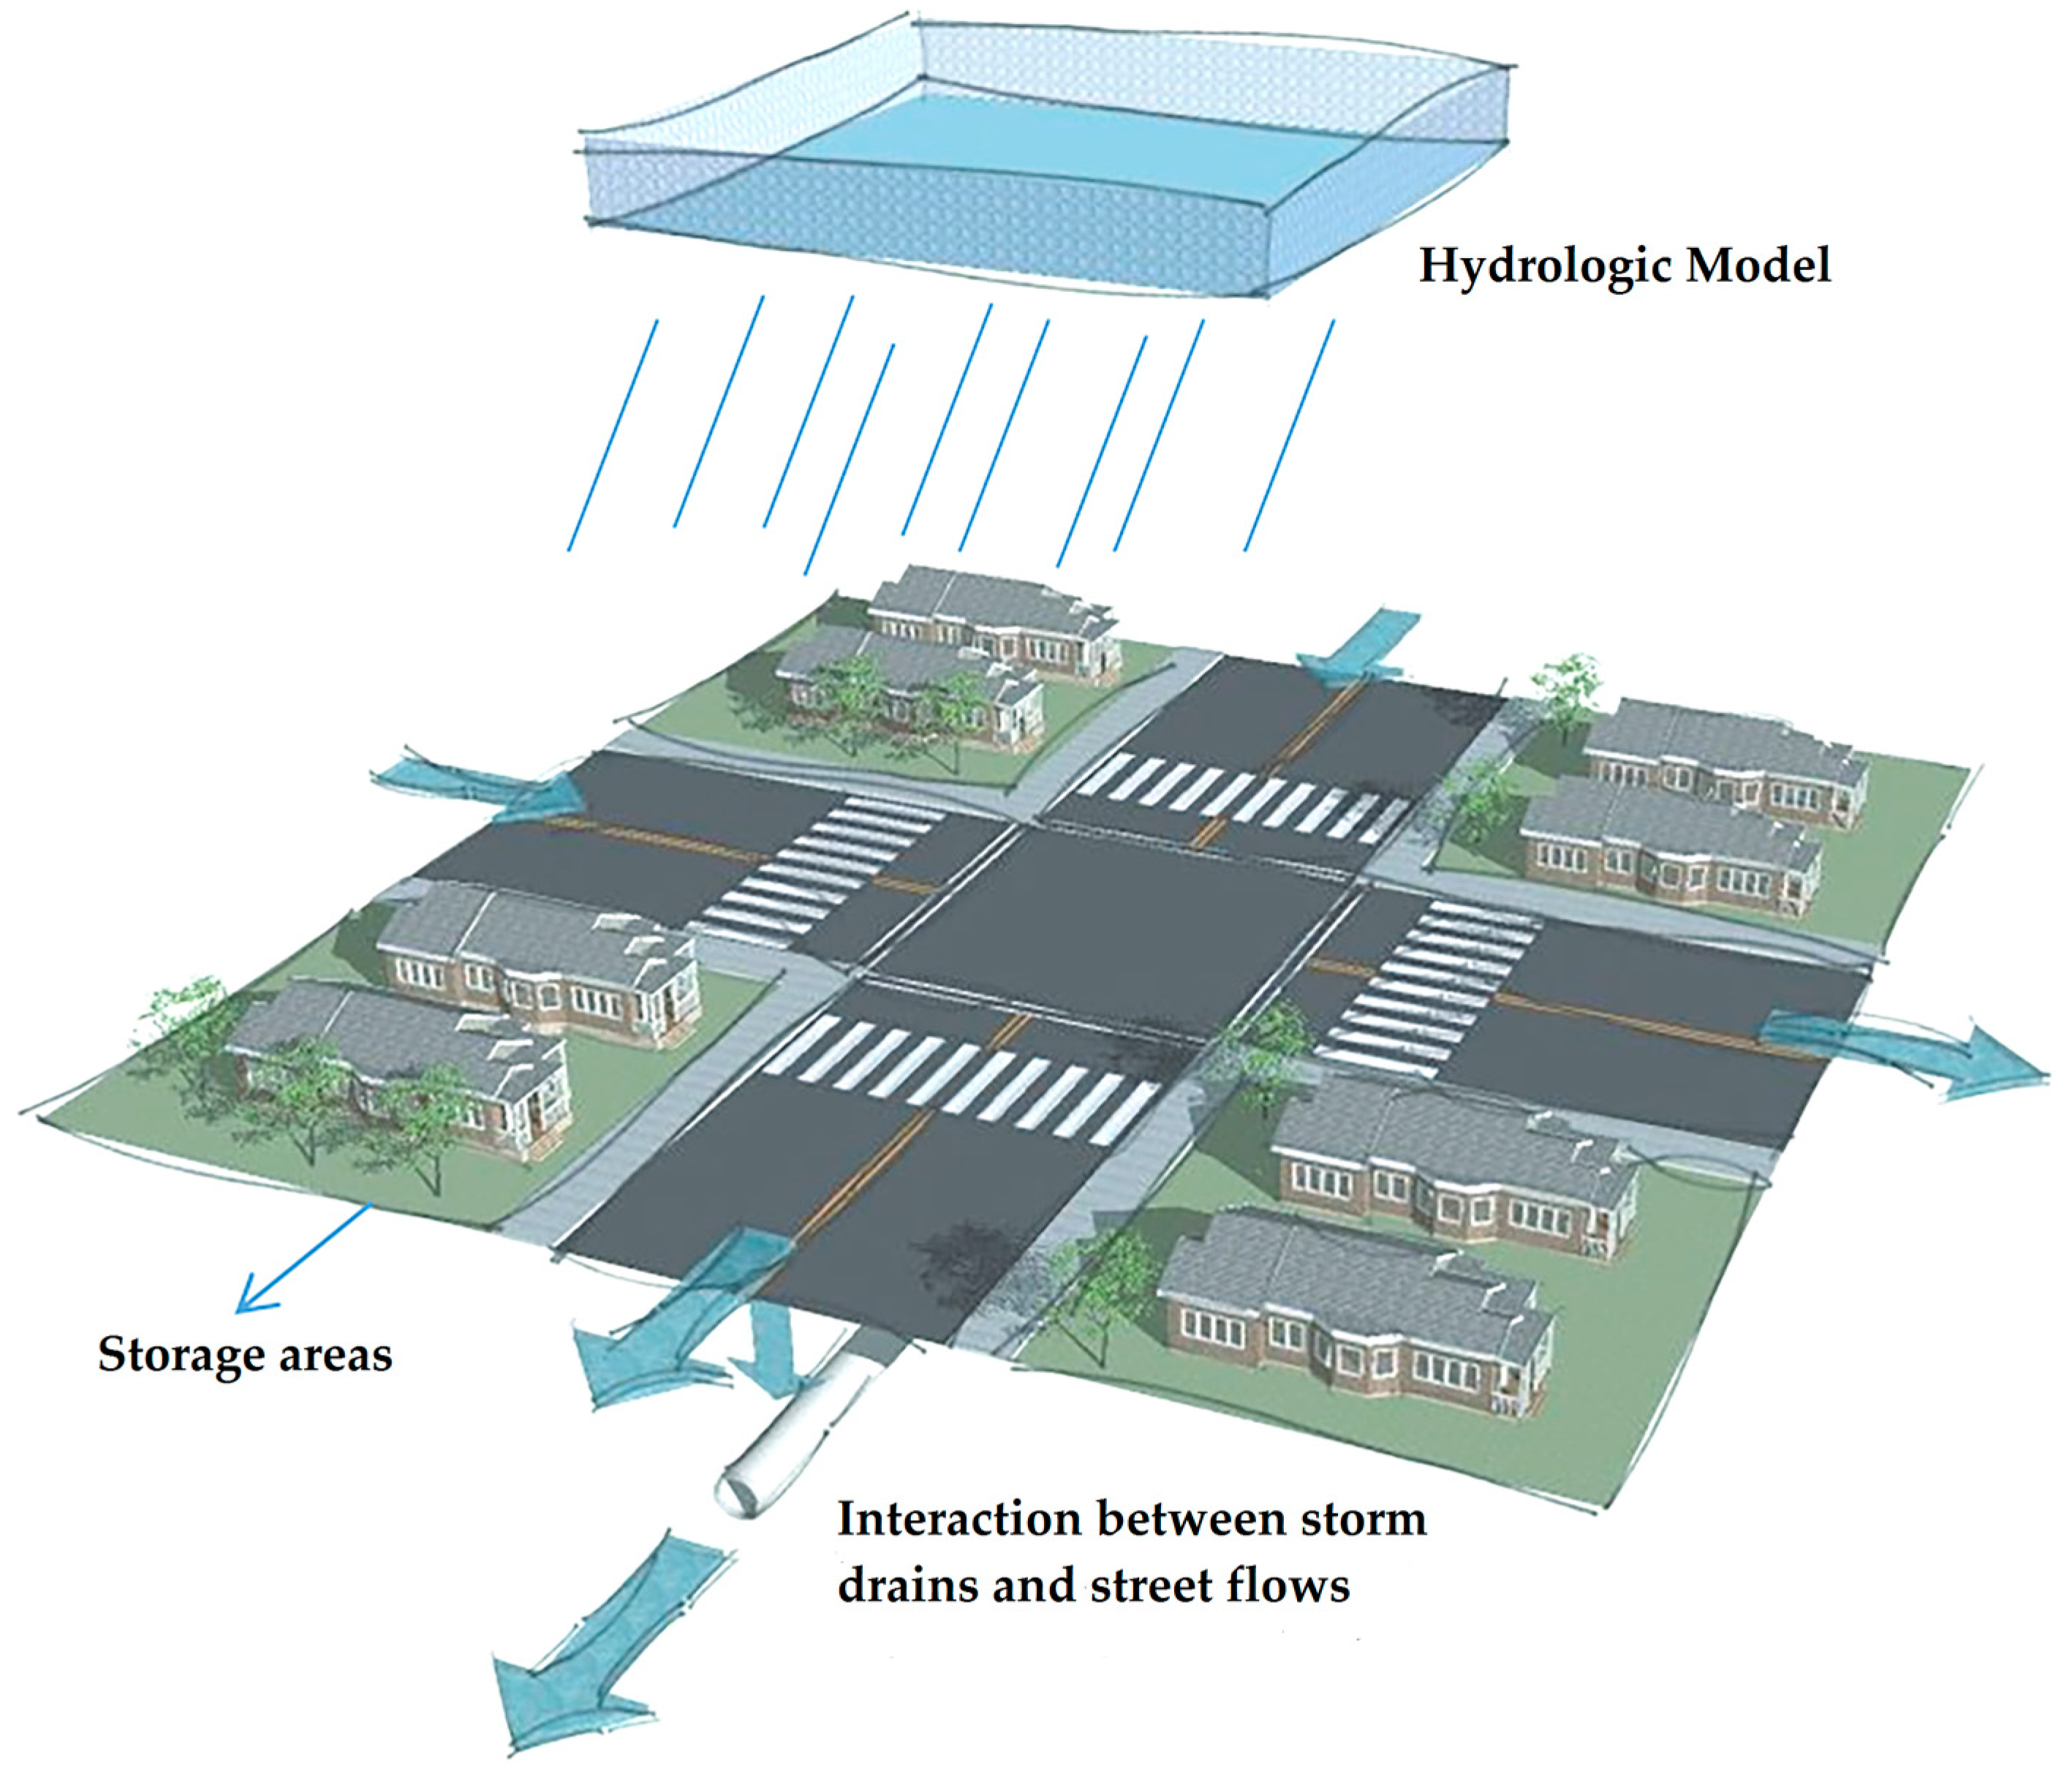
4.2. Basic Concepts and Mathematical Modelling Structure

MODCEL is based in the basic principles of mass conservation, energy conservation and momentum conservation laws. The entire basin and its different elements are represented by cells, including the rivers, channels, storm drains, flood plains, hilly areas, urban areas, reservoirs, and other structures. Therefore, several urban structures and flow patterns can be simulated by the combination of a pre-defined set of cell types and cell links. The cells act as the storage elements of the model, representing terrain elevation and land occupation characteristics, while the links, on the other side, activate the flows between each pair of cells. Thus, cells and links are the computational basic elements of MODCEL.
The mass balance is applied to all cells. Thus, at each time step, the stored amount of water in one cell depends on the discharges exchanged between this cell and its neighbours, as well as on the rainfall contribution added through a rainfall run-off transformation. Two simple hydrologic models are available in MODCEL: the use of the Rational Method per cell, applying a runoff coefficient, evaluated according to the land use characteristics of each cell; or the use of a simple hydrological model to represent infiltration, vegetal interception and depression retentions, being the two latter parcels considered in a combined way as a limited reservoir. On the other hand, infiltration can occur as long as there is water accumulated over the surface of the modelled cell, even though the rainfall has finished. Abstraction (vegetal interception + retention) and infiltration are considered to occur simultaneously in the model, as part of the abstraction may occur in impervious surfaces.
The mesh of cells composes a hydrodynamic looped network, in a spatial representation that links surface flows, channel flows and storm drains, allowing discharges to occur in different directions on the modelled watershed, depending on the calculated water levels. All mathematical relations written are one-dimensional. Figure 1 illustrates the basic concepts of a cell. There are some important characteristics associated to every cell to adequately represent land surface properties: the total plain area, where the rainfall occurs; the storage area, where the mass balance is applied; and the land use and occupation characteristics, which is essential to estimate run-off generation. In urban cells, the different levels established by streets, sidewalks and buildings affect the storage capacity. Different patterns may be pre-defined in MODCEL, accounting for different characteristics of neighbourhoods in the urban tissue. These patterns influence storage availability (and consequent flooding levels) by establishing superficial areas associated with different terrain elevations. Figure 2 illustrates the different levels defined by the urban patterns inside an urbanised cell. The street level refers to the lowest area available for storage purposes. The sidewalk level refers to sidewalks themselves, but also to gardens, parks, and parking lots. The building level indicates the threshold related with initiating the flooding of houses and their contents.
The set of pre-defined cell types used in MODCEL is listed below:
  • River/channel cells: This type of cell is used to model the main free open channel flows, in which the cross section is taken as a rectangular equivalent shape.
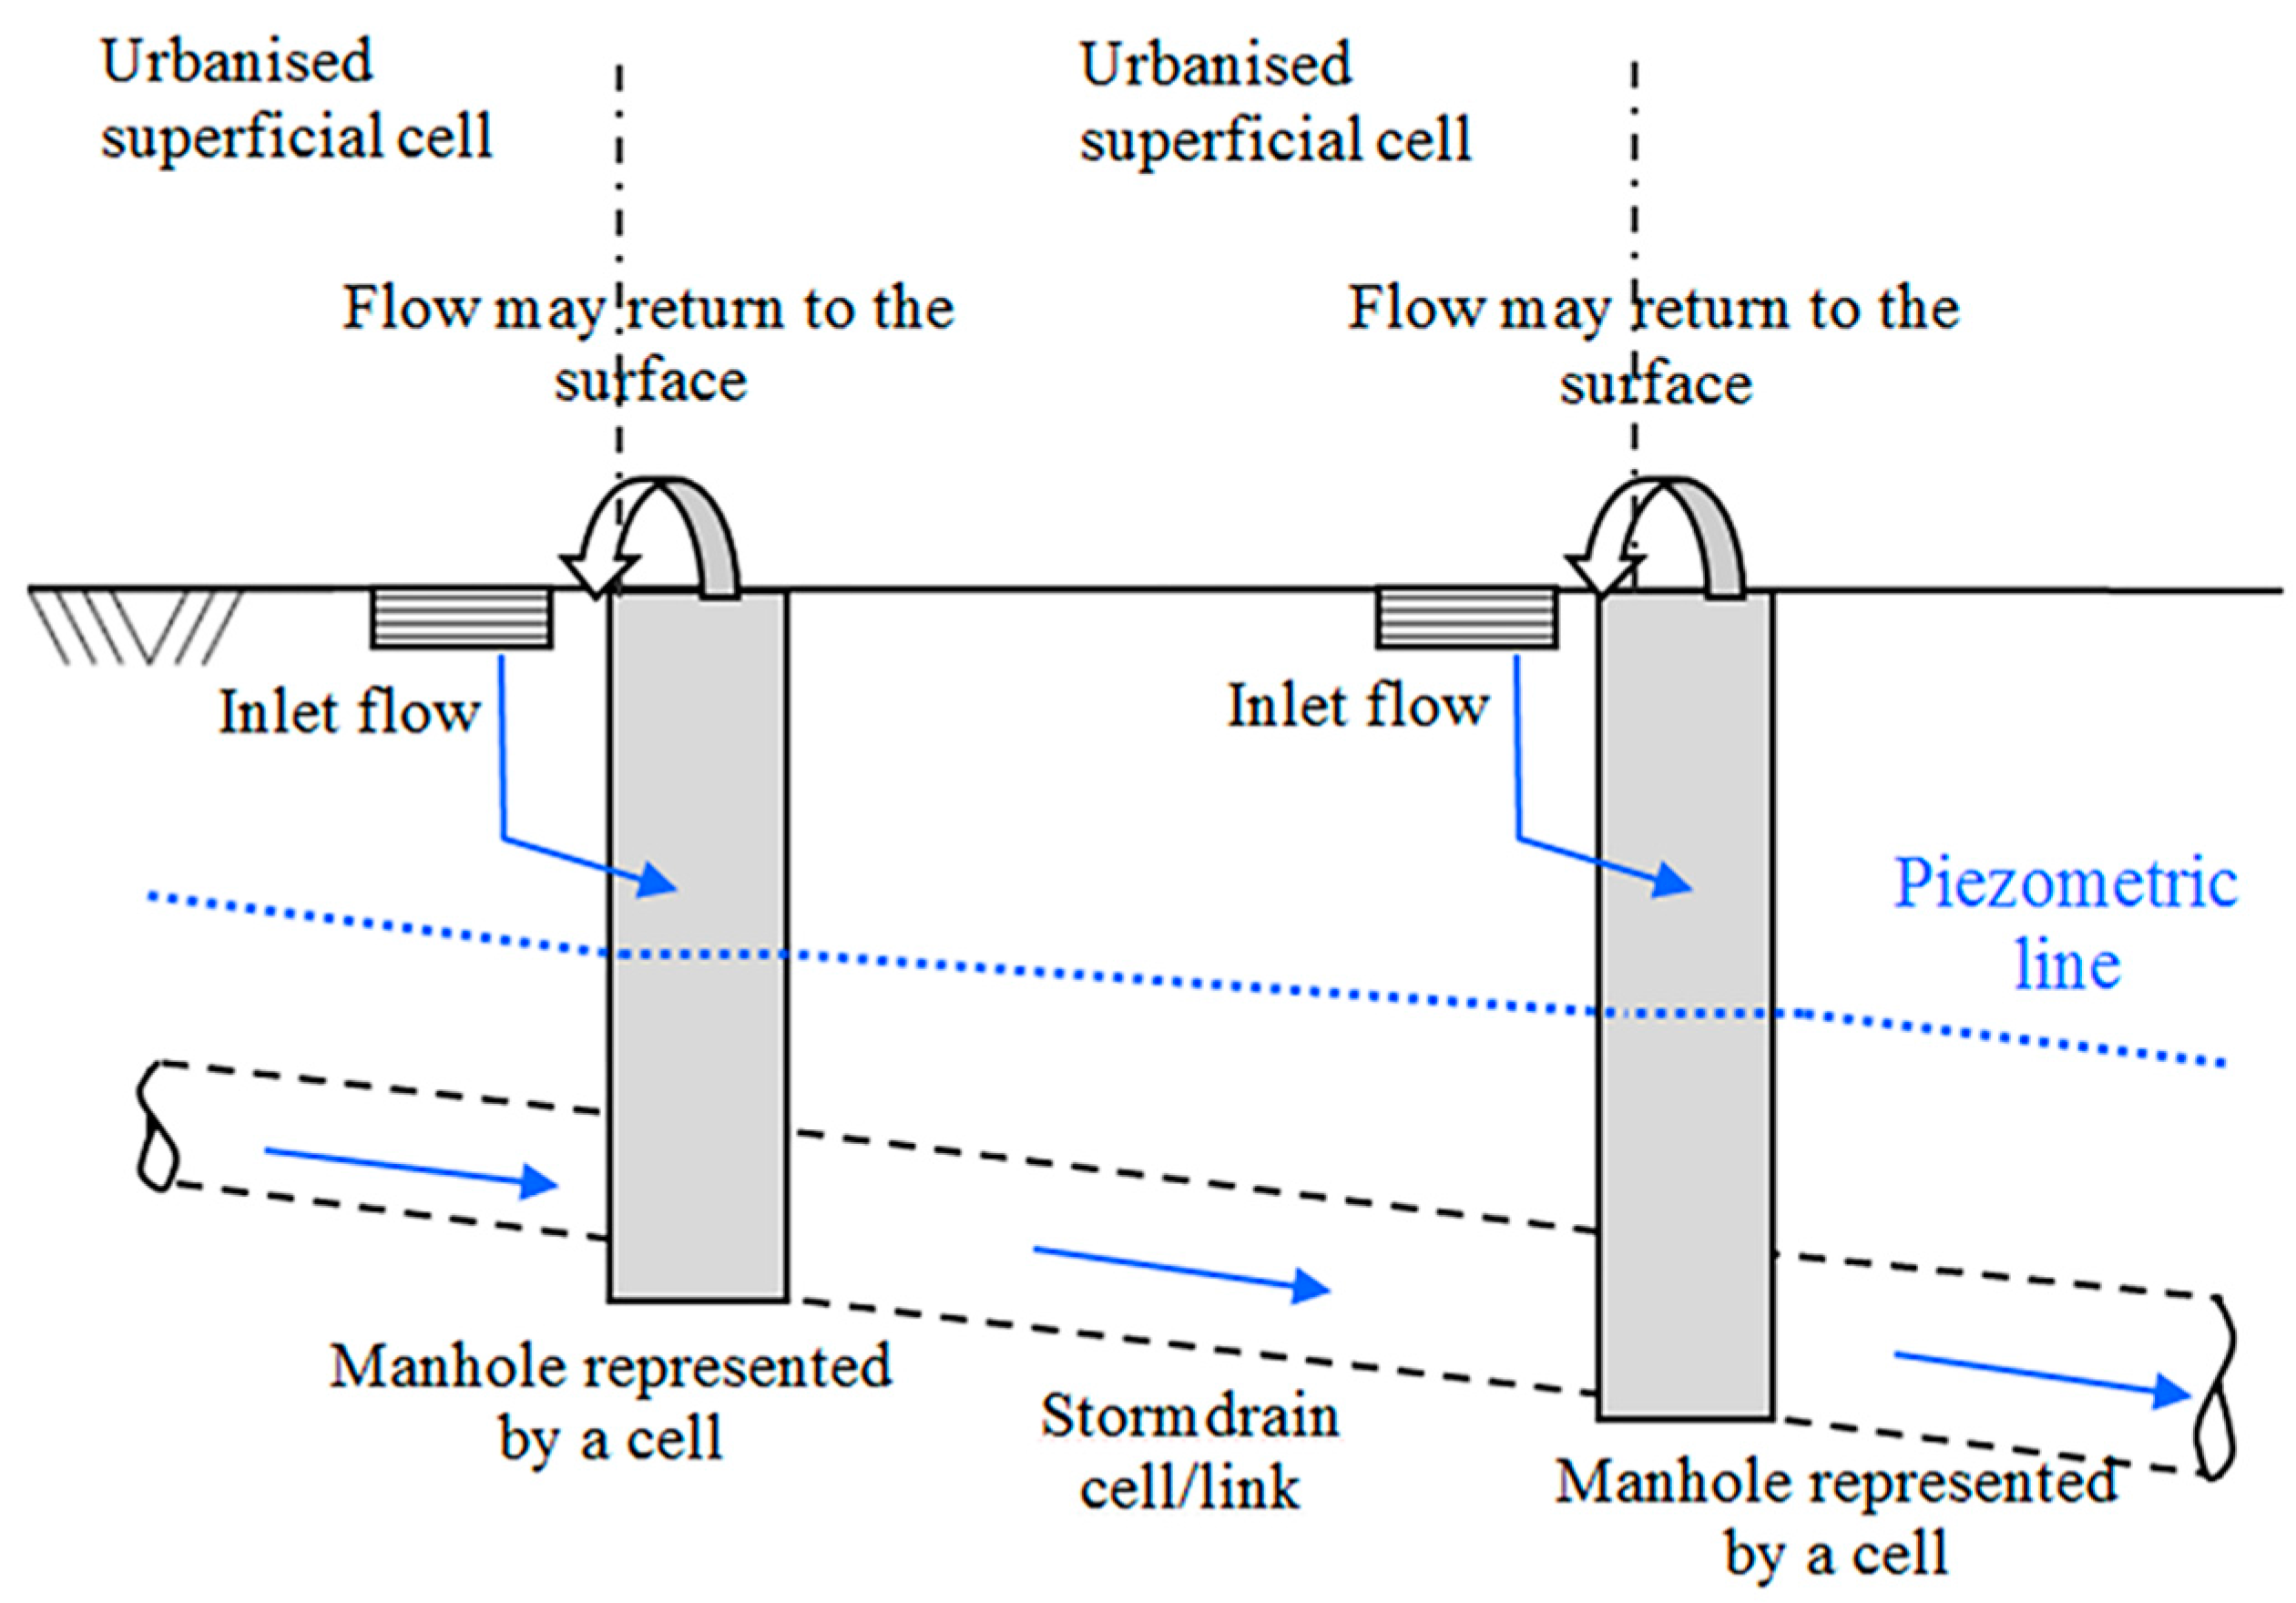
  • Storm drain cells: This type of cell represents enclosed sections in the drainage network, with a top limit to the flow depths. It allows superficial or surcharged flows.
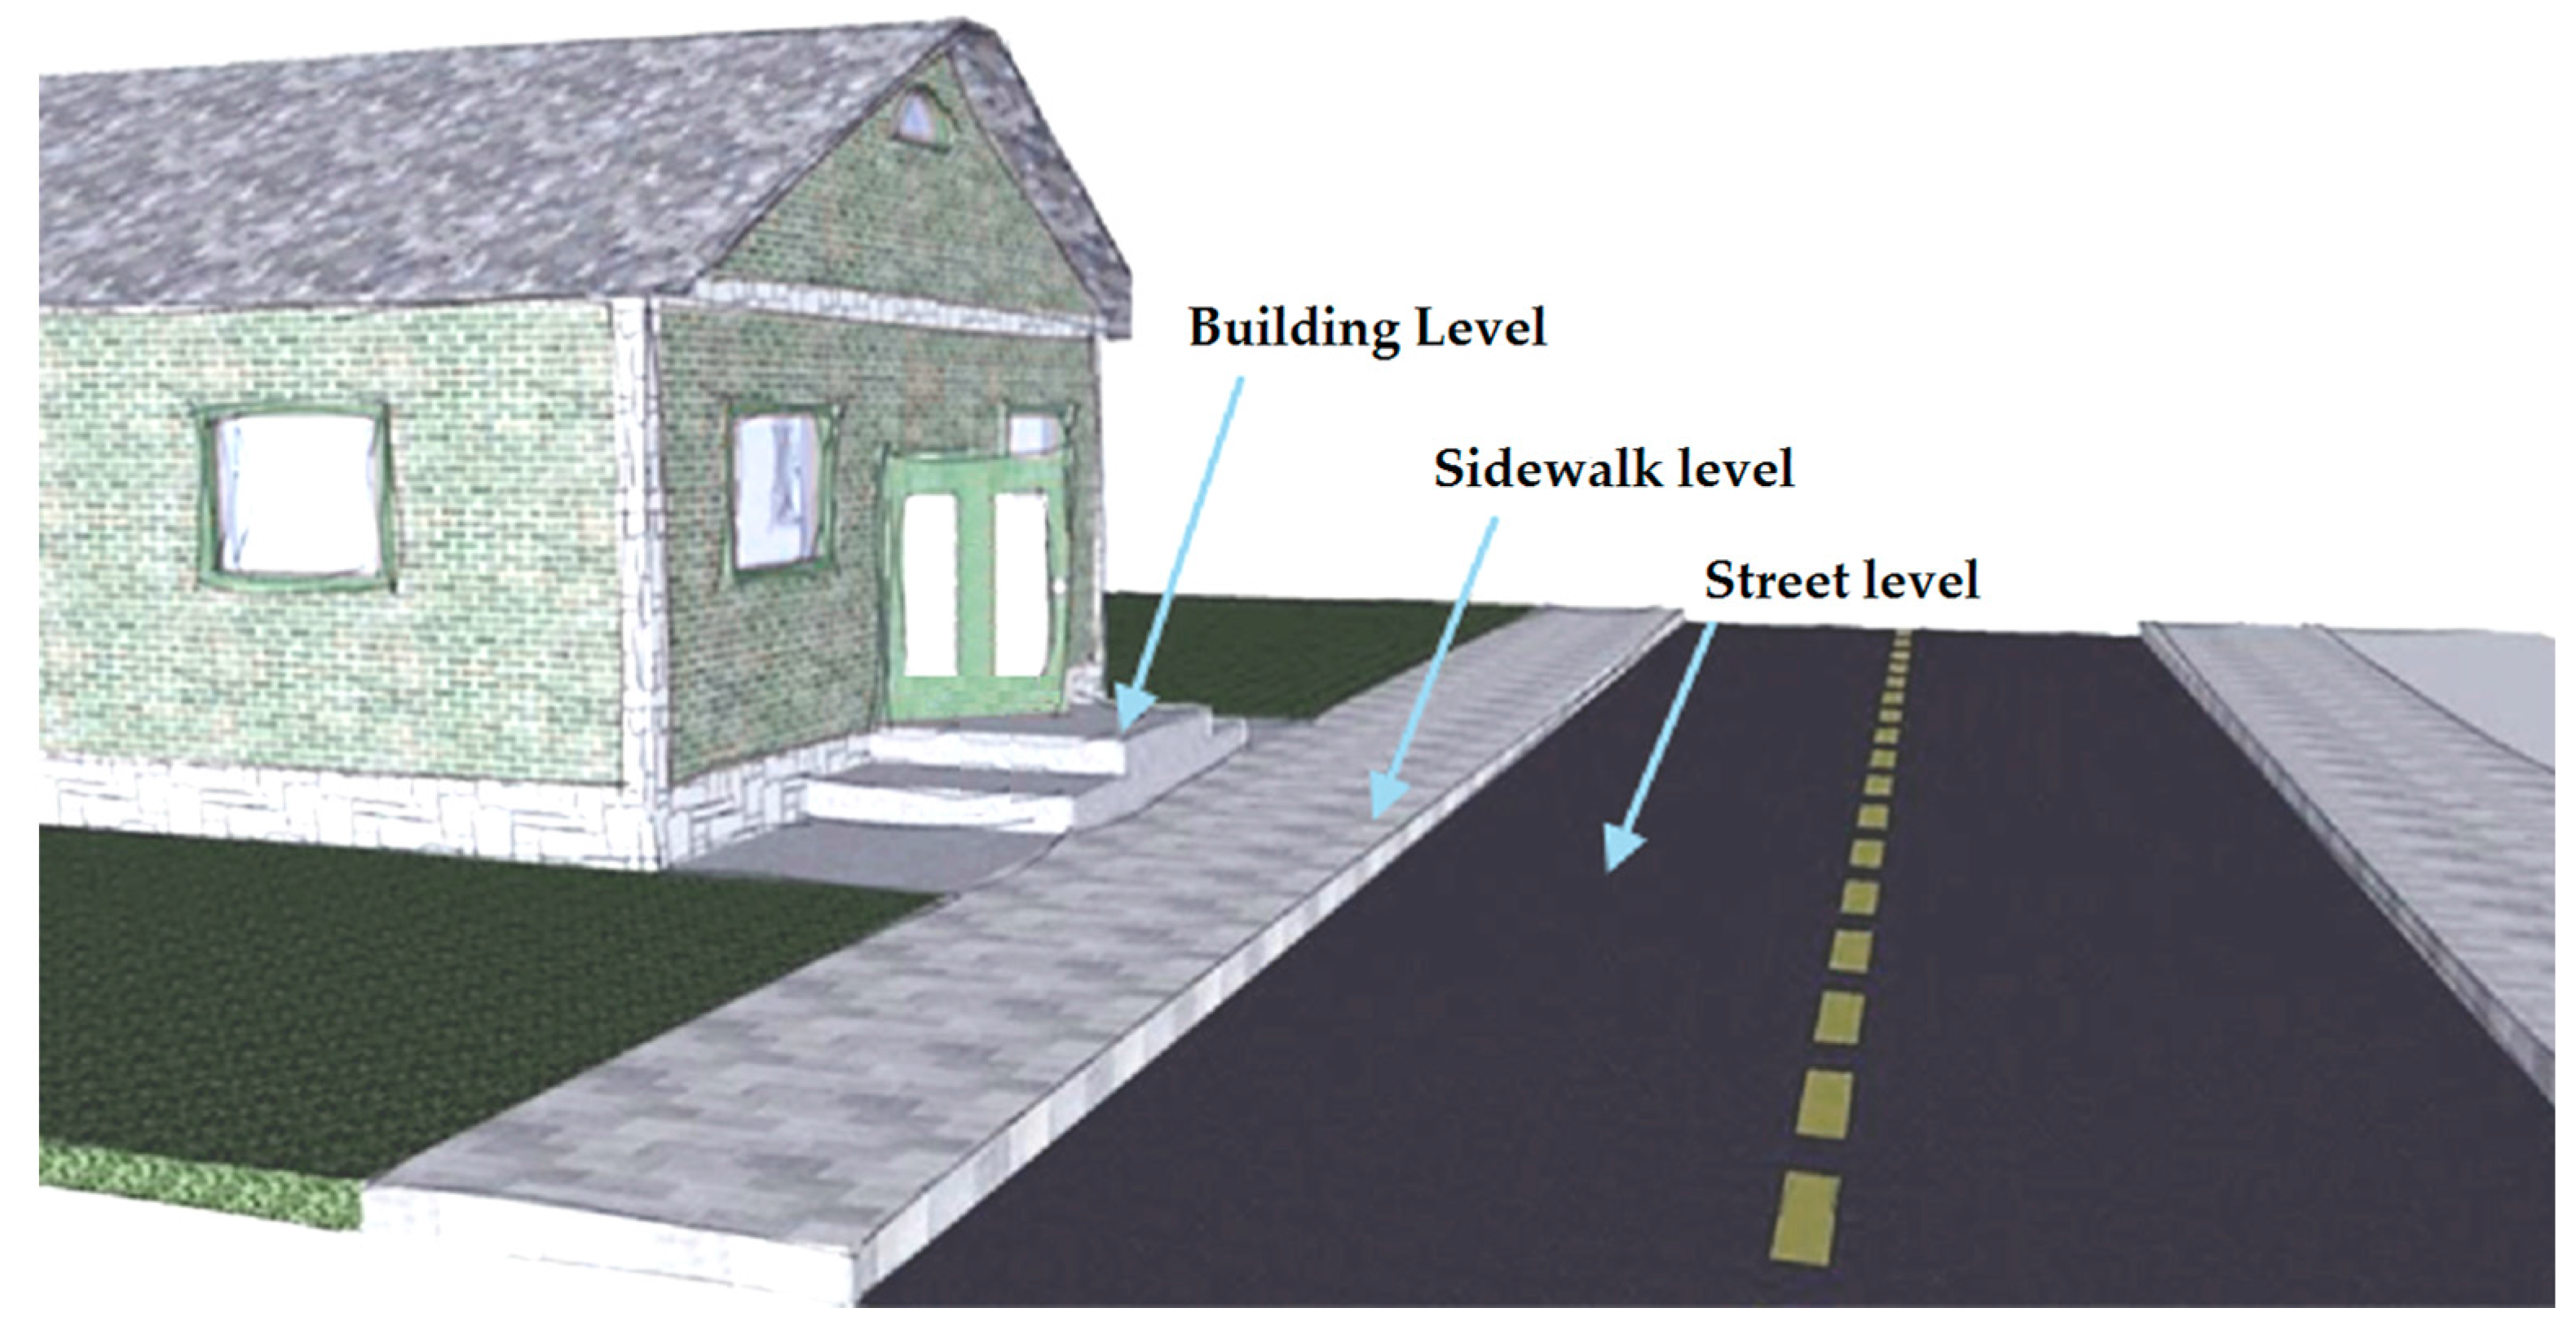
  • Urban surface cells: These cells are used to represent urban flood plain surfaces, where run-off occurs, as well as flood flows in inundated areas. They are larger areas, when compared with river cells, and they act as storage areas linked to each other by a hydraulic link (a street functioning as a channel, for example). They also may represent slope areas, if a little storage area is assigned, leaving the most part of the total area just to receive rainfall contribution.
  • Natural surface cells: These cells are similar to the preceding ones, but they do not consider any kind of urbanisation pattern. The connection between two of these cells may be done by natural channels or thalwegs. When there are local elevations inside this kind of cell, the storage area is reduced to calculate adequately water levels inside the cell.
  • Reservoir cells: These cells are used to simulate a temporary pond or reservoir, represented by the relation of the terrain elevation with the surface area. Departing from this curve, it is possible to evaluate the stored volume variation from the water depth variation. The reservoir cell type may play the role of damping inflow discharges when representing flood control measures.
The water level variation in a cell i, at a time interval t, is given by the continuity equation applied for that cell as stated in Equation (1), in discrete terms.
A s i t Z i t + 1 Z i t Δ t = P i t + 1 + k Q i , k t + 1
where Qi,k is discharge between two neighbouring cells i and k; Zi is the water surface level at the centre of the cell i; ASi is the water surface area for the cell i; and Pi is the discharge related to the rainfall over the cell.
The discrete time interval (n + 1)·Δt, represented by the index t + 1, is taken as the calculation time, when the variables are unknown. On the other hand, at the discrete time n · Δ t , represented by the index t, all variables are known, due to their previous calculation or because they were prescribed as initial conditions. The water surface area of the cell i, A S i t , is taken as a function of the known water level Z i t , implying that a first order approach, ( Δ A S i / A S i ) 1 , is adopted. P i is a known value, since the rainfall is considered a known entry for all time intervals. Z i t + 1 and Q i , k t + 1 are unknowns and the numerical scheme is implicit. To solve this equation, the unknown discharges may be written as a function of the water levels in the cell i and all its k neighbour cells. Thus, to avoid the presence of a non-linear term, it is possible to develop Q i , k t + 1 in Taylor series, taking only the first order terms, as shown in Equation (2).
Q i , k n + 1 = Q i , k n + Q i , k n Z i Δ Z i n + 1 + Q i , k n Z k Δ Z k n + 1
Taking into account the previous discussion, Equation (1) may be re-written as Equation (3).
A S i t Δ Z i t + 1 Δ t = P i t + 1 + k Q i , k t + k Q i , k t Z i Δ Z i t + 1 + k Q i , k t Z k Δ Z k t + 1
This way, analysing Equation (3), discharges are written in the time interval n·Δt, when all the variables are already known. The variables Δ Z i t + 1 and Δ Z k t + 1 are related respectively to the water levels Z i t + 1 and Z k t + 1 , written for each cell, and they are the only unknowns. They refer to the considered cell i and to its immediate adjacent k neighbours. Therefore, this system can be solved in a relatively simple way, once the mathematical relations for the discharges between cells are written for values of Z i t and Z k t . Cells are arranged in a topological scheme, which is numerically solved by a double sweep method [36,37].
The discharge links between cells can be expressed through known hydraulic laws. The possibility of introducing different mathematical relations is one of the features that inspire the use of the cell model to represent the urban floods diversity. The types of links considered in the current version of the model are briefly presented and discussed in the following.
Types of Links:
  • River/Channel link: This link is related to river and channel free flows corresponding to the De Saint Venant dynamic equation. Equation (4) results from the consideration of rectangular cross sections.
1 A i , k Q i , k t Q i , k A i , k 2 A i , k t + Q i , k A i , k 2 Q i , k x Q i , k 2 A i , k 3 A i , k x + g Z x + g S f = 0
where Ai,k is the wetted cross-section area between cells i and k; Sf is the energy line slope; and the other variables were previously defined.
The parameter Ai,k, and any other that appears in the flow section between cells i and k, may be evaluated through a weighting procedure departing from the values of water levels Zi and Zk.
Note that, when working with natural river stretches, the hypothesis of a rectangular cross section may be strong and should be used carefully. However, when modelling channelized urban rivers and considering artificial drainage systems, this is a reasonable approach. Besides that, the cell concept allows the modeller to compose a cross section using multiple cells with different terrain levels, representing the main channel, the secondary channels and the flood plains.
Multiplying Equation (5) by Ai,k, and using the traditional form of the continuity equation to substitute Q i , k x by A i , k t , Equation (5) may be written:
Q i , k t 2 Q i , k A i , k A i , k t Q i , k 2 A i , k 2 A i , k x + g A i , k Z x + g A i , k S f = 0
Remembering that the discharges relations were written in the time interval n·   Δ t , the expression to evaluate this discharge explicitly provides the entrance required in the modified continuity Equation (3). Writing Equation (5) in discrete terms leads to Equation (6), considering cell i in an upstream position:
Q i , k t Q i , k t 1 Δ t 2 Q i , k t A i , k t A i , k t A i , k t 1 Δ t ( Q i , k t A i , k t ) 2 A k t A i t Δ x + g A i , k t ( Z k t Z i t Δ x ) + g A i , k t S f = 0
Sf, by its turn, may be approximated by Expression (7):
S f = Q i , k 2 n 2 A i , k 2 R i , k 4 3
where: n is Manning’s roughness coefficient; Ri,k is the hydraulic radius of the flow cross-section between cells i and k.
Combining Equations (6) and (7), the term Q i , k t is the focus of interest. To explicate this term and obtain a direct solution for this equation, the quadratic terms were “factored”, using a numerical simplification as it can be seen in Expression (8).
( Q i , k t ) 2 = Q i , k t 1 Q i , k t
From this discussion, Equation (9) for the river flow link is obtained and may be used in the mass conservation balance:
Q i , k t = Q i , k t 1 g A i , k t Δ t ( Z k t Z i t ) Δ x 1 2 ( A i , k t A i , k t 1 ) A i , k t Q i , k t 1 A i , k t 1 A i , k t A k t A i t Δ x Δ t + g A i , k t Q i , k t 1 n 2 A i , k t 1 A i , k t ( R i , k t 1 R i , k t ) 2 3 Δ t
  • Surface flow link: This link corresponds to the free surface flow without inertia terms, as presented in Zanobetti et al. [37]. MODCEL uses this link frequently to represent flow between surface cells (natural and/or urban).
  • Storm drain link: This link represents the flow that occurs in closed conduits. Depending on the flow conditions, this can be a free surface flow or an under pressure flow, if the storm drains become drowned. Free surface flow is modelled in this case exactly as it is in surface links, using simplified De Saint Venant dynamic equation. On the other hand, when storm drains surcharge, the energy conservation law is used to draw the flow conditions and calculate discharges through cells.
There are two possibilities to use this link. The first one, which refers to the original representation, considers the main drainage line entering in a closed cross section. In this case, MODCEL considers the closed storm drain as cells linked between each other. They also communicate with superficial cells, by manholes to a street above them. In this situation, flow over the street, represented by an urban surface cell, occurs with free surface and the water level associated to this flow can be considered equal to the piezometric line level for the drowned storm drain flow. In this case, cross sections are also rectangular. It is important to note that mass balance is calculated accordingly with real geometry, and the model keeps track of the cross section water levels and possible surcharge.
In the second possibility, which is used to represent minor drainage network, the manholes are represented by cells, but the storm drains are simple links, without the need to introduce a formal cell. Cross sections are taken as circular ones.
Thus, departing from Bernoulli Equation (10), Equation (11) is developed, where cell i is in the upstream position. Figure 3 shows the storm drain link representation. It is important to stress that, with these considerations, depending on the water levels involved in the calculation, flow might be forced backwards (what can really happen in physical reality).
Z i + v i 2 2 g = Z k + v k 2 2 g + S f Δ x
Q i , k = [ 2 g ( Z k Z i ) 1 A i 2 1 A k 2 2 g n 2 Δ x A i , k 2 R i , k 4 3 ] 1 2
  • Entrance and outfall links: These two links represent flow conditions at the entrance and at the outfall of closed section of the major drainage, in their transition to open channels. If there is a free surface flow at the entrance or outfall of the closed reach, this link acts as a channel link, with a local head loss. If the entrance/outfall is drowned, then Bernoulli equation is used.
  • Storm drain discharge into an open channel link: This link allows a storm drain to discharge into an open channel, arriving at a level higher than that of the river bottom, acting as free broad crested weirs, drowned weirs, or orifices, depending on water level in the channel.
In MODCEL, junctions of river reaches are treated as special cells with “Y” shape, where mass balance equates inflows and outflows and, therefore, this kind of confluence does not need a special link.
  • Inlet link: This link promotes the interface between the street gutters of the surface cells and the underground storm drain cells. When not drowned, it acts as an equivalent weir conveying flow from streets to storm drains. This weir has the length of the perimeter of a single inlet multiplied by the number of inlets along the street modelled by the considered cell. When drowned, this link considers flow occurring through a certain number of orifices associated to the inlet grates in the street.
  • Broad crested weir link: This link represents the flow over broad-crested weirs. It is used, mainly, to represent the flow between a river and its riverine areas. The classic formula of flow over broad-crested weirs is used here. Flow over a weir may be free or drowned, depending on water levels of the cells connected by this link.
  • Orifice link: This link represents the classic formula for flow through orifices.
  • Reservoir link: This link combines orifices (at different possible heights), as the outlet discharge of a reservoir, with a weir, which can enter or not in charge, depending on reservoir operation. It is useful to simulate the damping effect of a reservoir, in the design condition, and to verify reservoir operation in more severe conditions (those in which the weir can start to be used).
  • Stage-discharge curve link: This link corresponds to a mathematical relation calibrated for hydraulic structures in a laboratory and basically relates discharges with water levels.
  • Pumping link: This link allows discharges pumped from a cell to another departing from a starting pre-defined operation level.
  • Flap gate link: This link simulates flows occurring in the direction allowed by the flap gate opening, and can be found, normally, in regions protected by polders.

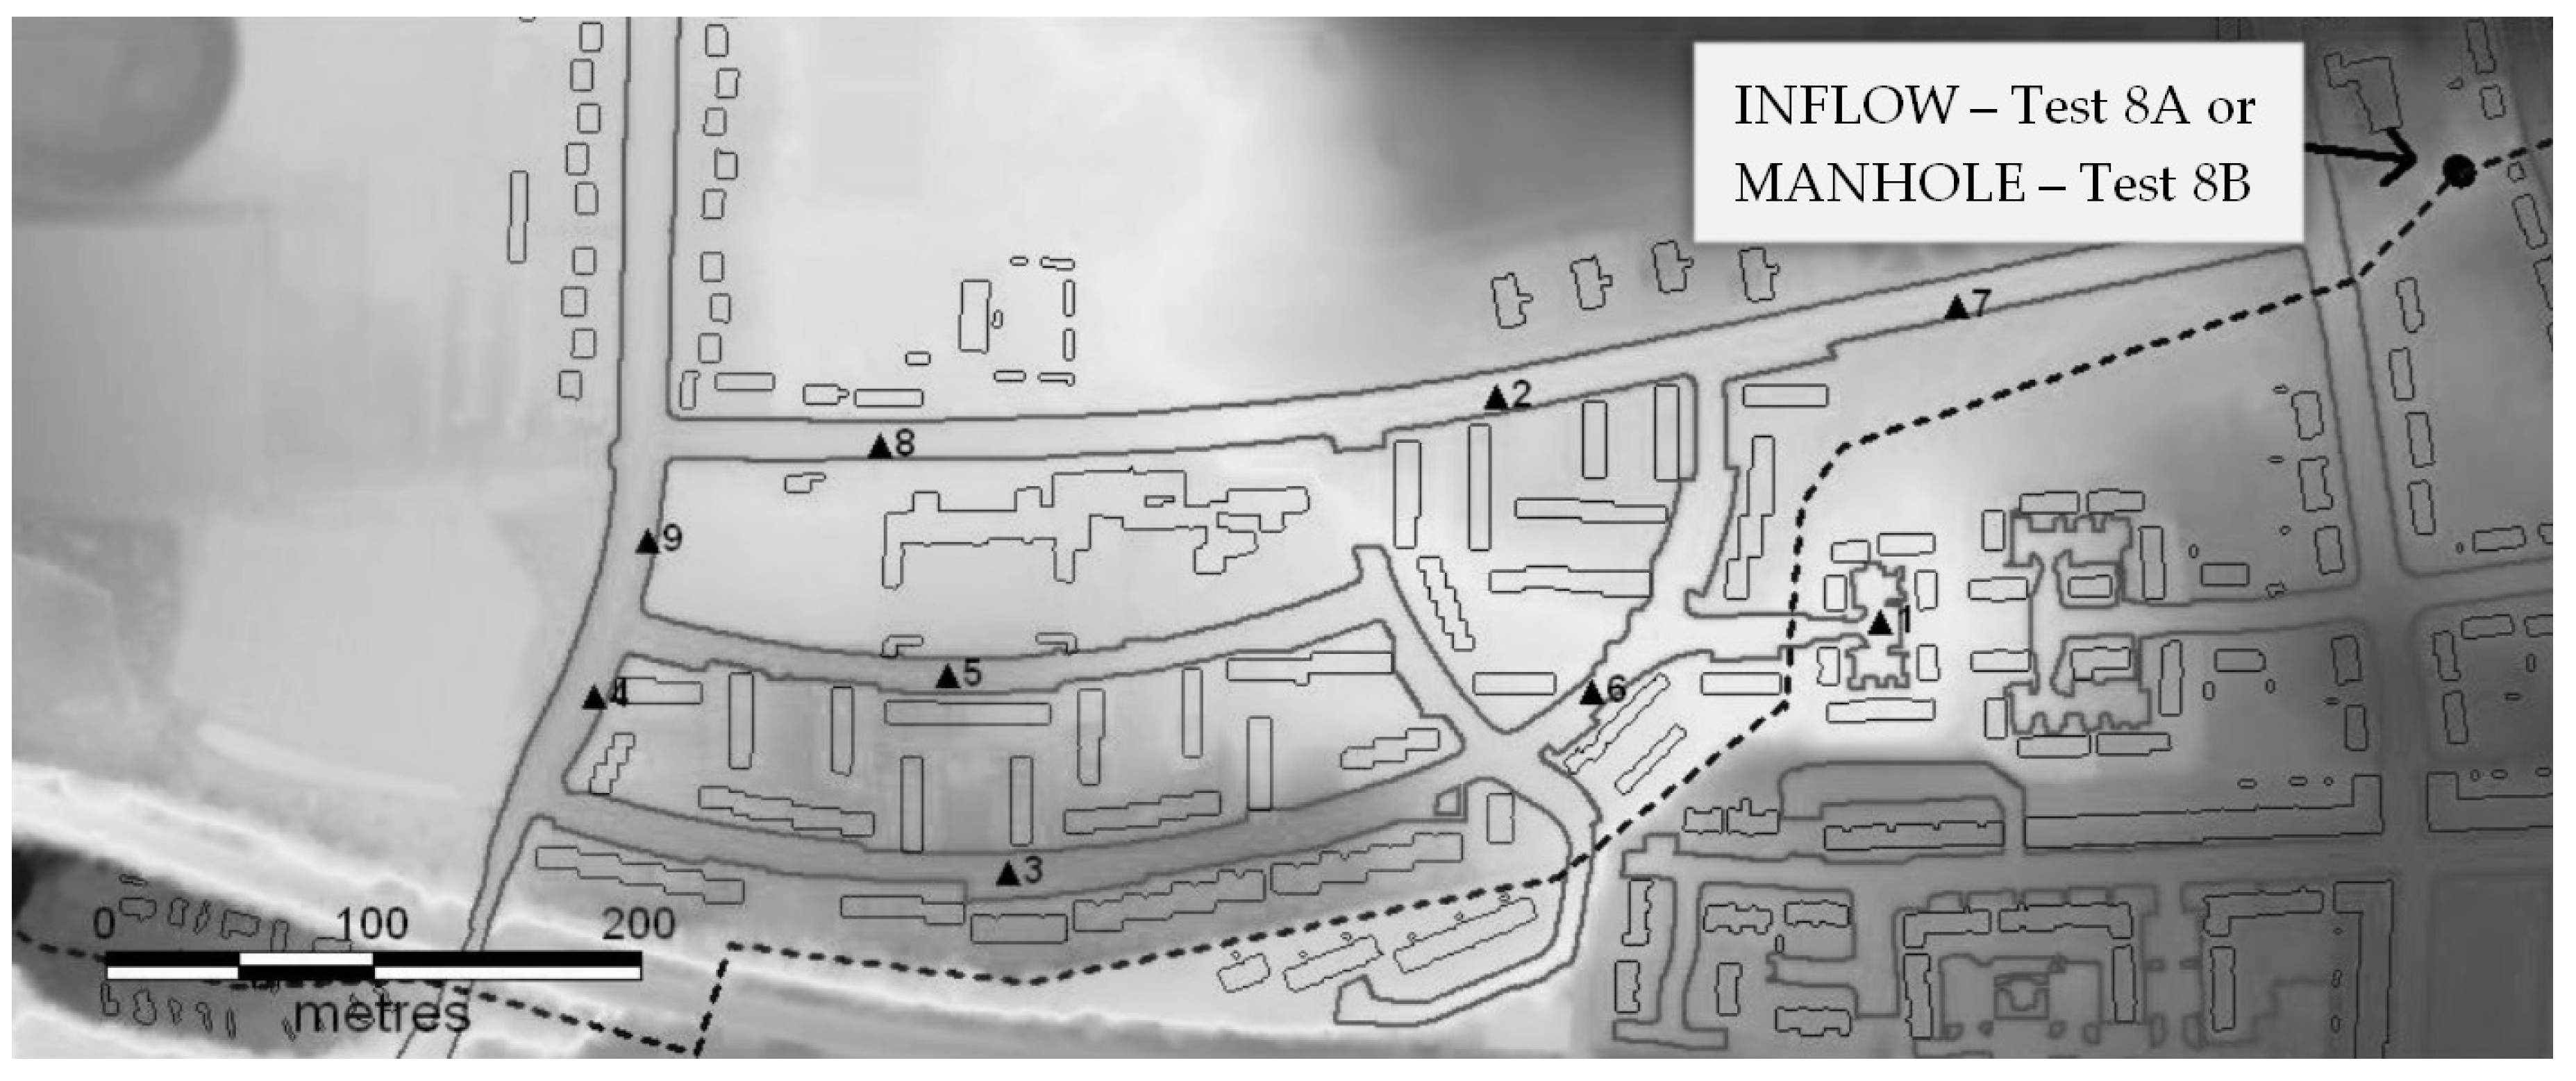
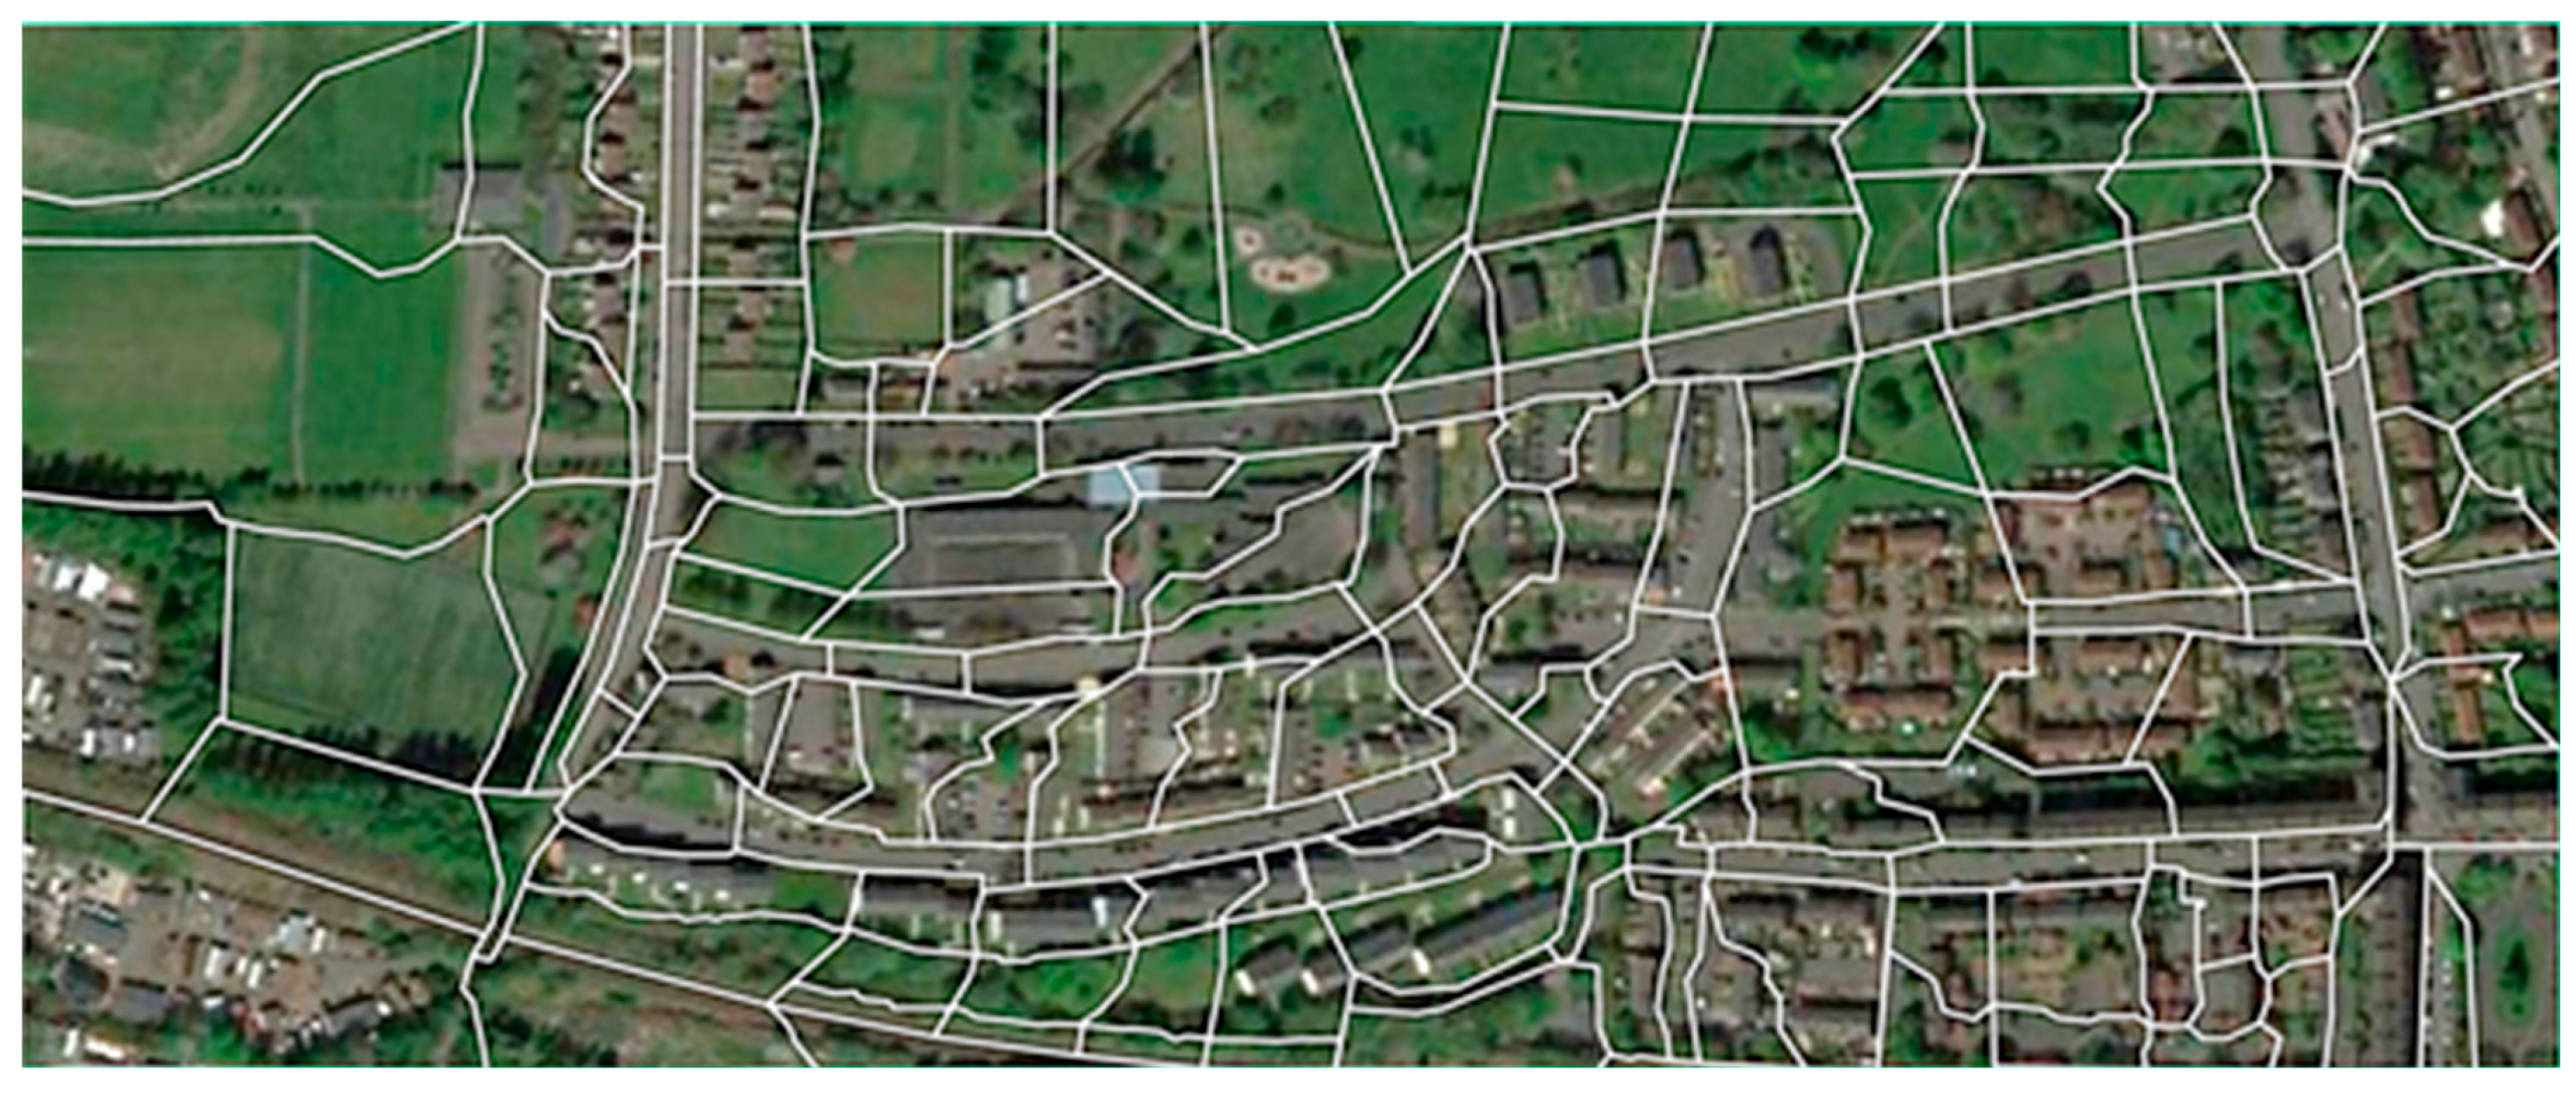
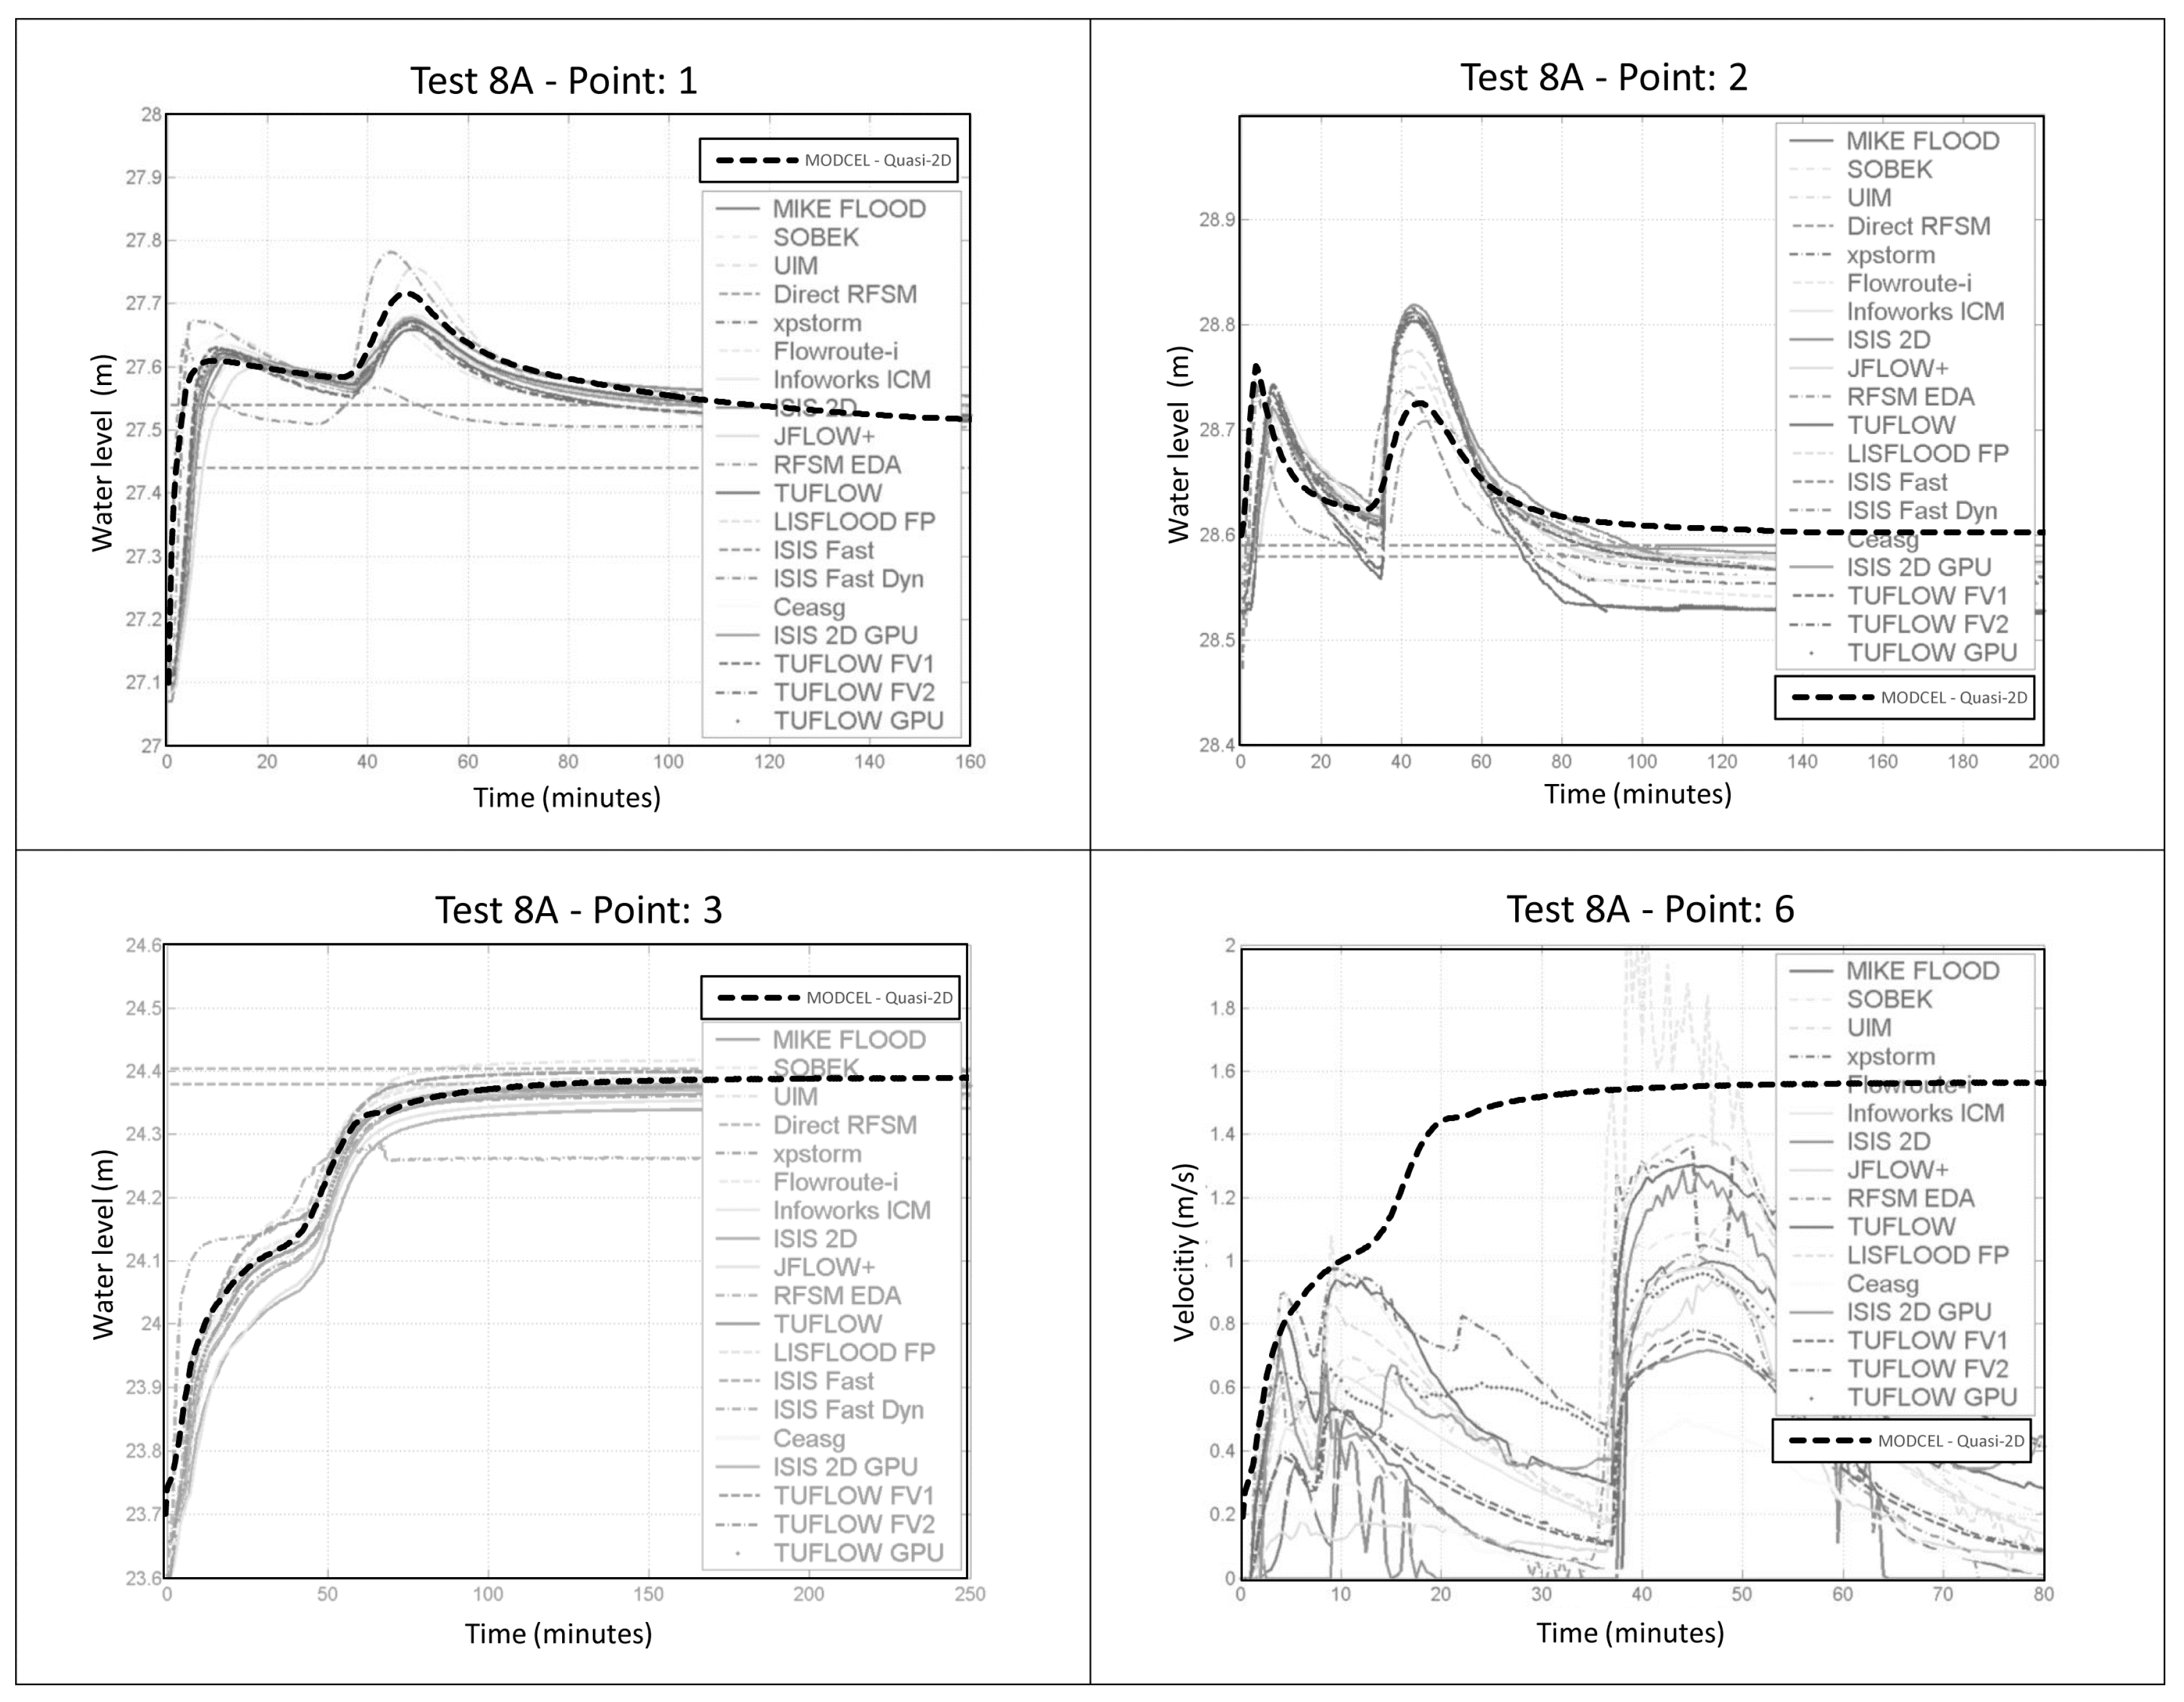
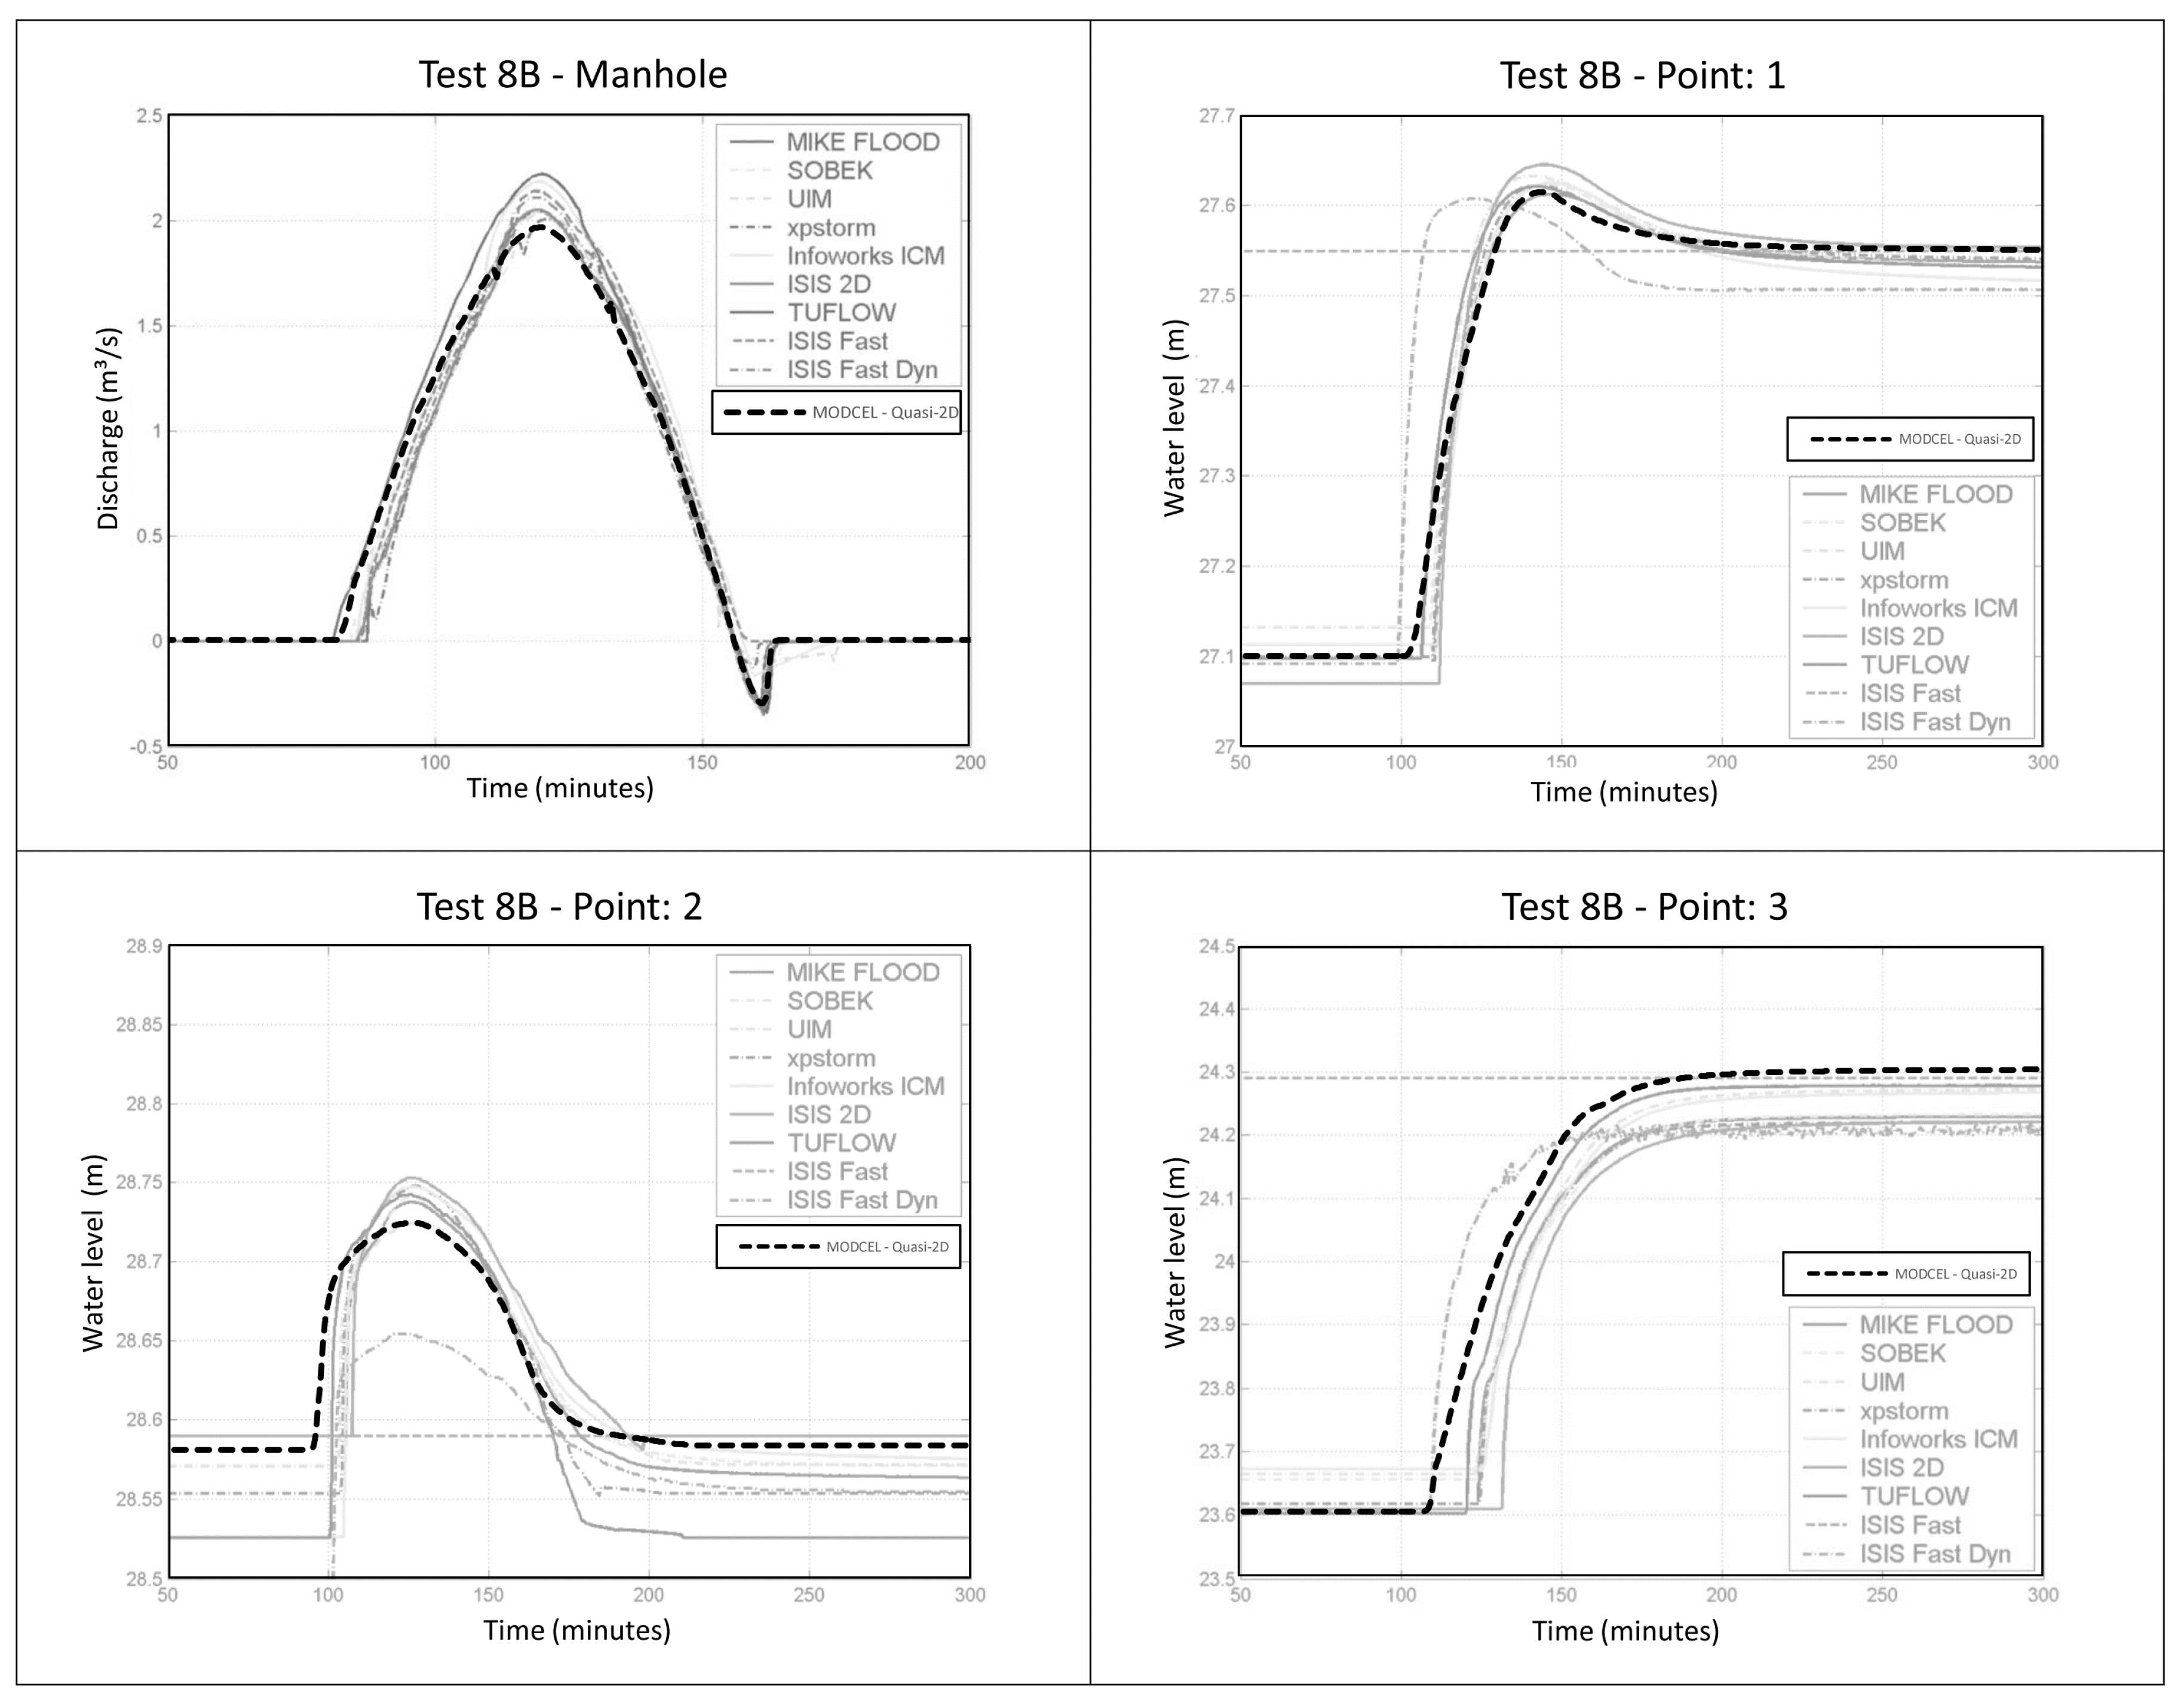
5. Benchmarking MODCEL

This section intends to show MODCEL performance in a benchmark test proposed in a research commissioned by the British Environment Agency in the context of the Flood and Coastal Erosion Risk Management Research and Development Programme. The resulting report of this research [33] describes “the results from a benchmarking exercise assessing the latest generation of 2D hydraulic modelling tools for a variety of purposes in Flood and Coastal Risk Management to support Environment Agency decision making”. This benchmarking exercise involves 10 test cases and one of the objectives of this research is to provide a data set against which a model can be evaluated by its developer.
Test 8, in particular, was designed to benchmark models for urban flood modelling and it is divided in two parts, 8A and 8B.
Test 8A assumes that the flood arises from two sources: a uniformly distributed rainfall event (peaking at 400 mm/h over a time base of 3 min), applied to the modelled area; and a point discharge source occurring over a time base of approximately 15 min, reaching a peak at 5 m3/s, 35 min after the rainfall event. This point source occurs at the location represented by the “INFLOW” indication in Figure 4. In Test 8B, a culverted watercourse of circular section is assumed to run through the site, with a single manhole at the location indicated as “MANHOLE” in Figure 4. An inflow boundary condition is applied at the upstream end of the pipe, forcing a surcharge at the manhole, aiming at assessing the model capability to simulate shallow inundation resulting from a surcharged underground pipe.
The modelled area is a rectangle of approximately 0.4 km by 0.96 km as it is shown in Figure 4. Model grid resolution is 2 m, resulting in ~97,000 nodes (0.388 km2). The test considers initial dry bed, Manning’s coefficient of 0.02 for roads and pavements and 0.05 elsewhere
Figure 5 shows the test area divided into cells, resulting in a mesh of 163 cells (contrasting with the expected 97,000 simulation nodes). Roads were individualised to act as channels, while blocks (with buildings and open green areas) were mainly taken as storage areas, although they are also allowed to represent surface flows. Figure 6 and Figure 7 show the results obtained with MODCEL, respectively, for Test 8A and Test 8B, compared with the published results [33]. Time of simulation using MODCEL to obtain these results was 3 min and 10 s. The simulation time step gave answers at each 1 s.
Observing the results obtained with MODCEL, when compared with the set of 2D models that participated in the test and that had their results published in Néelz and Pender [33], it is possible to note that there are no significant differences. In Test 8A, the major differences refer to the velocity measures—and this is, probably, the major weakness of MODCEL, due to the hydrodynamic 1D relations, that are not able to capture transversal interferences. Test 8B showed equivalent results among the different models and MODCEL, both for discharge and water levels observations.

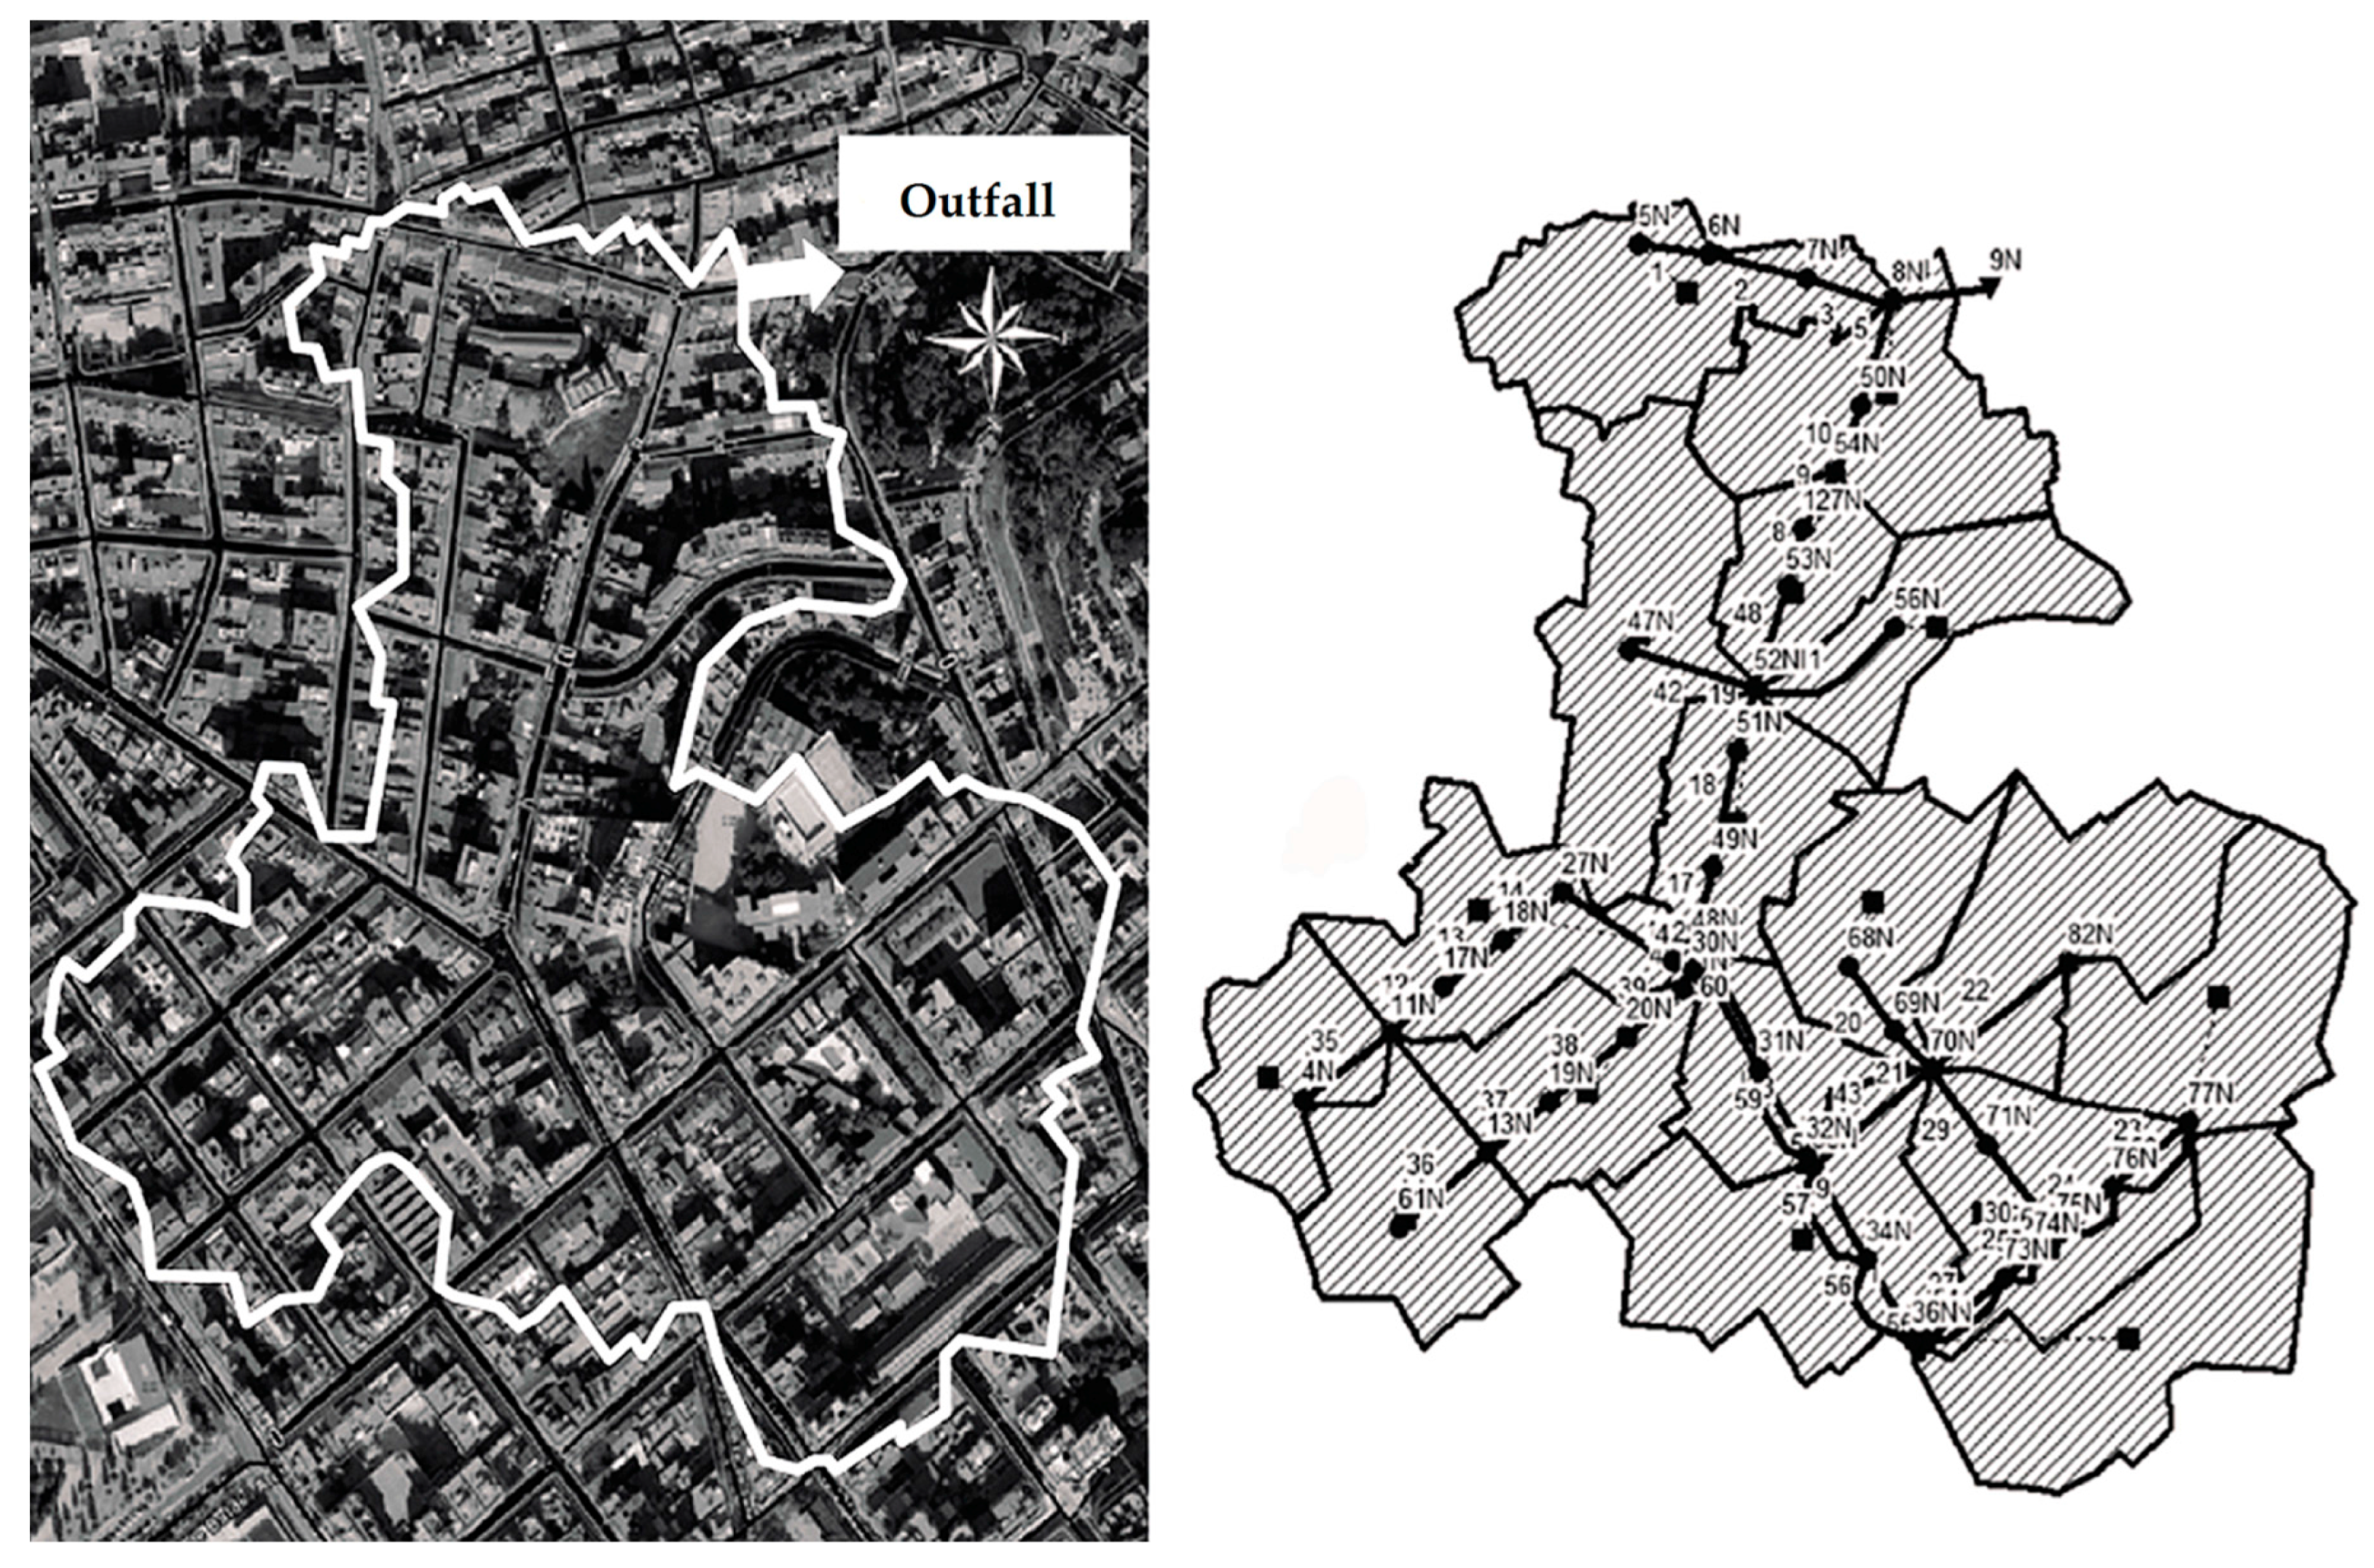
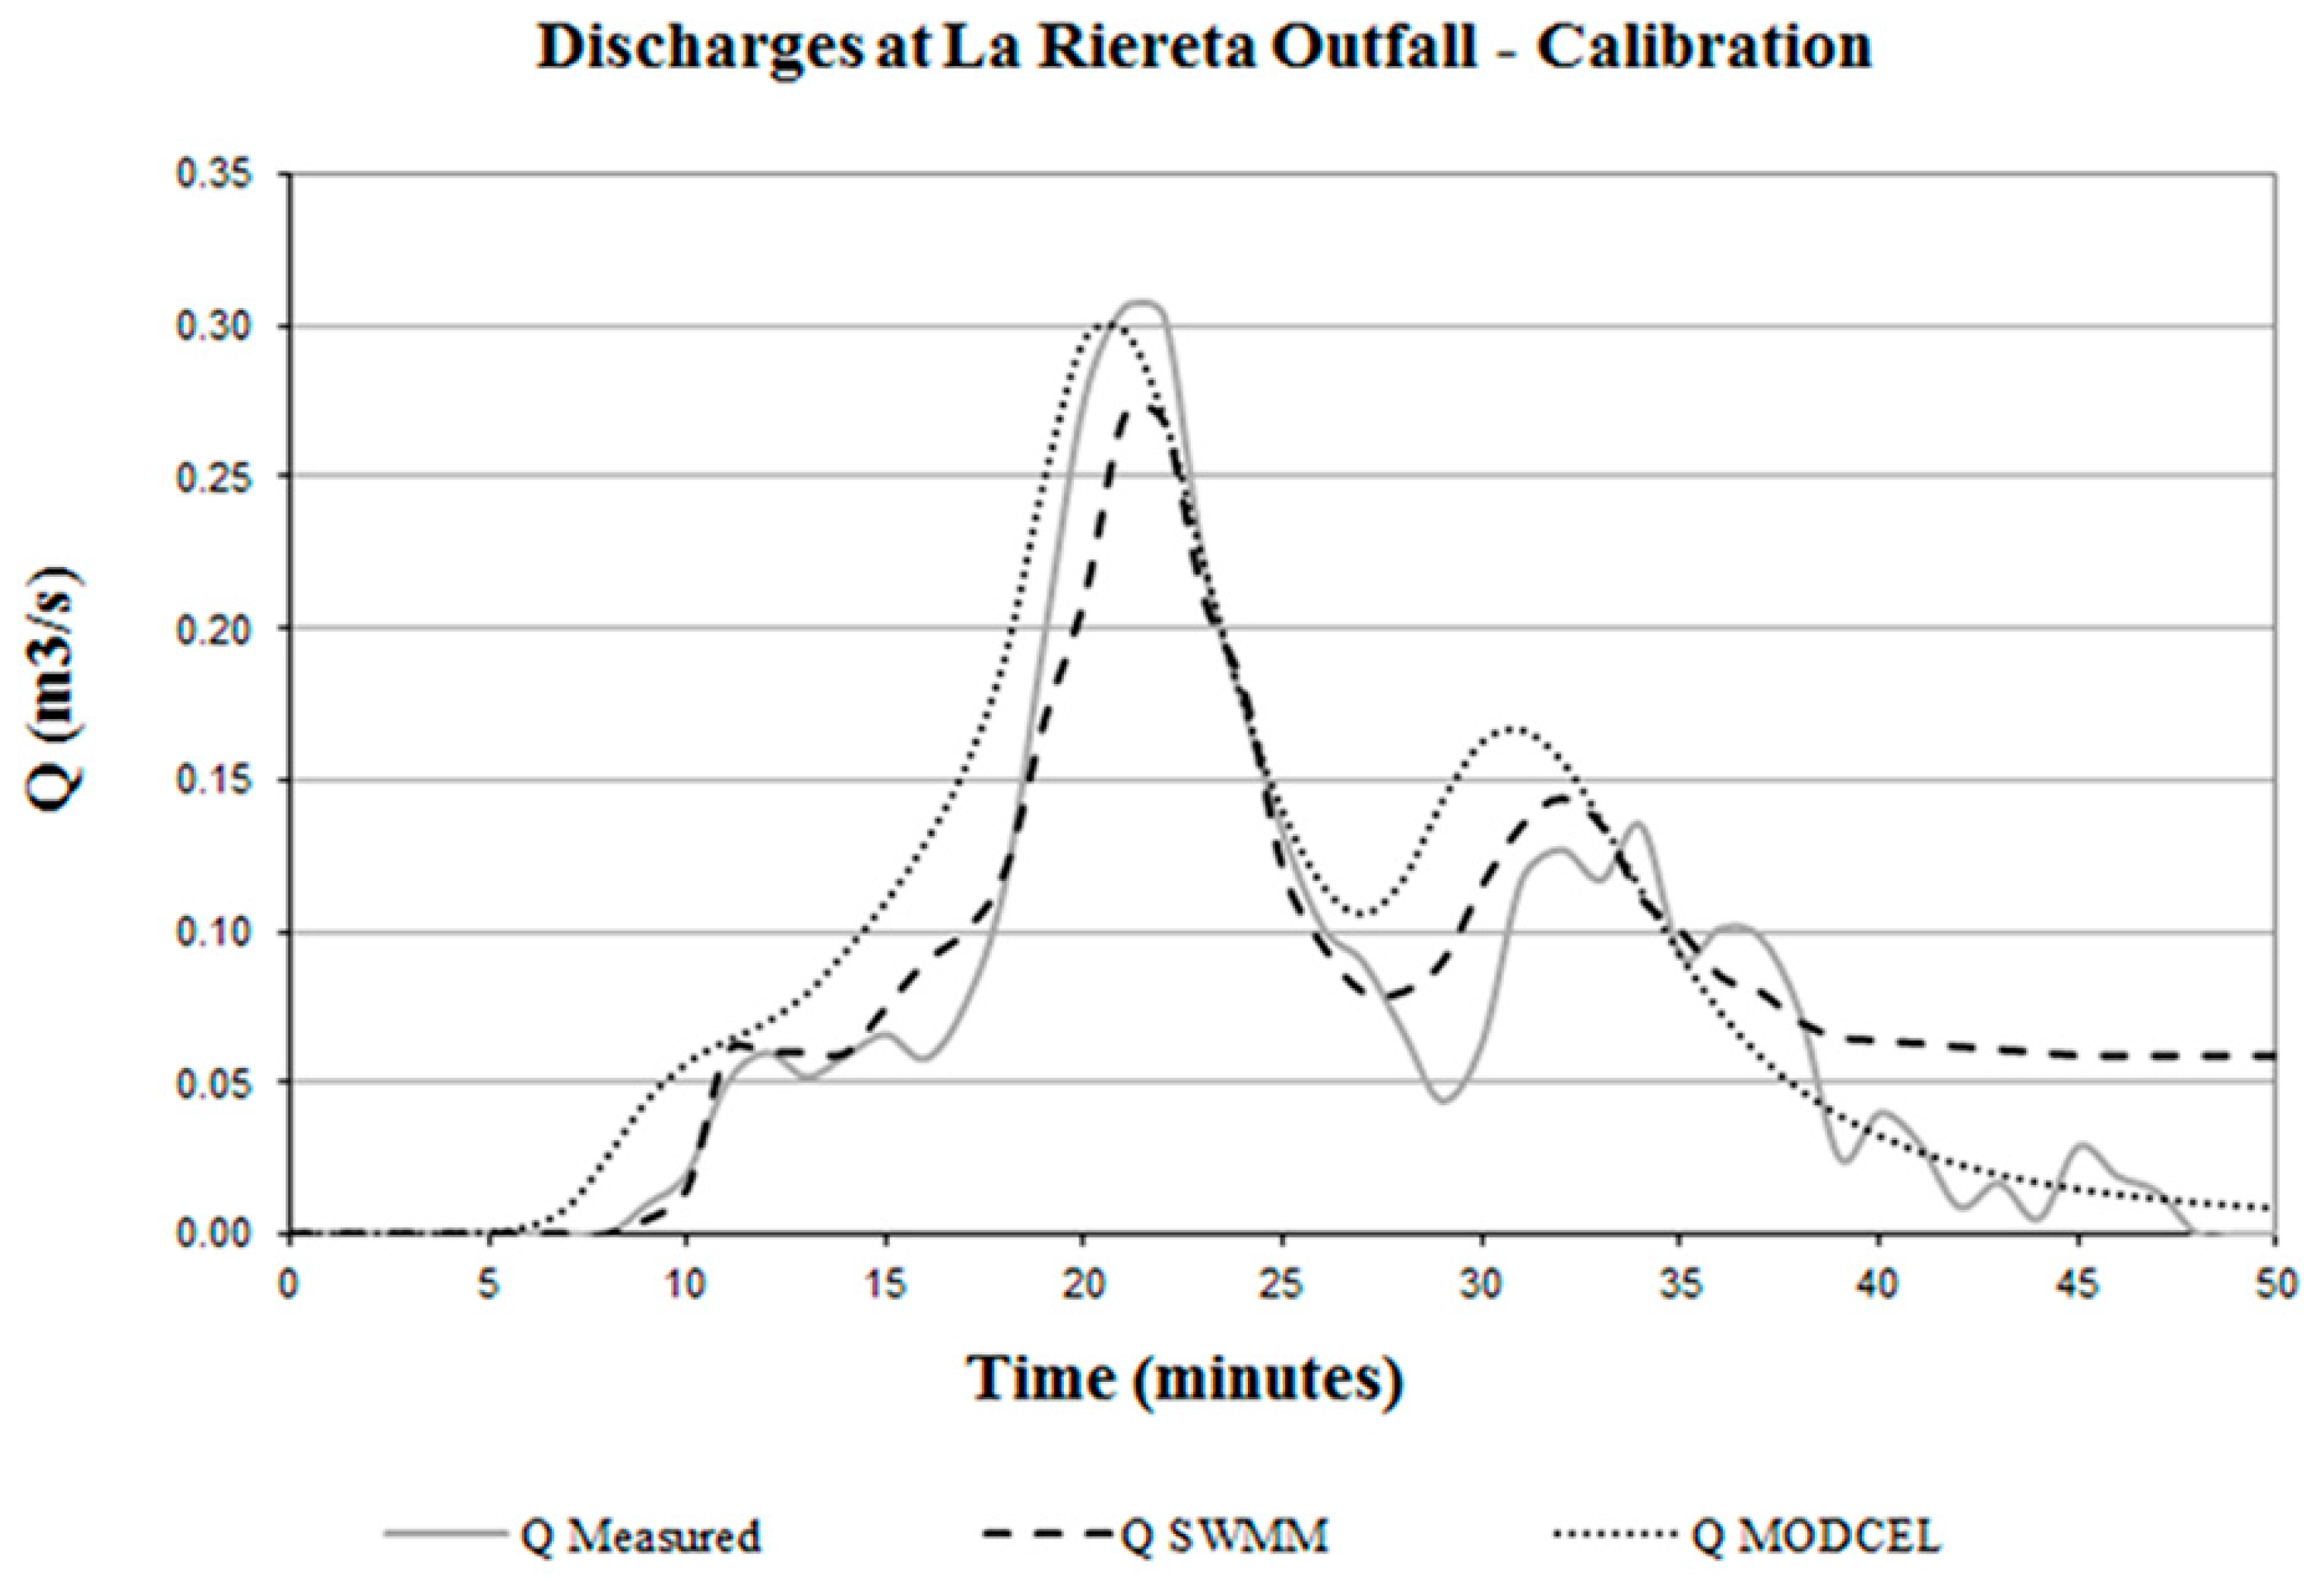
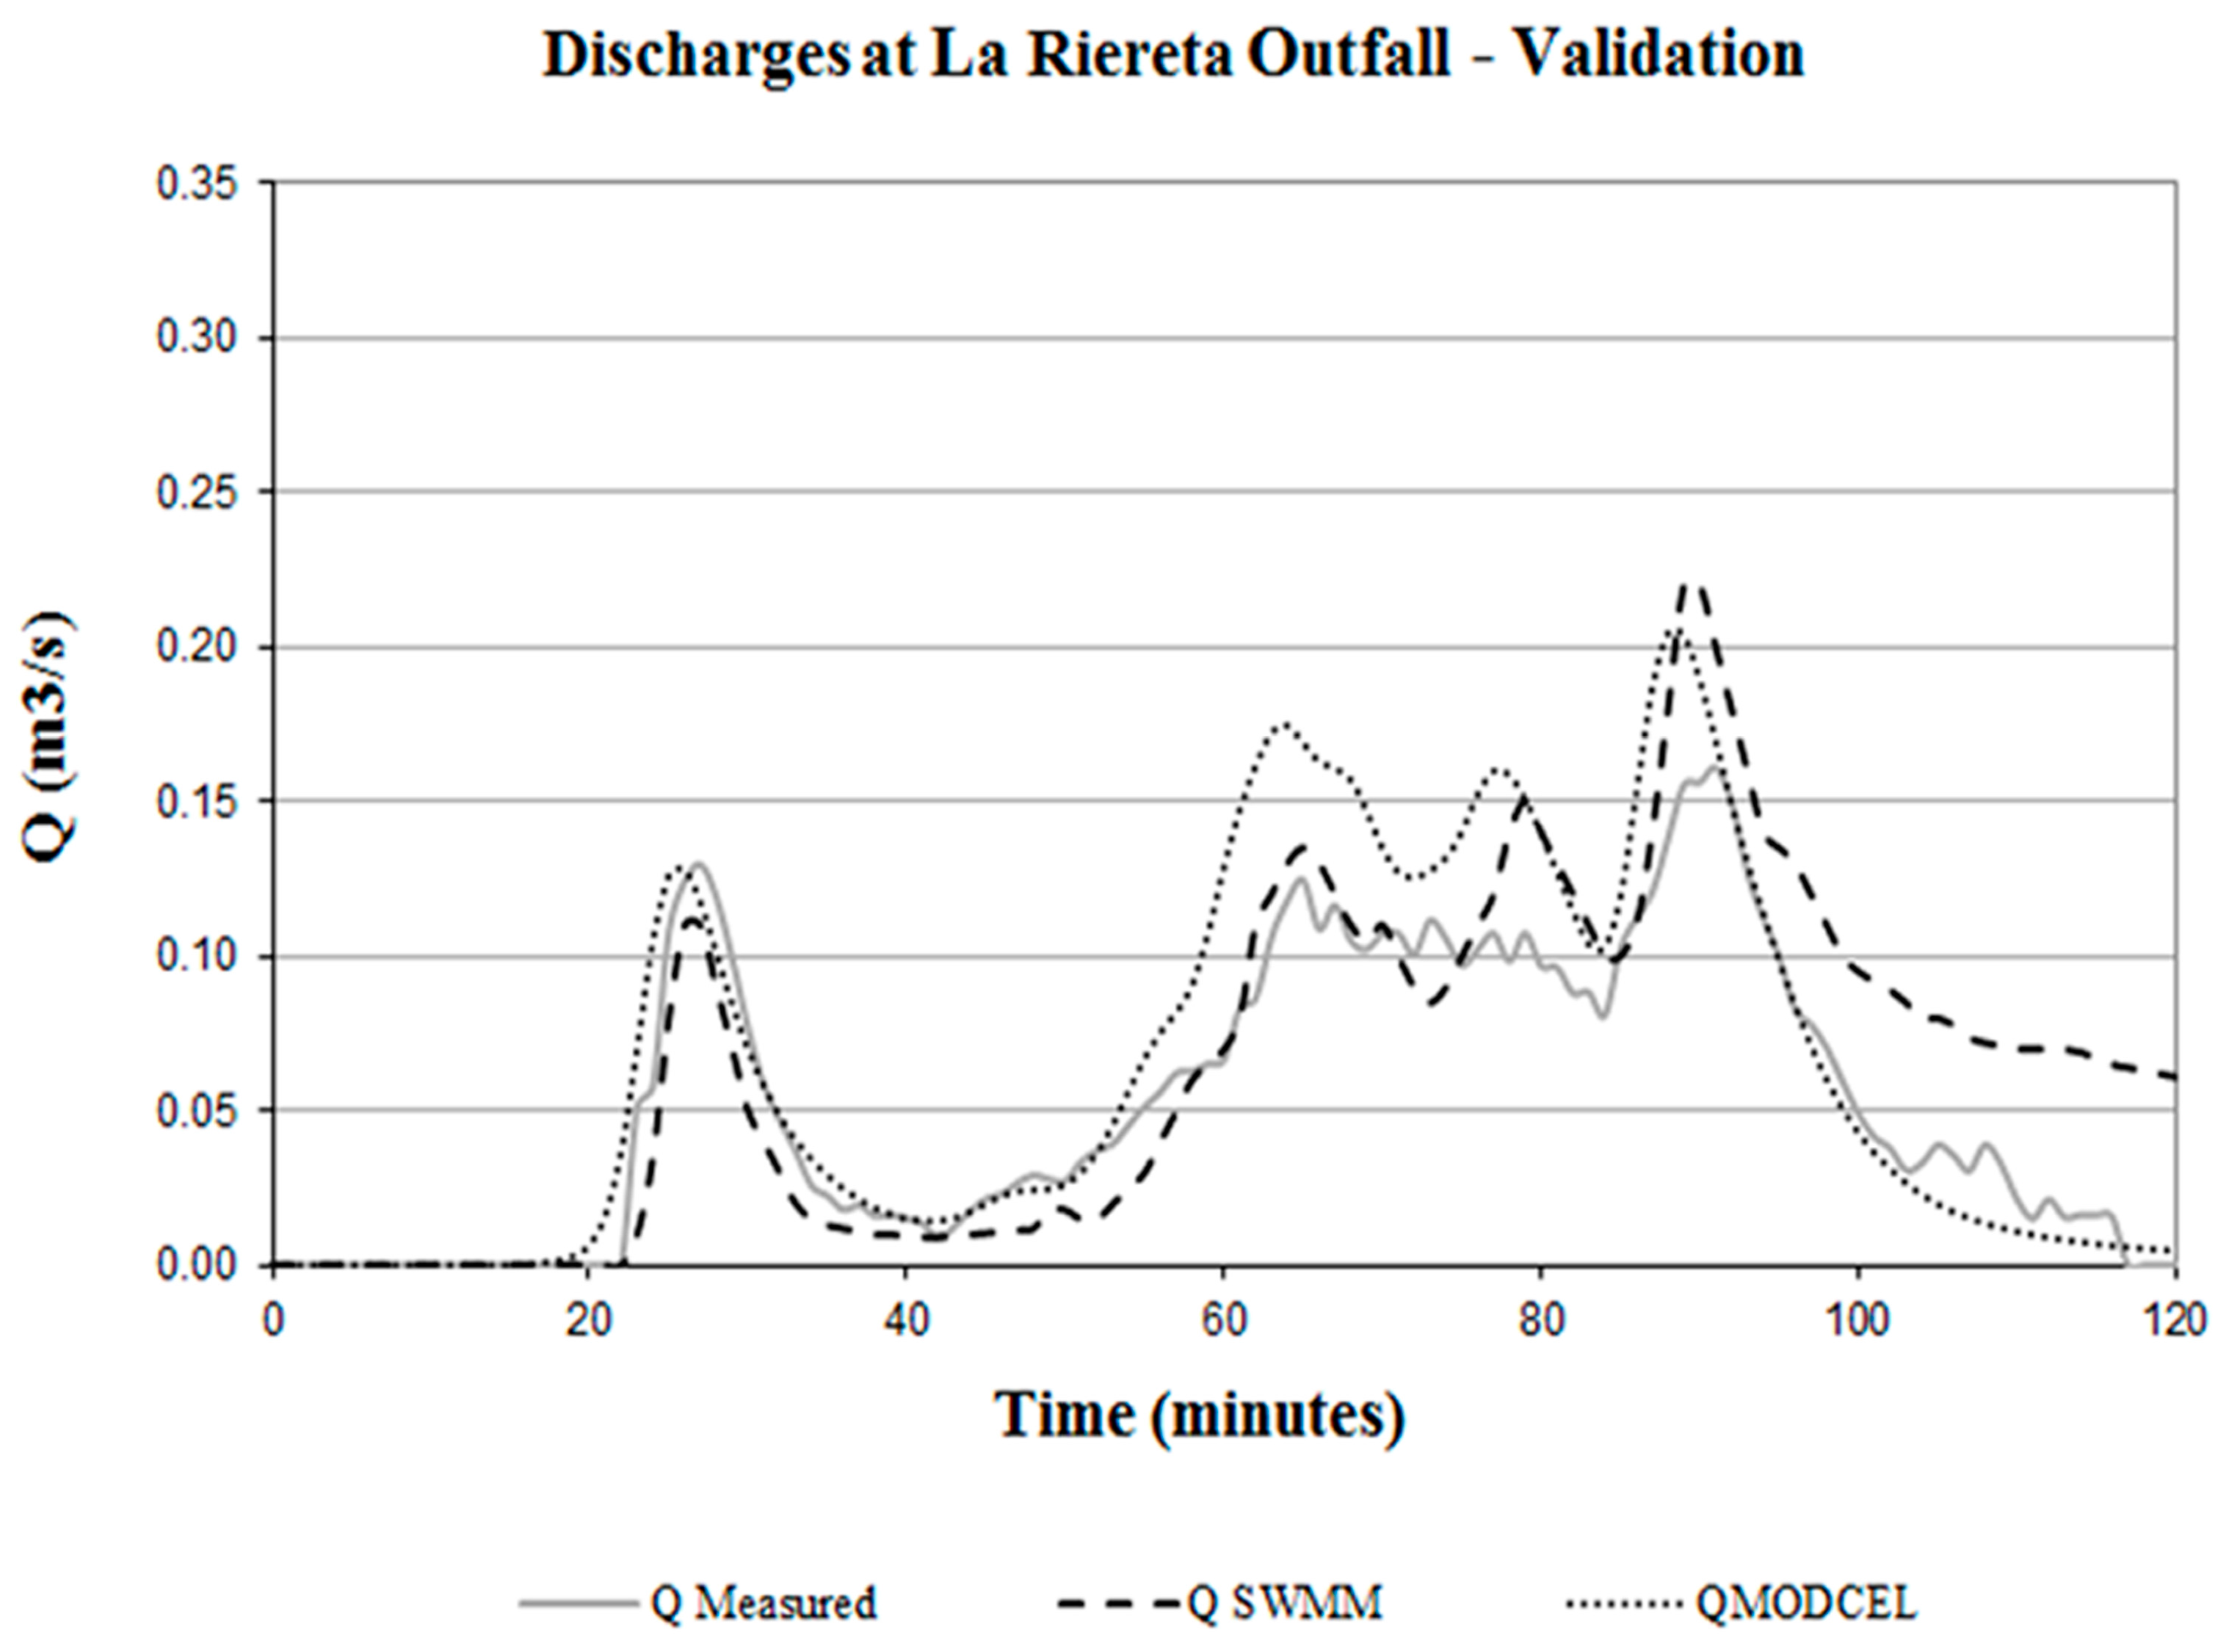
6. MODCEL and Minor Drainage Representation at La Riereta Watershed, Saint Boi de Lobregat/Spain

This test was introduced to compare MODCEL with a well-known software for urban storm drains simulation—the Storm Water Management Model (SWMM), developed by the United States Environmental Protection Agency (US-EPA), was used as reference. La Riereta watershed is located in the old town of Sant Boi de Llobregat, near Barcelona. This urban basin has a superficial area of nearly 180,000 m2, with a high level of impervious surfaces and medium slope values. Runoff generated by rooftops is dropped directly to the streets where a large set of grate inlets are located on sidewalks to assure the capture of the superficial flows. The sewer of “La Riereta” is a combined system, consisting mostly of circular conduits with variable diameters. The majority of the pipes are made of concrete. Figure 8 shows a map of this watershed. According to topographic characteristics, This Figure also shows 17 sub-catchments in a topological scheme defined for SWMM modelling purposes. The same division was assumed in MODCEL, to test its capabilities in the same conditions and without increasing the level of details. In general terms, the manholes were taken as cells, and storm drain links ware written between each pair of manholes, connecting them. Then, the 17 sub-catchments were defined as urban surface cells and they were connected with manholes by inlet links, and they were also connected with each other by surface flow links.
Figure 9 and Figure 10 show the obtained results for SWMM and MODCEL in the calibration and validation phases, respectively, comparing these results with measured events.
It is possible to note that both models performed reasonably well, representing adequately flood peaks, peak phase and hydrograph form. Simulated volumes, however, are a little bit greater than the observed ones.

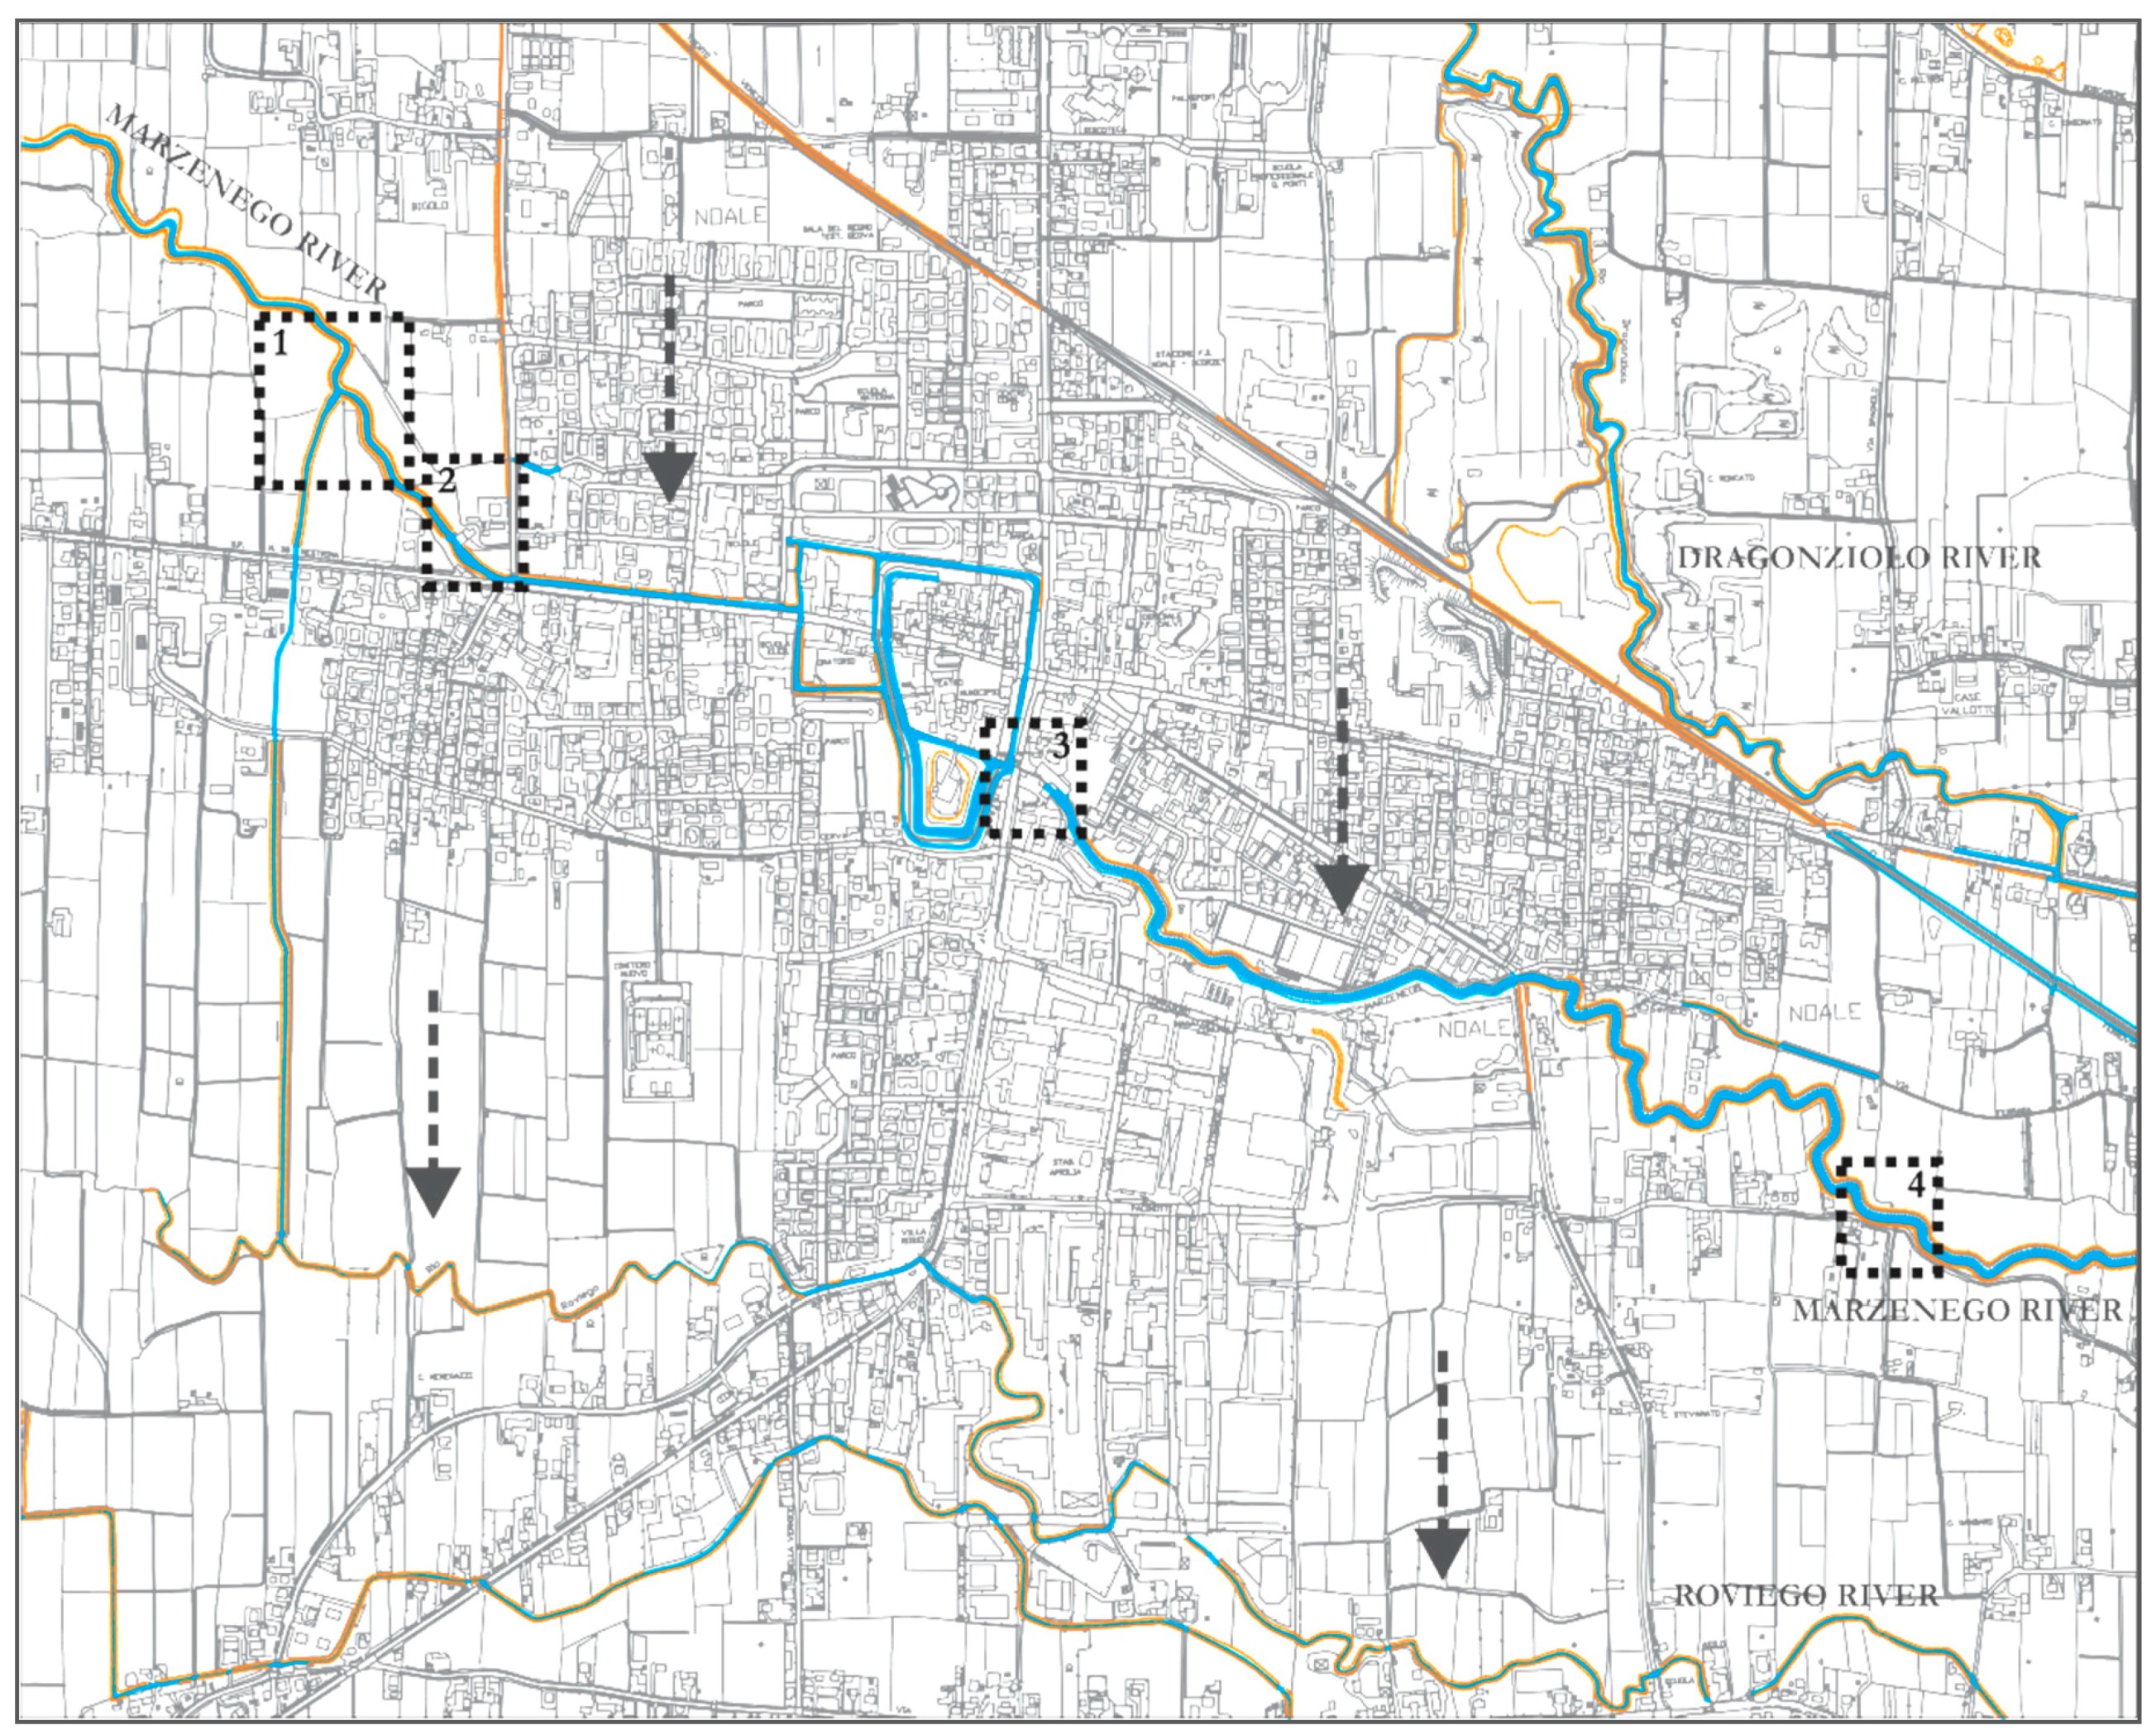
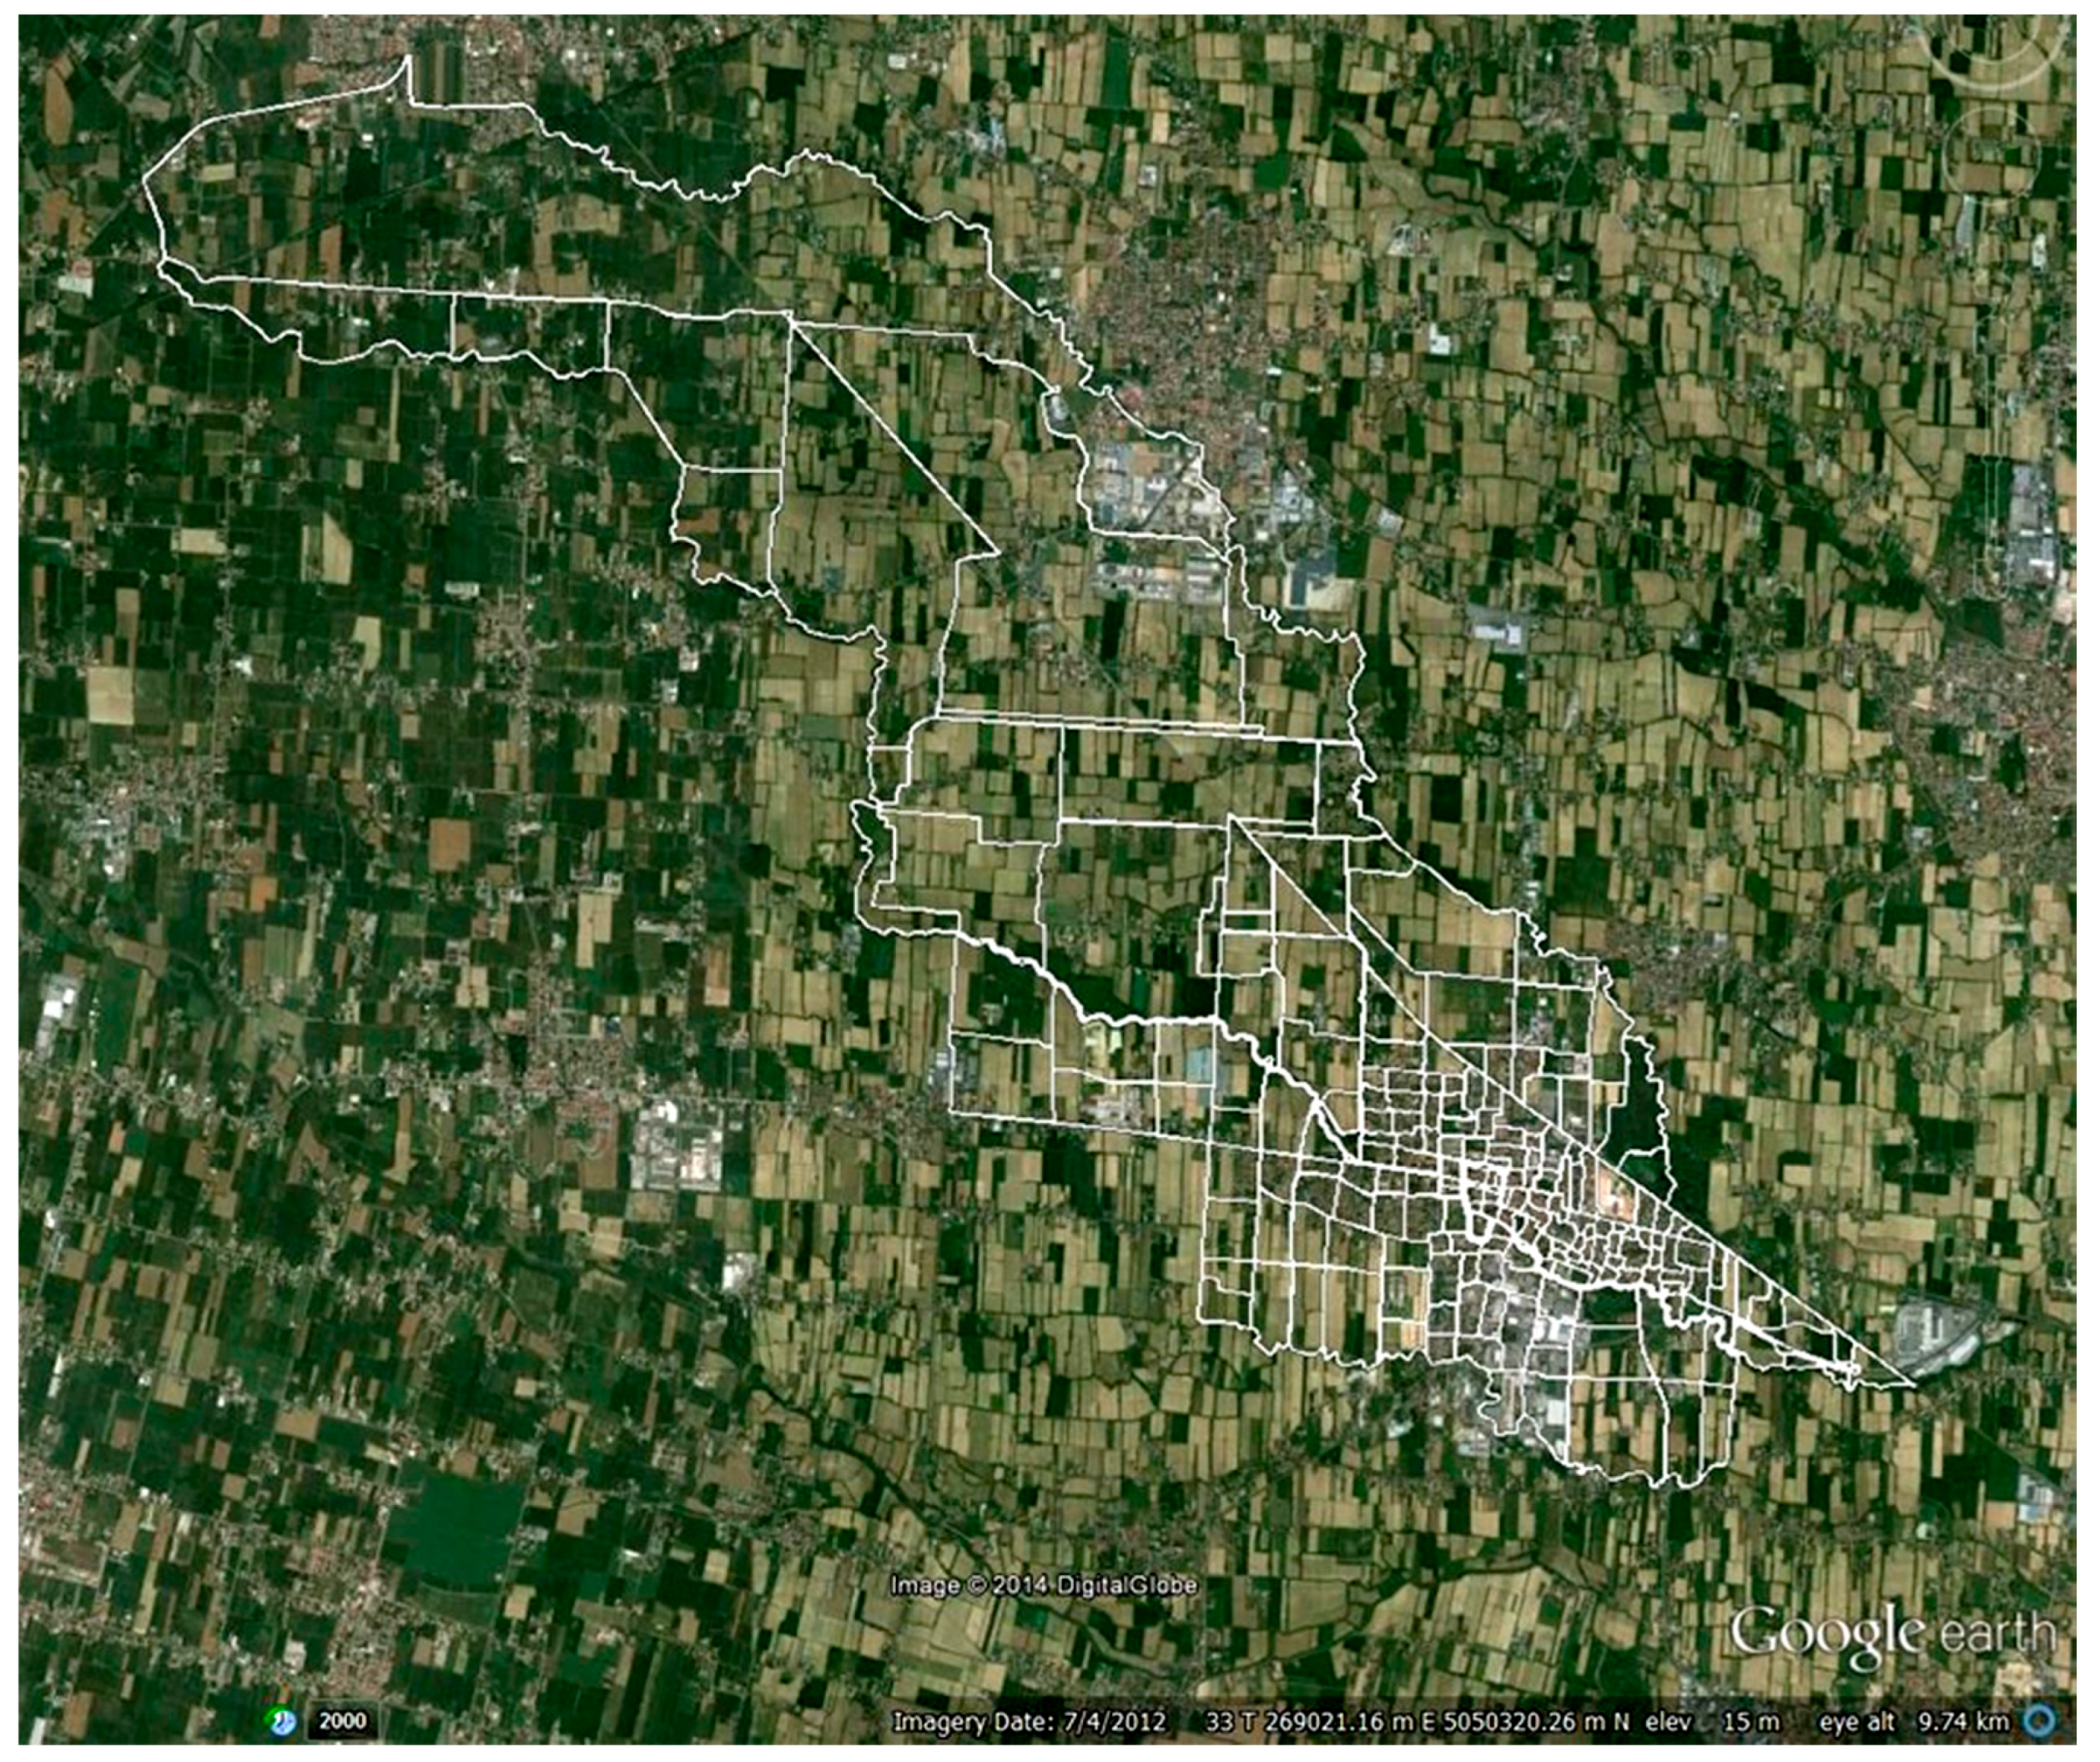
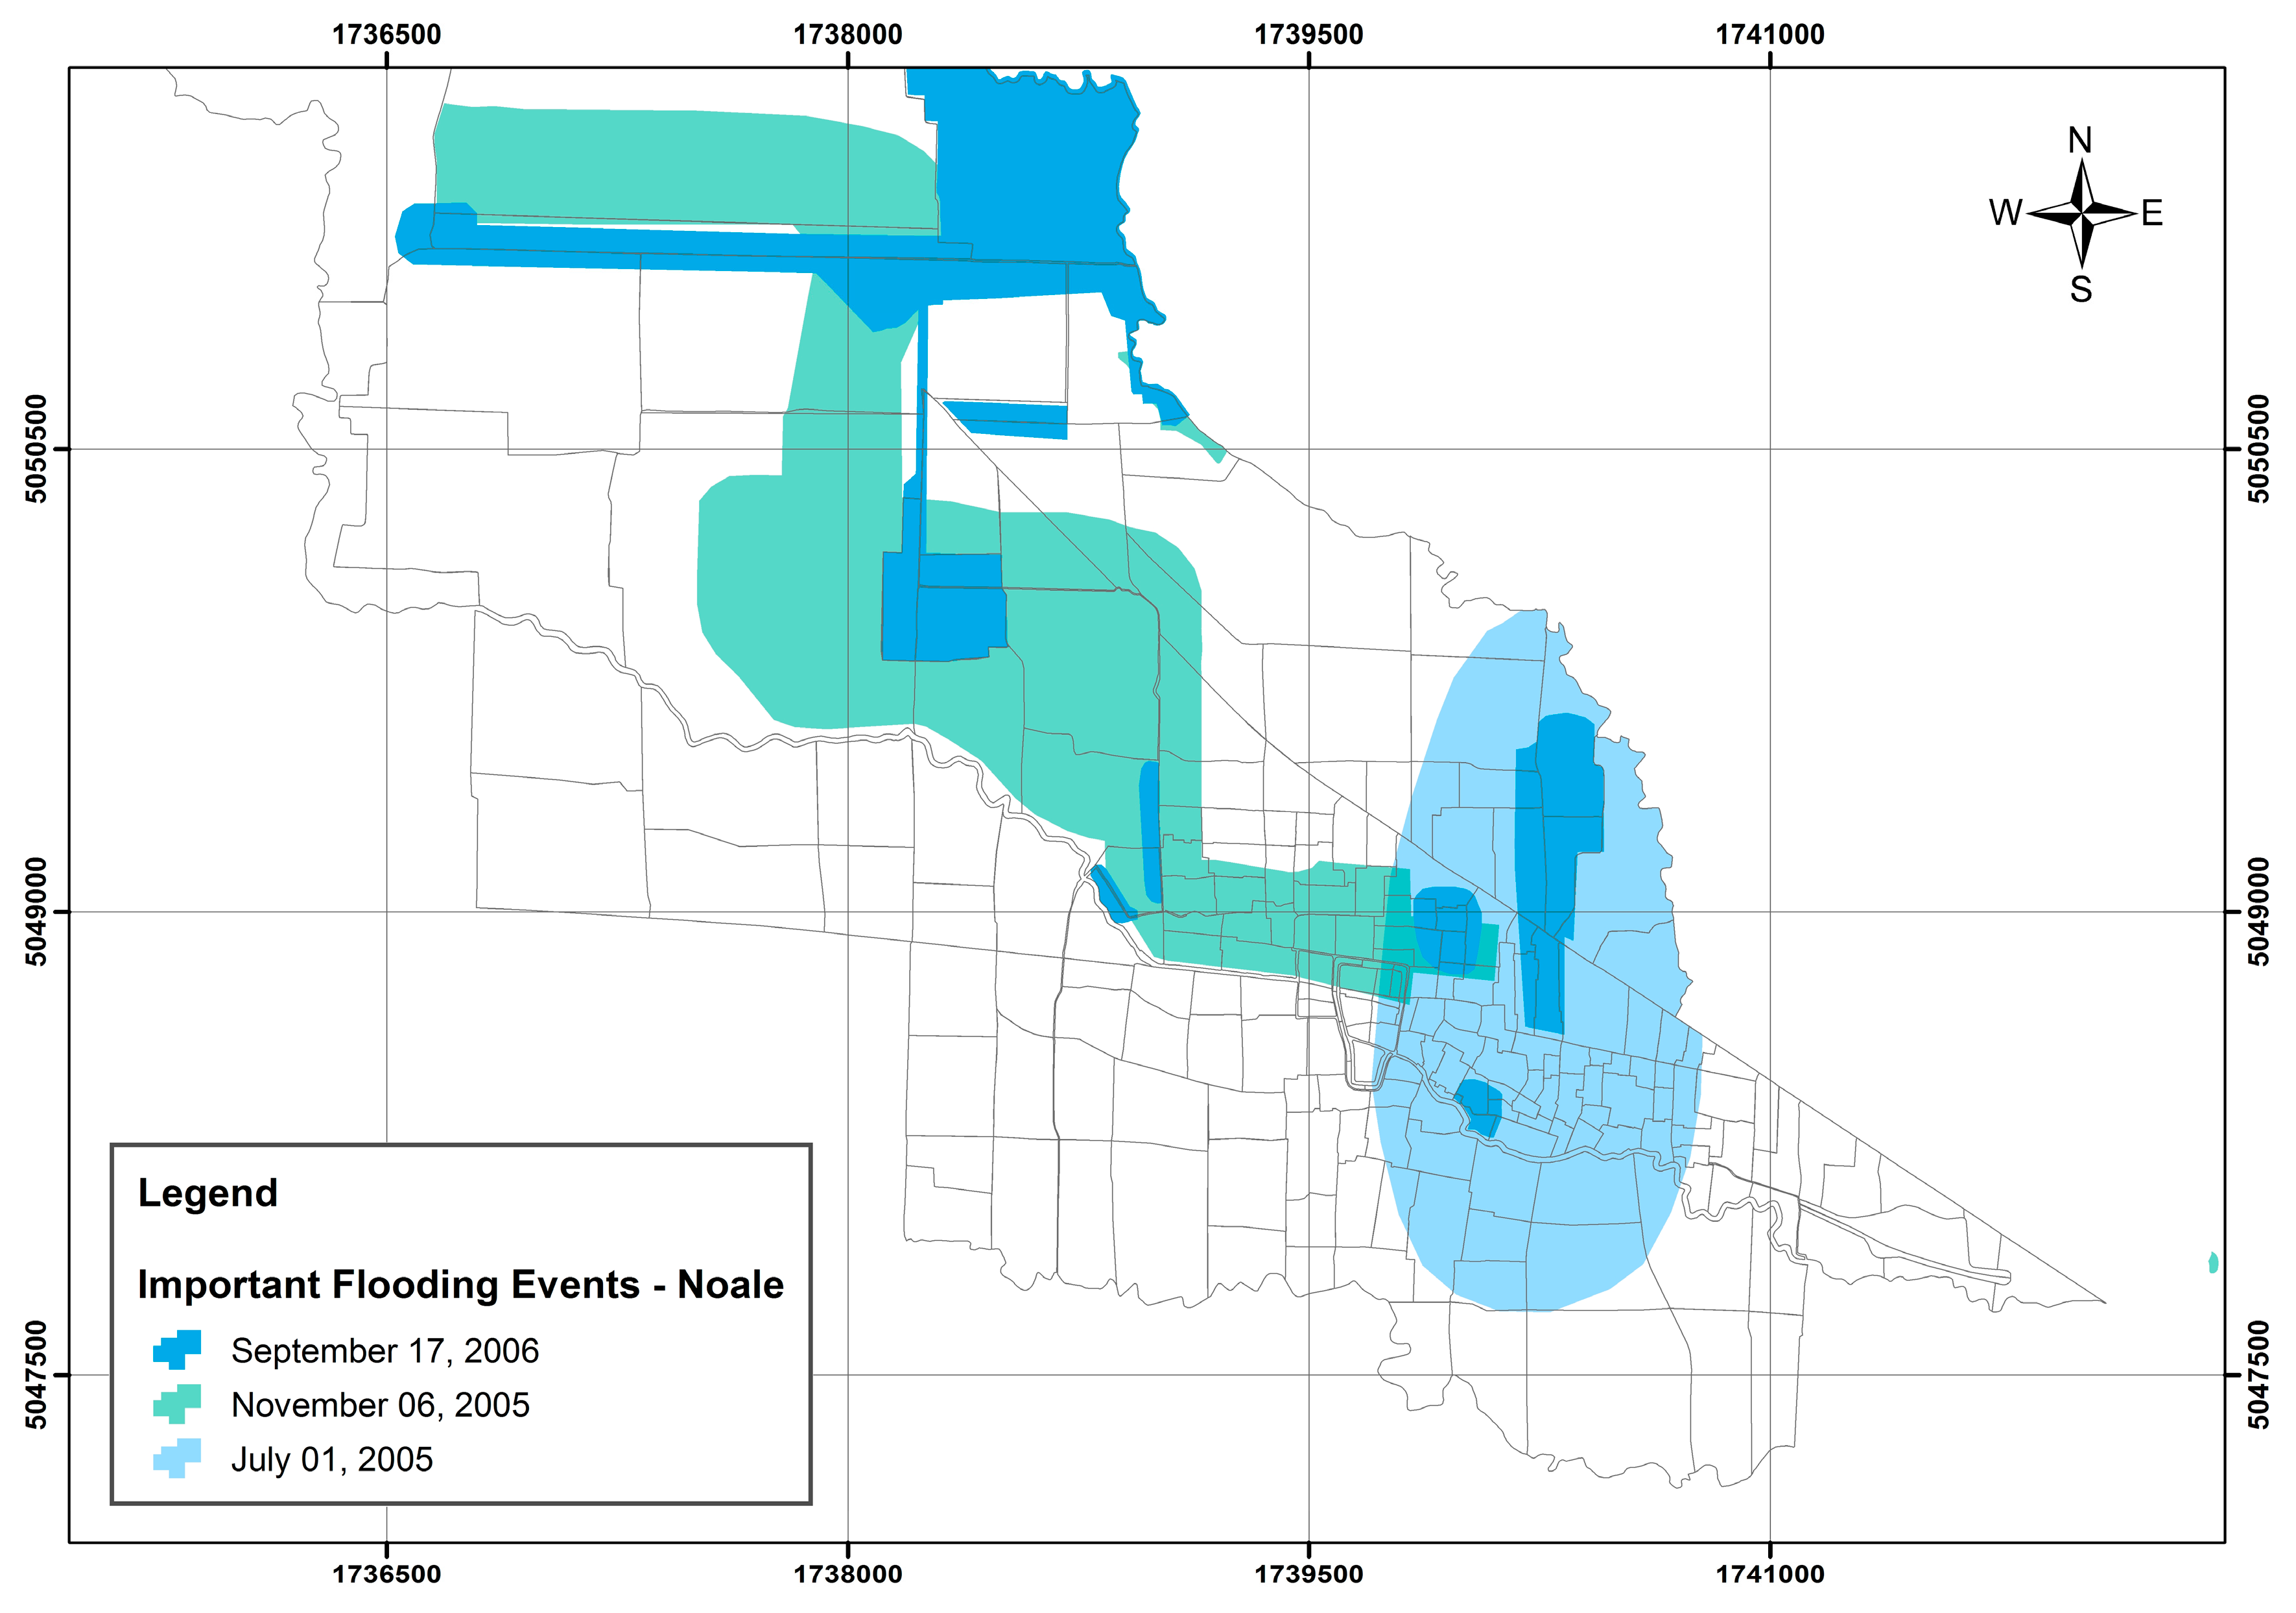
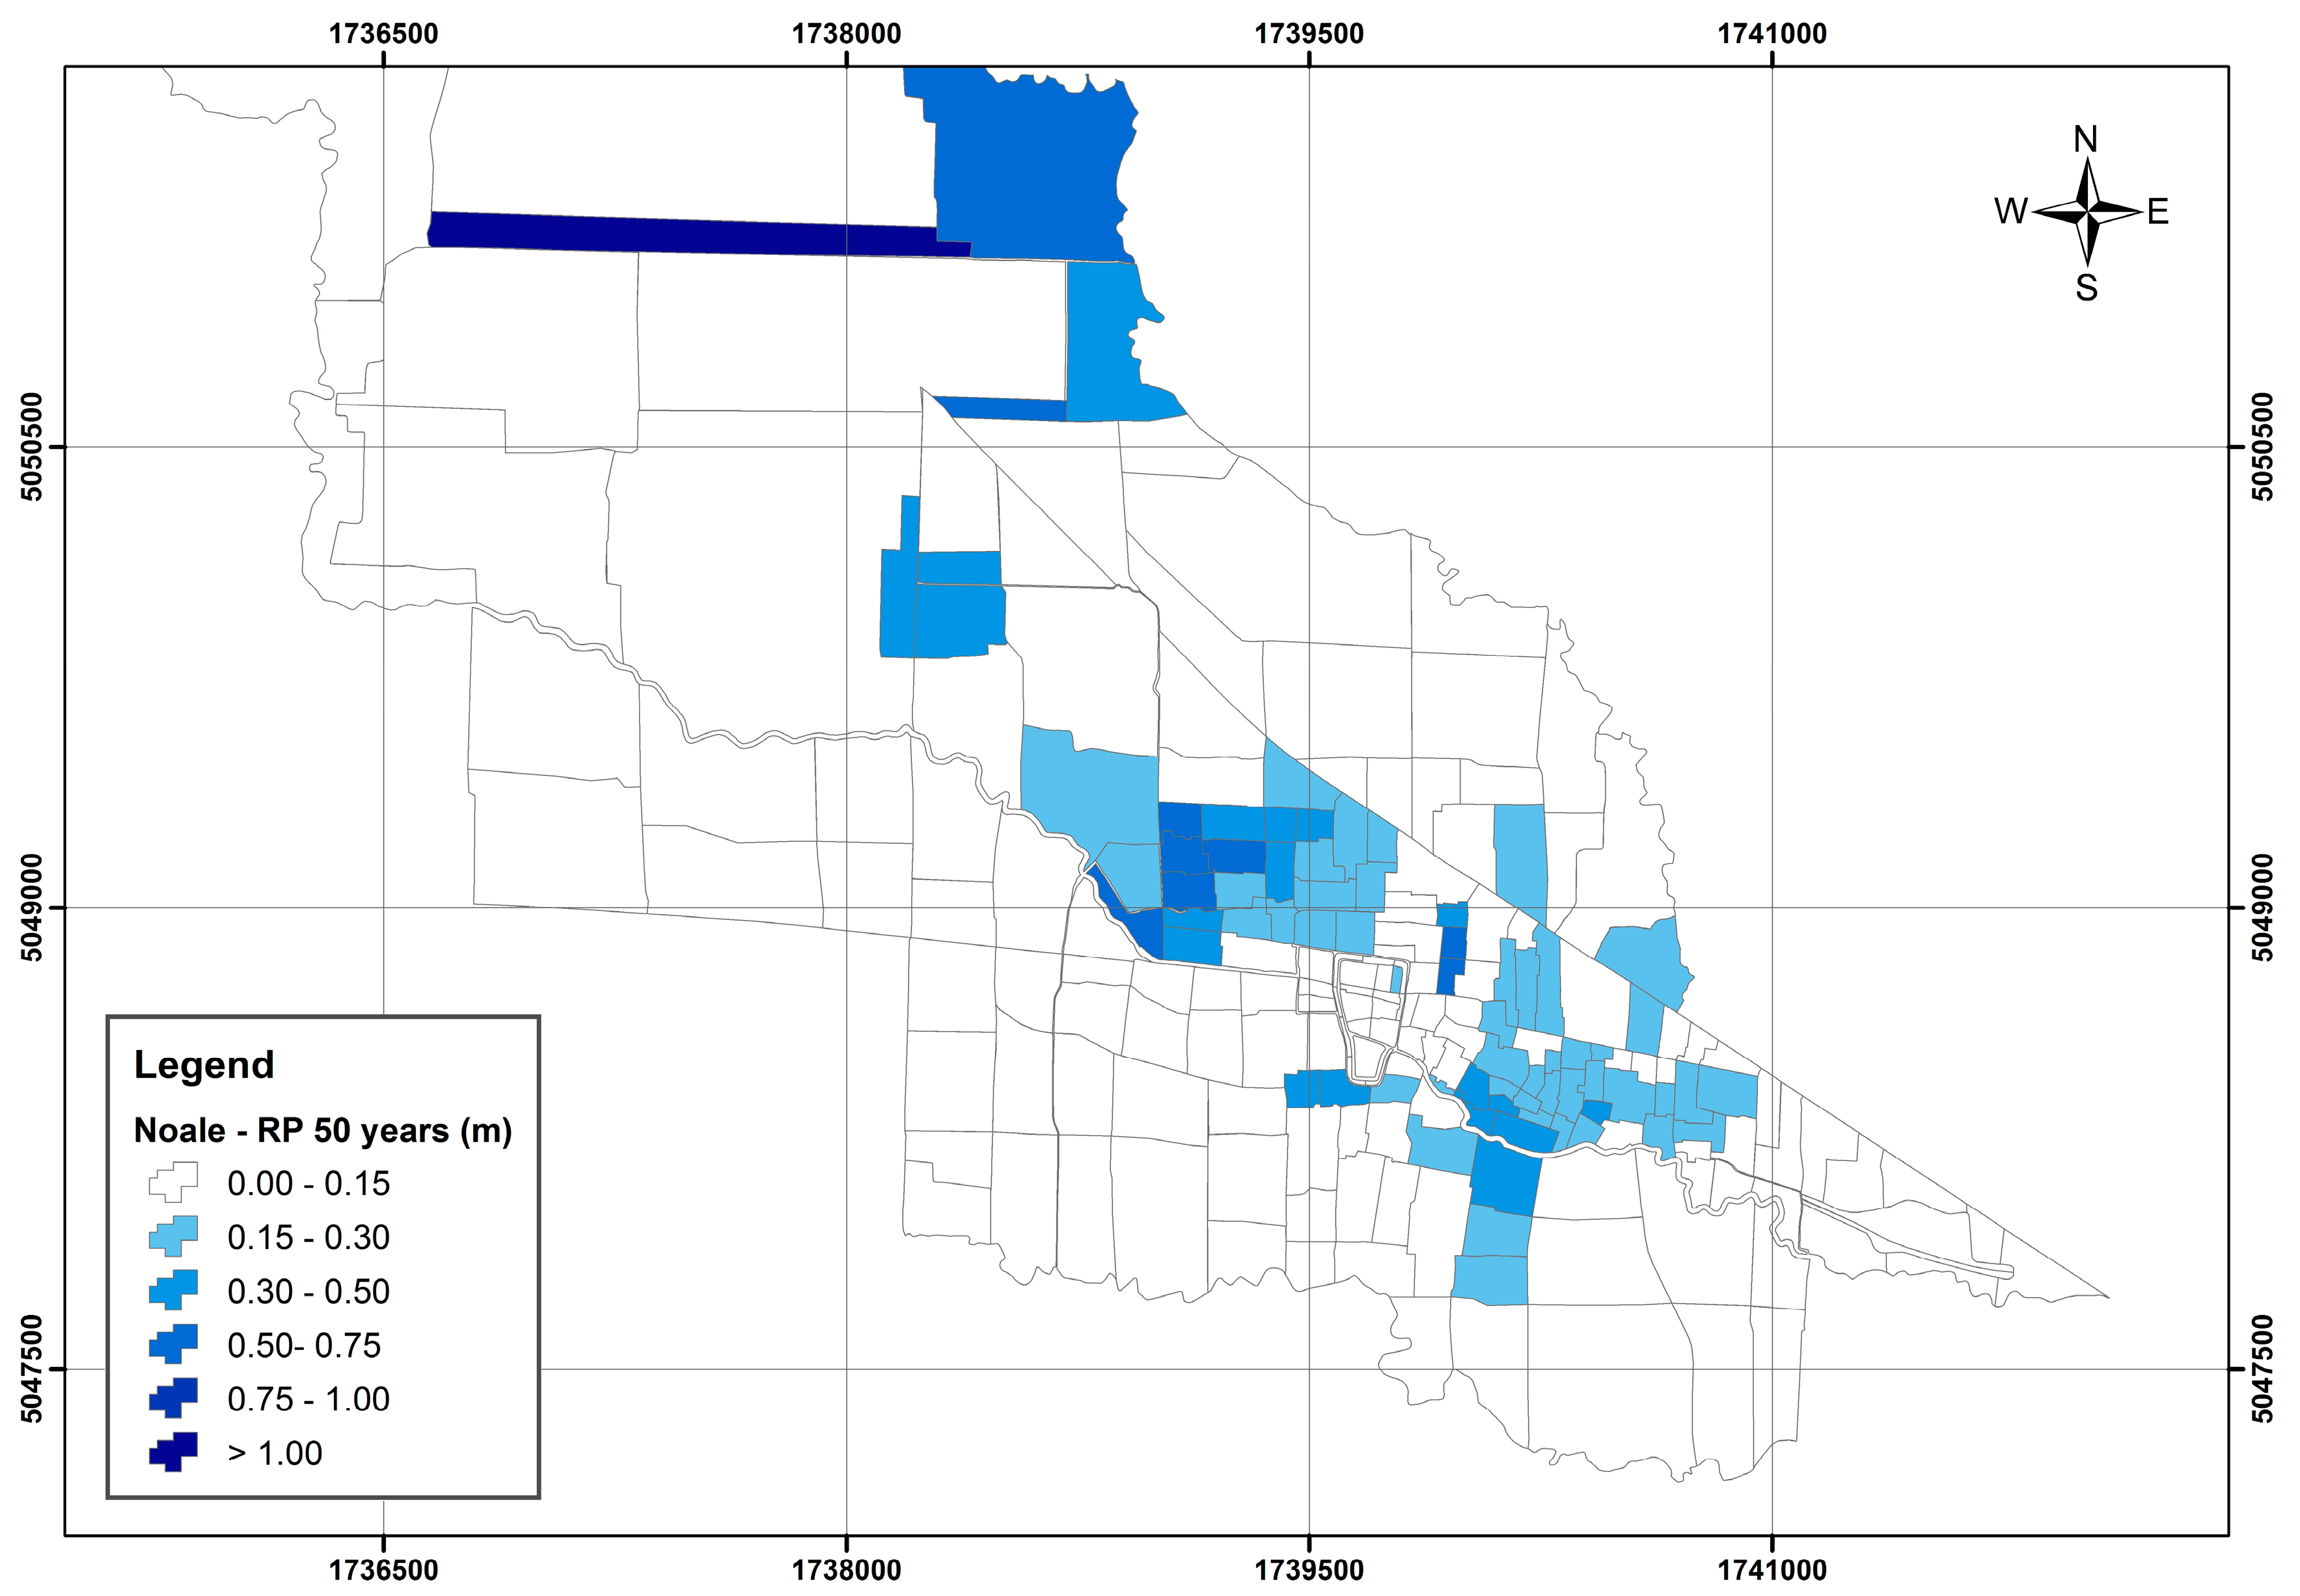
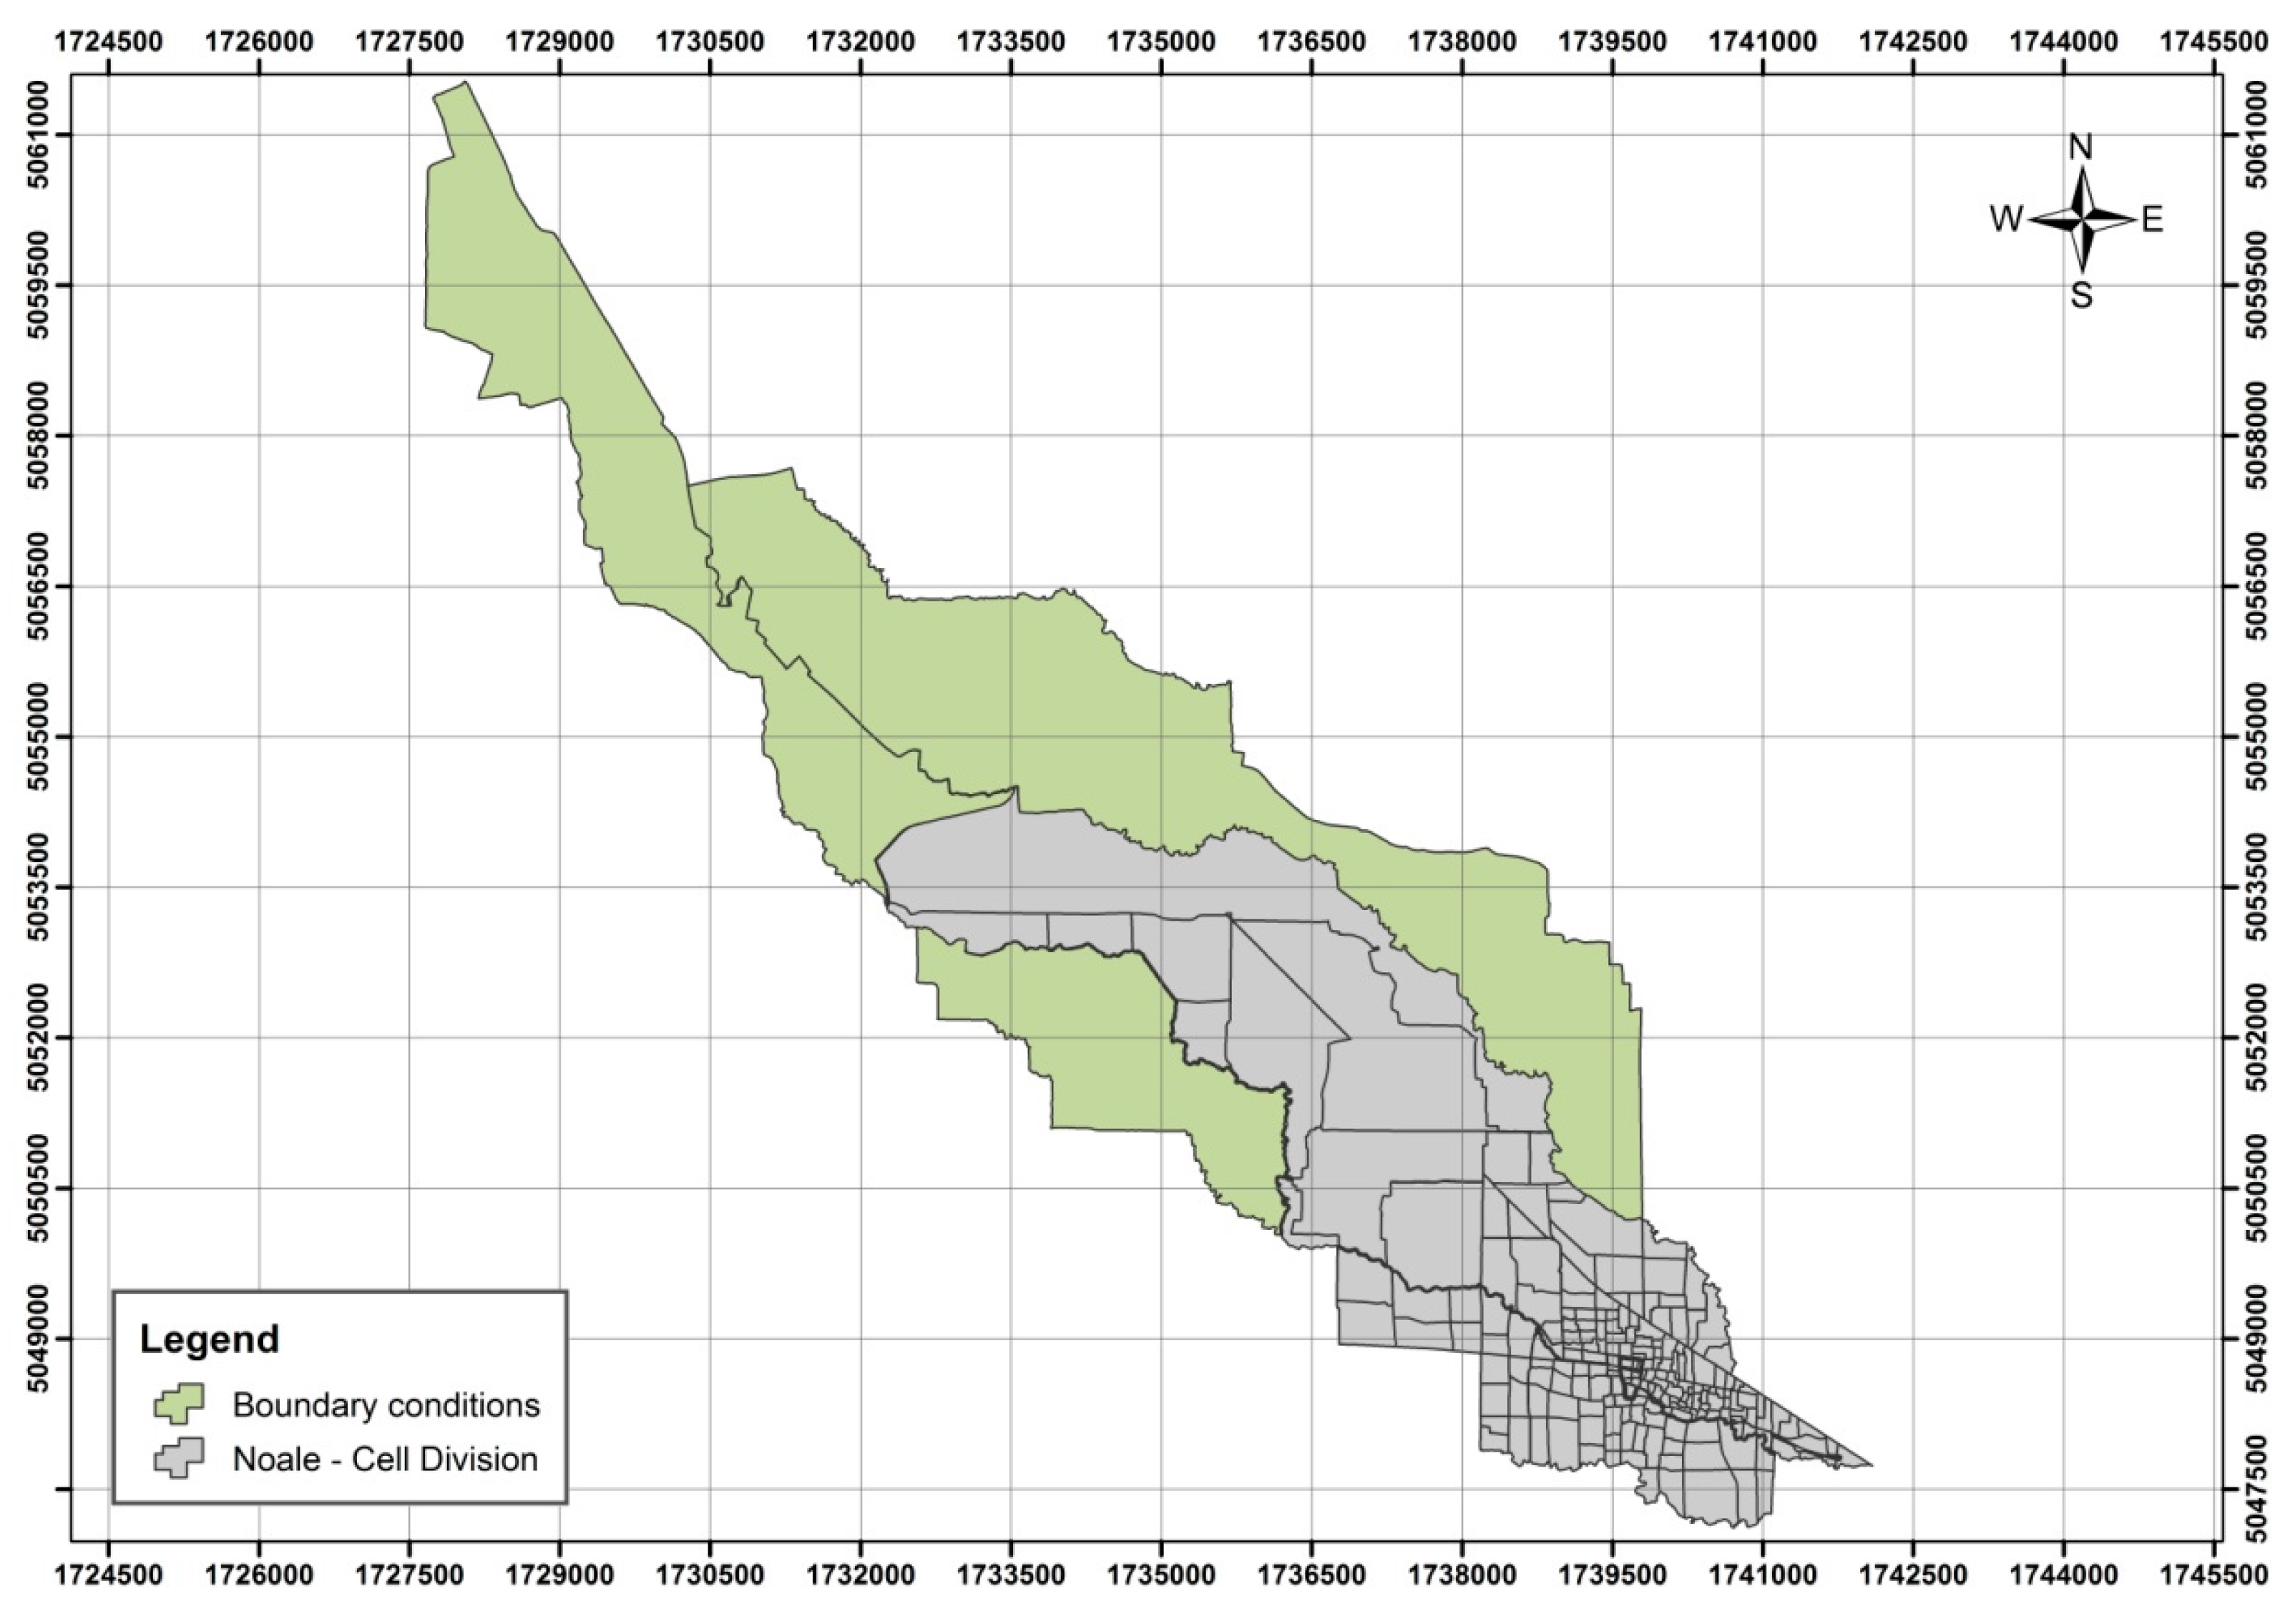
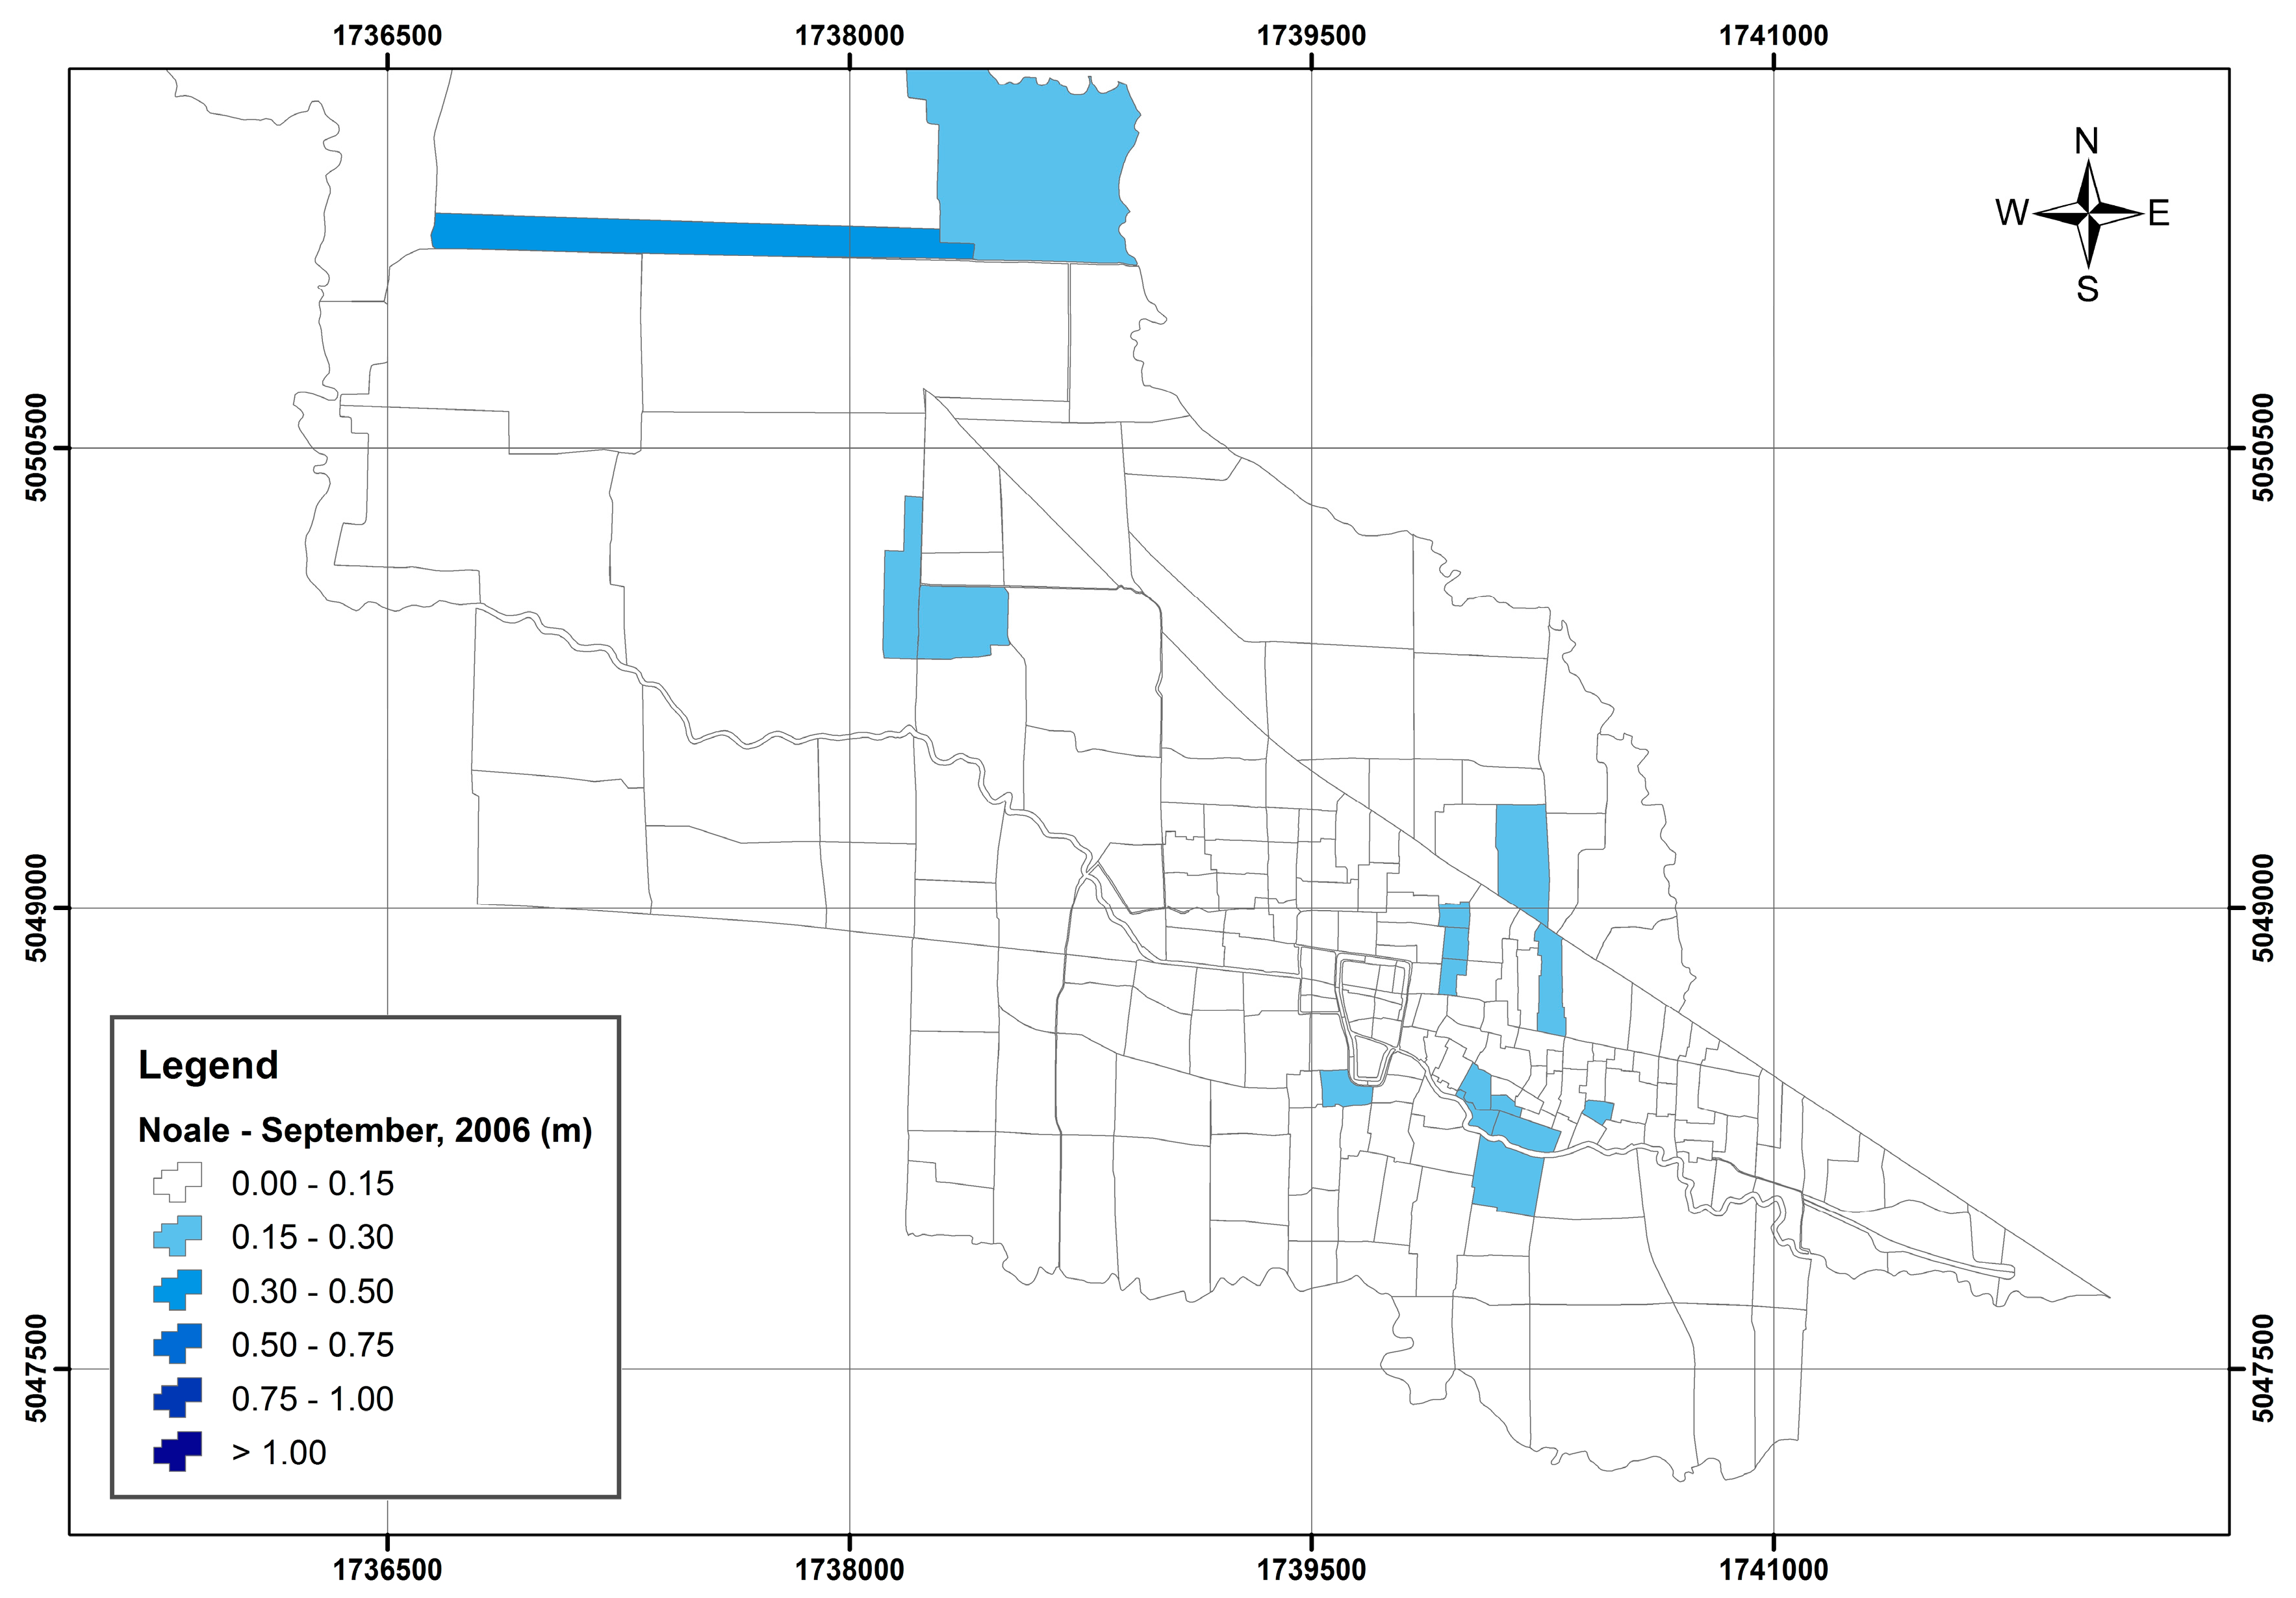
7. Case Study of Noale—MODCEL and the Simulation of Complex Flood Plains

The main purpose of bringing here this last case is to illustrate model capabilities when representing flood plains with a complex topology, in which artificial structures heavily changes the natural patterns and creates several local disconnected flows.
Particularly here, the proposed example refers to Noale, a city in the Venetian continental plains, in Italy, where urban flood occurs frequently and this phenomenon is driven by anthropic actions that modified the watershed with artificial hydraulic structures. This study was conducted in the context of The European Project SERELAREFA—SEmillas REd LAtina Recuperación Ecosistemas Fluviales y Acuáticos (Seeds of a Latin American Network for the Restoration of Fluvial and Aquatic Ecosystems), funded by the UE programme FP7 IRSES-PEOPLE 2009. The main aim of this project was to improve the way watercourses are managed by achieving benefits for both the environment and socio-economic activities. SERELAREFA fostered the adoption of River Restoration concept and developed several case studies that were supported by mathematical modelling. The Project started in September 2010 and lasted four years. Partners from Italy, Spain, Mexico, Chile and Brazil were involved in several researches regarding the use of river restoration approach to restore riparian areas, recover hydrological and morphological processes, and control floods, improving river ecosystems in general, as well as city environment, in the urban cases. The general coordination was issued to the Centro Italiano per la Riqualificazione Fluviale—CIRF (Italian Centre for River Restoration).

7.1. Rationale of Case Study
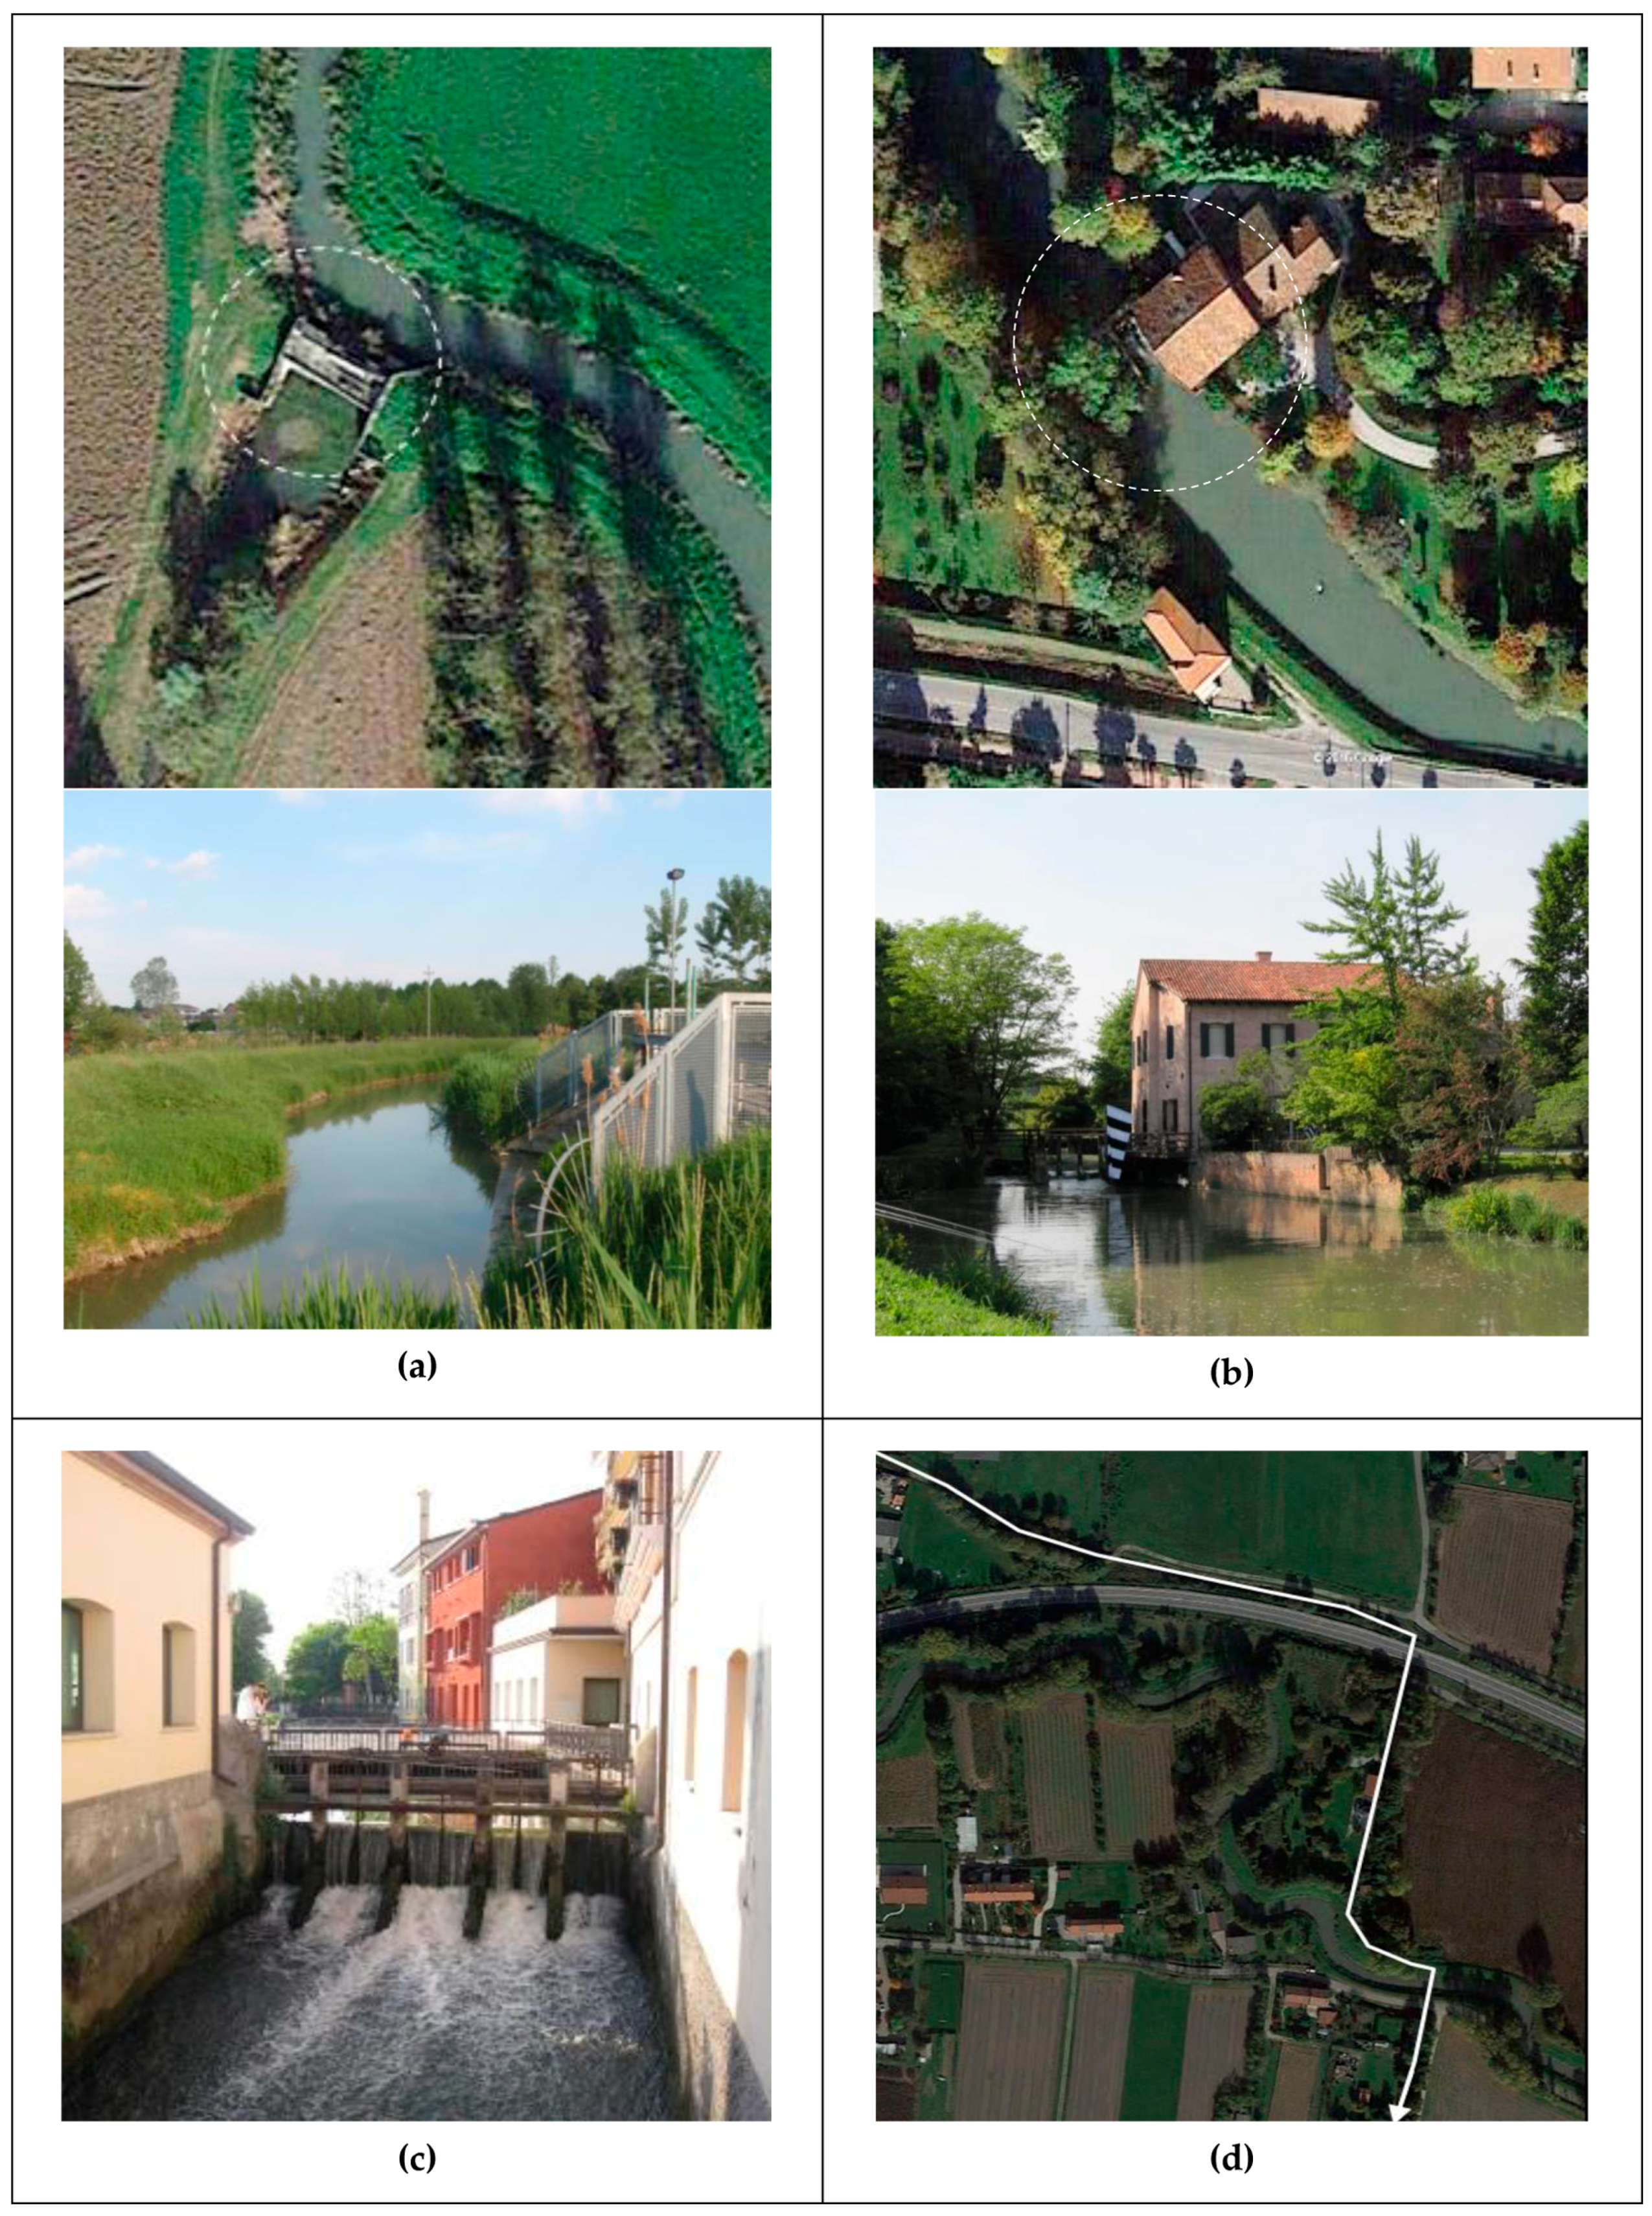
The lowland area of Mestre/Venice is naturally subject to harsh flooding as a significant part of it lies in areas of low absolute elevations, and even below average sea level. Consequently, it is artificially drained and it has been heavily modified over time. Dramatic events in 2006 and 2007 led to a mandate to a special Commissioner who issued a specific law that introduced the “hydraulic invariance” concept. The idea is that if a new building/infrastructure would increase the peak discharge of a reference flood event (return period of 50 years)—owing to the loss of natural storage volume and infiltration capacity—then building permission could be granted only if provided that suitable compensatory measures are put in place to maintain the original peak value under control. This concept has been fully developed by the Piano Territoriale di Coordinamento Provinciale (Territorial Coordination Provincial Plan) [48], approved by Venetian province administration (December 2010), which stated the need to elaborate specific Water Plans.
More recently, guidelines for the ecological restoration of the extensive network of natural and artificial irrigation and drainage canals [49] were issued, and several concepts of sustainable water management and river restoration were included, much in line with SERELAREFA philosophy.
Within the framework of SERELAREFA project, a first study trip happened in September 2010, during which the project partners could understand the problems faced in that region. After this visit, the group of the Federal University of Rio de Janeiro took part in a relevant Italian conference (Acqua e Città held in Venezia, 2011) and then in a specific workshop in Mestre. This workshop, hosted by Consiglio di Bacino Laguna di Venezia (Venetian Lagoon Watershed Council), counted with the participation of several key actors, amongst which the technical staff of hydro-geological defence of the Venetian Province. In this opportunity, the modelling framework of MODCEL was presented and this event opened a door for setting up an Italian case study around the Venetian area, conceived as an academic opportunity of applied research and know-how exchange.

7.2. Noale

Noale is a city that has its origins in ancient times. From the middle of the 1800s until today, great changes happened and its population was approximately multiplied by four. The centre of the city is flooded by Marzenego River, where one of its branches overflows the dike of the historic city castle’s moat. The discharges that surpass the dyke go superficially to the south, towards Roviego River.
Urban grow and consequent land use modifications generated an increase in the hydraulic risks reaching important central areas and affecting a greater exposed population. Today, flood risk management is of prime concern for the protection of properties and economic assets. The first step in this path refers to understanding and mapping the interrelations between the city and the river. Therefore, this first step is the main objective of this case study, which also intends to illustrate MODCEL capability to map the current flooding situation in this complex flood plain.

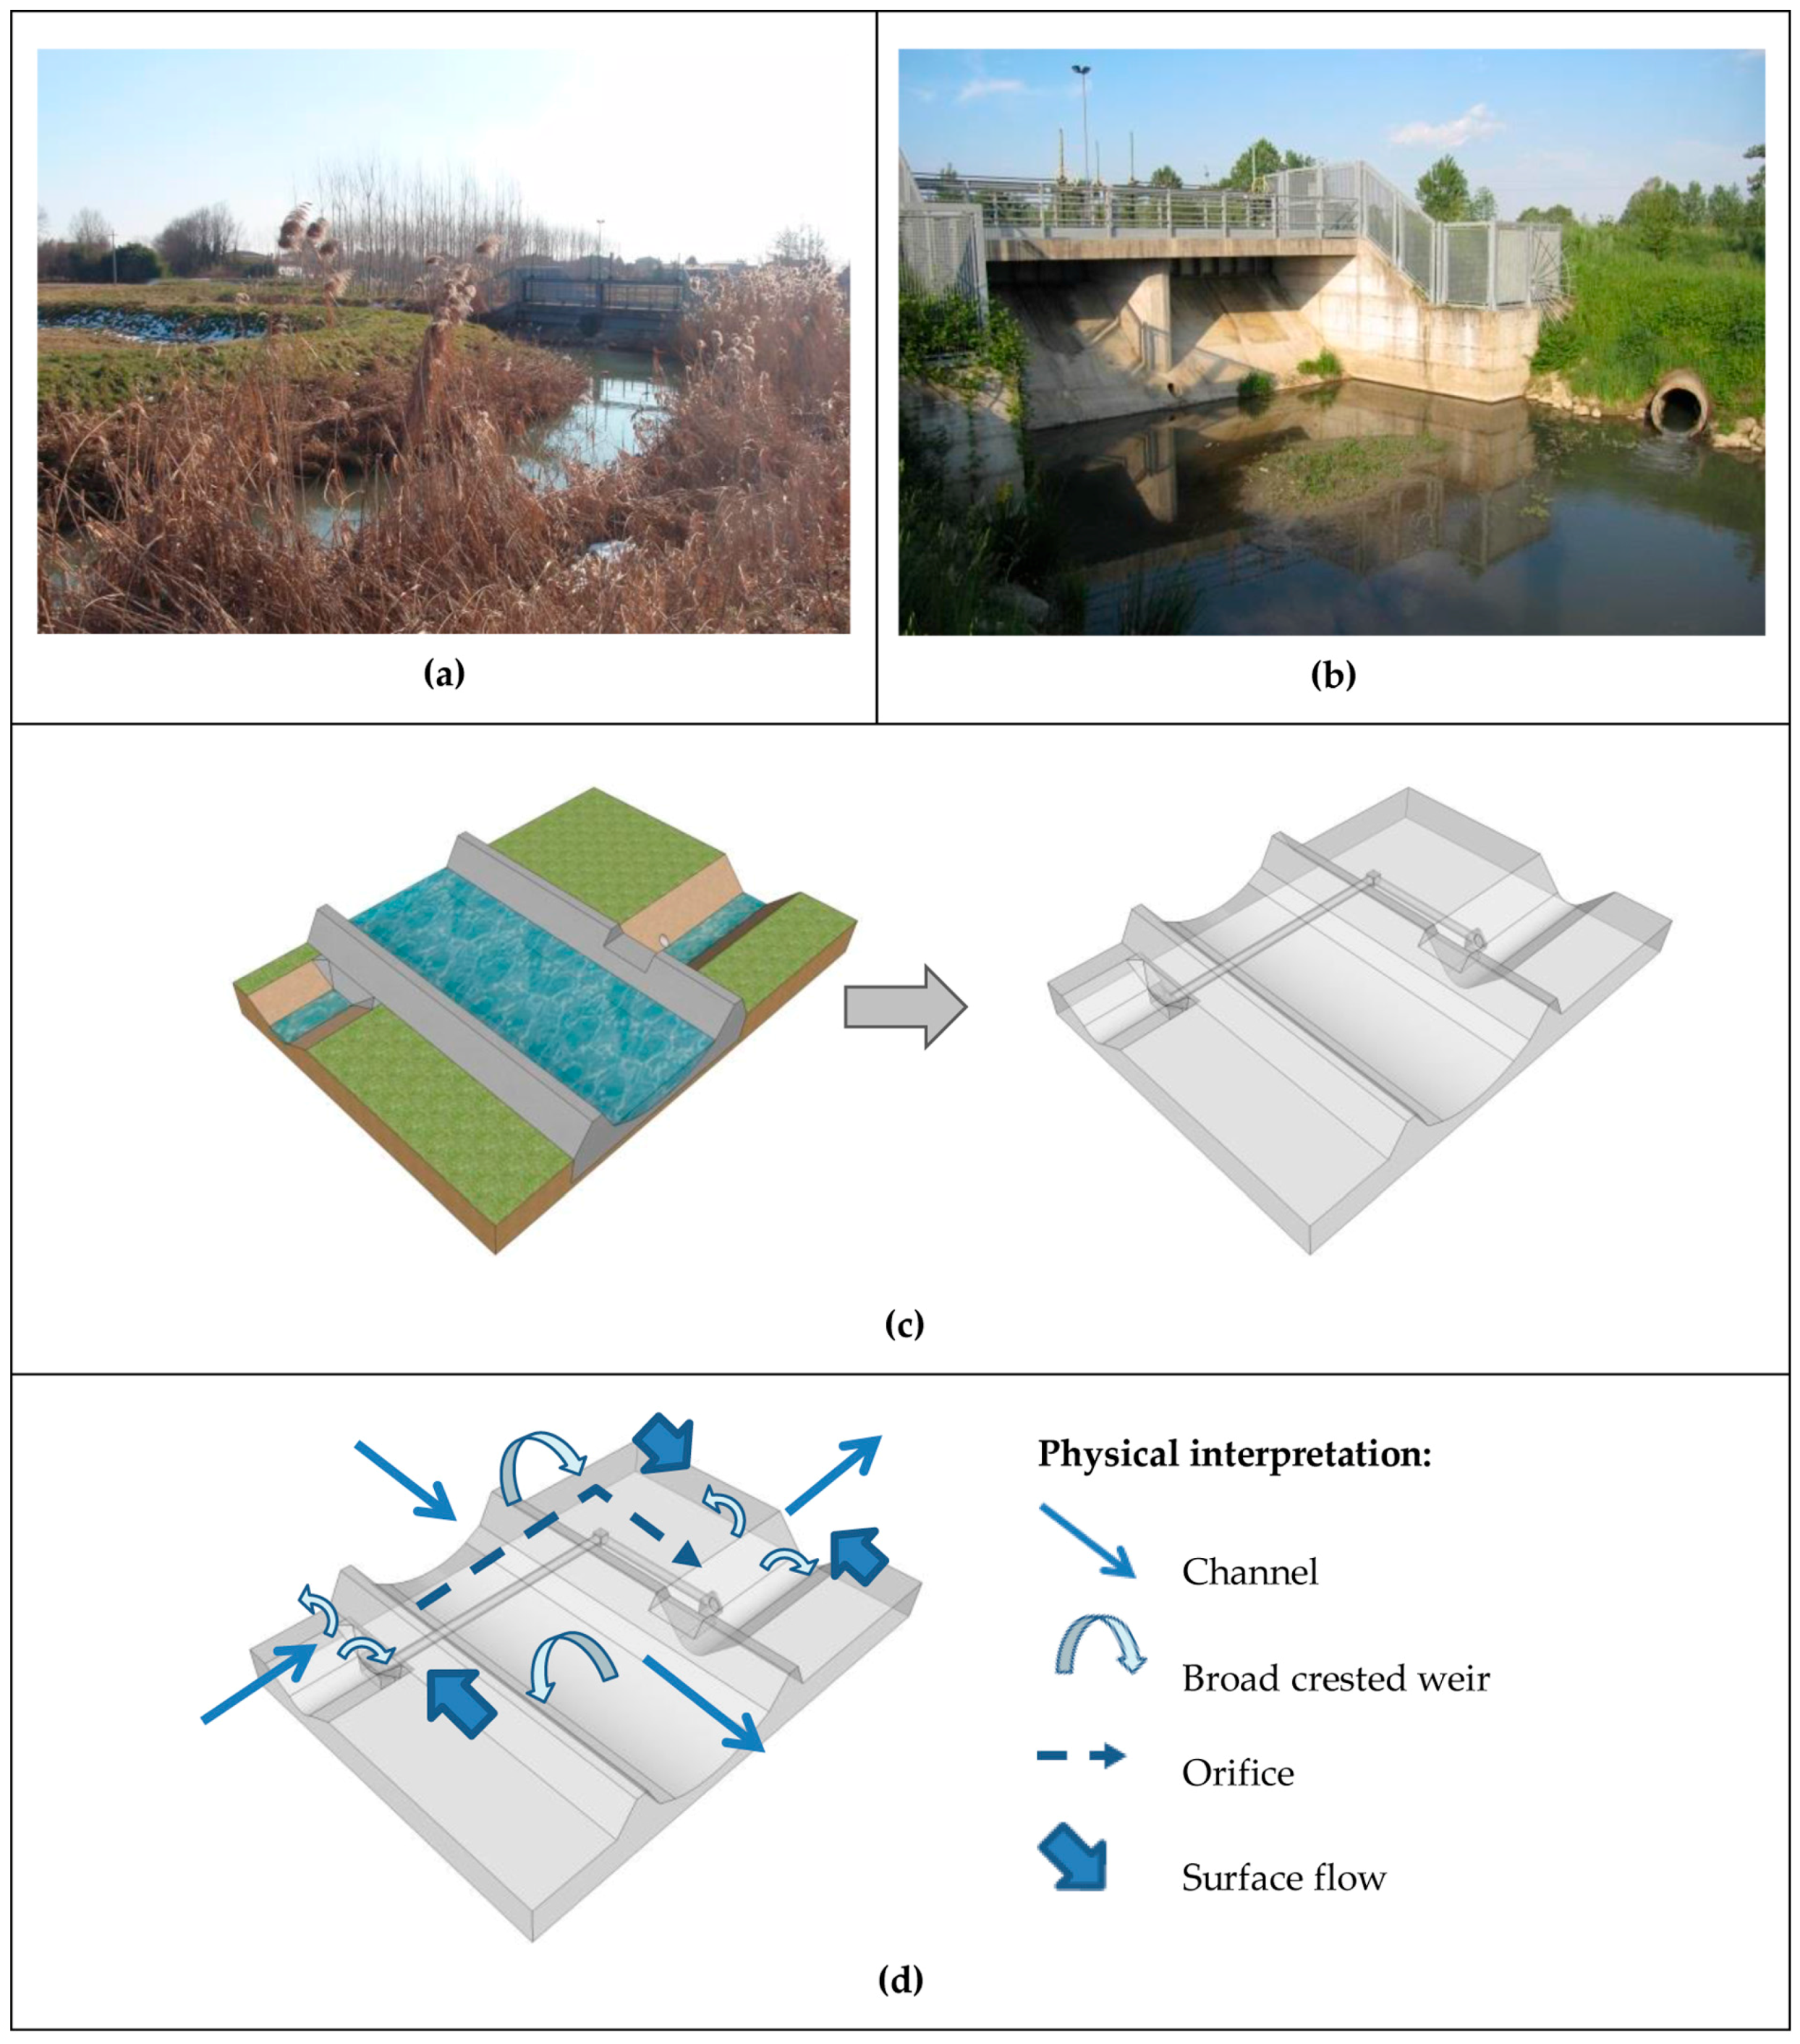
7.3. General Hydraulic Description

The Marzenego River passes through Noale’s centre and defines the main river course of the city. However, this watershed is not as usual and very few natural characteristic (if any) are preserved. The Marzenego River runs from northwest to southeast. In the north region, Dragonziolo River is its main tributary to the left bank. South to Marzenego runs Roviego River. Figure 11 shows a general plan view of this region and Figure 12 highlights some points located and numbered from 1 to 4 in Figure 11.
All Rivers running west to east in this region are contained by dikes on the right bank, so that the riverine areas that should be connected to a river by its right bank are artificially drained to the left riverbank of the next river to the south. The dyke in the centre of the city, referred to the castle moat, has a low height (approximately 50 cm) and frequently overflows.
River running north to south may experience “river crossings”, both by siphons or by elevated channels (similar to aqueducts over earth works), as shown in Figure 13. The main urban storm drain passes below Marzenego River, reaching a channel that outflows in the Roviego River.
Marzenego River also presents a series of watermills in the main river course, which limit discharges flowing through these reaches. There are also some pumping stations and gates that artificially control (and changes) the flows in this complex network.

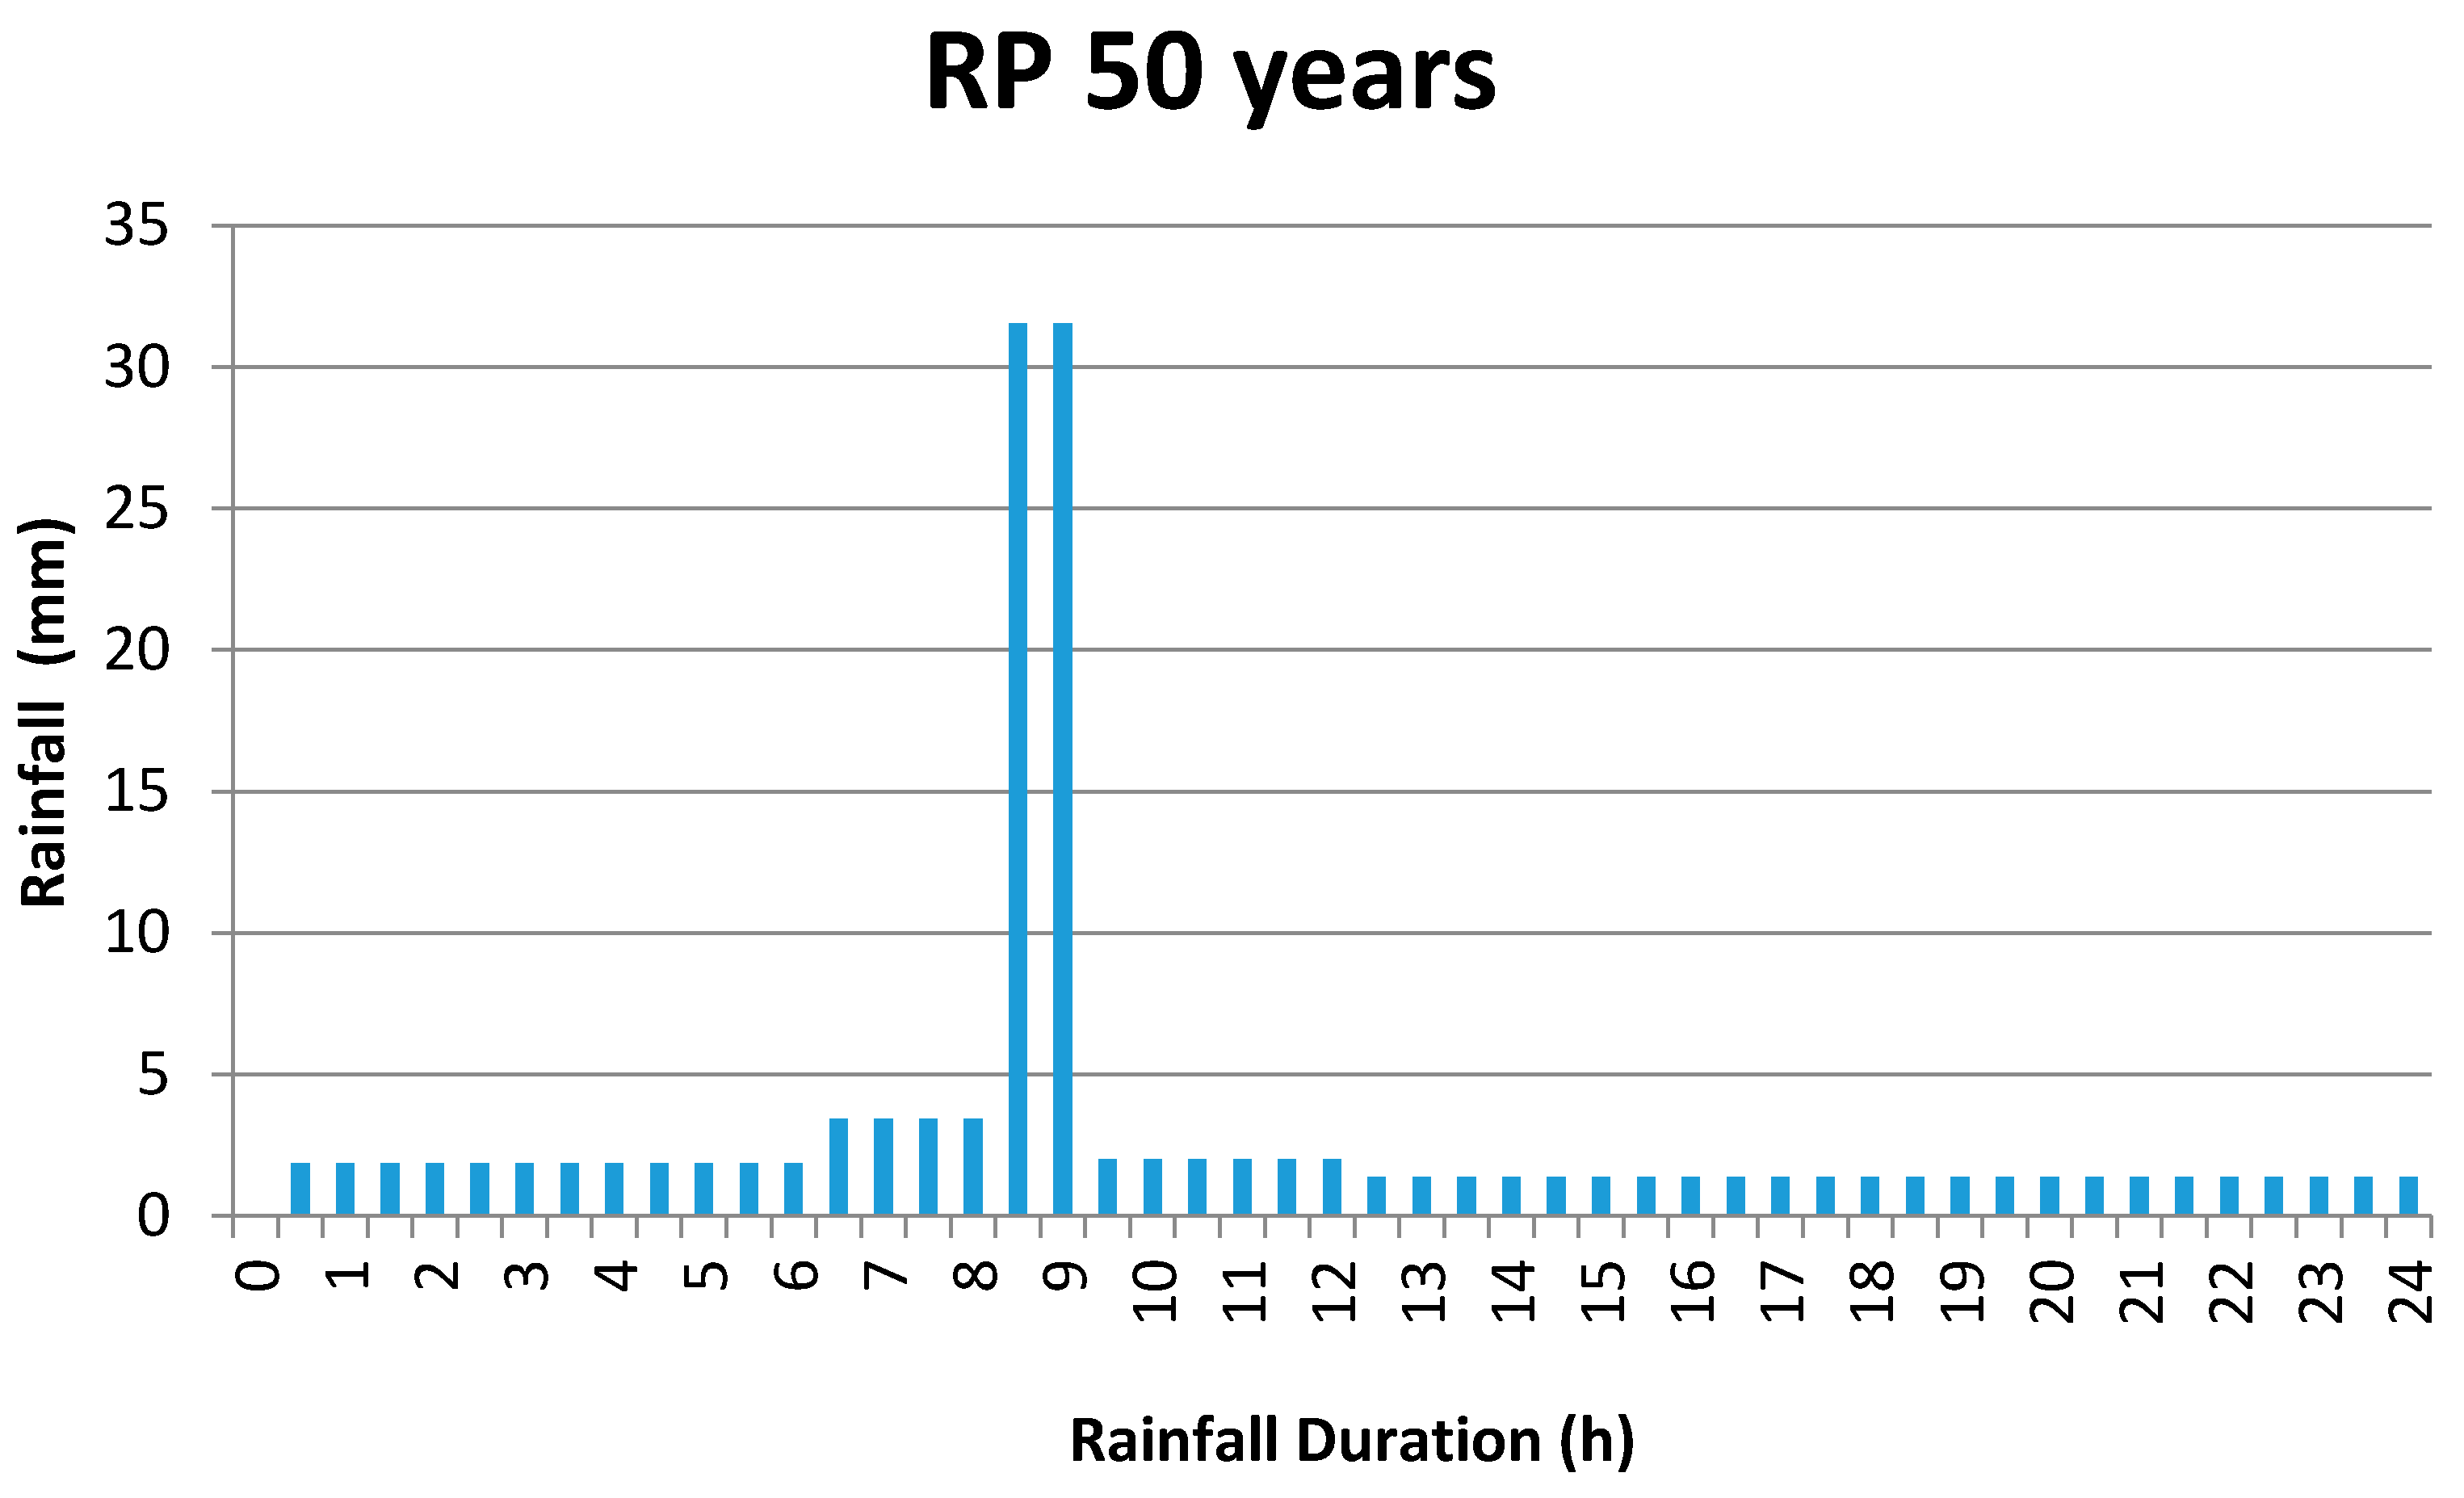
7.4. Modelling Noale’s Case

Marzenego River was modelled from Molino Cosma to Robegano City. The upstream reach of Marzenego River, until reaching the city of Castelfranco, was transformed into a boundary condition. The upper reach of Dragonziolo River and Scolo Fossalta were also taken as boundary conditions. Roviego River was modelled as an outfall. The whole area between Marzenego and Roviego may drain to this river and all the drainage network-conducting waters into this river may discharge there, but the Roviego hydrodynamics was not represented.
The topographic information was obtained from maps in the scale of 1:5000, from Segreteria Regionale All'Ambiente e Territorio (Territory and Environment Regional Secretariat). The modelled area covered an area of approximately 42 km2 and 20 km of Marzenego River, with a medium slope of 0.0006. The time of concentration for the whole watershed was estimated as 12 h, using the Kirpich formula.
The model implemented in this study has 63 channel cells representing Marzenego River and other 54 cells representing the other water courses. There are also 219 cells representing the flood plains and the city of Noale, while 11 cells represent the storm drains, totalising 347 cells. It is important to stress that this model includes only the main storm drains.
Figure 14 shows the watershed, including the boundary conditions and the cell division, while Figure 15 shows the cell division over an aerial view.
A compilation of available information on Venetian floods was made, resulting in the map shown in Figure 16. The flooding event of 2006 was used to calibrate the model, using the rainfall measured. The envelope of important flooding events, corresponding to their superimposed effects, was used to validate the model. In this latter case, a rainfall of 50 years of return period was introduced uniformly in the model intending to reproduce this larger flood map.
Two rainfall gauges were taken as representative of the modelled area: Istrana (14 km far from Noale’s city centre) and Stra (14 km far from Noale’s city centre) [50].
Considering a 24 h event, but introducing a time variation component, using the information of the rainfall values occurred in 1, 3, 6 and 12 h, a design rainfall of 50 years of return period [51] was built, using the alternate blocks method from the US Soil Conservation Service. The resulting rainfall was defined for time intervals of 0.5 h, intending to represent a critical situation to the whole basin and also to the sub-basins with different times of concentration. That is, if we are working with a storm drain, in a street in the middle of the city, the higher rainfall intensity related with a single time interval (of 30 min) will be critical in the local scale, while the composed rainfall intensity for the entire modelled basin scale (12 h) will also be critical. Figure 17 shows the design rainfall built for the return period of 50 years.
Figure 18 shows the modelled results for the flood event of 2006, while Figure 19 shows the inundation map for a rainfall event with 50-year return period. It is possible to see that the modelled results are adherent in both cases.
The modelled event of September 2006 (Figure 18) shows that MODCEL was capable to reproduce almost all the observed flooded areas, although with some discontinuities.
When considering a rainfall with 50-year return period distributed over the entire basin, the basic intention was to reproduce (for this representative rainfall intensity) the enveloped results of all previous important observed floods. This aim was reached and the results shown in Figure 19 are quite similar to those shown in Figure 16. An important thing to be added is that this result was submitted to the appreciation of the Venetian Lagoon Watershed Council and the local staff considered that the general flooding representation and paths of flows were quite accurate.

8. Concluding Remarks

Mathematical models are useful tools for managing drainage systems, especially when flooding problems produces large inundation areas. In these cases, the drainage system tends to interact with urban landscape and urban structures may act hydraulically composing a new flow pattern distinct from that predicted in the original project. Most times, the superficial processes may play a major role in the flood problem, being affected by urban structures and local obstacles in a complex arrangement. This is where the main potential of MODCEL arises, focusing on the interactions between surface flows and the drainage net flows, also allowing the introduction of typical urban structures in this representation. This is an important feature to consider in this kind of situation, providing the possibility to explore different integrated flood control alternatives by placing different types of interventions over the basin landscape, even outside the drainage network.
In this paper, MODCEL was benchmarked in a 2D test proposed by the British Environmental Agency, showing water level results compatible with 2D Models, but using only 163 cells, against 97,000 elements. Then MODCEL was compared with a storm drain model to show its capacity to represent the 1D branched network. Finally, MODCEL was applied to a complex watershed in the lowland area of Mestre/Venice, where the city of Noale lies in the Marzenego River basin. The results were compared with known flooding events. However, the case of Noale could only allow a spatial calibration (flooded area) and not its temporal evolution. The simulation of this watershed, in particular, was important to show MODCEL capability to deal with a mixed and complex setup, where a plain territory interacts with artificial structures and non-natural flow paths, including the operation of gates, pumping stations and channel crossings (where overflows cause discharges transpositions from one watershed to another),
MODCEL showed to be able to reproduce this great variety of hydraulic patterns in the urban landscape, as well as the set of hydraulic structures working jointly with natural and artificial drainage network. Although using a relative simple squasi-2D scheme, the physical interpretation phase that is needed to use this type of model allowed obtaining adequate and representative results, with low computational costs and less information need. The main weakness of this proposal refers to great flooding areas, where significant high flood levels occur (producing a continuous and extensive flooding surface). In this case, real 2D models are expected to produce better results.

Acknowledgments

The authors would like to acknowledge the support of the European Union that has co-financed the project SERELAREFA (IRSES Marie Curie 2009; Grant 247522). This project founded part of the exchange missions and allowed the field investigations related with the case study. The authors would also like to thank the Consorzio di Bonifica Acque Risorgive for the technical support provided during this research for the case study modelling, including technical meetings, joint inspections along the drainage network, and relevant information to support the physical interpretation of the drainage system behaviour.

Author Contributions

Marcelo Gomes Miguez conceived and developed MODCEL, made the initial literature review and coordinated the research team and the work in Noale; Aline Pires Veról and Osvaldo Moura Rezende conceived the first model set-up for Noale case study and worked with the hydrologic studies; Marcelo Gomes Miguez and Osvaldo Moura Rezende also developed the comparison with SWMM; Matheus Martins De Sousa revised the model setup, helped with the literature review and benchmarked MODCEL with the British Environmental Agency tests; Bruna Peres Battemarco helped in the model setup revision for Noale, calibrated the model and operated it throughout the simulations; and Giancarlo Gusmaroli planned and conducted the field research related with Noale, collected and organised the basic data and helped in the physical interpretation of the watershed behaviour.

Conflicts of Interest

The authors declare no conflict of interest.

References

  1. Leandro, J.; Schumann, A.; Pfister, A. A step towards considering the spatial heterogeneity of urban key features in urban hydrology flood modelling. J. Hydrol. 2016, 535, 356–365. [Google Scholar] [CrossRef]
  2. Simões, N.; Ochoa, S.; Leitão, J.P.; Pina, R.; SáMarques, A.; Maksimović, Č.; International Water Association (IWA). Urban drainage models for flood forecasting: 1D/1D, 1D/2D and hybrid models. In Proceedings of the 12th International Conference on Urban Drainage—ICUD, Porto Alegre, Brazil, 10–15 September 2011. [Google Scholar]
  3. Djordjevic, S.; Prodanovic, D.; Maksimovic, C. An approach to stimulation of dual drainage. Water Sci. Technol. 1999, 39, 95–103. [Google Scholar] [CrossRef]
  4. Apel, H.; Trepat, O.M.; Hung, N.N.; Chinh, D.T.; Merz, B.; Dung, N.V. Combined fluvial and pluvial urban flood hazard analysis: Concept development and application to Can Tho city, Mekong Delta, Vietnam. Nat. Hazards Earth Syst. Sci. 2016, 16, 941–961. [Google Scholar] [CrossRef]
  5. Cunge, J.A. What Do We Model? What Results Do We Get? An Anatomy of Modelling Systems Foundations. In Advances in Hydroinformatics; Gourbesville, P., Cunge, J., Caignaert, G., Eds.; Springer: Singapore, 2014. [Google Scholar] [CrossRef]
  6. Abbott, M.B.; Vojinovic, Z. Applications of numerical modelling in hydroinformatics. J. Hydroinform. 2009, 11, 308–319. [Google Scholar] [CrossRef]
  7. Neal, J.; Villanueva, I.; Wright, N.; Willis, T.; Fewtrell, T.; Bates, P. How much physical complexity is needed to model flood inundation? Hydrol. Process 2012, 26, 2264–2282. [Google Scholar] [CrossRef]
  8. Mascarenhas, F.C.B.; Miguez, M.G. Urban Flood Control through a Mathematical Cell. Water Int. 2002, 27, 208–218. [Google Scholar] [CrossRef]
  9. Zanobetti, D.; Lorgeré, H. Le Modele Mathématique du Delta du Mékong. La Houille Blanche 1968, 5, 363–378. [Google Scholar] [CrossRef]
  10. Burian, S.J.; Edwards, F.G.; International Water Association (IWA). Historical Perspectives of Urban Drainage. In Proceedings of the 9th International Conference on Urban Drainage—ICUD, Portland, OR, USA, 8–13 September 2002. [Google Scholar]
  11. Benevolo, L. Storia Della Città. Vol. 4: La Città Contemporânea, 2nd ed.; Gius. Laterza & Figli: Roma-Bari, Italia, 2006; p. 332. [Google Scholar]
  12. Andoh, R.Y.G.; International Water Association (IWA). Urban Drainage and Wastewater Treatment for the 21st Century. In Proceedings of the 9th International Conference on Urban Drainage—ICUD, Portland, OR, USA, 8–13 September 2002. [Google Scholar]
  13. United States Environmental Protection Agency (US EPA). Low Impact Development—A Literature Review; EPA-841-B-00-005; Office of Water USA: Washington, DC, USA, 2000.
  14. Ahiablame, L.M.; Engel, B.A.; Chaubey, I. Effectiveness of Low Impact Development Practices: Literature Review and Suggestions for Future Research. Water Air Soil Pollut. 2012, 223, 4253–4273. [Google Scholar] [CrossRef]
  15. Woods-Ballard, B.; Kellagher, R.; Martin, P.; Bray, R.; Shaffer, P. The SUDS Manual; CIRIA C697; CIRIA: London, UK, 2007. [Google Scholar]
  16. Chocat, B.; Ashley, R.; Marsalek, J.; Matos, M.R.; Rauch, W.; Schilling, W.; Urbonas, B. Toward the Sustainable Management of Urban Storm-Water. Indoor Built Environ. 2007, 16, 273–285. [Google Scholar] [CrossRef]
  17. Barbosa, A.E.; Fernandes, J.N.; David, L.M. Key issues for sustainable urban stormwater management. Water Res. 2012, 46, 6787–6798. [Google Scholar] [CrossRef] [PubMed]
  18. Miguez, M.G.; Veról, A.P.; Carneiro, P.R.F. Sustainable Drainage Systems: An Integrated Approach, Combining Hydraulic Engineering Design, Urban Land Control and River Revitalisation Aspects. In Muhammad Salik Javaid. (Org.). Drainage Systems, 1th ed.; InTech—Open Access Publisher: Rijeka, Croatia, 2012; Volume 1, pp. 21–54. [Google Scholar]
  19. Argue, J.R. WSUD: Basic Procedures for ‘Source Control’ of Stormwater—A Handbook for Australian Practice; Urban Water Resources Centre, University of South Australia: Adelaide, Australia, 2004. [Google Scholar]
  20. Wong, T.; Brown, R.; International Water Association (IWA). Transitioning to Water Sensitive Cities: Ensuring Resilience through a new Hydro-Social Contract. In Proceedings of the 11th International Conference on Urban Drainage, Edinburgh, UK, 31 August–5 September 2008. [Google Scholar]
  21. Johnstone, P.; International Water Association (IWA). Water Sensitive Cities—Science-Policy Partnershi. In Proceedings of the 12th International Conference on Urban Drainage—ICUD, Porto Alegre, Brazil, 10–15 September 2011. [Google Scholar]
  22. Bellos, V.; Tsakiris, G. Comparing various methods of building representation for 2D flood modelling in built-up areas. Water Res. Manag. 2015, 29, 379–397. [Google Scholar] [CrossRef]
  23. Chang, T.-J.; Wang, C.-H.; Chen, A.S. A novel approach to model dynamic flow interactions between storm sewer system and overland surface for different land covers in urban areas. J. Hydrol. 2015, 524, 662–679. [Google Scholar] [CrossRef]
  24. Nasello, C.; Tucciarelli, T. Dual Multilevel Urban Drainage Model. J. Hydraul. Eng. ASCE 2005, 131, 748–754. [Google Scholar] [CrossRef]
  25. Leon, A.S.; Nanía, L.S.; Schmidt, A.; García, M.H. A Robust and Fast Model for Simulating Street Flooding. In Proceedings of the ASCE EWRI World Environmental & Water Resource Congress, Kansas City, MO, USA, 17–21 May 2009. [Google Scholar]
  26. Noh, S.J.; Lee, S.; An, H.; Kawaike, K.; Nakagawa, H. Ensemble urban flood simulation in comparison with laboratory-scale experiments: Impact of interaction models for manhole, sewer pipe, and surface flow. Adv. Water Res. 2016, 97, 25–37. [Google Scholar] [CrossRef]
  27. Maksimovic, C.; Prodanovic, D. Modelling of Urban Flooding—Breakthrough or Recycling of Outdated Concepts. In Proceedings of the World Water and Environmental Resources Congress, Specialty Symposium, Orlando, FL, USA, 20–24 May 2001. [Google Scholar]
  28. Leandro, J.; Chen, A.S.; Djordjević, S.; Savić, D.A. Comparison of 1D/1D and 1D/2D Coupled (Sewer/Surface) Hydraulic Models for Urban Flood Simulation. J. Hydraul. Eng. ASCE 2009, 135, 495–504. Available online: http://ascelibrary.org/doi/abs/10.1061/(ASCE)HY.1943-7900.0000037 (accessed on 2 June 2011). [CrossRef]
  29. Spry, R.B.; Zhang, S. Modelling of drainage systems and overland flow paths at catchment’s scales. In Proceedings of the 7th International Conference on Urban Drainage Modelling and the 4th International Conference on Water Sensitive Urban Design, Monash University, Melbourne, Australia, 2–7 April 2006. [Google Scholar]
  30. Eleutério, J.; Mosé, R.; International Water Association (IWA). Comparison of strategies used to map riverine flooding: The town of Fislis, in France, as a case study. In Proceedings of the 12th International Conference on Urban Drainage—ICUD, Porto Alegre, Brazil, 10–15 September 2011. [Google Scholar]
  31. Abily, M.; Duluc, C.M.; Faes, J.B.; Gourbesville, P. Performance assessment of modelling tools for high resolution runoff simulation over an industrial site. J. Hydroinform. 2013, 15, 1296–1311. [Google Scholar] [CrossRef]
  32. Crowder, R.A.; Pepper, A.T.; Whitlow, C.; Sleigh, A.; Wright, N.; Tomlin, C. Benchmarking of Hydraulic River Modelling Software Packages; Environment Agency: Bristol, UK, 2004.
  33. Néelz, S.; Pender, G. Delivering benefits thorough evidences: Benchmarking the Latest Generation of 2D Hydraulic Modelling Packages; Report—SC120002; Environment Agency: Bristol, UK, 2013.
  34. Mignot, E.; Paquier, A.; Haider, S. Modeling floods in a dense urban area using 2D shallow water equations. J. Hydrol. 2006, 327, 186–199. [Google Scholar] [CrossRef]
  35. Neal, J.; Bates, P.; Fewtrell, T.; Hunter, N.M.; Wilson, M.; Horritt, M. Distributed whole city water level measurements from the Carlisle 2005 urban flood event and comparison with hydraulic model simulations. J. Hydrol. 2009, 368, 42–55. [Google Scholar] [CrossRef]
  36. Cunge, J.A.; Holly, F.M., Jr.; Verwey, A. Practical Aspects of Computational River Hydraulics; Pitman Advanced Publishing Program: London, England, UK, 1980. [Google Scholar]
  37. Zanobetti, D.; Lorgeré, H.; Preissman, A.; Cunge, J.A. Mekong Delta Mathematical Program Construction. J. Waterw. Harb. Div. ASCE 1970, 96, 181–199. [Google Scholar]
  38. Hutchison, I.P.G.; Midgley, D.C. Mathematical Model to Aid Management of Outflow from the Okavango Swamp, Botswana. J. Hydrol. 1973, 19, 93–113. [Google Scholar] [CrossRef]
  39. Cunge, J.A. Two-Dimensional Modelling of Flood Plains. In Unsteady Flow in Open Channels; cap. 17; Mahmood, K., Yevjevich, V., Eds.; Water Resources Publications: Littleton, CO, USA, 1975. [Google Scholar]
  40. Weiss, H.W.; Midgley, D.C. Suite of the Mathematical Flood Plain Models. J. Hydraul. Div. ASCE 1978, 104, 361–376. [Google Scholar]
  41. Major, T.F.; Lara, A.; Cunge, J.A. Mathematical Modelling of Yacyreta-Apipe Scheme of the Rio Parana. La Houille Blanche 1985, 6, 519–528. [Google Scholar] [CrossRef]
  42. Gallati, M.; Braschi, G.; Di Fillipo, A.; Rossi, U. Simulation of the Inundation of Large Areas of Complex Topography Caused by Heavy Floods. In Hydraulic Engineering Software Applications, Proceedings of the Third International Conference on Hydraulic Engineering Software, MA, USA, 3–5 April 1990; Blain, W.R., Ouazar, D., Eds.; Computational Mechanics Publications: Southampton, UK, 1990; pp. 117–126. [Google Scholar]
  43. Mascarenhas, F.C.B.; Miguez, M.G. Large Flood Plains Modeling by a Cell Scheme: Application to the Pantanal of Mato Grosso. In Second International Symposium on Engineering Hydrology; Hydraulics Division of the American Society of Civil Engineering (ASCE): San Francisco, CA, USA, 1993. [Google Scholar]
  44. Miguez, M.G.; Rezende, O.M.; Veról, A.P. City Growth and Urban Drainage Alternatives: Sustainability Challenge. J. Urban Plan. Dev. 2014, 140, 04014026. [Google Scholar] [CrossRef]
  45. Barbedo, J.; Miguez, M.G.; Van Der Horst, D.; Carneiro, P.; Amis, P.; Ioris, A. Policy dimensions of land-use change in peri-urban floodplains: The case of Paraty. Ecol. Soc. J. Integr. Sci. Resil. Sustain. 2015, 20, 5. [Google Scholar] [CrossRef]
  46. Miguez, M.G.; Veról, A.P.; Sousa, M.M.; Rezende, O.M. Urban Floods in Lowlands-Levee Systems, Unplanned Urban Growth and River Restoration Alternative: A Case Study in Brazil. Sustainability 2015, 7, 11068–11097. [Google Scholar] [CrossRef]
  47. Nardini, A.; Miguez, M.G. An Integrated Plan to Sustainably Enable the City of Riohacha (Colombia) to Cope with Increasing Urban Flooding, while Improving Its Environmental Setting. Sustainability 2016, 8, 198. [Google Scholar] [CrossRef]
  48. Giunta Provinciale (Provincia di Venezia). Piano Territoriale di Coordinamento Provinciale; Provincia di Venezia: Venezia, Italy, 2010. [Google Scholar]
  49. Veneto Agricoltura—Sezione Ricerca Agraria e Gestioni Agroforestali. Manuale per la Gestione Ambientale dei Corsi D’acqua a Supporto dei Consorzi di Bonifica; Veneto Agricoltura: Padova, Italy, 2011. [Google Scholar]
  50. Misure Termo-Pluviometriche Giornaliere Della Rete Tradizionale Dell’ex Ufficio Idrografico di Venezia—ANNO 2006; Agenzia Regionale per la Prevenzione e Protezione Ambientale del Veneto (ARPAV): Padova, Italy, 2006.
  51. Caratterizzazione Delle Piogge Intense sul Bacino Scolante Nella Laguna di Venezia; Agenzia Regionale per la Prevenzione e Protezione Ambientale del Veneto (ARPAV): Padova, Italy, 2012.
Figure 1. Sketch of a flow cell behaviour.
Water 09 00445 g001
Figure 2. Pre-defined urban pattern of an urban cell.
Water 09 00445 g002
Figure 3. Representation of flow under pressure in a drowned storm drain.
Water 09 00445 g003
Figure 4. Digital elevation model of the case study area, with output points located (triangles). Solid lines represent the outline of roads and pavements and buildings (Source: Néelz and Pender, Environmental Agency, 2013).
Water 09 00445 g004
Figure 5. Cell division for the modelled area in Test 8.
Water 09 00445 g005
Figure 6. Urban Flood Cell Model-MODCEL results for benchmarking Test 8A.
Water 09 00445 g006
Figure 7. MODCEL results for benchmarking Test 8B.
Water 09 00445 g007
Figure 8. La Riereta Watershed at Saint Boi de Lobregat/Spain and its modelled storm drain system.
Water 09 00445 g008
Figure 9. Calibration results for Storm Water Management Model (SWMM) and MODCEL simulations.
Water 09 00445 g009
Figure 10. Validation results for SWMM and MODCEL simulations.
Water 09 00445 g010
Figure 11. Noale city map, showing the main rivers (Dragonziolo to the north, Marzenego crossing the city centre, and Roviego to the south), some important spots (Areas 1–4) and the main direction of flow in the flood plains (dashed arrows).
Water 09 00445 g011
Figure 12. Highlights of the four areas in Figure 11: (a) lateral weir spills flood waters from Marzenego to Roviego River (aerial view and detail); (b) Zorzi watermill at Marzenego River restricts main channel flows, both in width and height, acting as a weir (aerial view and detail); (c) gates downstream of the castle sustain water levels in the moat and (d) main storm drain passing below Marzenego going to Roviego River.
Water 09 00445 g012
Figure 13. Example of a complex hydraulic site in the watershed, in a reach upstream the city centre: (a) Marzenego River running between dykes–on the right bank stands a deviation structure working for flood alleviation; (b) Deviation channel—looking to the deviation structure from downstream to upstream—note that on the left bank it is possible to see the outfall of a channel that crosses below Marzenego River; (c) Schematic view of the site, showing the river, its dykes, the deviation weir, the deviation channel and a former tributary passing below Marzenego River, also going to the deviation channel and (d) physical interpretation of the system working and how it is modelled.
Water 09 00445 g013
Figure 14. Modelled Cell Division.
Water 09 00445 g014
Figure 15. Modelled Cells projected over an aerial view of the studied area.
Water 09 00445 g015
Figure 16. Important Flooding Events—Noale.
Water 09 00445 g016
Figure 17. Design rainfall built for a return period of 50 years.
Water 09 00445 g017
Figure 18. Flood Map modelled for the event of September 2006.
Water 09 00445 g018
Figure 19. Flood Map modelled for a rainfall design event with 50-year return period.
Water 09 00445 g019

