Seepage Piping Evolution Characteristics in Bimsoils -An Experimental Study

Beijing Key Laboratory of Urban Underground Space Engineering, Department of Civil Engineering, School of Civil & Resource Engineering, University of Science and Technology Beijing, Beijing 100083, China
*
Authors to whom correspondence should be addressed.
Water 2017, 9(7), 458; https://doi.org/10.3390/w9070458
Submission received: 11 May 2017
/
Revised: 21 June 2017
/
Accepted: 22 June 2017
/
Published: 24 June 2017
Abstract
:Piping is a kind of seepage failure mode that commonly occurs under the influence of seepage force in soil materials. Many studies have been done to study the characteristics of piping for soil materials, however, the initiation and development mechanism of piping in bimsoils is poorly understood. In this work, an experimental program was set for investigating the evolution process of piping, in a self-developed servo-controlled flow–erosion–stress coupled testing system. All the studied samples with rock block percentage (RBP) of 30%, 40%, 50%, 60%, and 70%, were produced as a cylindrical shape (50 mm diameter and 100 mm height) by compaction tests with different hammer strike counts to roughly insure the same void ratio. The results show that the amount of rock blocks in bimsoil samples significantly influenced the initiation and development of piping. Furthermore, the stress state has a crucial influence on the critical hydraulic gradient, seepage velocity, permeability, erosion, and migration of soil particles. Moreover, interactions among soil matrix, rock blocks, and rock–soil interfaces control the seepage stability of the bimsoil sample.
1. Introduction
The term bimsoils (block-in-matrix-soils) is used to describe structurally complex geological formations characterized by a fine-grained soil matrix which includes in a typical block-in-matrix fabric, rock block fragments of variable sizes, strength, and different lithologies [1]. These complex mixtures are widespread and originate by several geological processes. In some literature, despite several researchers focusing on this special inhomogeneous and loose geomaterial, different terminologies have been used for mixed geo-materials similar to bimsoils, such as bimrock [2,3,4,5], soil and rock mixture [6,7,8,9,10,11], mélange [12,13,14,15,16,17], rock and soil aggregate [18,19], conglomerates [20], coarse-grain alluviums and colluviums [21], to name a few. Due to the different properties of the soil matrix, the types of seepage failure include erosion, flowing soil, and piping. Generally, flowing soil occurred in soil particles that are closer to each other and has a strong constraining force similar to that found in a clay matrix or relatively homogenous sand matrix; sometimes, this seepage failure may occur in inhomogeneous sand and the outlet has no protect measurements. Piping is a form of seepage erosion and the general name for the adverse effects of groundwater flow on soil stability. High seepage pressures may remove soil material to such an extent that geotechnical structures may, and do, collapse. Several terms have been used in the literature to classify this seepage erosion. For instance “heave” (a substantial soil volume which is simultaneously raised by seepage flow, Terzaghi [22]), “karst-piping” (the removal of material due to weathering) [23], “hydraulic fracturing” (the process of soil being locally pushed apart by pore water pressures) [24], and the “internal erosion” (the transport of small particles through a matrix of larger ones [25,26].
Piping has been studied since the turn of the century. It is mentioned in the context of dyke and dam design on sandy foundations where, in addition to the usual design problems encountered in civil engineering, seepage erosion plays an important role. Piping, as a typical seepage failure type, has drawn the attention of many scholars. There are theoretical and practical significance to study the mechanisms of piping and its prevention measures. Sherard et al. [27] indicated that the piping of loose soils is a common problem downstream of earth embankments under the influence of upward seepage. Foster et al. [28] reported that many embankment failures result from the occurrence of piping. Ojha et al. [29] stated that piping is a form of seepage erosion and involves the development of subsurface channels in which soil particles are transported through a porous medium. They indicated that piping erosion occurs in structures that are made up of loose soil with relatively high permeability. Ubilla et al. [30] reported that the main reason for the failure of the levees and flood walls can be the occurrence of piping. Cyril et al. [31] studied contact erosion at the interfaces between granular coarse soil and various base soils under tangential flow conditions, and proposed an empirical expression for critical velocity using effective base-soil grain diameter. Das et al. [32] studied the effect of discrete and randomly distributed fibers on the piping behavior of soil, and explained the mechanism of discrete fiber reinforcement in restraining piping of soil. Richards and Reddy [33] conducted a piping test for non-cohesive materials under relatively high confining stress. From the results, they found that the hydraulic gradient is a less reliable indicator of piping potential than the hydraulic velocity for non-cohesive soils. Fleshman and Rice [34] performed a test to study the initiation of piping erosion, and found that factors of grain size, grain shape, gradation, and specific gravity have some influence on the critical hydraulic gradient. Midgley et al. [35] quantified and modeled pipeflow and the internal erosion processes in the field with either natural or artificially created soil pipes, to study the mechanism of the instability of embankments and stream banks. Estabragh et al. [36] pointed out that piping is considered to be the main mechanism leading to failure of hydraulic structures in a soil and rock mixture. In bimsoils, which can be considered kind of special porous medium, piping is one of the typical types of seepage failure. In addition, piping is directly related to the instabilities that cause landslides, and to be the formation of dams and dyke building, which are composed of bimsoils. From statistical data worldwide, for the wreckage of earth-rockfill dams, about 40.5% of them are caused by seepage failure, e.g., the Malpasset Arch Dam in France 1959, the Balder Yamauchi Damin 1964, Teton in USA 1976, Gouhou Reservoir Dam in China 1993, etc. In addition, it is common for landslides composed of bimsoils to be closed to seepage failure. Piping often occurs in loose and unstable soil and rock medium structures, especially when there is a high rock block percentage. When this occurs, part of the soil and rock units cannot be coupled tightly, and some soil particles are even in a state of free suspension; under seepage flow, the high seepage gradient acts on soil–rock interfaces, and the seepage channel is easily formed at the soil–rock interfaces due to the seepage force. Once the formation of seepage channels occurs, these channels propagate into the soil matrix under continuous water flow, and small soil particles move in those channels and develop into piping seepage failure.
After the above literature review, it can be understood that piping is closely related to the internal structural characteristics of geomaterials. Furthermore, bimsoils are a special kind of soil particle and rock block coupling body, and the mechanical and physical properties are characterized by extreme nonhomogeneity, looseness, and environmental sensitivity. Piping seepage failure occurs in bimsoils is very common. Currently, studies about piping are mainly focused on soils (e.g., clay, silty, sand, sandy gravels, etc.) [37,38,39,40,41]. It is clear that few reports have been published about the piping evolution process in bimsoils. As a special geomaterial, bimsoil is made up of a mixture of fine soil aggregates, rock blocks, cracks, and pores [1,2,3,4,5,6,7,8,9,10]. These individual components of bimsoil usually have different hydraulic properties and different responses under flow condition. Randomly distributed rock blocks alter the seepage path of the fluids, while the drop of a large seepage force happens at rock–soil interfaces, and contact erosion at random rock–soil interfaces is dominant. The piping characteristic of bimsoil is obviously controlled by the inhomogeneous geological structure. Although the bimsoil piping phenomenon has been studied by several scholars [37,38,39,40,41,42,43,44], the study of the piping evolution process of bimsoil in laboratory test is mostly based on conventional penetration testing (e.g., constant head test) [37,38], and it is difficult to precisely control the seepage hydraulic pressure and hydraulic gradient. In addition, although field experiments can obtain macroscopic piping characteristics of bimsoil, it is impossible to study the change of the permeability coefficient with hydraulic gradient [41,42,43]. Moreover, the conventional penetration test that is the permeability test conducted in the laboratory cannot ensure an accurate constant pressure increment or flow rate of injected water. Therefore, the basic objective of the present work is to investigate the whole process of piping of bimsoils with different rock block percentage. The self-specific developed servo pressurized water supply test system the author developed can accurately control the water injection rate and pressure increment, and it is used to perform the piping test. From the relationship between hydraulic gradient, seepage velocity, and permeability coefficient, the whole piping process was experimentally investigated.
2. Experimental Study
2.1. The Testing Materials
(1) Soil matrix
The soil that was used in this experimental work was a kind of clay soil. The gradation curve of this soil is shown in Figure 1a. Standard compaction tests were carried out on natural soil according to ASTM D 698-07. The physical and mechanical properties of the soil are summarized in Table 1. Scanning Electron Microscope (SEM) and X-ray diffraction (XRD) tests were performed to obtain the mineral content and composition to typical soil matrix. From SEM images, many irregular and rodlike quartz grains surrounded by clay minerals can be observed under SEM scanning, the grain size is between 0.01 mm and 0.03 mm, as shown in Figure 2. The detailed mineral composition was acquired by XRD tests and listed in Table 2. From the analysis results, it can be seen that plenty of clay minerals (e.g., montmorillonite, kaolinite, and illite) exist in soil matrix (Wang et al., [9,10]).
(2) Rock blocks
According to the geotechnical test standards (GB/T 50123-1999; BS1377-1 (1990)) [44,45] and the prepared bimsoil sample, the threshold value for soil particle and rock block is determined as 5 mm. This is to say, when grain size exceeds 5 mm, it is treated as block, while it is treated as soil matrix if the grain size is below 5 mm. Lithology of rock blocks used in the experiment was marble, the size of rock blocks range between 2 and 5 mm (Figure 1b). The physical and mechanical properties are listed in Table 1. Generally, the morphological characteristics of the rock blocks have great effect on the geomechanical properties of bimsoil. The quantitative morphological feature of the rock blocks with weighted average indices are obtained by Image Pro software, as follows: (1) outline indices: elongation is 1.343, flakiness is 0.954, shape factor is 0.943, and sphericity is 0.845; and (2) angularity indices: convexity ratio is0.902, and angularity (Gradient Method) is 0.917.
2.2. Remolded Sample Preparation
Many researchers [9,10,11,46,47] have adopted the hand mixing method for mixing rock blocks uniformly with the soil matrix. In order to ensure homogeneity of the samples, the rock blocks were mixed by hand into the soil for several minutes.
Then compaction tests were conducted to produce samples similar to that used for natural soil. The maximum dry unit weight and optimum water content for all tests was determined. The following procedure was adopted when preparing the samples. In the preparation of unreinforced soil samples, the soil was mixed with an amount of water corresponding to the optimum water content. Moist soil was kept in a closed plastic bag and allowed to cure for 24 h. The above procedure was also used for preparing remolded bimsoil samples. All mixing was conducted by hand and proper care was taken to prepare homogenous mixtures at each stage of mixing. Dynamic compaction was used for preparing the samples, from the relationship between hammer count and soil density, the appropriate optimal hammer count was determined. Compaction was done in a split mold by applying a dynamic pressure, using a compaction test apparatus. Owing to the high difference of elastic modulus between the soil matrix and the rock block, the compactness of the bimsoil is actually the compactness of the soil matrix. Soil density is a very important factor affecting the permeability of the bimsoil, Zhou et al. [48] found that density of soil is much more sensitive to other factors. As a result, how to control the hammer count at different values is crucial to the sensitive analysis of piping. In this work, determination of hammer count producing samples with roughly the same soil density is from the curves, shown in Figure 3a. As shown in Figure 3a, the density of the soil matrix in bimsoil samples with a rock block percentage of 30–70% increased with the increase of hammer count. To keep the same soil density (i.e., void ratio) in the bimsoil samples, five dot dash lines intersect with the curves in Figure 3a, the corresponding abscissa values are determined as the optimal hammer count. Figure 3b plots the optimal hammer count for bimsoil samples, and it was determined as 3, 3.5, 5, 11, and 15 counts with rock block percentages of 30–70%, respectively. When the RBP reaches 70%, the soil in bimsoil samples is difficult to be compacted, the rock blocks play the role of a skeleton to a large extent. When the RBP is 70%, the soil matrix in samples is difficult to compact, considering that rock blocks in bimsoil samples with RBP of 70% would be crushed with too many hammer counts, therefore, 15 times was determined as the optimal hammer count. All the samples were compacted layer by layer with three layers in this work, as shown in Figure 4a. The length and diameter of the prepared samples were 100 and 50 mm. The prepared cylinder-shaped samples with RBP of 30–70% are shown in Figure 4b; all the tested samples were sealed with plastic wrap.
2.3. Experimental Setup
This experimental setup was previously described by Wang et al. [11]. Figure 5 shows the layout of the flow test system made up of rigid specimen holder, the servo pressurized water-supply system, and the specimen chamber system. The rigid specimen holder is composed of the beams, rigid column, rigid platform, guide bar, etc. The servo pressurized water-supply system includes the main parts of the speed feedback component, servo and drive motor, full digital servo controller, and the computer. It is the core component of the overall setup. The sample chamber system is composed of two metal seepage plates, two metal cushions (upper one and lower ones), two hose clamps, and a length of heat shrink tubing accommodating the bimsoil specimen. The detailed dimensions and structure of the mental cushion, and locations of the inlet and outlet valve are shown in Figure 6. The confining pressure system (Figure 7) is composed of hoek cell, air pump, barometer, pneumatic connector, and pneumatic pipe. For extreme heterogeneous geological materials, such as bimsoil or fractured rock mass, the stress distribution inside is extremely uneven, and the real state is that stress acting on every point of the boundary surface are equal [11]. The measurement range of the gas-pressure meter is 600 kPa, and its measuring precision is 0.5 kPa.
2.4. Piping Test Procedure
To study the flow–erosion–stress coupled evolution process of bimsoil samples with RBP, and to obtain some important results from the piping test, the detailed technical flowchart is shown in Figure 8. When water flow reaches steady state, we can record the water-outflow volume, hydraulic pressure and flow time at each of the injection steps, and calculate the hydraulic gradient, permeability coefficient based on Darcy law, as shown below [7]:
where Q is the total amount of water flow; A is the sample cross-section area; t is the flow time; L is flow distance (i.e., length of sample); P1 and P2 is the hydraulic pressure of the inlet valve and outlet valve, respectively; and and are the coefficient of water kinematic viscosity at T °C and 20 °C, respectively.
When water flows through the pores of the soil matrix and rock–soil interfaces, it transfers some of itsenergy to soil particles, and part of the energy can be absorbed byrock–soil interfaces. Therefore, a sudden drop ofthe seepage force is applied by the flowing water, which is referred herein as a seepage force f. Sometimes, aseepage force that was too large would be detrimental to stability of thebimsoils and structure of bimsoils. Combined with the equation for the hydraulic gradient I = (P1 − P2)/L, the seepage force canbe calculated as below:
where Fc is critical seepage force at critical hydraulic gradient; V is sample volume; rw is water density; and RBPv is the volume block proportion.
Fc = rw × ic × V × (1 − RBPv)
3. Results and Discussion
3.1. General Observations
Figure 9 plots the curves of flow water and hydraulic pressure against flow time; for the studied samples with rock block percentage of 30%, 50%, and 70%, the confining pressure is zero. It can be seen that the hydraulic gradient increases gradually until to a critical value. After this value, the curves of the hydraulic pressure fluctuate with an increase of time. The results indicate that during the evolution of piping, the erosion and movement of soil particles results in a change of the permeability of the bimsoil sample. After the fine soil particles clog the pores during movement, leading to incremental of hydraulic pressure; and when the clogged pores break through again, the permeability coefficient suddenly increases, resulting in the decrement of hydraulic pressure. From the curves of the water flow, it can also be seen that the slope of the curve is not constant, but variational during the whole test. In addition, the maximum hydraulic gradient decreases with the increase of block content, and the slope of the curves increases with increasing rock blocks in bimsoil sample.
3.2. Piping Characteristic Curves Analysis
In this section, piping tests are performed for bimsoil samples with RBP of 30%, 40%, 50%, 60%, and 70%. We define the initial hydraulic pressure (P0) as the pressure in the inlet of the upper cushion, because bimsoil is a kind of special porous medium, when water flows in the sample and reaches steady seepage, the actual hydraulic pressure is generally lower than P0. This is to say, the hydraulic gradient is lower than the excreted value at the inlet. Figure 10 plots the relationship between hydraulic gradient, seepage velocity, permeability coefficient and initial hydraulic gradient. It was considered that when the water from the outlet valve became somewhat muddy, the hydraulic gradient at this moment is defined as the critical hydraulic gradient. Because the hydraulic pressure is excreted step by step, the obtained value has an error limit of 5–10%. Some significant results can be drawn from the curves as follows:
- (1)
- The value of the hydraulic gradient, seepage velocity, and permeability increases with the increasing of initial hydraulic pressure until the maximum. This indicates that the flow rule of bimsoil does not obey the Darcy flow law. The permeability capacity is variational and not constant. After a critical value of the three studied parameters, the curves fluctuate as the initial hydraulic pressure increases.
- (2)
- Although the curves show a fluctuating trend, the value cannot exceed the critical peak value. This result implies that irreversible damage occurs in bimsoil during piping. During the process of piping, the erosion and the movement of soil particles results in a change of permeability. Fine soil particles clog the pores during movement, leading to an incremental increase in the hydraulic gradient, seepage velocity, and the associated permeability coefficient; and when the clogged pores break through again, these values suddenly decrease. This non-linear multiple fluctuation always exist with the piping process.
- (3)
- The non-linear fluctuation behavior of the curves shows that the evolution of piping includes a series of complex movement behaviors, such as the erosion, migration of fine soil particles; contact erosion of the rock–soil interface; forming of the pore channel; blocking of the flow channel by fine soil particles; breakdown of the blocked flow channel; and re-blocking of the flow channel, etc. The characteristics of piping in bimsoil are progressive and repeated. The blocked flow channel can be attributed to two factors, one is the fine soil particles; the other is the movement of rock blocks, as the structure of bimsoil sample changes, the blocks would sink along the direction of water flow. From the non-linear evolution of piping flow in bimsoil, existence of rock blocks has a strong influence on the piping characteristics, which is different from the piping process in clay soil and sandy gravels [49,50,51,52,53].
- (4)
- The critical hydraulic gradient decreases with the increase of RBP (Figure 11). Existence of rock blocks not only influences the flow rule, but also the degree of contact erosion at rock–soil interfaces. With the increases of RBP, the number of rock–soil interfaces increases and the contact erosion at rock–soil interface becomes severe, resulting in the decrease of the hydraulic gradient.
- (5)
- The evolution of the bimsoil permeability coefficient is directly related to the erosion of the fine soil. Because the soil–rock interface is the weakest part of the bimsoil, the degree of erosion is most severe; therefore, the interface seepage effect controls the whole eroded soil.
3.3. Seepage Force Analysis
The critical seepage force is calculated using Equation (2); the relationship between the critical seepage force and initial hydraulic pressure is shown in Figure 12a. At the initiation of seepage piping, piping resistance of the bimsoil is equal to the critical seepage force; plots of the maximum seepage force to RBP are shown in Figure 12b. Owing to multiple behaviors of seepage piping, seepage force shows fluctuation change with increasing hydraulic gradient. The seepage obtained in Figure 12a is the resistance force that acts on the soil matrix. This result reflects the erosion, migration of fine soil particles, opening of piping flow channel, and blocking of channels. It should be noted that contact erosion at rock–soil interfaces is also crucial to the stability of bimsoil. Figure 12c shows the relationship between critical hydraulic gradient and rock block percentage. It can also be seen that value of critical hydraulic gradient decreases with the increase of RBP.
3.4. Eroded Soil Mass Analysis
During the whole piping test, the eroded soil particles are collected from the outlet by a loophole, witha sieve hole diameter of 75 μm (No. 200) (ASTM D2434-68). As shown in Figure 13, after the critical hydraulic gradient, soil particles begin to move out from the outlet of sample chamber. It can be seen that the mass of eroded soil is not monotonically increasing with the increase of initial hydraulic gradient. The variation tendency shows a fluctuation. This implies that movement of soil particles are blocked at some moment, at this moment, the flow channel is blocked; when the particles accumulates to a certain mass, the blocked flow channel breakdown again. The variation of eroded soil mass also reflects the characteristics of piping: it is progressive, circulated, and repeated. The sudden increase of eroded soil mass is the cause of high seepage velocity of the water flow, under the action of high hydraulic pressure difference from the inlet and outlet.
The maximum eroded soil mass is 0.44, 0.49, 0.51, 0.73, and 1.01 g, respectively. As shown in Figure 14, the relationship of eroded soil mass and RBP follows an exponential function; and there presents the rapidly increase with increasing RBP. This result indicates that rock blocks play an important role in contact piping in bimsoils.
3.5. Effect of Confining Pressure on Piping Evolution
The stress state of soil has an obvious effect on the evolution of piping. Mao [54] pointed out that conducting an in-situ piping test is much more important for predicting the seepage failure phenomenon. Cao [55] compared the piping results of the undisturbed sample and disturbed sample, and they found that the critical hydraulic gradient is larger for the undisturbed sample. Therefore, the piping test should consider the influence of the stress state. Currently, piping flow devices can be divided into three kinds: one kind ignore the stress state to piping evolution [56]; one kind only considers the axial force on the effect of piping evolution [57]; and the other kind can simulate the in-situ stress state [58,59]. Although the device can exert axial stress and confining pressure simultaneously, the mode of water injection is controlled by the water head, the injection water or injected pressure cannot be servo-controlled at a constant rate. However, in this work, we use the servo pressurized water-supply system to inject water into the bimsoil sample. By computer operation, the servo pressurized water supply system can inject water at a constant rate or pressure to the sample chamber. The confining pressure is exerted at an equivalent stress mode, to achieve a flexible loading boundary on the bimsoil. Figure 15 shows the effect of confining pressure on the critical hydraulic gradient. For the studied samples with different RBP, the critical hydraulic gradient increases with increasing confining pressure. We can deduce the critical hydraulic gradient under high in-situ stress through curve fitting approximation, and the approximation equations that have the highest correlation coefficient were determined for the critical hydraulic gradient-confining pressure equations. The relationship between critical hydraulic gradient and confining pressure obeys linear function, as listed in Table 3; the expression of bimsoil critical hydraulic gradient is expressed below:
where Pc is the effective confining pressure; a and b are the regression coefficients; and icr is the critical hydraulic gradient.
icr = a × Pc + b
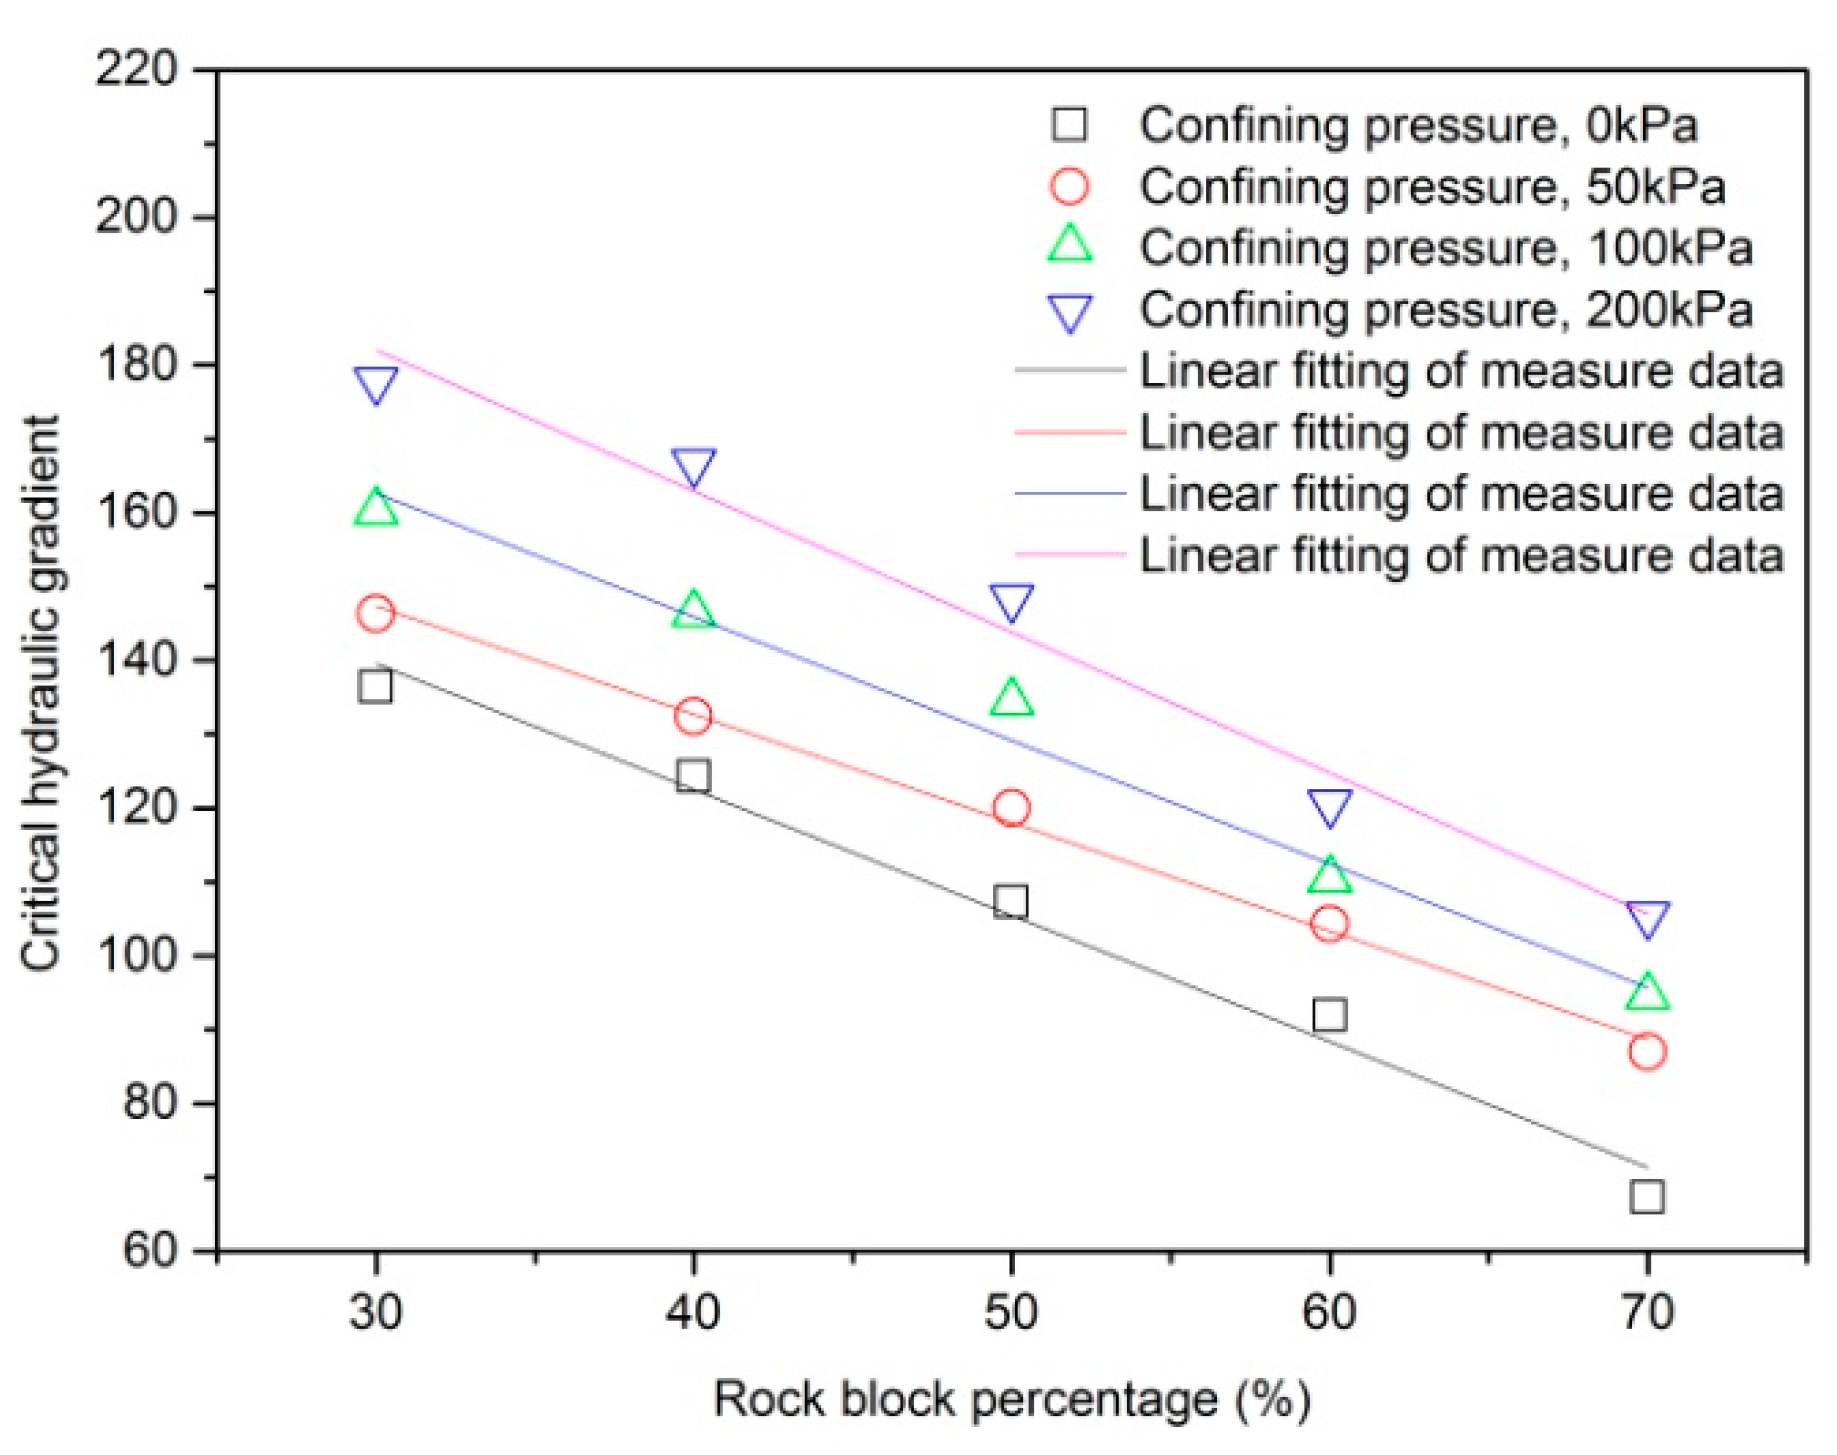
When the bimsoil samples are under an equivalent stress state (i.e., axial stress equals confining pressure), the values of critical hydraulic gradient are larger than samples under zero confining state. This result indicates that the samples are obviously compacted under an equivalent stress state, the drag resistance for soil erosion and migration is increased, obviously. Therefore, under this stress state, the critical hydraulic gradient increases with increasing confining pressure. From this result, we can infer that it is necessary to consider the stress state when conducting the piping test. Figure 16 plots the critical hydraulic gradient against rock block percentage, and the critical hydraulic gradient presents a linear monotonic decreasing trend (Table 4). Rock blocks as a special factor in bimsoil cause contact erosion at rock–soil interfaces that becomes severe with increasing RBP.
3.6. Discussion
From the piping test results, the evolution process for bimsoil with different rock block percentage presents progressive and circulatory characteristics. Piping seepage failure includes a series of complex movement behaviors, such as the erosion, migration of fine soil particles →contact erosion of rock–soil interface→ forming of pore channels→ blocking of flow channel by fine soil particles→ breakdown of the blocked flow channel →re-blocking of the flow channel, etc. These series of non-linear behaviors may be relevant to the properties of the soil matrix. In this work, only the bimsoil with a clay matrix was investigated. Owing to the mineral composition and microstructure, the matrix properties would have a strong influence on the piping evolution progress. However, the behavior of clogging and suffusion exist for various bimsoils with different soil matrix.
Contact erosion at the rock–soil interface is always the decisive factor controlling the seepage failure of the sample. Along the seepage direction, the hydraulic pressure sharply decreases in rock blocks, resulting in the formation of a great seepage force at the rock–soil interfaces, and this is where erosion flow channels first form. Therefore, the characteristics of rock blocks (e.g., size, shape, distribution, content, etc.) control the flow life of the sample. We also deduced that soil deposits at the outlet of the sample chamber block the seepage of water, which would influence the permeability of the bimsoil sample; the critical hydraulic gradient curve may be influenced by the deposit of fine particle at the outlet. Cyril et al. [31] conducted turbidity measurements to quantitatively estimate the mass of soil that was eroded during the experiment, and this method can also be used in the piping test for bimsoils.
4. Conclusions
Comprehensive laboratory experiments were conducted using a specially developed servo-controlled piping system to investigate the evolution of seepage failure in artificial bimsoil samples with different rock block percentage types. This study showed that the piping of bimsoil involves a series of behaviors resulting from the interaction between the soil matrix and rock blocks. The main conclusions are as follows:
- (1)
- Piping of bimsoilis a multiphase and multifield coupling phenomenon involving numerous complicated mechanical behaviors such as the erosion, migration of fine soil particles, contact erosion of rock–soil interfaces, formation of pore channels, blocking of flow channels by fine soil particles, breakdown of the blocked flow channel, re-blocking of the flow channel, etc.
- (2)
- From the change of hydraulic gradient, permeability coefficient, and eroded soil mass, piping of bimsoils is characterized by being progressive and circulated. The clog and suffusion of soil particles initiates from rock–soil interfaces, and the initiation of suffusion required seepage velocity is an order of magnitude more than the critical value.
- (3)
- Stress state has an obvious effect on the critical hydraulic gradient, seepage velocity, permeability, erosion, and migration of soil particles. It is found that an increase in confining pressure causes an increase in critical hydraulic gradient, and the relationship between critical hydraulic gradient and confining pressure follows a linear function with good correlation.
Acknowledgments
The authors would like to thank the editors and the anonymous reviewers for their helpful and constructive comments. This work was supported by the Beijing Natural Science Foundation of China (Grants No.8164070), and the Fundamental Research Funds for the Central Universities.
Author Contributions
Y. Wang and C.H. Li designed the theoretical framework; Y. Wang conducted the experiment, analyzed the experimental date and wrote the manuscript; and X. L. Zhou and X. M. Wei corrected the figures.
Conflicts of Interest
The authors declare no conflict of interest.
References
- Lindquist, E.S. The Strength and Deformation Properties of Melange. Ph.D. Thesis, Department of Civil Engineering, University of California, Berkeley, CA, USA, 1994. [Google Scholar]
- Kahraman, S.; Alber, M. Estimating unconned compressive strength and elastic modulus of a fault breccias mixture of weak block sand strong matrix. Int. J. Rock Mech. Min. Sci. 2006, 43, 1277–1287. [Google Scholar] [CrossRef]
- Kahraman, S.; Alber, M. Triaxial strength of a fault breccias of weak rocks in a strong matrix. Bull. Eng. Geol. Environ. 2008, 67, 435–441. [Google Scholar] [CrossRef]
- Sonmez, H.; Kasapoglu, K.E.; Coskun, A.; Tunusluoglu, C.; Medley, E.W.; Zimmerman, R.W. A conceptional empirical approach for the overall strength of unwelded bimrocks. In Rock Engineering in Difficult Ground Conditions, Karst and Soft Rock, Proceeding of the International Society Rock Mechanics Regional Symposium, Dubrovnik, Croatia, 29–31 October 2009; pp. 29–31.
- Coli, N.; Boldin, I.D.; Bandini, A.; Lopes, D.S. Modeling of complex geological rock mixtures under triaxial testing conditions. In Proceedings of the International Symposium on Rock Engineering &Technology for Sustainable Underground Construction (Eurock), Stockholm, Sweden, 28–30 May 2012. [Google Scholar]
- Xu, W.J.; Xu, Q.; Hu, R.L. Study on the shear strength of soil–rock mixture by large scale direct shear test. Int. J. RockMech. Min. Sci. 2011, 48, 1235–1247. [Google Scholar]
- Wang, Y.; Li, X.; Wu, Y.F.; Lin, C.; Zhang, B. Experimental study on meso-damage cracking characteristics of RSA by CT test. Environ. Earth Sci. 2015, 73, 5545–5558. [Google Scholar] [CrossRef]
- Wang, Y.; Li, X.; Zheng, B.; Zhang, B.; Wang, J.B. Real-time ultrasonic experiments and mechanical properties of soil and rock mixture during triaxial deformation. Géotech. Lett. 2015, 5, 281–286. [Google Scholar] [CrossRef]
- Wang, Y.; Li, X.; Zheng, B.; Zhang, Y.X.; Li, G.F. Experimental study on the non-Darcy flow characteristics of soil-rock mixture. Environ. Earth Sci. 2016, 75, 1–18. [Google Scholar] [CrossRef]
- Wang, Y.; Li, X.; Zheng, B.; Li, S.D.; Duan, Y.T. A laboratory study of the effect of confining pressure on permeable property in soil-rock mixture. Environ. Earth Sci. 2016, 75, 1–16. [Google Scholar] [CrossRef]
- Wang, Y.; Li, X.; Zheng, B.; Ma, C.F. An Experimental Investigation of the Flow–Stress Coupling Characteristics of Soil–Rock Mixture under Compression. Transp. Porous Med. 2016. [Google Scholar] [CrossRef]
- Medley, E.; Lindquist, E.S. The engineering significance of the scale-independence of some Franciscan Melanges in California, USA. In Proceedings of the 35th US Rock Mechanics Symposium, Rotterdam, The Netherlands, 5–7 June 1995; Daemen, J.K., Schultz, R.A., Eds.; Balkema: Rotterdam, The Netherlands, 1995; pp. 907–914. [Google Scholar]
- Medley, E.W. Systematic characterization of mélange bimrocks and other chaotic soil/rock mixtures. Felsbau 1999, 17, 152–162. [Google Scholar]
- Medley, E.W. Observations on tortuous failure surfaces in Bimrocks. Felsbau 2004, 5, 35–43. [Google Scholar]
- Goodman, R.E.; Ahlgren, C.S. Evaluating safety of concrete gravity dam on weak rock. J. Geotech. Geoenviron. Eng. 2000, 126, 429–442. [Google Scholar] [CrossRef]
- Medley, E.W.; Wakabayashi, J. Geological characterization of mélange for practitioners. Felsbau 2004, 22, 10–18. [Google Scholar]
- Afifipour, M.; Moarefvand, P. Failure patterns of geomaterials with block-in-matrix texture: Experimental and numerical evaluation. Arab. J.Geosci. 2014, 7, 2781–2792. [Google Scholar] [CrossRef]
- Li, X.; Liao, Q.L.; He, J.M. In-situ tests and astochastic structural model of rock and soil aggregate in the three Gorges Reservoir Area, China. Int. J. Rock Mech. Min. Sci. 2004, 41, 702–707. [Google Scholar] [CrossRef]
- Wang, Y.; Li, X.; Zhang, B.; Wu, Y. Meso-damage cracking characteristics analysis for rock and soil aggregate with CT test. Sci. China Technol. Sci. 2014, 57, 1361–1371. [Google Scholar] [CrossRef]
- Akram, M.S. Physical and Numerical Investigation of Conglomeratic Rocks. Ph.D. Thesis, University New South Wales, Sydney, Australia, 2010. [Google Scholar]
- Sunuwar, S.C. Challenges on Estimating Shear Strength Parameters of Colluvium Slopes for Reservoir Slope Stability Analysis of Tamakoshi 3 Hydroelectric Project. Int. J. Landslide Environ. 2013, 1, 93–94. [Google Scholar]
- Terzaghi, K.; Peck, R.B. Soil Mechanics in Engineering Practice; John Wiley & Sons, Inc.: New York, NY, USA; London, UK; Sydney, Australia, 1956. [Google Scholar]
- Dykhovichnyi, Y.A.; Maksimenko, V.A. Design and Construction on Territories Subjected to Karst-Piping Processes in Moscow. Soil Mech. Found. Eng. 1979, 163, 147–151. [Google Scholar] [CrossRef]
- Seed, H.B. Laboratory Study of Hydraulic Fracturing. J. Geotech. Eng. Div. 1981, 107, 713–732. [Google Scholar]
- Lubochkov, E.A. Piping Resistant Non Cohesive Soils. Isvestia VN II G 71, May 1962; 61–89. [Google Scholar]
- Van Zyl, D.; Harr, M.E. Seepage Erosion Analysis of Structures. In Proceedings of the Tenth International Conference on Soil Mechanics and Foundation Engineering, Stockholm, Sweden, 15–19 June 1981; p. 503. [Google Scholar]
- Sherard, J.L.; Dunnigan, L.P.; Talbot, J.R. Basic properties of sand and gravel filters. J. Geotech. Eng. 1984, 110, 684–700. [Google Scholar] [CrossRef]
- Foster, M.A.; Fell, R.; Spannagle, M. The statistics of embankment dam failures and accidents. Can. Geotech. J. 2000, 37, 1000–1024. [Google Scholar] [CrossRef]
- Sellmeijer, J.B. On the Mechanism of Piping under Impervious structures. Ph.D. Thesis, University of Delft, Delft, The Netherlands, 1998. [Google Scholar]
- Ubilla, J.; Abdoun, T.; Sasaakul, L.; Sharp, M.; Steadman, S.; Vanadat-Ellis, W.; Zimmie, T. New Orleans levee system performance during hurricane Katrina, London Avenue and Orleans Canal South. J. Geotech. Geoenviron. Eng. ASCE 2008, 134, 668–680. [Google Scholar] [CrossRef]
- Cyril, G.; Yves-Henri, F.; Rémi, B. Contact erosion at the interface between granular coarse soil and various base soils under tangential flow condition. J. Geotech. Geoenviron. Eng. 2009, 136, 741–750. [Google Scholar] [CrossRef]
- Das, A.; Viswanadham, B.V.S. Experiments on the piping behaviour of geofiber-reinforced soil. Geosynth. Int. 2010, 17, 171–182. [Google Scholar] [CrossRef]
- Richards, K.S.; Reddy, K.R. Experimental investigation of initiation of backward erosion piping in soils. Géotechnique 2012, 62, 933–942. [Google Scholar] [CrossRef]
- Kevin, S.; Krishna, R.R. True triaxial piping test apparatus for evaluation of piping potential in earth structures. Geotech. Test. J. 2009, 33, 83–95. [Google Scholar]
- Midgley, T.L.; Fox, G.A.; Wilson, G.V. In situ soil pipeflow experiments on contrasting streambank soils. Trans. ASABE 2013, 56, 479–488. [Google Scholar] [CrossRef]
- Estabragh, A.R.; Soltannajad, K.; Javadi, A.A. Improving piping resistance using randomly distributed fibers. Geotext. Geomembr. 2014, 42, 15–24. [Google Scholar] [CrossRef]
- Covelli, C.; Palumbo, A.; Pianese, D. A few criteria for the evaluation of the hydraulic causes of the levees’ failure. In River Flow 2008, Proceedings of the International Conference on Fluvial Hydraulics, Cesme, Izmir, Turkey, 3–5 September 2008; KUBABA Congress Department and Travel Services.
- Ojha, C.S.P.; Singh, V.P.; Adrian, D.H. Determination of Critical Head in Soil Piping. J. Hydraul. Eng. 2003, 129, 511–518. [Google Scholar] [CrossRef]
- Fleshman, M.; Rice, J. Laboratory Modeling of the Mechanisms of Piping Erosion Initiation. J. Geotech. Geoenviron. Eng. 2014, 140, 1–12. [Google Scholar] [CrossRef]
- Weijers, J.B.A.; Sellmeijer, J.B. A New Model to Deal with Piping Mechanism. In Filters in Geotechnical and Hydraulic Engineering, Proceedings of the 1st International Conference “Geo-Filters”, Karlsruhe, Germany, 20–22 October 1992; Brauns, J., Heibaum, M., Schuler, U., Eds.; Balkema: Rotterdam, The Netherlands, 1993; pp. 349–355. [Google Scholar]
- Gao, Q.; Liu, Z.H.; Li, X.; Li, J.H. Permeability Characteristics of Rock and Soil Aggregate of Backfilling Open-Pit And Particle Element Numerical Analysis. Chin. J. Rock Mech. Eng. 2009, 28, 2342–2348. (In Chinese) [Google Scholar]
- Chen, Z.H.; Chen, S.J.; Chen, J.; Sheng, Q.; Yan, H.; Hu, W. In-situ Double-Ring Infiltration Test of Soil-Rock Mixture. J. Yangtze River Sci. Res. Inst. 2012, 29, 52–56. (In Chinese) [Google Scholar]
- Wu, J.H.; Chen, J.H.; Lu, C.W. Investigation of the Hsien-du-Shan rock avalanche caused by typhoon Morakot in 2009 at Kaohsiung county, Taiwan. Int. J. Rock Mech. Min. Sci. 2013, 60, 148–159. [Google Scholar] [CrossRef]
- ASTM D 2434-68. Standard Test Method for Permeability of Granular Soils (Revised, Constant Head); ASTM International Press: West Conshohocken, PA, USA, 2006. [Google Scholar]
- BS1377-1. Methods of Test for SOILS for Civil Engineering Purposes—Part 1: General Requirements and Sample Preparation; British Standard: London, UK, 1990. [Google Scholar]
- Donaghe, R.T.; Torrey, V.H. Proposed New Standard Test Method for Laboratory Compaction Testing of Soil-Rock Mixtures Using Standard Effort. Geotech. Test. J. 1994, 3, 387–392. [Google Scholar]
- Rücknagel, J.; Götze, P.; Hofmann, B.; Christen, O.; Marschall, K. The influence of soil gravel content on compaction behaviour and pre-compression stress. Geoderma 2013, 209–210, 226–232. [Google Scholar] [CrossRef]
- Zhou, Z.; Fu, H.L.; Liu, B.C. Orthogonal tests on permeability of soil-rock mixture. Chin. J. Rock Mech. Eng. 2006, 28, 1132–1138. (In Chinese) [Google Scholar]
- Khilar, K.C.; Fogler, H.S.; Gray, D.H. Model for Piping-Plugging in Earthen Structures. J. Geotech. Eng. ASCE 1985, 111, 833–846. [Google Scholar] [CrossRef]
- Ozkan, S. Analytical Study on Flood Induced Seepage under River Levees. Ph. D. Thesis, Louisiana State University, Baton Rouge, LA, USA, 2003. [Google Scholar]
- Xu, W.J.; Wang, Y.G. Meso-structural permeability of S-RM based on numerical tests. China J. Rock Mech. Eng. 2010, 32, 543–550. [Google Scholar]
- Skempton, A.W.; Brogan, J.M. Experiments on piping in sandy gravels. Geotechnique 1994, 44, 449–460. [Google Scholar] [CrossRef]
- Yalin, M.S.; Karahan, E. Inception of sediment transport. J. Hydraul. Div. 1979, 105, 1433–1443. [Google Scholar]
- Mao, C.X. Discussion of “Seepage control of earth dam on the sand-gravel foundation”. J. Hydraul. Eng. 1963, 4, 66–69. (In Chinese) [Google Scholar]
- Cao, D.L. Cofferdam seepage control of Gezhouba Project. J. Hydraul. Eng. 1988, 19, 49–55. (In Chinese) [Google Scholar]
- Kenney, T.C.; Lau, D. Internal stability of granular filters. Can. Geotech. J. 1985, 22, 215–225. [Google Scholar] [CrossRef]
- Palmeira, E.M.; Fannin, R.J.; Vaid, Y.P. A study on the behavior of soil-geotextile systems in filtration tests. Can. Geotech. J. 1996, 33, 899–912. [Google Scholar] [CrossRef]
- Luo, Y.L.; Wu, Q.; Zhan, M.L.; Sheng, G.C. Development of Seepage-Erosion-Stress Coupling Piping Test Apparatus and Its Primary Application. Chin. J. Rock Mech. Eng. 2013, 32, 2108–2114. (In Chinese) [Google Scholar]
- Tomlinson, S.S.; Vaid, Y.P. Seepage forces and confining pressure effects on piping erosion. Can. Geotech. J. 2000, 37, 1–13. [Google Scholar] [CrossRef]
Figure 1.
The characteristics of soil matrix and rock blocks for bimsoils in this study: (a) grain size distribution of soil matrix; and (b) rock blocks used in bimsoil samples, size range from 2 mm to 5 mm according to BS1377-1 (1990).
Figure 1.
The characteristics of soil matrix and rock blocks for bimsoils in this study: (a) grain size distribution of soil matrix; and (b) rock blocks used in bimsoil samples, size range from 2 mm to 5 mm according to BS1377-1 (1990).
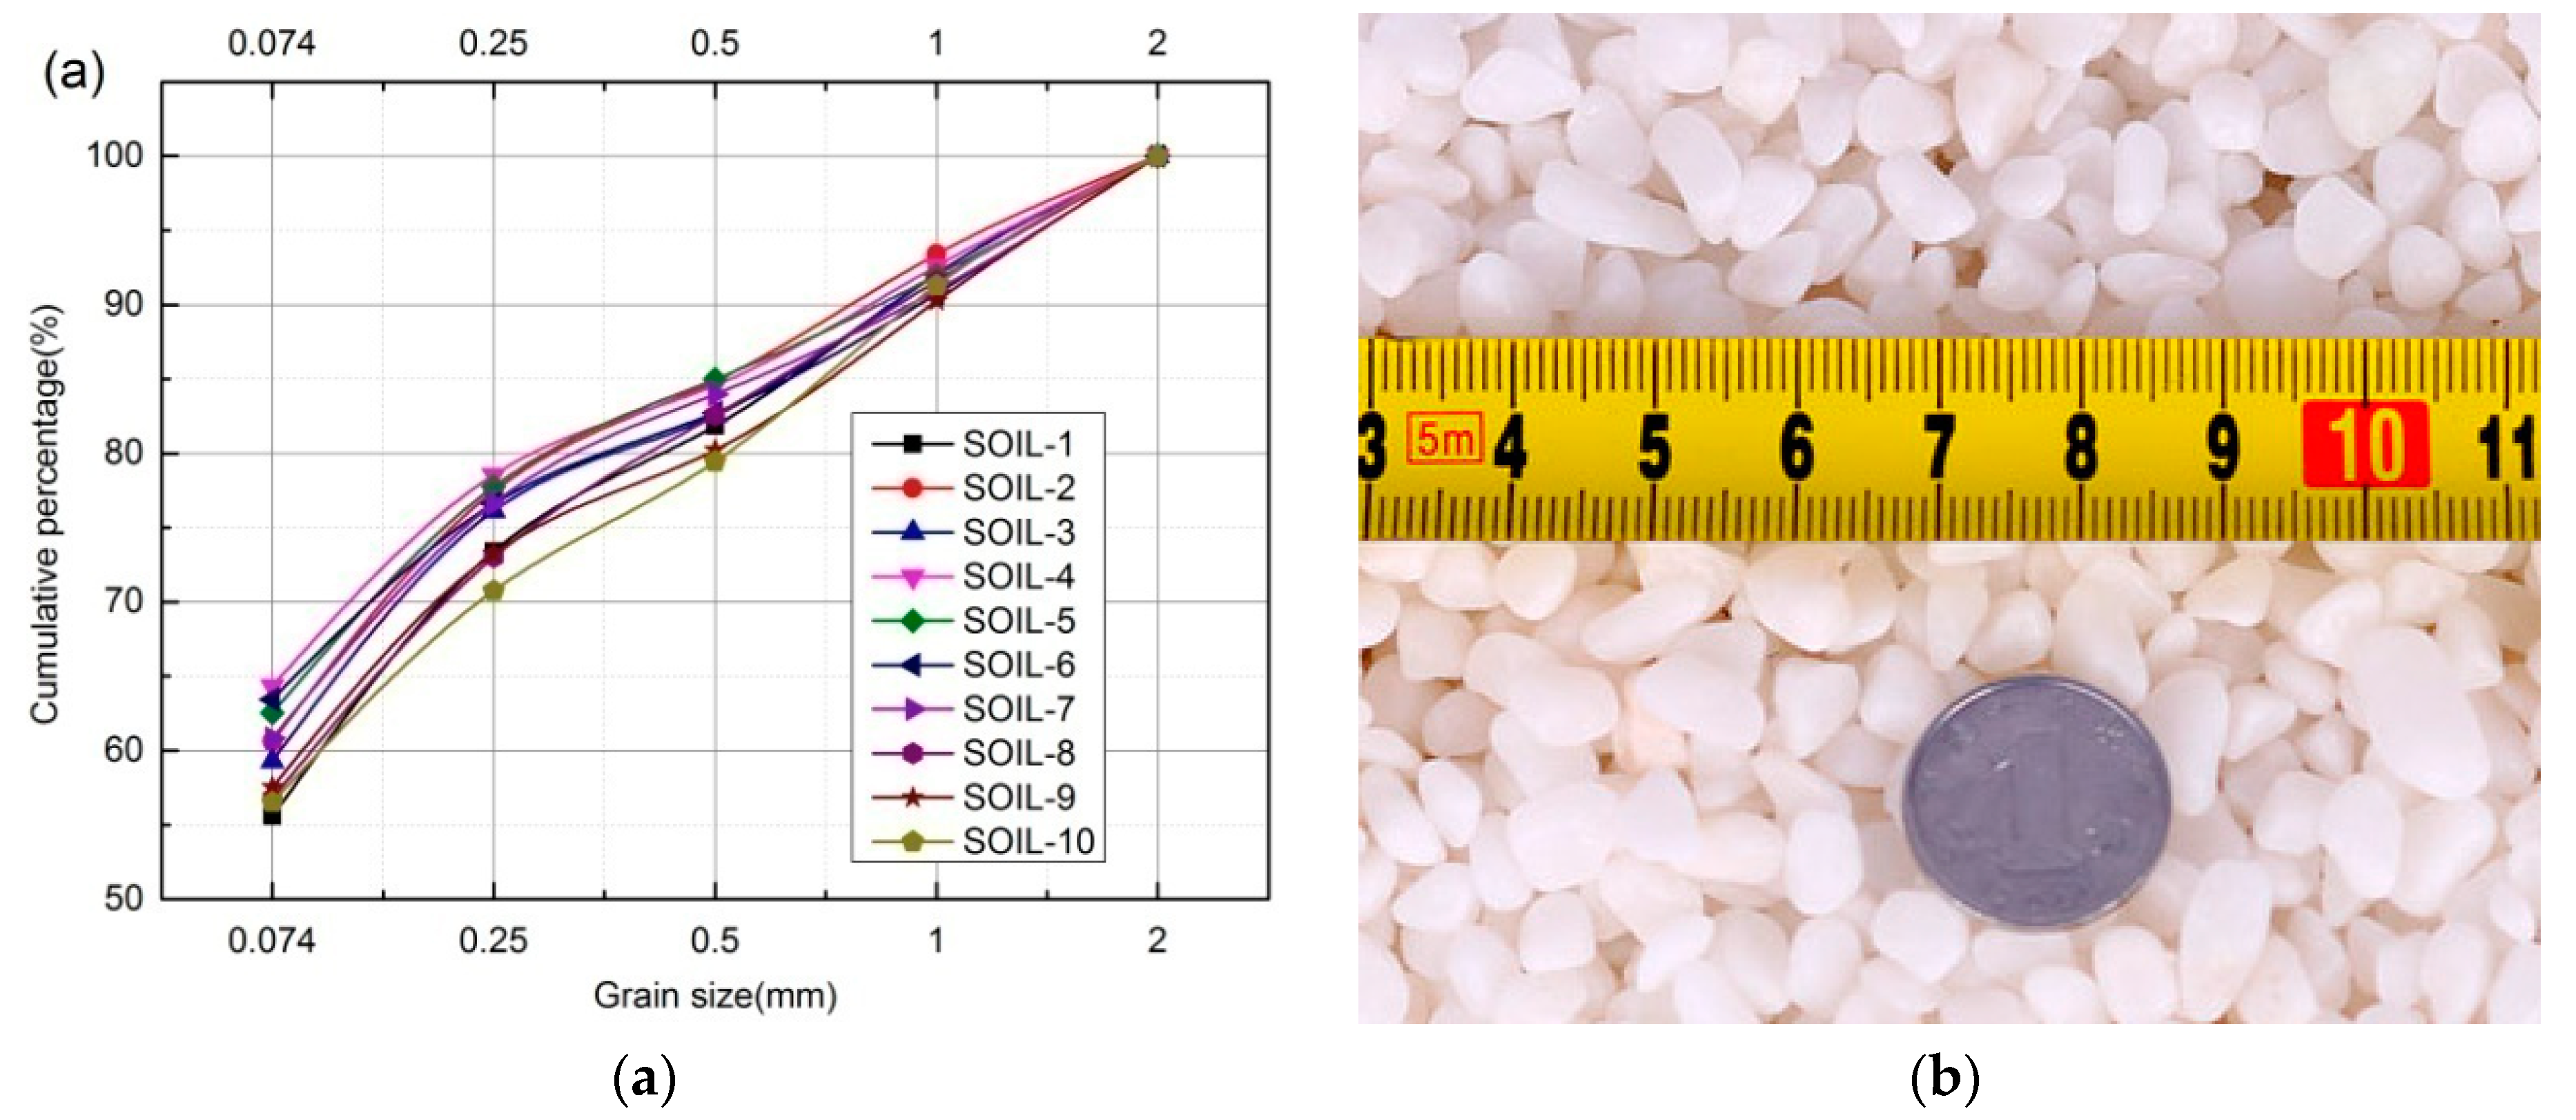
Figure 2.
SEM (Scanning Electron Microscope) images for typical soil matrix of in bimsoil: (a) the SEM picture magnified 2000 times; and (b) present EDS spectra and charts of elemental weight percentages of points 1 and 2, respectively. Accelerating voltage = 15 kV.
Figure 2.
SEM (Scanning Electron Microscope) images for typical soil matrix of in bimsoil: (a) the SEM picture magnified 2000 times; and (b) present EDS spectra and charts of elemental weight percentages of points 1 and 2, respectively. Accelerating voltage = 15 kV.
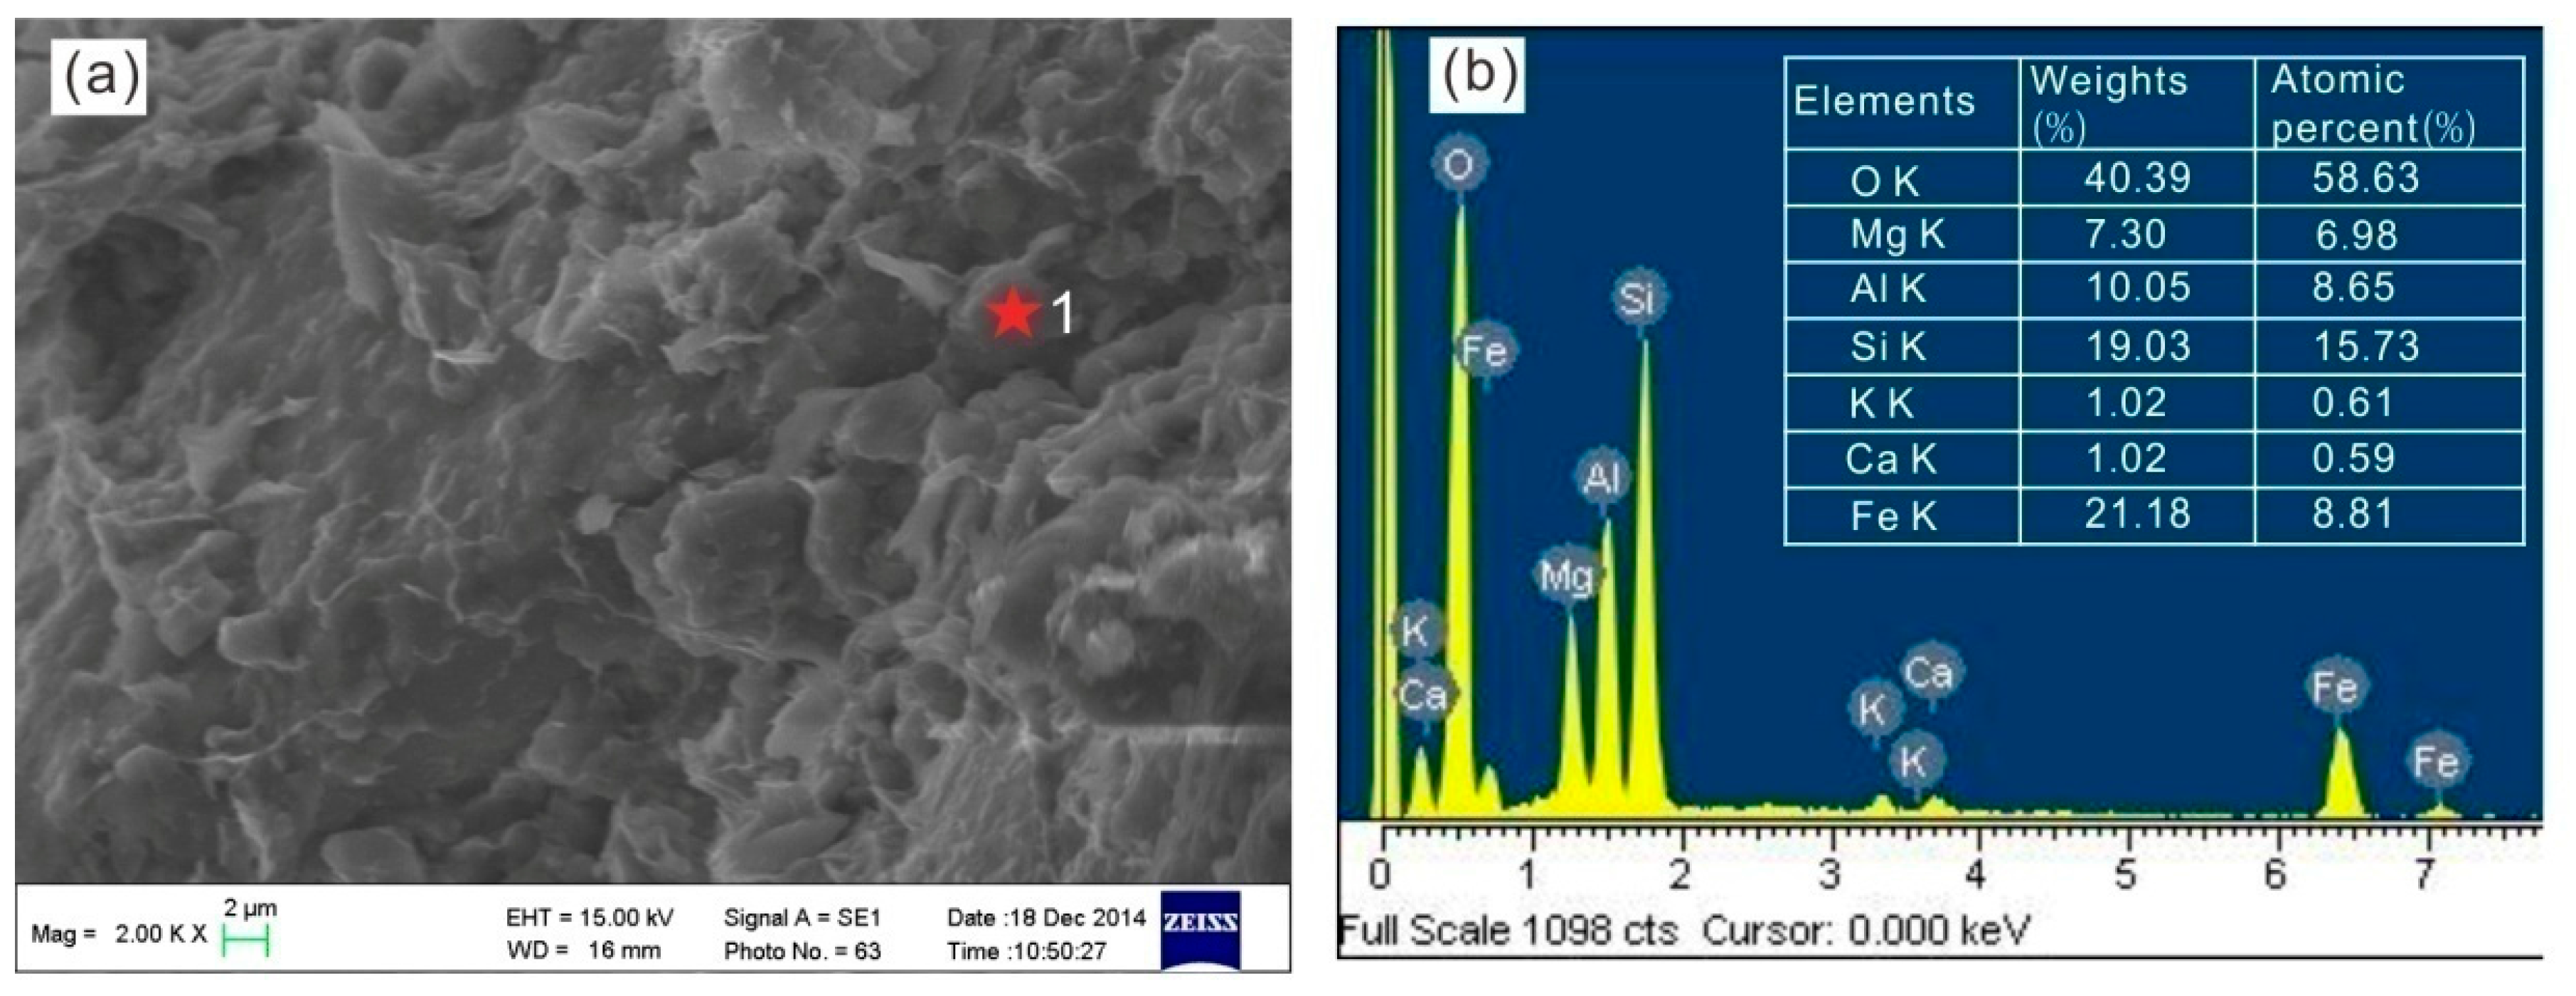
Figure 3.
The relationship between hammer count and soil density and rock block percentage: (a) relationship between the density of soil matrix and hammer count, for samples with rock block percentage of 20–70%; and (b) determination of the optimal hammer count.
Figure 3.
The relationship between hammer count and soil density and rock block percentage: (a) relationship between the density of soil matrix and hammer count, for samples with rock block percentage of 20–70%; and (b) determination of the optimal hammer count.
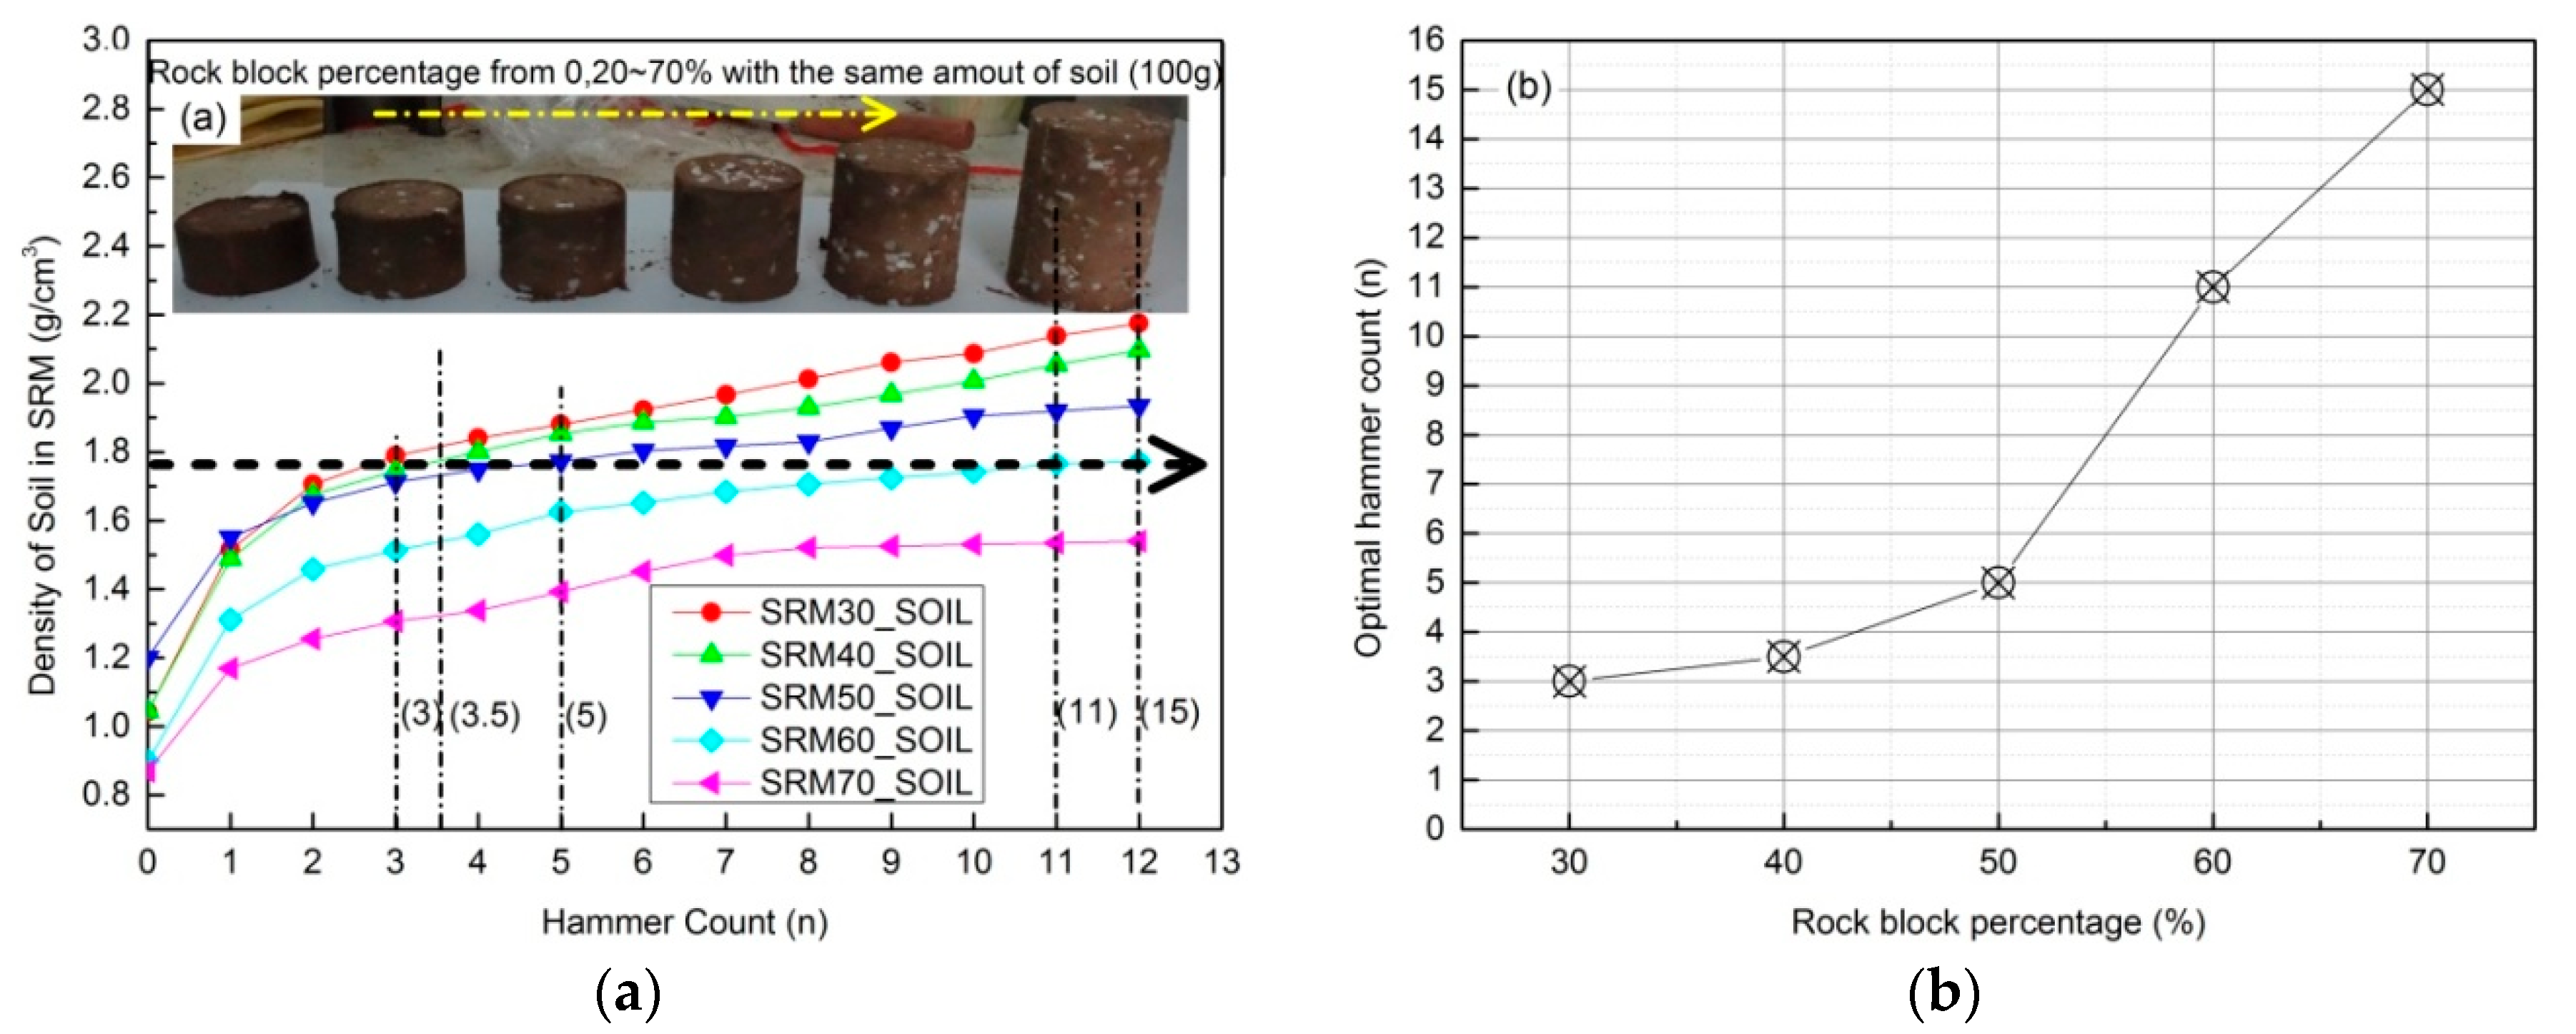
Figure 4.
Preparation of the remolded samples and samples used in the piping tests: (a) production of the remolded samples with Compact Test, the sample was compacted with three layers; and (b) partial remolded bimsoil samples for permeability test.
Figure 4.
Preparation of the remolded samples and samples used in the piping tests: (a) production of the remolded samples with Compact Test, the sample was compacted with three layers; and (b) partial remolded bimsoil samples for permeability test.
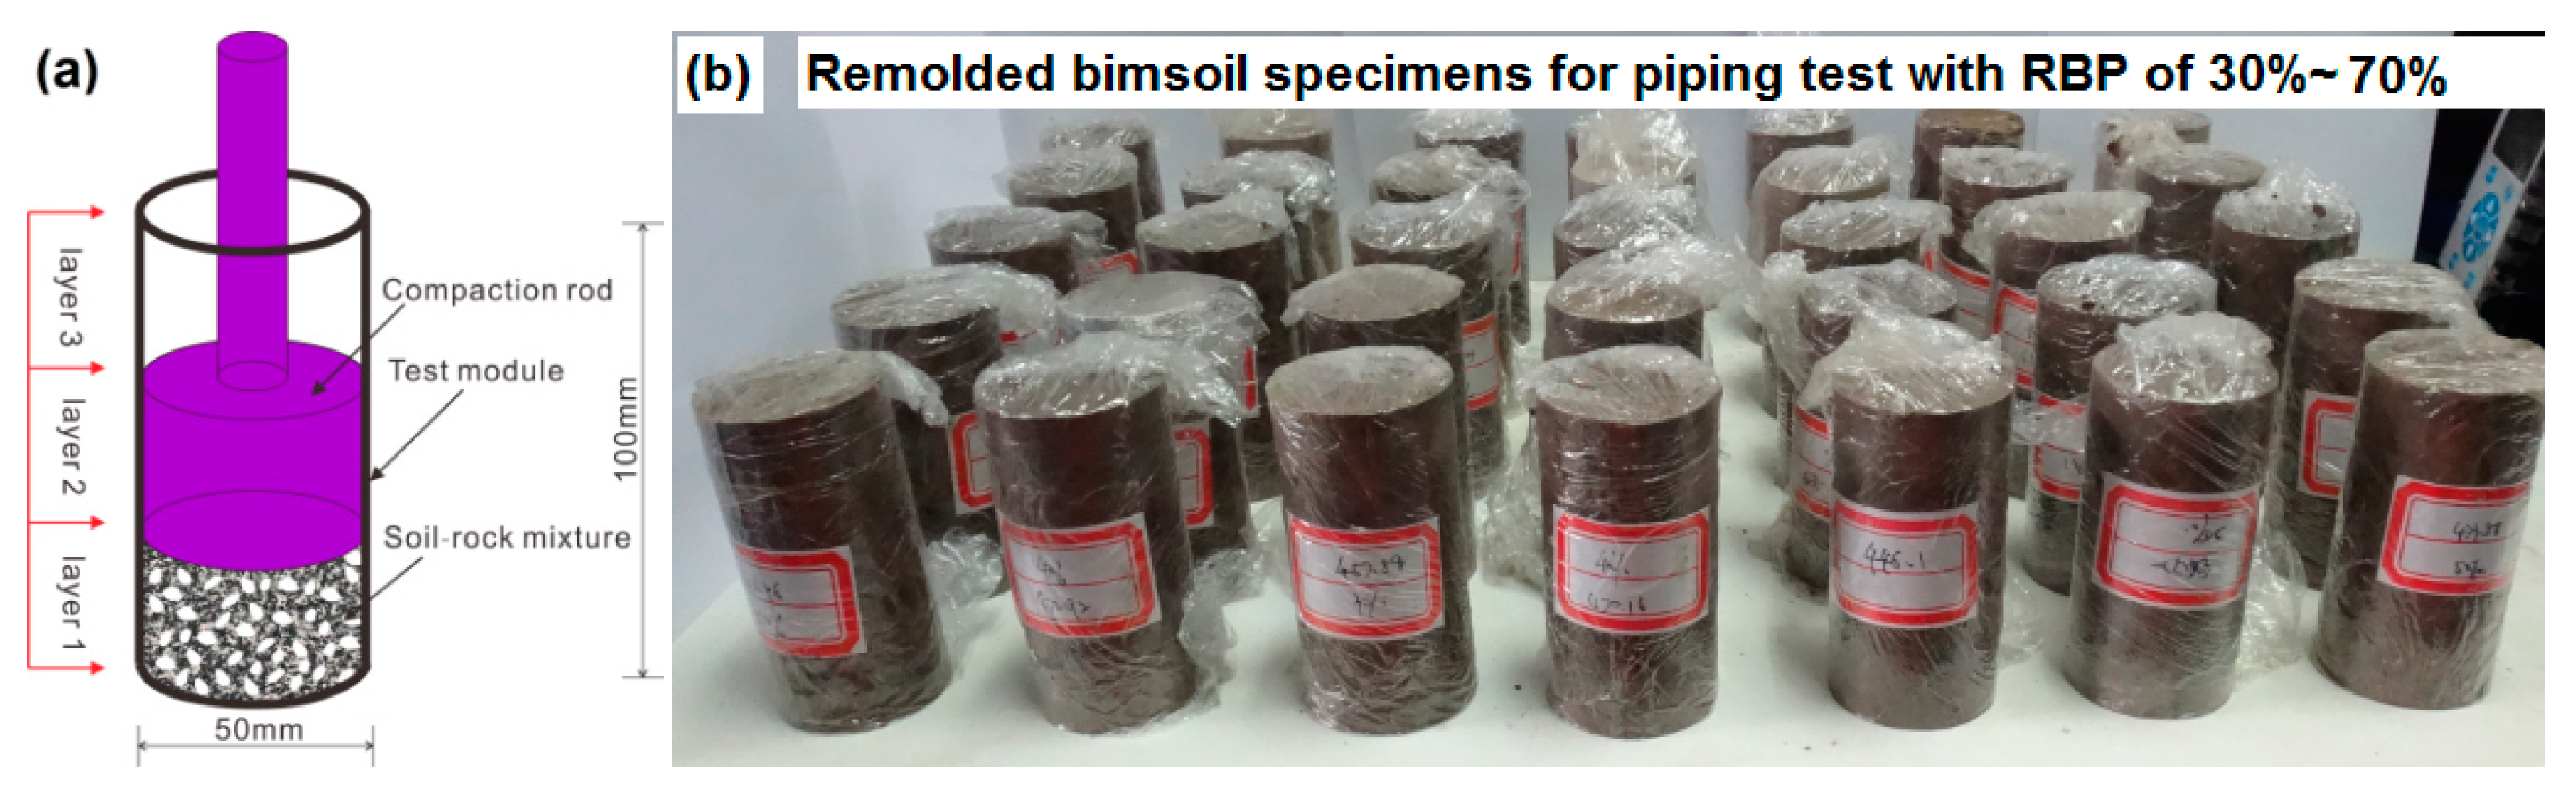
Figure 5.
Schematic diagram of the piping testing system, which is composed of the rigid sample holder, the servo pressurized water-supply system, and the sample chamber system. The servo pressurized water-supply system is the core part of the system. Components were previously described in detail by Reference [7].

Figure 6.
Picture of the structure of seepage cushion and sample chamber: (a) the lower cushion; (b) the upper cushion; and (c) sample chamber for bimsoil sample with rock block percentage of 30%.
Figure 6.
Picture of the structure of seepage cushion and sample chamber: (a) the lower cushion; (b) the upper cushion; and (c) sample chamber for bimsoil sample with rock block percentage of 30%.
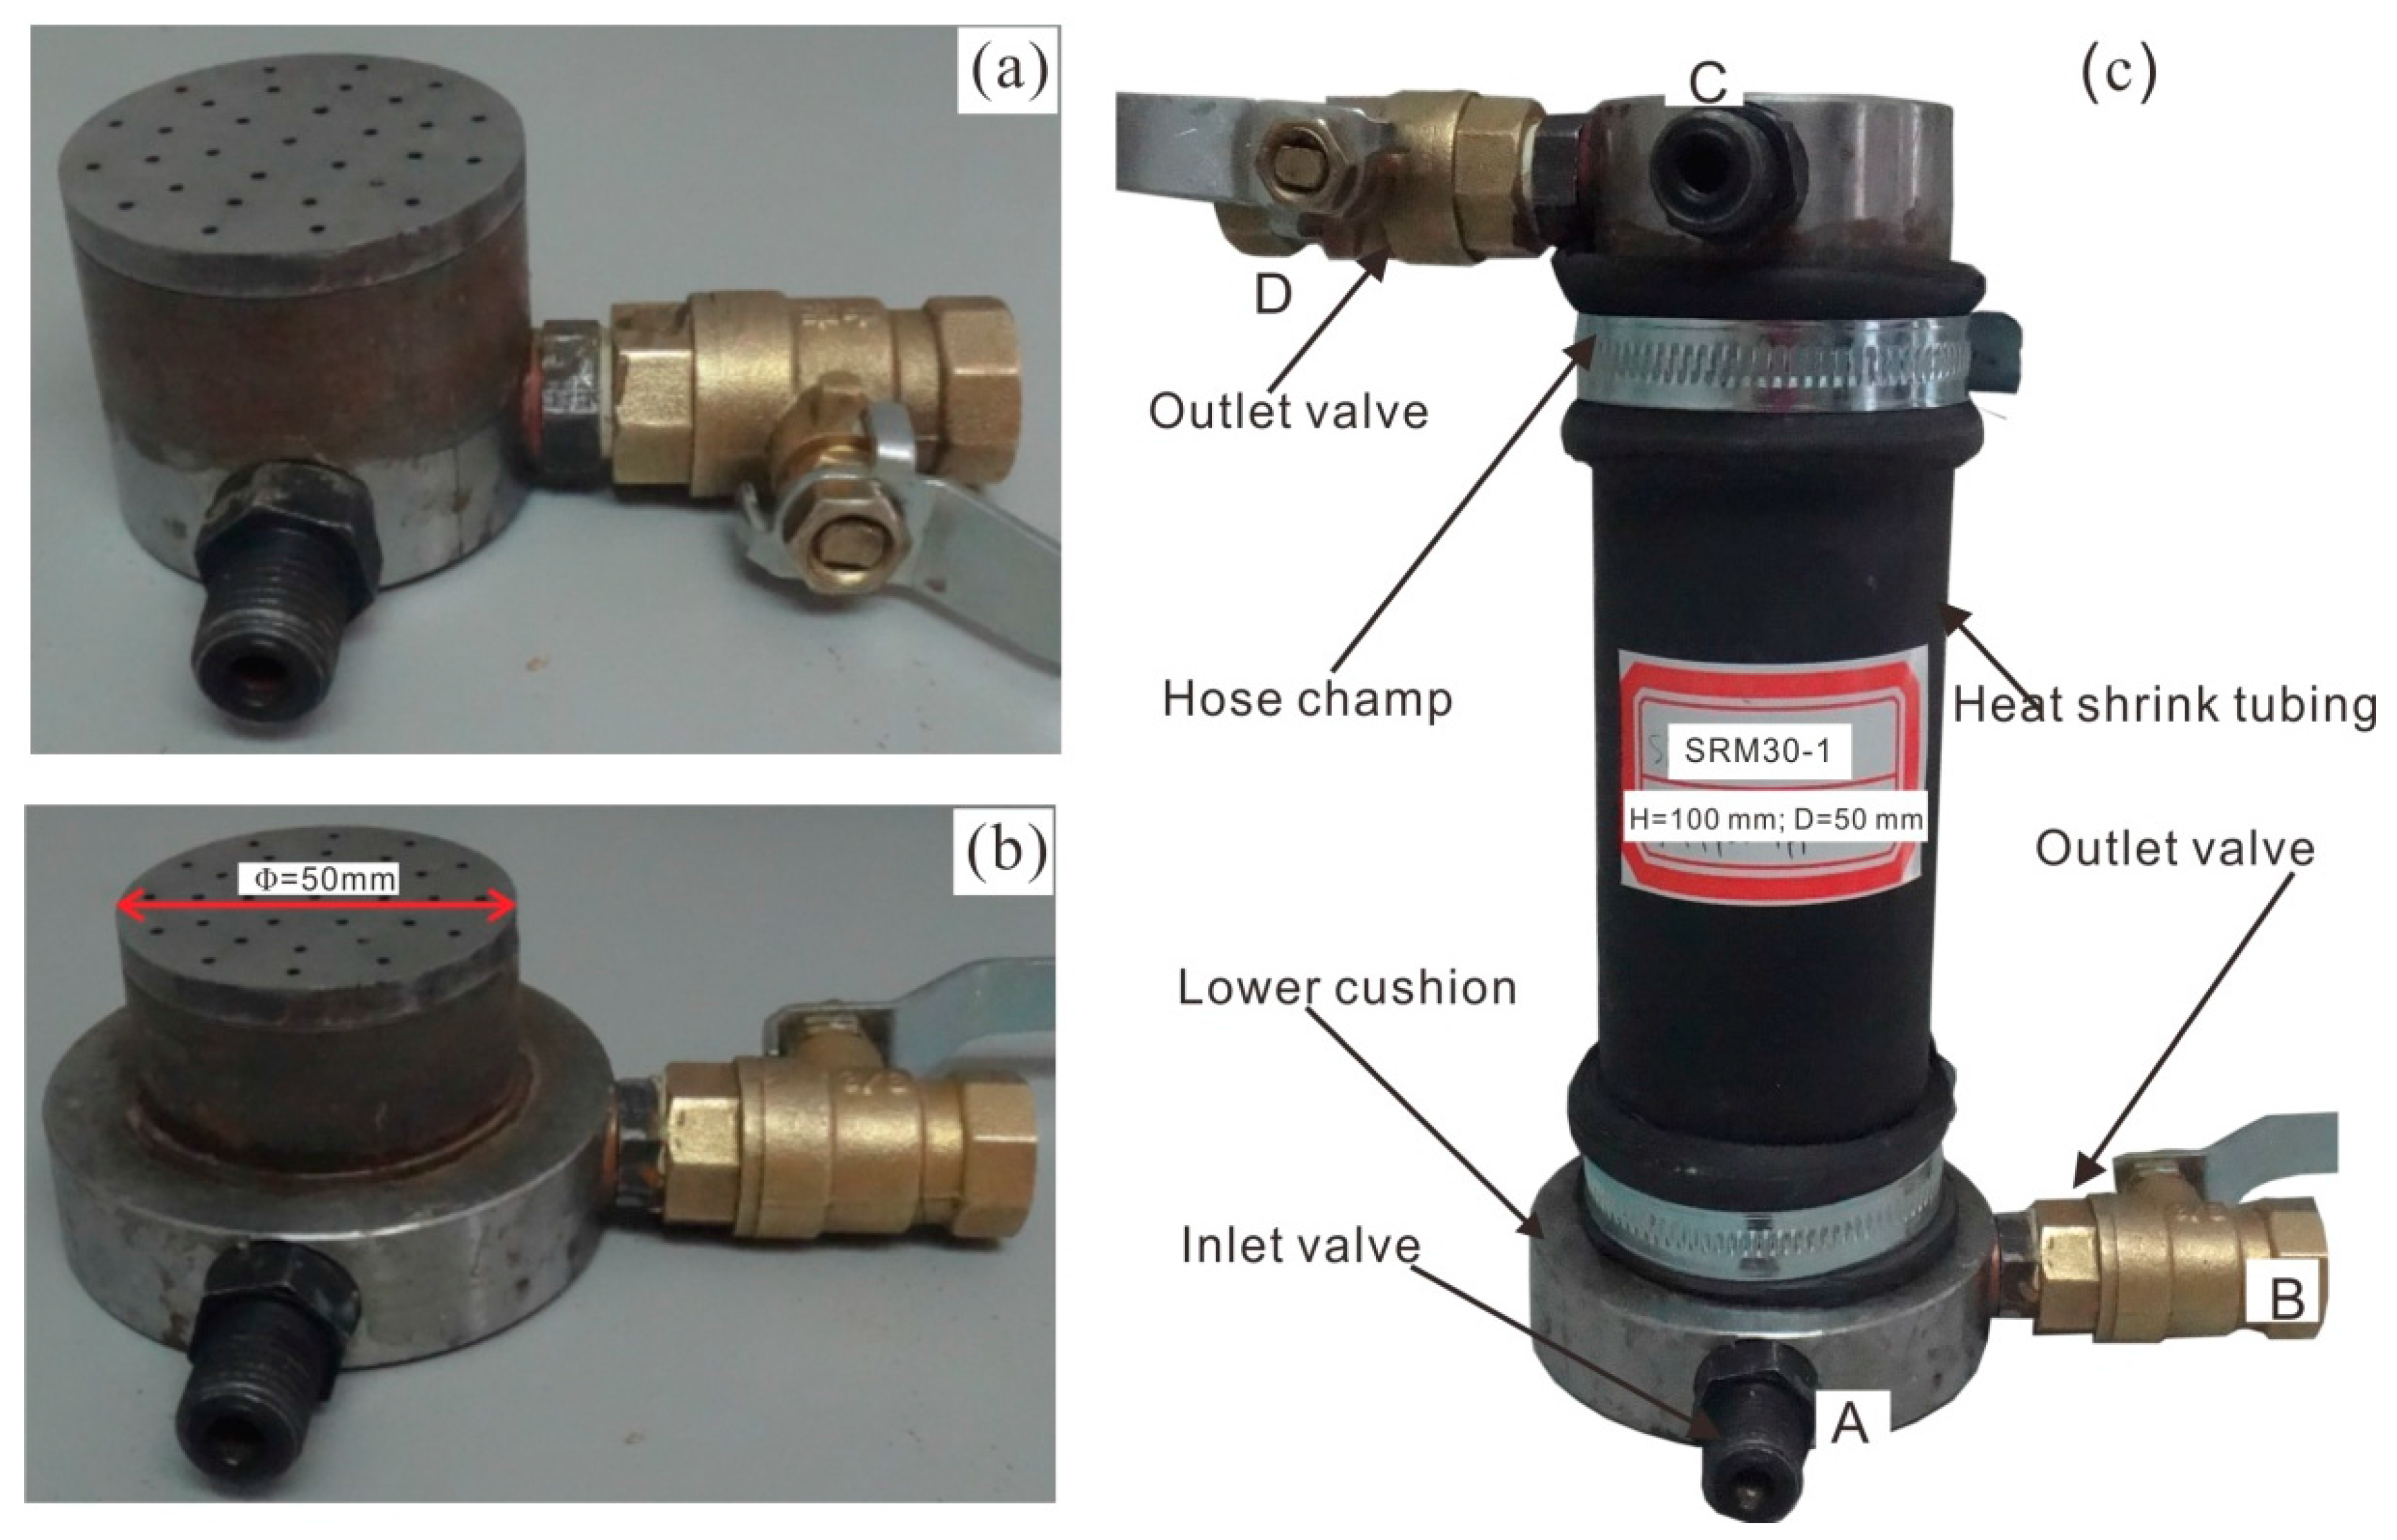
Figure 7.
Photograph of the confining pressure system and the soil particle collector: (a) Hoek cell, where the main components includes air pump, hoek cell, barometer, pneumatic connector, and pneumatic tubel and (b) soil particle collector with mesh size of 0.075 mm.
Figure 7.
Photograph of the confining pressure system and the soil particle collector: (a) Hoek cell, where the main components includes air pump, hoek cell, barometer, pneumatic connector, and pneumatic tubel and (b) soil particle collector with mesh size of 0.075 mm.
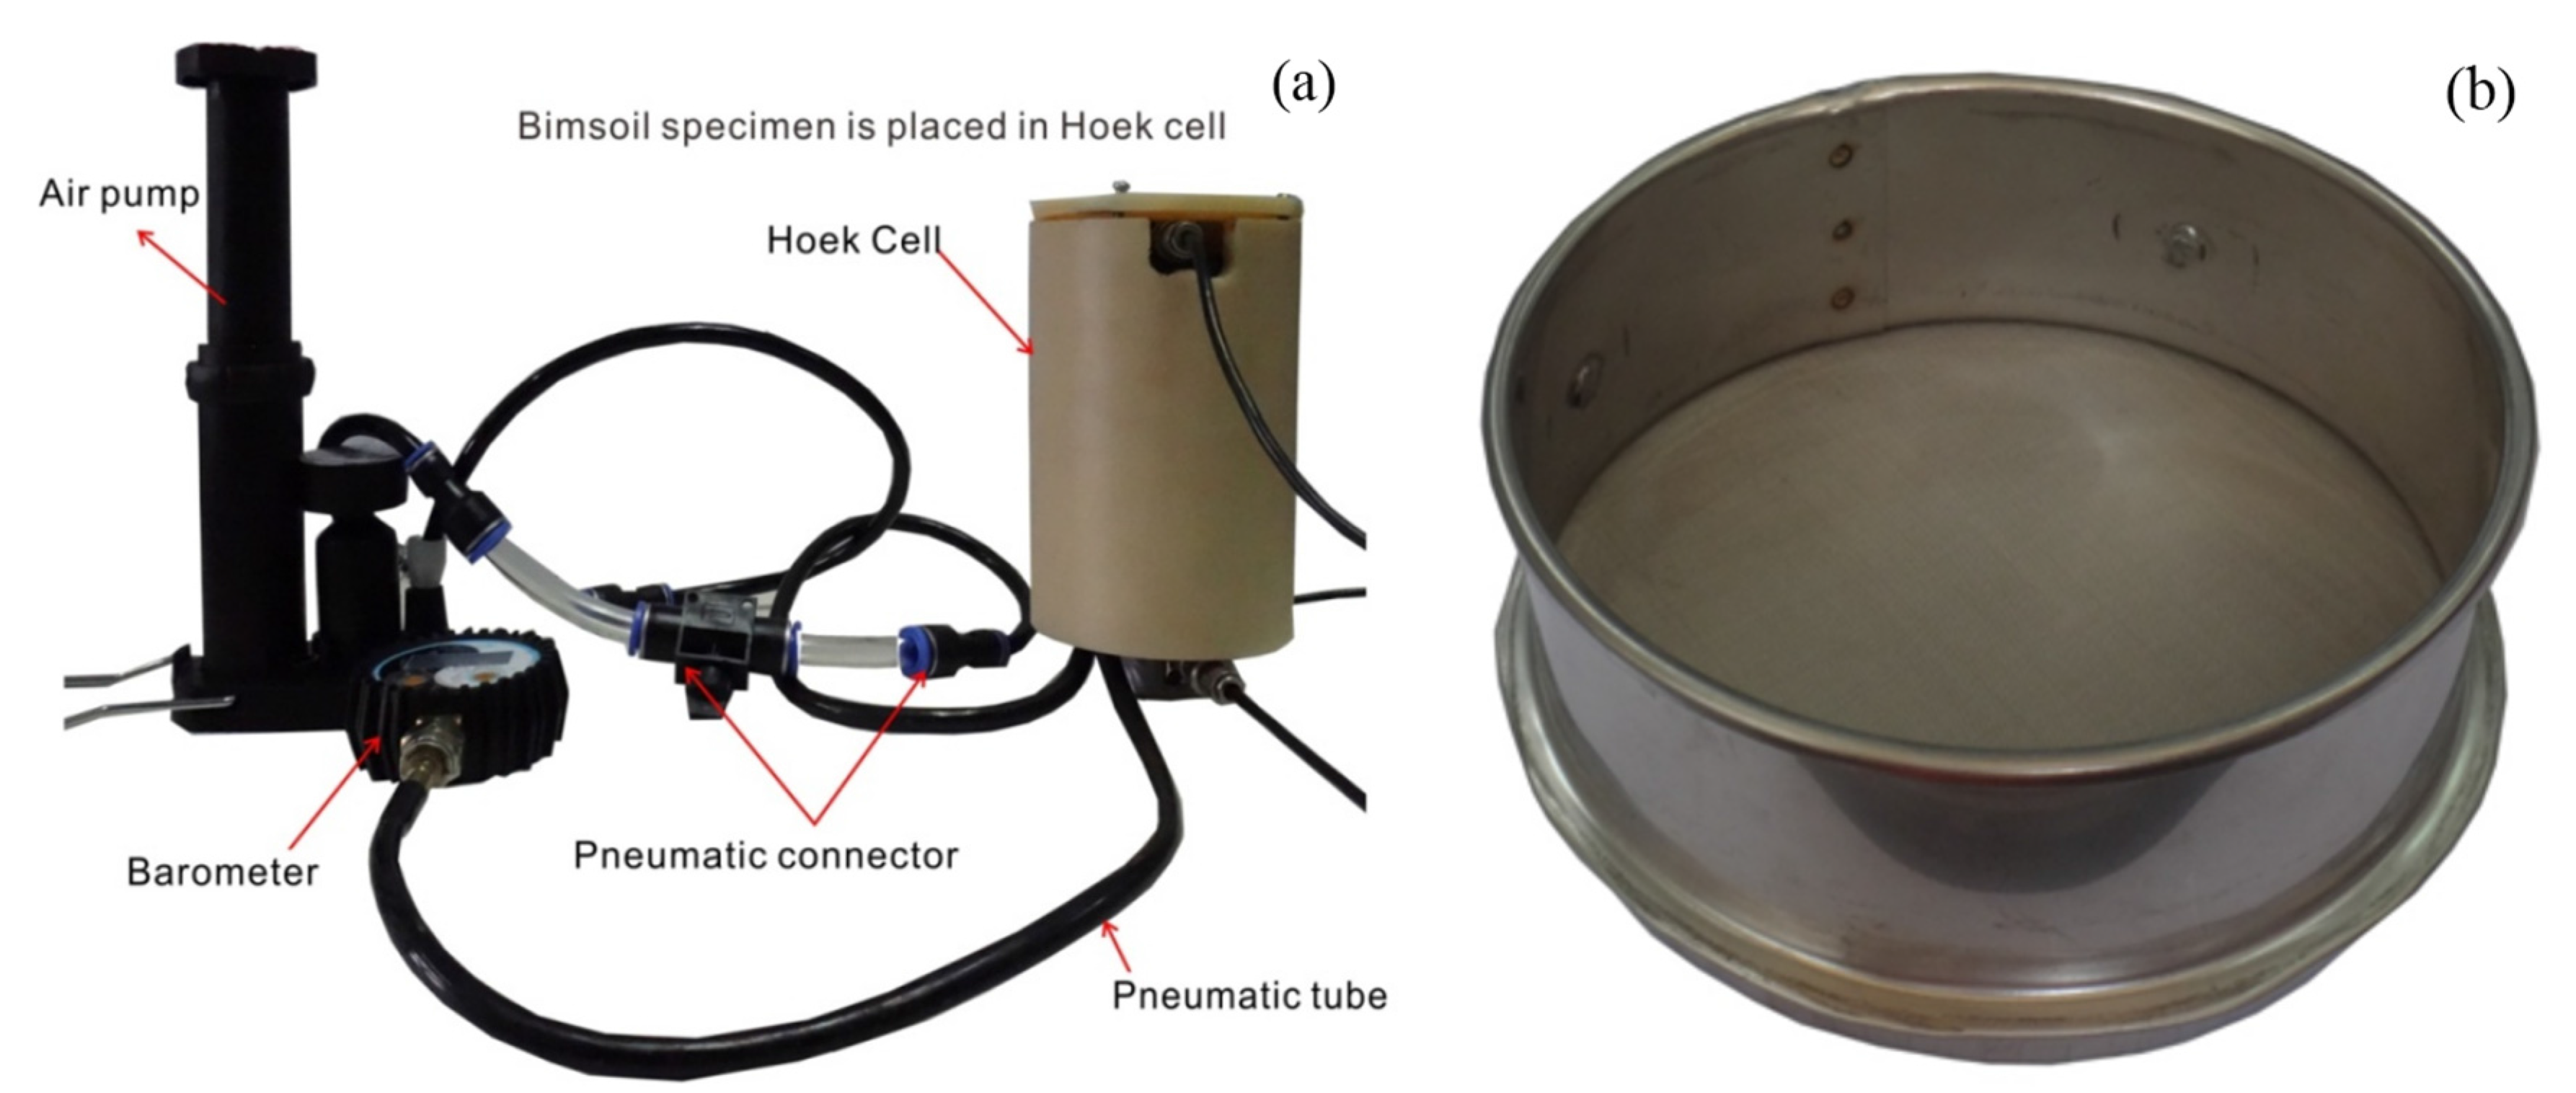
Figure 8.
The flowchart of the piping test for bimsoil samples with various rock block percentages.

Figure 9.
The whole experimental curves recorded during piping test for samples with RBP of 30%, 50% and 70%. The left column plots curves of hydraulic pressure against time; and right column plots of flow water against time.
Figure 9.
The whole experimental curves recorded during piping test for samples with RBP of 30%, 50% and 70%. The left column plots curves of hydraulic pressure against time; and right column plots of flow water against time.
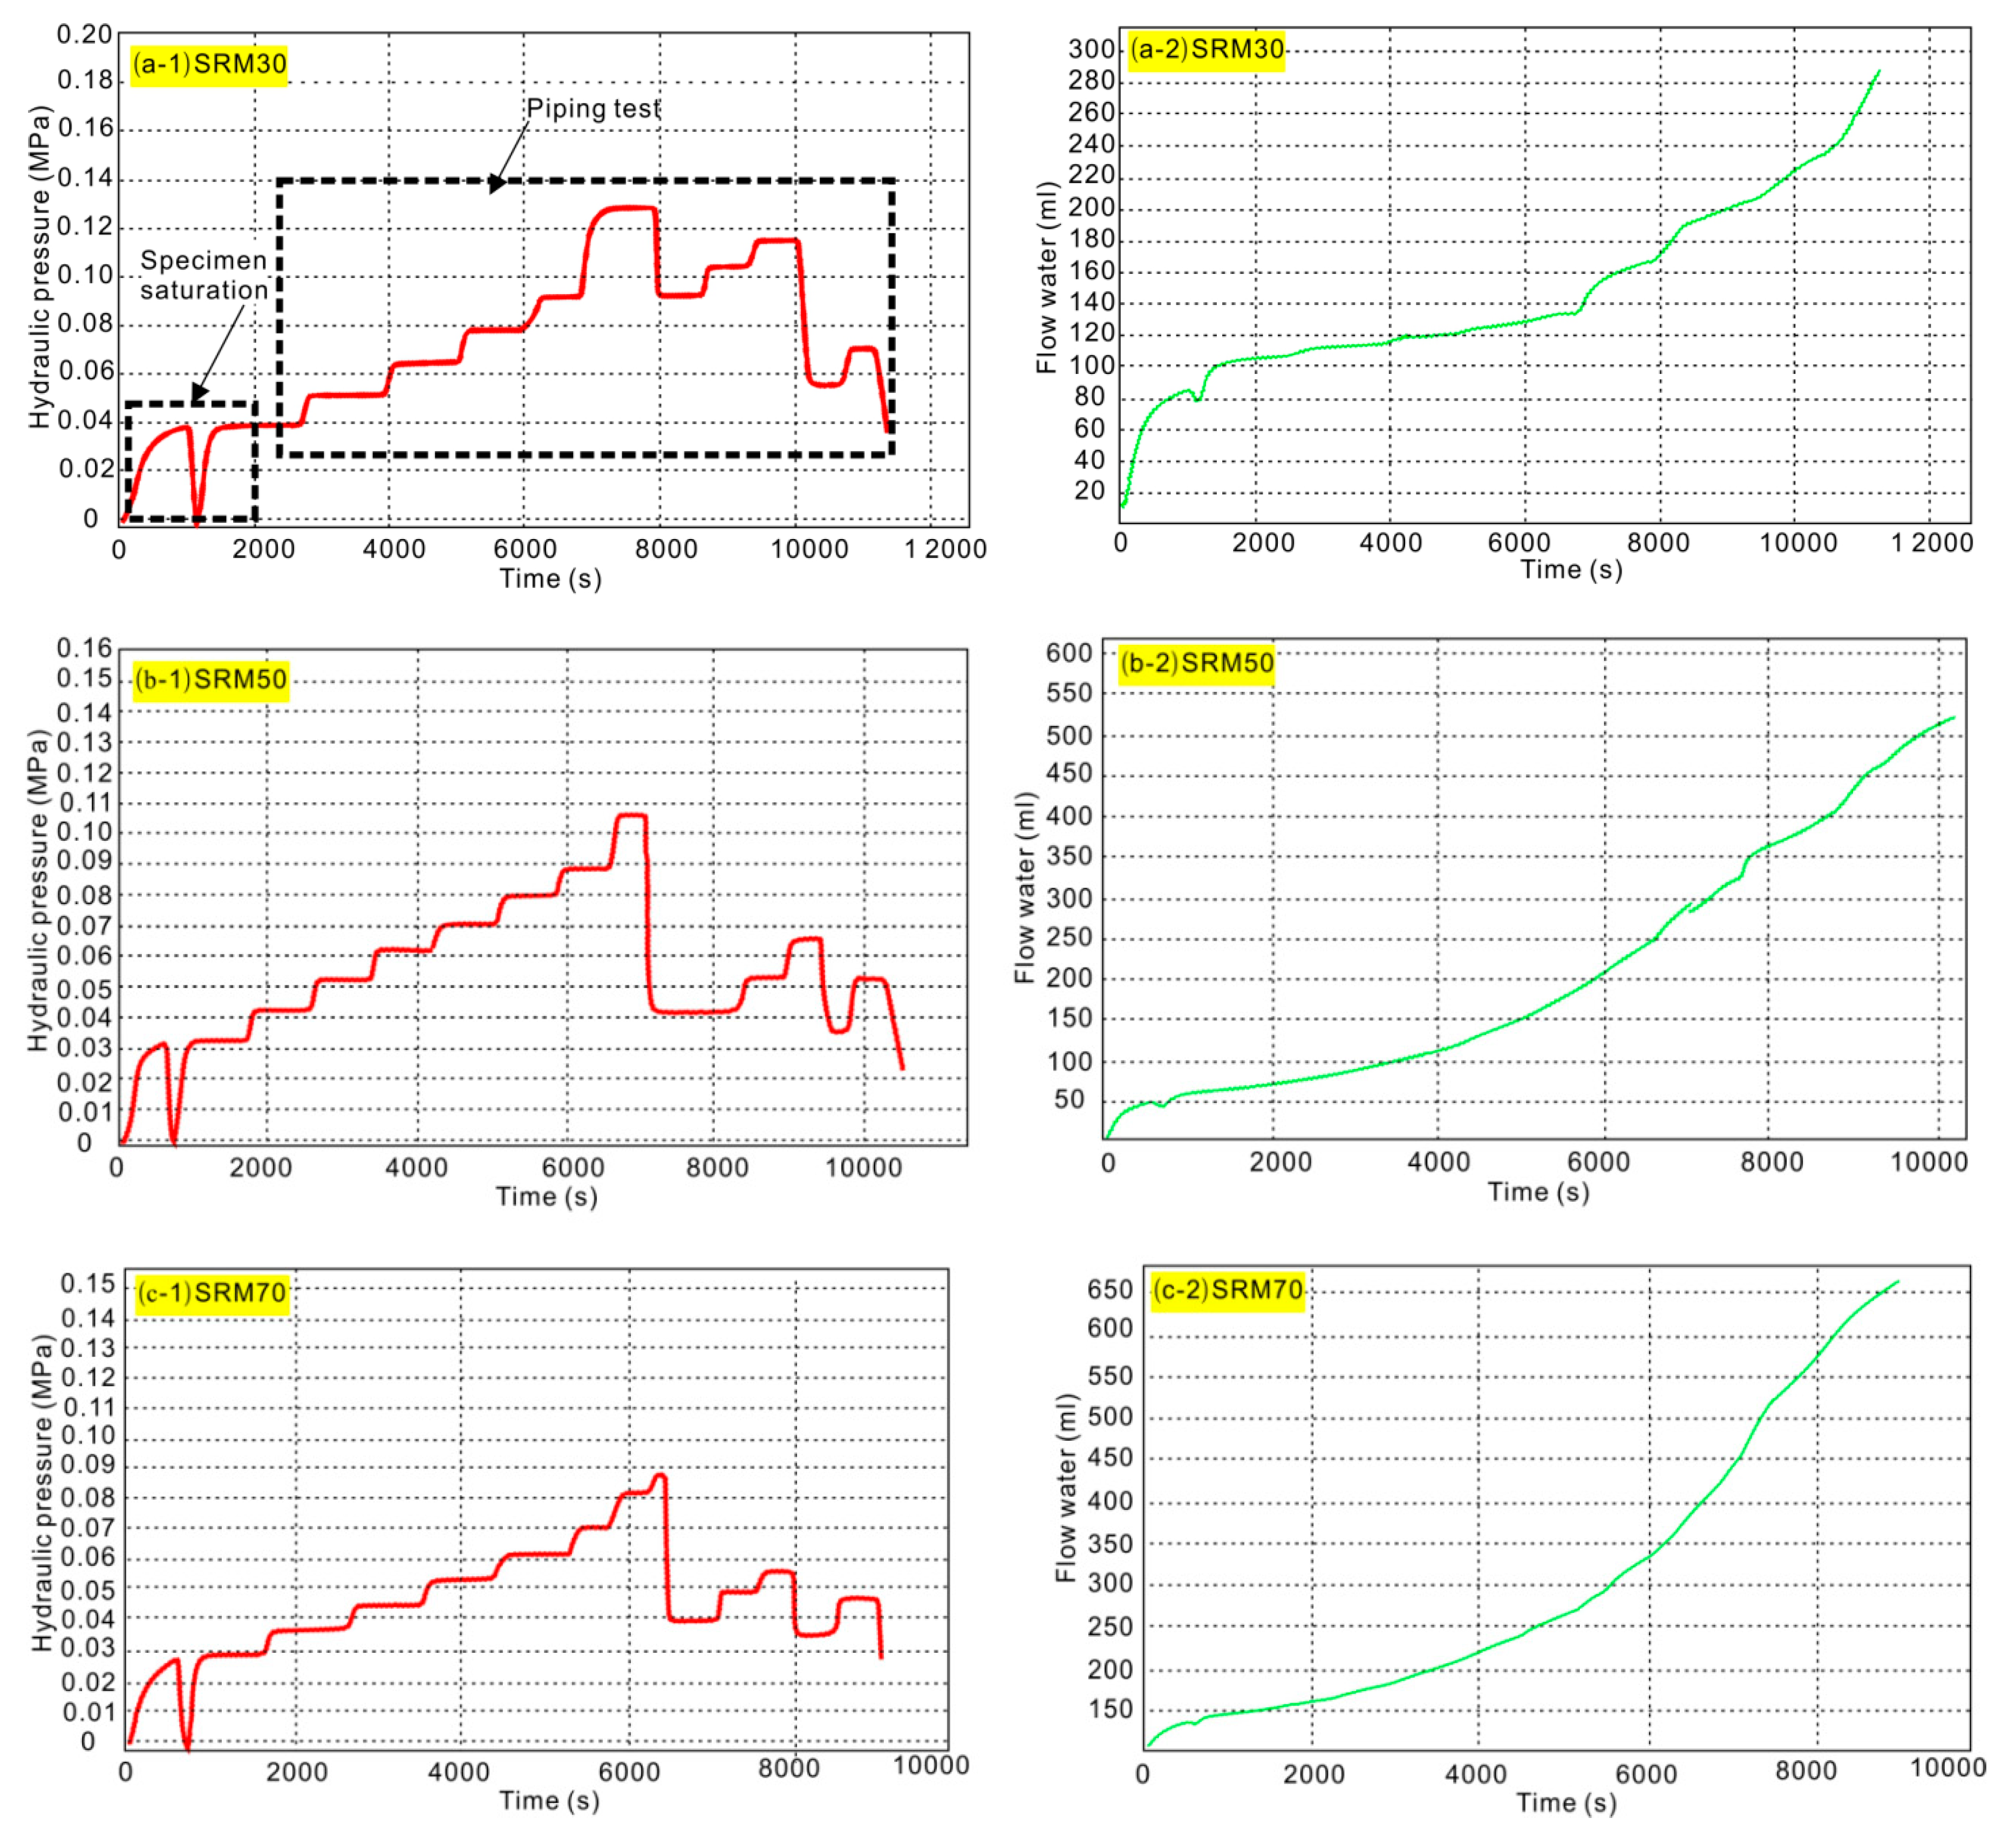
Figure 10.
Plots of hydraulic gradient, seepage velocity, permeability coefficient against initial hydraulic gradient: (a–e) the curves corresponding to RBP of 30–70%, respectively.
Figure 10.
Plots of hydraulic gradient, seepage velocity, permeability coefficient against initial hydraulic gradient: (a–e) the curves corresponding to RBP of 30–70%, respectively.
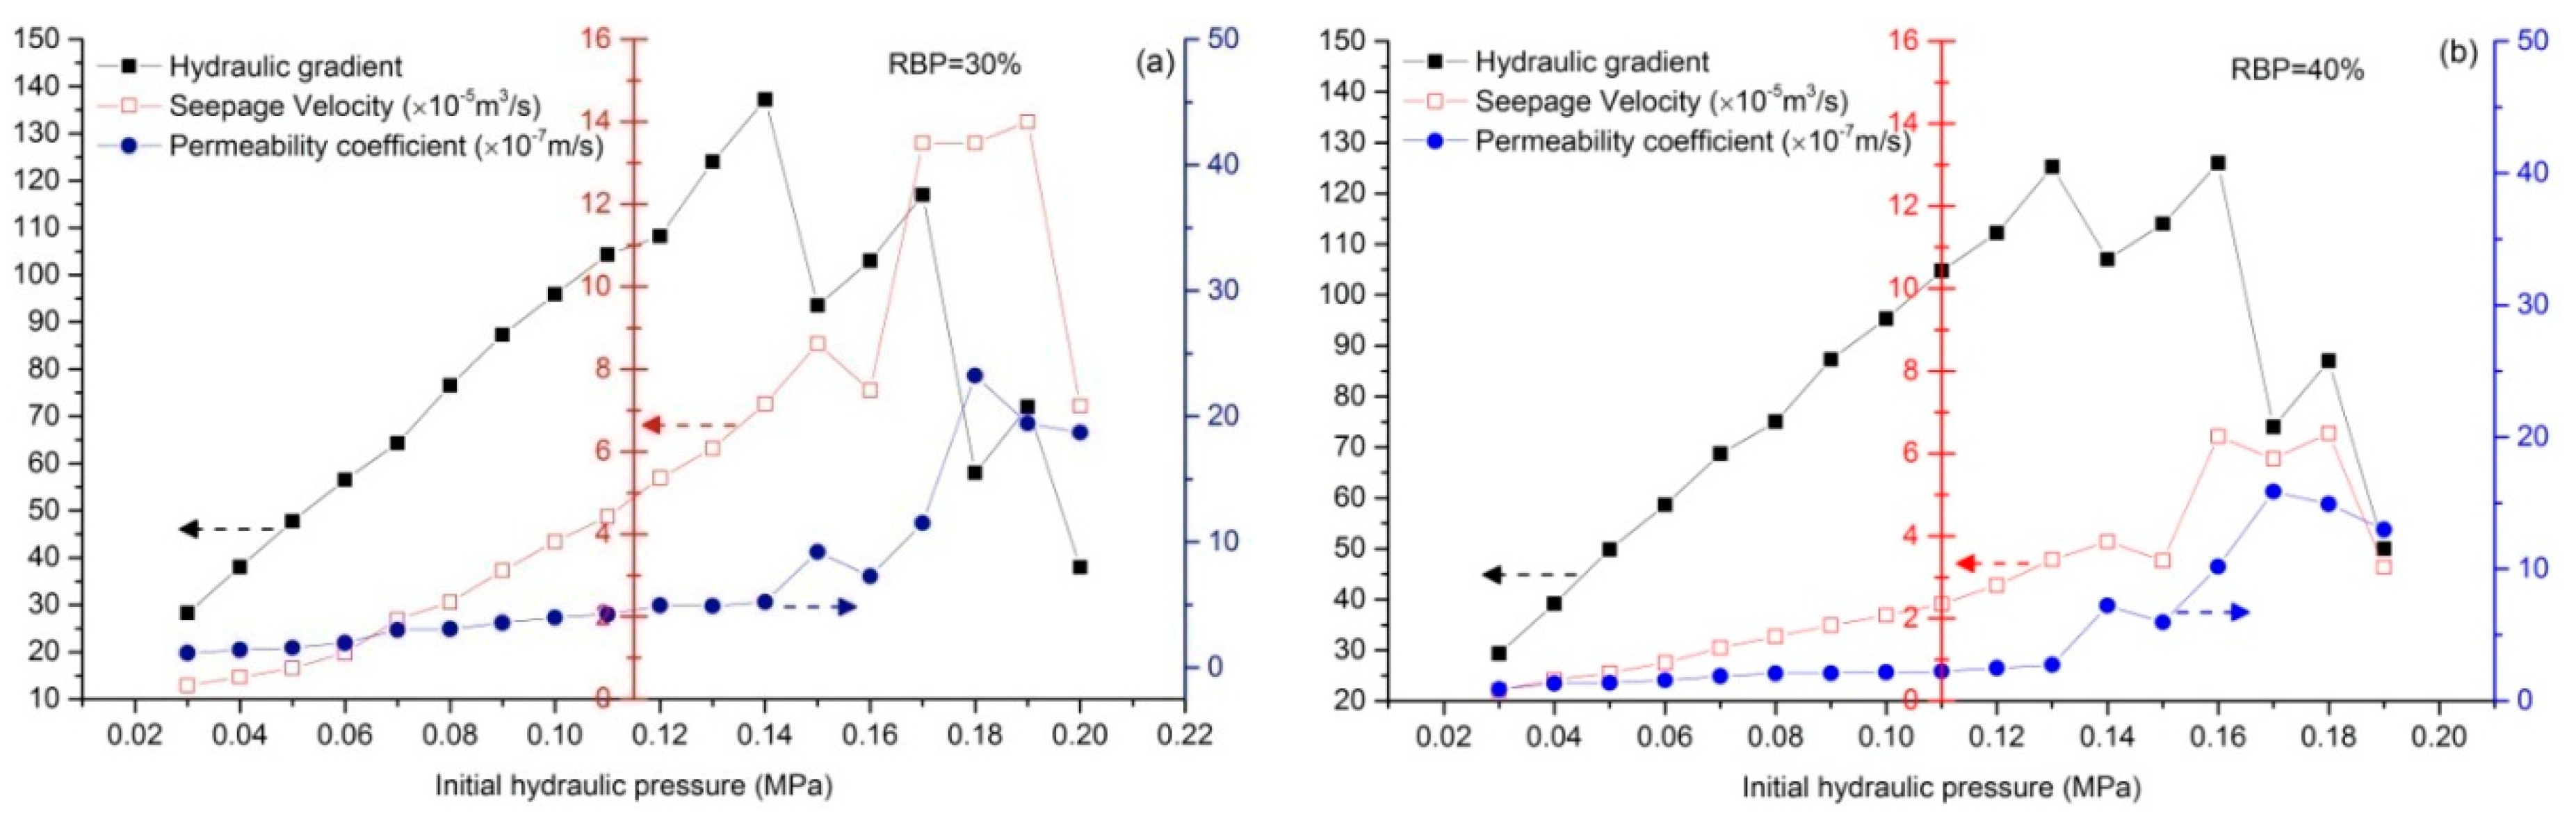
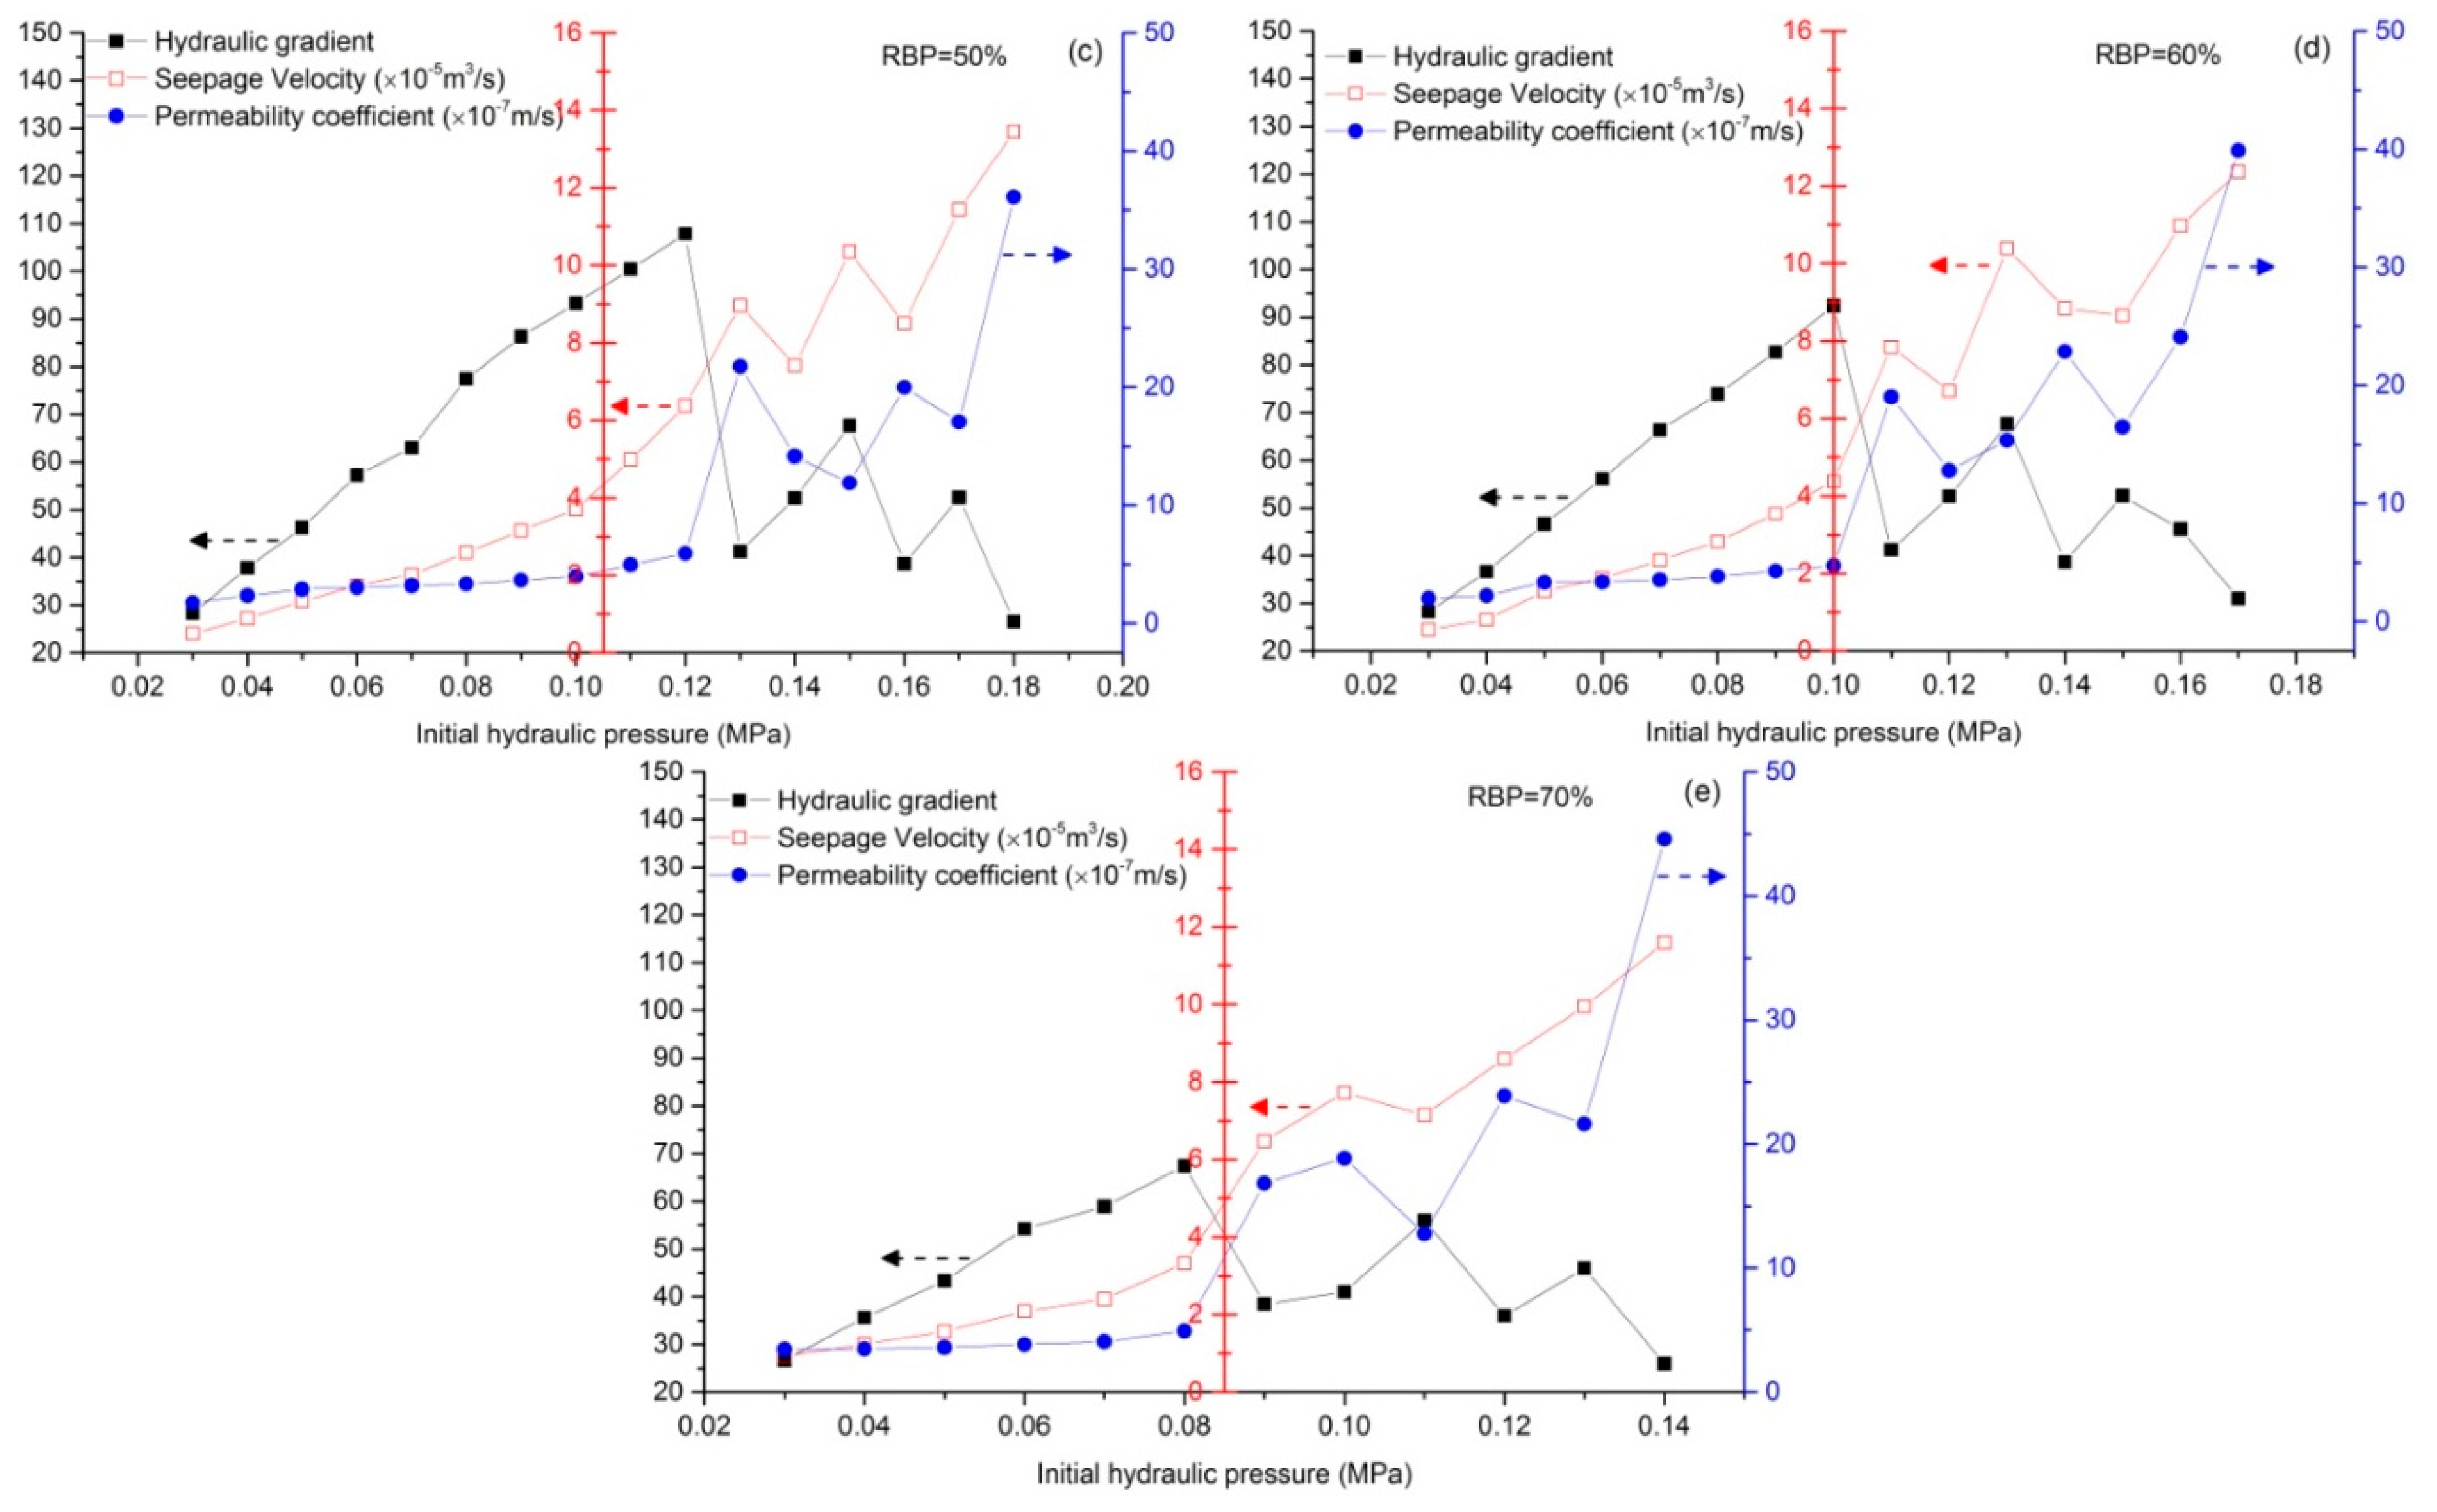
Figure 11.
Plot of the critical hydraulic gradient against rock block percentage for bimsoil samples.
Figure 11.
Plot of the critical hydraulic gradient against rock block percentage for bimsoil samples.
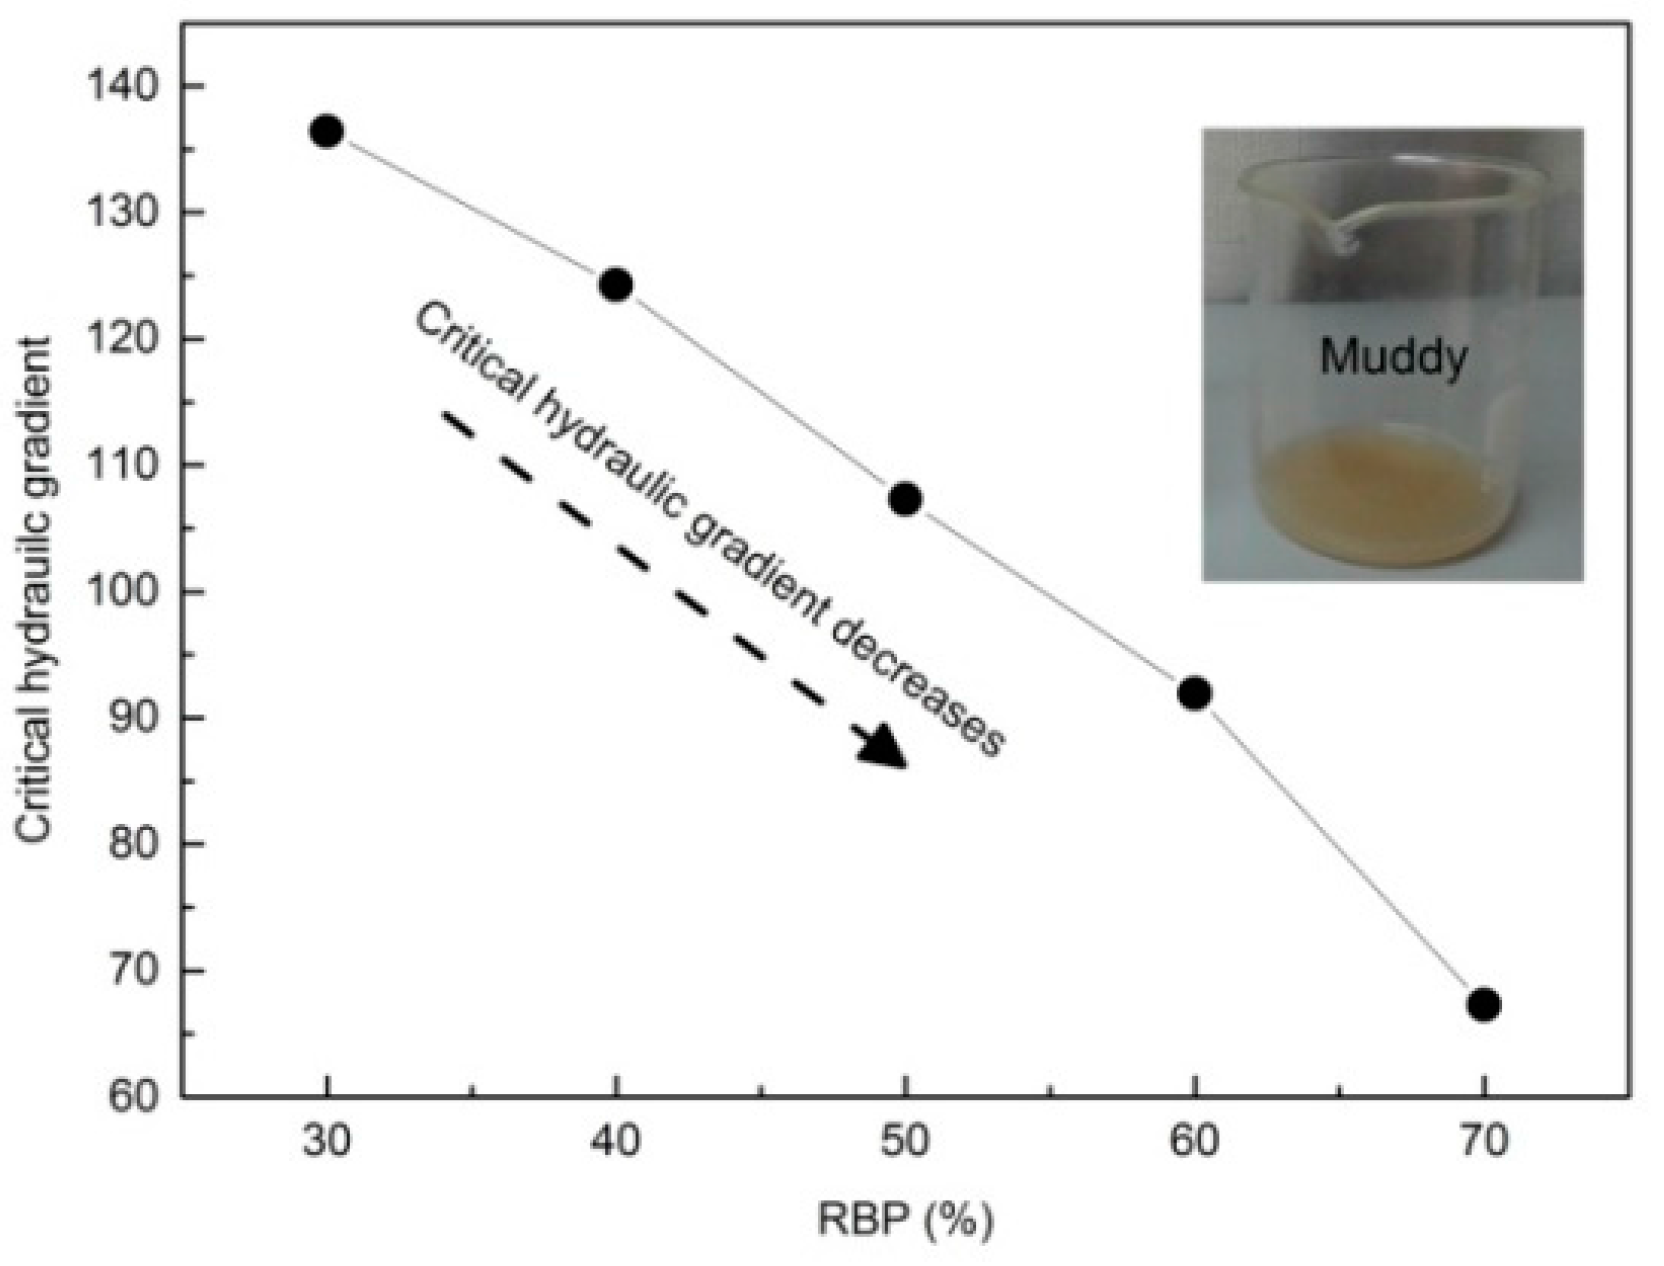
Figure 12.
Variation of seepage force for bimsoil with difference RBP: (a) relationship between seepage force and initial hydraulic gradient; (b) plot of critical seepage force against RBP; and (c) plot of critical hydraulic gradient against rock block percentage.
Figure 12.
Variation of seepage force for bimsoil with difference RBP: (a) relationship between seepage force and initial hydraulic gradient; (b) plot of critical seepage force against RBP; and (c) plot of critical hydraulic gradient against rock block percentage.

Figure 13.
Plot of relationship between cumulative eroded soil and initial hydraulic pressure.
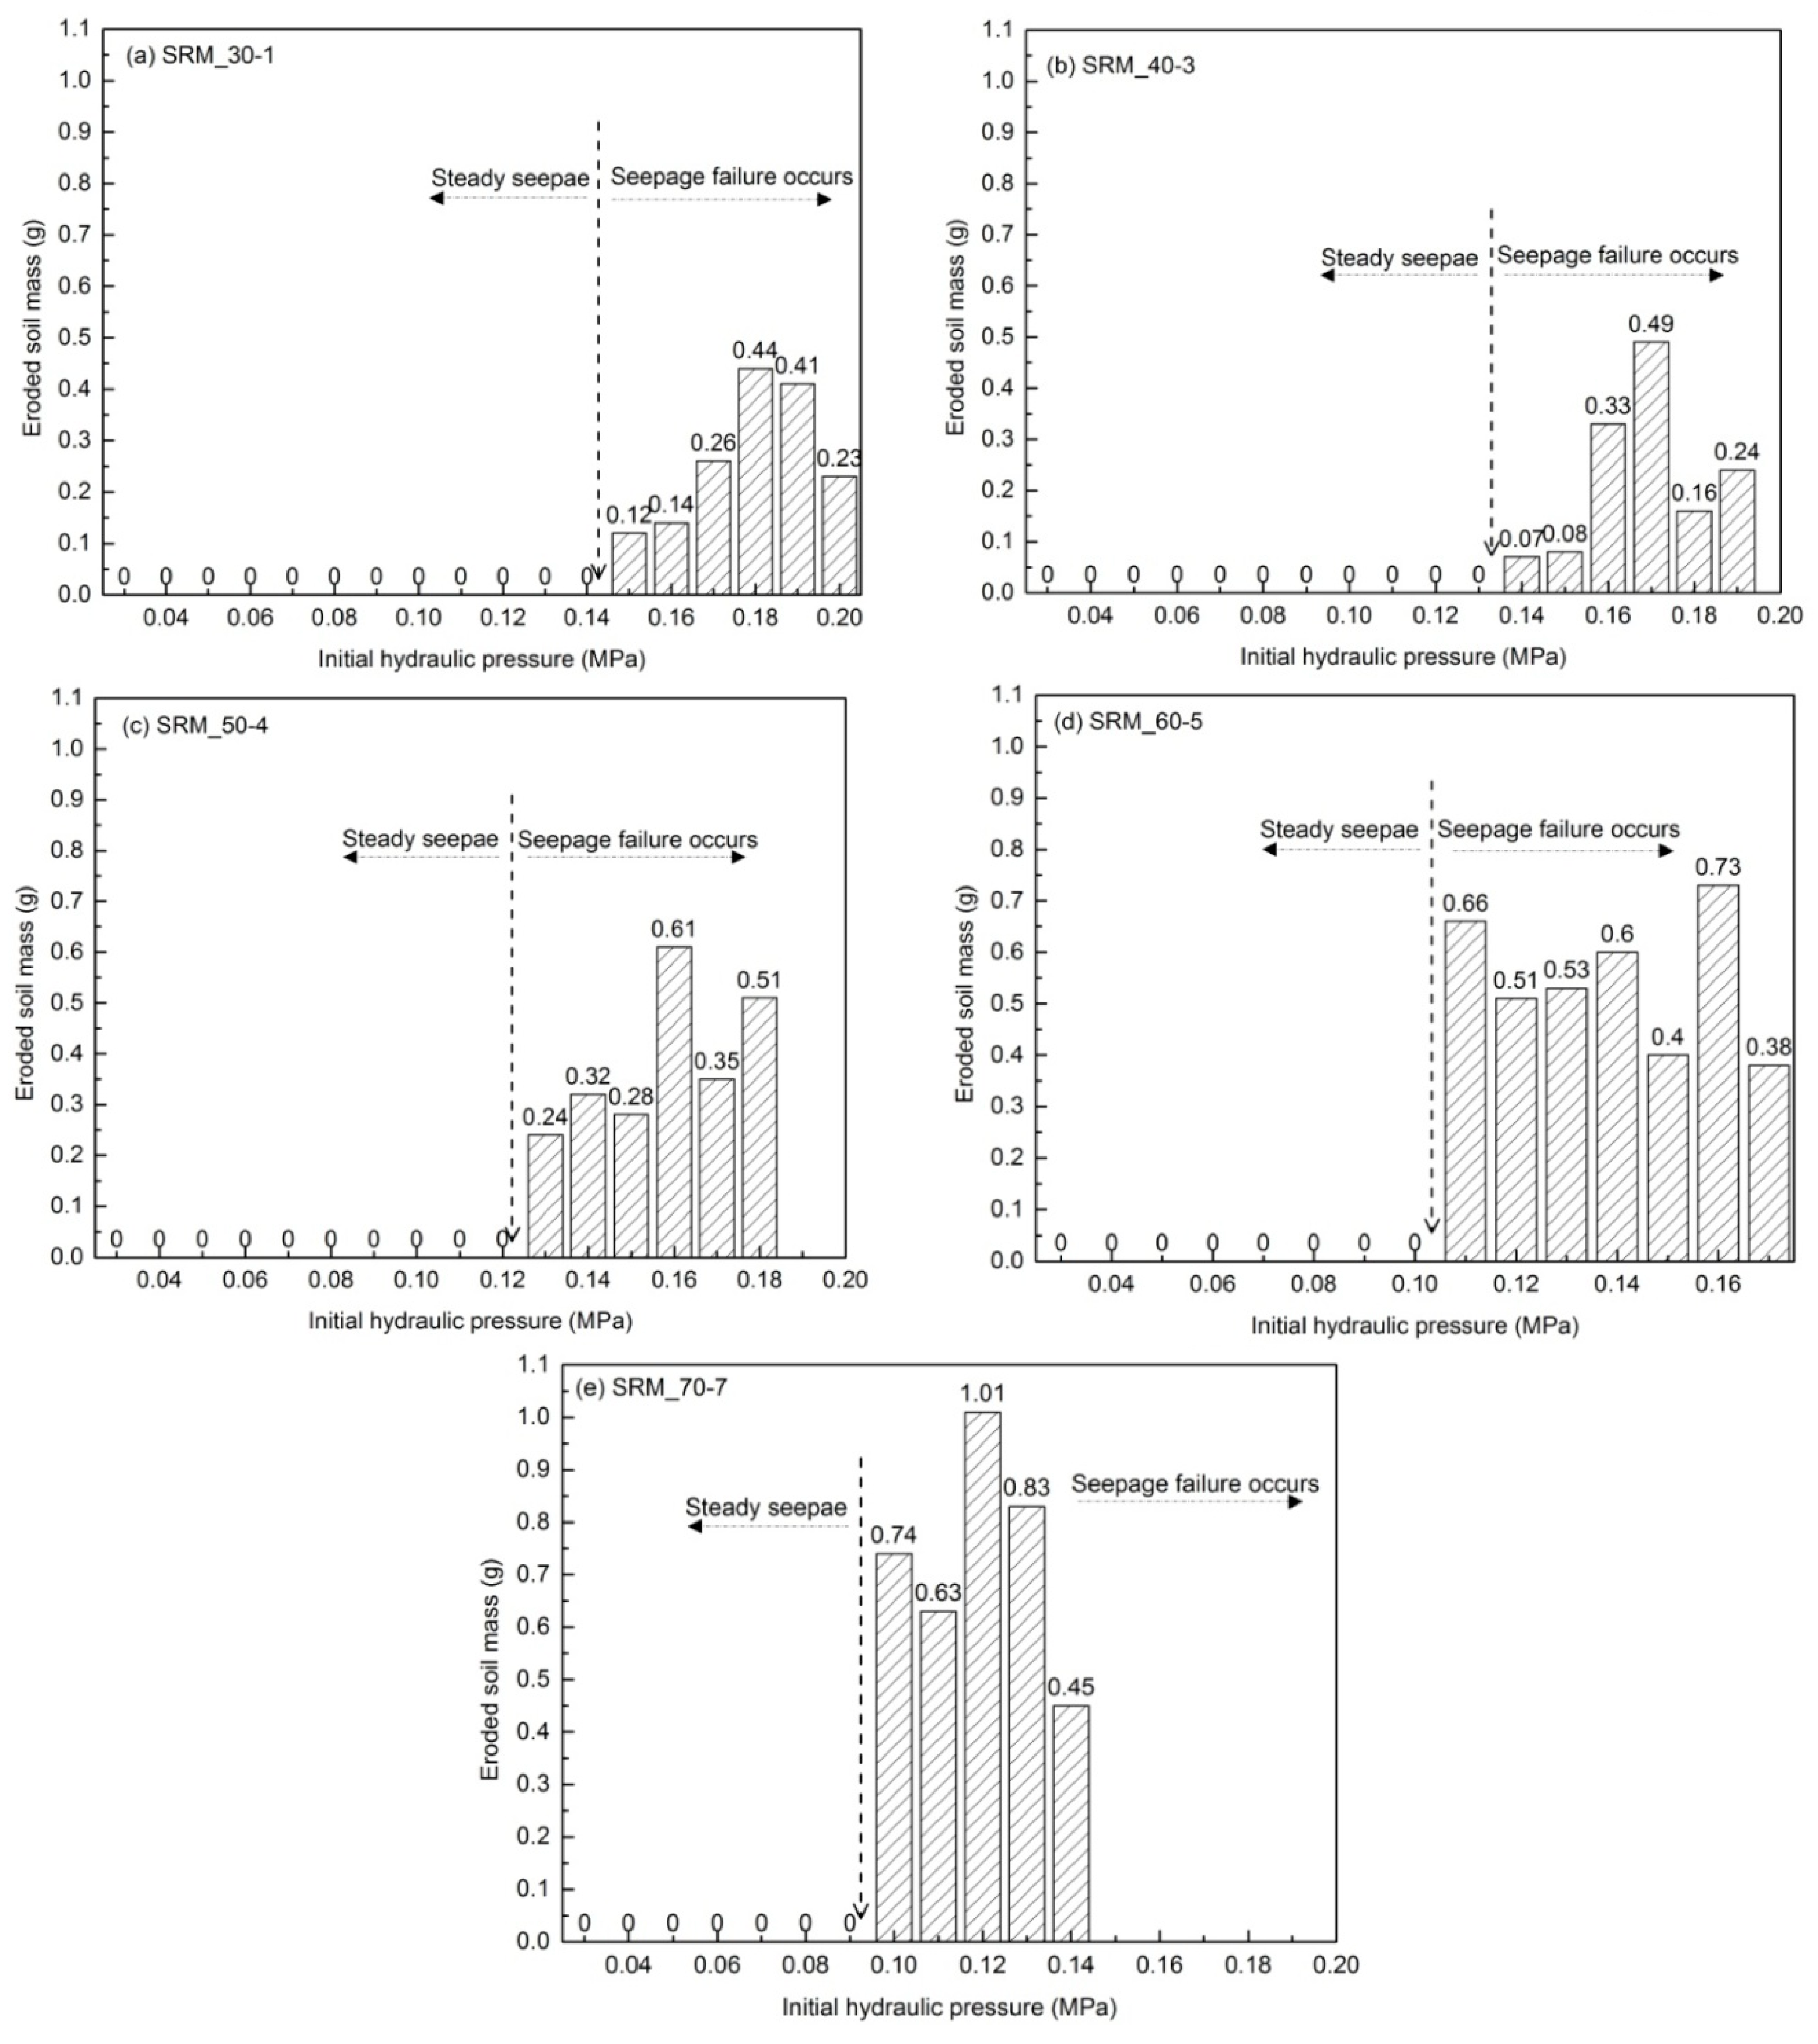
Figure 14.
Relationship between the maximum eroded soil mass and rock block percentage.
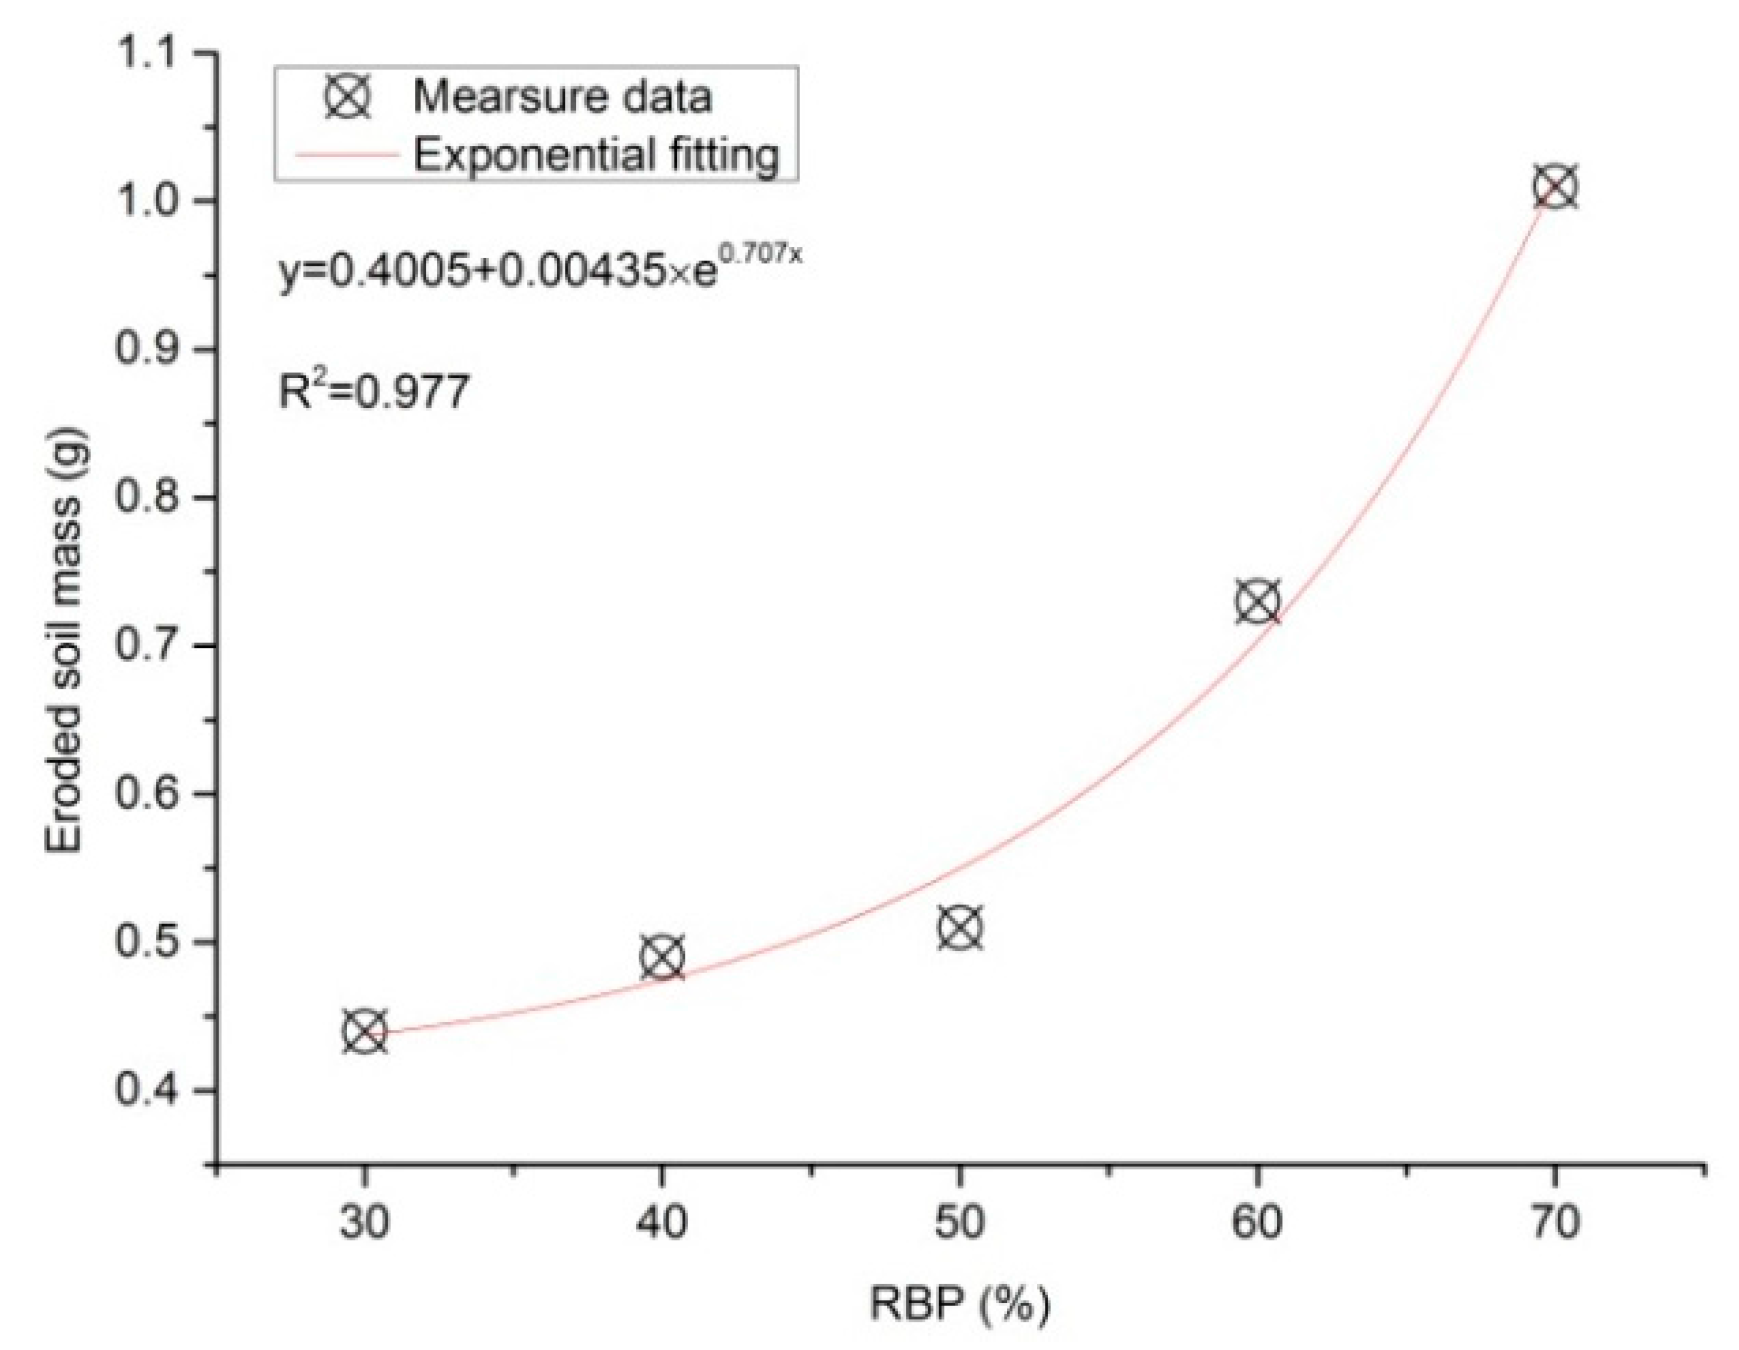
Figure 15.
Relationship between critical hydraulic gradient and confining pressure for samples with RBP of 30–70%.
Figure 15.
Relationship between critical hydraulic gradient and confining pressure for samples with RBP of 30–70%.
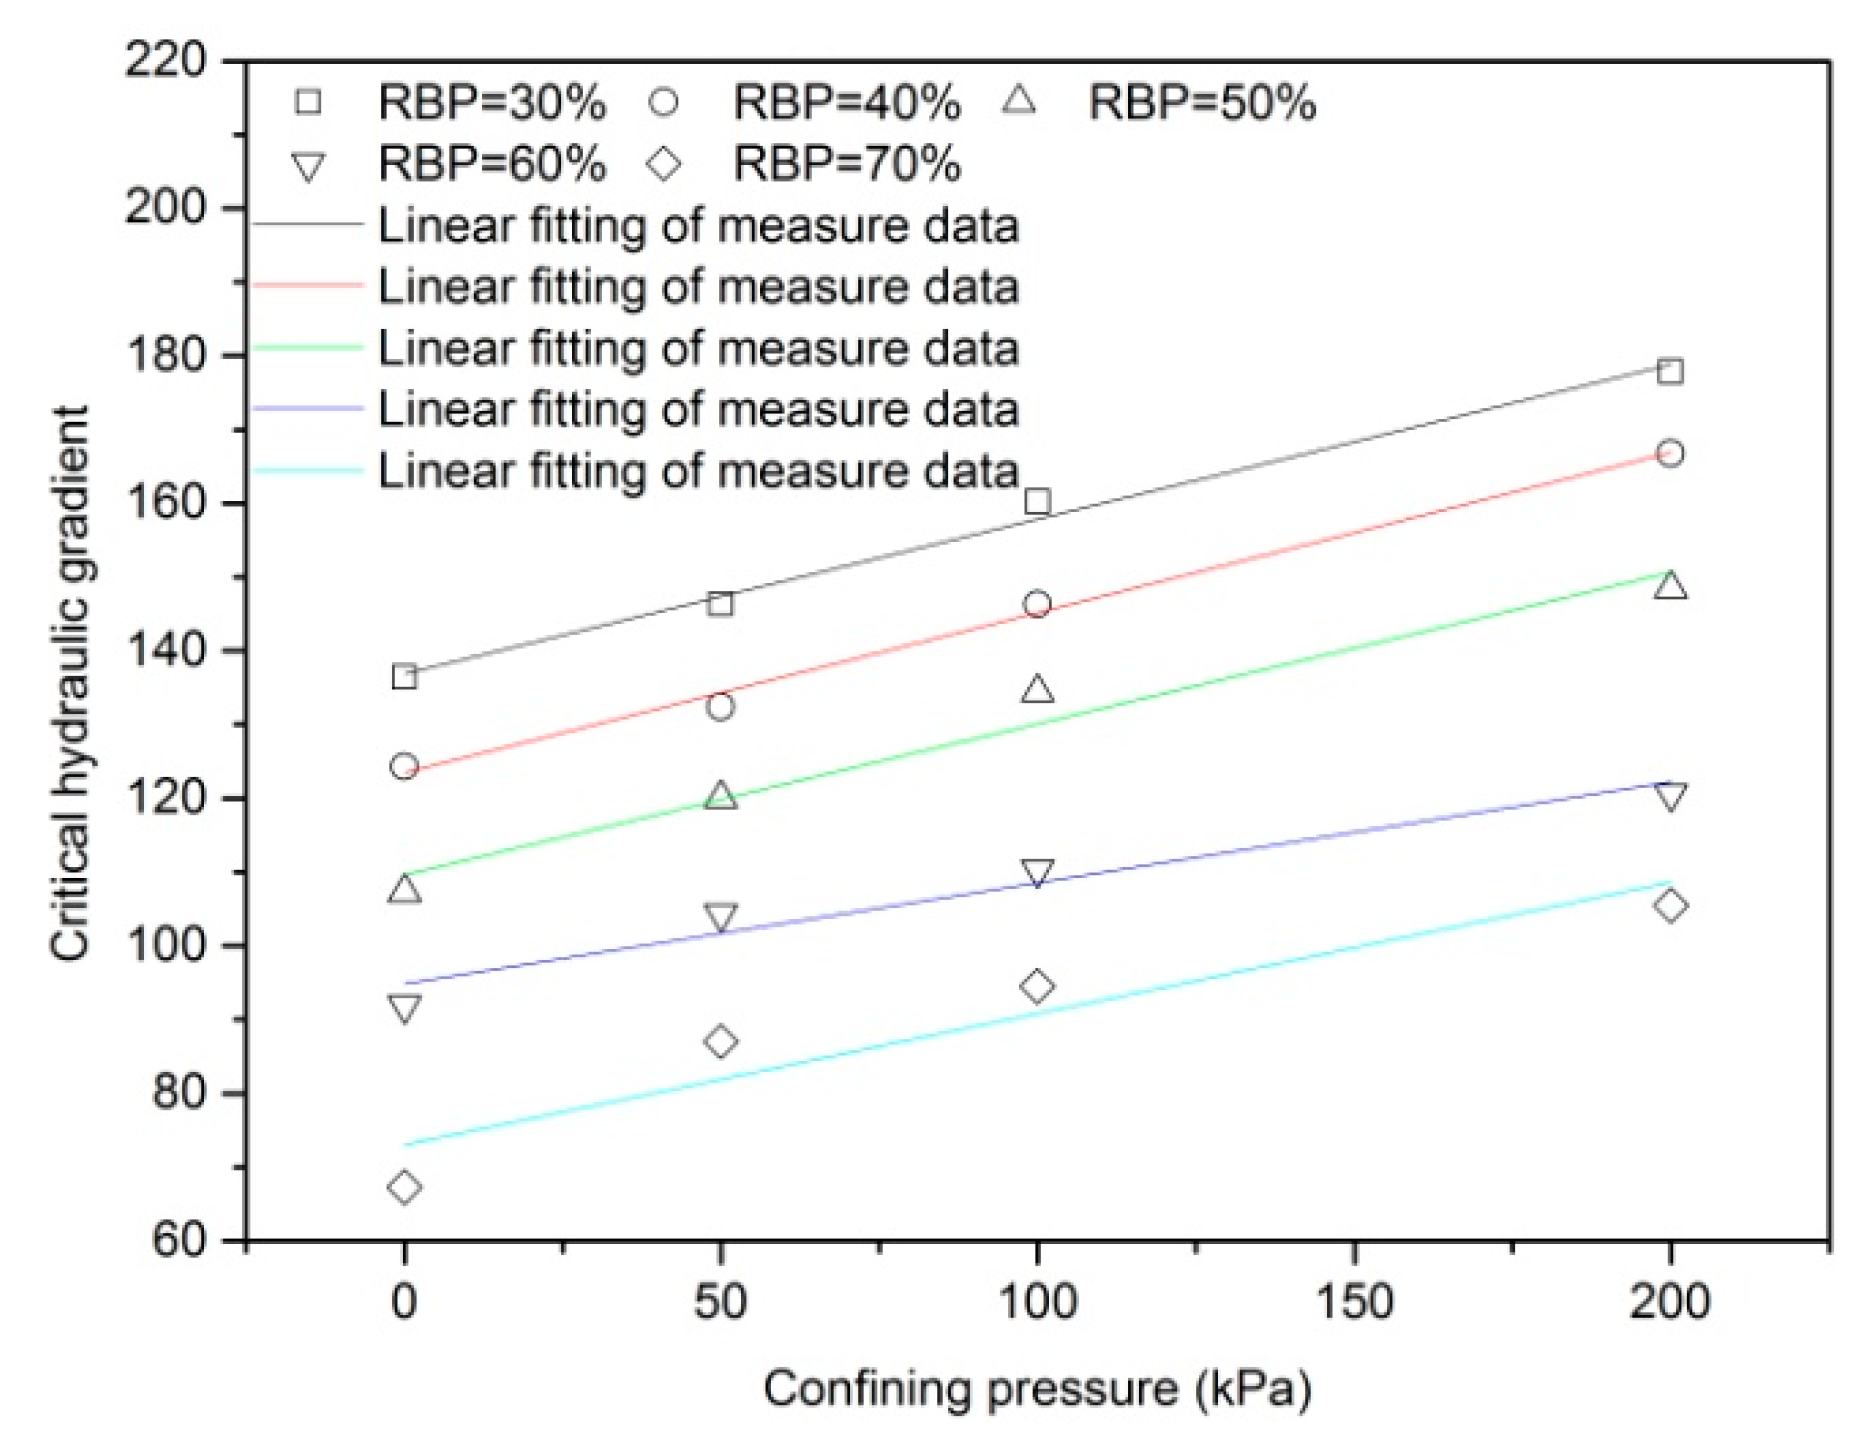
Figure 16.
Plot of critical hydraulic gradient against rock block percentage under various confining pressure.
Figure 16.
Plot of critical hydraulic gradient against rock block percentage under various confining pressure.

Table 1.
Physical and mechanical properties of the used soil matrix and rock blocks for bimsoil samples.
Table 1.
Physical and mechanical properties of the used soil matrix and rock blocks for bimsoil samples.
| Index | Soil Matrix | Rock Block |
|---|---|---|
| Bulk density (g/cm3) | 1.64 | 2.53 |
| Dry weight density (g/cm3) | 2.06 | / |
| Optimum water content (%) | 10.2 | / |
| Specific gravity (GS) | 2.73 | / |
| Effective particle size, D10 (mm) | 0.01 | / |
| Coefficient of uniformity, Cu | 4.2 | / |
| Coefficient of curvature, Cc | 1.32 | / |
| Liquid limit (%) | 64 | / |
| Plastic limit (%) | 36 | / |
| Plasticity index | 28 | / |
| Liquidity index | 0.121 | / |
| Wet UCS (MPa) | 0.57 | 43.21 |
| Dry UCS (MPa) | 2.27 | 80.75 |
Table 2.
Mineralogical composition of soil matrix in bimsoil matrix by XRD test.
| Mineral | Soil Sample #1 | Soil Sample #2 |
|---|---|---|
| Montmorillonite | 61.27 | 60.31 |
| Kaolinite | 26.34 | 24.07 |
| Illite | 6.43 | 6.55 |
| chlorite | 5.96 | 3.31 |
Table 3.
The fitting result of critical hydraulic gradient and confining pressure with linear equation for the typical samples.
Table 3.
The fitting result of critical hydraulic gradient and confining pressure with linear equation for the typical samples.
| Confining Pressure (kPa) | Coefficient | Correlation Coefficient (r) | |
|---|---|---|---|
| a | b | ||
| 0 | −1.7062 | 190.752 | 0.9792 |
| 50 | −1.4673 | 191.395 | 0.9945 |
| 100 | −1.6735 | 212.845 | 0.9816 |
| 200 | −1.9089 | 239.283 | 0.9749 |
Table 4.
The fitting result of critical hydraulic gradient and rock block percentage with linear equation for the typical samples.
Table 4.
The fitting result of critical hydraulic gradient and rock block percentage with linear equation for the typical samples.
| RBP (%) | Coefficient | Correlation Coefficient (r) | |
|---|---|---|---|
| a | b | ||
| 30 | 0.2097 | 136.862 | 0.9879 |
| 40 | 0.2171 | 123.448 | 0.9912 |
| 50 | 0.2051 | 109.599 | 0.9555 |
| 60 | 0.1369 | 94.893 | 0.9213 |
| 70 | 0.1782 | 72.991 | 0.8923 |
© 2017 by the authors. Licensee MDPI, Basel, Switzerland. This article is an open access article distributed under the terms and conditions of the Creative Commons Attribution (CC BY) license (http://creativecommons.org/licenses/by/4.0/).
Share and Cite
MDPI and ACS Style
Wang, Y.; Li, C.; Zhou, X.; Wei, X. Seepage Piping Evolution Characteristics in Bimsoils -An Experimental Study. Water 2017, 9, 458. https://doi.org/10.3390/w9070458
AMA Style
Wang Y, Li C, Zhou X, Wei X. Seepage Piping Evolution Characteristics in Bimsoils -An Experimental Study. Water. 2017; 9(7):458. https://doi.org/10.3390/w9070458
Chicago/Turabian StyleWang, Yu, Changhong Li, Xiaolong Zhou, and Xiaoming Wei. 2017. "Seepage Piping Evolution Characteristics in Bimsoils -An Experimental Study" Water 9, no. 7: 458. https://doi.org/10.3390/w9070458
Note that from the first issue of 2016, this journal uses article numbers instead of page numbers. See further details here.