Snow Precipitation Measured by Gauges: Systematic Error Estimation and Data Series Correction in the Central Italian Alps


1
Department of Civil, Environmental, Architectural Engineering and Mathematics, Università degli Studi di Brescia-DICATAM, Via Branze, 42, 25123 Brescia BS, Italy
2
ARPA Lombardia–Centro Nivometeorologico di Bormio (SO), Bormio, SO 23032, Italy
*
Author to whom correspondence should be addressed.
Water 2017, 9(7), 461; https://doi.org/10.3390/w9070461
Submission received: 28 December 2016
/
Revised: 4 June 2017
/
Accepted: 20 June 2017
/
Published: 25 June 2017
(This article belongs to the Special Issue Advances in Hydro-Meteorological Monitoring)
Abstract
:Precipitation measurements by rain gauges are usually affected by a systematic underestimation, which can be larger in case of snowfall. The wind, disturbing the trajectory of the falling water droplets or snowflakes above the rain gauge, is the major source of error, but when tipping-bucket recording gauges are used, the induced evaporation due to the heating device must also be taken into account. Manual measurements of fresh snow water equivalent (SWE) were taken in Alpine areas of Valtellina and Vallecamonica, in Northern Italy, and compared with daily precipitation and melted snow measured by manual precipitation gauges and by mechanical and electronic heated tipping-bucket recording gauges without any wind-shield: all of these gauges underestimated the SWE in a range between 15% and 66%. In some experimental monitoring sites, instead, electronic weighing storage gauges with Alter-type wind-shields are coupled with snow pillows data: daily SWE measurements from these instruments are in good agreement. In order to correct the historical data series of precipitation affected by systematic errors in snowfall measurements, a simple ‘at-site’ and instrument-dependent model was first developed that applies a correction factor as a function of daily air temperature, which is an index of the solid/liquid precipitation type. The threshold air temperatures were estimated through a statistical analysis of snow field observations. The correction model applied to daily observations led to 5–37% total annual precipitation increments, growing with altitude (1740 ÷ 2190 m above sea level, a.s.l.) and wind exposure. A second ‘climatological‘ correction model based on daily air temperature and wind speed was proposed, leading to errors only slightly higher than those obtained for the at-site corrections.
1. Introduction
Snow precipitation is one of the key hydrometeorological variables, besides snow monitoring activities connected to hydrological and meteorological processes. Planning and managing water resources, as well as preventing floods and landslides, need precise and accurate precipitation data. However, precipitation measurements by rain gauges are normally affected by systematic errors that lead to an underestimation of the real value [1,2,3]. The wind, disturbing the trajectory of the falling water droplets or snowflakes above the rain gauge, is the major source of error [4,5,6]. When precipitation occurs in its liquid phase, the maximum underestimation, even in strong wind conditions, is generally below 15%. Errors are much higher when precipitation turns into snow: even 100% underestimation is possible in this case [7,8].
Evaporation induced by heating devices (necessary for tipping bucket rain gauges) adds to the wind effect [9]. Tipping-bucket rain gauges are the most used around the world [10], but they are very often installed in those areas where snowfall exceeds rainfall throughout the year. This happens despite their well-known low reliability in such conditions [11,12,13].
The errors clearly show up in the Alps, a densely-monitored area, where precipitation measurements are commonly underestimated, more and more as altitude increases. It is at higher elevations that precipitation is greater, the wind is stronger and more continuous, and snowfall is the predominant form of precipitation: these are the most critical issues in correctly measuring the water volume that falls onto the ground. The increasing automatization in meteorological monitoring systems poses new challenges in this field of work, but also pushes to develop new, and maybe crucial, technologies, including advanced methods for monitoring the snow water equivalent and snow properties with remote sensing [14].
In this study a dataset from snow-meteorological monitoring stations located in Northern Italy is analysed. The focus is on the Valtellina and Vallecamonica upper areas, belonging to the Lombardy Region, with the purpose of estimating systematic errors in solid precipitation measurements collected by rain gauges (1740 ÷ 2190 m a.s.l.). To do so, daily rain gauge observations are compared to fresh Snow Water Equivalent (SWE) data from monitoring sites close to the study area. The dataset was collected thanks to cooperation between Università degli Studi di Brescia and the Snow and Avalanches ARPA centre located in Bormio, which is the official snow, avalanche, and weather monitoring institution for mountain areas in Lombardy. Field surveys supported the choice of the most suitable sites, according to the study aim. This paper not only draws the reader’s attention to the issues of solid precipitation-measuring methods, but it also suggests a practical way to reconstruct the time series of precipitation observations affected by underestimation errors. Therefore, a simple statistical one-parameter model is proposed here, useful to correct daily precipitation data and based on two meteorological variables, temperature, and precipitation.
2. Case Study and the Error Estimate
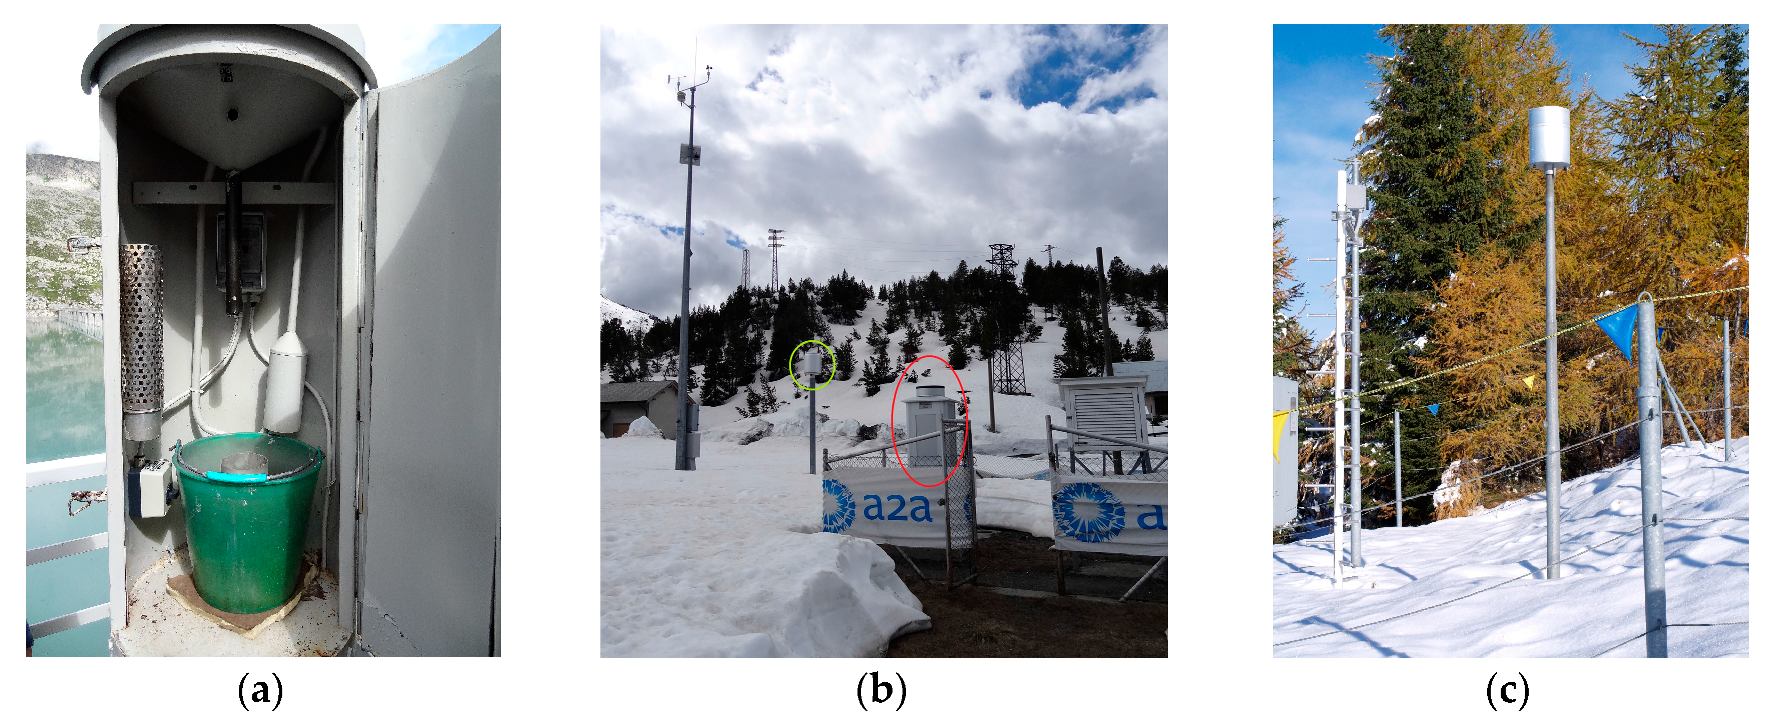
Lombardy Region owns a dense meteorological monitoring network, part of which is a legacy of the former National Hydrological Service SIMN (Servizio Idrografico e Mareografico Nazionale, decommissioned in the nineties) and it is still composed of the original manual and mechanical devices, such as the mechanical tipping-bucket rain gauges with paper ink recorders manufactured by SIAP (Villanova (BO), Italy) (Figure 1a,b). With the transfer to regional administrations of the responsibility of environmental monitoring services from the national level to the regional level (ARPA Lombardia, the regional Environment Protection Agency), electronic devices and digital recording systems were installed in addition to the old ones, sometimes adjacent to the old manual stations. In many cases rain gauges manufactured by CAE (San Lazzaro di Savena (BO), Italy) (PMB2 model, Figure 1c) were chosen, so these are now the newest instruments in Lombardy.
For each one of the sites shown in Figure 2 and listed in Table 1, selected from those that are still active in the area, freshly-fallen snow water equivalent (SWE) daily measurements were compared to daily precipitation data retrieved from rain gauges nearby (Figure 3). SWE data by depth and density measurements of freshly-fallen snow collected on snowboards are assumed to be reliable because they provide a direct estimate of the real precipitation fallen on the ground [15]. In fact SWE was previously used by Sevruk [11,16] to reconstruct solid precipitation data from rain gauges and also by [17] as a representative reference measure for quality control of snow pillow measurements by the Snow Telemetry (SNOTEL) Data Collection Network by the U.S Department of Agriculture (USDA).
Starting with seasonal manual monitoring observations, only the precipitation events with the fresh snow density and depth correctly recorded by the observers were selected, in order to evaluate the snow water equivalent (SWE) with snow course data according to the following formula:
where the snow density ρ is expressed in kg/m3 and the depth of fresh snow HN is in cm and SWE in mm or kg m−2.
To assess the underestimation of fresh fallen snow, no snow-mixed-to-rain events were considered (specific forms following the international standards are adopted in Italy [18,19,20]), nor were those with missing, incomplete, or inconsistent SWE measurements or rain gauge precipitation values. SWE manual measurements were taken between 8:00 and 10:00 am with a white wood snow board, a graduated scale and a snow sampler attached to a dynamometer (Figure 4 shows an example snow monitoring field). SWE measurements given by Equation (1) were assumed as the ‘true’ precipitation reference value. These data are affected by uncertainties in both depth of fresh snow and snow density measurements. In order to assess such uncertainty, results of a recent intercomparison of SWE measurement methods adopted in Italy were analysed [21]. They showed a 7% coefficient of variation of 92 SWE estimates conducted with combined depth and density measurements. This is a result of a 1 cm standard uncertainty of snow depth measurements and a typical 5% standard relative uncertainty of gravimetric snow density measurements with density cutters and portable dynamometers in the field [22]. Rain gauge types are: manual rain gauge with 1000 cm2 hole and melting snow operation made at the measurement time (P1); manual rain gauge (1000 cm2) in a heated housing SIAP model (P2); mechanical tipping-bucket recording gauge (1000 cm2) SIAP or Salmoiraghi in a heated housing SIAP model (P3); CAE PMB2 electronic tipping-bucket recording heated gauge (1000 cm2) (P4).
In addition to the ARPA Lombardia monitoring network, A2A (an Italian energy generation and trading company) also manages several hydrometeorological stations, used in their management activity of hydroelectric power plants located in this area. Some of these stations are equipped with snow pillows and electronic weighing storage precipitation gauges with Alter-type wind-shields (Figure 5). Table 2 shows the comparison between daily precipitation measurements from weighing storage gauges (model Geonor T200B, with 200 cm2 hole) and the respective snow pillows (model STS ATM/N; see also [23]). In both cases the total amount in 24 h and a 0.5 mm lower bound were considered to avoid high relative differences [24,25]. A 0 °C higher bound was also set for the daily average temperature, to leave out most of the snow-mixed-to-rain events. The obtained daily dataset was finally purged of all records with missing or incoherent data from one of the instruments. The literature [17] indicates that snow pillow SWE data are within 15% of the snow course reference value in 68% of the SNOTEL network sites and within 5% in 28% of the sites.
Regarding the manual rain gauges and tipping-bucket heated recording gauges, the underestimation is systematic and varies from 15% to 66%; windy sites (Cancano and Pantano d’Avio) are those with the highest errors, above 50%, while in low wind conditions or wind-covered stations the average error is around 25%. The wind effect is responsible for about half of the total underestimation encountered for the Cancano mechanical tipping-bucket gauge SIAP model (Figure 1b) and Pantano d’Avio manual gauge in a SIAP heated housing (Figure 1a), since these instruments have no wind shielding device; in fact, the same instrument installed in low wind sites shows about halved errors. For the majority of the sites, the lack of wind data makes it difficult to comment more precisely on the influence of the wind. For this reason our basic correction procedures of rain gauge precipitation measurements are based on air temperature only, as presented in the next section.
However, at Cancano and S. Caterina, with two types of tipping bucket gauges, and Aprica Magnolta wind data are also available, although for a limited period and with some gaps. The results of the analysis of those data confirm the influence of the wind on the SIAP mechanical tipping-bucket heated gauge systematic errors, which in S. Caterina are about halved compared to Cancano, where the station is significantly more exposed to the wind. Using the SWE, precipitation, air temperature, and wind speed data available for these three sites a correction procedure of precipitation measurements based on both daily air temperature and wind speed data will be discussed in the fourth section.
Less significant, and apparently contradictory, are the results from the CAE PMB2 electronic tipping-bucket heated gauge. In fact, at S. Caterina, the errors are large despite the fact that the wind speed is even lower when compared to the Aprica Magnolta ones, where the same instrument shows only 15% underestimation, the lowest of all the examined ones, as shown in Table 1. This discrepancy may be justified by the fact that the Aprica Magnolta precipitation gauge is equipped with a heating device only from the end of 2012. Measurements considered for this comparison are mostly from the 2013–2014 season (only one winter season), in which exceptional temperature anomalies were recorded in Northern Italy (up to 4 °C above the average; see also [26]). At Aprica Magnolta the average temperature during the days taken into account for the 2013–2014 season was −1.7 °C; the remaining measurements are from the 2012–2013 season, in which days the average temperature was −3.7 °C. Considering only the data from the 2012–2013 season the gap in accumulated precipitation is −29.3%. At S. Caterina, where the same instrument shows an underestimate near 50%, the data refer to the 2005–2010 period, with an average temperature equal to −4.0 °C. This fact, added to an on-average lower intensity precipitation occurring at this site compared to Aprica, because of the interior Alps precipitation regime, could justify this different instrument performance, less accurate at lower temperatures and lower rainfall intensities. In fact, at S. Caterina, the SIAP mechanical tipping-bucket heated gauge shows fewer underestimations than the CAE PMB2 electronic one, probably due to the different heating devices of the two instruments, given that all other conditions are nearly identical.
Regarding the automated monitoring stations equipped with snow pillows and weighing storage gauges, there is a good correspondence between the increments of precipitation recorded by the gauge and daily increases of snow water equivalent on the snow pillow (Table 2). However there might still be a non-negligible underestimation of the measurements from the snow pillow because the considered sites are not fully wind protected and the Geonor T200B weighing precipitation gauge, equipped with an Alter-type wind shield, is known to underestimate snow precipitations by about 5–10% already for 1–2 m/s wind speed [27,28,29,30]. Therefore, it is reasonable to assume that there is an underestimation in the measurements from the snow pillow, because of the well-known problem caused by the internal cohesion of the snowpack. Unfortunately, none of these stations is equipped with wind sensors, so it was not possible to resolve these uncertainties. Results are consistent with those obtained in other similar studies referring to the Alpine region [11,31,32,33,34].
3. Correction of Precipitation Data
In order to reconstruct the precipitation data series, a simple model was developed and calibrated. It is based on the application of a correction factor to the daily measurement as a function of daily average temperature [31,35,36,37,38,39,40,41]. It appears thusly:
where the daily recorded precipitation P is corrected using a factor Cs as a function of the daily average temperature Tm through the coefficient αs, which varies linearly between 0 and 1 as the temperature increases from the minimum threshold value for liquid precipitation Th to the maximum threshold value for solid precipitation Tl (Figure 6a). In this way, theoretically, the snow-only precipitation measurements are increased, rain-only precipitation measurements remain the same and the snow-mixed-to-rain ones are partially corrected in a linear way according to the position of the daily mean temperature value between the two thresholds. This model is widely applicable because daily observations of air temperature are easy to find even in very old datasets. Wind speed data would be very useful for a more accurate correction, but they are seldom available and representative data samples are too hard to find, especially regarding the time extension. The nature of the area concerned does not even allow easy connections or interpolations with the data of other stations nearby, as the wind is influenced by the extremely complex orography. In order to determine the transition temperature between liquid and solid precipitation, a statistical analysis was carried out on the data collected by the observers at manual monitoring sites.
AINEVA (Associazione Interregionale di coordinamento e documentazione per i problemi inerenti la NEve e le VAlanghe), the Italian association for snow and avalanche studies, has set a procedure useful to clearly classify the precipitation events as: rain-only, snow-only, and sleet events. Given the availability of samples with a high abundance for each type of event and, very often, also for each individual station, it was possible to carry out a statistical analysis which can be assumed to be representative. Subdividing the samples of the three types of events mentioned above in temperature classes of 1 °C, it was possible to observe that they are well approximated by the normal distribution (Gauss). First, the samples of the three types of meteorological events selected for each station were taken into account; then, to obtain a generalized result, the samples of individual stations were also added.
The generalized sample analysis (Figure 6b) led to the setting of the following thresholds:
- 90% of snow-only events occur in days with average temperature below 1.5 °C
- 90% of rain-only events occur in days with average temperature above 0.1 °C
- 90% of sleet events occur in days with average temperature between −3.1 °C and 4.8 °C
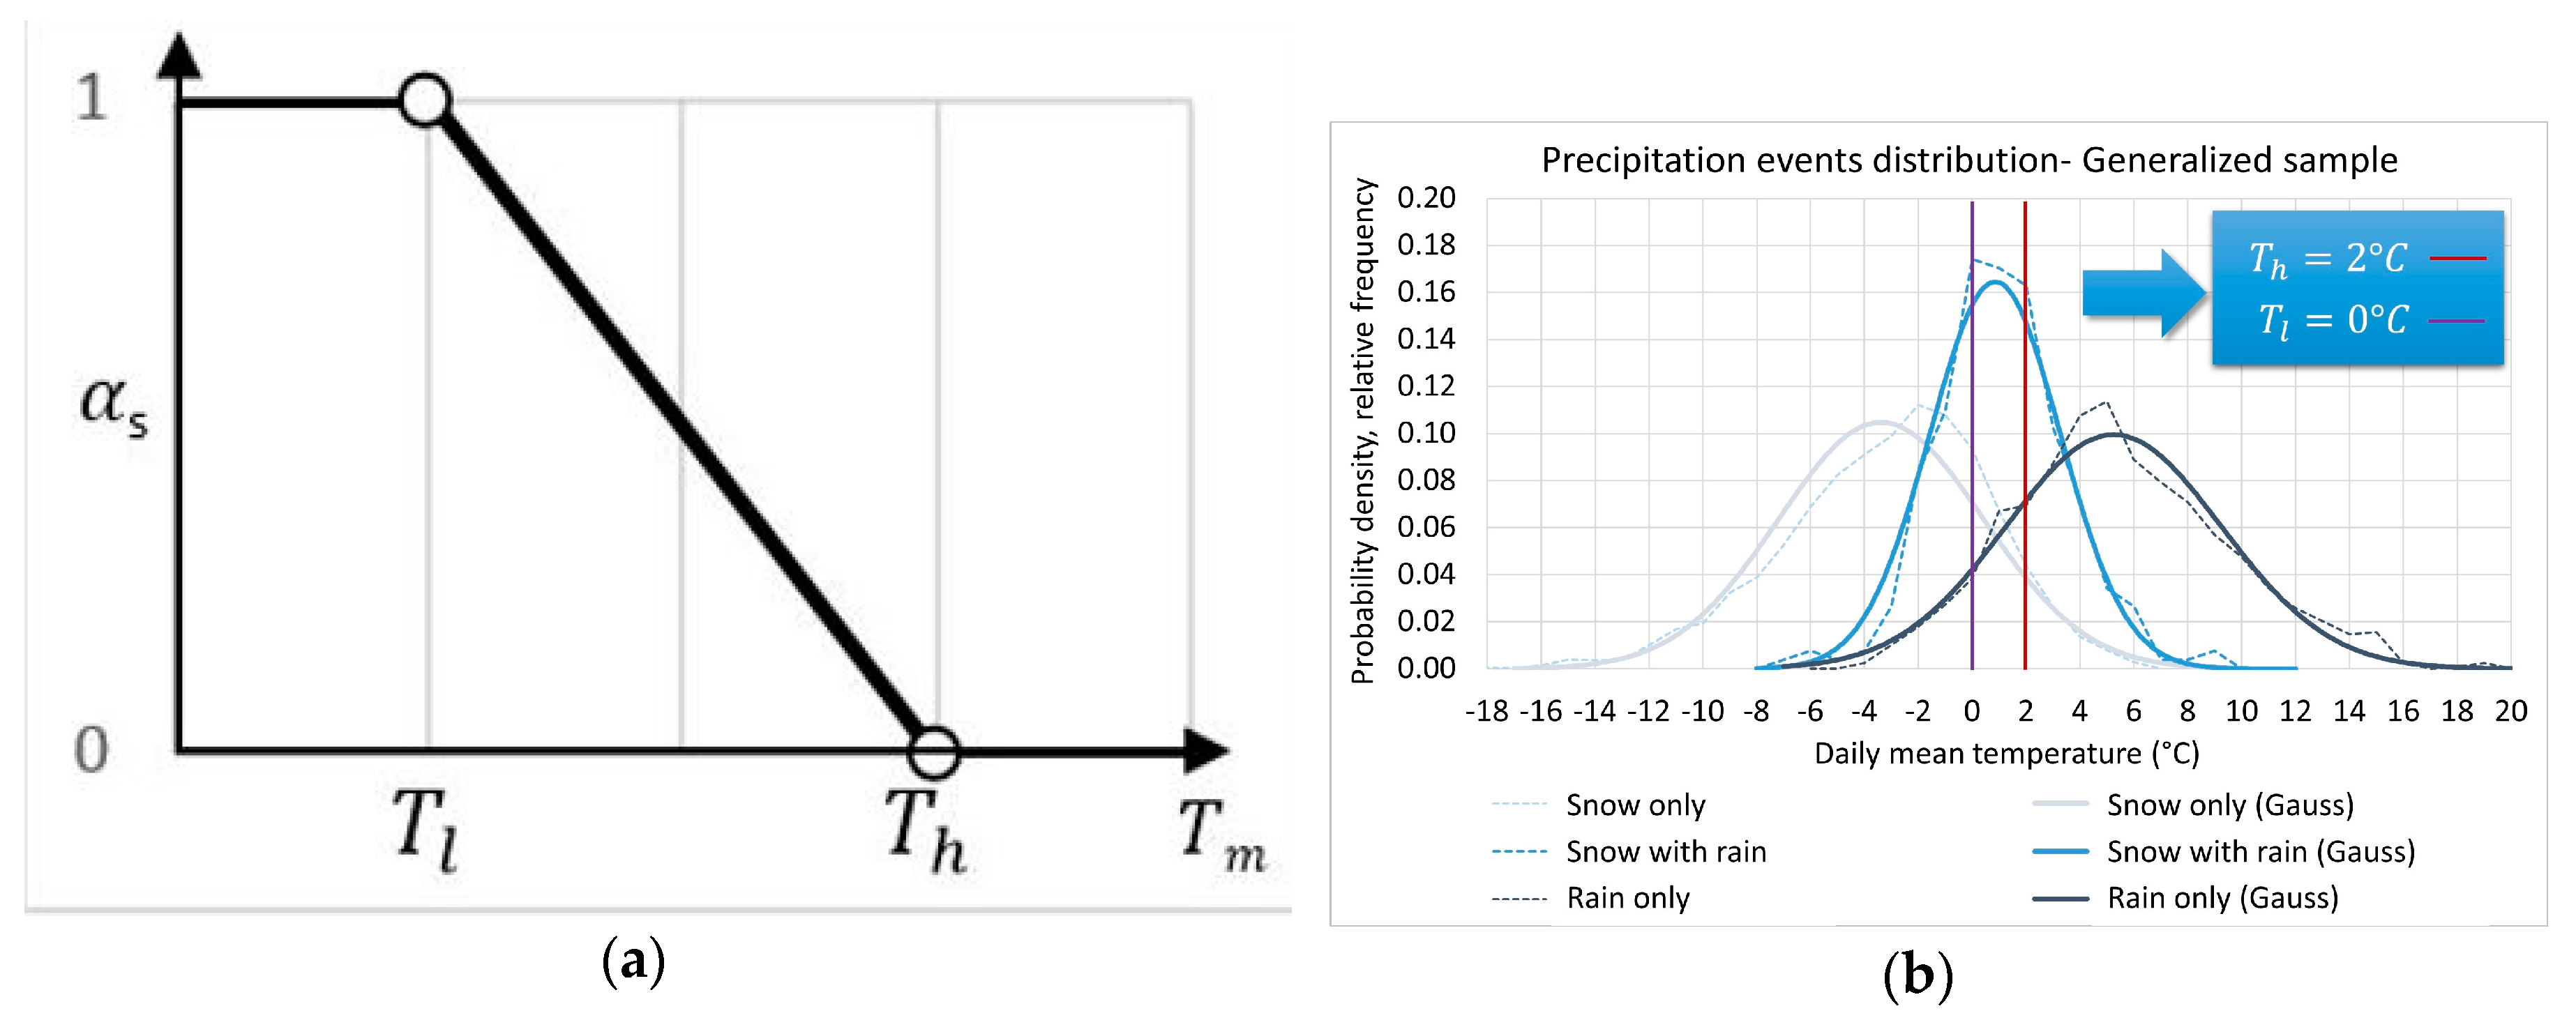
The number of snow-mixed-to-rain events is significantly less than the number of rain-only or snow-only events (264 against 1284 and 2780, respectively). Therefore, it is logical to give more importance to the temperature thresholds identified by the rain-only and snow-only events. On the other hand the fact that the sleet events have a distribution centred at 1 °C was accounted for by choosing symmetrical temperature thresholds with respect to this value. In particular, the selected threshold temperatures are Th = 2 °C and Tl = 0 °C. That is coherent with those specified by [31] and [35] for the application of the same model (based on a similar precipitation event analysis) to Malga Bissina and Pinzolo-Prà Rodont sites, in the Trentino-Alto Adige/Südtirol Region.
The correction factor Cs was calibrated for each monitoring site by minimizing the square bias of the individual measurements or the bias between the cumulative values (Table 3). The Cs value appeared to always be higher in the latter case. Subsequently, an intermediate value was chosen, fulfilling also the condition that the slope of the best-fit line of each measurement has to be lower than 1. In this way the resulting values of Cs were close to those obtained by minimizing the RMSE.
The model was applied to four precipitation data series: Pantano d’Avio, Lago d’Avio, S. Caterina and Cancano. In particular for the following years: Pantano d’Avio: 1990, 1994, 1996; Lago d’Avio: 1987–1994, 1996, 2002, 2003, 2005; S. Caterina Valfurva: 1968–1970, 1972–1976, 1978–1984, 1986, 1988–1992, 1994–1997, 1999–2007, 2009, 2012–2013; Cancano: 1979–1986; 1988–1989; 1997; 2002–1913.
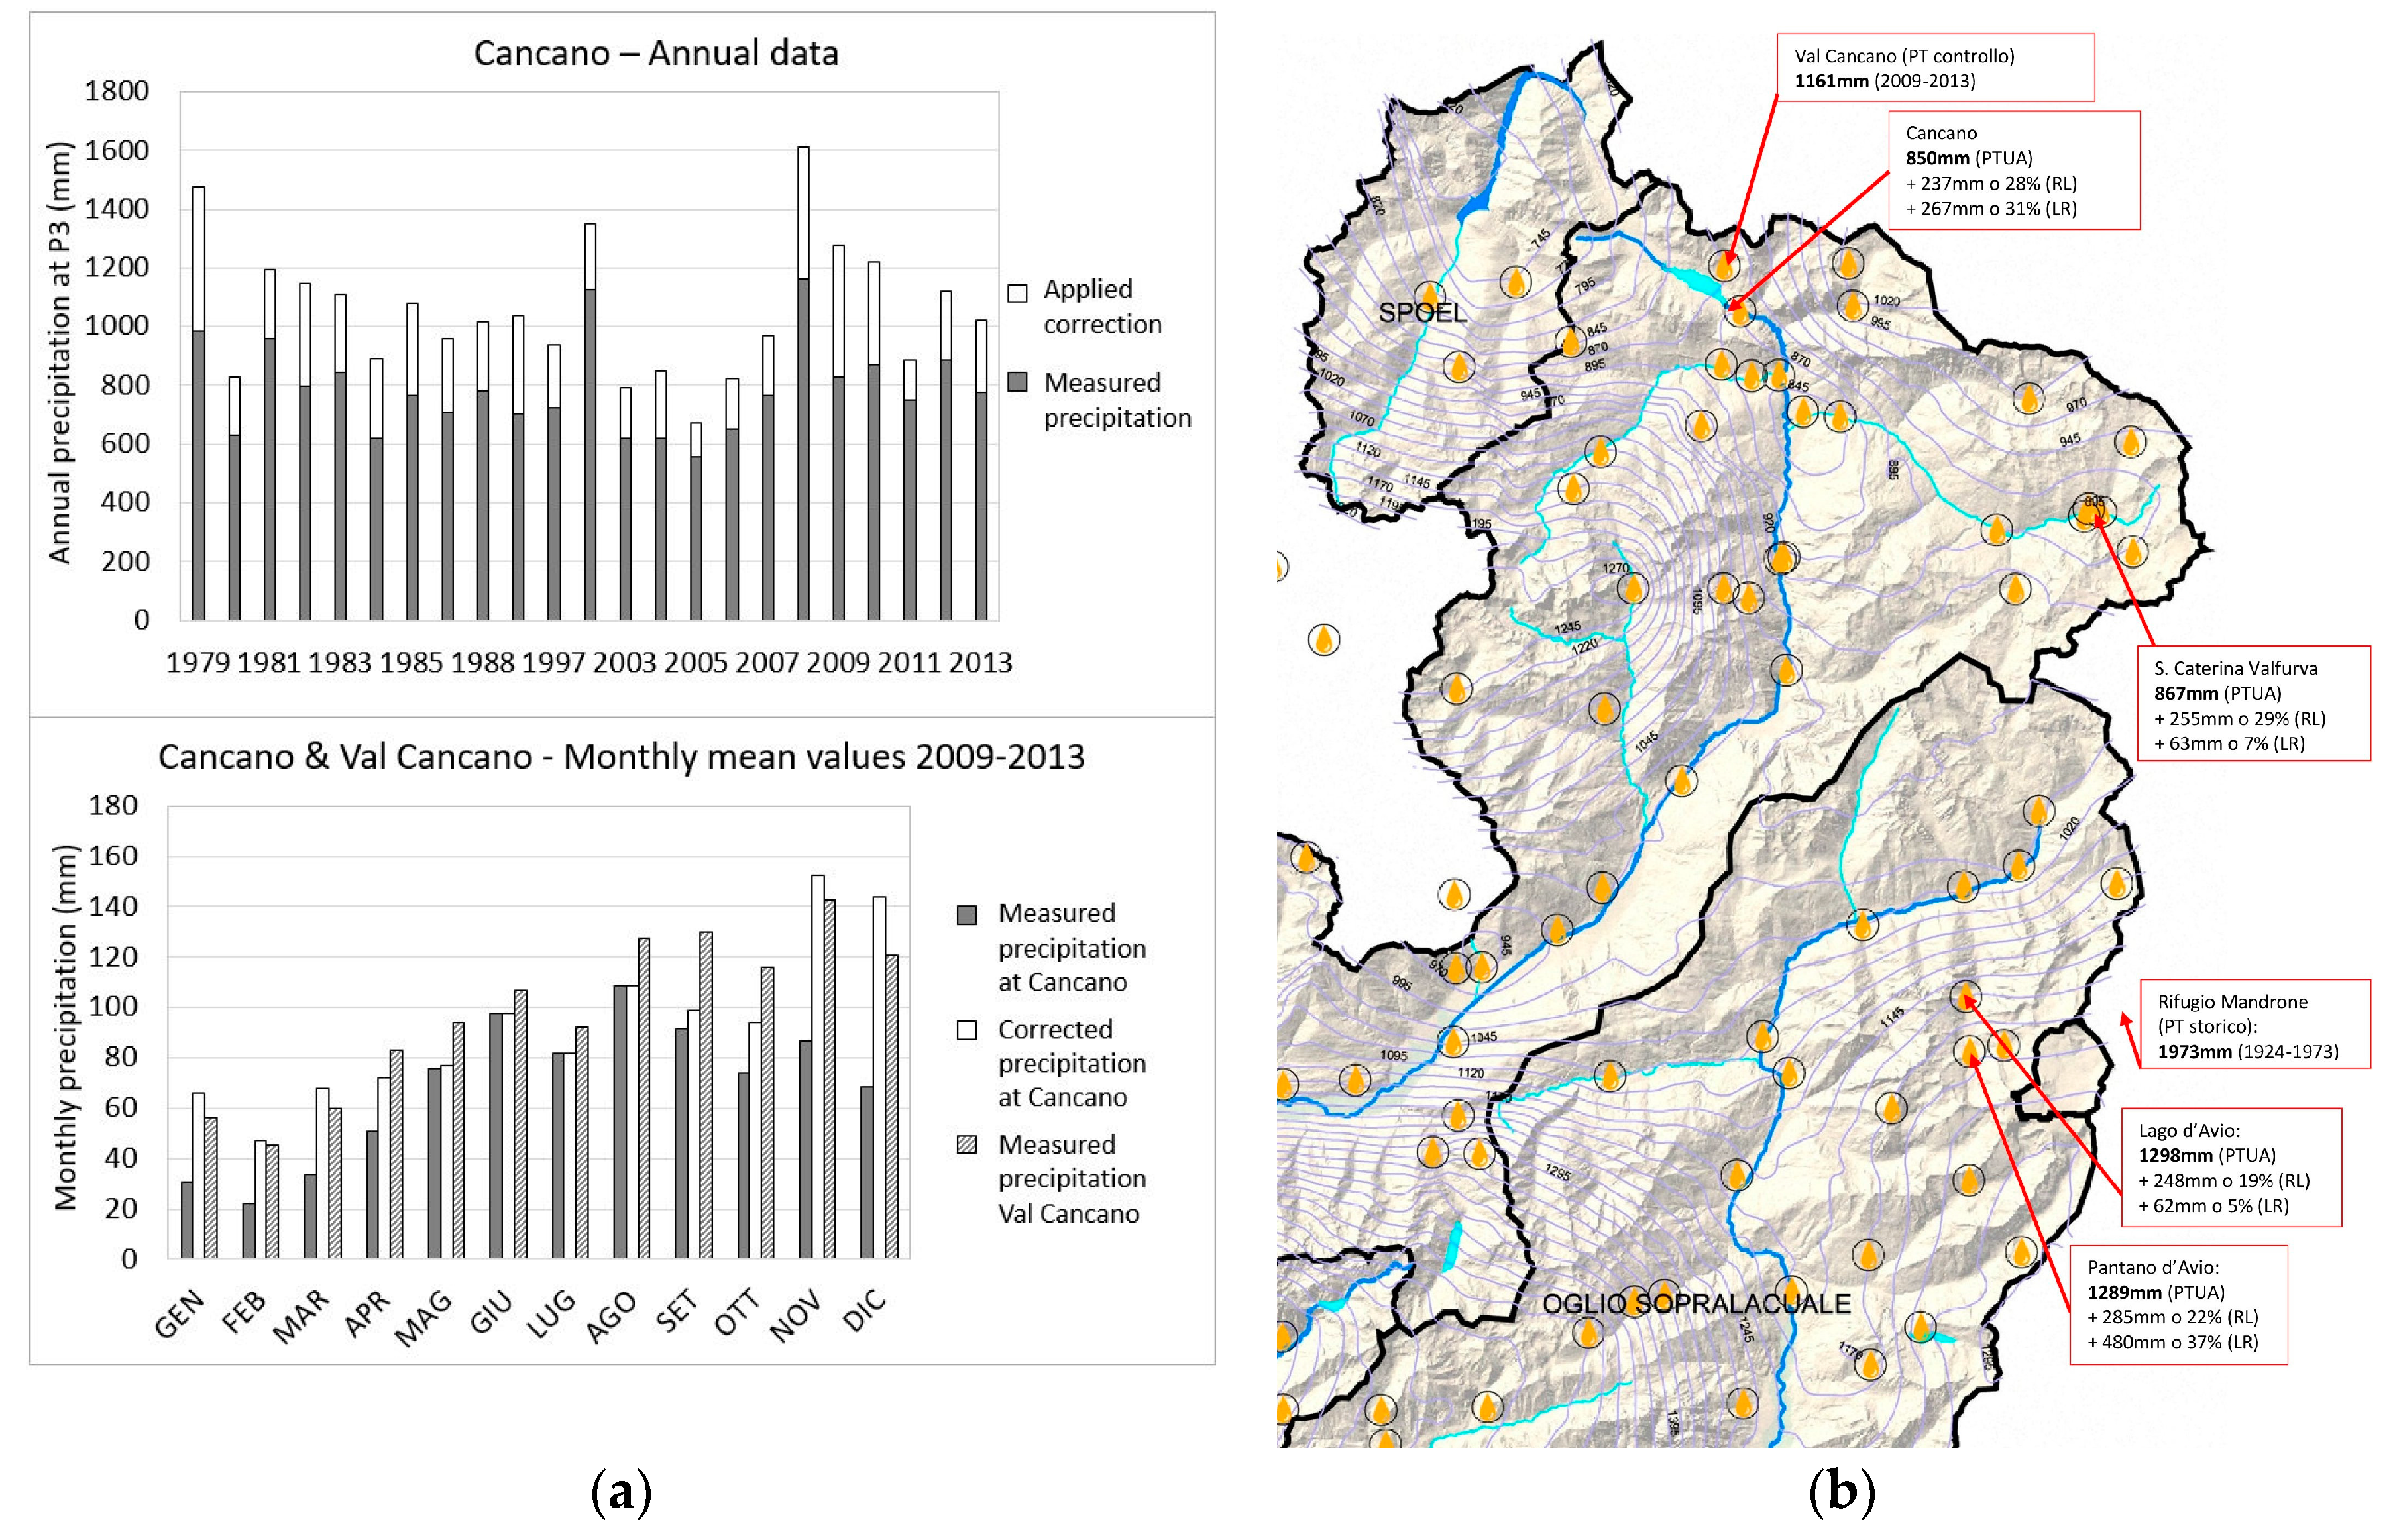
An example of the correction effects on monthly precipitation averages and annual total value is reported in Figure 7a and Table 4. Corrected values for Cancano were compared to data from the nearby Val Cancano station, about 2 km apart and 250 metres higher than the first, but equipped with a Geonor T200B weighing precipitation gauge with a Alter-type wind-shield, considered a more reliable instrument in measuring solid precipitation. Regarding the 2009–2013 period, the average precipitation shows significant differences both in the annual values, and in the monthly ones, that cannot be explained only by the different exposure and the altitude gap. The corrected data show excellent consistency on the mean yearly total; at the monthly scale the variability is greater, probably due to an over-correction in the winter months but, overall, the precipitation regime (with the maximum in November) is properly reproduced.
4. Discussion
The results obtained for this and other stations can be compared in Figure 7b with those reported on the current official Lombardy Region precipitation distribution map (2003), here limited to the area of this study. To compensate the well-known underestimation of precipitation measurements at the high elevation sites, the Lombardy Region in its General Water Management and Protection Plan-PTUA (2006) uses, and proposes to use for other hydrological studies, a procedure in order to compensate the solid precipitation missing values. This consists in adding, to the yearly precipitation average value, a variable SWE value according to the different river basins and only to the basin area above the winter mean freezing level.
Figure 7b also shows the average precipitation measured by the manual storage gauge at Rifugio Mandrone (TN). Data published on Hydrological Yearbooks by SIMN show a mean yearly precipitation of 1973 mm calculated on the hydrological year and according to the available data for the period between 1924 and 1973. In the same period, starting from the daily measurements, the manual rain gauge at Lago d’Avio shows a yearly average of 1240 mm. Although the comparison is not as rigorous as the one made for Cancano site, since there is no coincidence in time period, nor the availability of such evolved instruments, the reconstruction performed on the data of Pantano d’Avio can still be considered consistent: it gives an yearly average of about 1900 mm for the three years 1990, 1994, and 1996.
A complete dataset of wind data was available for only three stations, and for an extensive and systematic solid precipitation data correction for the past, the simple temperature-based correction procedure was implemented for all of the stations. However, for the three stations equipped with five instruments for which wind data were available some variability with respect to wind speed in the systematic underestimation of precipitation was found.
To test the possibility to extend the information collected for these stations to other environments a temperature and wind-based data correction was tested. The value of the Cs (now Cs,w) factor in Equation (2) was assigned by minimising the RMSE between the corrected value Pc and the reference ‘true’ value of the fresh fallen SWE with the following criteria:
- if daily wind speed V is < 1.5 m/s, then Cs,w = 0.4 (S. Caterina, Aprica Magnolta)
- if 1.5 < V < 2.5 m/s, then Cs,w = 0.7 (Cancano P3)
- if V > 2.5, then Cs,w = 1.5 (Cancano P4)
Since this second procedure is no more an at-site correction through a best fit value of Cs,w for each station, but has a more general climatological value, a slight loss of accuracy (bias) and precision (RMSE) was observed, as expected, although it has to be kept in mind that the dataset used for the climatological correction is smaller than the one used for the at-site correction, because wind data are available only for a subset of measurements. The results are still acceptable, though, as it can be seen by comparing the error standard deviation in Table 3 and Table 5 and, for this reason, this second method is suggested in case both temperature and wind data are available.
5. Conclusions
This study concerned Valtellina and Vallecamonica upper areas, located in the Lombardy Region, where ARPA Lombardia is officially in charge for the snow monitoring and avalanche risk warning service. Regarding the precipitation measurement in high-altitude areas, the current monitoring network is mostly equipped with mechanical and electronic tipping-bucket recording gauges, and only some of them have a heating device useful to melt the snow; moreover, there are still some manual precipitation gauges in use. During the snow season, there are several sites where human observers take fresh fallen snow water equivalent (SWE) measurements that are assumed as a reference ‘true value’ to correct systematic errors of precipitation measured by rain gauges nearby. Heated tipping-bucket gauges and manual gauges underestimate the real precipitation depth by between 15% and 66%; windy monitoring sites are those with the highest errors, above 50%, while in low wind or wind-covered stations the average error is around 25%.
In addition the A2A hydropower generation company had some hydrometeorological stations installed in 2008, equipped with snow pillows and electronic weighing storage precipitation gauges with Alter windshield. For each station, a comparison between measurements taken by these instruments showed to be in good agreement. This fact confirms the high reliability of electronic weighing gauges in solid precipitation measurement. However, it is likely that the snow pillows also underestimate the snowpack SWE when this is subject to significant internal cohesion, so that it creates a bridge effect that threatens the correct sensor reading.
The results obtained are, overall, consistent with those obtained from other similar studies conducted in the Alpine region and confirm the great variability of the underestimation of solid precipitation observations through rain gauges, depending on both site conditions and instrument type and model. In order to correct the precipitation datasets affected by systematic errors, first, a simple model was developed, which takes into account only daily average temperature and a site and instrument-dependent correction factor as parameters to set the correction. The model is then widely applicable since the air temperature is often the only meteorological information available, especially in old monitoring sites with similar characteristics. The model evaluates the constant correction factor Cs, ranging between 0.11 and 1.50, to daily precipitation measurements when they refer to a snow-only event: it does not modify the measurements of rain-only events. It also considers a linear variation within the temperature range in which snow-mixed-to-rain event occurred. The proposed model was applied to the precipitation datasets of four stations, with different results in terms of the impact on the monthly and yearly averages, which are increased between 5% and 37% as altitude above the sea level and the site’s wind exposure increase. These results were compared to those reported on the Lombardy map of yearly precipitation distribution, which is the current official reference in this field of work, and with some interesting old data from the former National Hydrological Service (SIMN). A second correction procedure with more general climatological value, based on both daily temperature and wind speed data is then considered. The verification of this procedure provides only slightly worse performances than those obtained with the at-site and instrument-dependent correction and, therefore, can be used when complete meteorological data are available.
Acknowledgments
Special thanks for their cooperation in this study: ARPA Lombardia, especially the Centro Nivometeorologico di Bormio (SO) and the Servizio Idrografico di Milano; A2A S.p.A., especially the Uffici di Grosio (SO) for providing data from their stations.
Author Contributions
Amerigo Lendvai collected and analysed the data with the help of Giovanni Peretti and his collaborators, who did most of the fieldwork. Giovanna Grossi contributed in framing the study in the international research on snow monitoring. Roberto Ranzi indicated the methodologies and the statistical analyses to be performed.
Conflicts of Interest
The authors declare no conflict of interest.
References
- Sevruk, B. Point precipitation measurement: Why are they not corrected? In Water for the Future: Hydrology in Perspective; IAHS Publication: Rome, Italy, 1987. [Google Scholar]
- Immerzeel, W.; Wanders, N.; Lutz, A.; Shea, J.; Bierkens, M. Reconciling high altitude precipitation in the upper Indus basin with glacier mass balances and runoff. Hydrol. Erath Syst. Sci. 2015, 19, 4673–4687. [Google Scholar] [CrossRef]
- Groot Zwaaftink, C.D.; Cagnati, A.; Crepaz, A.; Fierz, C.; Macelloni, G.; Valt, M.; Lehning, M. Event-driven deposition of snow on the Antarctic Plateau: Analyzing field measurements with SNOWPACK. Cryosphere 2013, 7, 333–347. [Google Scholar] [CrossRef]
- Sevruk, B.; Hertig, J.; Spiess, R. Wind field deformation above precipitation gauge orifices. IAHS 1989, 179, 65–70. [Google Scholar]
- Chvila, B.; Ondras, M.; Sevruk, B. The wind-induced loss of precipitation measurement of small time intervals as recorded in the field. In Proceedings of the WMO/CIMO Technical Conference, Bratislava, Slovaki, 25 September–3 October 2002. [Google Scholar]
- Rasmussen, R.; Baker, B.; Kochendorfer, J.; Meyers, T.; Landolt, S.; Fischer, A.; Black, J.; Theriault, J.; Kucera, P.; Gochis, D.; et al. How well are we measuring snow? The NOAA/FAA/NCAR winter precipitation test bed. BAMS 2012, 6, 811–829. [Google Scholar] [CrossRef]
- Duchon, C.; Cole, J.; Rasmussen, R. Measuring heavy snowfall using five different windshields and vibrating-wire precipitation gauges. In Proceedings of the 65th Eastern Snow Conference, Lake Morey, Fairlee, VT, USA, 28–30 May 2008. [Google Scholar]
- Pan, X.; Yang, D.; Li, Y.; Barr, A.; Helgason, W.; Hayashi, M.; Marsh, P.; Janowicz, J.P.R. Bias Corrections of Precipitation Measurements across Experimental Sites in Different Ecoclimatic Regions of Western Canada. Cryosphere Discussi. 2016, 10, 2347. [Google Scholar] [CrossRef]
- Sevruk, B. Distribution of precipitation in mountainous areas. In Evaporation Losses from Storage Gauges; WMO: Geneva, Switzerland, 1972; pp. 96–102. [Google Scholar]
- Nitu, R.; Wong, K. CIMO Survey on National Summaries of Methods and Instruments for Solid Precipitation Measurement at Automatic Weather Stations; WMO: Geneva, Switzerland, 2010. [Google Scholar]
- Sevruk, B. Correction of measured precipitation in the Alps using the water equivalent of new snow. Nord. Hydrol. 1983, 1, 49–58. [Google Scholar]
- Savina, M.; Schaeppi, B.; Molnar, P.; Burlando, P.; Sevruk, B. Comparison of a tipping-bucket and electronic weighing precipitation gage for sbnowfall. Atmos. Res. 2012, 103, 45–51. [Google Scholar] [CrossRef]
- Nitu, R.; Rasmussen, R.; Baker, B.; Lanzinger, E.; Joe, P.; Yang, D.; Smith, C.; Roulet, Y.; Goodison, B.; Liang, H.; et al. WMO Intercomparison of Instruments and Methods for the Measurement of Solid Precipitation and Snow on the Ground: Organization of the Experiment; WMO: Geneva, Switzerland, 2012. [Google Scholar]
- Cagnati, A.; Crepaz, A.; Macelloni, G.; Pampaloni, P.; Ranzi, R.; Tedesco, M.; Tomirotti, M.; Valt, M. Study of the snow meltfreeze cycle using multi-sensor data and snow modelling. J. Glaciol. 2004, 50, 419–426. [Google Scholar] [CrossRef]
- Bocchiola, D.; Rosso, R. The distribution of daily snow water equivalent in the central Italian Alps. Adv.Water Resour. 2007, 30, 135–147. [Google Scholar] [CrossRef]
- Sevruk, B. Conversion of Snowfall Depths to Water Equivalents in the Swiss Alps. Zürcher Geogr. Schr. 1986, 23, 13–23. [Google Scholar]
- Serreze, M.C.; Clark, M.P.; Armstrong, R.L.; McGinnis, D.A.; Pulwarty, R.S. Characteristics of the western United States snowpack from snowpack telemetry (SNOTEL) data. Water Resour. Res. 1999, 35, 2145–2160. [Google Scholar] [CrossRef]
- Cagnati, A. Strumenti di Misura e Metodi di Osservazione Nivometeorologici; AINEVA: Trento, Italy, 2003. (In Italian) [Google Scholar]
- Valt, M.; Cagnati, A.; Corso, T. Stima dell’equivalente in acqua della neve. Neve e Valanghe 2006, 59, 24–33. (In Italian) [Google Scholar]
- Valt, M.; Moro, M. Average snowcover density values in eastern Alps mountain. Proceedings of EGU General Assembly 2009, Vienna, Austria, 19–24 April 2009. [Google Scholar]
- D’Aosta, A.V. Secondo Interconfronto SWE; ARPA: Valle d’Aosta, Aosta, Italy, 2016. [Google Scholar]
- Proksch, M.; Rutter, N.; Fierz, C.; Schneebeli, M. Intercomparison of snow density measurements: Bias, precision, and vertical resolution. Cryosphere 2016, 10, 371–384. [Google Scholar] [CrossRef]
- Valgoi, P. Cuscinetto per la misura della densità della neve (snow pillow). Neve e Valanghe 2011, 72, 48–53. (In Italian) [Google Scholar]
- Goodison, B.; Louie, P.; Yang, D. WMO Solid Precipitation Measurement Intercomparison-Final Report; WMO: Geneva, Switzerland, 1998. [Google Scholar]
- Sevruk, B. Adjustment of tipping-bucket precipitation gauge measurements. Atmos. Res. 1996, 42, 237–246. [Google Scholar] [CrossRef]
- ArCIS-Gruppo di lavoro Archivio climatologico dell’Italia centro-settentrionale. Il clima nell’inverno 2013–2014: Le eccezionali anomalie climatiche del Centro-Nord Italia. Neve e Valanghe 2014, 81, 4–9. (In Italian) [Google Scholar]
- Colli, M.; Lanza, L.; Rasmussen, R.; Thériault, J. The collection efficiency of shielded and unshielded precipitation gauges. Part I: CFD airflow modeling. J. Hydrometeorol. 2016, 17, 231–243. [Google Scholar] [CrossRef]
- Colli, M.; Lanza, L.; Rasmussen, R.; Thériault, J. The collection efficiency of shielded and unshielded precipitation gauges. Part II: Modeling particle trajectories. J. Hydrometeorol. 2016, 17, 245–255. [Google Scholar] [CrossRef]
- Smith, C. Correcting the wind bias in snowfall measurements made with a Geonor T-200B precipitation gauge and alter wind shield. In Proceedings of the 15th Symposium on Meteorological Observation and Instrumentation, Atlanta, GA, USA, 17–21 January 2010. [Google Scholar]
- Macdonald, J.; Pomeroy, J. Gauge undercatch of two common snowfall gauges in a prairie environment. In Proceedings of the 64th Eastern Snow Conference, St. John’s, NL, Canada, 29 May–1 June 2007. [Google Scholar]
- Ranzi, R.; Grossi, G.; Bacchi, B. Ten years of monitoring areal snowpack in the Southern Alps using NOAA-AVHRR imagery, ground measurements and hydrological data. Hydrolog. Process. 1999, 13, 2079–2095. [Google Scholar] [CrossRef]
- Zweifel, A.; Sevruk, B. Comparative accuracy of solid precipitation measurement using heated recording gauges in the Alps. In Workshop on Determination of Solid Precipitation in Cold Climate Regions; Fairbanks: Zürich, Switzerland, 2002. [Google Scholar]
- Savina, M.; Schaeppi, B.; Molnar, P.; Burlando, P.; Sevruk, B. Comparison of a tipping-bucket and electronic weighing precipitation gage for snowfall. Atmos. Res. 2012, 103, 45–51. [Google Scholar] [CrossRef]
- Cugerone, K.; Allamano, P.; Salandin, A.; Barbero, S. Stima della precipitazione in siti di alta quota. Neve e Valanghe 2012, 77, 36–43. (In Italian) [Google Scholar]
- Eccel, E.; Cau, P.; Ranzi, R. Data reconstruction and homogenization for reducing uncertainties in high-resolution climate analysis in Alpine regions. Theor. Appl. Climatol. 2012, 110, 345–358. [Google Scholar] [CrossRef]
- Ranzi, R.; Grossi, G.; Gitti, A.; Taschner, S. Energy and mass balance of the Mandrone Glacier. Geogr. Fis. Din. Quat. 2010, 33, 45–60. [Google Scholar]
- Grossi, G.; Caronna, P.; Ranzi, R. Hydrologic vulnerability to climate change of the Mandrone glacier (Adamello-Presanella group, Italian Alps). Adv. Water Resour. 2013, 55, 190–203. [Google Scholar] [CrossRef]
- World Meteorlolgical Organization. Intercomparison of Models of Snowmelt Runoff; WMO Operational Hydrology Report No 23, WMO Publ. No 646; WMO: Geneva, Switzerland, 1986. [Google Scholar]
- Kienzle, S. A new temperature based method to separate rain and snow. Hydrol. Process. 2008, 22, 5067–5085. [Google Scholar] [CrossRef]
- Forland, E.; Allerup, P.; Dahlström, B.; Elomaa, E.T.; Perälä, J.; Rissanen, P.; Vedin, H.; Vejen, F. Manual for operational correction of Nordic precipitation data. DNMI Oslo 1996, 96, 66. [Google Scholar]
- Morin, S.; Lejeune, Y.; Lesaffre, B.; Panel, J.; Poncet, D.; David, P.; Sudul, M. An 18-yr long (1993–2011) snow and meteorological dataset from a mid-altitude mountain site (Col de Porte, France, 1325 m alt.) for driving and evaluating snowpack models. Earth Syst. Sci. Data 2012, 4, 13–21. [Google Scholar] [CrossRef]
Figure 1.
(a) Precipitation gauge at Pantano d’Avio (Brescia province, see also Figure 7b) monitoring site. The tank is inside a heated housing made by SIAP (Italian weather instruments manufacturer). On the left, the heating device, activated by a thermostat, here set to 4 °C. (b) Cancano monitoring site, where a CAE PMB2 electronic tipping-bucket heated gauge (yellow circle) is installed besidea heated mechanical SIAP one (red circle). (c) Electronic tipping-bucket heated gauge model CAE PMB2 at the Aprica Magnolta (SO) monitoring site.

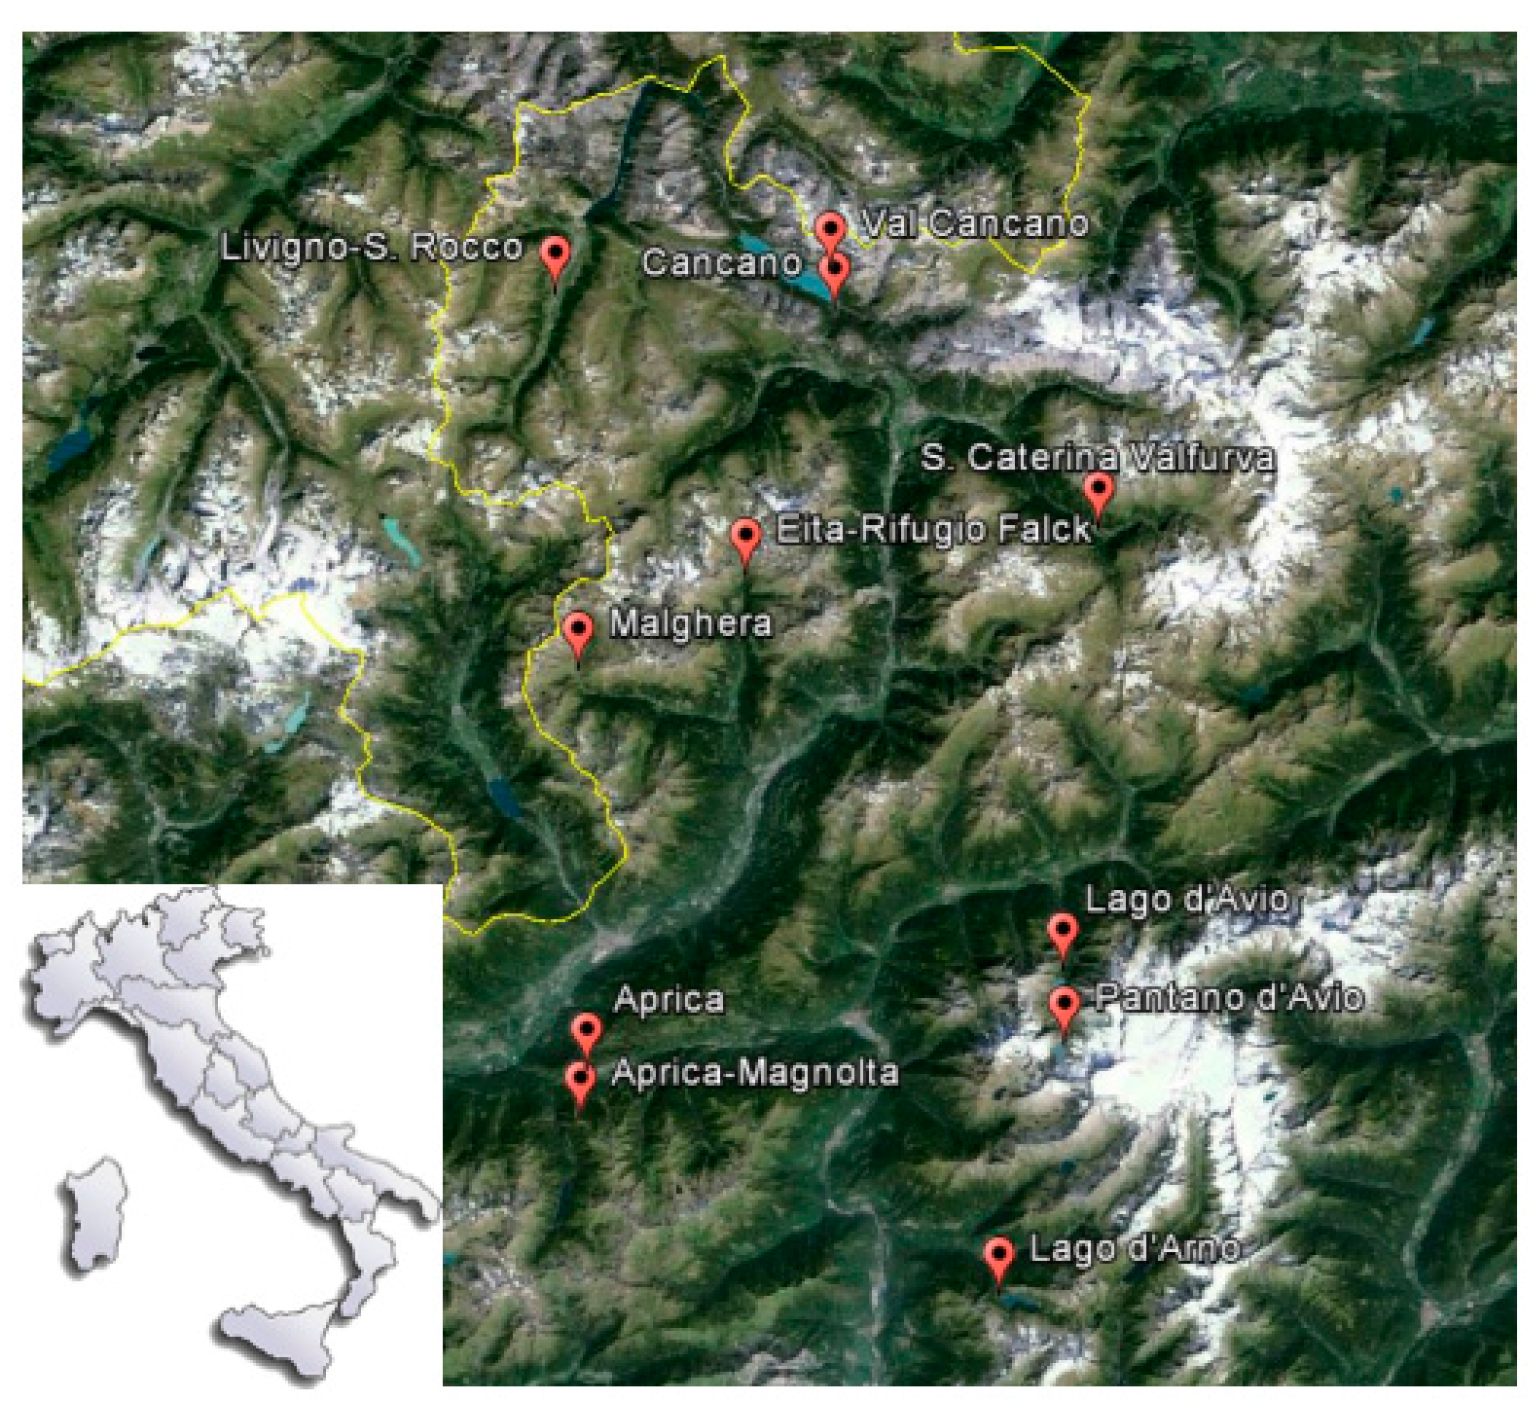
Figure 2.
Map of the sites selected for the error estimate for solid precipitation measurements through precipitation gauges in the upper Valtellina and upper Valcamonica, in Northern Italy.
Figure 2.
Map of the sites selected for the error estimate for solid precipitation measurements through precipitation gauges in the upper Valtellina and upper Valcamonica, in Northern Italy.

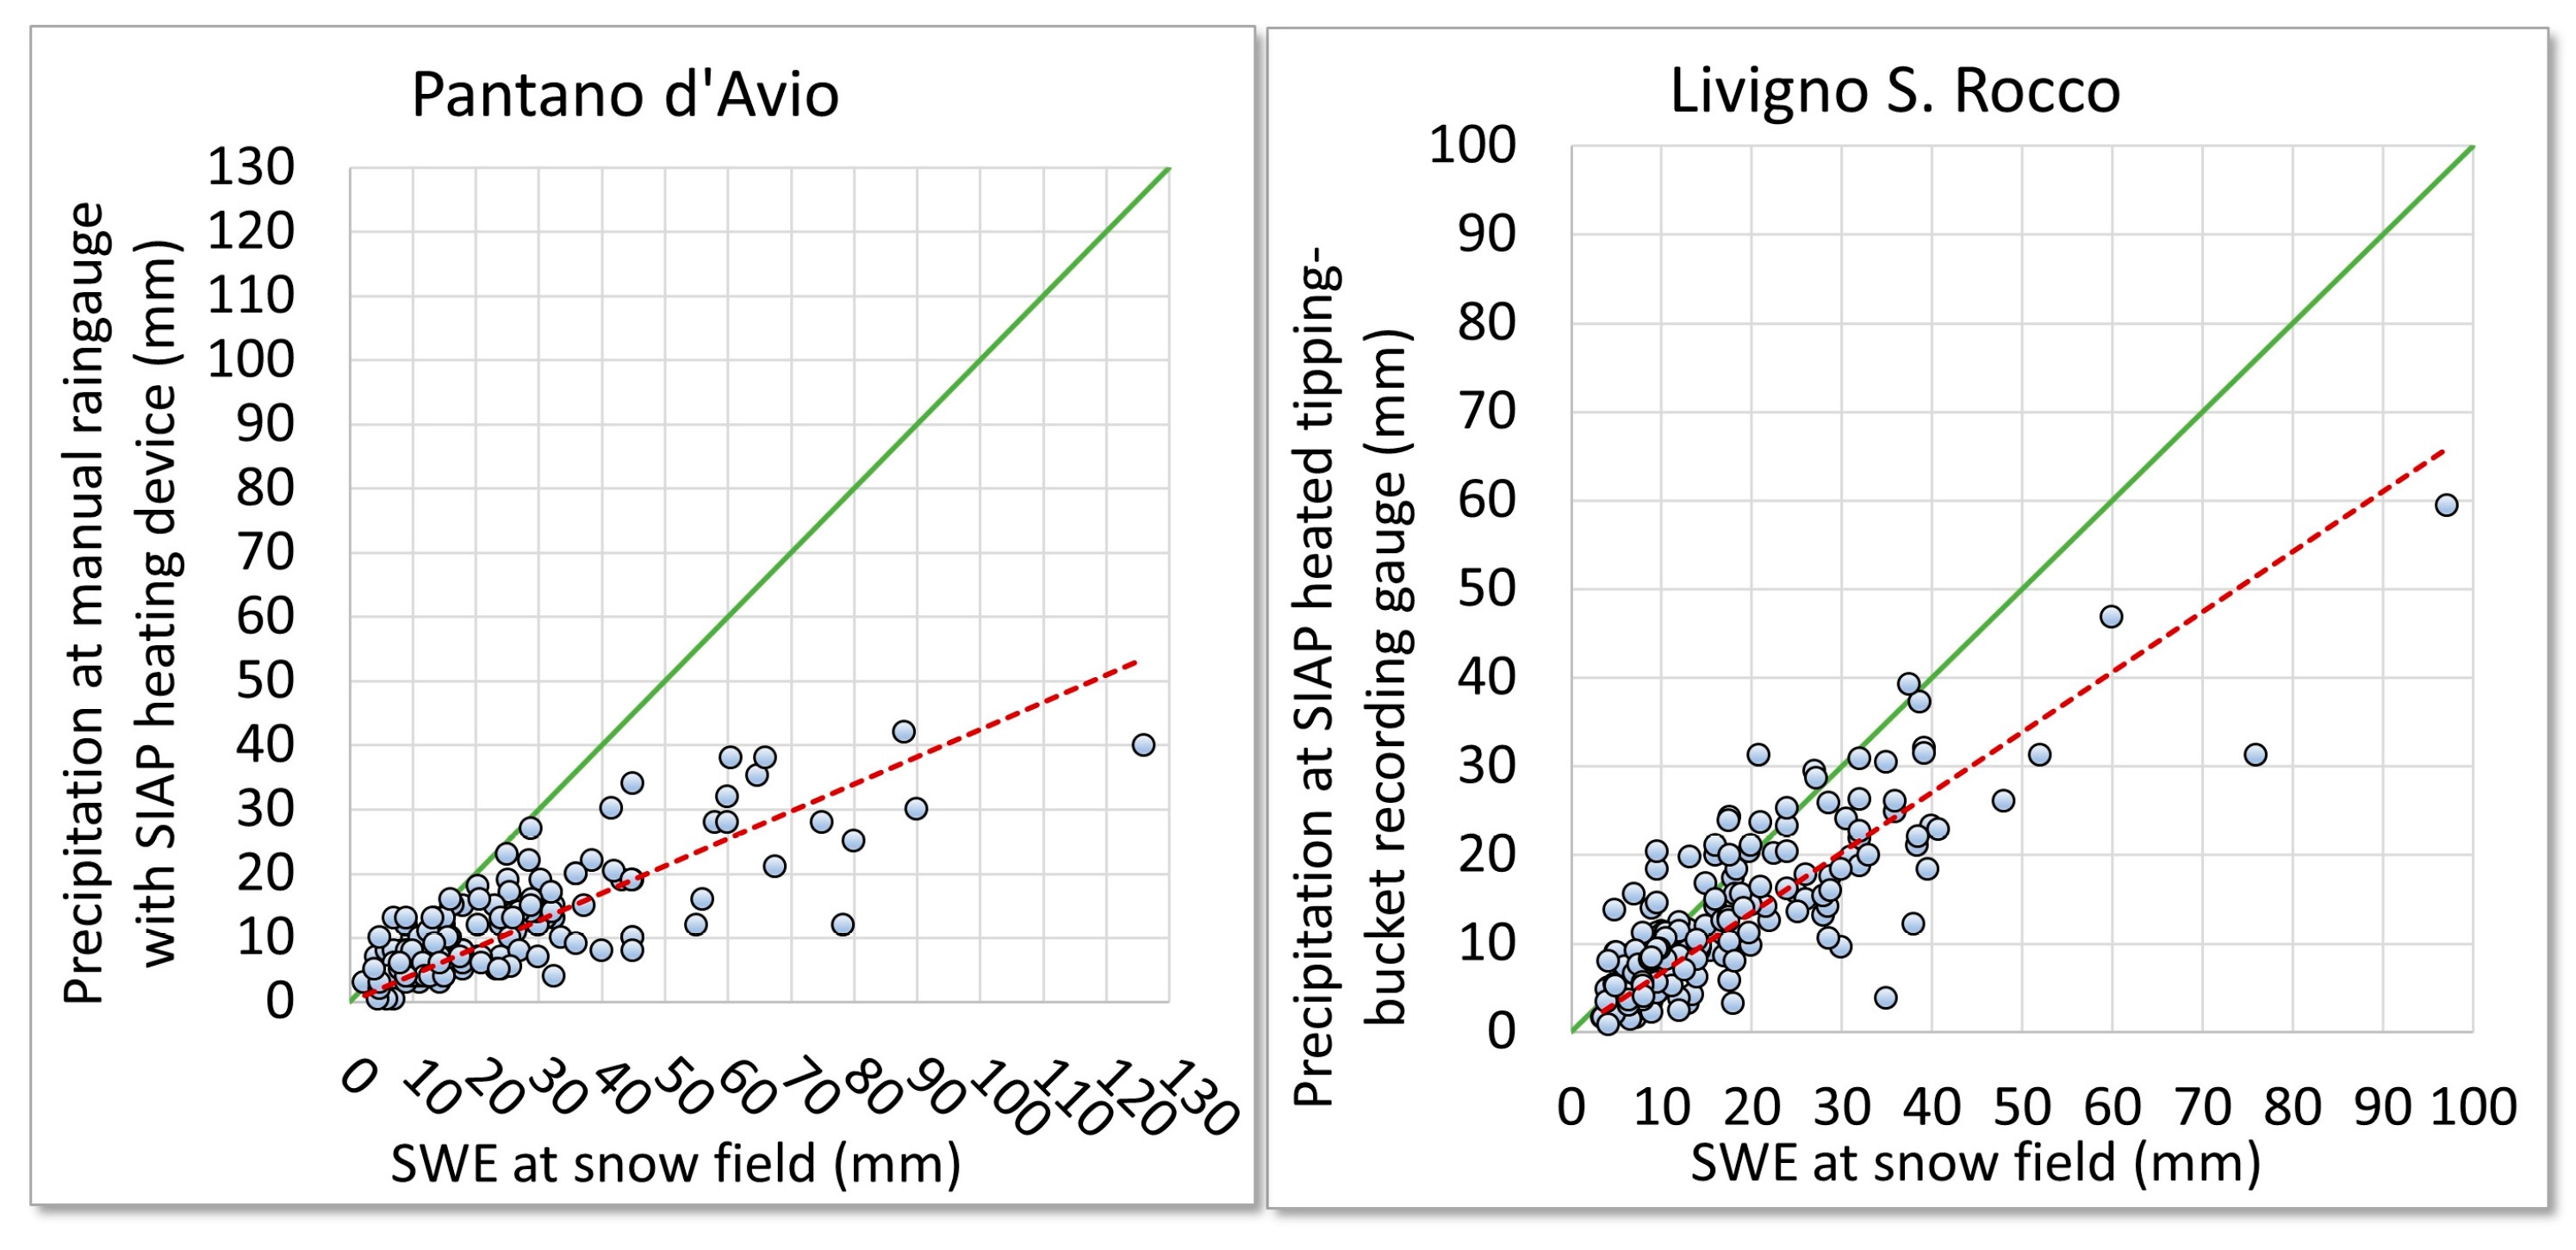
Figure 3.
Comparison between melted snow measured daily by rain gauges and SWE of freshly-fallen snow manually measured at snow field sites. Plots refer to Pantano d’Avio (2390 m a.s.l., period 1987–2014) and Livigno S.Rocco (1865 m a.s.l., period 1989–2014).
Figure 3.
Comparison between melted snow measured daily by rain gauges and SWE of freshly-fallen snow manually measured at snow field sites. Plots refer to Pantano d’Avio (2390 m a.s.l., period 1987–2014) and Livigno S.Rocco (1865 m a.s.l., period 1989–2014).

Figure 4.
(a) S. Caterina Valfurva manual monitoring site; and (b) instruments for the direct manual measurement of snow water equivalent: snow sampler and dynamometer.
Figure 4.
(a) S. Caterina Valfurva manual monitoring site; and (b) instruments for the direct manual measurement of snow water equivalent: snow sampler and dynamometer.
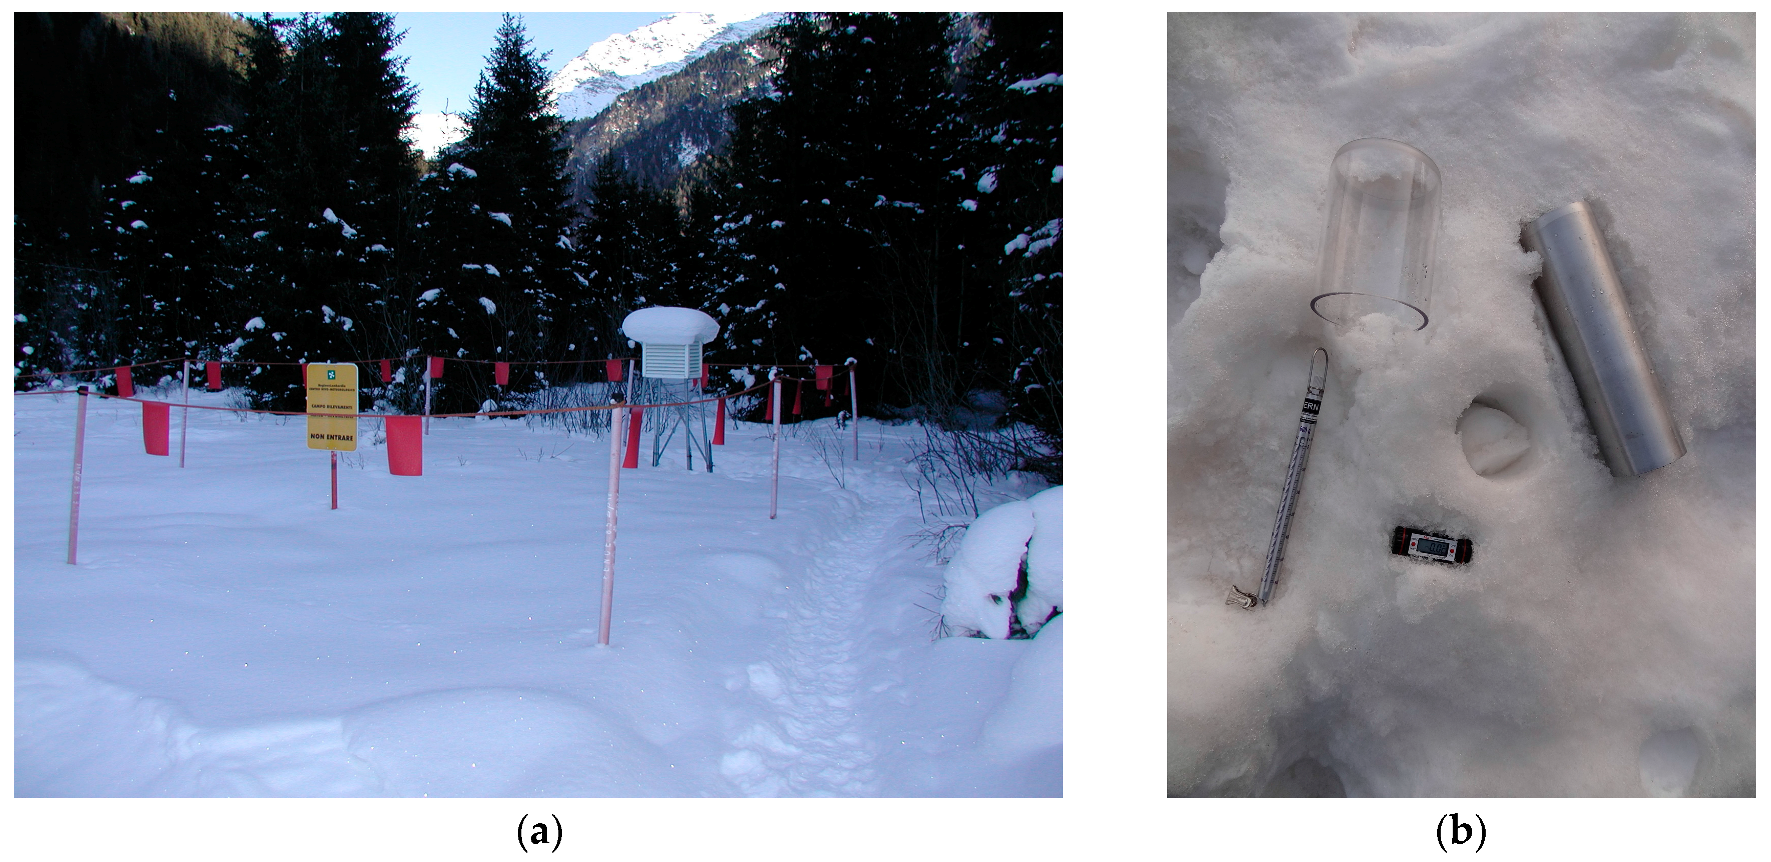
Figure 5.
(a) Val Cancano monitoring site managed by A2A equipped with Geonor T200B weighing storage gauge with an Alter-type wind-shield and snow pillow; and (b) a comparison of daily precipitation measurements: melted snow measured by the Geonor weighing storage gauge with an Alter-type wind-shield versus SWE of fresh fallen snow measured by snow pillows, for the period 2008–2014.
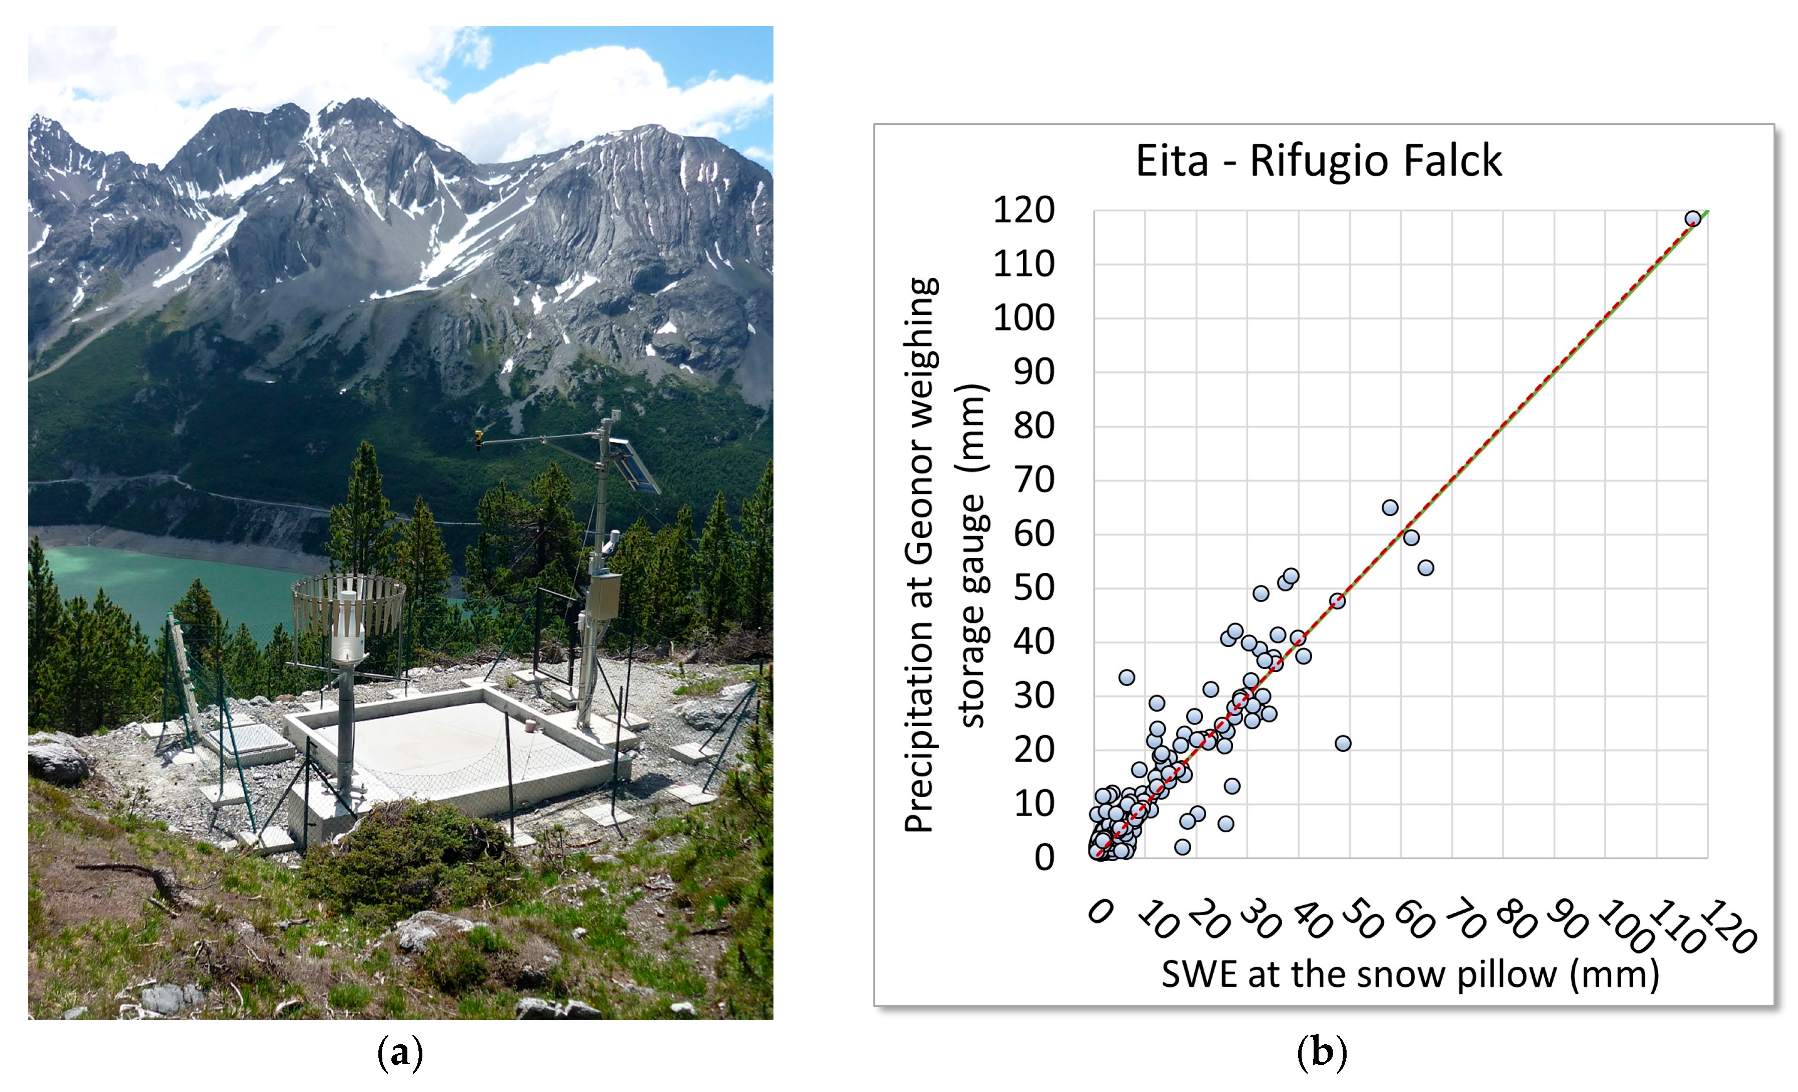
Figure 6.
(a) Variability of the coefficient αs as a function of mean daily temperature. (b) Probability density distribution of the precipitation events as a function of the daily mean temperature for the generalized sample, obtained joining many single station samples (S. Caterina Valfurva, Livigno S. Rocco, Cancano, Aprica, Lago d’Arno, Pantano d’Avio, for the time period shown in Table 1).

Figure 7.
(a) The effects of the application of the correction model to the precipitation data gathered by mechanical SIAP heated tipping-bucket recording gauges in Cancano. In the upper part, the annual values and, beneath, the monthly mean values for the 2009–2013 period also compared with the precipitation measured by the close weighing storage gauge with wind-shields at the Val Cancano monitoring site. (b) Probability part of the official Lombardy mean annual precipitation map, made in 2003 for the General Water Management and Protection Plan (PTUA). For the highlighted stations a more representative value using the correction model was estimated: the panels show a comparison between the official values with no correction (PTUA), the correction suggested by Regione Lombardia (RL), from a mean estimated SWE, and the correction suggested in this paper using the Lendvai-Ranzi model (LR). For a better comparison, the mean annual precipitation are also measured at two weighing storage gauges with wind-shields (PT) are shown.

Table 1.
Comparison between melted snow measured by precipitation gauges and SWE of freshly-fallen snow manually measured at snow field sites nearby. Instruments abbreviation: SWE = manual measurement of fresh fallen snow with snow board and cylindrical coring device; P1 = manual rain gauge with 1000 cm2 top hole and melting operation made at measuring time; P2 = manual rain gauge with SIAP heating device; P3 = mechanical SIAP heated tipping-bucket recording gauge; P4 = electronic heated tipping-bucket recording gauge CAE PMB2.
| Sites | Position WGS84 (Lat; Long) | Elevation (m a.s.l.) | Period | Wind Exposure | Wind Data Availability | Site Context | Instruments Compared | Distance SWE/SP-Px (m) | No. of Compared Measurements | Accumulated SWE (mm) | Accumulated P (mm) | Bias (%) |
|---|---|---|---|---|---|---|---|---|---|---|---|---|
| S. Caterina Valfurva | 46.410; 10.500 46.413; 10.493 | 1740 | 2001–2014 | Low | 2005–2010 | Valley, open | SWE-P3 | 590 | 75 | 866 | 649 | −25 |
| 2003–2010 | SWE-P4 | 28 | 359 | 177 | −51 | |||||||
| Livigno S. Rocco | 46.522; 10.125 | 1865 | 1989–2014 | Low | none | Valley, open | SWE-P3 | 0 | 241 | 3641 | 2662 | −27 |
| Cancano | 46.514; 10.317 46.513; 10.318 | 1950 | 1989–2013 | High | 2005–2010 | Valley, open | SWE-P3 | 120 | 301 | 5723 | 2353 | −59 |
| 2003–2010 | SWE-P4 | 73 | 1579 | 535 | −66 | |||||||
| Aprica | 46.154; 10.147 | 1180 | 1993–2014 | Low | none | Valley, garden | SWE-P1 | 0 | 66 | 1452 | 912 | −37 |
| Aprica Magnolta | 46.132; 10.140 46.129; 10.148 | 1865–1950 | 2009–2014 | Low | 2012–2014 | Slope, forest | SWE-P4 | 740 | 38 | 744 | 631 | −15 |
| Lago d’Arno | 46.048; 10.430 | 1830 | 1984–2014 | Medium | none | Slope, open | SWE-P2 | 0 | 163 | 3429 | 2597 | −24 |
| Pantano d’Avio | 46.167; 10.474 | 2390 | 1987–2014 | High | none | Slope, open | SWE-P2 | 20 | 176 | 3956 | 1909 | −52 |
| Lago d’Avio | 46.202; 10.474 | 1902 | 2003–2012 | Low | none | Valley, open | SWE-P1 | 0 | 12 | 220 | 176 | −20 |
| Eita | 46.388; 10.258 | 1950 | 2008–2014 | Medium | none | Valley, open | SP-PT | 0 | 195 | 2405 | 2554 | 6 |
| Malghera | 46.344; 10.142 | 1995 | 2008–2014 | Medium | none | Valley, open | SP-PT | 0 | 164 | 1835 | 1806 | −2 |
| Val Cancano | 46.532; 10.313 | 2190 | 2008–2014 | High | none | Slope, open | SP-PT | 0 | 254 | 2113 | 2294 | 9 |
Table 2.
Comparison between melted snow measured by Geonor weighing storage gauge with Alter windshield (PT) and SWE of fresh fallen snow measured by snow pillows (SP) installed in new A2A monitoring sites.
Table 2.
Comparison between melted snow measured by Geonor weighing storage gauge with Alter windshield (PT) and SWE of fresh fallen snow measured by snow pillows (SP) installed in new A2A monitoring sites.
| Sites | Elevation (m a.s.l.) | Period | Instruments | No. of Measurements | Accumulated SWE (mm) | Accumulated P (mm) | Bias (%) |
|---|---|---|---|---|---|---|---|
| Eita | 1950 | 2008–2014 | SP-PT | 195 | 2405.4 | 2554.3 | 6 |
| Malghera | 1995 | 2008–2014 | SP-PT | 164 | 1835.0 | 1805.7 | −2 |
| Val Cancano | 2190 | 2008–2014 | SP-PT | 254 | 2112.7 | 2294.3 | 9 |
Table 3.
Estimate of the correction factor Cs for each monitoring site and statistics of the resulting errors by considering the freshly-fallen snow water equivalent as the ‘true’ reference measurement.
Table 3.
Estimate of the correction factor Cs for each monitoring site and statistics of the resulting errors by considering the freshly-fallen snow water equivalent as the ‘true’ reference measurement.
| Sites | Elevation (m a.s.l.) | Distance (m) | Instruments | No. of Measurements | Correction Factor Cs | New Bias (%) | Errors St. Dev (mm) |
|---|---|---|---|---|---|---|---|
| S. Caterina Valfurva | 1740 | 590 | SWE-P3 | 75 | 0.30 | −3.6 | 4.9 |
| SWE-P4 | 28 | 0.80 | −11.8 | 4.3 | |||
| Livigno-S. Rocco | 1865 | 0 | SWE-P3 | 241 | 0.35 | −2.6 | 6.6 |
| Cancano | 1950 | 120 | SWE-P3 | 301 | 1.15 | −17.0 | 13.1 |
| SWE-P4 | 73 | 1.50 | −17.7 | 10.9 | |||
| Aprica | 1180 | 0 | SWE-P1 | 66 | 0.60 | −4.7 | 13.4 |
| Aprica-Magnolta | 1865/1950 | 740 | SWE-P4 | 38 | 0.11 | −6.1 | 5.8 |
| Lago d’Arno | 1830 | 0 | SWE-P2 | 163 | 0.25 | −6.9 | 10.7 |
| Pantano d’Avio | 2390 | 20 | SWE-P2 | 176 | 1.05 | −2.3 | 11.5 |
| Lago d’Avio | 1902 | 0 | SWE-P1 | 12 | 0.20 | −3.6 | 13.9 |
Table 4.
Mean yearly precipitation in some monitoring stations before and after the correction model application.
Table 4.
Mean yearly precipitation in some monitoring stations before and after the correction model application.
| Sites | No. of years | Cs | Pm (mm) | Pm,c (mm) | Error ΔP (%) |
|---|---|---|---|---|---|
| S. Caterina Valfurva | 40 | 0.3 | 860.3 | 923.6 | 7% |
| Cancano | 23 | 1.15 | 788.3 | 1055.5 | 34% |
| Pantano d’Avio | 3 | 1.05 | 1417.3 | 1897.0 | 34% |
| Lago d’Avio | 12 | 0.2 | 1263.3 | 1324.8 | 5% |
Table 5.
Data used for the verification of the correction procedure based on both temperature and wind speed data. The coefficient Cs,w is calibrated by minimising the RMSE of the corrected precipitation Pc vs. the ‘true’ value of fresh fallen snow SWE. Uncorrected rain gauge precipitation measurements are indicated by P.
| Sites | Instrument | Number of Measurements | Accumulated SWE (mm) | Accumulated Measured Precipitation P (mm) | Corrected Precipitation Pc (mm) | Error St. Dev (mm) | Event Average Wind Speed (m/s) | Annual Average Wind Speed (m/s) |
|---|---|---|---|---|---|---|---|---|
| SCP/S.Caterina Valfurva | SWE-P3 | 26 | 337.8 | 256.2 | 387.0 | 4.5 | 0.7 | 1.1 (2005–2009) |
| SWE-P4 | 26 | 337.8 | 170.2 | 264.6 | 3.3 | |||
| CAN/Cancano | SWE-P3 | 82 | 1758.3 | 650.4 | 1354.4 | 13.4 | 2.3 | 2.6 (2005–2009) |
| SWE-P4 | 71 | 1566.8 | 530.0 | 1106.1 | 9.7 | |||
| AMA/Aprica Magnolta | SWE-P4 | 37 | 694.6 | 595.4 | 991.9 | 13.4 | 1.1 | 2.2 (2012–2014) |
© 2017 by the authors. Licensee MDPI, Basel, Switzerland. This article is an open access article distributed under the terms and conditions of the Creative Commons Attribution (CC BY) license (http://creativecommons.org/licenses/by/4.0/).
Share and Cite
MDPI and ACS Style
Grossi, G.; Lendvai, A.; Peretti, G.; Ranzi, R. Snow Precipitation Measured by Gauges: Systematic Error Estimation and Data Series Correction in the Central Italian Alps. Water 2017, 9, 461. https://doi.org/10.3390/w9070461
AMA Style
Grossi G, Lendvai A, Peretti G, Ranzi R. Snow Precipitation Measured by Gauges: Systematic Error Estimation and Data Series Correction in the Central Italian Alps. Water. 2017; 9(7):461. https://doi.org/10.3390/w9070461
Chicago/Turabian StyleGrossi, Giovanna, Amerigo Lendvai, Giovanni Peretti, and Roberto Ranzi. 2017. "Snow Precipitation Measured by Gauges: Systematic Error Estimation and Data Series Correction in the Central Italian Alps" Water 9, no. 7: 461. https://doi.org/10.3390/w9070461
Note that from the first issue of 2016, this journal uses article numbers instead of page numbers. See further details here.