Early Warning and Forecasting System of Water Quality Safety for Drinking Water Source Areas in Three Gorges Reservoir Area, China

1
Key Laboratory of Regional Energy and Environmental Systems Optimization, Ministry of Education, North China Electric Power University, Beijing 102206, China
2
Institute for Energy, Environment and Sustainable Communities, University of Regina, Regina, SK S4S 7H9, Canada
*
Author to whom correspondence should be addressed.
Water 2017, 9(7), 465; https://doi.org/10.3390/w9070465
Submission received: 7 April 2017
/
Revised: 17 June 2017
/
Accepted: 22 June 2017
/
Published: 28 June 2017
(This article belongs to the Special Issue Modeling of Water Systems)
Abstract
:Nowadays, the effects of water pollution accidents on water quality safety and regional residents’ living have attracted worldwide attention. Therefore, the objective of this research is to propose an early warning and forecasting model and develop a visual system of water quality safety for drinking water source areas in the Three Gorges Reservoir Area under accident conditions. Based on an Instantaneous Point Source Two-dimensional Water Quality Model and the security requirements of water quality, an early warning and forecasting model was presented, and then the system was advanced by a MATLAB platform. In addition, a hypothetical case was also carried out for the Fenghuangshan drinking water source area. Within 0.040 h to 0.096 h after the accident, the water quality could meet the standard, and the warning level was primary and intermediate, sequentially. From 0.096 h to 11.960 h after the accident, the pollutant concentration exceeded the standard, under which conditions advanced warning started. Then the intermediate and primary warnings restarted in sequence until the pollutant concentration decreased to the background value. Therefore, the proposed model could accurately predict the spatial-temporal change trend of pollutant concentration, and the developed system could efficiently realize early warnings and the forecasting of water quality safety.
1. Introduction
Nowadays, the water quality of drinking water source areas affects public health and regional economic development directly. Therefore ensuring the drinking water source area is safe is an important issue in the field of water environment management [1,2,3,4]. The Three Gorges Reservoir Area (TGRA) extends over 600 km, where 17 cities with more than 1700 industrial enterprises are located and thousands of commercial boats transport every year [5,6,7]. Such conditions place drinking water source areas in the TGRA at serious risk of being polluted. Early warning and forecasting of water quality safety are very important for drinking water source areas, and the TGRA has become a hot spot in recent years [8,9,10]. An early warning and forecasting model is a useful tool for predicting spatial-temporal change trends of pollutant concentration. In addition, developing an early warning and forecasting system is significant to realize the visual early warnings and to forecaste water quality safety and provide decision support for the administrators of drinking water safety, water environment protection, and emergency response.
Presently, models and systems for monitoring and predicting water quality safety have become focuses in the field of water resource protection and management [11,12,13,14,15]. He et al. developed an integrated geographic information system based on a water pollution management information system for the TGRA that could predict the transfer and diffusion processes of pollutants and support water pollution emergency management [16]. Zhang applied the one-dimensional river quality system dynamics model to forecast water quality change, constructed the conceptual Geographic Information System—System Dynamics (GIS-SD ) frame, and developed the experimental system of water quality simulation under water pollution accidents based on the system dynamics model [17]. Kundzewicz et al. carried out continuous water quality monitoring and predictive analyses at regional and local scales, based on which sustainable water resource management was also advanced [18]. However, they still had two major limitations. One is that previous research mainly focused on a water quality model, which can hardly support early warnings of water quality safety; another is that real-time and visual early warnings and forecasting systems of water quality safety were scare. As effective measures to mitigate those concerns, models and systems for the early warning and forecasting of water quality safety are desired.
Therefore, the objective of this study is to propose an early warning and forecasting model of water quality safety for drinking water sources in the TGRA and to develop a related early warning and forecasting system. In this research, an early warning and forecasting model will be proposed according to hydrodynamic conditions and warning levels. Then, theearly warning and forecasting system will be developed on the basis of real-time water quality monitoring, wireless transmission, databases, and early warning and forecasting models. Finally, a hypothetical will be carried out in which spatial distribution and the temporal change trend of a pollutant influence the degree of the accident, and the warning level will be obtained. The study would give relative researchers a professional and online method and system to forecast future diffusion and transport processes and to determine the warning level of a drinking water source area under accident conditions. Moreover, it may also provide an efficient tool and decision support in the early warning and forecasting of water quality safety for administrators of water resource management.
2. Materials and Methods
2.1. Study Area
The Yangtze River is the largest river in China, and the TGRA is in its middle reach. The TGRA, extending from Yichang of Hubei province to Banan district of Chongqing Municipality (600 km), covers 29°07′48.4′′ N to 30°57′34.3′′ N, 106°07′24.4′′ E to 110°45′32.7′′ E. Drinking water source areas in the TGRA provide drinking water for 129 towns with a population of more than 1.170 million and have great importance for local residents’ life and regional economic development [19,20,21,22,23]. However, the water quality safety of drinking water source areas in the TGRA is facing a threat caused by shipping, industry discharge, and nonpoint source pollution. The location of drinking water source areas in the TGRA is as Figure 1 shows. In this study, the research subjects are drinking water source areas of the TGRA not the whole water body of the TGRA. According to the national divisions for drinking water source areas, the length and width of drinking water source areas of the TGRA are about 1 or 2 km (Figure 1). Consequently, it could be concluded that the flow direction is roughly straight in a drinking water source area, and that the direction of steam flow is stable. The interactions between flow, bed, and bank, as well as turbulent flow and water swing could be ignored for a drinking water source area.
2.2. Methodology
2.2.1. Early Warning and Forecasting Model
To realize the early warning and forecasting of water quality safety for drinking water source areas in the TGRA, a new warning and forecasting model is developed by the following steps. If an accident occurs in flood season, the pollutants spread rapidly, and therefore the influence of the accident on a drinking water source area is relatively small due to its fast flow. If an accident occurs in the dry season, the effects may be more serious and the influence will last a relatively long period of time due to its slow flow. Hence, the model in this study aims at the latter with a slow flow considering that early warnings and forecasting for those accidents are more urgent and important. First, we define the boundary conditions of a drinking water source area after an accident, including water flow, water level, and pollutant concentration, based on:
where C is the pollutant concentration in mg/L, t is time in h, ux is the water flow rate in x directions in m2/s, x is longitudinal distance from the origin in m; Dx is the diffusion coefficient in x directions in m2/s; and K refers to the rate constant of pollutant degradation in s−1 [24]. Secondly, we calculate the pollutant concentration of the drinking water source area in the TGRA by the Instantaneous Point Source Two-dimensional Water Quality Model, which can be expressed as [25,26,27]:
where C is the pollutant concentration in mg/L, t is time in h, ux and uy are the water flow rates in the directions of x and y, respectively, in m2/s, Dx and Dy are the diffusion coefficients in the directions of x and y, respectively, in m2/s, x and y are the longitudinal and transverse distances from origin in m; and K refers to the rate constant of pollutant degradation caused by suspended solid adsorptions and plant absorptions in s−1. In Formula (2), is the sum of the concentration changes in directions of x and y caused by flow rates during the period of ∆t, while is that in directions of x and y caused by turbulent diffusion. Then, the level of early warning (EW) can be determined as:
where C is the pollutant concentration in mg/L, CB is the background value of the pollutant concentration in mg/L, CS is the standard value of the pollutant concentration in mg/L, and CA is the average value of the background concentration and the standard one in mg/L. The pollutant concentration C is obtained by monitoring or Formula (2), the background value (CB) is the long-term average annual value of the monitoring data for the pollutant, and the standard value (CS) is the concentration that meets the requirements of level III in the ‘Environmental quality standards for surface water (GB3838-2002)’. For Formula (3), the values of EW represent three grades. If EW is a negative number, the pollutant concentration exceeds the background value and primary warning starts. Under this condition, the water quality of the drinking water source area has been affected, and the relevant departments should strengthen water quality monitoring and find the pollution source timely and accurately. If EW is between 0 and 1, pollutant concentration will reach the standard value and the intermediate warning initiates. At that time, there is a risk of the pollution concentration exceeding the related standard, and the related departments should take emergency management to assure the drinking water supply of the drinking water source area. If EW is more than 1, the pollutant concentration exceeds the standard value and advanced warning begins. In this circumstance, the water quality of the drinking water source area is seriously polluted and water withdraw must be suspended. Through an early warning and forecasting system of water quality safety, the influence degree of an accident can be obtained, the spatial-temporal change trend of a pollutant can be predicted, the warning level can be determined, and an early warning signal can be released.
2.2.2. Early Warning and Forecasting System
The development process for the early warning and forecasting system of water quality safety included system framework building, system construction, system function analysis, and system debugging. The main works for the phases were as follows. Firstly, the framework of the early warning and forecasting system was built, which consisted of a database, a model library, a system development platform, and the C# or FORTRAN language program. Secondly, the early warning and forecasting system of water quality safety was constructed by the following steps. Data were collected, which included the degradation coefficient and the diffusion coefficient acquired by references, empirical formulas, and monitoring data of the water quality and flow rate (mentioned specifically in Section 2.3). Then the database was built on the basis of data processing. The early warning and forecasting model was determined based on the hydrodynamic conditions of drinking water source areas. The procedure code of early warning and forecasting system was written by the MATLAB platform, considering its powerful spatial data analysis and expression ability. In the MATLAB and C language development environment, a system interface was designed that integrated the input data, the early warning and forecasting model, output data, and the result expression to an organic whole. It had a friendly interface, convenient operation, and comprehensive function [28,29]. Thirdly, a two-dimensional water area was generalized and a spatial grid was discretized by MATLAB. Furthermore, a two-dimensional orthogonal grid could be generated, velocity and concentration fields of the simulation area were obtained, and then contaminant concentration forecasting for drinking water source areas could be realized once they were influenced and polluted. In addition, the grid resolution of this system was 1 m. By the early warning and forecasting model, the maximum concentration of a pollutant in a drinking water source area could be calculated, the warning level could be determined, and an early warning signal could be released, by which a real-time and efficient early warning of the drinking water source area could be realized. In the system, the primary warning, intermediate warning, and advanced warning for Formula (3) correspond to yellow, orange, and red signals respectively. Finally, system debugging, including encoding debugging and function debugging, was carried out, and then the early warning and forecasting system could be applied [30]. The values involved in the warning system were the output data from the forecasting model, which referred to the transverse diffusion coefficient, the vertical diffusion coefficient, the degradation rate of pollutants, time, flow rate, and so on. As far as the computing time was concerned, for one pollutant in a drinking water source area, it was about 2 min once an accident occurred.
In a word, the early warning and forecasting system has some advantages in that its output results are visual and the released early warning signal is timely. However, the system installation costs 20 min, which needs to be optimized.
The system contained a login and register module, a data process module, and an early warning and forecasting module. Specifically, users could login and register the system by the main interface of the register and login module; data could be collected and processed through the data process module, meanwhile users could input and modify parameters; and early warning and forecasting under different accident conditions could be achieved utilizing the early warning and forecasting module (Figure 2). From Figure 2, users could get information on the present pollutant concentrations and the current early warning level for a drinking water source area. Then users could input parameters again by clicking the modify parameters button and obtain the forecasting results by the forecasting button.
2.3. Data
The data available for this study included: (i) water flow and level data of the TGRA monthly from 2013 to 2014 provided by the China Three Gorges Corporation ; (ii) profile maps of sections of the drinking water sources area (2015) supplied by the China Three Gorges Corporation; (iii) terrain data of drinking water source areas for the TGRA obtained from the Zigui Environmental Protection Bureau; (iv) monthly concentrations of three water quality parameters and 24 kinds of pollutants (Temperature, pH, DO, CODMn, COD, BOD5, NH3-N, TP, Cu, Zn, F, Se, As, Hg, Cd, Cr6+, Pb, CYN, VP, Oils, a-SAA, S2−, E. coil (MPN/L), SO42−, Cl−, NO3−, Fe, Mn) in drinking water source areas for the TGRA during 2013 to 2014 obtained from regional environmental protection bureaus; and (v) the flow velocity of drinking water source areas for the TGRA during 2013 to 2014 in different (transverse, longitudinal, vertical) directions gained from China Three Gorges University. In addition, it measured the process referred to by the Beijing 1954 coordinate system and the 1985 national elevation datum. In this research, the transverse diffusion coefficient Dy (diffusion coefficient in y direction) was obtained by empirical formula:
where α was the transverse diffusion coefficient with the dimension of 1 (empirical value for straight natural rivers 0.100~0.150 being adopted in this research); H was the average water depth of a river, m; and u* was the friction velocity, m/s. In addition, u* was calculated by Formula (5):
where g referred to the acceleration of gravity, m/s2; i referred to average hydraulic grade of a river; and meanings of the other symbols were the same as those in Formula (4).
As for the longitudinal dispersion coefficient Dx (diffusion coefficient in x direction, m2/s), it was calculated by the empirical Formula (6):
In this research, the degradation coefficient of Total Phosphorus (TP), K, was obtained by the empirical Formula (7):
where K was rate constant of pollutant degradation in 1/s and Q was flow rate from original cross section in m3/s [24].
Velocity in x direction ux (m/s), velocity in y direction uy (m/s), the transverse distance from the origin y (m), and water depth H (m) were obtained by monitoring.
3. Case Study
To illustrate the system function of early warning in different levels and forecasting for the pollutant concentration change trend, the early warning and forecasting for the TP pollution accident that occurred in the Fenghuangshan drinking water source area (FDWSA) was carried out. FDWSA is a river-type drinking water source area located in the TGRA and covers 110°58′30′′ E to 111°1′30′′ E and 30°49′30′′ N to 30°51′0′′ N. According to the national divisions for drinking water source areas, the length of the FDWSA is 1100 m (from 100 m upstream to 1000 m downstream of the water intake), the width is that of the river (2000 m), and the area is about 2.2 km2. Water is withdrawn from the center of the drinking water source area to the amount of 18,000 m3/day and services a population of 80,000. According to the related division standard, the FDWSA is an important drinking water source area, and its water quality should meet the requirements of level III in ‘Environmental quality standards for surface water (GB3838-2002)’.
As far as the actual situation is concerned, the FDWSA faces greater risks of TP pollution, considering that there are several phosphorus mines around. Meanwhile, TP is an important cause of the eutrophication of the background and standard concentration values, which are 0.090 mg/L and 0.200 mg/L, respectively, in the FDWSA. The location of the FDWSA is as Figure 3 shows. The dry season was selected as the early warning and forecasting period in this case considering that it has slower water flow and poorer self-purification capacity compared to flood season. It was supposed that 1 t TP was released to the FDWSA instantaneously, and the accident origin lay in the middle of the river (1 km upstream of the water intake), the coordinate of which was (0, 0). The parameters used in this case were listed in Table 1. Moreover, the early warning and forecasting time was from accident occurrence (T = 0) to TP concentration reducing to the background value; the early warning and forecasting range was the whole drinking water source area.
In Table 1, there were the parameters of the FDWSA in dry season. This study was carried out based on the ideal circumstance that there was no turbulent flow and water swing and that the surface of the river was smooth. Furthermore, the method of sensitivity analysis was carried out to examine the impact of each parameter on TP pollution early warning and forecasting in this study. All of the parameters in Table 1 were analyzed by means of a multiple regression method in which only one value of a parameter changed when other parameters remained unchanged. Firstly, K was analyzed by raising and reducing its value by 10% and 20%, respectively, under the occasion that other parameters remained unchanged. Secondly, the model was operated, as long as the value of K changed and output the TP concentration. Finally, the operations for other parameters were the same as for K. A sensitivity analysis was carried out for water intake, the coordinate of which was (1000, 0) under the conditions that time was 10 h and the instantaneous point source item was 1000 kg. The results of the sensitivity analysis were shown in Table 2.
It can be known from Table 2 that TP concentration change has a negative correlation relation with K, Dx, Dy, and Uy, while it has positive correlation relation with Ux. Among these parameters, Dy has the greatest influence on the results of early warning and forecasting, and K has the minimum influence. The sensitivity of a parameter is expressed as [31]:
where S is the sensitivity of parameter, Yi is the output value when the model is operated i times, Yi+1 is the output value when the model is operated i + 1 times, Y0 is the initial value, Pi is the percentage change of parameter value when the model is operated i times, Pi+1 is the percentage change of parameter value when the model is operated i + 1 times, and n is the number of times of operation. According to the sensitivity analysis, the order of parameter sensitivity was |SDy| > |SUx| > |SDx| > |SUy| > |SK|.
4. Results and Discussion
4.1. Early Warning and Forecasting for Water Intake
Considering that water was withdrawn directly from the water intake, it was regarded as a sensitive point of water quality, wherein it was closely related to the quality of residents’ drinking water. Therefore, the early warning and forecasting of TP concentration at the water intake was advanced in that the simulation duration went from the accident occurrence to when TP concentration reduced to the background value. Figure 4 is the early warning and forecasting of TP concentration at the water intake after the accident. From Figure 4, it could be seen that the pollutant concentration showed a reverse-U tendency, with a maximum of 11.870 mg/L at 0.770 h after the accident due to diffusion and transport effects. Compared to the background value, it could be found that the water there was influenced by the accident from 0.050 h to 21.030 h afterwards. In addition, the pollutant concentration at the water intake exceeded the standard from 0.120 h to 9.872 h after the accident, which indicated that the water there was seriously polluted by the accident during the period and could serve as a source of drinking water.
In Table 3 as well, there were five levels of early warning and their times after the accident and their durations reflected the whole process of TP pollution during the whole accident. From Figure 4, it could be known that the water at the point of intake was affected from 0.050 h after the accident, TP concentration began to raise from 0.090 mg/L (background value), and the primary warning for the water intake started. After 0.059 h, the TP concentration reached 0.145 mg/L and the level of early warning upgraded to intermediate, which indicated that there was a risk of TP concentration at the water intake of exceeding the standard and that emergency plans should be launched. Then TP concentration had exceeded the standard (0.200 mg/L) during the period from 0.120 h to 9.872 h after the accident, leading to advanced warning. In particular, TP concentration reached the maximum value (11.870 mg/L) at 0.770 h after the accident, which was much higher than the standard one. Therefore, water withdrawal should be suspended and emergency measures should be taken. After that, TP concentration began to decrease and was reduced to 0.200 mg/L at 9.872 h after the accident, so there was a return to the intermediate warning level. After 1.558 h, TP concentration decreased to 0.145 mg/L and primary warning level was initiated; 9.590 h later, TP concentration dropped to the background value and the effects of the accident were eliminated.
4.2. Spatial-Temporal Change of the Maximum Concentration
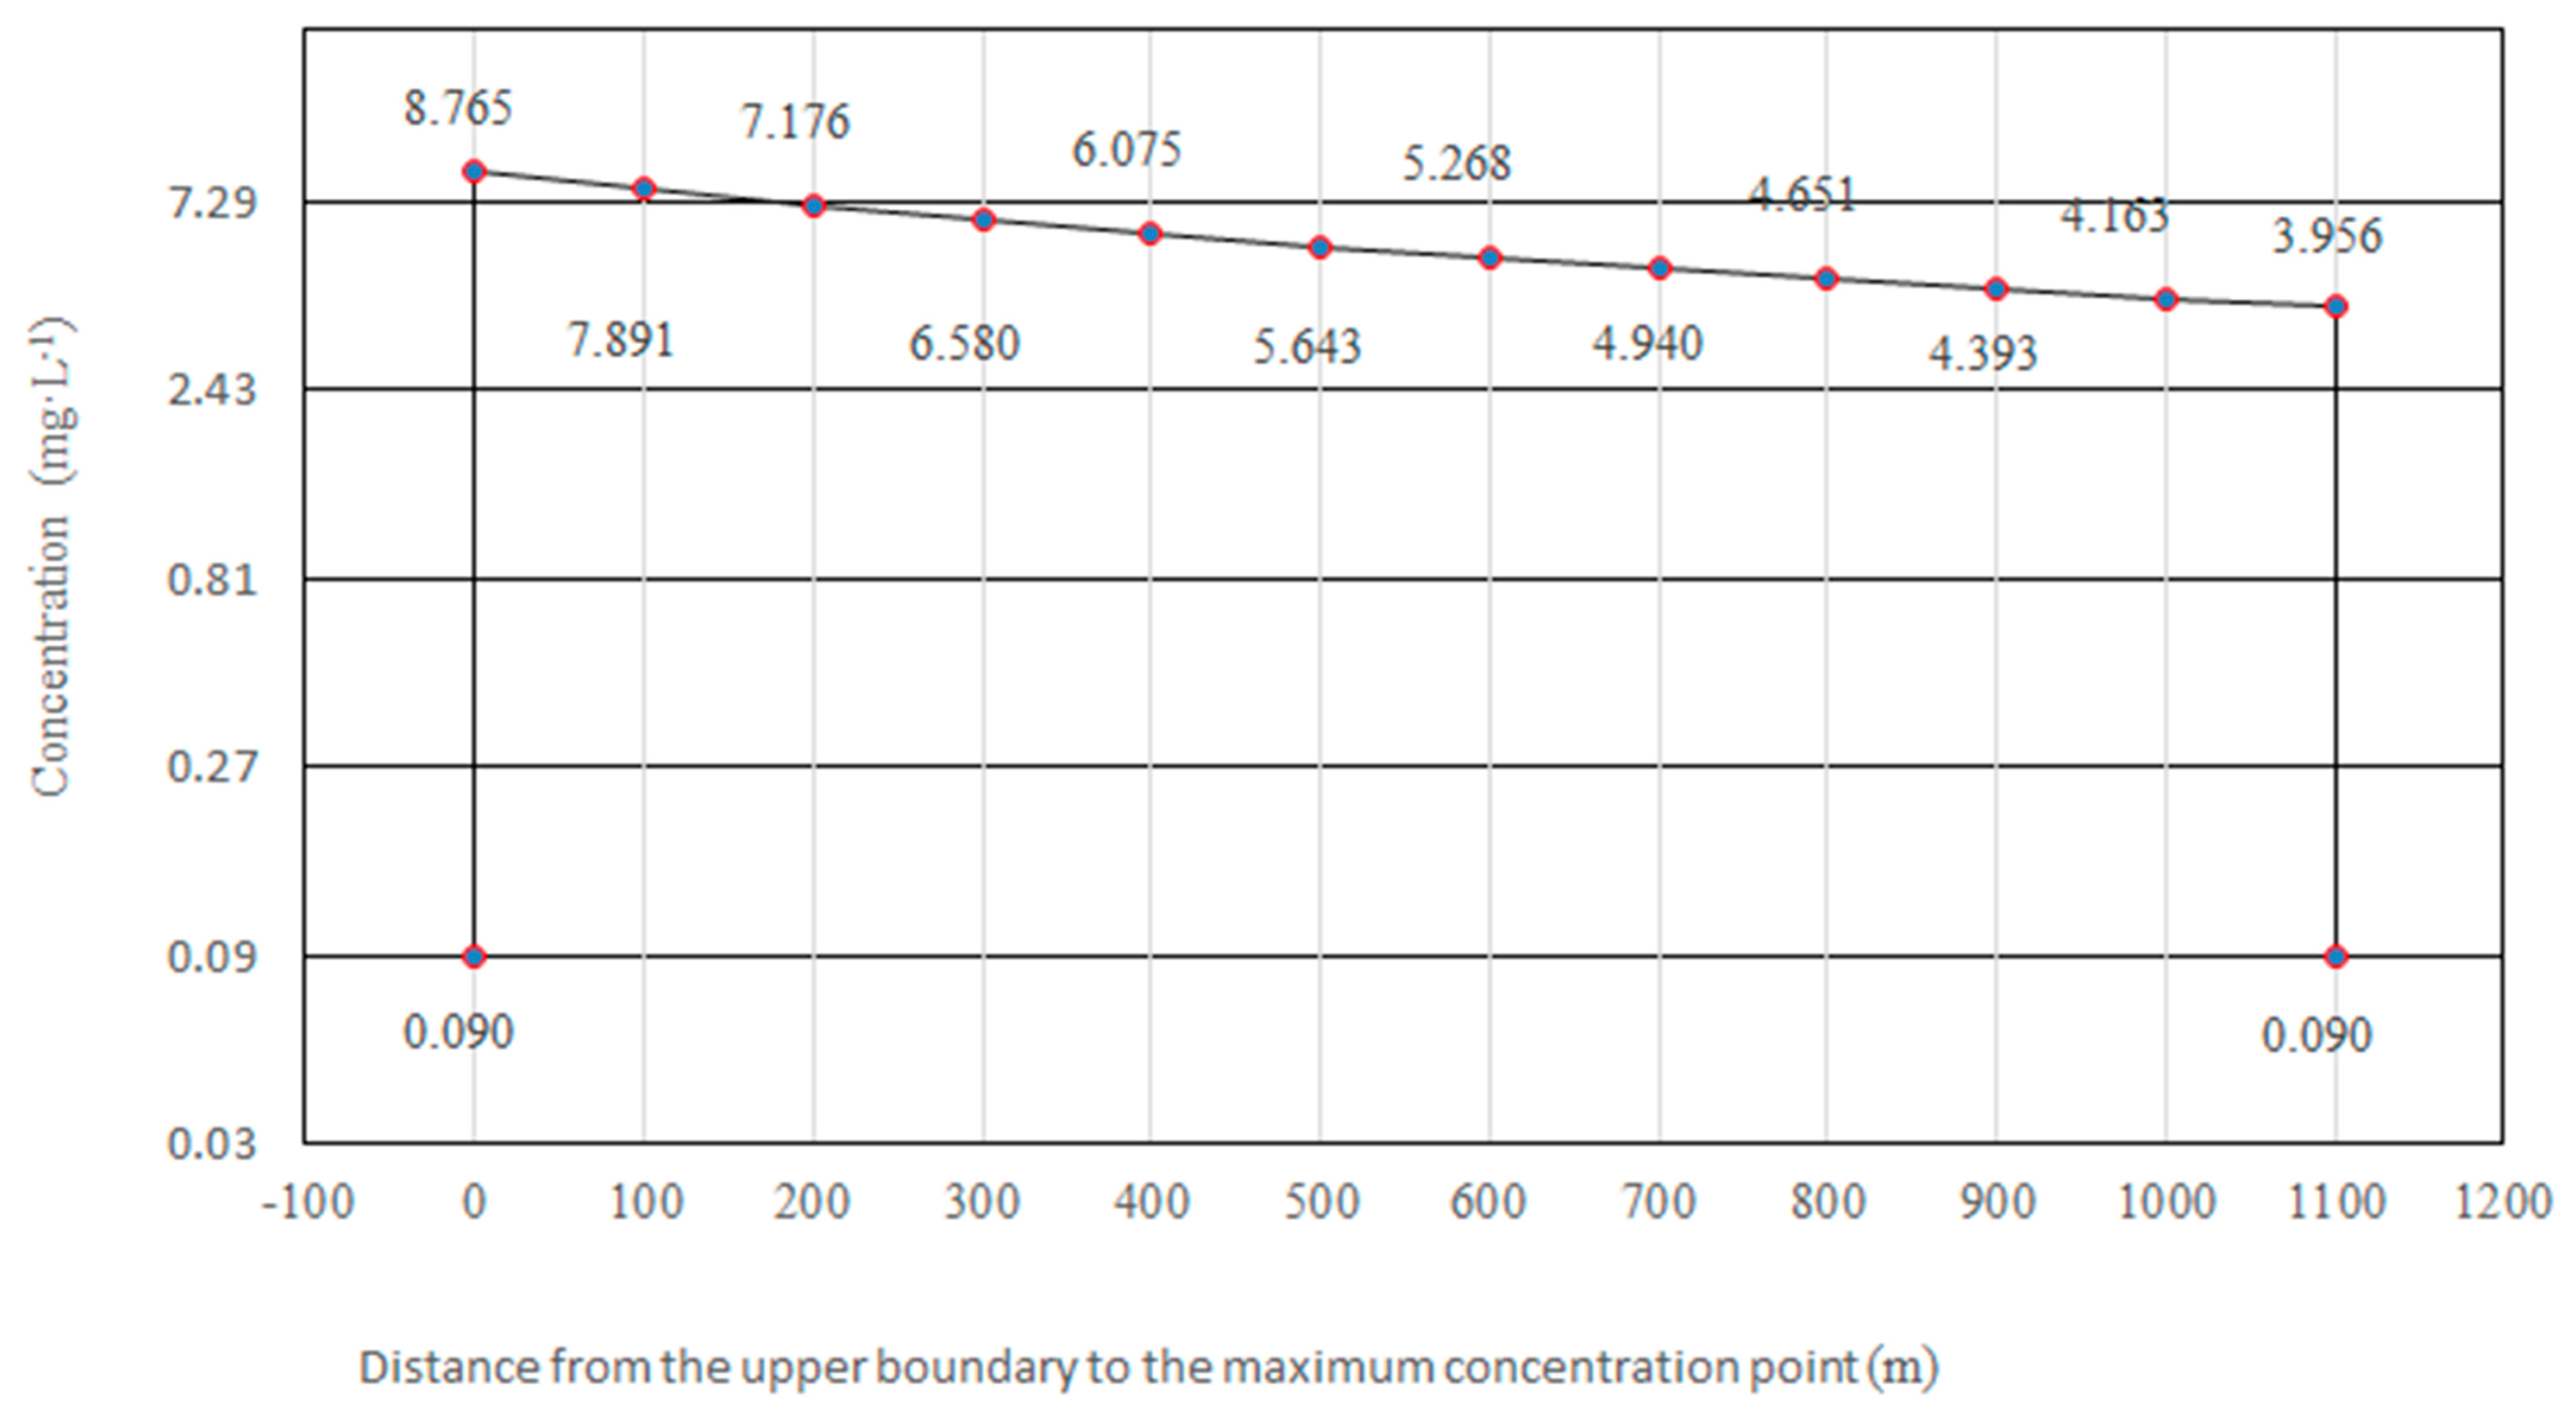
The process of pollutant transport was point source diffusion and TP concentration presented center distribution, which lead to the maximum value in the center of the pollutant group. For the study area, the spatial-temporal change of the maximum concentration for TP was simulated, as Table 4 and Figure 5 show. After the accident, the location of the maximum concentration migrated downstream from the accident origin to the upper boundary of the FDWSA, which was caused by water flow in the x direction. From 0.040 h to 1.481 h after the accident, the maximum concentration rose from 0.090 mg/L to 8.765 mg/L which always appeared in the upper boundary. At 0.040 h after the accident, the instantaneous point source had enlarged into a pollutant group and entered into the FDWSA, and then the maximum concentration of the pollutant group approached the upper boundary gradually and reached it at 1.481 h after the accident. Namely, the maximum concentration of the pollutant group did not arrive in the FDWSA (the upper boundary) until 1.481 h after the accident. During the period of 1.481 h to 3.291 h after the accident, the maximum concentration migrated downstream and decreased from 8.765 mg/L to 3.956 mg/L. The reason is that the initial value was much larger than the subsequent ones and reduced gradually due to the effects of diffusion and transport. Finally, the maximum concentration appeared in the lower boundary from 3.291 h to 24.030 h after the accident with a dropping value between 3.956 mg/L and 0.090 mg/L. Specifically, the maximum concentration of the pollutant group emerged in the lower boundary and then was away from the FDWSA. However the whole pollutant group moved out of the FDWSA until the effects of the accident were eliminated entirely. Therefore, the maximum concentration of appeared in the lower boundary of the FDWSA for 20.739 h.
4.3. Spatial-Temporal Change of TP Concentration
As far as study area was concerned, the spatial-temporal change of TP concentration could effectively reflect the influence, scope, and degree of the accident. Therefore, TP concentration change was revealed for the study area within four hours, after which the maximum concentration migrated out of the FDWSA. Figure 6 reflected the spatial-temporal change of TP concentration in the FDWSA within four hours. Specifically, Figure 6a–d, reflected the spatial distribution of TP concentration in the FDWSA at 1.0 h, 2.0 h, 3.0 h, and 4.0 h after the accident, respectively. From Figure 6, it could be known that the pollutant moved downstream with an increasing pollution area but a decreasing TP concentration, which was mainly caused by transverse and longitudinal diffusions and affected by their speeds. Furthermore, the reasons for the decrease of TP concentration were the degradation and transportation of the pollutant, as well as the self-purification of the water body.
4.4. Early Warning and Forecasting for FDWSA
On the basis of the spatial-temporal change of the pollutant, the early warning and forecasting of TP concentration for the whole drinking water source areas were advanced through an early warning and forecasting system in which the duration was from accident occurrence (T = 0) to when TP concentration reduced to the background value. In fact, the pollutant concentration of water source areas had spatial heterogeneity, and therefore the level of early warning was determined by the maximum concentration to ensure the safety of the FDWSA (Table 5).
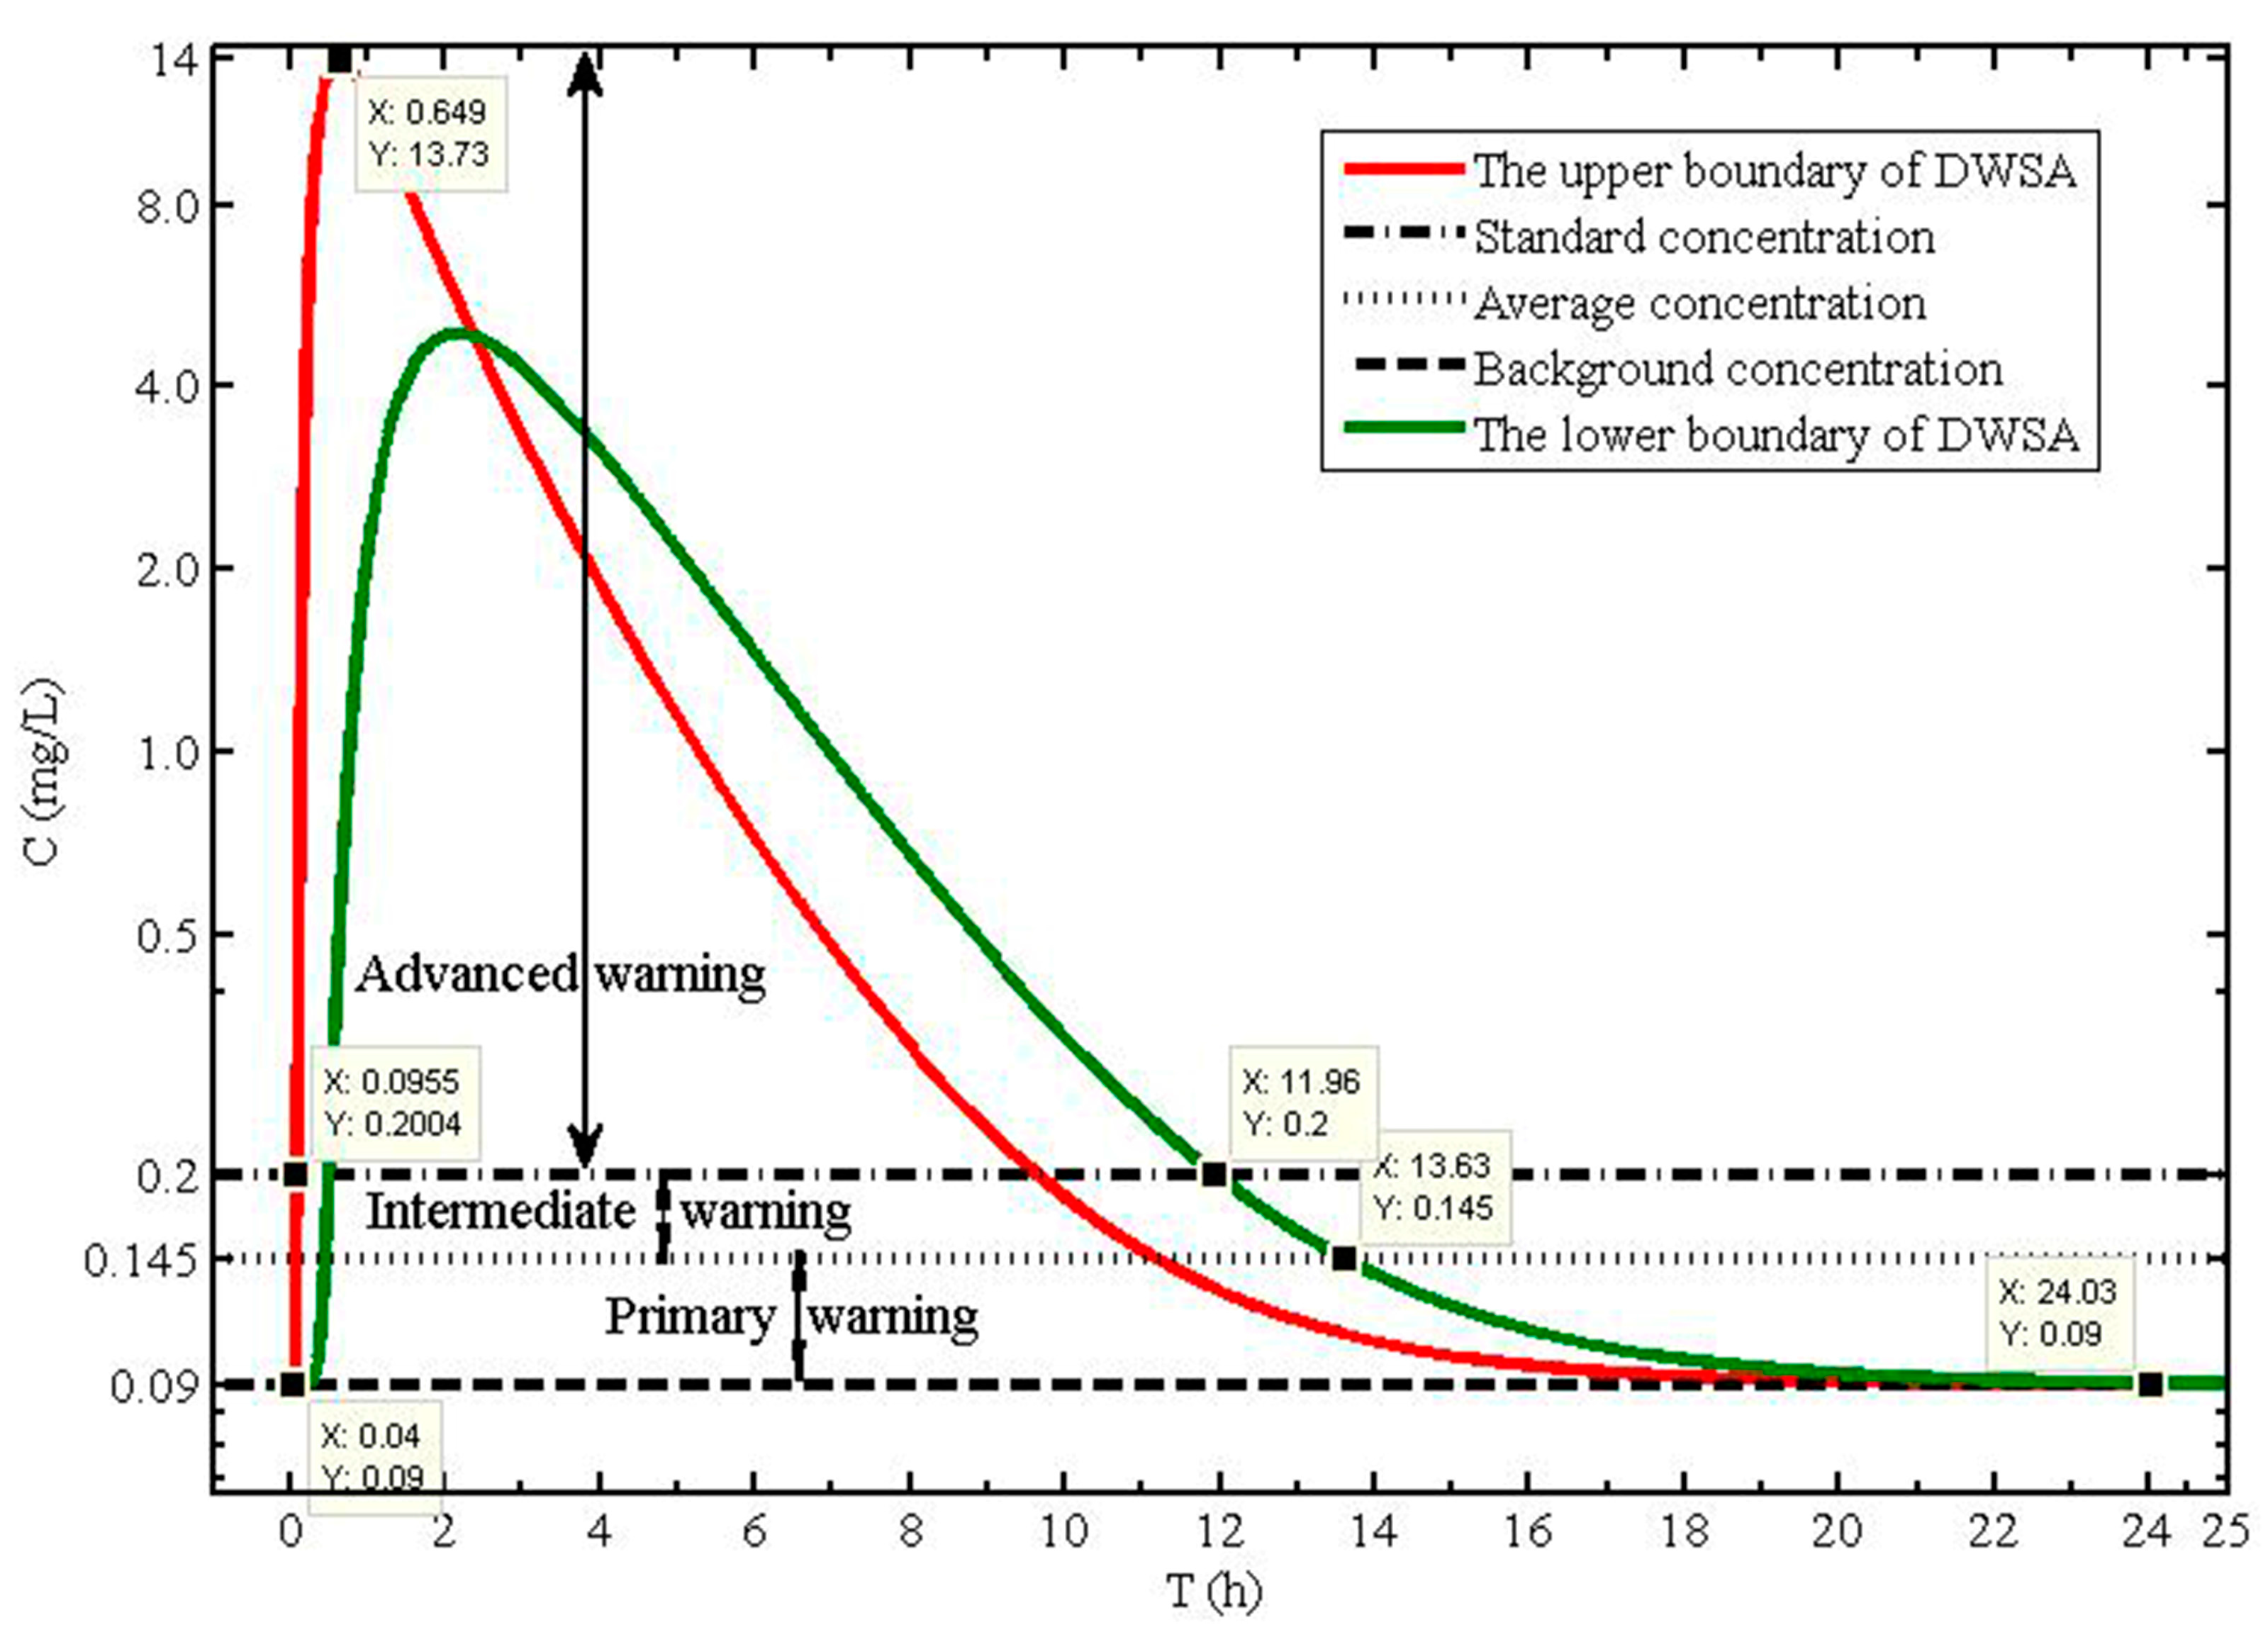
According to national management regulations for drinking water source areas, the whole drinking water source area should meet the related water quality standard. That is to say, TP concentration in the water from the upper boundary to the lower boundary of the FDWSA should be no more than 0.200 mg/L. For the early warning and forecasting system, the early warning system will be triggered if that TP concentration in any part of the FDWSA exceeds the background value. As mentioned in Section 4.2, the maximum concentration of the water source areas appeared in the upper boundary, then moved downstream, and finally stayed in the upper boundary until it reduced to the background value (Figure 5). Within 0.040 h to 0.096 h after the accident, the maximum concentration had been in the upper boundary and met the standard (primary or intermediate warning). From 0.096 h to 11.960 h, it had exceeded the standard, which caused the advanced warning status in the FDWSA to be implemented. Then, the maximum concentration existed in the upper boundary until it decreased to the background value (primary or intermediate warning). The processes of early warning and forecasting for TP concentration in the FDWSA after the accident were as Figure 7 shows.
From 0.040 h after the accident, the water in the FDWSA began to be affected by the accident, the maximum value of TP concentration in the drinking water source areas rose from 0.09 mg/L (background value) and the primary warning level started. After 0.047 h, the maximum value reached 0.145 mg/L and the level of early warning was upgraded to the intermediate level, which indicated that there was risk that TP concentration would exceed the related standard and that emergency plans should be started. Then, the maximum value exceeded the standard during the period from 0.096 h to 11.96 h after the accident, leading to an advanced warning status. In particular, it reached 13.730 mg/L in the upper boundary at 0.649 h after the accident, which was much higher than the standard value. Therefore, the government should suspend water withdrawal and emergency measures should be taken during this period. After that, TP concentration began to decrease and was reduced to no more than 0.200 mg/L at 11.96 h after the accident, and intermediate warning restarted, which indicated that the water supply could be considered to be recovering. At 13.630 h after the accident, TP concentration dropped to 0.145 mg/L and the primary warning level was initiated; 10.400 h later, TP concentration decreased to the background value and the effects of the accident were eliminated.
In addition to the above hypothetical case, another hypothetical case was also carried out to analyze the limitations and benefits of the system. In the hypothetical case, the early warning and forecasting system was applied to warn of and predict a Cd pollution accident that happened in a river-type drinking water source area of the TGRA in dry season. A pollutant concentration change trend at the water intake point in the drinking water source area was forecasted, and the time when it lost the function of a drinking water supply was also obtained. Moreover, as far as the whole drinking water source area was concerned, the spatial distribution of the pollutant and the durations for the different early warning levels were also acquired. In addition, the times that the Cd pollutant entered into and passed through the drinking water source area were also advanced.
A water pollution management system for emergency response for the TGRA [16] and a one-dimensional river quality system dynamics model [17] could not realize the early warning but only the forecasting of water quality safety. However, the developed system in this study could advance both of them synchronously. The average relative error of pollutant concentration for the water pollution management system for emergency response was 8.21% for total phosphorus based on model calibration, and the average relative error of concentration for the one-dimension river quality system dynamics model was 4.9%. For the early warning and forecasting system, the average relative error of prediction for the spatial-temporal change trend of pollutant concentration and the early warning and forecasting of water quality safety was about 15%. The results indicated that the early warning and forecasting system is feasible and scientific for the early warning and forecasting of water quality safety in the TGRA area.
From the two hypothetical cases, it could found that the early warning and forecasting system could supply visual results timely and release different levels of early warning signals. However, the system installation costs 20 min, which needs to be optimized. In addition, it was mainly aimed at accidents in the dry season with a slow flow.
5. Conclusions
In this study, an early warning and forecasting model was proposed firstly in which warnings for drinking water source areas under accidents were divided into three levels through establishing the relationships among pollutant concentration, background concentration, and standard concentration. Meanwhile, the real-time and visual forecasting of drinking water source areas in the Three Gorges Reservoir Area were realized through integrating a two-dimensional water quality model into MATLAB. Moreover, an early warning and forecasting system for the water quality safety of drinking water source areas in the Three Gorges Reservoir Area was developed based on the proposed model and the MATLAB platform. It could actualize efficiently early warning and forecasting for water intake and the whole drinking water source area through data analysis and the spatial expression of MATLAB for the migration process of a pollutant after an accident. The user interface, an early warning and forecasting model, and a visual output interface were integrated into an organic system, which could acquire accurate early warning and forecasting results for drinking water source areas in Three Gorges Reservoir Area. Taking the Fenghuangshan drinking water source area in the Three Gorges Reservoir Area as the study area, the early warning and forecasting system was also applied under a hypothetical water pollution accident. For the water intake, the TP concentration rose from the background value to the standard value, and primary as well as intermediate warnings started sequentially during the period of 0.050 h to 0.120 h after the accident. Then, the TP concentration exceeded the standard value until 9.872 h after the accident, leading to advanced warning status. After that, the TP concentration began to decrease and equaled the background value at 21.030 h after the accident, when the intermediate and primary warning levels were returned to. As for the whole water source area, primary and intermediate warning in sequence started within 0.040 h to 0.0955 h after the accident. After that, TP concentration would continuously increase as the advanced warning level started, peaked (13.730 mg/L) at 0.649 h after the accident, and then reduced to meet the standard at 11.96 h after the accident. Then, the warning level downgraded from advanced to intermediate and primary until TP concentration was reduced to the background value. This study is the first attempt to propose an early warning and forecasting model of water quality safety for drinking water source areas in the Three Gorges Reservoir Area. In addition, the system is also developed for the first time based on the proposed model and a MATLB platform. In the future, more efforts will be focused on how to determine the values of uncertain parameters due to the uncertainties in water pollution accidents.
Acknowledgments
The work described in this study was funded by the key technology and demonstration of improving water quality of reservoir areas by the joint scheduling of the cascade reservoir group (2014ZX07104-005), and the Fundamental Research Funds for the Central Universities of PRC.
Author Contributions
Xiaowen Ding and Jianjie Zhang established the model; Jianjie Zhang and Guihong Jiang analyzed the data; Jianjie Zhang and Shanghong Zhang drew the figures; and Xiaowen Ding and Jianjie Zhang wrote the paper.
Conflicts of Interest
The authors declare no conflict of interest. The founding sponsors had no role in the design of the study; in the collection, analyses, or interpretation of data; in the writing of the manuscript; or in the decision to publish the results.
References
- Madouxhumery, A.S.; Dorner, S.; Sauvé, S.; Aboulfadl, K.; Galarneau, M.; Servais, P.; Prévosta, M. The effects of combined sewer overflow events on riverine sources of drinking water. Water Res. 2016, 92, 218–227. [Google Scholar] [CrossRef] [PubMed]
- Farenhorst, A.; Li, R.; Jahan, M.; Tun, H.M.; Mi, R.; Amarakoon, I. Bacteria in drinking water sources of a First Nation reserve in Canada. Sci. Total Environ. 2016, 575, 813–819. [Google Scholar] [CrossRef] [PubMed]
- Scheili, A.; Rodriguez, M.J.; Sadiq, R. Impact of human operational factors on drinking water quality in small systems: An exploratory analysis. J. Clean. Prod. 2016, 133, 681–690. [Google Scholar] [CrossRef]
- Noubactep, C.; Schöner, A.; Woafo, P. Metallic iron filters for universal access to safe drinking water. CLEAN-Soil Air Water 2009, 37, 930–937. [Google Scholar] [CrossRef]
- Wang, H.; Yu, X. A review of the protection of sources of drinking water in China. Nat. Resour. Forum 2014, 38, 99–108. [Google Scholar] [CrossRef]
- Mi, Y.; He, C.; Bian, H.; Cai, Y.; Sheng, L.; Ma, L. Ecological engineering restoration of a non-point source polluted river in Northern China. Ecol. Eng. 2015, 76, 142–150. [Google Scholar] [CrossRef]
- Shi, S.G.; Cao, J.C.; Feng, L.; Liang, W.Y.; Zhang, L.Q. Construction of a technique plan repository and evaluation system based on AHP group decision-making for emergency treatment and disposal in chemical pollution accidents. J. Hazard. Mater. 2014, 276, 200–206. [Google Scholar] [CrossRef] [PubMed]
- Khan, S.; Shahnaz, M.; Jehan, N.; Rehman, S.; Shah, M.T.; Din, I. Drinking water quality and human health risk in Charsadda district, Pakistan. J. Clean. Prod. 2013, 60, 93–101. [Google Scholar] [CrossRef]
- Fernando, D.M.; Tun, H.M.; Poole, J.; Patidar, R.; Li, R.; Mi, R.D.; Amarawansha, G.E.A.; Fernando, W.G.D.; Khafipour, E.; Farenhorst, A.; et al. Detection of antibiotic resistance genes in source and drinking water samples from a first nation community in Canada. Appl. Environ. Microb. 2016, 82, 4767–4775. [Google Scholar] [CrossRef] [PubMed]
- Sahin, O.; Bertone, E.; Beal, C.D. A systems approach for assessing water conservation potential through demand-based water tariffs. J. Clean. Prod. 2017, 148, 773–784. [Google Scholar] [CrossRef]
- Scatena, F.N. Drinking water quality. In Drinking Water from Forests and Grasslands: A Synthesis of the Scientific Literature; General Technical Report SRS-39; Dissmeyer, G.E., Ed.; USDA Forest Service Southern Research Station: Asheville, NC, USA, 2000; Chapter 2; pp. 7–25. [Google Scholar]
- Neary, D.G.; Baillie, B.R. Cumulative Effects Analysis of the Water Quality Risk of Herbicides Used for Site Preparation in the Central North Island, New Zealand. Water 2016, 8, 573. [Google Scholar] [CrossRef]
- Zeng, H.A.; Wu, J.L. Tracing the Nitrate Sources of the Yili River in the Taihu Lake Watershed: A Dual Isotope Approach. Water 2015, 7, 188–201. [Google Scholar] [CrossRef]
- Armstrong, J.S. Evaluating Forecasting Methods. In Principles of Forecasting; Springer: New York, NY, USA, 2001; Volume 30, pp. 443–472. [Google Scholar]
- Franses, P.H. A note on the Mean Absolute Scaled Error. Int. J. Forecast. 2016, 32, 20–22. [Google Scholar] [CrossRef]
- He, Q.; Peng, S.; Zhai, J.; Xiao, H. Development and application of a water pollution emergency response system for the Three Gorges Reservoir in the Yangtze River, China. J. Environ. Sci. 2011, 23, 595–600. [Google Scholar] [CrossRef]
- Zhang, B.; Qin, Y.; Huang, M.X.; Sun, Q.; Li, S.; Wang, L.Q.; Yu, C.H. SD-GIS-based temporal-spatial simulation of water quality in sudden water pollution accidents. Comput. Geosci. 2011, 37, 874–882. [Google Scholar] [CrossRef]
- Kundzewicz, Z.W.; Mata, L.J.; Arnell, N.W.; Döll, P.; Kabat, P.; Jiménez, B. Climate Change 2007—The Physical Science Basis; IPCC: Geneva, Switzerland, 2007. [Google Scholar]
- Li, K.F.; Zhu, C.; Wu, L.; Huang, L.Y. Problems caused by the Three Gorges Dam construction in the Yangtze River basin: A review. Environ. Rev. 2013, 21, 127–135. [Google Scholar] [CrossRef]
- Gleick, P.H.; Cooley, H.; Cohen, M.; Morikawa, M.; Morrison, J.; Palaniappan, M. The World’s Water, 2008–2009: The Biennial Report on Freshwater Resources; Island Press: Washington, DC, USA, 2009. [Google Scholar]
- Wang, J.X.; Bi, Y.H.; Pfister, G.; Henkelmann, B.; Zhu, K.X.; Schramm, K.W. Determination of PAH, PCB, and OCP in water from the three Gorges reservoir accumulated by semipermeable membrane devices (SPMD). Chemosphere 2009, 75, 1119–1127. [Google Scholar] [CrossRef] [PubMed]
- Fu, B.J.; Wu, B.F.; Lu, Y.H.; Xu, Z.H.; Cao, J.H.; Niu, D.; Yang, G.S.; Zhou, Y.M. Three Gorges Project: Efforts and challenges for the environment. Prog. Phys. Geogr. 2010, 34, 741–754. [Google Scholar] [CrossRef]
- Ye, J.Y.; Liu, J.; Ji, F.Y.; Liao, Q.; Wang, X. Analysis and counter measure of water pollution treatment in the City of Chongqing, upstream of the Three Gorges Reservoir in China. In The 2nd International Conference on Bioinformatics and Biomedical Engineering (ICBBE), 2008, Shanghai, China; Engineering in Medicine and Biology Society: Piscataway, NJ, USA, 2008; pp. 3716–3721. [Google Scholar]
- General Administration of Quality Supervision, Inspection and Quarantine of the People’s Republic of China. GB/T 25173–2010, Code of Practice for Computation on Allowable Permitted Assimilative Capacity of Water Bodies; AQSIQ: Beijing, China, 2010.
- Zeng, G.M.; Yuan, X.Z.; Yin, Y.Y.; Yang, C.P. A two-dimensional water-quality model for a winding and topographically complicated river. J. Environ. Manag. 2001, 61, 113. [Google Scholar] [CrossRef] [PubMed]
- Deus, R.; Brito, D.; Mateus, M.; Kenov, I.; Fornaro, A.; Neves, R.; Alves, C.N. Impact evaluation of a pisciculture in the Tucuruí reservoir (Pará, Brazil) using a two-dimensional water quality model. J. Hydrol. 2013, 487, 1–12. [Google Scholar] [CrossRef]
- Martin, J.L. Application of two-dimensional water quality model. J. Environ. Eng. 1988, 114, 317–336. [Google Scholar] [CrossRef]
- Ani, E.C.; Agachi, P.S.; Cristea, M.V. Mathematical models to support pollution counteraction in case of accidents. Environ. Eng. Manag. J. 2012, 16, 143–151. [Google Scholar]
- Ge, X.F.; Hou, D.B.; Zhang, G.X.; Huang, P.J. Cloud Simulation Platform for Water Environment Assessment. Appl. Mech. Mater. 2013, 317, 670–673. [Google Scholar] [CrossRef]
- Chiş, A.; Denker, M.; Gîrba, T.; Nierstrasz, O. Practical domain-specific debuggers using the moldable debugger framework. Comput. Lang. Syst. Struct. 2015, 44, 89–113. [Google Scholar] [CrossRef]
- Morris, M.D. Factorial sampling plans for preliminary computational experiments. Technometrics 1991, 33, 161–174. [Google Scholar] [CrossRef]
Figure 1.
Location of drinking water source areas in the Three Gorges Reservoir Area (TGRA).
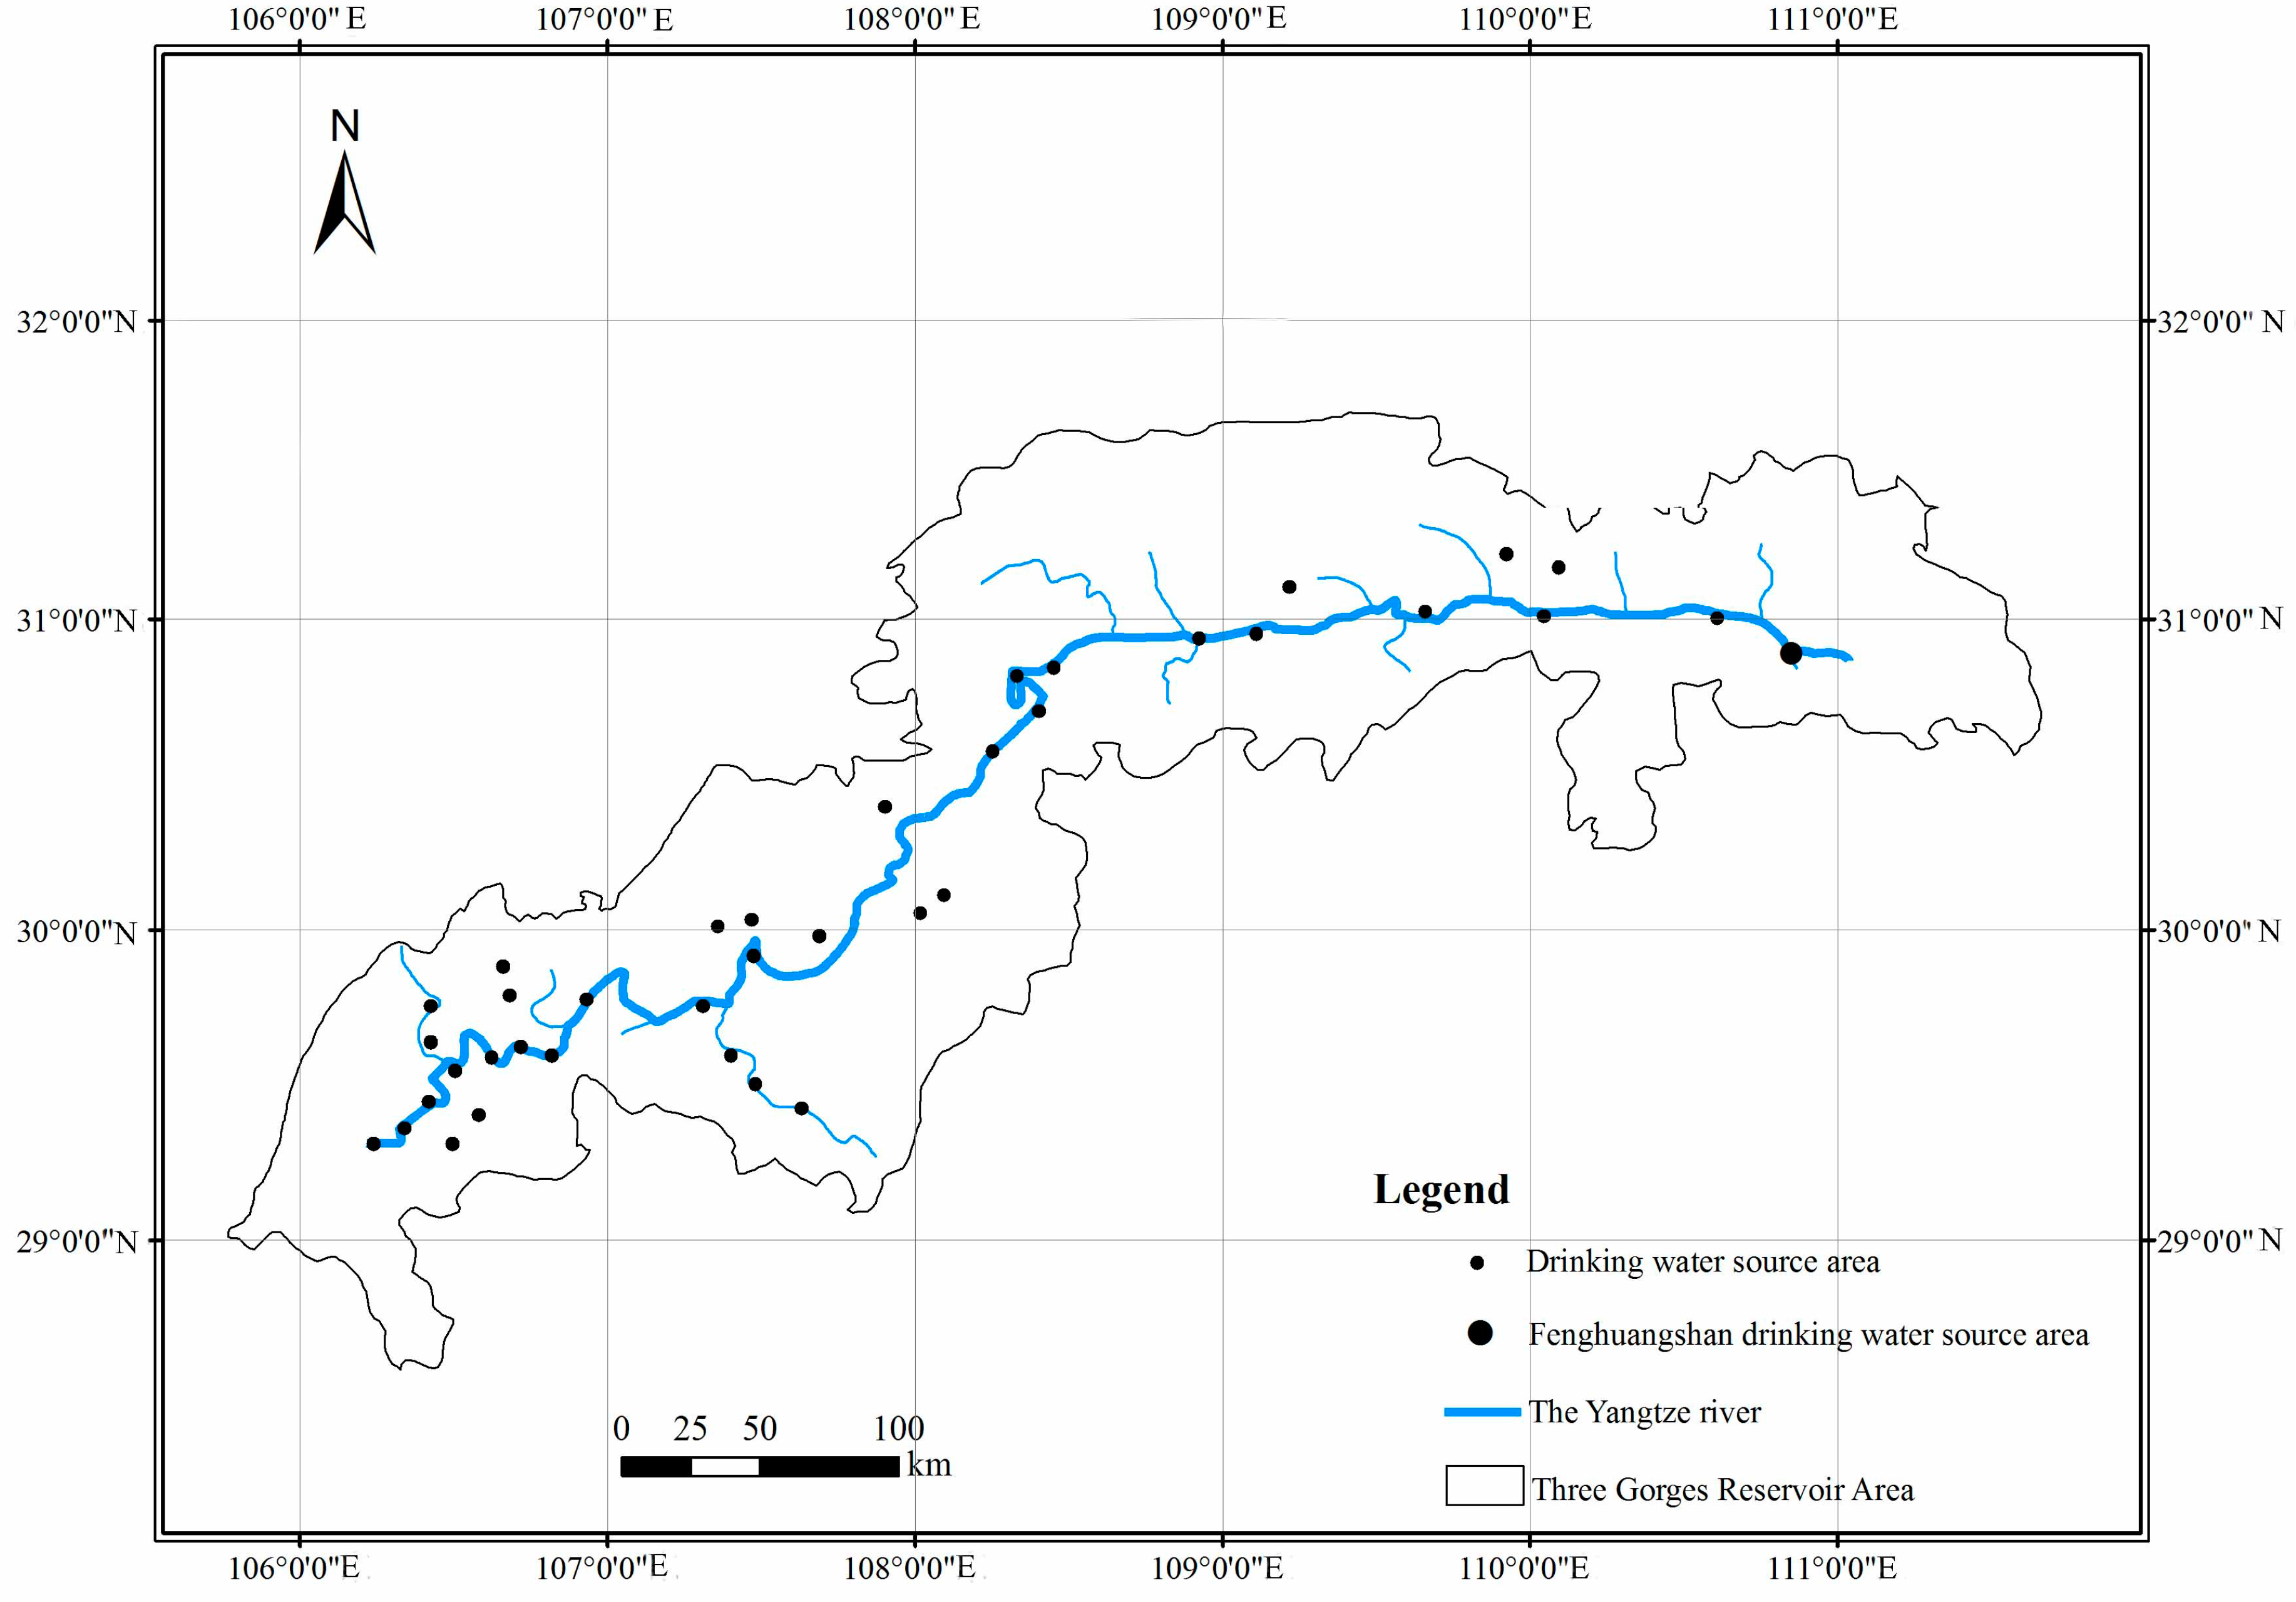
Figure 2.
Early warning and forecasting interface of the early warning and forecasting system.
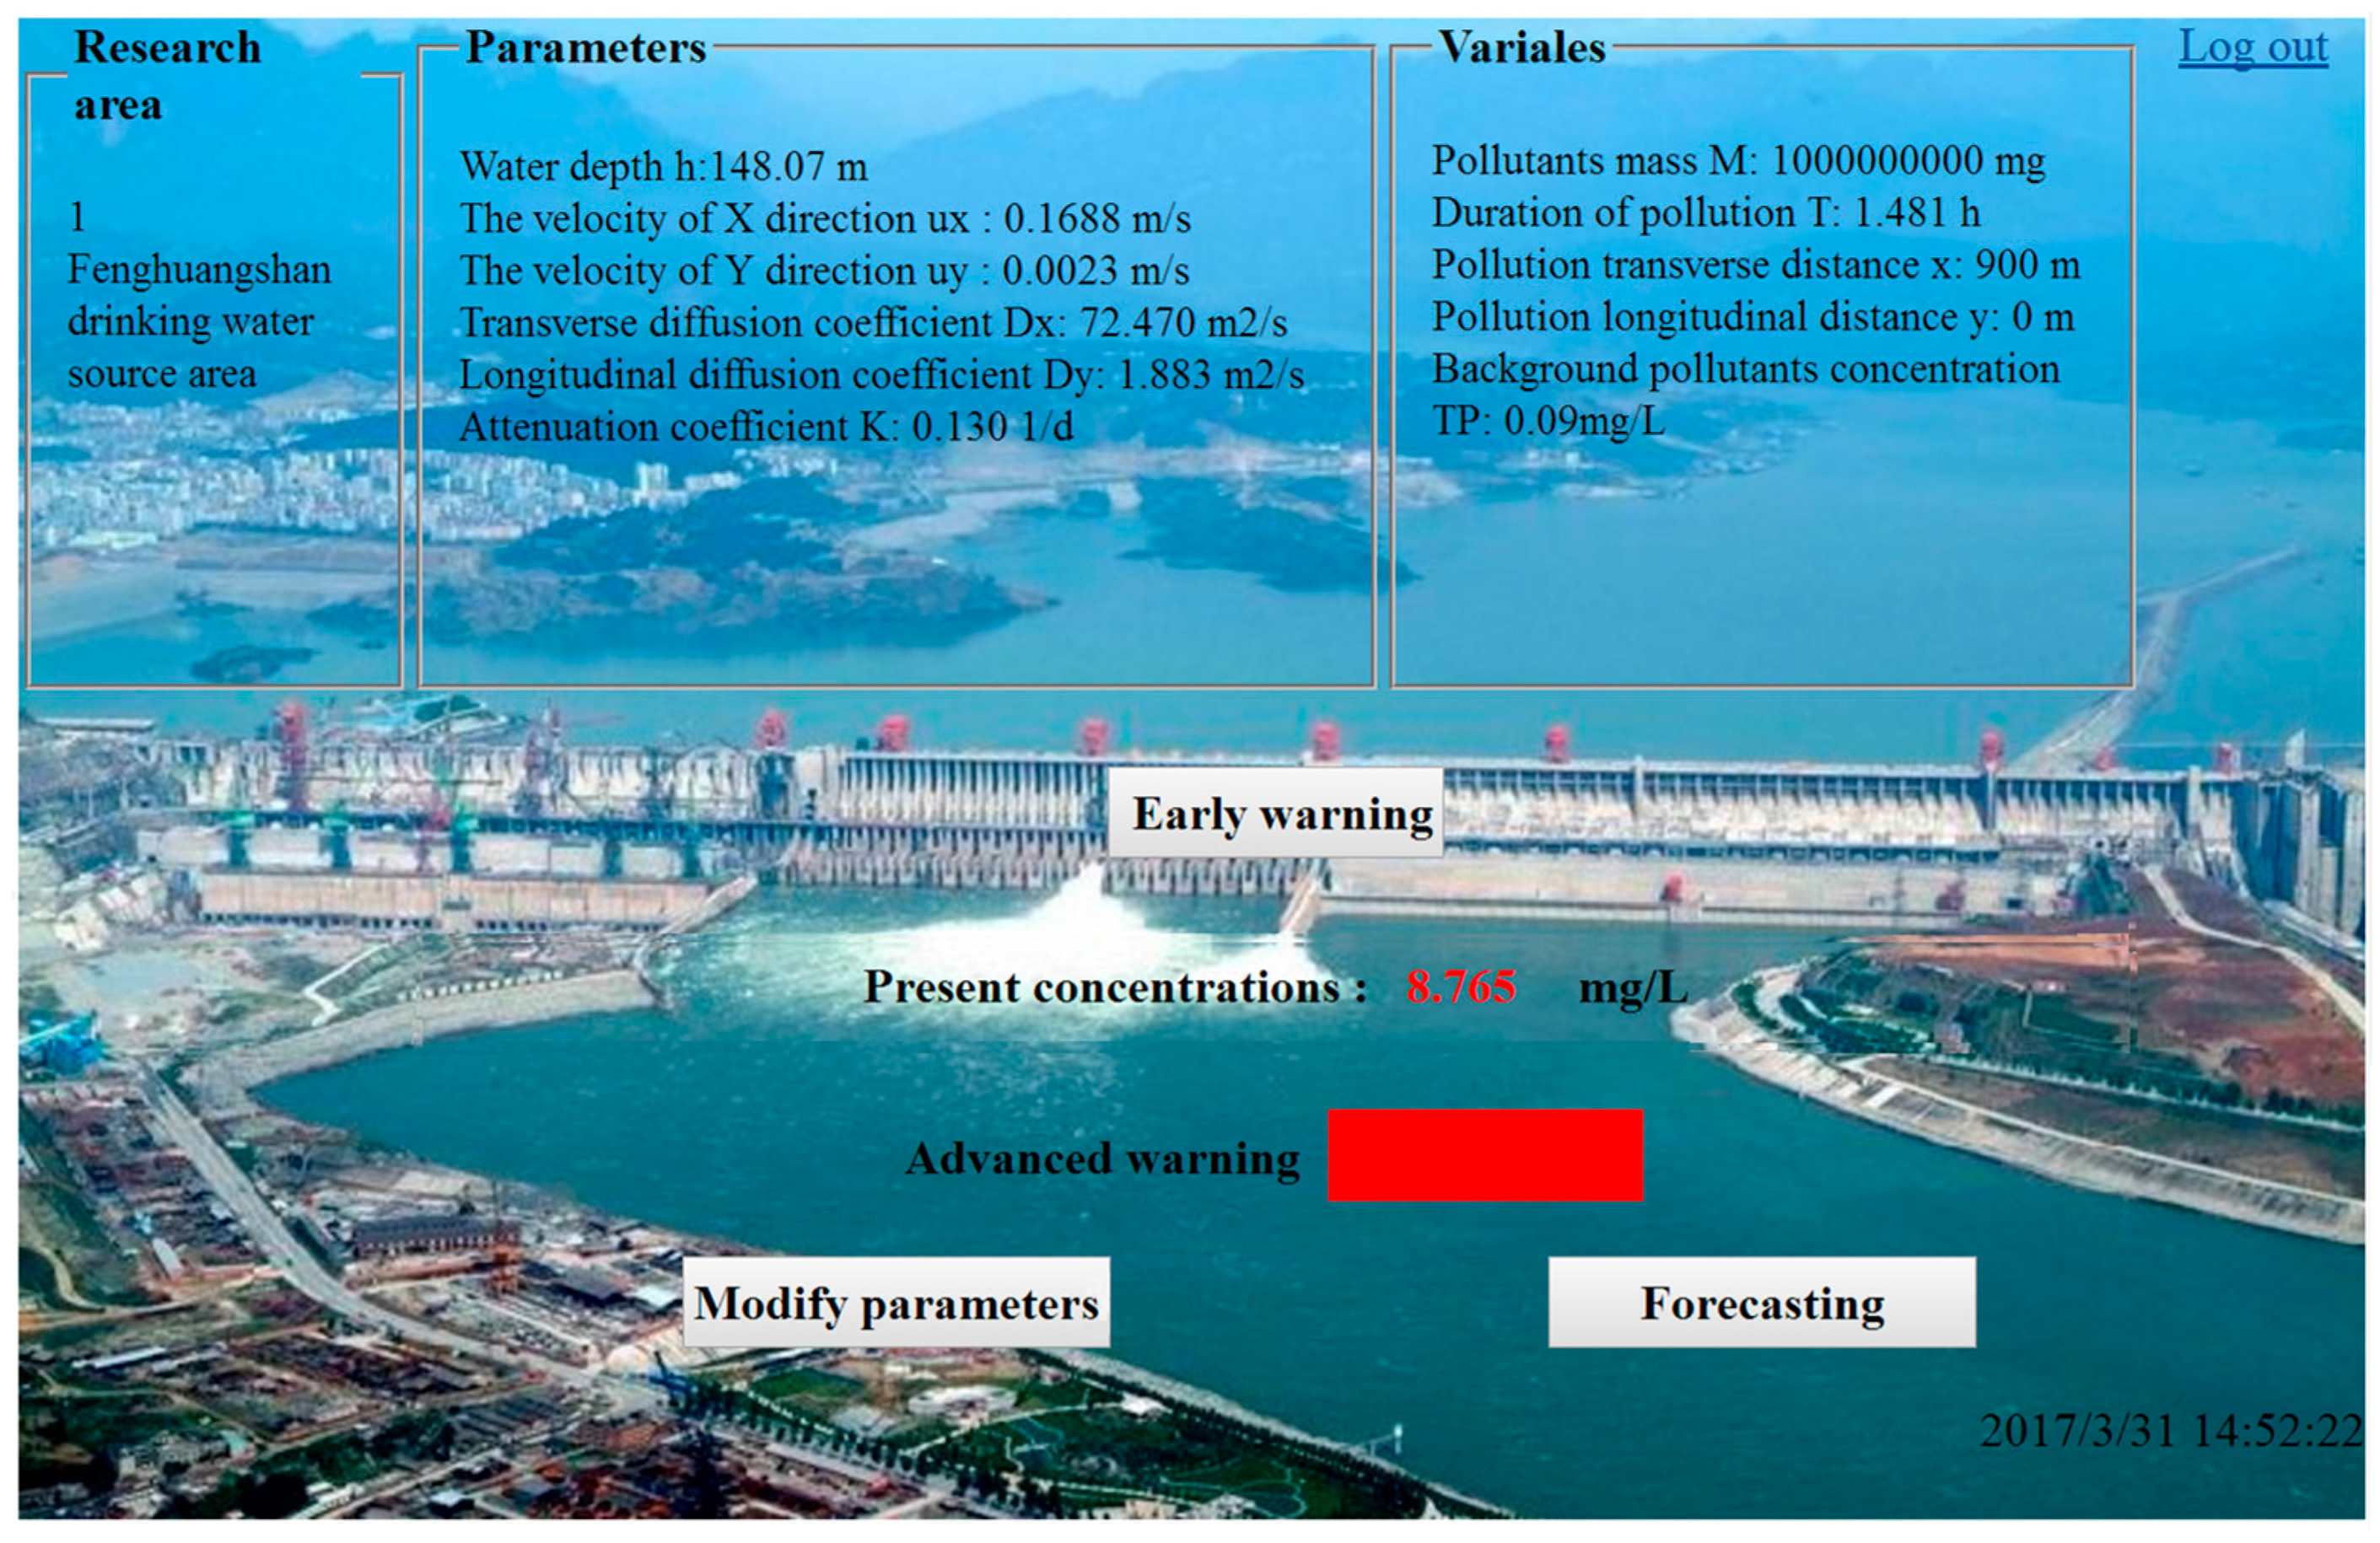
Figure 3.
Location of the Fenghuangshan drinking water source area.
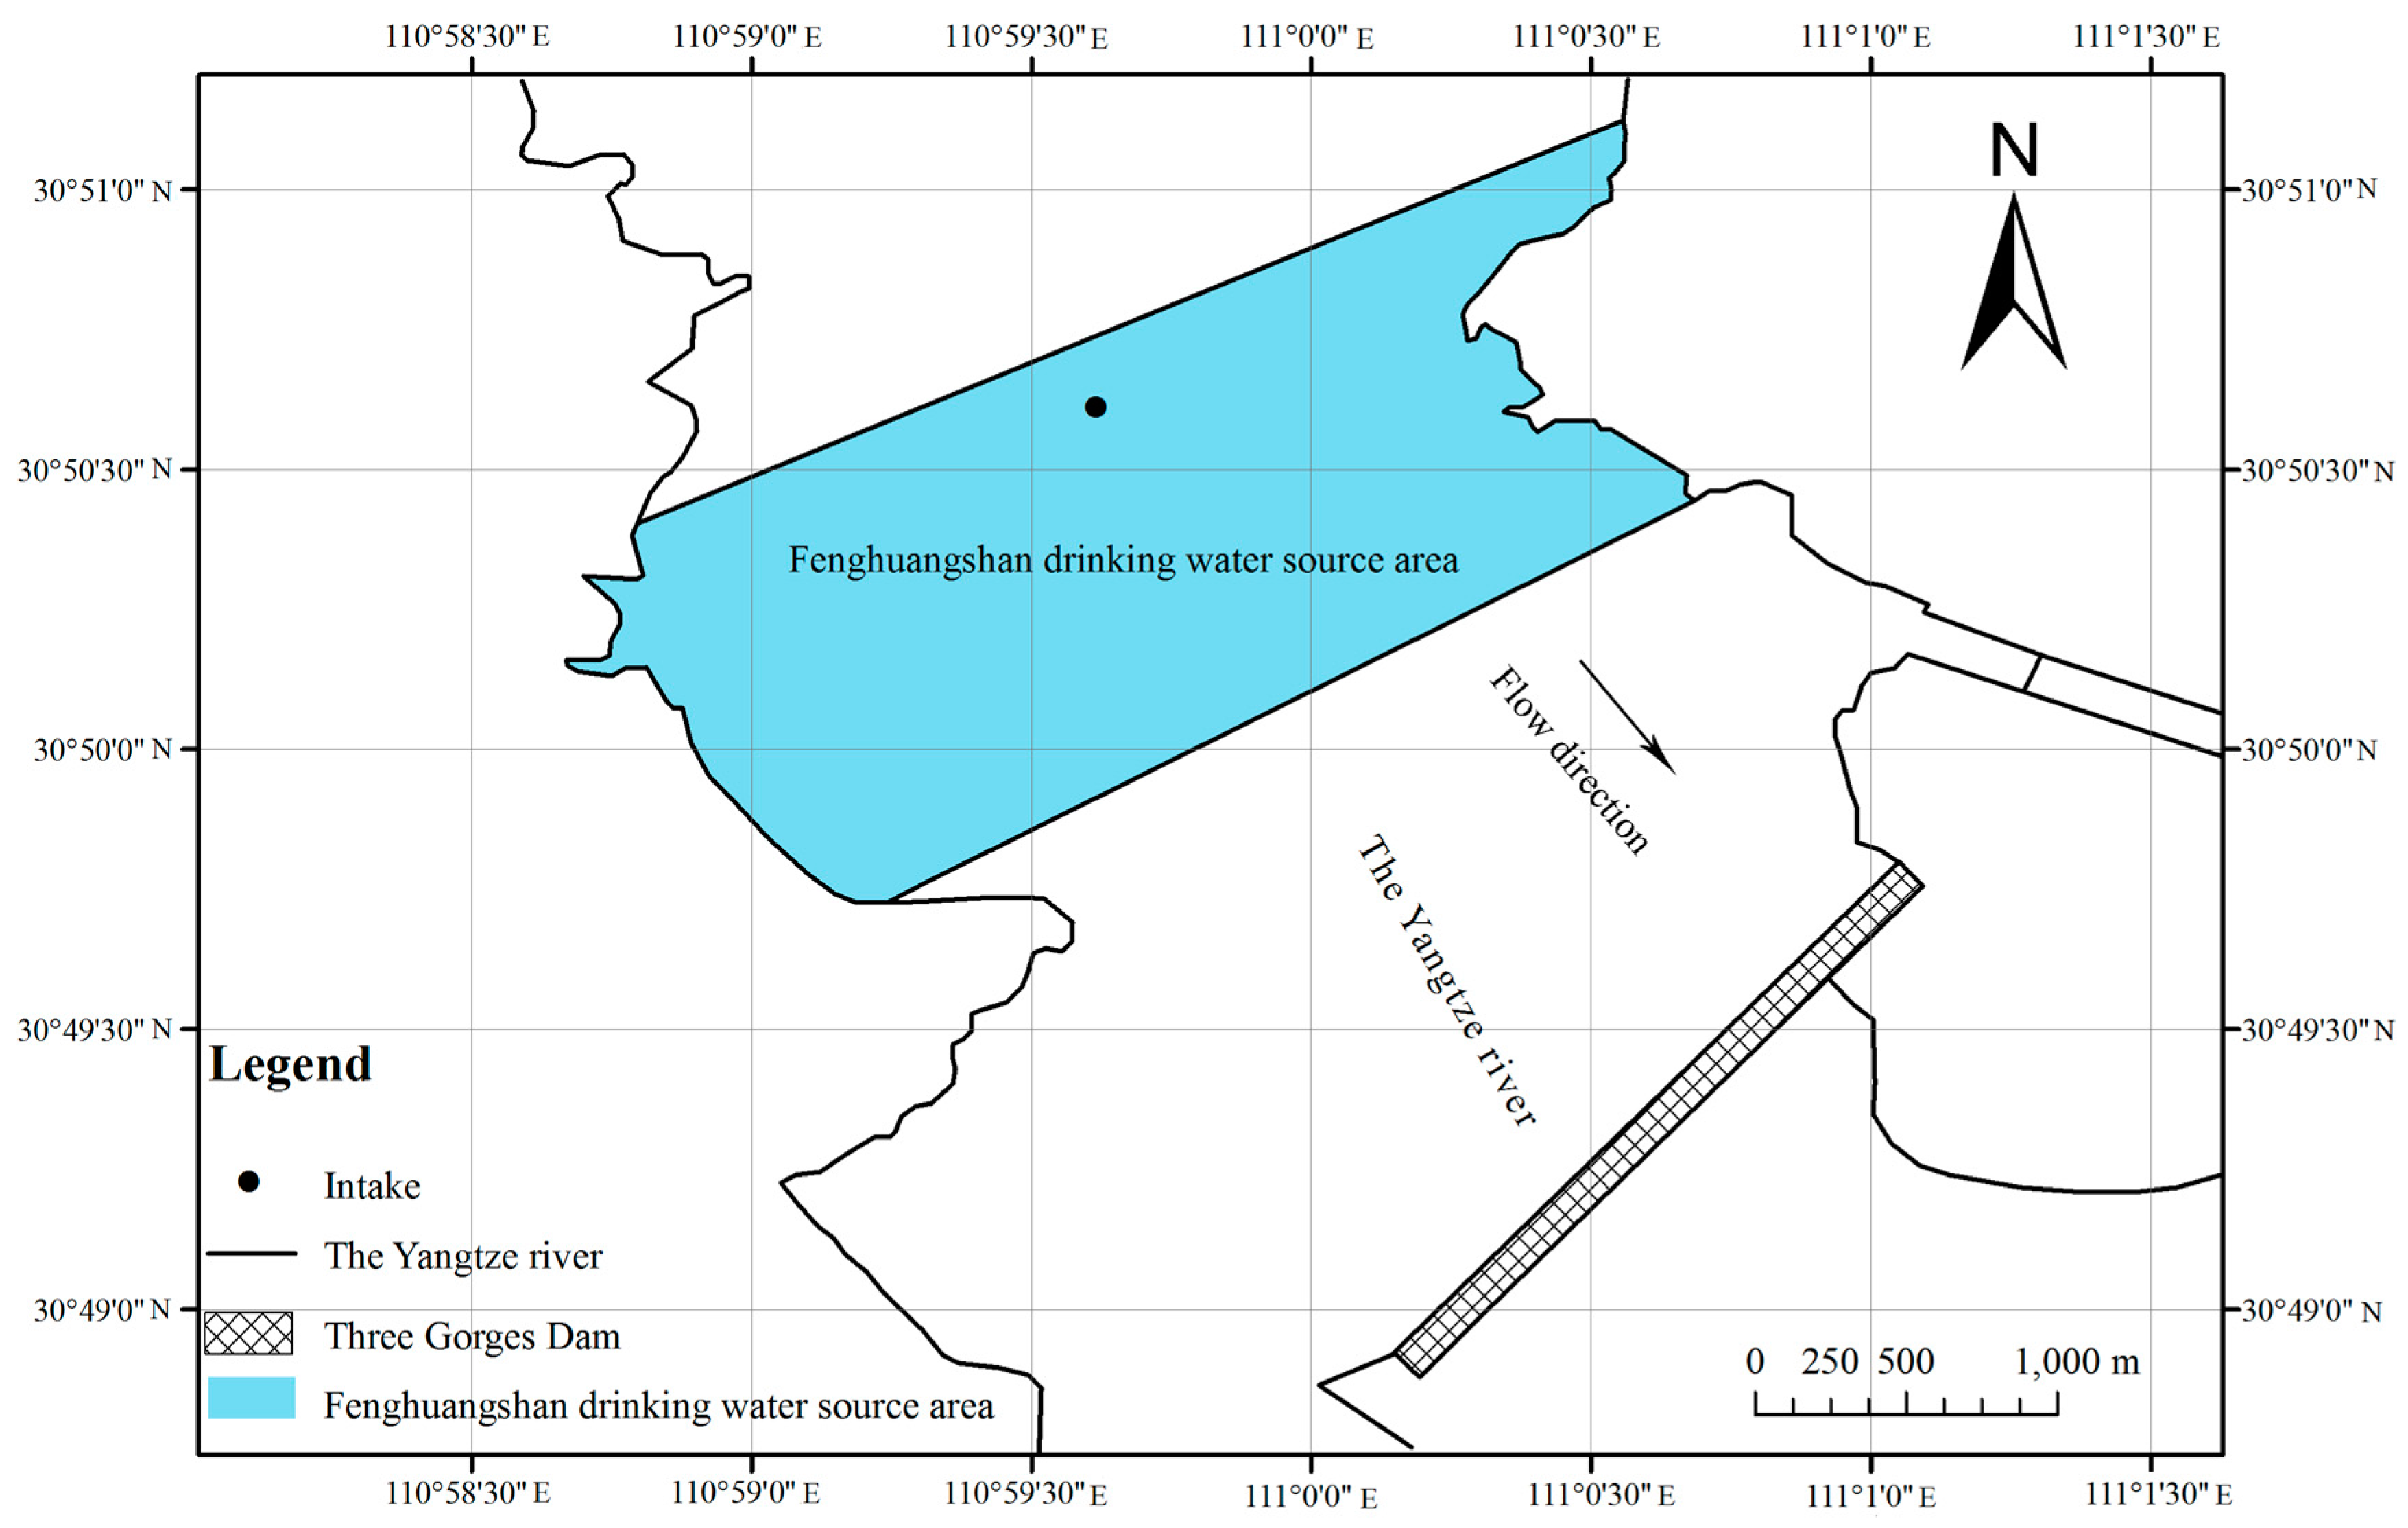
Figure 4.
Early warning and forecasting of TP concentration at the water intake.
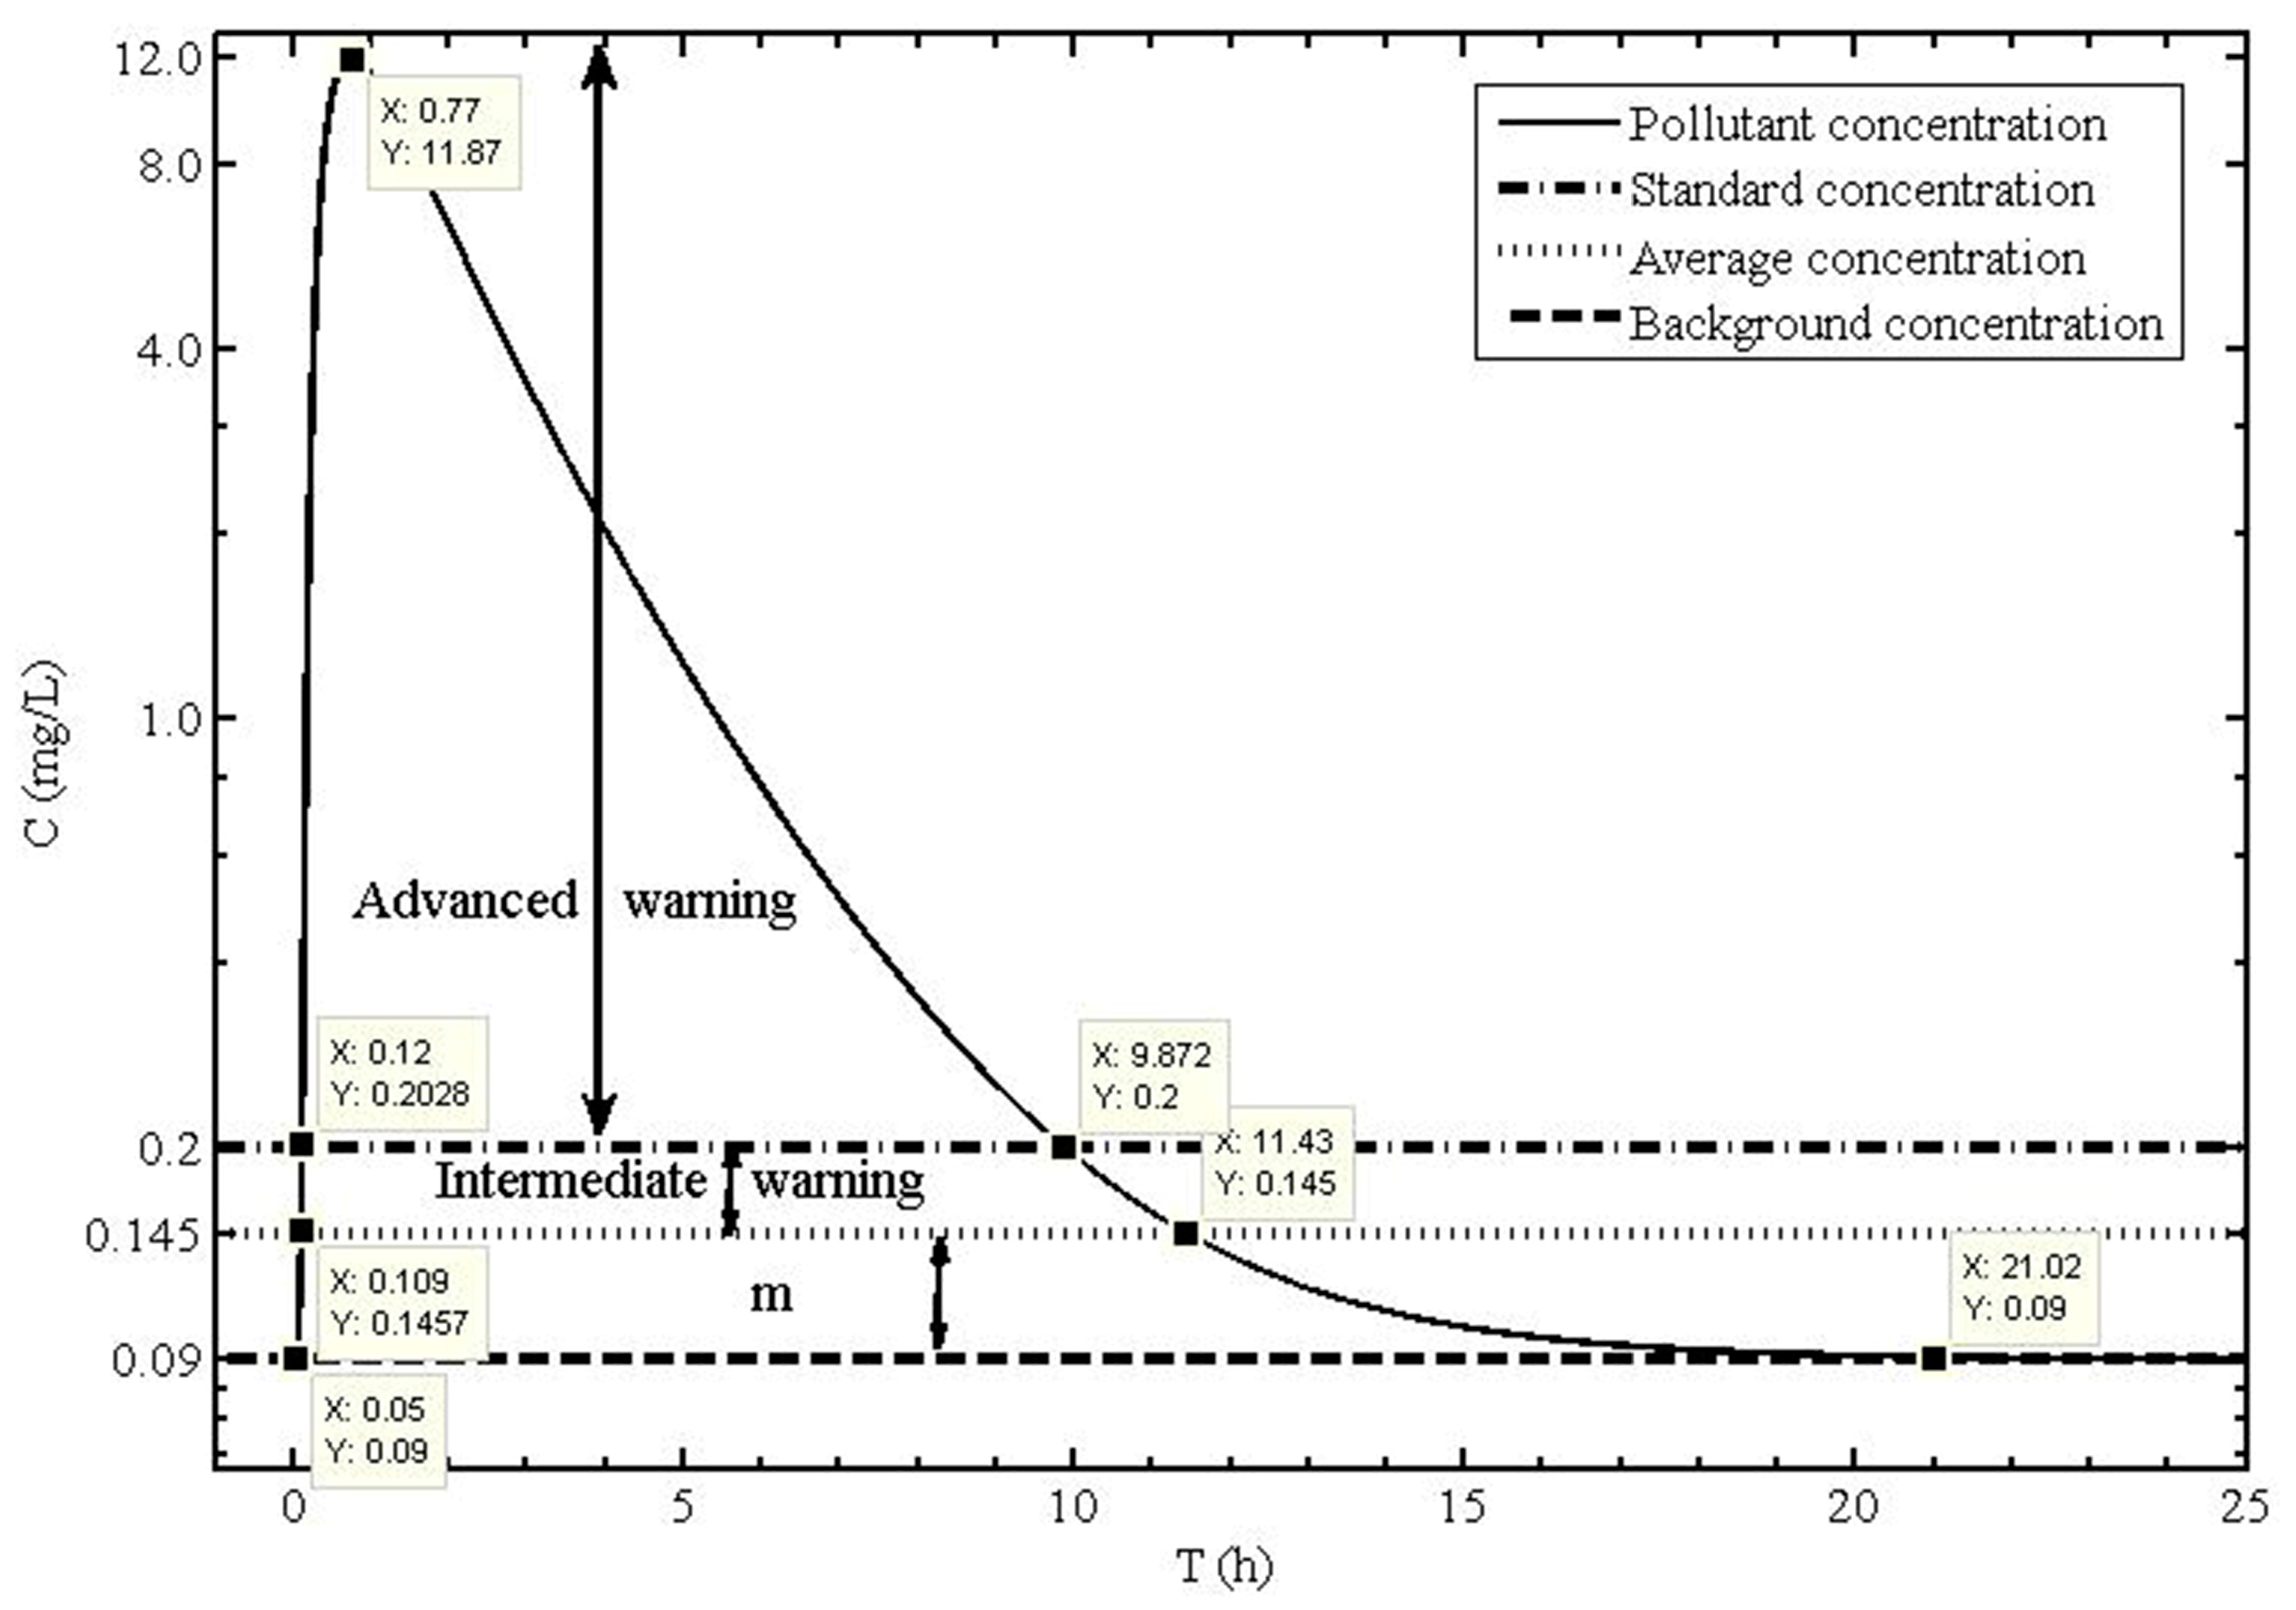
Figure 5.
Spatial variation of the maximum concentration for TP.

Figure 6.
(a) Spatial distribution of TP concentration at 1 h after the accident; (b) Spatial distribution of TP concentration at 2 h after the accident; (c) Spatial distribution of TP concentration at 3 h after the accident; (d) Spatial distribution of TP concentration at 4 h after the accident.
Figure 6.
(a) Spatial distribution of TP concentration at 1 h after the accident; (b) Spatial distribution of TP concentration at 2 h after the accident; (c) Spatial distribution of TP concentration at 3 h after the accident; (d) Spatial distribution of TP concentration at 4 h after the accident.

Figure 7.
Early warning and forecasting of TP concentration at the drinking water source area.


Table 1.
Parameters of the Fenghuangshan drinking water source area in the dry season.
| No. | Parameters | Variable | Meanings and Unit |
|---|---|---|---|
| 1 | C | Variables | Pollutant concentrations (mg/L) |
| 2 | t | Variables | time (h) |
| 3 | x | Variables | Longitudinal distance from origin (m) |
| 4 | y | Variables | Transverse distance from origin (m) |
| 5 | M | 1000 | Instantaneous point source item (kg) |
| 6 | H | 147 | Water depth (m) |
| 7 | ux | 0.010–0.100 | Velocity of x direction (m/s) |
| 8 | uy | 0.001–0.005 | Velocity of y direction (m/s) |
| 9 | Dx | 72.470 | Longitudinal diffusion coefficient |
| 10 | Dy | 1.833 | Transverse diffusion coefficient |
| 11 | K | 0.130 | Rate constant of pollutant degradation (s−1) |
Table 2.
Change of Total Phosphorus (TP)concentration under different parameter conditions.
| Parameter | TP Concentration Change (mg/L) | ||||
|---|---|---|---|---|---|
| −20% | −10% | 0 | 10% | 20% | |
| K | 0.012 (0.11%) | 0.006 (0.05%) | 0.000 | −0.006 (−0.05%) | −0.012 (−0.11%) |
| Dx | 0.861 (7.71%) | 0.410 (3.67%) | 0.000 | −0.373 (−3.34%) | −0.714 (−6.40%) |
| Dy | 1.295 (11.60%) | 0.592 (5.30%) | 0.000 | −0.051 (−0.46%) | −0.958 (−8.58%) |
| Ux | −1.116 (−10.00%) | −0.535 (−4.79%) | 0.000 | 0.479 (4.29%) | 0.892 (7.99%) |
| Uy | 0.018 (0.16%) | 0.009 (0.08%) | 0.000 | −0.010 (−0.09%) | −0.022 (−0.20%) |
Table 3.
Levels of early warning for the water intake.
| Stage | Level of Early Warning | TP Concentration (mg/L) | Time (after the Accident) (h) | Duration (h) |
|---|---|---|---|---|
| 1 | Primary warning | 0.090–0.145 | 0.050–0.109 | 0.059 |
| 2 | Intermediate warning | 0.145–0.200 | 0.109–0.120 | 0.011 |
| 3 | Advanced warning | 0.200–3.804 | 0.120–9.872 | 9.752 |
| 4 | Intermediate warning | 0.200–0.145 | 9.872–11.430 | 1.558 |
| 5 | Primary warning | 0.145–0.009 | 11.430–21.020 | 9.590 |
Table 4.
Spatial-temporal change of the maximum concentration for the study area.
| Distance from the Upper Boundary to the Maximum Concentration Point (m) | Maximum Concentration (mg/L) | Time after the Accident (h) |
|---|---|---|
| 0 | 0.090 | a1 0.040 |
| 0 | 8.765 | a2 1.481 |
| 100 | 7.891 | 1.646 |
| 200 | 7.176 | 1.810 |
| 300 | 6.580 | 1.975 |
| 400 | 6.075 | 2.139 |
| 500 | 5.643 | 2.304 |
| 600 | 5.268 | 2.468 |
| 700 | 4.940 | 2.633 |
| 800 | 4.651 | 2.798 |
| 900 | 4.393 | 2.962 |
| 1000 | 4.163 | 3.127 |
| 1100 | 3.956 | b1 3.291 |
| 1100 | 0.090 | b2 24.030 |
Notes: a1: The pollution group began to enter the FDWSA; a2: The maximum concentration of the pollution group arrived in the Fenghuangshan drinking water source area (FDWSA); b1: The maximum concentration of the pollution group left the FDWSA; b2: The pollution group left the FDWSA entirely.
Table 5.
Levels of early warning for the drinking water source area.
| Stage | Early Warning Level | Concentration (mg/L) | Time (after the Accident) (h) | Duration (h) |
|---|---|---|---|---|
| 1 | Primary warning | 0.090–0.145 | 0.040–0.087 | 0.047 |
| 2 | Intermediate warning | 0.145–0.200 | 0.087–0.096 | 0.009 |
| 3 | Advanced warning | 0.200–3.804 | 0.0960–11.960 | 11.864 |
| 4 | Intermediate warning | 0.200–0.145 | 11.960–13.630 | 1.670 |
| 5 | Primary warning | 0.145–0.009 | 13.630–24.030 | 10.400 |
© 2017 by the authors. Licensee MDPI, Basel, Switzerland. This article is an open access article distributed under the terms and conditions of the Creative Commons Attribution (CC BY) license (http://creativecommons.org/licenses/by/4.0/).
Share and Cite
MDPI and ACS Style
Ding, X.; Zhang, J.; Jiang, G.; Zhang, S. Early Warning and Forecasting System of Water Quality Safety for Drinking Water Source Areas in Three Gorges Reservoir Area, China. Water 2017, 9, 465. https://doi.org/10.3390/w9070465
AMA Style
Ding X, Zhang J, Jiang G, Zhang S. Early Warning and Forecasting System of Water Quality Safety for Drinking Water Source Areas in Three Gorges Reservoir Area, China. Water. 2017; 9(7):465. https://doi.org/10.3390/w9070465
Chicago/Turabian StyleDing, Xiaowen, Jianjie Zhang, Guihong Jiang, and Shanghong Zhang. 2017. "Early Warning and Forecasting System of Water Quality Safety for Drinking Water Source Areas in Three Gorges Reservoir Area, China" Water 9, no. 7: 465. https://doi.org/10.3390/w9070465
Note that from the first issue of 2016, this journal uses article numbers instead of page numbers. See further details here.