ENSO Influence on Rainy Season Precipitation over the Yangtze River Basin


1
State Key Laboratory of Hydrology Water Resources and Hydraulic Engineering, Hohai University, Nanjing 210098, China
2
National Cooperative Innovation Center for Water Safety & Hydro-Science, Hohai University, Nanjing 210098, China
3
Department of Water Resources Engineering and Center for Middle Eastern Studies, Lund University, P.O. Box 118, SE-221 00 Lund, Sweden
*
Authors to whom correspondence should be addressed.
Water 2017, 9(7), 469; https://doi.org/10.3390/w9070469
Submission received: 20 April 2017
/
Revised: 11 June 2017
/
Accepted: 24 June 2017
/
Published: 27 June 2017
Abstract
:The paper explores the impact of El Niño-Southern Oscillation (ENSO) on rainy season precipitation properties over the Yangtze River Basin. The multi-scale moving t-test was used to determine the onset and withdrawal of the rainy season. Results showed the following: (1) Onset and withdrawal of the averaged rainy season over the Yangtze River Basin showed a similar distribution and both progressed northwards and westwards. There is a trend for delayed onset of rainy season precipitation over the Yangtze River Basin. A similar trend in the withdrawal of rainy season precipitation was not found. (2) The decaying Central and Eastern Pacific Warming are indicative of wet signals in the Yangtze River Basin, with precipitation anomalies up to 25% above normal. The decaying Eastern Pacific Cooling and developing Eastern Pacific Warming are indicative of dry signals over the Yangtze River Basin, with 5–20% lower than average precipitation (3) ENSO Modoki in the developing phase is more important than the developing ENSO when it comes to present wetter or drier signals. Conversely, the decaying ENSO shows more prominent wet or dry signals than the decaying ENSO Modoki.
1. Introduction
El Niño-Southern Oscillation (ENSO) is one of the most significant climate indicators that influence precipitation patterns [1,2,3,4,5,6]. ENSO can trigger extreme hydro-climatological events (e.g., floods and droughts) and cause devastating damage to the environment and economy [7]. For instance, damage worth 2400 million dollars per year has been attributed to ENSO regimes in the U.S. alone [8]. Therefore, regional weather anomalies related to ENSO have been investigated around the globe [9], which could improve predictability of weather conditions. The Yangtze River Basin (YRB) in China heavily depends on precipitation for agricultural and economic development. The key element affecting the YRB precipitation is sea surface temperature anomalies (SSTA) in the equatorial Pacific [10]. Floods and droughts are frequent in the YRB. For instance, destructive Asian summer monsoon flooding occurred in the YRB during two typical El Niño events in 1982/1983 and 1997/1998. The devastating flooding in 2016 was attributed to a variation of Pacific SSTA [3]. Previous research has focused on seasonal precipitation and precipitation extremes [11,12,13] and the influence of single ENSO mode on precipitation in the YRB [10,14] to a great extent. Nonetheless, the impact of various ENSO regimes on rainy season precipitation in the YRB, especially comparative analyses of influence of different ENSO regimes in the developing and decaying phases, have not been studied. Rainy season precipitation can exert negative social and economic effects in the YRB. Reliable prediction of onset of the rainy season will reduce the risks associated with, e.g., sowing and planting too early or too late [15,16,17]. Good knowledge of withdrawal of the rainy season determines the length of the growing season, which is useful for crop variety selection [18]. The amount of precipitation during the rainy season determines the drought or flood conditions in the YRB [14]. As a consequence, there is a strong need to investigate rainy season characteristics in the YRB under various ENSO regimes.
For the reasons above, five ENSO types (i.e., Central Pacific Warming (CPW), Eastern Pacific Cooling (EPC), Eastern Pacific Warming (EPW), conventional ENSO, and ENSO Modoki) were analyzed in this study. Kim et al. [8] divided ENSO into three types based on SSTA in the equatorial Pacific, i.e., CPW, EPC, and EPW. An eastern Pacific type (conventional ENSO) is generally identified based on a single area-averaged SSTA in the equatorial Pacific, such as the Niño 3.4 region [19]. A central Pacific type (ENSO Modoki), proposed by Ashok et al. [20], is different from the conventional ENSO in spatial pattern and formation mechanism [21]. ENSO Modoki is characterized by positive SSTA in the central equatorial Pacific flanked by negative SSTA in the east and west equatorial Pacific [20].
The influence of ENSO Modoki on precipitation is different from that of conventional ENSO regimes. Taschetto et al. [22] compared the influence of conventional ENSO and ENSO Modoki on Australian rainfall and found that the occurrence of maximum rainfall under El Niño Modoki regimes is in austral autumn and conventional El Niño in austral spring. Moreover, El Niño is associated with reduced rainfall in eastern Australia but El Niño Modoki has a tendency to decrease rainfall in northern Australia. Tedeschi et al. [23] studied the effect of ENSO and ENSO Modoki on South American precipitation and concluded that the precipitation differences between them lie in variations in the Pacific wave trains and moisture flux intensity over the continent. Preethi et al. [24] investigated the relative effects of ENSO and ENSO Modoki on African seasonal rainfall variability and found that the conventional El Niño and El Niño Modoki are generally related to anomalous reduction (enhancement) of rainfall in southern (northern) hemispheric regions in spring.
Different performance of precipitation in China under various ENSO regimes is associated with atmospheric circulation and monsoon [23,25,26,27,28,29]. Wu et al. [30] explained the physical mechanism of teleconnection between precipitation in East Asia and SSTs through features of atmospheric circulation. Zhang et al. [31] pointed out that the southeast monsoon from the western Pacific and the southwest monsoon from Indian Ocean can bring abundant water vapor to the Huaihe River Basin. More active water vapor flux and a stronger southwest monsoon are attributed to more abundant precipitation during conventional El Niño years as compared to El Niño Modoki years [31]. The atmospheric circulation and monsoon have different effects on ENSO regimes [32,33,34]. The teleconnection between ENSO and precipitation over the YRB in this study is also partly explained by circulation and monsoon.
The influence of ENSO and ENSO Modoki on precipitation has been widely analyzed in China. Feng et al. [35] pointed out that enhanced precipitation can be observed in southern parts of China during the decaying El Niño, which may be attributed to the Western North Pacific (WNP) anti-cyclone and the shift of the ridge of sub-tropical high. Zhang et al. [36] argued that the occurrence of ENSO Modoki has become more frequent as compared to conventional ENSO after the 1990s. They concluded that ENSO Modoki tends to cause increased rainfall over southern China while conventional ENSO often leads to decreased rainfall. Zhang et al. [31] investigated variability of seasonal rainfall under various ENSO regimes (e.g., CPW, EPC, and EPW) and found that EPC tends to increase spring and autumn precipitation and EPW and CPW can cause an increase of summer precipitation over the Huaihe River Basin.
However, there is still no consensus regarding the influence of various ENSO regimes in the developing and decaying phases on rainy season precipitation in the YRB. Motivated by the lack of a consensus, the objective of this study is to improve our understanding of the relationship between the developing and decaying phases in the Yangtze River Basin rainy season precipitation and the five different ENSO regimes (i.e., CPW, EPC, EPW, ENSO, and ENSO Modoki). The multi-scale moving t-test was used to determine onset and withdrawal of the rainy season in this study. The spatial and temporal variability of rainy season features (i.e., onset, withdrawal, and precipitation) was investigated, and the association between rainy season precipitation and ENSO was explored. As a consequence, the paper is organized as follows. Section 2 describes the study area and used data. Section 3 shows the methodology for determining the rainy season, the detection of mutation points of temporal variation in precipitation and the definition of ENSO and ENSO Modoki. In Section 4, we investigate and discuss the spatial and temporal distribution of rainy season features and spatial patterns of precipitation anomalies during the rainy season under the different ENSO regimes in the developing and decaying phase. The final section summarizes the main findings.
2. Study Area and Data
2.1. Study Area
The Yangtze River (Changjiang River) is the longest river in Asia and the third longest river in the world, with a drainage area of 1.8 × 10⁶ km2 and a length of 6380 km. The climate is dominated by a subtropical and temperate climate with monsoons. The classification of the upper, middle, and lower regions of the basin is determined by the “Changjiang River Water Resources Commission (CWRC)”. The catchment is divided into three parts along the longitude from west to east. The vertical white lines in Figure 1 are the division lines of the upper, middle and lower reaches. The section above the vertical white line going across the Yichang station is the upper reach (Figure 1), which accounts for 70.4% of the Yangtze River Basin. The area between the two vertical white lines is the middle reach, and the remaining part below the vertical white line going across the Hukou station to the estuary is the lower reach.
2.2. Data
Daily precipitation data from 1960 to 2015 at 127 observation stations over the Yangtze River Basin were selected for this study (Figure 1). The data were obtained from the China Meteorological Data Sharing Service System that also is responsible for data quality. To consider station representivity, we applied kriging to induce a data mesh resolution of . NOAA extended reconstructed SST data were used to identify different types of conventional ENSO. ENSO Modoki index (EMI) was obtained from the Japan Agency for Marine Science and Technology.
3. Methodology
3.1. Determination of the Rainy Season
The onset and withdrawal of the rainy season were determined by the multi-scale moving t-test method. The method is characterized by the detection of abrupt changing points between two subsamples with size n, where n is the length of each subsample, (n = 30, 31, …, 182/183; where 182/183 corresponds to half a year 365/366). However, when finding the onset or withdrawal of the rainy season, it was not considered if the length of the subsample was just one or several days when the abrupt changing point was prominent. Hence, the value of n is limited between 30 and 182/183. The determination of the abrupt changing point is described as [37,38]
where and defined as,
and is daily precipitation for Julian day i within one year and for one station. and are the average of subsamples before and after the Julian day i, respectively.
The t-value calculated above was normalized by the 0.01 test value shown below in Equation (4), which is equivalent to the result of Mann-Kendall test at 0.05 significance level.
where can be taken as the threshold to detect mutations. > 1.0 represents an increasing trend and < 1.0 is a decreasing trend. Onset of the rainy season was defined as the abrupt changing point corresponding to a maximum . For this case, precipitation changes from a small to a large value. Likewise, withdrawal is defined as the changing point corresponding to a minimum .
3.2. Pettitt Test
The Pettitt test was used to detect a single change-point in inter-annual onset-withdrawal-precipitation series , i = 1, 2, …, 56, where represents the mean onset-withdrawal-precipitation for stations in the YRB and for the year. The non-parametric statistic is defined as [39]
where
where KT can be taken as the change-point of the series and the statistic is meaningful when KT < 0.5. The parameter P is used to judge the significance level of the change-point, which is defined as
where n = 56. When P is less than 0.05, the change point is statistically significant at the 0.05 level.
3.3. Correlation between Precipitation and SST
The Pearson product-moment correlation between rainy season characteristics and SST was calculated according to [40]
represents average precipitation from April to September (the average rainy season period) in year in the YRB; the average rainy season precipitation for the period of 1960–2015; represents 6-month average SST in year, with lagged rainy season in the YRB month; j represents the number of months that precipitation lagged SST and the j ranges between and ; the mean SST for the period of 1960–2015 or 1959–2014.
3.4. Classification of ENSO and ENSO Modoki Regimes
Five different ENSO types (i.e., CPW, EPC, EPW, conventional ENSO and ENSO Modoki) are considered in this study because they have different characteristics and could cause different effects on Chinese precipitation variability [8,22,23,24]. Conventional El Niño is mainly characterized by East Pacific warming in the cold tongue of the East Pacific ocean [8]. The division of CPW, EPC and EPW is based on SSTA in Niño 3, Niño 3.4, and Niño 4 regions. ENSO Modoki is characterized by positive SSTA in the central Pacific, bounded by negative SSTA in the western and eastern Pacific [20]. Years dominated by CPW, EPC, and EPW are listed in Table 1.
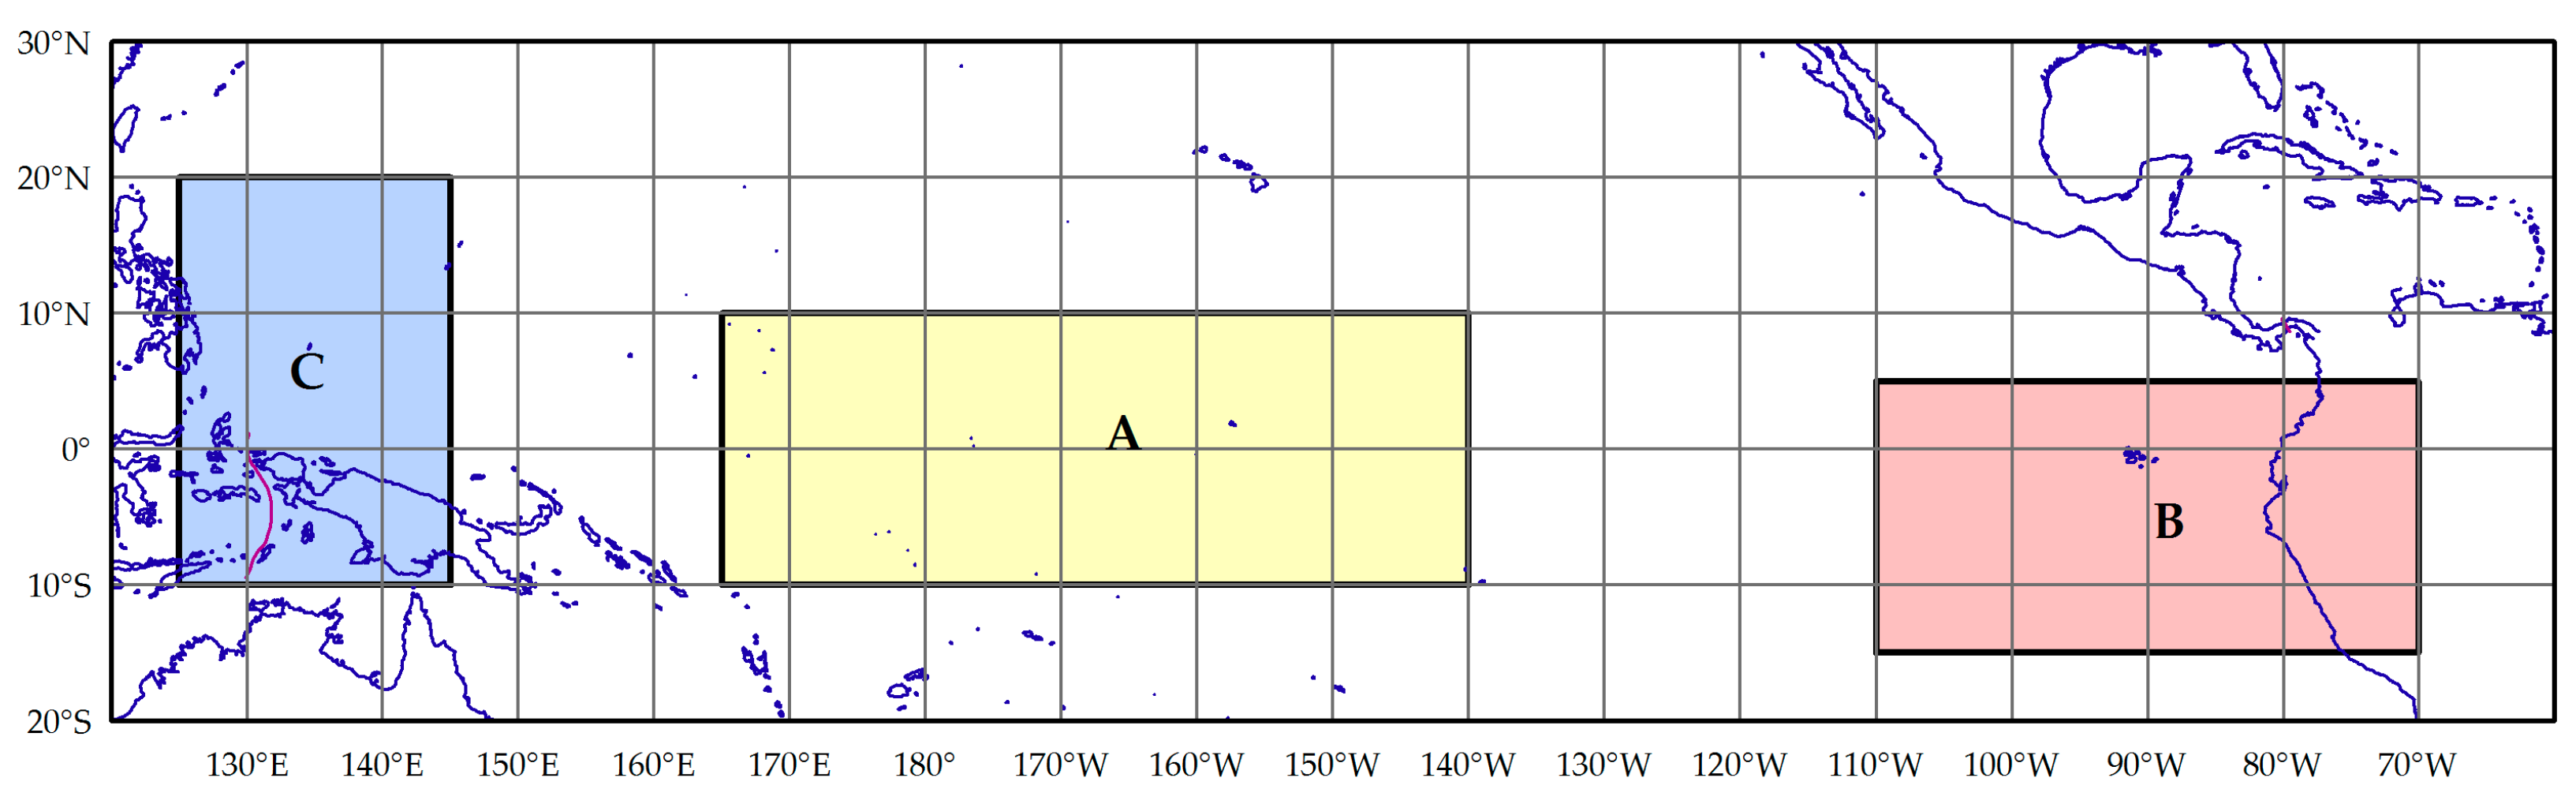
Conventional El Niño (La Niña), abbreviated as CEN (CLN), is defined as SSTA above (below) 0.7 SD (−0.7 SD) in the area of , where SD is the standard deviation [23]. El Niño (La Niña) Modoki, abbreviated as MEN (MLN), is defined as ENSO Modoki Index (EMI) above (below) 0.7 SD (−0.7 SD) [20]. , where [SSTA]A, [SSTA]B, [SSTA]C represents the SSTA in region A (), region B () and region C (), respectively, shown in Figure 2.
3.5. Precipitation Anomaly Index during the Rainy Season (PARS)
Precipitation anomaly index during the rainy season (PARS) was used to investigate the difference in precipitation between ENSO and normal years defined as
where denotes precipitation anomaly during the rainy season at station in year; denotes average daily precipitation during the rainy season at station in year, and denotes average daily precipitation during the rainy season at station in normal year. The normal year refers to a year without the occurrence of an ENSO event.
4. Results and Discussion
4.1. Spatial and Temporal Patterns of Rainy Season Features
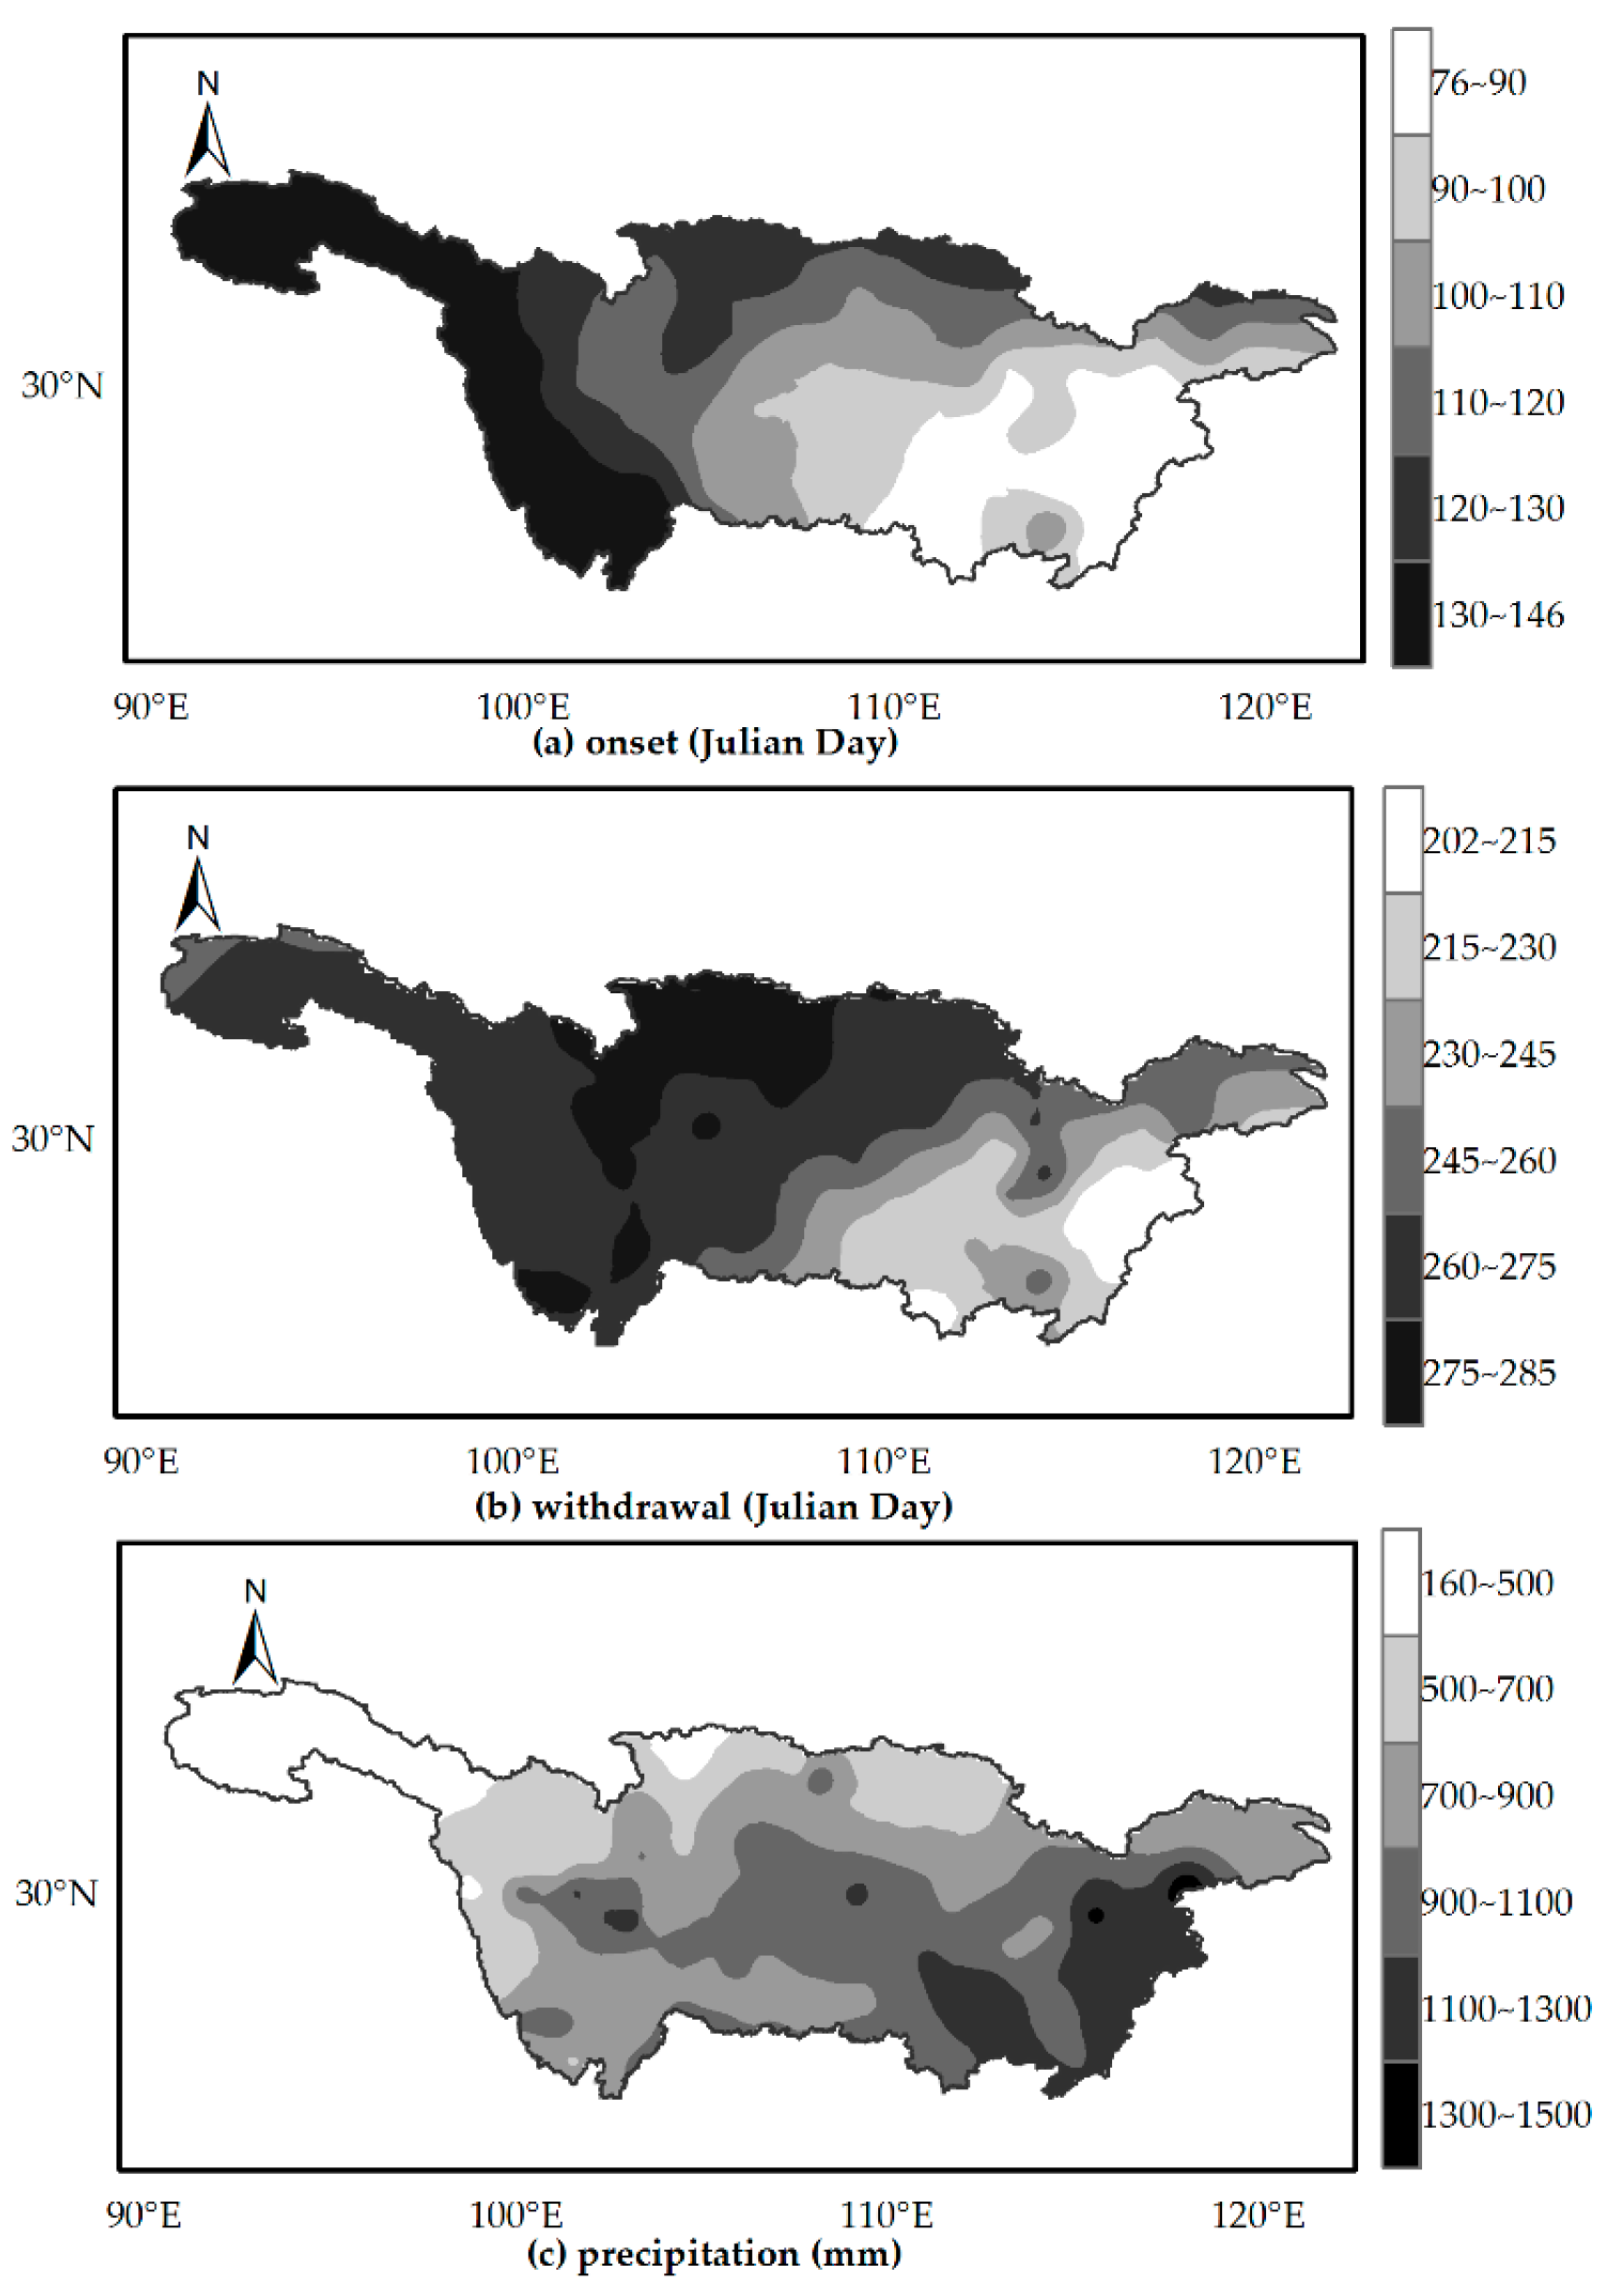
Spatial patterns of onset, withdrawal, and precipitation provide an overall understanding of rainy season characteristics. Figure 3 shows that the rainy season over the YRB begins at the earliest in March in southeastern parts of the middle and lower reaches. The onset progresses northwards ranging from March to early May in the lower reach and westwards ranging from March to late May in the upper and middle reaches. The rainy season starts at the latest at the end of May in western parts of the upper reach of the YRB. Similar to the distribution of onset, withdrawal occurs at the earliest in late July in the southeast corner of the lower reach and progresses northwards and westwards. The middle reach shows median withdrawal dates, ranging between early August in southeastern parts and late September in northwestern parts. The northern regions of the upper reach present the latest withdrawal dates in early October, with rainy season in other regions generally ending in late September. Different from spatial patterns of onset and withdrawal, rainy season precipitation is higher in the lower reach compared to the upper reach. More specifically, the western parts of the upper reach present the lowest precipitation (160–500 mm) that progresses southeastwards. The southern regions of the upper and middle reaches show medium rainy season precipitation, with 900–1300 mm. The highest precipitation during the rainy season over the YRB occurs in the south of the lower reach, ranging between 1300 and 1500 mm. In summary, the lower reach of the YRB presents the earliest onset and withdrawal dates and has the highest rainy season precipitation and the middle reach displays a medium onset, withdrawal dates, and precipitation. Rainy season starts and ends the latest in the upper reach, which demonstrates the lowest precipitation.
The spatial distribution of onset and withdrawal is consistent with research results of Ding et al. [41]. Onset and withdrawal generally progress northwards and westwards, which may be attributed to influence of the seasonal location of the East Asian monsoon [41]. Note that the rainy season determined in this study is not divided into more detailed types, such as the main rainy season and the pre-summer rainy season, but instead is a combination of these. For example, the rainy season in the lower reach of the YRB in this study is from March to July, which contain the spring rainy season period (from March to May) and the Mei-yu period (from June to July) [12,14]. Different from the spatial patterns of onset and withdrawal, rainy season precipitation is lowest in the western part of the upper reach and highest in the southeast of the lower reach. Precipitation increases from northwest to southeast parts of the YRB due to the influence of large-scale topography [41].
Figure 4 presents further insight into rainy season features by showing temporal variability. Dashed vertical lines in the figure represent the abrupt year determined by the Pettitt test. Dashed horizontal lines are the average values if there are no abrupt changes in the period 1960–2015. It is seen that there is a delayed trend for the onset at the inter-annual scale. An abrupt change point is detected in 1978, which was an El Niño Modoki year in the decaying phase. Before 1978, onset stabilized at Julian Day 106. After 1978, onset fluctuated generally, with an average onset of Julian Day 112. No abrupt change point was detected for the withdrawal, which reaches a stable level in September. Similarly, the temporal variability of rainy season precipitation does not show a mutation point. In summary, the average rainy season over the YRB is from April to September. Withdrawal and precipitation during the rainy season reached a stable level at the inter-annual scale and onset presented a delaying trend. Moreover, an abrupt change point (1978) was detected in year-to-year variations of onset. Gong et al. [11] argued that the prominent regime shift of rainy season precipitation in the 1970s over the YRB was closely related to the variability of SST in the eastern tropical Pacific, which is consistent with our study.
4.2. Precipitation Anomalies during the Rainy Season (PARS) Influenced by CPW, EPC, and EPW Regimes
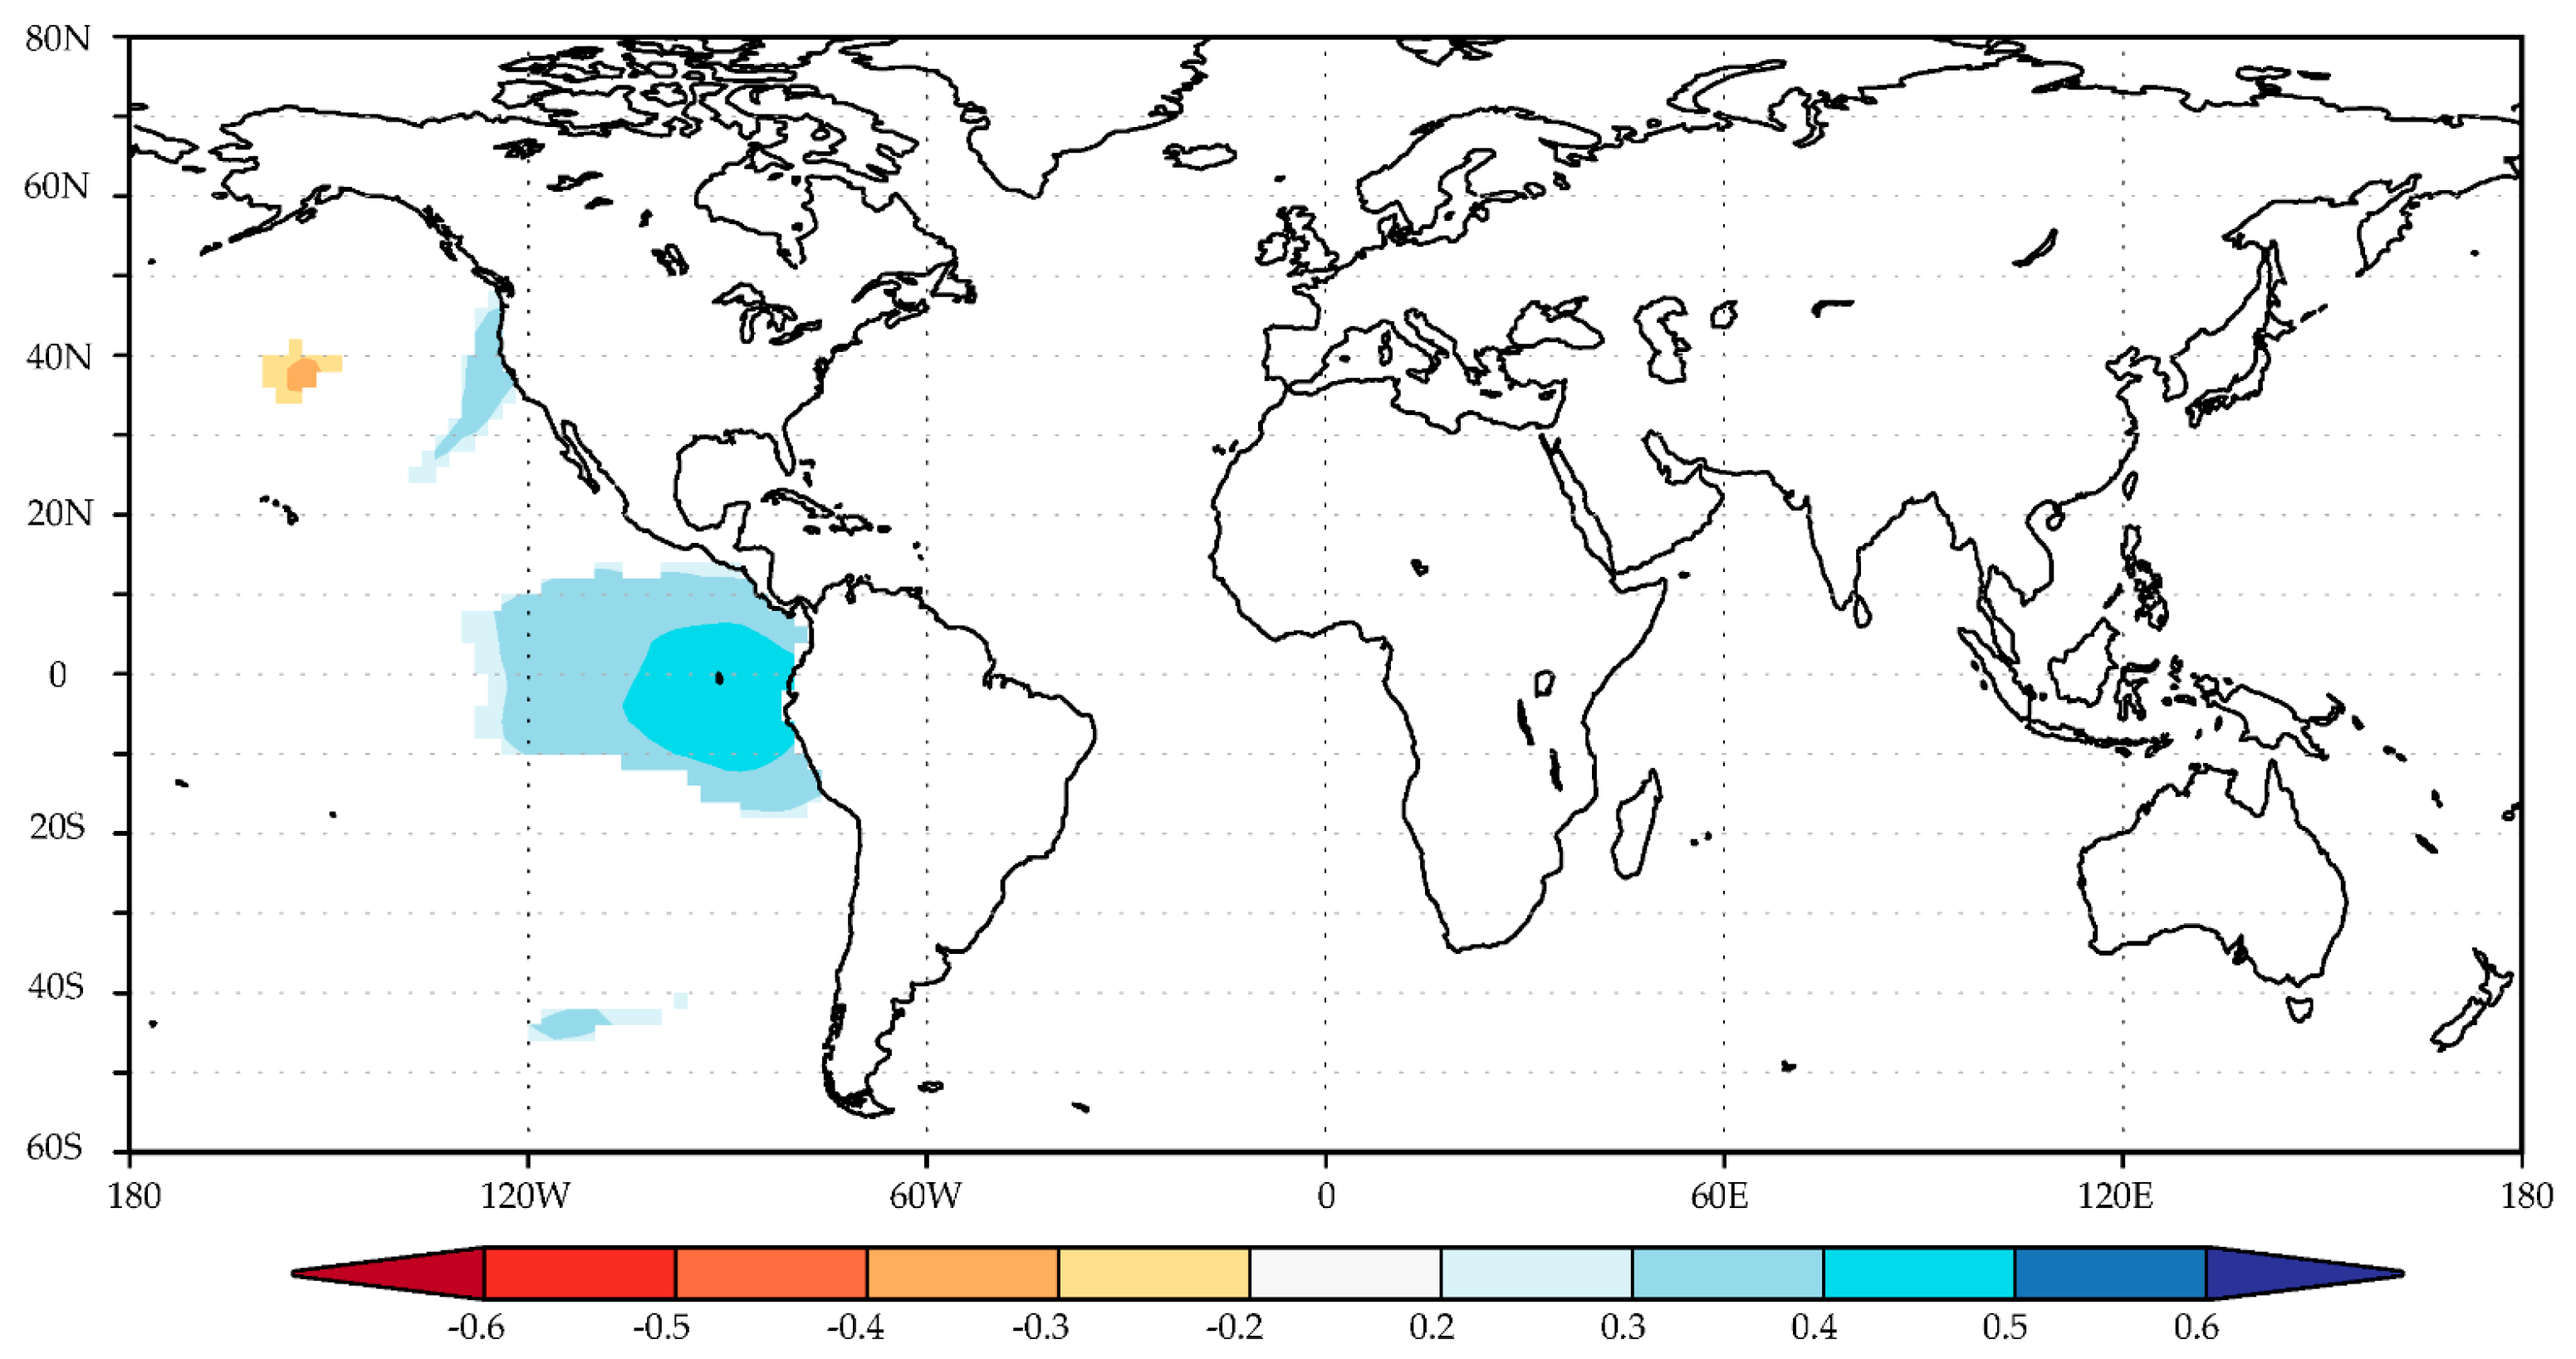
Figure 5 shows rainy season features associated with ENSO regimes by investigating the correlation between average rainy season precipitation over the Yangtze River Basin and average SST during July–December. Correlations between averaged rainy season precipitation and 6-month average moving SST in preceding periods, with a lag ranging between 1 and 12 months, were investigated. SSTA in Northern and Western Pacific is one of the predictors for precipitation in China [42]. The lag combination with the strongest correlation is shown in Figure 5 (July–December SST with April–September averaged rainy season precipitation). Precipitation during the rainy season was generally positively correlated with preceding Pacific SST (statistically significant at the 0.05 level), indicating that warm SST results in increasing precipitation over the YRB. Niu et al. [42] analyzed the lag-correlation between SSTA and autumn precipitation over South China. They found that SSTA in July shows the strongest correlation with precipitation and leads to autumn precipitation over South China. SSTA in northern and western Pacific contributes to precipitation in China through its close relationship with the western Pacific subtropical high [42].
SST from July to December during the preceding year (lagging 9 months) in eastern and central Pacific has the largest influence on rainy season precipitation. Moreover, SST regions showing strong correlation to rainy season precipitation over the YRB are mainly concentrated in the Niño 3 region, which is the main area of ENSO influence. Thus, it is clear that rainy season precipitation is sensitive to ENSO-related SSTs at the interannual time scale, which is consistent with the research of Ping et al. [10]. Impacts of various ENSO types on precipitation during the rainy season over the YRB are further elaborated below.
The spatial variability of rainy season precipitation anomalies influenced by CPW, EPC, and EPW regimes in the developing and decaying phases is demonstrated in Figure 6. The western part of the upper reach showed the largest negative precipitation anomaly during the developing CPW phase, with values of 5–10% below average precipitation. Similarly, the eastern regions of the lower reach also presented below normal precipitation. The largest positive precipitation anomalies were displayed for the middle reach, with 10–15% above average precipitation. In contrast, most parts of the YRB demonstrated suppressed rainfall for years with the decaying CPW phase, with the largest values reaching 10–15% above mean precipitation in the lower reach. It should be noted that precipitation anomalies are higher during the CPW decaying phase as compared to the CPW developing phase. The EPC developing phase shows a regular spatial distribution, with western parts of the upper reach having negative PARS (−5–0%) and other areas having positive values. Positive PARS values increased eastwards. Unlike the EPC developing phase, most parts showed dry signals in the decaying phase of EPC, with largest negative PARS (approximately −15%) in the south of middle and lower reaches. The developing EPW demonstrated the most serious dry conditions during the rainy season and the situation is more severe northwards, reaching 10–20% below average precipitation in the northern upper and middle reaches. The decaying EPW showed different rainy season precipitation spatial distribution as compared to the developing phase. Most regions over the YRB presented positive PARS values, with the largest values in the lower reach (20–25%). In conclusion, the CPW and EPW decaying phases are more flood-prone as compared to the corresponding developing phases. The EPC decaying and EPW developing phases should, however, also be noted, because they display, in general, dry signals suggesting a risk for drought. It can be pointed out that the increase or decrease of the precipitation anomaly is statistically significant over the YRB. EPC and EPW showed the same dry signals for the YRB despite their different SST characteristics because (1) they are under different ENSO phases (the developing phase for EPW and the decaying phase for EPC) and the influence of ENSO on precipitation varies in different ENSO phases in a given location; (2) the dry signal is an evaluation of mean precipitation anomalies for ENSO years for the period of 1960–2015. For example, Zhang et al. [31] explored the influence of ENSO on precipitation over the Huaihe River Basin (HRB) and found that both EPC and EPW in the developing phase are indicative of dry signals in the western parts of the HRB. El Niño and La Niña also presented wet signals during the same period over the north-east of the HRB despite their different SST features. Therefore, it is possible that the developing EPW and the decaying EPC are both indicative of drought in this study.
4.3. Precipitation Anomaly during the Rainy Season (PARS) Impacted by ENSO and ENSO Modoki Regimes
Figure 7 shows the spatial distribution of rainy season precipitation over the YRB during conventional ENSO and ENSO Modoki for years with the developing phase. The middle reach and the central regions of the upper reach presented negative precipitation anomalies with values ranging between −10% and 0% for the CEN developing phase (Figure 7a). In comparison, the lower reach and eastern and western parts of the upper reach displayed generally wet signals (0–25%). The MEN developing phase (Figure 7b) demonstrated relatively regular spatial pattern in comparison to the CEN developing phase, and approximately 70% of YRB had positive rainy season precipitation anomalies, with values ranging from 0% to 10%. The lower reach and central parts of the upper reach for the La Niña developing phase had positive precipitation anomalies, with the largest values reaching 15% in the southern upper reach (Figure 7c). The western corner of the upper reach and the whole middle reach showed generally negative PARS values. Large areas of the YRB showed depressed precipitation in the developing phase of La Niña Modoki, with the largest negative values occurring in the southern upper reach (−10–5%). In summary, ENSO Modoki in the developing phase should receive more attention as compared to the corresponding ENSO phase, since it has higher positive PARS or lower negative PARS. The influence of ENSO and ENSO Modoki in the developing phase is statistically significant.
Spatial variability of PARS for the decaying ENSO and ENSO Modoki events is shown in Figure 8. Most of the YRB presents wet signals for the decaying years of CEN (Figure 8a), with largest PARS reaching 20%. Above normal precipitation is observed over the YRB in the decaying phase of El Niño, which is consistent with the research of Feng et al. [35] and Wang et al. [14]. Feng et al. [35] pointed out that higher rainy season precipitation in the decaying El Niño is attributed to the lower tropospheric WNP anomalous anti-cyclone, sustained WNP sub-tropical high and moisture transport from the western Pacific to Southern China and from the northern part of India to Southern China. Approximately 70% of the upper reach showed positive PARS (0–5%), with other parts and middle and lower reaches having negative values (−5–0%) in the decaying El Niño Modoki (Figure 8b). Feng et al. [35] argued that obvious variation of precipitation is observed in the decaying El Niño, with no significant variability in the decaying El Niño Modoki, which is in agreement with our research. Different from the decaying El Niño, La Niña in the decaying phase demonstrates, in general, dry signals over the YRB. The extent of negative PARS shrinks for years with the La Niña Modoki decaying phase, with the northern corner of the upper and lower reaches showing positive values. The impact of the decaying ENSO and ENSO Modoki on precipitation anomaly over the YRB is significant, which is similar to that of the developing phase.
In conclusion, conventional ENSO regimes in the decaying phase present more obvious wet or dry signals as compared to the corresponding ENSO Modoki phase. However, ENSO Modoki in the developing phase plays a relatively more significant role in rainy season precipitation over the YRB in comparison to conventional ENSO developing phase. Thus, ENSO and ENSO Modoki phases are of equal significance for precipitation over the YRB.
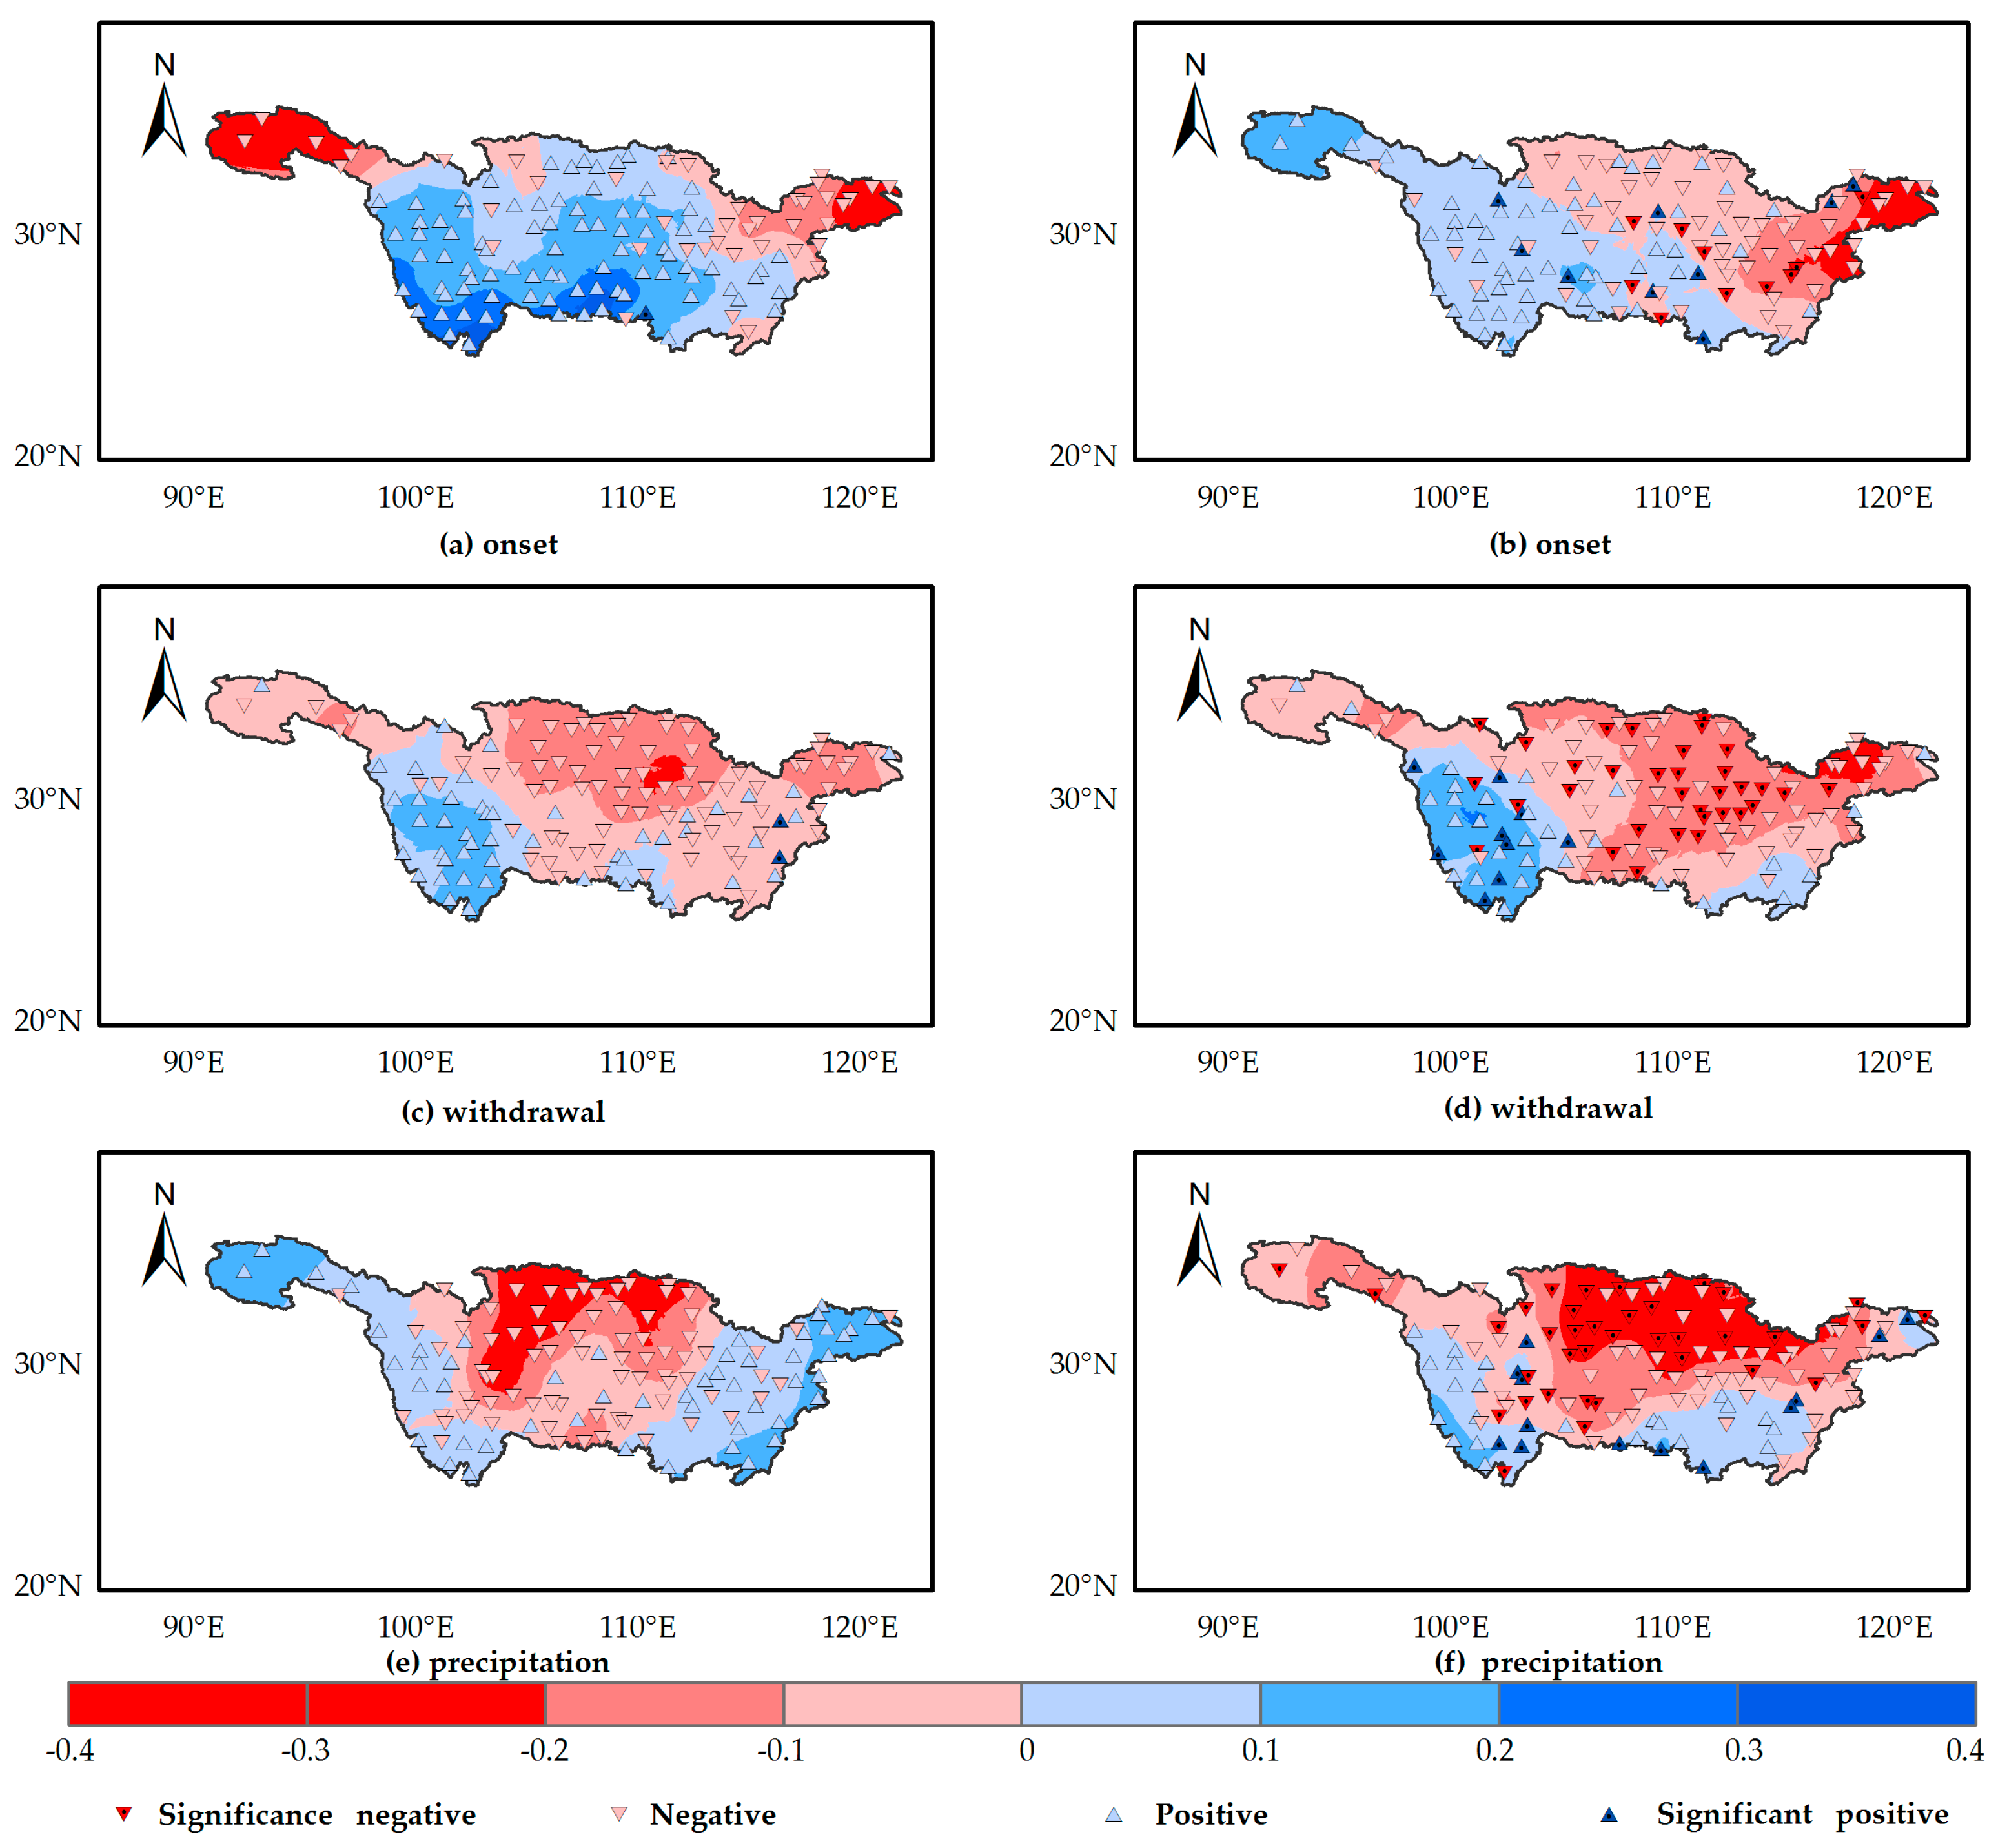
Figure 9 presented the possible relationships between ENSO, ENSO Modoki and rainy season features (i.e., onset, withdrawal and precipitation) over the YRB. It can be seen from Figure 9 that positive relationships can be identified between onset and Niño 3.4 SSTA in most parts of the YRB, implying that an increase of SST in ENSO regions could increase precipitation over the basin (Figure 9a). Comparatively, northeastern regions of the YRB had negative correlation between EMI and onset of the rainy season (Figure 9b), with southwestern parts showing positive relationship. The correlation between onset and ENSO and ENSO Modoki is not statistically significant. Similar relationships can be observed between ENSO, ENSO Modoki regions, withdrawal and precipitation of the rainy season, which presented a negative relationship over most parts of the YRB. The difference between them lies in that the correlation between ENSO Modoki and withdrawal and precipitation is statistically significant, but the relationship between ENSO and them is insignificant.
In general, impacts of ENSO on rainy season precipitation vary with the different phases of the ENSO regimes, which is in agreement with Wang et al. [43]. The variation of ENSO-induced rainfall over the YRB is related to the East-Asian summer monsoon, the western Pacific subtropical high, and the general atmospheric circulation [10,44,45]. ENSO-induced flooding is closely associated with the South Asia high center and the East Asia summer monsoon development [46]. Wu et al. [45] argued that droughts and floods over the YRB are related to the global large-scale atmospheric singularities. Hence, it is suggested that further studies can explore the prediction of rainy season precipitation under ENSO regimes through the investigation of their underlying causes (i.e., the atmospheric circulation, the western Pacific subtropical high).
5. Conclusions
This study investigated the spatial and temporal distribution of rainy season characteristics over the YRB. We explored the influence of different ENSO types during the developing and decaying phases on rainy season precipitation. The main conclusions are the following:
- (1)
- The rainy season over the YRB starts in early March in southeastern parts of the basin and progresses north-and westwards, with latest onset occurring in late May in western parts of the upper reach. The temporal distribution of withdrawal is similar to onset, with rainy season ending at the earliest in mid-July in the southeastern region and at the latest in mid-October in the northern parts of the upper reach of the YRB. In contrast to the spatial pattern of onset and withdrawal, rainy season precipitation increases from the northwest (160–500 mm) to southeast (1300–1500 mm). Withdrawal and rainy season precipitation generally display a stable temporal distribution at the interannual scale, but onset has a tendency to become more and more delayed.
- (2)
- CPW and EPW in their decaying phases are indicating wetter signals as compared to the corresponding the developing phases. The decaying EPC and developing EPW are important since they signal dry spells in most areas of the YRB.
- (3)
- ENSO Modoki for years with the developing phase appear to present wetter or drier signals as compared to the corresponding conventional ENSO regimes. In contrast, conventional ENSO regimes in the decaying phase play a more significant role in flooding and drought monitoring as compared to ENSO Modoki, since it presents wetter or drier signals.
Acknowledgements
Funding from the National Key Research Projects (Grant No. 2016YFC0402704) and the National Natural Science Foundation of China (Grant No. 41371047) is gratefully acknowledged. Support from the China Postdoctoral Science Foundation (Grant No. 2016M601711) and the Jiangsu Planning Projects for Postdoctoral Research Funds (Grant No. 1601027B) is appreciated.
Author Contributions
Qing Cao planned the work together with the co-authors, performed the statistical analysis, analyzed the results and wrote the paper together with the co-authors. The co-authors participated in discussions and helped to revise the paper.
Conflicts of Interest
The authors declare no conflict of interest.
References
- McPhaden, M.J.; Zebiak, S.E.; Glantz, M.H. ENSO as an integrating concept in earth science. Science 2006, 314, 1740–1745. [Google Scholar] [CrossRef] [PubMed]
- Kayano, M.T.; Andreoli, R.V. Relationships between rainfall anomalies over northeastern Brazil and the El Niño–Southern Oscillation. J. Geophys. Res. Atmos. 2006, 111, D13101. [Google Scholar] [CrossRef]
- Zhang, W.; Jin, F.F.; Stuecker, M.F.; Wittenberg, A.T.; Timmermann, A.; Ren, H.L.; Kug, J.S.; Cai, W.; Cane, M. Unraveling El Niño’s impact on the East Asian Monsoon and Yangtze River summer flooding. Geophys. Res. Lett. 2016, 43, 11375–11382. [Google Scholar] [CrossRef]
- Xiao, M.; Zhang, Q.; Singh, V.P. Influences of ENSO, NAO, IOD and PDO on seasonal precipitation regimes in the Yangtze River basin, China. Int. J. Climatol. 2015, 35, 3556–3567. [Google Scholar] [CrossRef]
- Yuan, F.; Berndtsson, R.; Uvo, C.B.; Zhang, L.; Jiang, P. Summer precipitation prediction in the source region of the Yellow River using climate indices. Hydrol. Res. 2016, 47, 847–856. [Google Scholar] [CrossRef]
- Yuan, F.; Yasuda, H.; Berndtsson, R.; Bertacchi Uvo, C.; Zhang, L.; Hao, Z.; Wang, X. Regional sea-surface temperatures explain spatial and temporal variation of summer precipitation in the source region of the Yellow River. Hydrol. Sci. J. 2016, 61, 1383–1394. [Google Scholar] [CrossRef]
- Andrews, E.; Antweiler, R.C.; Neiman, P.J.; Ralph, F.M. Influence of ENSO on flood frequency along the California coast. J. Clim. 2004, 17, 337–348. [Google Scholar] [CrossRef]
- Kim, H.-M.; Webster, P.J.; Curry, J.A. Impact of shifting patterns of Pacific Ocean warming on North Atlantic tropical cyclones. Science 2009, 325, 77–80. [Google Scholar] [CrossRef] [PubMed]
- Larkin, N.K.; Harrison, D. On the definition of El Niño and associated seasonal average US weather anomalies. Geophys. Res. Lett. 2005, 32, L13705. [Google Scholar] [CrossRef]
- Ping, F.; Luo, Z.; Ju, J. Differences between dynamics factors for interannual and decadal variations of rainfall over the Yangtze River valley during flood seasons. Sci. Bull. 2006, 51, 994–999. [Google Scholar] [CrossRef]
- Gong, D.Y.; Ho, C.H. Shift in the summer rainfall over the Yangtze River valley in the late 1970s. Geophys. Res. Lett. 2002, 29, 101436. [Google Scholar] [CrossRef]
- Qian, W.; Kang, H.-S.; Lee, D.-K. Distribution of seasonal rainfall in the East Asian monsoon region. Theor. Appl. Climatol. 2002, 73, 151–168. [Google Scholar] [CrossRef]
- Gemmer, M.; Jiang, T.; Su, B.; Kundzewicz, Z.W. Seasonal precipitation changes in the wet season and their influence on flood/drought hazards in the Yangtze River Basin, China. Quatern. Int. 2008, 186, 12–21. [Google Scholar] [CrossRef]
- Wang, X.; Wang, D.; Zhou, W.; Li, C. Interdecadal modulation of the influence of La Niña events on mei-yu rainfall over the Yangtze River Valley. Adv. Atmos. Sci. 2012, 29, 157–168. [Google Scholar] [CrossRef]
- Omotosho, J.B.; Balogun, A.; Ogunjobi, K. Predicting monthly and seasonal rainfall, onset and cessation of the rainy season in West Africa using only surface data. Int. J. Climatol. 2000, 20, 865–880. [Google Scholar] [CrossRef]
- Ingram, K.; Roncoli, M.; Kirshen, P. Opportunities and constraints for farmers of west Africa to use seasonal precipitation forecasts with Burkina Faso as a case study. Agric. Syst. 2002, 74, 331–349. [Google Scholar] [CrossRef]
- Barbier, B.; Yacouba, H.; Karambiri, H.; Zoromé, M.; Somé, B. Human vulnerability to climate variability in the Sahel: Farmers’ adaptation strategies in northern Burkina Faso. Environ. Manag. 2009, 43, 790–803. [Google Scholar] [CrossRef] [PubMed]
- Marteau, R.; Sultan, B.; Moron, V.; Alhassane, A.; Baron, C.; Traoré, S.B. The onset of the rainy season and farmers’ sowing strategy for pearl millet cultivation in Southwest Niger. Agric. For. Meteorol. 2011, 151, 1356–1369. [Google Scholar] [CrossRef]
- Weng, H.; Ashok, K.; Behera, S.K.; Rao, S.A.; Yamagata, T. Impacts of recent El Niño Modoki on dry/wet conditions in the Pacific rim during boreal summer. Clim. Dyn. 2007, 29, 113–129. [Google Scholar] [CrossRef]
- Ashok, K.; Behera, S.K.; Rao, S.A.; Weng, H.; Yamagata, T. El Niño Modoki and its possible teleconnection. J. Geophys. Res. Oceans 2007, 112, C11007. [Google Scholar] [CrossRef]
- Kao, H.-Y.; Yu, J.-Y. Contrasting eastern-Pacific and central-Pacific types of ENSO. J. Clim. 2009, 22, 615–632. [Google Scholar] [CrossRef]
- Taschetto, A.S.; England, M.H. El Niño Modoki impacts on Australian rainfall. J. Clim. 2009, 22, 3167–3174. [Google Scholar] [CrossRef]
- Tedeschi, R.G.; Cavalcanti, I.F.A.; Grimm, A.M. Influences of two types of ENSO on South American precipitation. Int. J. Climatol. 2013, 33, 1382–1400. [Google Scholar] [CrossRef]
- Preethi, B.; Sabin, T.P.; Adedoyin, J.A.; Ashok, K. Impacts of the ENSO Modoki and other tropical Indo-Pacific climate-drivers on African rainfall. Sci. Rep. 2015, 5, 16653. [Google Scholar] [CrossRef] [PubMed]
- Feng, J.; Wang, L.; Chen, W.; Fong, S.K.; Leong, K.C. Different impacts of two types of Pacific Ocean warming on Southeast Asian rainfall during boreal winter. J. Geophys. Res. Atmos. 2010, 115, D24122. [Google Scholar] [CrossRef]
- Cai, W.; Van Rensch, P.; Cowan, T.; Sullivan, A. Asymmetry in ENSO teleconnection with regional rainfall, its multidecadal variability, and impact. J. Clim. 2010, 23, 4944–4955. [Google Scholar] [CrossRef]
- Black, E.; Slingo, J.; Sperber, K.R. An observational study of the relationship between excessively strong short rains in coastal East Africa and Indian Ocean SST. Mon. Weather Rev. 2003, 131, 74–94. [Google Scholar] [CrossRef]
- Chang, C.; Harr, P.; Ju, J. Possible roles of Atlantic circulations on the weakening Indian monsoon rainfall—ENSO relationship. J. Clim. 2001, 14, 2376–2380. [Google Scholar] [CrossRef]
- Onyutha, C.; Willems, P. Spatial and temporal variability of rainfall in the Nile Basin. Hydrol. Earth Syst. Sci. 2015, 19, 2227–2246. [Google Scholar] [CrossRef]
- Wu, R.; Hu, Z.-Z.; Kirtman, B.P. Evolution of ENSO—Related rainfall anomalies in East Asia. J. Clim. 2003, 16, 3742–3758. [Google Scholar] [CrossRef]
- Zhang, Q.; Wang, Y.; Singh, V.P.; Gu, X.; Kong, D.; Xiao, M. Impacts of ENSO and ENSO Modoki+A regimes on seasonal precipitation variations and possible underlying causes in the Huai River basin, China. J. Hydrol. 2016, 533, 308–319. [Google Scholar] [CrossRef]
- Feng, J.; Li, J. Contrasting impacts of two types of ENSO on the boreal spring Hadley circulation. J. Clim. 2013, 26, 4773–4789. [Google Scholar] [CrossRef]
- Zhang, W.; Jin, F.-F.; Li, J.; Ren, H.-L. Contrasting impacts of two-type El Niño over the Western North Pacific during boreal autumn. J. Meteor. Soc. Jpn. 2011, 89, 563–569. [Google Scholar] [CrossRef]
- Zhou, W.; Chan, J.C. ENSO and the South China Sea summer monsoon onset. Int. J. Climatol. 2007, 27, 157–167. [Google Scholar] [CrossRef]
- Feng, J.; Chen, W.; Tam, C.Y.; Zhou, W. Different impacts of El Niño and El Niño Modoki on China rainfall in the decaying phases. Int. J. Climatol. 2011, 31, 2091–2101. [Google Scholar] [CrossRef]
- Zhang, W.; Jin, F.F.; Turner, A. Increasing autumn drought over southern China associated with ENSO regime shift. Geophys. Res. Lett. 2014, 41, 4020–4026. [Google Scholar] [CrossRef]
- Jiang, J.; Klaus, F.; Zou, Y. A Scanning t test of multiscale abrupt changes and its coherence analysis. Chin. J. Geophys. 2001, 44, 31–39. [Google Scholar]
- Wang, H.; Xiao, W.; Wang, J.; Wang, Y.; Huang, Y.; Hou, B.; Lu, C. The Impact of Climate Change on the Duration and Division of Flood Season in the Fenhe River Basin, China. Water 2016, 8, 105. [Google Scholar] [CrossRef]
- Pettitt, A.N. A non-parametric approach to the change-point problem. Appl. Stat. 1979, 28, 126–135. [Google Scholar] [CrossRef]
- Pearson, K. Note on regression and inheritance in the case of two parents. Proc. R. Soc. Lond. 1895, 58, 240–242. [Google Scholar] [CrossRef]
- Ding, Y.; Wang, Z. A study of rainy seasons in China. Meteorol. Atmos. Phys. 2008, 100, 121–138. [Google Scholar] [CrossRef]
- Niu, N.; Li, J. Interannual variability of autumn precipitation over South China and its relation to atmospheric circulation and SST anomalies. Adv. Atmos. Sci. 2008, 25, 117–125. [Google Scholar] [CrossRef]
- Wang, B.; Wu, R.; Lau, K. Interannual variability of the Asian summer monsoon: Contrasts between the Indian and the western North Pacific–East Asian monsoons. J. Clim. 2001, 14, 4073–4090. [Google Scholar] [CrossRef]
- Nan, S.; Li, J. The relationship between the summer precipitation in the Yangtze River valley and the boreal spring Southern Hemisphere annular mode. Geophys. Res. Lett. 2003, 30, 242266. [Google Scholar] [CrossRef]
- Wu, Z.; Li, J.; He, J.; Jiang, Z. Large-scale atmospheric singularities and summer long-cycle droughts-floods abrupt alternation in the middle and lower reaches of the Yangtze River. Sci. Bull. 2006, 51, 2027–2034. [Google Scholar] [CrossRef]
- Ping, F.; Tang, X.; Gao, S.; Luo, Z. A comparative study of the atmospheric circulations associated with rainy-season floods between the Yangtze and Huaihe River Basins. Sci. China Earth Sci. 2014, 57, 1464–1479. [Google Scholar] [CrossRef]
Figure 1.
The Yangtze River Basin and the spatial distribution of precipitation stations used in this study. Yichang and Hukou stations are stations classifying the upper, middle and lower reaches of the YRB, which are presented by stars in this figure.
Figure 1.
The Yangtze River Basin and the spatial distribution of precipitation stations used in this study. Yichang and Hukou stations are stations classifying the upper, middle and lower reaches of the YRB, which are presented by stars in this figure.
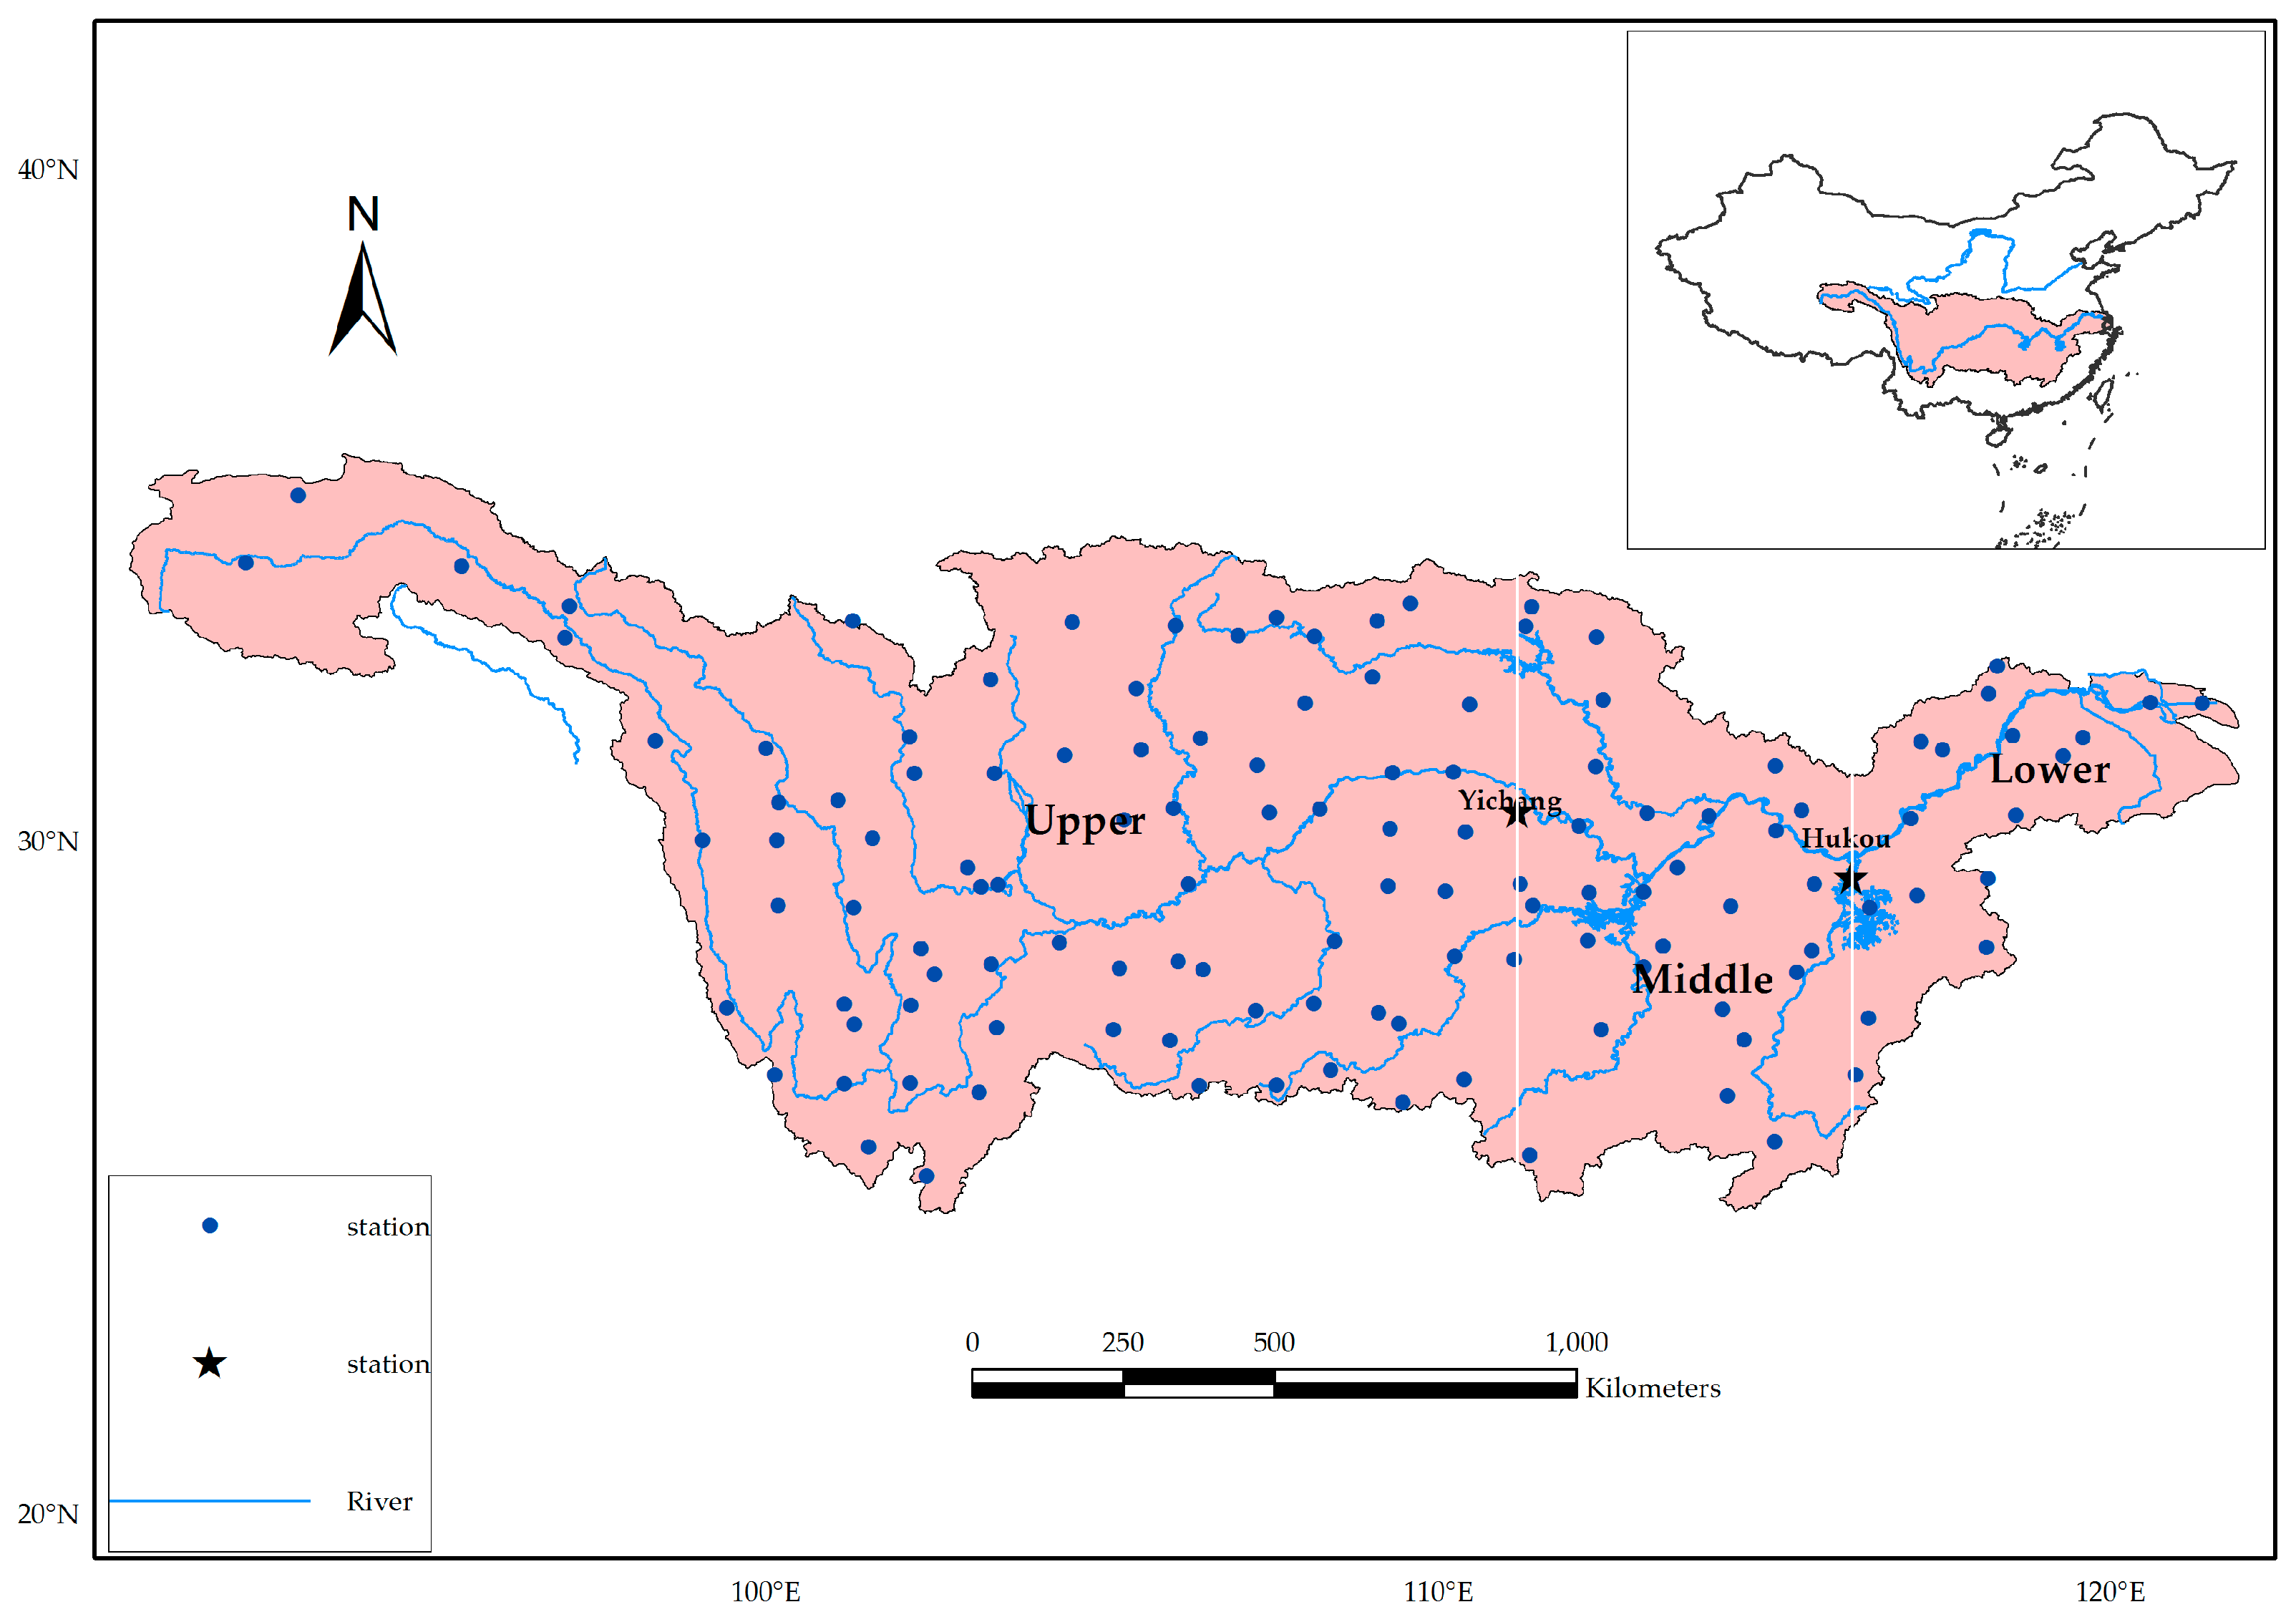
Figure 2.
Ocean areas defined as ENSO Modoki. (A: 10°S–10°N, 165°E–140°W; B: 15°S–5°N, 110°W–70°W; C: 10°S–20°N, 125°E–145°E).
Figure 2.
Ocean areas defined as ENSO Modoki. (A: 10°S–10°N, 165°E–140°W; B: 15°S–5°N, 110°W–70°W; C: 10°S–20°N, 125°E–145°E).

Figure 3.
Spatial pattern of average onset, withdrawal, and rainy season precipitation over the YRB for the period 1960–2015.
Figure 3.
Spatial pattern of average onset, withdrawal, and rainy season precipitation over the YRB for the period 1960–2015.

Figure 4.
Inter-annual variability of onset, withdrawal, and rainy season precipitation over the YRB.
Figure 4.
Inter-annual variability of onset, withdrawal, and rainy season precipitation over the YRB.
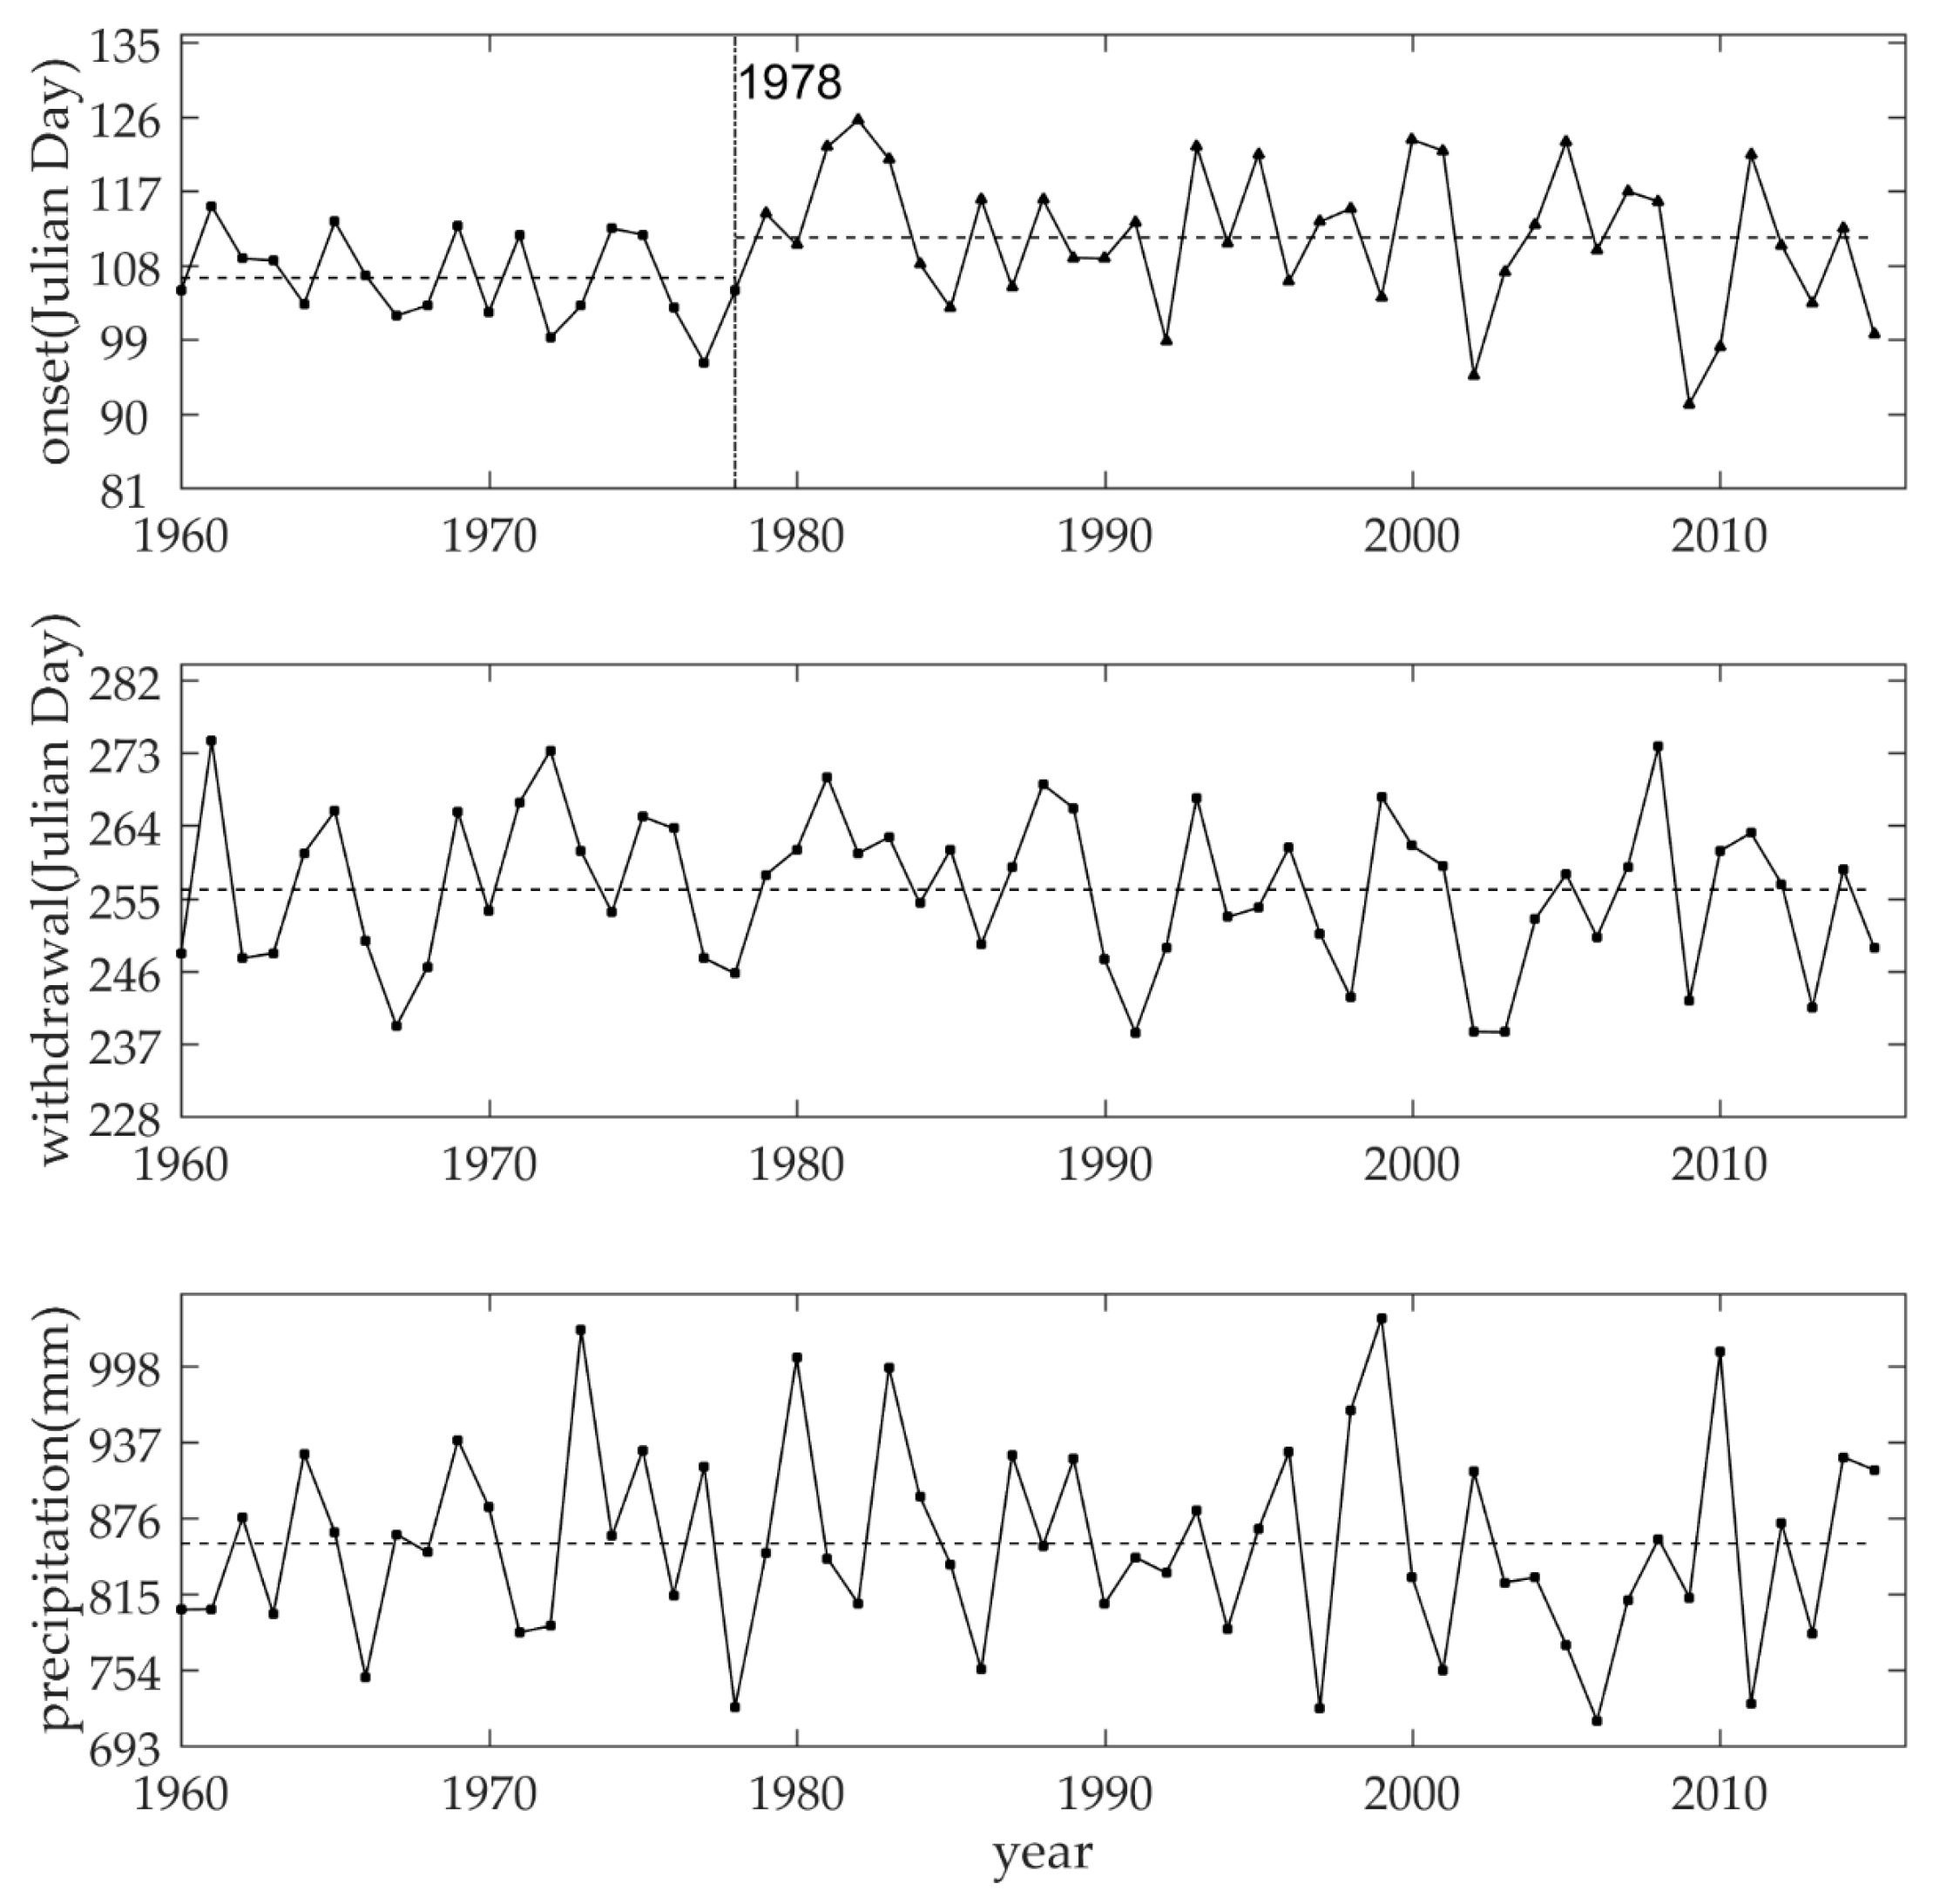
Figure 5.
Correlation between April–September average rainy season precipitation over the Yangtze River Basin and July–December (–) average SST. The “–” within the parenthesis denotes SST preceding precipitation during the rainy season. The results are significant at the 0.05 significance level.
Figure 5.
Correlation between April–September average rainy season precipitation over the Yangtze River Basin and July–December (–) average SST. The “–” within the parenthesis denotes SST preceding precipitation during the rainy season. The results are significant at the 0.05 significance level.

Figure 6.
Spatial pattern for rainy season precipitation anomaly (PARS) over the YRB during CPW (first row), EPC (second row), and EPW (third row) episodes in the ENSO developing (year 0) and decaying phase (year 1). The “0” in the parenthesis denotes the ENSO developing year and “1” denotes the decaying year. Significantly positive/negative means significant positive/negative precipitation anomaly. Negative/positive means negative/positive precipitation anomaly. Filled circles with solid dots indicate significant differences between the precipitation anomaly during normal years and that during CPW, EPC, EPW years.
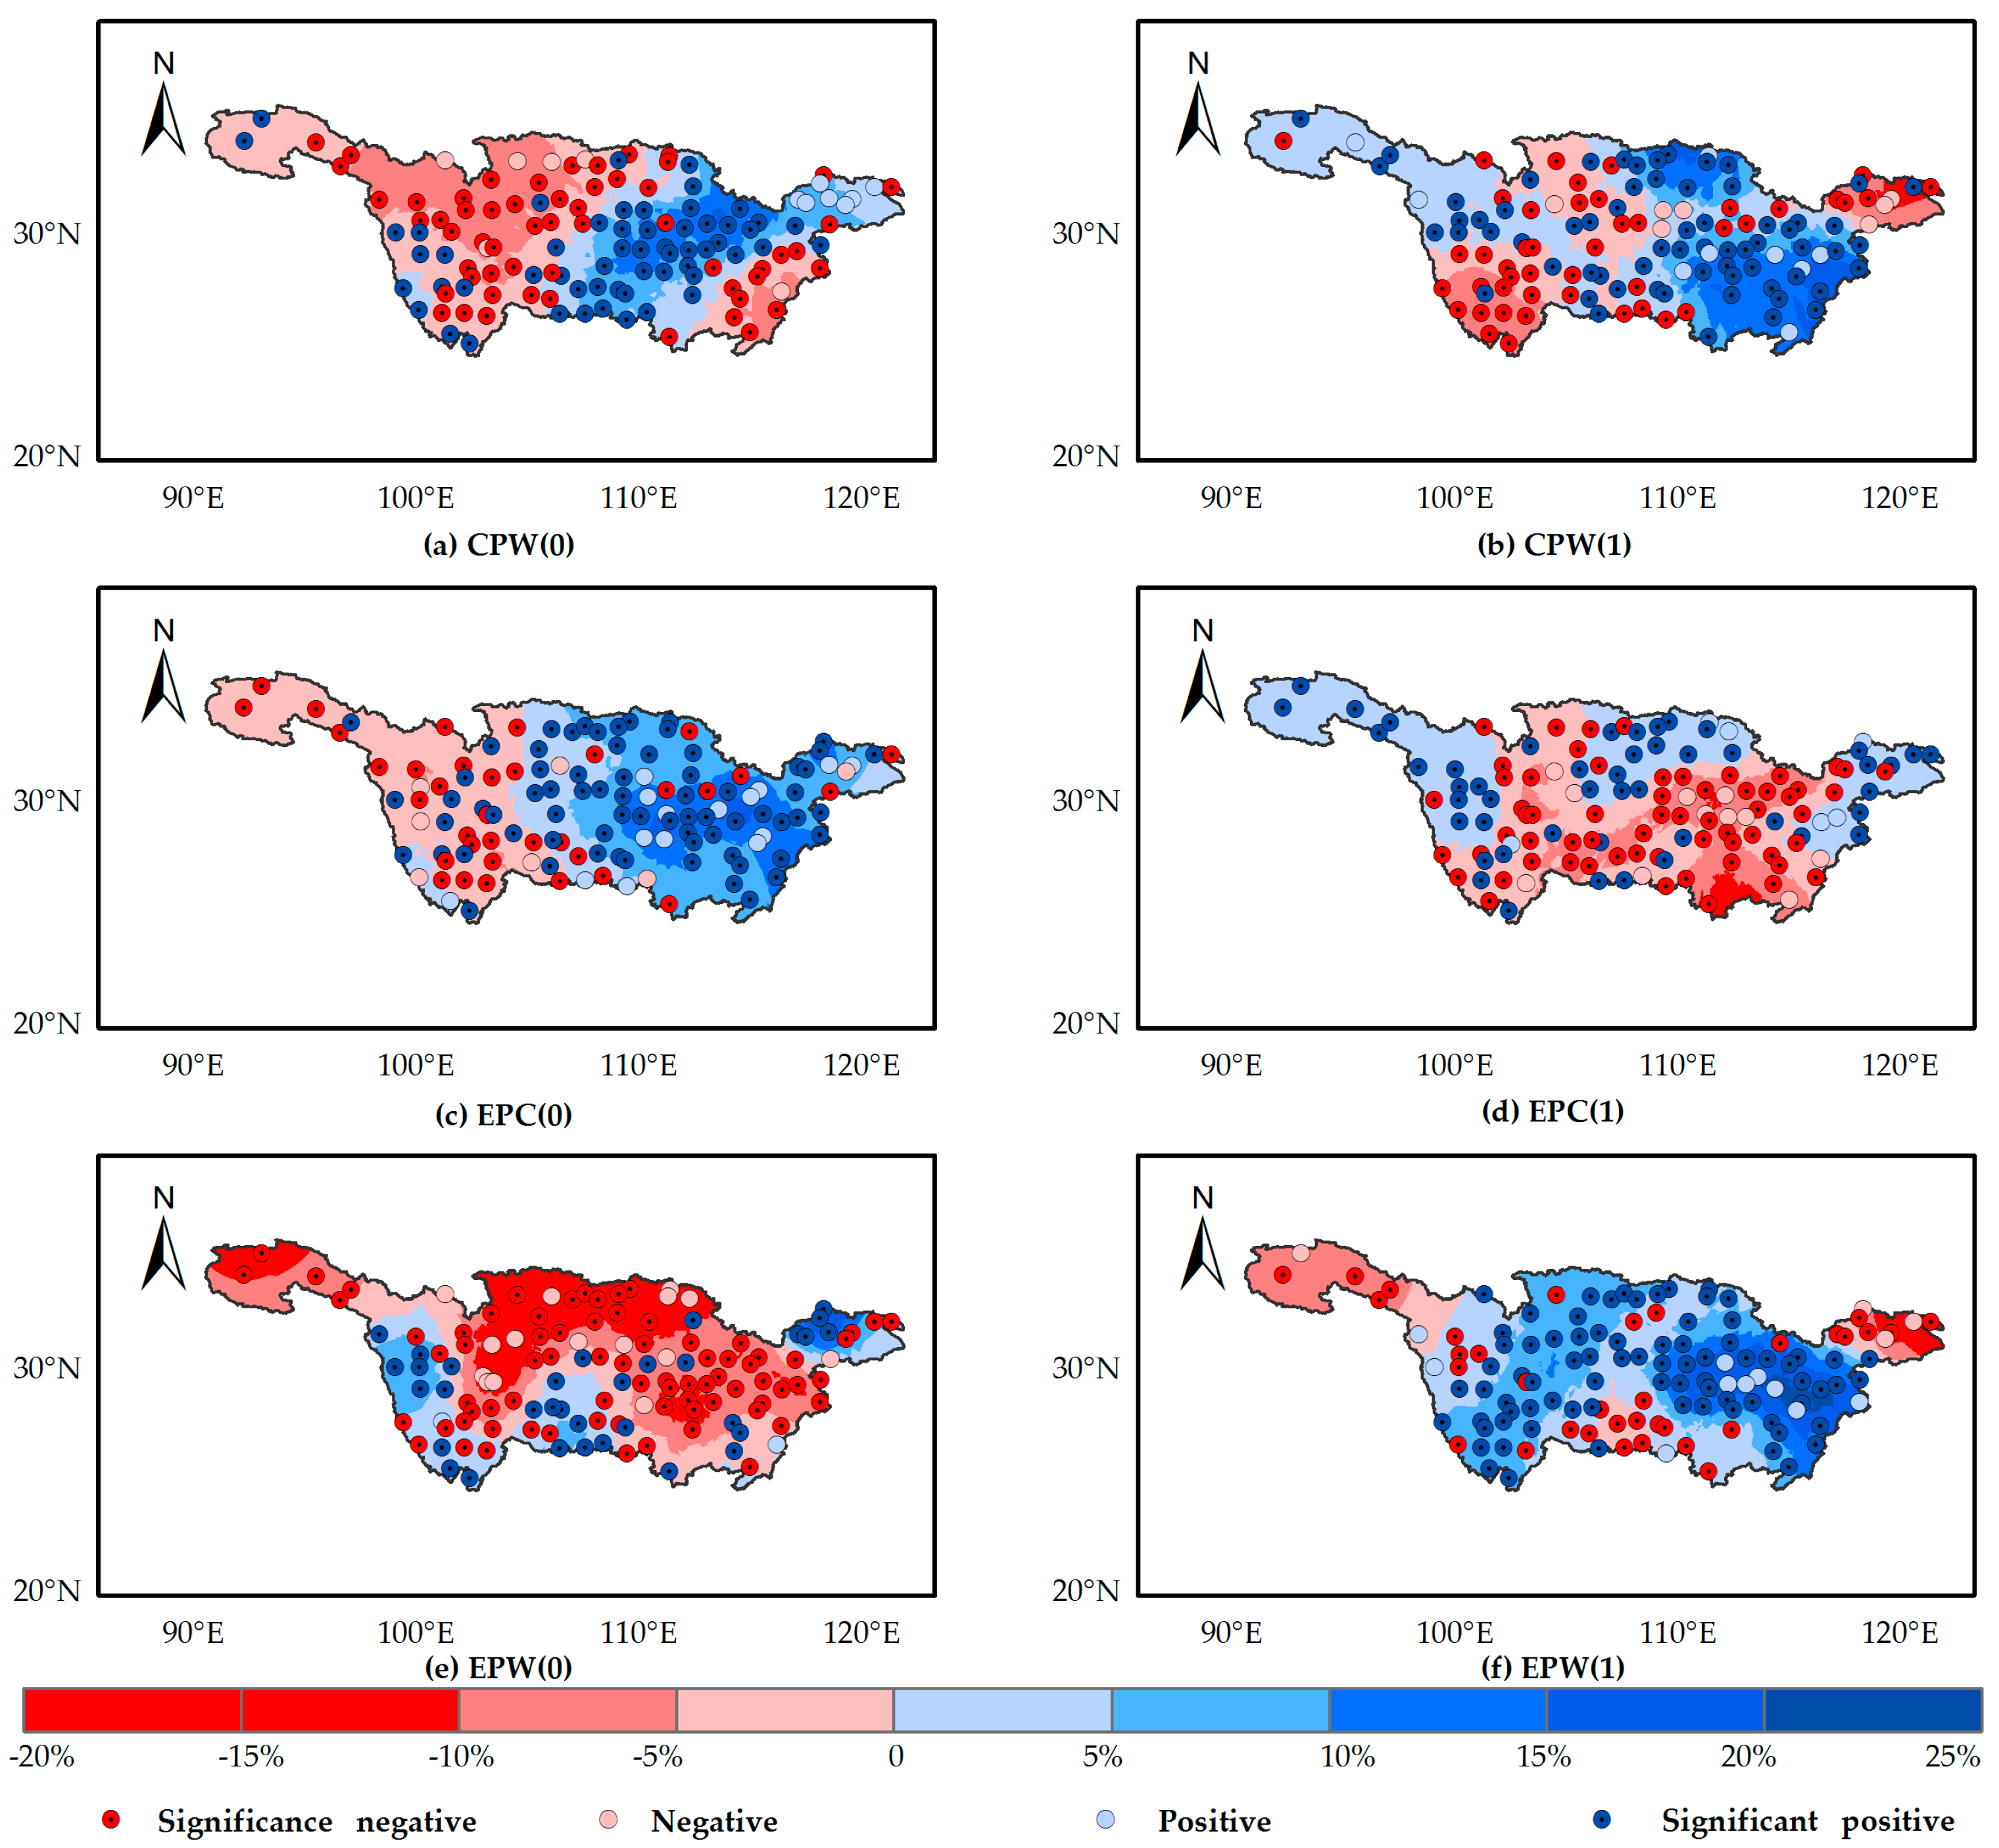
Figure 7.
Spatial pattern of precipitation anomalies during the rainy season (PARS) over the YRB during the developing (0) conventional ENSO and ENSO Modoki events. Significantly positive/negative means significant positive/negative precipitation anomaly. Negative/positive means negative/positive precipitation anomaly. Filled circles with solid dots indicate significant differences between the precipitation anomaly during normal years and that during ENSO and ENSO Modoki years.
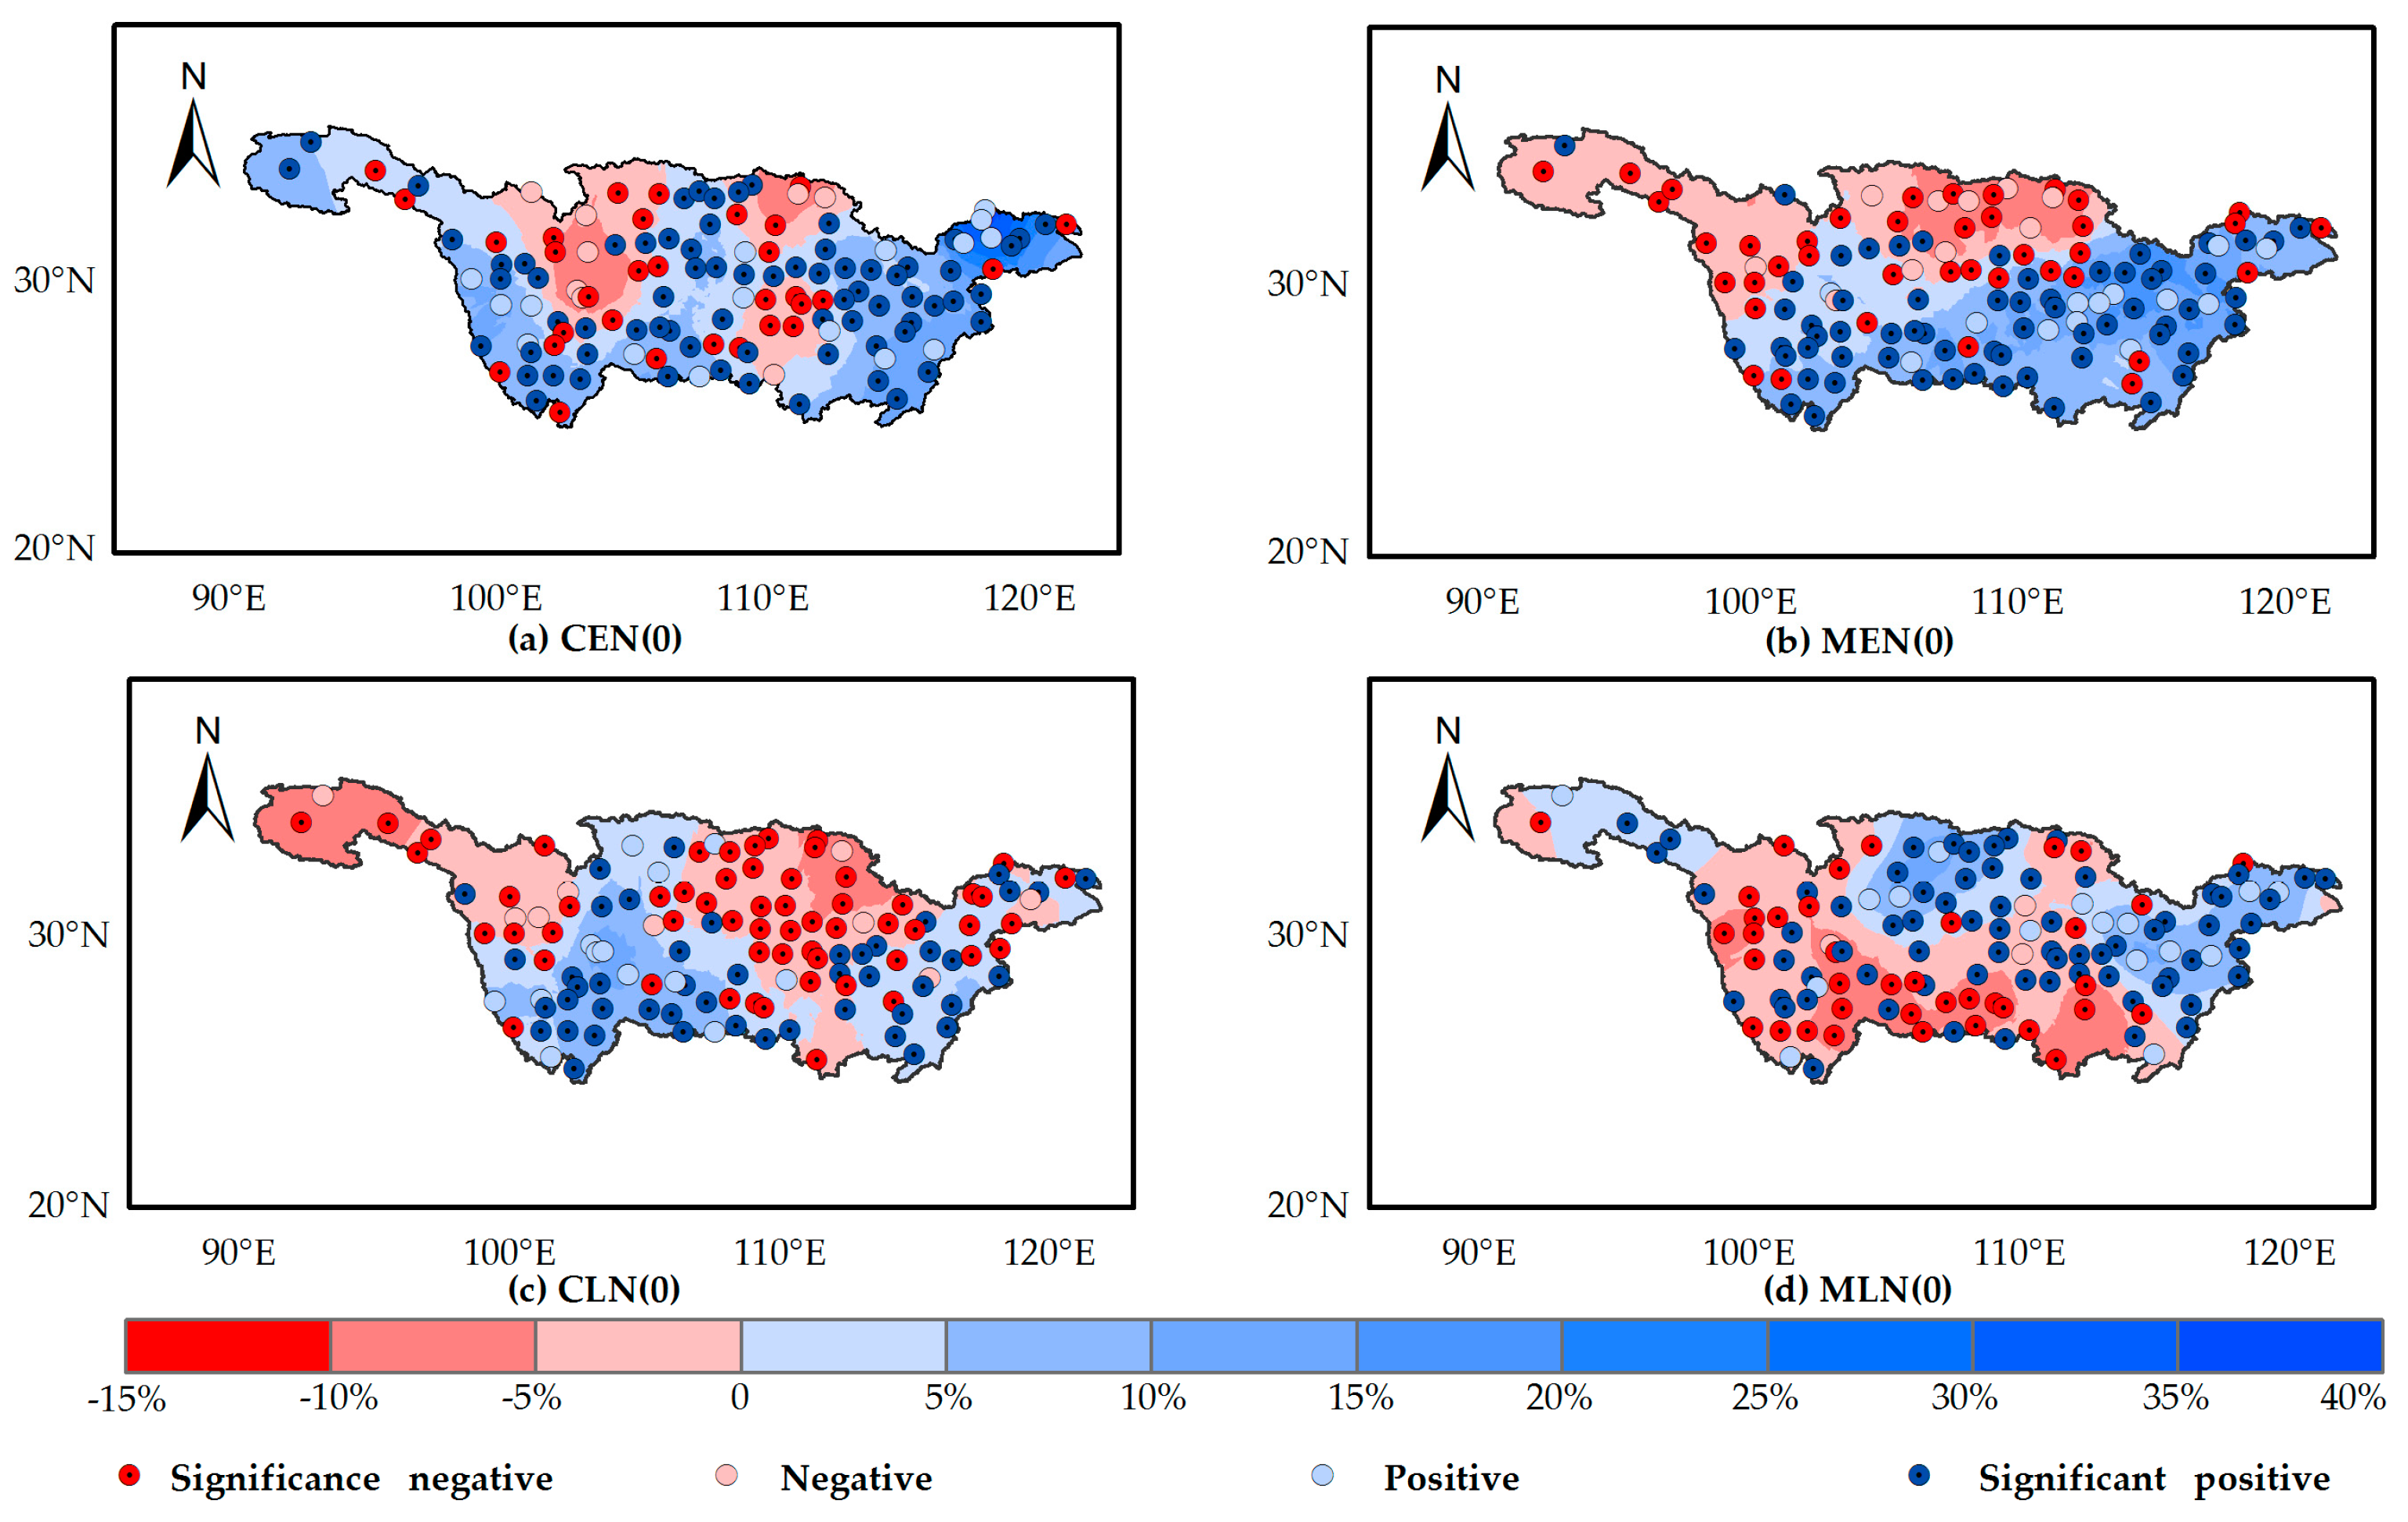
Figure 8.
Spatial pattern of precipitation anomalies during the rainy season (PARS) over the YRB for the decaying (1) conventional ENSO and ENSO Modoki events. Significantly positive/negative means significant positive/negative precipitation anomaly. Negative/positive means negative/positive precipitation anomaly. Filled circles with solid dots indicate significant differences between the precipitation anomaly during normal years and that during ENSO and ENSO Modoki years.
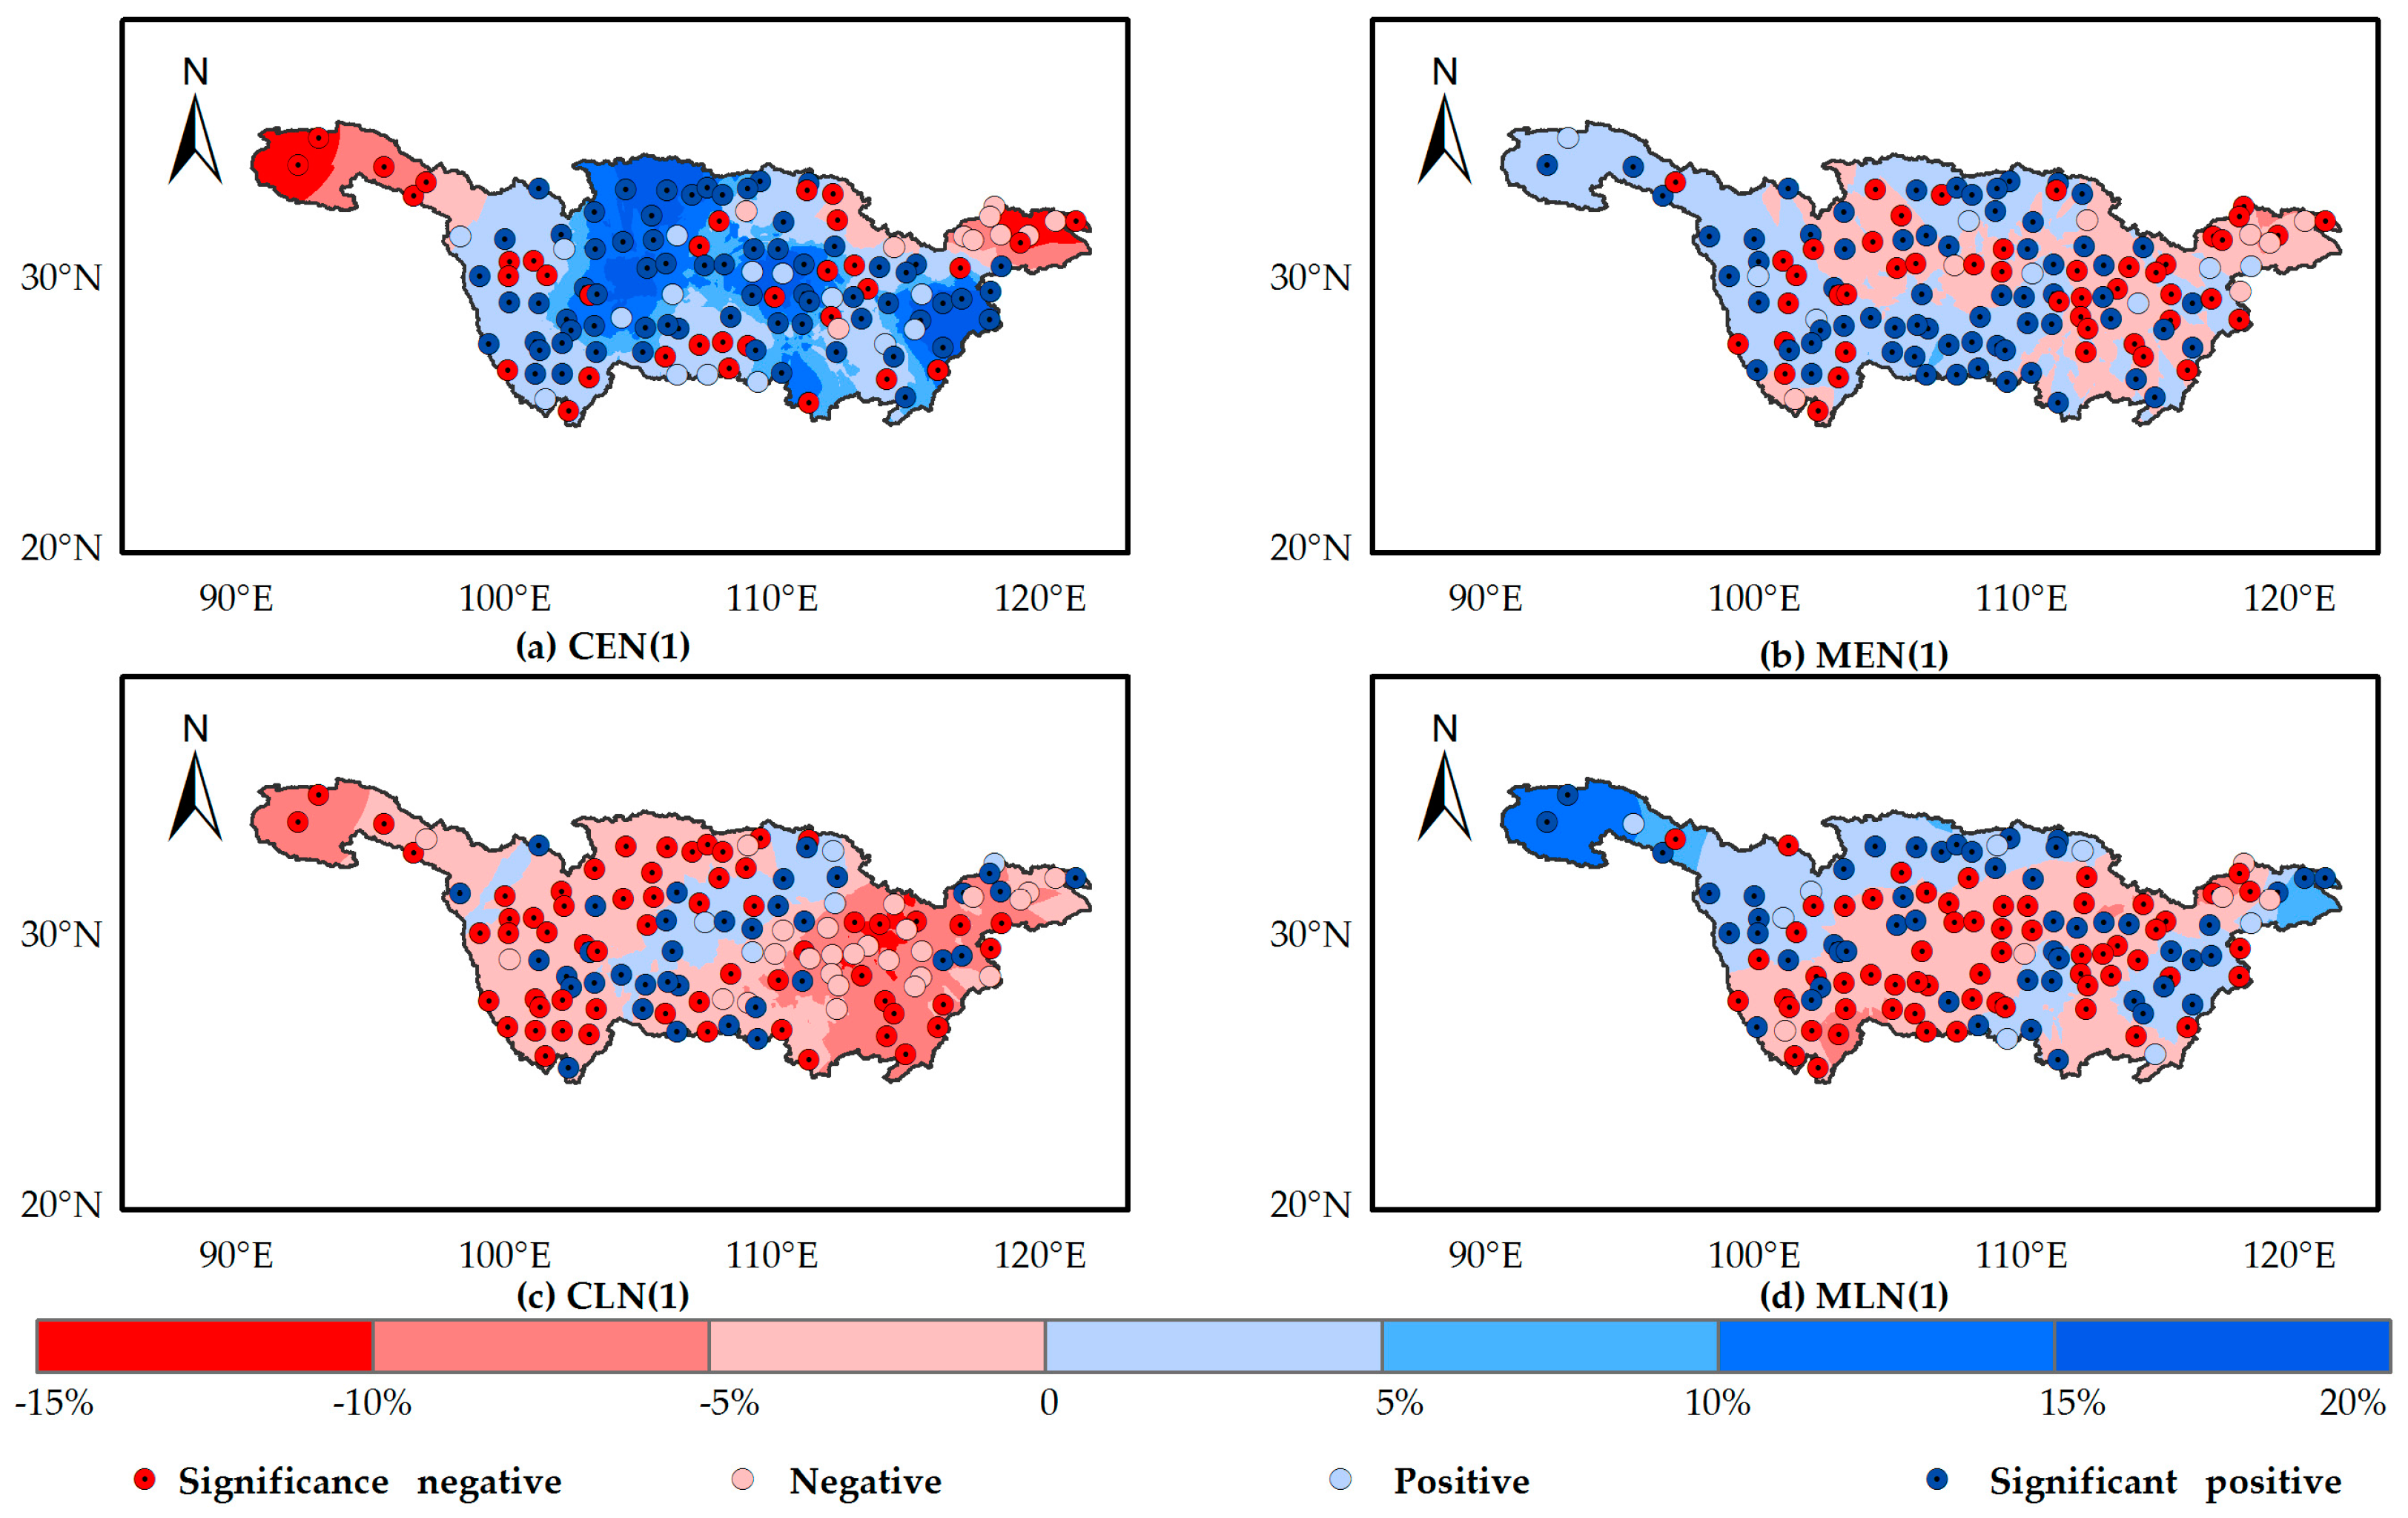
Figure 9.
Spatial distribution of the Pearson correlation coefficients between rainy season features including onset, withdrawal and precipitation and SSTA of Niño 3.4 areas (the first column, i.e., (a,c,e)); between rainy season features including onset, withdrawal and precipitation and EMI (the second column, i.e., (b,d,f)).

Table 1.
Years dominated by CPW, EPC, and EPW regimes during 1960–2015.
| EPW | EPC | CPW |
|---|---|---|
| 1965, 1972, 1976, 1982, 1987, 1997, 2015 | 1964, 1970, 1973, 1975, 1988, 1998, 1999, 2007, 2010, 2011 | 1963, 1969, 1991, 1994, 2002, 2004, 2009 |
© 2017 by the authors. Licensee MDPI, Basel, Switzerland. This article is an open access article distributed under the terms and conditions of the Creative Commons Attribution (CC BY) license (http://creativecommons.org/licenses/by/4.0/).
Share and Cite
MDPI and ACS Style
Cao, Q.; Hao, Z.; Yuan, F.; Su, Z.; Berndtsson, R. ENSO Influence on Rainy Season Precipitation over the Yangtze River Basin. Water 2017, 9, 469. https://doi.org/10.3390/w9070469
AMA Style
Cao Q, Hao Z, Yuan F, Su Z, Berndtsson R. ENSO Influence on Rainy Season Precipitation over the Yangtze River Basin. Water. 2017; 9(7):469. https://doi.org/10.3390/w9070469
Chicago/Turabian StyleCao, Qing, Zhenchun Hao, Feifei Yuan, Zhenkuan Su, and Ronny Berndtsson. 2017. "ENSO Influence on Rainy Season Precipitation over the Yangtze River Basin" Water 9, no. 7: 469. https://doi.org/10.3390/w9070469
Note that from the first issue of 2016, this journal uses article numbers instead of page numbers. See further details here.