Performance of an Agricultural Wetland-Reservoir-Irrigation Management System
by
 and
and
Michael J. Haverstock
1, 
Ali Madani
1,
Hambaliou Baldé
2,
Andrew C. VanderZaag
2 and
Robert J. Gordon
3,* 1
Department of Engineering, Faculty of Agriculture, Dalhousie University, P.O. Box 550, Truro, NS B2N 5E3, Canada
2
Science and Technology Branch, Agriculture and Agri-Food Canada, Ottawa Research and Development Centre, Ottawa, ON K1A 0C5, Canada
3
Department of Geography & Environmental Studies, Wilfrid Laurier University, Waterloo, ON N2L 3C5, Canada
*
Author to whom correspondence should be addressed.
Water 2017, 9(7), 472; https://doi.org/10.3390/w9070472
Submission received: 30 April 2017
/
Revised: 14 June 2017
/
Accepted: 18 June 2017
/
Published: 28 June 2017
(This article belongs to the Special Issue Treatment Wetlands for Nutrient Removal)
Abstract
:Constructed wetlands (CW) have gained recognition as a management option for the treatment of various agricultural wastewaters. This study involved the design, construction, and initial evaluation of a wetland-reservoir-irrigation (WRI) system. The system was established in Truro, Nova Scotia, Canada, with the goal to capture, treat, and re-use agricultural sub-surface drainage water. It consisted of a 1.8-ha area of a cropped field that was systematically tile drained. Drainage water was directed through a 2-cell CW and then into a reservoir-irrigation pond. Flow rate hydraulics, residence time distributions, and treatment efficiencies for nitrate-nitrogen (NO3−-N) and Escherichia coli (E. coli) were monitored for 14 months. Mass reductions of NO3−-N and E. coli from the CW were 67.6% and 63.3%, respectively. However, average E. coli concentrations increased to 178 CFU 100 mL−1 in the reservoir during the warm season. It may therefore be best to use reservoir water for irrigation of crops that are not consumed raw. To aid in the future design of similar systems, mean first-order rate constants (ks) for NO3−-N and E. coli were calculated to be 8.0 and 6.4 m y−1, respectively. The volume of water collected in the reservoir exceeded typical irrigation requirements of the drained land and could therefore provide irrigation to additional land beyond the drainage area.
1. Introduction
The agriculture sector is the largest consumer of water in Canada and contributes to surface and groundwater pollution [1]. As a result, responsible use and treatment of agricultural water and wastewaters is vital [2,3,4]. Subsurface drainage removes excess water from the soil profile, resulting in more productive cropping systems by allowing for earlier (in the spring) and later (in the fall) field trafficability and enhanced growing conditions [5]. Drainage water can be a source of surface water degradation due to the presence of pesticides, nutrients, pathogens, and sediment, with discharge levels frequently exceeding water quality guidelines [4].
Constructed wetlands (CW) have received increased on-farm use in recent years, as they have been shown to effectively remove pollutants from agricultural wastewater streams [6]. A number of promising CW studies have been conducted in colder climates [7,8,9,10,11].
A wetland-reservoir-irrigation (WRI) system integrates a CW to treat agricultural runoff/drainage water and provides an opportunity to re-use the treated water for irrigation when crops require supplemental water [12,13,14]. Through a WRI system, surface runoff and/or drainage water is captured and directed through a CW to treat contaminants, thereby improving the water quality. This treated water, leaving the CW, is then stored in a holding reservoir, which is eventually used for irrigation [12,13,14].
Losses of nutrients from agriculture systems contribute to eutrophication of waterways, lakes, estuaries, and coastal zones, with inorganic N being potentially toxic to humans, livestock, and aquatic life [15]. The use of CWs has been shown to effectively remove NO3−-N from agriculture runoff [16], as close contact with plant surfaces and rapid biogeochemical cycling effectively removes N [17,18]. In a review of 57 CWs by [19], it was found that N was reduced by 80%, on average. Additionally, CWs have been found to be ecologically and economically viable for reducing NO3−-N levels from agriculture and wastewater pollution [20]. In addition to nutrient removal, an increased focus has been directed toward removing bacteria and pathogens due to contamination outbreaks [21], and the potential for waterborne illness via water stored in surface reservoirs. Previous CW studies [22] report excellent fecal coliform reductions from the treatment of dairy wastewater in both cold and warm seasons. However, additional research is needed in the context of treating tile drainage effluent.
In the present study, a WRI system that received agricultural sub-surface drainage water was evaluated. The ability of the CW to treat agriculture nutrients (NO3−-N) and pathogens (E. coli) was assessed. The efficiency of treating and re-using this drainage water for irrigation purposes was also evaluated.
2. Materials and Methods
2.1. Site Description
The study was conducted from 1 November 2007 to 31 December 2008 at the Bio-Environmental Engineering Centre (BEEC) in Truro, NS, Canada. This location has a mean air temperature (Ta) of −7 °C in January and +19 °C in July with a mean annual temperature of 6 °C, and annually receives 1170 mm of precipitation [23] (Table 1). The research site was adjacent to a 5.0 ha land-base for crop production that had subsurface tile drains throughout (Figure 1a). Subsurface drains were 100 mm in diameter and were installed at 80 cm depth at 12 m intervals throughout the field. The drainage water all flowed through an outflow monitoring facility.
The soils were Pugwash (Gleyed and Orthic Melanic Brunisol) and Debert (Gleyed Melanic Brunisol) texture classes [24], which are generally sandy loam. The hydraulic conductivity is higher than recommended for CWs, which require an impervious base to prevent seepage [25]. Additional details on site geology are provided in [26]. Conventional and no-tillage practices cover 43% and 57% of the drainage area, respectively, and have been utilized over the previous five years. Current and previous years of crop growth and manure application are listed in Table 2.
2.2. Design and Construction of the Wetland-Reservoir-Irrigation System
The appropriate sizing of a CW is important to minimize construction costs and the footprint of the system. Hydraulic flow determinations are vital when assessing expected treatment by CWs for different types of pollution management and optimizing the design of systems [20]. For the present study the system was designed in 2007 using the k-C* model [27] to determine the wetland area (A), which was based on relevant literature at the time (for future designs, more recent literature should be consulted). The model is based on expected influent concentrations (Cin) and desired effluent concentrations (Cout), first-order uptake rate constants (k), annual estimated flow (Q), and background concentration (C*),
As Equation (1) is for long-term treatment, the k-C* model was adapted as in [28] to deal with short-term dynamic flow rates. To do so, the hydrological effectiveness curves were adjusted to include historical tile drainage flow and water quality information. The k-C* model parameters were used to determine the optimal and feasible CW size. Selected outflow concentrations (Cout) were based on meeting the Health Canada Guideline for Canadian Drinking Water Quality (drinking water guideline) [29] for NO3−-N (10 mg L−1), and the Canadian Council of Ministers of the Environment (CCME) Canadian Water Quality Guideline for the Protection of Agriculture Water Uses (Irrigation Water) (irrigation water guideline) [30] for E. coli (100 CFU 100 mL−1). The value of Q was determined based on the peak monthly flow (October 2005) obtained by Jamieson et al. [31]. The maximum non-adjusted ks values were generated as in [31], based on a four-year study using operational CWs in close proximity to the study site. This resulted in a design A of 1027 m2 for the CW (thus the wetland surface area was 5.7% of the drainage area).
It was decided that the CW would include two identical and side-by-side cells (CW1 and CW2) each 512 m2 (Figure 1a,b). These cells were situated south of the tile-drained field on a grade to achieve gravitational flow. Tile drainage was conveyed to the CWs by a 200 mm diameter underground pipe, and equally distributed between CW1 and CW2 by a flow splitter. Once split, flow was directed into each wetland by a 150 mm diameter underground pipe, with access ports for water sampling. A 10:1 length to width ratio was selected, with a shallow marsh design, and alternating shallow (0.15 m) and deep (0.60 m) zones to ensure wastewater residence in both aerobic and anaerobic environments during high flow periods [32]. To avoid seepage and groundwater intrusion, a 300 µm woven polyethylene liner was installed as the base layer of both cells. Two 50 mm perforated pipes, wrapped in filter fabric, were installed beneath the liner in the last two zones of CW1 and CW2 as underdrains. During CW construction, cattail (Typha spp.) plants were transplanted from a natural wetland at a spacing of 1 m [27] into the shallow zones of both CW1 and CW2, with other species establishing naturally by August 2007. Effluent from each cell was discharged via a 150 mm diameter underground pipe and water level control structure leading to a sampling hut (where Q was measured) and then flowed into the reservoir. Full details on CW design and construction are provided in [33].
The reservoir was situated in a gully south of the 5 ha field and was formed by constructing a dam across the gully. To size the reservoir, annual additions were estimated based on average tile drainage flows during 2003 through 2005 [31] (approximately 6000 m3) and direct precipitation over the CW and gully areas (approximately 3500 m3). Seepage control at the reservoir was supported through utilizing impervious bentonite clay fill (12 kg m−2) in the upstream dam surface and covered with soil [34]. Full details on the dam design are provided in [26]. The maximum surface area and depth of the reservoir were 0.3 ha and 4.5 m, respectively, yielding a capacity of approximately 5000 m3. The design capacity of the reservoir was less than the estimated inputs because the dam location was limited by land availability, topography, and cost.
2.3. Water Sampling and Meteorological Parameter Measurements
Water quality was monitored at the CW inlets and outlets and the reservoir outlet throughout the study period (1 November 2007 through 31 December 2008). CW inlet (i.e., tile drain outlet) water samples were manually collected from sampling ports in the inlet piping to each CW twice per week, with the exception of during the first 45 days of monitoring (1 November 2007 to 14 December 2007), when the inlet water samples were collected as a weekly composite water sample of each of the tile drain outlets (comprised of six daily samples for NO3−-N and one weekly sample for E. coli). During this initial period, the daily NO3−-N samples were collected automatically using ISCO 6700 portable samplers (Teledyne Isco Inc., Lincoln, NE, USA) and the weekly E. coli samples were collected manually. During this initial period, flow-weighted average pollutant concentrations were calculated to give Cin (mg L−1). Over the entire monitoring period, CW outlet water samples were collected automatically for NO3−-N analysis and manually for E. coli analysis. All sampling frequencies increased to 6 h intervals during times of higher flow. Reservoir samples were collected manually from the reservoir spillway twice per week. Although water quality may vary throughout the reservoir, the spillway was the furthest point from the CW, accessible for manual collection, and was near the irrigation system site intake pipe. As a result, it provided a good indication of irrigation water quality.
Influent and effluent CW flow rates were monitored by tipping buckets in heated huts and recorded as hourly totals. A Palmer-Bowlus flume [26] at the outlets of both CW1 and CW2 were used during high-flow events to measure flow that exceeded the tipping bucket capacity (0.5 tip s−1).
Meteorological conditions monitored at the site included air temperature (CS500 thermistor; Campbell Scientific, Edmonton, AB, Canada), solar radiation (LI200S silicon pyranometer, LI-COR Inc., Lincoln, NE, USA), and precipitation (52202 heated tipping bucket rain gauge; R. M. Young Company, Traverse City, MI, USA). These data were recorded hourly using a CR10X datalogger (Campbell Scientific, Edmonton, AB, Canada). Missing precipitation data was supplemented with local Environment Canada [23] data collected at the Bible Hill Climate Station (<3 km away). Evapotranspiration (ET) measurements were obtained from the Lake Evaporation Normal for Truro, NS [23].
2.4. Residence Time Monitoring
Knowledge of residence time distribution (RTD) aids in characterizing hydraulics, and has been shown to correlate with treatment performance [35]. A tracer study was conducted using a bromide (Br−) tracer (in the form of potassium bromide) in CW2 from 24 September to 28 October 2008 (34 d). During this period, water depths in the deep and shallow zones were 0.65 m and 0.35 m, respectively. The mass of the tracer added was determined from 25× the background concentrations multiplied by the CW2 volume [36]; hence 0.5 mg L−1 for Br− was used. This amount of Br− was injected into the inlet of CW2, with ion concentrations monitored at the outlet, as in [27]. The selected Br− tracer was shown to be a suitable tracer for on-farm wetlands by [37]. Moreover, Br− is a nonreactive ion, found at low background concentrations, has a low toxicity, and requires a simple analysis [38].
During the tracer study, Isco 6712 portable autosamplers (Teledyne Isco Inc., Lincoln, NE, USA) collected water samples at the outlet of CW2 at 12 h intervals. Concentrations of Br− were analyzed by means of ion chromatography (APHA; Method 4110 C: Single-Column Ion Chromatography) [39]. Samples were syringe filtered with 0.45 μm nitrocellulose membrane filters (Millipore Corp., Billerica, MA, USA) and analyzed using a Waters Ion Chromatography System (Waters Canada Ltd., Mississauga, ON, Canada). The nominal residence time (tn) was calculated as the ratio of the product of porosity (η = 0.95) and Q0 (mean outflow rate, m3 d−1) [27] to wetland volume (V). Actual measured residence (ta) time during the tracer study was determined from the first moment of the residence time distribution function f(t),
where f(t) is the residence time distribution function (d−1), C(t) is the exit tracer concentration (mg m−3), Q0 is the wetland outflow rate (m3 d−1), m is the total tracer mass collected (mg), and t is time (d).
2.5. Water Samples Analysis and Pollutant Removal Efficiences
All water samples were analyzed at the Environmental Microbiology Research Laboratory at the Faculty of Agriculture of Dalhousie University (Halifax, NS, Canada). Water samples were analyzed for NO3−-N by means of ion chromatography in accordance with APHA Method 4110 C: Single-Column Ion Chromatography [39]. E. coli concentrations were analyzed by means of membrane filtration using an m-ColiBlue24® broth as a growth medium Hach Method 10029, [40]. The detection limits of these analyses were 0.04 mg L−1 for NO3−-N and 0 CFU 100 mL−1 for E. coli. Estimate sampling and laboratory analysis precision was completed using identical spatiotemporal field replicates.
To assess pollutant removal efficiencies, pollutant loads were considered to account for the variable flow regime. Concentrations reductions were considered when evaluating if water quality met guidelines. NO3−-N and E. coli loads (M) (mg or CFU) entering and leaving the CW were calculated for each sampling interval (i) (i.e., twice per week, or every 6 h during times of higher flow) as the product of the sample concentration (C) (mg L−1 or CFU 100 mL−1) and total flow volume (V) (L) over the interval, as shown in Equation (3),
and percent mass reductions (MR) were used to quantify event, seasonal, and annual treatment using the following:
where Cout and Cin represent the concentrations at the CW outlet and inlet (mg L−1), respectively, and Vout and Vin represent the volume of outflow and inflow from the CW (L), respectively.
The statistical relationships of environmental and hydraulic dynamics on pollutant loadings and concentrations were assessed using Pearson correlations and statistical analyses, with a level of statistical significance of p = 0.05.
3. Results and Discussion
3.1. Hydraulics and Flow Rates
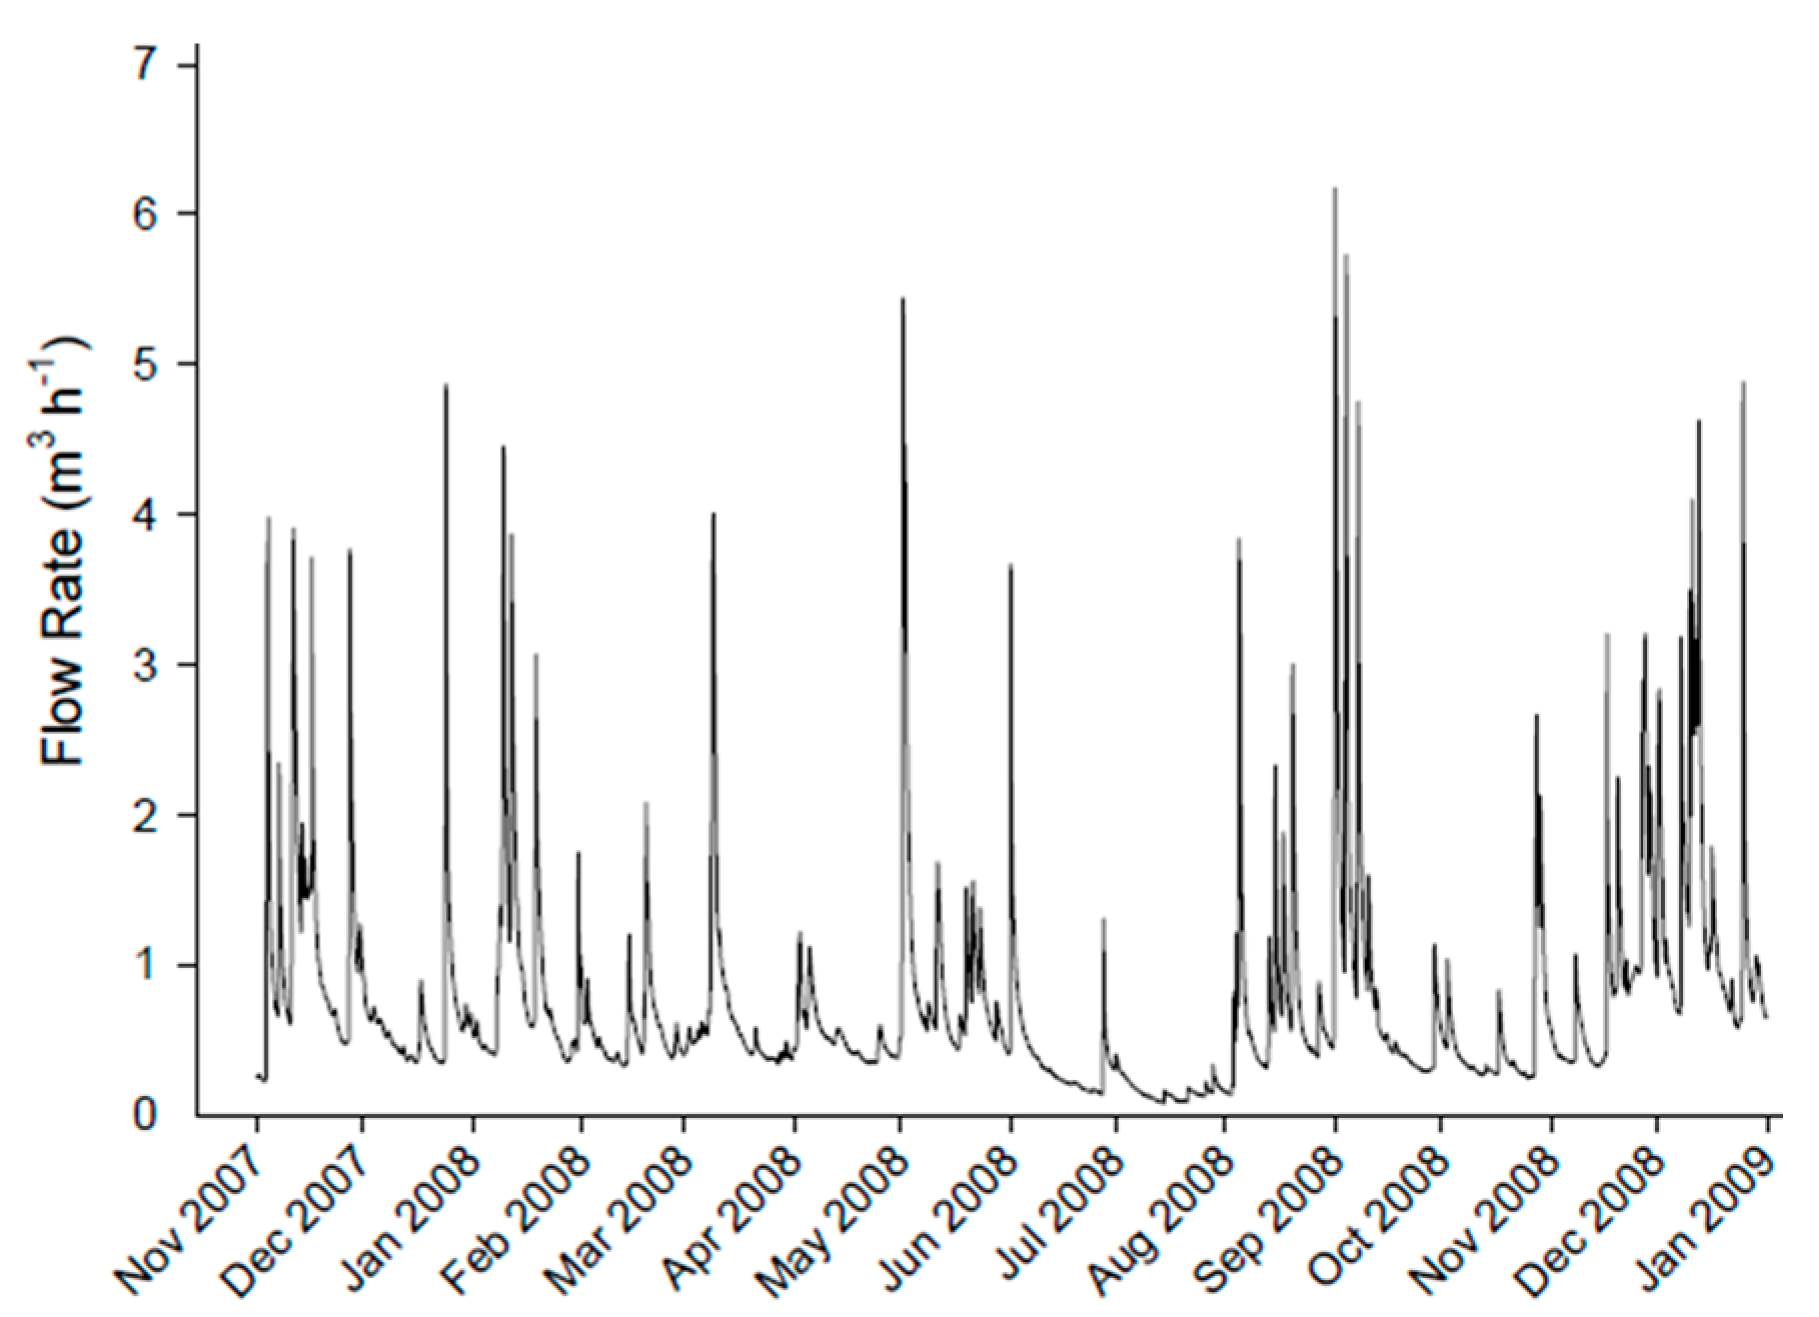
During eight of the 14 months in the study period, precipitation rates were 8 to 88% higher than the 30-year average. This resulted in 260 mm of precipitation above normal, with the greatest excess in August (+79 mm) (Table 1). Surface water losses due to ET were estimated to be 510 mm for each wetland in 2008 (from Lake Evaporation normal for Truro, NS [23]), which amounts to 6.7% of the contribution from the tile drainage outflow and precipitation. This loss in CW water budgets agrees with studies in warmer climates [41,42,43]. The tile drainage entering the CW in 2008 was 0.72 m3 h−1, on average (Figure 2). A peak tile drainage outflow rate of 6.2 m3 h−1 (during a 30 mm storm event) and peak CW outflow rates of 11.4 m3 h−1 (during a 46 mm storm event) were recorded. The combined total drainage flow received by CW1 and CW2 in 2008 was 6360 m3.
A large water surplus was found in CW1 (−578 ± 151 m3 month−1) (−0.803 ± 0.210 m3 h−1). Thus, subsequent to 1 August 2008, all flow was directed to CW2 (effectively doubling Q), which experienced a mean monthly imbalance of 103 m3 (±118 m3) (0.143 m3 h−1 (±0.164 m3 h−1) for the entire 14-month period (Figure 3 and Figure 4, top). Issues likely to cause such imbalance in CW1 include: excess surface runoff entering during large storm events, a shallow water table, and lifting of the impervious liner by groundwater pressure in some areas. After directing all water to CW2 on 1 August 2008, the inflow to CW2 increased (Figure 3 and Figure 4, top).
Between 1 October 2007 and 30 September 2008, the reservoir captured 15,600 m3 (1.935 m3 h−1) of water from CW outflow and precipitation combined (with 867 mm entering the CW from tile drainage). This drainage is higher than other studies that have reported annual CW outflow volumes ranging from 150 to 280 mm [41,42,43,44]. This indicates that Atlantic Canada (i.e., high precipitation and low ET) provides the potential to capture and re-use more water using WRI than other locations, including Ohio [12] and Ontario [4]. Evapotranspiration removed an estimated 1540 m3 of reservoir water (512 mm) for the period from October 2007 to September 2008.
3.2. Residence Time Monitoring
Residence time distribution (RTD) aids in characterizing hydraulics and has been shown to have a strong correlation with treatment efficiencies [35,37,45]. The hydraulic tracer assessment determined that the measured residence time (ta) was 15.0 d, which was similar to the nominal design residence time (tn) of 14.5 d (Figure 5). The tracer response curve illustrates that wetland drainage water did not completely follow plug-flow hydraulics, and therefore varying treatment of parcels of water may be expected. Since both tn and ta were found to be similar, few inactive zones exist in the current CW. However, during high flow events, the residence time may be too short to provide desired treatment. Additionally, high flow events may release stored pollutants, causing elevated loading [46], and further result in shorter RT.
3.3. Water Quality
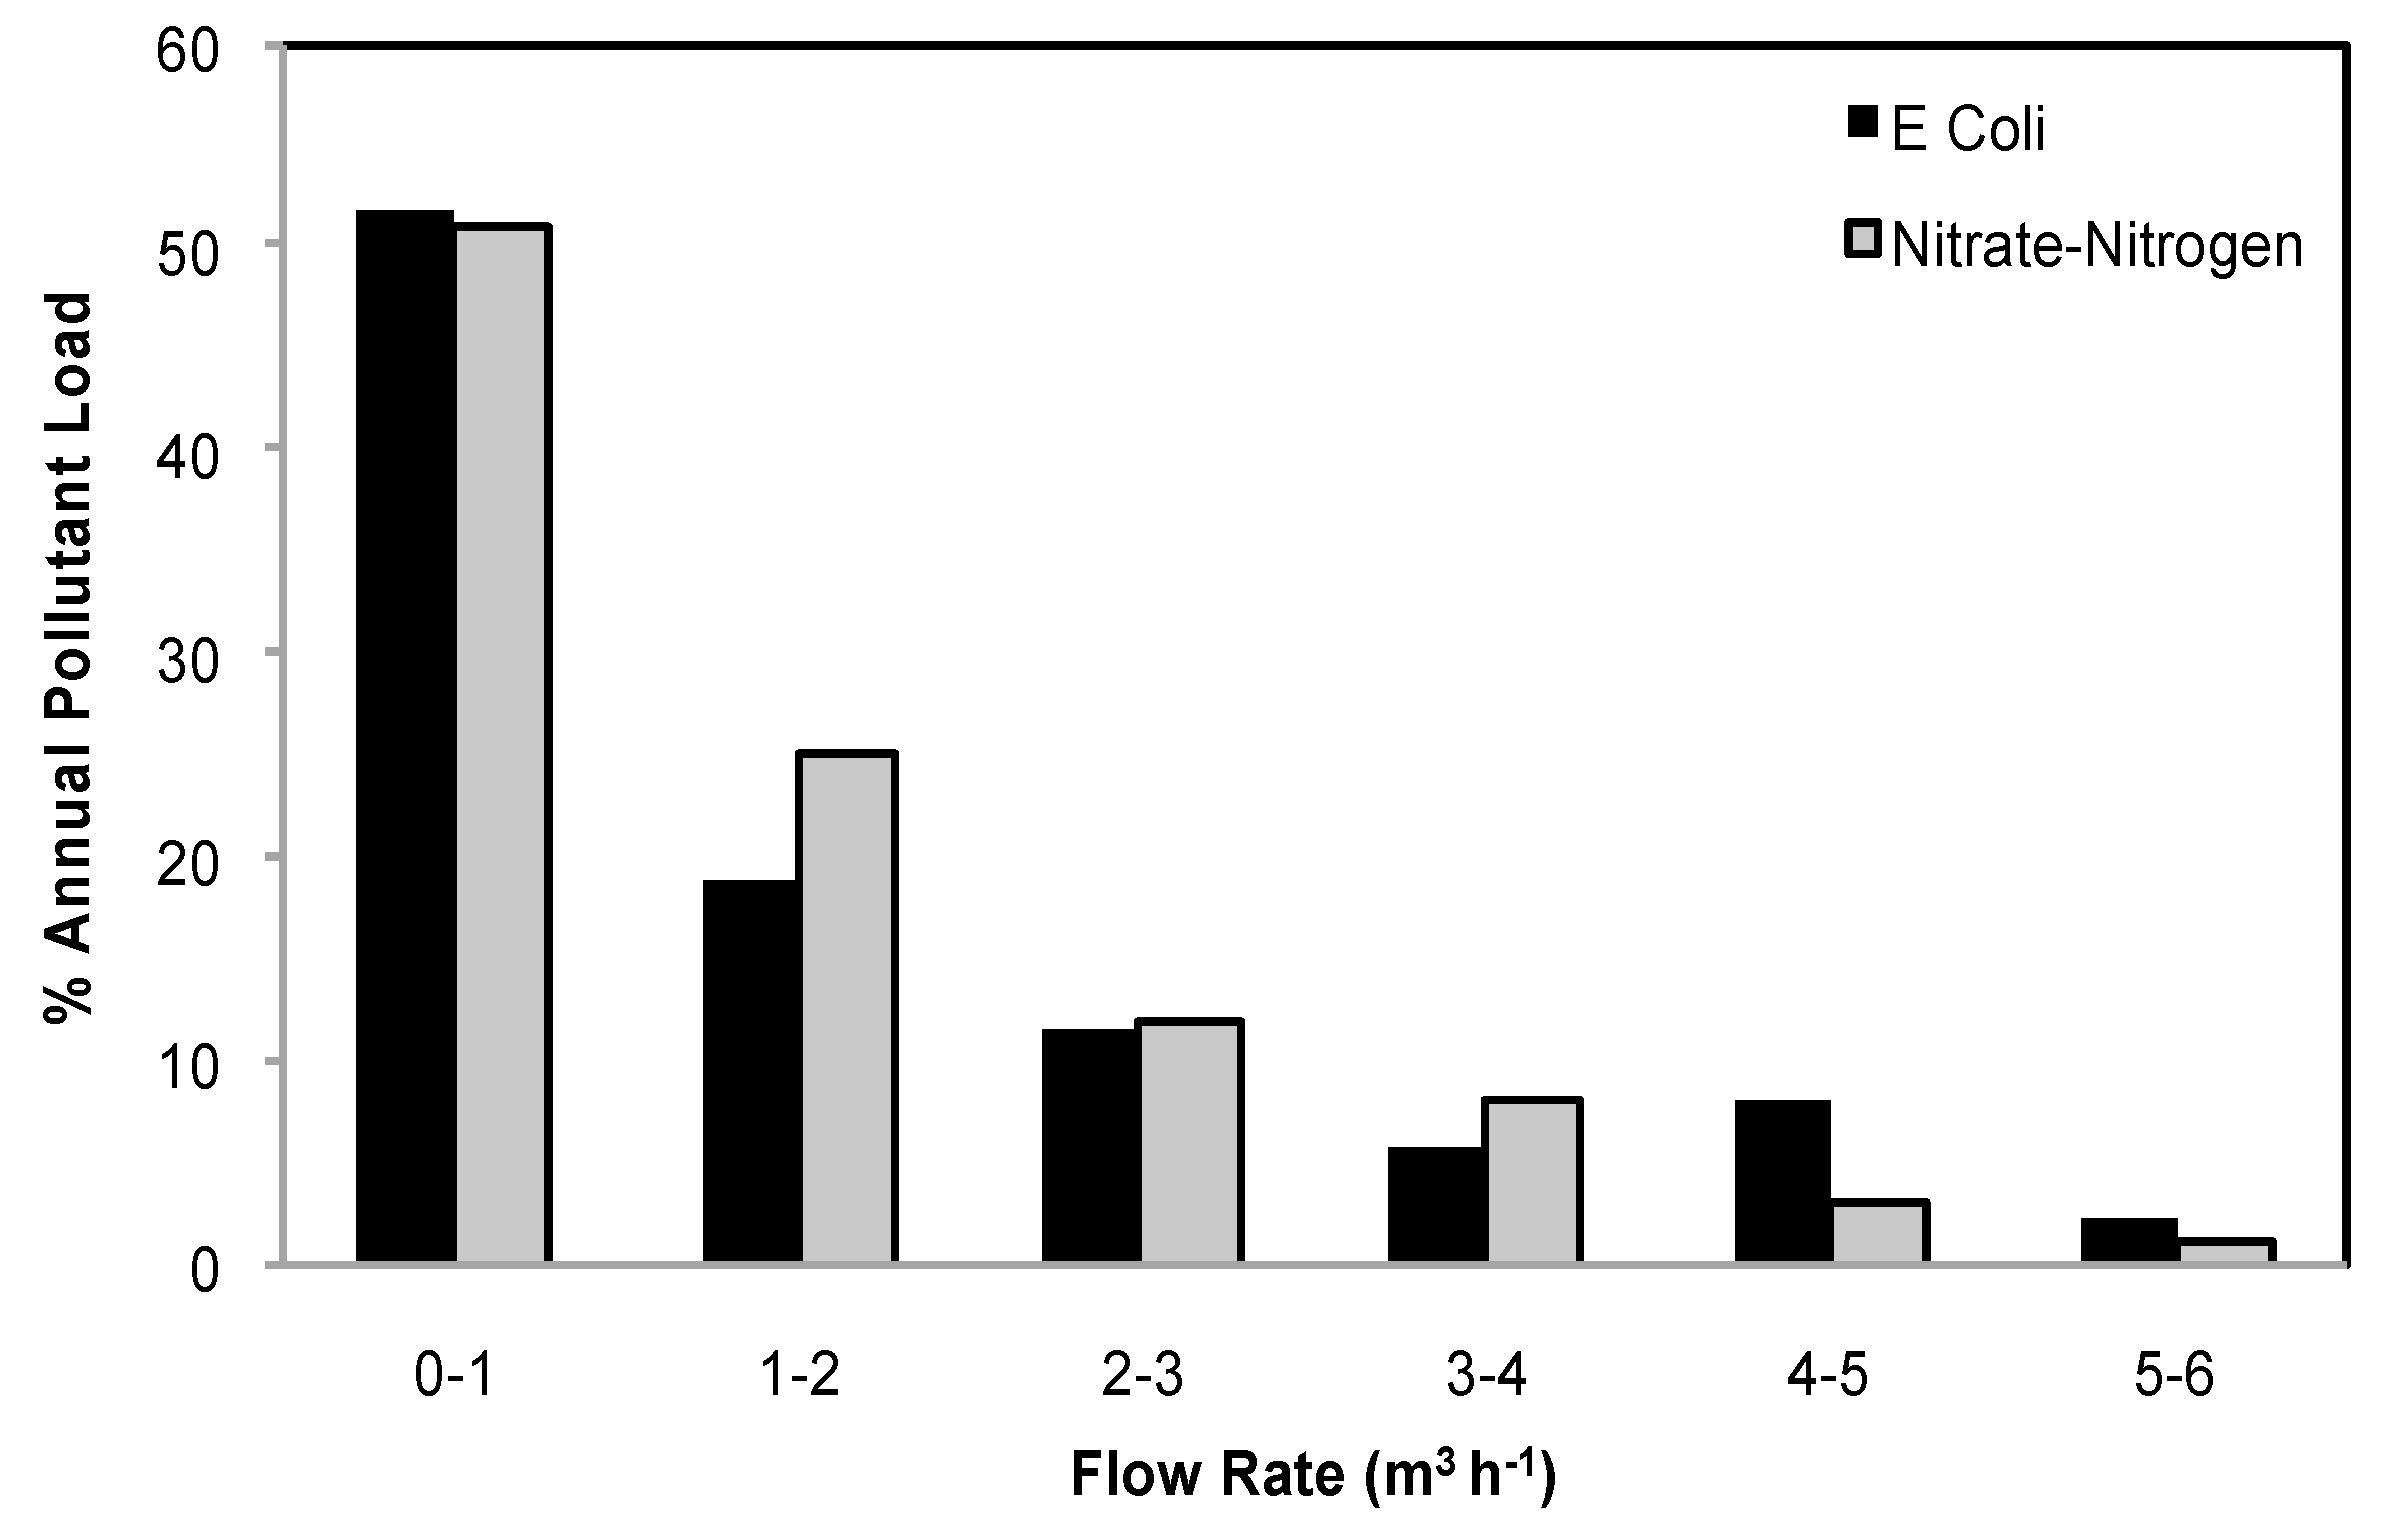
The relationship between flow rate and loading was assessment by categorizing average daily effluent flow rates as shown in Figure 6. The highest wetland influent loads of NO3−-N, and E. coli occurred during the lowest flow volumes of water into the CW. These results indicate that treatment during high flow periods may not be as critical as expected. The assessment of contaminant removal focuses on treatment in CW2. Pollutant loadings of NO3−-N and E. coli from the tile drainage, and corresponding daily input volumes of water, are displayed in Figure 3 and Figure 4 (discussed in later sections). Influent concentrations were variable (Table 3) but remained well below the historical extremes from the study field which have exceeded concentrations of 80 mg L−1 of NO3−-N and 34,000 CFU 100 mL−1 of E. coli between 2003 and 2009 [47]. The CW was effective in overall reductions of NO3−-N and E. coli loads (Figure 3 and Figure 4). In general, water quality improved from the CW2 inflow (tile drainage outlet) to the outflow, and finally at the reservoir outlet (Table 3).
3.4. Nitrate-Nitrogen
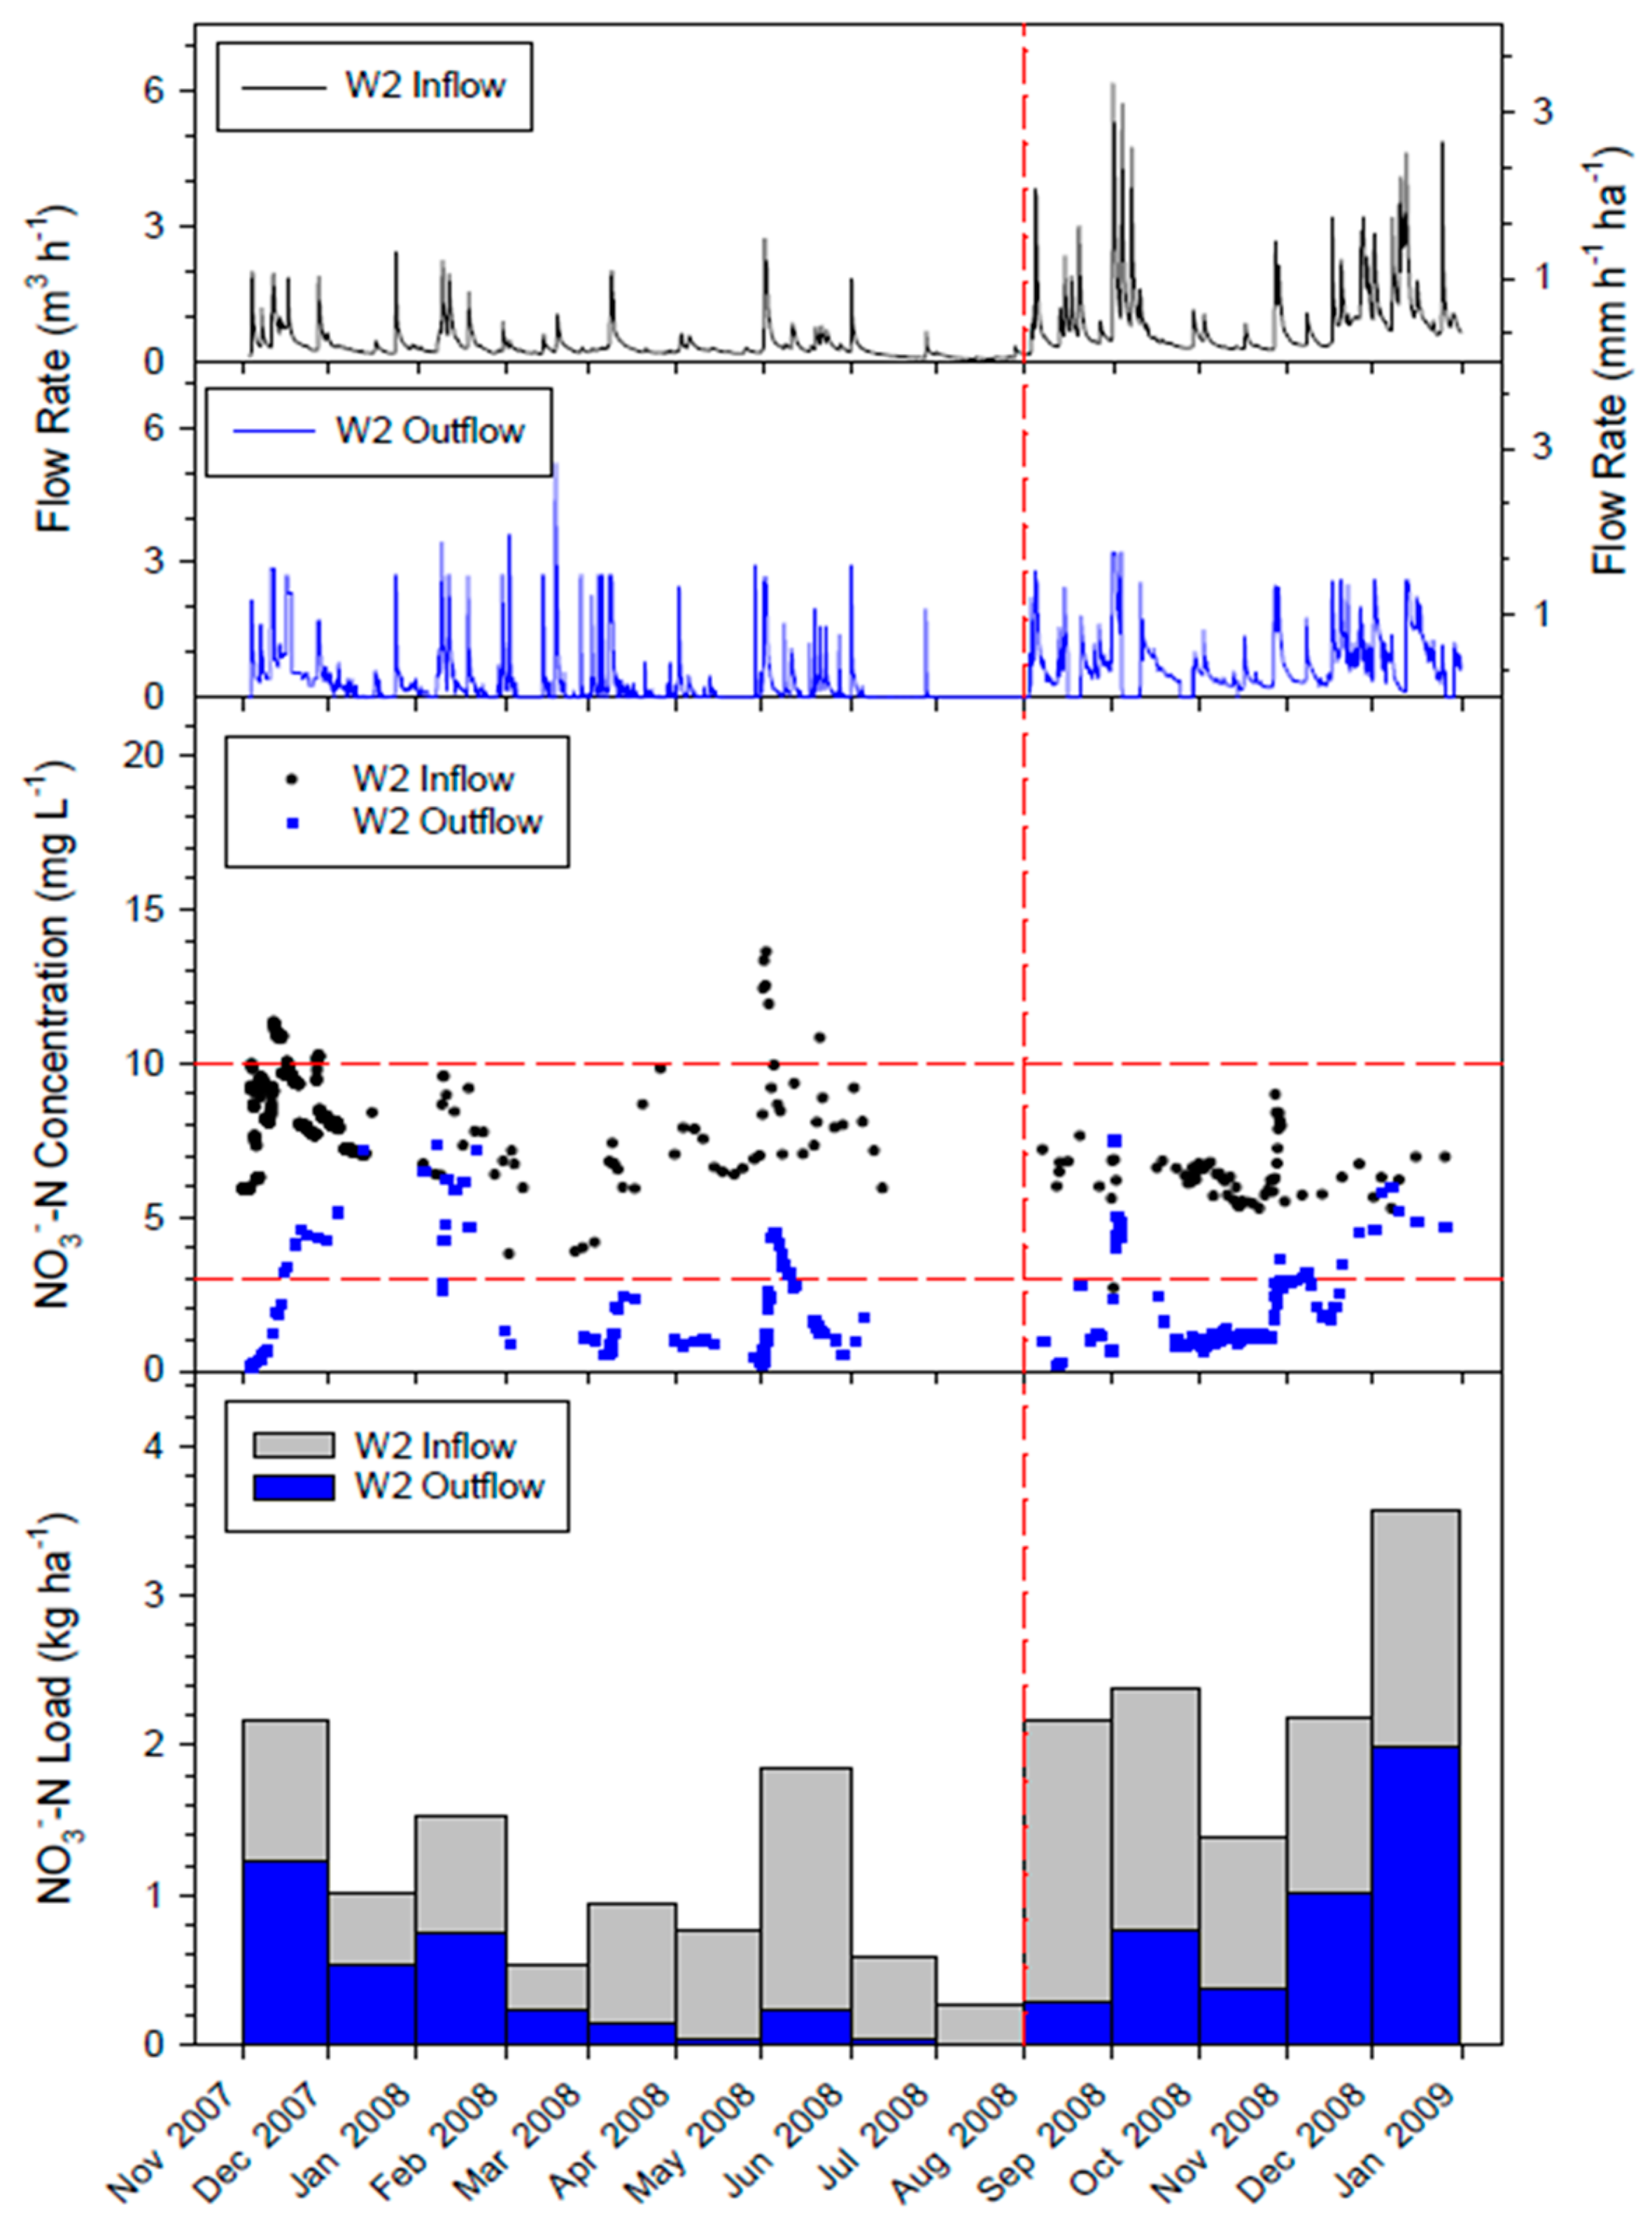
The mean NO3−-N concentration in the tile drainage water (CW influent) was 6.7 mg L−1 and ranged from 2.68 to 13.6 mg L−1 (Table 3). The highest concentration was recorded during an 18.4 mm rainfall event in June 2008, immediately after a manure application. This resulted in an average flow of 5.4 m3 h−1 over a three-day period, which accounted for 5.5% of the total annual NO3−-N load. Lower flow rates (0–2 m3 h−1) accounted for 76% of the load during 2008 (Figure 6), which is further displayed by the clustering of low concentrations at low flow rates. Previous research [46] reported a similar distribution of 68% of annual total N loading during baseline drainage flow conditions, and 32% during storm induced drainage events. The highest flow event in this study was 6.3 m3 h−1, which occurred in October 2008 (Figure 3 and Figure 4). This event however, resulted in a relatively low NO3−-N load of only 2.4 kg ha−1. This agrees with [48] who reported decreasing NO3−-N loading during rainfall events (high flow rate), but increasing loading before and after streamflow peak; and agrees with [49] who observed that high rainfall in the week before a sample was a stronger predictor of increased NO3−-N concentrations than was high rainfall on the sampling day.
The mass NO3−-N reduction through the CW was 67.6% (Table 3), which was greater than reported in similar studies [4,50]. However similar average removal of 68% over three years was found by [51] from a tile drainage treatment wetland in Minnesota. While the effluent concentrations were always below the Health Canada drinking water guideline (10 mg L−1) [29], the CCME Canadian Water Quality Guideline for the Protection of Aquatic Life (Freshwater) (aquatic life guideline) [52] (3 mg L−1) was often exceeded (Figure 3). Daily NO3−-N concentrations were poorly correlated with CW inflow from tile drainage (r = 0.212, p < 0.05), and treatment efficiency of NO3−-N improved moderately with higher daily inflow volume (r = 0.456, p < 0.05). N removal is also dependent on temperature, and influenced by microbial activity [53,54]. The daily treatment efficiencies of NO3−-N in 2008 displayed a moderate and significant relationship with daily mean Ta (r = 0.36, p < 0.05).
The reservoir outflow NO3−-N concentrations throughout 2008 were on average 1.2 mg L−1 and ranged from 0.02 to 4.5 mg L−1 (Table 3), which was below drinking Health Canada drinking water guideline (10 mg L−1). These reduced concentrations from the CW outlet may be attributed to a combination of additional treatment within the reservoir and dilution from precipitation. Outflow concentrations exceeded the CCME aquatic life guideline (3 mg L−1) on 25 d throughout the year and primarily occurred during the winter. A previous review identified that a key challenge for crop producers in Eastern Canada is to minimize losses of N to air or waterways [55]. The data in the present study suggest that WRI was effective at capturing and reducing the N concentration in drainage water and making it available for re-use as irrigation rather than wasted as an environmental pollutant.
3.5. Escherichia coli
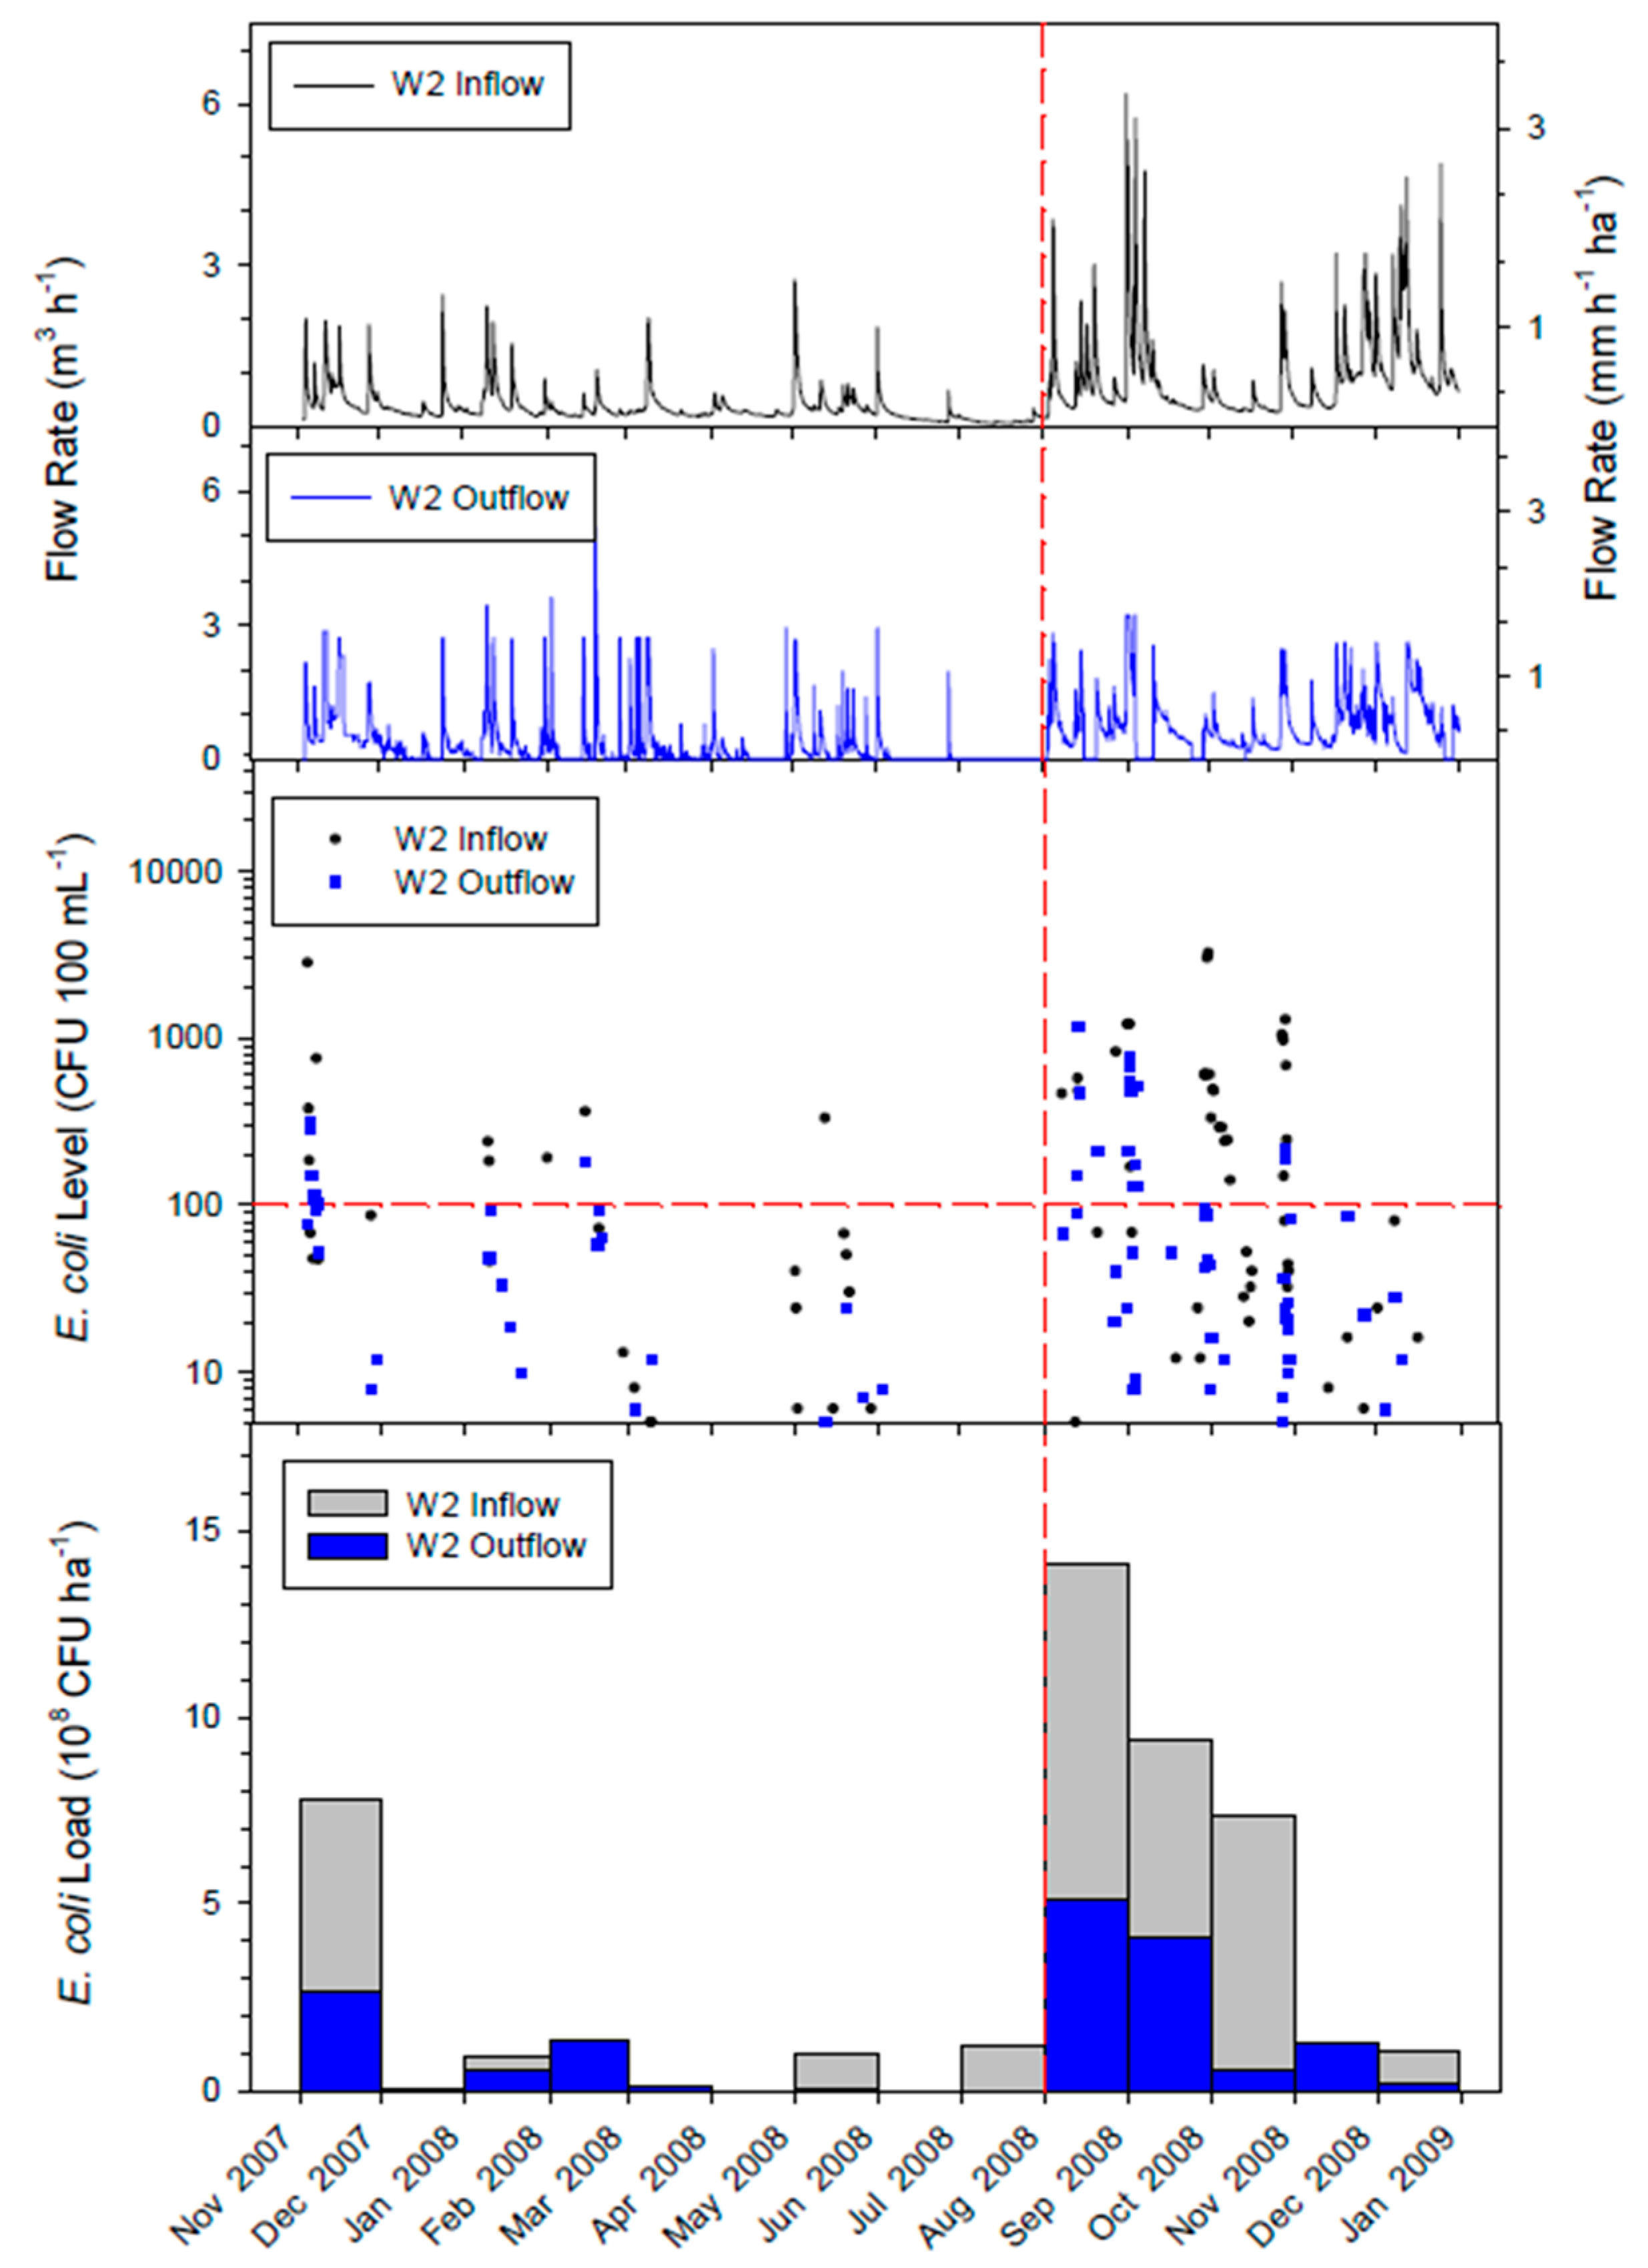
Average E. coli reductions through the CW were 63.3% (Table 3), which is less than the 95% found by [56] and the 96.8 to 99.7% found by [22] for CWs treating domestic wastewater in both warm and cold seasons. The difference for these is likely due to the high E. coli concentrations from stronger wastewater and low flow (0.3 to 1 m3 d−1) in previous studies, compared to 16.8 m3 d−1, on average, in this study for tile drain discharge. Tile drainage outflow concentrations of E. coli exceeded the CCME irrigation water guideline (100 CFU 100 mL−1) on 79 d (Figure 4), but were generally less than the mean E. coli concentrations (mean = 2891 CFU 100 mL−1) observed at the same site by Thiagarajan et al. [47], likely due to the longer duration of zero tillage practices in their study resulting in higher macropores and preferential flow to tiles leading to greater loads of E. coli discharge. The CW reduced mean E. coli concentrations below the CCME irrigation water guideline. However, E. coli concentrations appeared to be increased in the reservoir (likely due to inhabitation by ducks, geese, and other wildlife species), so that reservoir outflow E. coli concentrations averaged 178 CFU 100 mL−1 (ranging from 0 to 2700 CFU 100 mL−1).
The highest levels in the reservoir were measured during the fall corresponding to low flow conditions (0.5 to 1.1 m3 h−1) and high presence of waterfowl. These lower flows of 0 to 2 m3 h−1 accounted for 71% of the total annual load (Figure 6). The two highest flow rate events (5.8 and 6.2 m3 h−1), also in the fall, had corresponding E. coli concentrations of 69 to 1010 CFU 100 mL−1. Elevated E. coli concentrations were predominantly recorded at low flow rates with higher RTs, hence accounting for the high load percentages at 0 to 1 m3 h−1. Retention time has been found to be the most important factor in E. coli treatment [57] whereby a short RT of <1 d has resulted in considerable bacteria retention (~70%), with longer RTs potentially resulting in E. coli regeneration [16].
During the four highest flow events of 2008, the CW treatment performance was positively correlated with inflow rate (r = 0.51, p < 0.05); hence, a higher flow improved treatment reductions of E. coli load. The distribution by flow rates for both E. coli loads suggest that treatment during high flow periods were not as critical as expected. Levels of E. coli in the reservoir outflow (Table 3) exceeded the CCME irrigation water guideline on day 119 in 2008. This illustrates a challenge to any treatment technology that does not treat water immediately before irrigation. Therefore, it may not be safe to use reservoir water for irrigation of crops consumed raw immediately after harvest.
The E. coli concentrations in the drainage water displayed seasonal patterns, with higher values in the late summer and early fall (July-Sept) in which times the CCME irrigation water guideline was routinely exceeded (Figure 4). However, E. coli concentrations throughout the remaining months were predominantly below the guideline. Typically, E. coli removal rate increases with higher temperature and UV, thus we would expect higher treatment rates in the summer [58]. However, we found daily treatment efficiencies of E. coli to be only weakly dependent on Ta. Boutilier et al. [56] found E. coli reductions rates were lower in warmer summer months that in spring—partially due to coverage by duckweed in the summer that blocked UV. It was suggested that in the warm season, E. coli may increase, or be regenerated, within a wetland. In the current study, higher Ta was significantly correlated to increased levels of E. coli at the reservoir outflow (r = 0.41, p < 0.05). When Ta was >15 °C (lowest mean daily Ta for June–August), the average E. coli concentrations were 542 CFU 100 mL−1. Further, elevated evapotranspiration losses during the warm season may contribute to increased E. coli concentrations at that time. Seasonal birds and mammals inhabiting the areas adjacent to the reservoir during the warm season likely contributed to the increased E. coli as well.
3.6. First-Order Areal Uptake Rates and CW Sizing
To aid in the future sizing of similar CWs, first-order areal uptake rates (k) were generated using Equation (1) and adjusted ks (kadjs) were also calculated to account for the changes in concentrations due to hydrologic losses or gains. Due to cold-season slow-down, the mean ks and kadjs for both NO3−-N (9.2 m y−1 and 8.0 m y−1, respectively) and E. coli (7.7 m y−1 and 6.4 m y−1, respectively) were lower than the ks reported by Kadlec and Knight [27], (30 m y−1 for NO3−-N and 83 m y−1 for E. coli). Results of ks and kadjs were in closer agreement to that of Jamieson et al. [31] who reported k of 1.9 m y−1 and 11.0 m y−1 for NO3−-N and E. coli, respectively, and kadj values of −0.2 m y−1 and 8.3 m y−1 for NO3−-N and E. coli, respectively. The CW size for the current study effectively reduced pollution concentrations was economically feasible, fit within the allocated land, and did not dry-up during low flow periods. It may therefore be acceptable to use the non-adjusted ks values from similar studies in the literature when sizing CWs for receiving tile drainage water. Others [57] have demonstrated the ability of a relatively small wetland area to treat run-off from large agriculture areas, with higher removal efficiencies for E. coli (i.e., 80–87%) in similar surface-flow wetlands that allowed evapotranspiration losses. This further supports the use of a smaller wetland area than that calculated and used by [27,31].
3.7. Irrigation Water Availability
To illustrate water availability the annual period of reservoir recharge is assumed to be a 12-month period starting 1 October when the seasonal need for reservoir irrigation is over. Between 1 October 2007 and 1 October 2008, the reservoir captured 15,600 m3 (8666 m3 ha−1 of drained land) from CW outflow and precipitation. Evapotranspiration removed 1536 m3 (512 mm) from the reservoir during this period, leaving 14,064 m3 of available water during the following growing season. This volume is considerably greater than the projected volume of 8500 m3 from captured ground water and some surface runoff from drained land. The volume of water available is equivalent to 780 mm of water for irrigation over the 1.8 ha of drained land, provided that the reservoir capacity was sufficient to retain it all. This quantity of water would therefore exceed the typical irrigation requirements and therefore could provide irrigation water to land outside the drainage area.
In a similar system in Ontario, Tan et al. [4] reported annual tile drainage outflows of 238 and 167 mm under free and controlled drainage, respectively. Other studies on CWs receiving solely tile drainage water have reported annual CW outflow volumes ranging from 150 to 280 mm [41,43,44]. The differences in available water between the present study (780 mm) and others (from 150 to 280 mm) may be attributed to a greater amount of precipitation in Nova Scotia. This illustrates the importance of adapting WRI system designs to local environmental conditions. Accurately sized reservoirs will capture all available water to maximize irrigation benefits and accurately sized CWs will provide the desired treatment without unnecessary construction and land use expenses.
4. Conclusions
Constructed wetlands have received increased focus in recent years due to their potential to remove nutrients and other pollutants from agricultural wastewater. On average, mass reductions by the CW were 67.7% and 63.3% for NO3−-N and E. coli, respectively. Elevated E. coli concentrations were observed in the reservoir (CW effluent) during the warm season. It may therefore be best to use reservoir water for irrigation of crops that are not consumed raw.
In the current study, a relatively smaller CW size (5.7% of drainage area) was adequate for treating the tile drainage inputs. Current results provide guidance for future WRI system design applications. Efficiency of a WRI system occurs when all available water inputs are captured subsequent to treatment, thus maximizing the irrigation benefits. Currently, no WRI systems are in use in Atlantic Canada. The results of the current study support the use of WRI as effective for mitigating environmental water pollution from agricultural drainage water, with site-specific testing required for improved efficiency.
Acknowledgments
This study was financially supported by the Canada-Nova Scotia Water Supply Expansion Program, an initiative under the Federal-Provincial-Territorial Agricultural Policy Framework. Additional support was provided by Nova Scotia Power Inc., Aliant Inc., Stella-Jones, the Canada Research Chairs Program, NSERC. University of Guelph and Wilfrid Laurier University.
Author Contributions
Michael J. Haverstock (M.J.H.), Ali Madani (A.M.), and Robert J. Gordon (R.J.G.) conceived and designed the study; M.J.H. acquired data from the treatment system; M.J.H., A.M. acquired laboratory data; A.M., R.J.G., contributed reagents/materials/analysis tools; M.J.H. analyzed the data; M.J.H., Hambaliou Baldé (H.B.), and Andrew VanderZaag (A.C.V.) interpreted the data, reviewed literature, and drafted the paper; R.J.G., A.M., A.C.V., M.J.H., H.B., provided critical revision of the manuscript; M.J.H., A.M., H.B., A.C.V., R.J.G. gave final approval of the version to be submitted.
Conflicts of Interest
The authors declare no conflict of interest.
References
- Coote, D.R.; Gregorich, L.J. The Health of Our Water, Towards Sustainable Agriculture in Canada; Publication No. 2020/E; Ministry of Public Works and Government Services: Ottawa, ON, Canada, 2000.
- De Kimpe, C.R. Water Quality/Quantity Issues for Sustainable Agriculture in Canada. In Proceedings of the 12th International Soil Conservation Organization Conference (ISCO), Beijing, China, 26–31 May 2002; pp. 380–385. [Google Scholar]
- Exall, K.; Marsalek, J.; Schaefer, K. Water Reuse in Canada: Opportunities and Challenges. In Integrated Urban Water Resources Management; Hlavinek, P., Kukharchyk, T., Marsalek, J., Mahrikova, I., Eds.; Springer: Dordrecht, The Netherlands, 2006; pp. 253–262. [Google Scholar]
- Tan, C.S.; Zhang, T.Q.; Drury, C.F.; Reynolds, W.D.; Oloya, T.; Gaynor, J.D. Water Quality and Crop Production Improvements Using a Wetland-Reservoir and Drainage/Subsurface Irrigation System. Can. Water Resour. J. 2007, 32, 129–136. [Google Scholar] [CrossRef]
- Kornecki, T.S.; Fouss, J.L. Quantifying soil trafficability improvements provided by subsurface drainage for field crop operations in Louisiana. Appl. Eng. Agric. 2001, 17, 777–781. [Google Scholar] [CrossRef]
- Rozema, E.R.; VanderZaag, A.C.; Wood, J.D.; Drizo, A.; Zheng, Y.; Madani, A.; Gordon, R.J. Constructed Wetlands for Agricultural Wastewater Treatment in Northeastern North America: A Review. Water 2016, 8, 173. [Google Scholar] [CrossRef]
- Rochon, J.; Gordon, R.; Madani, A.; Rodd, V.; Cochrane, L. Seasonal Influences on Constructed Wetlands for Treatment of Agricultural Wastewater in Nova Scotia, Canada; ASAE Paper No. 992205; ASAE: St. Joseph, MI, USA, 1999. [Google Scholar]
- Smith, E.; Gordon, R.; Madani, A.; Stratton, G. Year-round treatment of dairy wastewater by constructed wetlands in Atlantic Canada. Wetlands 2006, 26, 349–357. [Google Scholar] [CrossRef]
- Wood, J.D.; Gordon, R.; Madani, A.; Stratton, G. A long term assessment of phosphorus treatment by a constructed wetland receiving dairy wastewater. Wetlands 2008, 28, 715–723. [Google Scholar] [CrossRef]
- MacPhee, N.B.; Gordon, R.; Gagnon, G.A.; Stratton, G.W.; Blanchard, J.; Wood, J.D. Evaluation of a Diffused Air Aeration System for a Constructed Wetland Receiving Dairy Wastewater. Trans. ASABE 2009, 52, 111–119. [Google Scholar] [CrossRef]
- Carreau, R.; VanAcker, S.; VanderZaag, A.C.; Madani, A.; Drizo, A.; Gordon, R.J. Evaluation of a Surface Flow Constructed Wetland Treating Abattoir Wastewater. Appl. Eng. Agric. 2012, 28, 757–766. [Google Scholar] [CrossRef]
- Allred, B.J.; Brown, L.C.; Fausey, N.R.; Cooper, R.L.; Clevenger, W.B.; Prill, G.L.; La Barge, G.A.; Thornton, C.; Riethman, D.T.; Chester, P.W.; et al. Water table management to enhance crop yields in a wetland reservoir subirrigation system. Appl. Eng. Agric. 2003, 19, 407–421. [Google Scholar] [CrossRef]
- Allred, B.J.; Gamble, D.L.; Clevenger, W.B.; LaBarge, G.A.; Prill, G.L.; Czartoski, B.J.; Fausey, N.R.; Brown, L.C. Crop yield summary for three wetland reservoir subirrigation systems in Northwest Ohio. Appl. Eng. Agric. 2014, 30, 889–903. [Google Scholar]
- Reinhart, B.; Frankenberger, J.; Abendroth, L.; Ahiablame, L.; Bowling, L.; Brown, L.; Helmers, M.; Jaynes, D.; Jia, X.; Kladivko, E.; et al. Drainage Water Storage for Improved Resiliency and Environmental Performance of Agricultural Landscapes. In Proceedings of the 10th International Drainage Symposium, Minneapolis, MN, USA, 7–9 September 2016. [Google Scholar] [CrossRef]
- Camargo, J.A.; Alonso, A. Ecological and Toxicological Effects of Inorganic Nitrogen Pollution in Aquatic Ecosystems: A Global Assessment. Environ. Int. 2006, 32, 831. [Google Scholar] [CrossRef] [PubMed]
- Kadlec, R.H. Constructed Marshes for Nitrate Removal. Crit. Rev. Environ. Sci. Technol. 2012, 42, 934–1005. [Google Scholar] [CrossRef]
- Mitsch, W.J.; Day, J.W.; Zhang, L.; Lane, R.R. Nitrate-nitrogen Retention in Wetlands in the Mississippi River Basin. Ecol. Eng. 2005, 24, 267–278. [Google Scholar] [CrossRef]
- Kadlec, R.H. Nitrate Dynamics in Event-driven Wetlands. Ecol. Eng. 2010, 36, 503–516. [Google Scholar] [CrossRef]
- Fisher, J.; Acreman, M.C. Wetland Nutrient Removal: A Review of the Evidence. Hydrol. Earth Syst. Sci. Discuss. 2004, 8, 673–685. [Google Scholar] [CrossRef]
- Tanner, C.C.; Kadlec, R.H. Influence of hydrological regime on wetland attenuation of diffuse agricultural nitrate losses. Ecol. Eng. 2013, 56, 79–88. [Google Scholar] [CrossRef]
- Boutilier, L.; Jamieson, R.; Gordon, R.; Lake, C. Modeling E. coli Fate and Transport in Treatment Wetlands Using the Water Quality Analysis and Simulation Program. J. Environ. Sci. Health Part A 2011, 46, 680–691. [Google Scholar] [CrossRef] [PubMed]
- Smith, E.; Gordon, R.; Madani, A.; Stratton, G. Pathogen Removal by Agricultural Constructed Wetlands in Cold Climates. J. Environ. Inform. 2005, 6, 46–50. [Google Scholar] [CrossRef]
- Environment Canada. Canadian Climate Normal 1981–2010 Station Data. Truro, Nova Scotia. Available online: http://climate.weather.gc.ca/climate_normals/index_e.html (accessed on 28 December 2016).
- Webb, K.T.; Langille, D.R. Soils of the Fiddes and Brookside Research Fields, Colchester County, Nova Scotia—Revised; Research Branch, Agriculture and Agriculture-Food Canada: Halifax, NS, Canada, 1996. [Google Scholar]
- Smith, E.L. Evaluation of Agricultural Constructed Wetlands in Cold Climates. M.Sc. Thesis, Department of Engineering, Nova Scotia Agricultural College and Dalhousie University, Halifax, NS, Canada, 2002. [Google Scholar]
- Walkowiak, D.K. Isco Open Channel Flow Measurement Handbook, 6th ed.; Teledyne Isco, Inc.: Lincoln, NE, USA, 2006. [Google Scholar]
- Kadlec, R.H.; Knight, R.L. Treatment Wetlands; CRC Press/Lewis Publishers: Boca Raton, FL, USA, 1996. [Google Scholar]
- Wong, T.H.F.; Geiger, W.F. Adaptation of wastewater surface flow wetland formulae for application in constructed stormwater wetlands. Ecol. Eng. 1997, 9, 187–202. [Google Scholar] [CrossRef]
- Health Canada. Guidelines for Canadian Drinking Water Quality—Summary Table. Water and Air Quality Bureau, Healthy Environments and Consumer Safety Branch, Health Canada: Ottawa, ON, Canada, 2007. Available online: http://www.hc-sc.gc.ca/ewh-semt/alt_formats/pdf/pubs/water-eau/sum_guide-res_recom/sum_guide-res_recom-eng.pdf (accessed on 11 June 2017).
- Canadian Council of Ministers of the Environment (CCME). Water Quality Guidelines for the Protection of Agriculture, Irrigation, Livestock -Summary Table. Available online: http://st-ts.ccme.ca/en/index.html (accessed on 11 June 2017).
- Jamieson, R.; Gordon, R.; Wheeler, N.; Smith, E.; Stratton, G.; Madani, A. Determination of first order rate constants for wetlands treating livestock wastewater in cold climates. J. Environ. Eng. Sci. 2007, 6, 65–72. [Google Scholar] [CrossRef]
- Schueler, T.R. Design of Storm Water Wetland System: Guidelines for Creating Diverse and Effective Storm Water Wetlands in the Mid-Atlantic Region; Metropolitan Washington Council of Governments: Washington, DC, USA, 1992.
- Haverstock, M.J. An Assessment of a Wetland-Reservoir Wastewater Treatment and Reuse System Receiving Agricultural Drainage Water in Nova Scotia. M.Sc. Thesis, Dalhousie University, Halifax, NS, Canada, 2010. [Google Scholar]
- Natural Resources Conservation Services (NRCS). Ponds—Planning, Design, Construction. In United States Department of Agriculture Agricultural Handbook 590; United States Department of Agriculture: Washington, DC, USA, 1997. Available online: https://www.nrcs.usda.gov/Internet/FSE_DOCUMENTS/nrcs144p2_030362.pdf (accessed on 11 June 2017).
- Reinhardt, M.; René, G.; Wehrli, B.; Müller, B. Phosphorus Retention in Small Constructed Wetlands Treating Agricultural Drainage Water. J. Environ. Qual. 2005, 34, 1251–1259. [Google Scholar] [CrossRef] [PubMed]
- Bowman, R.S. Evaluation of some new tracers for soil water studies. Soil Sci. Soc. Am. J. 1984, 48, 987–993. [Google Scholar] [CrossRef]
- Smith, E.; Gordon, R.; Madani, A.; Stratton, G. Cold climate hydrological flow characteristics of constructed wetlands. Can. Biosyst. Eng. 2005, 47, 1.1–1.7. [Google Scholar]
- Whitmer, S.; Baker, L.; Wass, R. Loss of bromide in a wetland tracer experiment. J. Environ. Qual. 2000, 29, 2043–2045. [Google Scholar] [CrossRef]
- Clesceri, L.S.; Greenberg, E.A.; Eaton, A.D. Standard Methods for Examination of Water and Wastewater, 21st ed.; American Public Health Association (APHA): Washington, DC, USA, 2005. [Google Scholar]
- Hach, Co. Total Coliforms and E. coli. In Hach Microbiological Methods; Hach Company: Loveland, CO, USA, 1999. [Google Scholar]
- Kovacic, D.A.; David, M.B.; Gentry, L.E.; Starks, K.M.; Cooke, R.A. Effectiveness of Constructed Wetlands in Reducing Nitrogen and Phosphorus Export Form Agricultural Tile Drainage. J. Environ. Qual. 2000, 29, 1262–1274. [Google Scholar] [CrossRef]
- Kivaisi, A.K. The Potential for Constructed Wetlands for Wastewater Treatment and Reuse in Developing Countries: A Review. Ecol. Eng. 2001, 16, 545–560. [Google Scholar] [CrossRef]
- Kovacic, D.A.; Twait, R.M.; Wallace, M.P.; Bowling, J.M. Use of Created Wetlands to Improve Water Quality in the Midwest-Lake Bloomington Case Study. Ecol. Eng. 2006, 28, 258–270. [Google Scholar] [CrossRef]
- Tanner, C.C.; Nguyen, M.L.; Sukias, J.P.S. Nutrient removal by a constructed wetland treating subsurface drainage from grazed dairy pasture. Agric. Ecosyst. Environ. 2005, 105, 145–162. [Google Scholar] [CrossRef]
- Dierberg, F.E.; Juston, J.J.; DeBusk, T.A.; Pietro, K.; Gu, B. Relationship Between Hydraulic Efficiency and Phosphorus Removal in a Submerged Aquatic Vegetation-dominated Treatment Wetland. Ecol. Eng. 2005, 25, 9–23. [Google Scholar] [CrossRef]
- Raisin, G.W.; Mitchell, S.D.; Croome, L.R. The Effectiveness of a Small Constructed Wetland in Ameliorating Diffuse Nutrient Loadings from an Australian Rural Catchment. Ecol. Eng. 1997, 9, 19–35. [Google Scholar] [CrossRef]
- Thiagarajan, A.; Gordon, R.; Madani, A.; Stratton, W.G. Discharge of Escherichia Coli from Agricultural Surface and Subsurface Drainage Water: Tillage Effects. Water Air Soil Pollut. 2007, 182, 3–12. [Google Scholar] [CrossRef]
- Amado, A.A.; Schilling, K.E.; Jones, C.; Thomas, N.; Weber, L.J. Estimation of tile drainage contribution to streamflow and nutrient loads at the watershed scale based on continuously monitored data. Presented at An ASABE Meeting, Orlando, FL, USA, 17–20 July 2016. [Google Scholar] [CrossRef]
- Pease, L.A.; Fausey, N.R.; Martin, J.F.; Brown, L.C. Climate, Landscape, and Management Effects on Nitrate and Soluble Phosphorus Concentrations in Subsurface Drainage Discharge in the Western Lake Erie Basin. Presented at an ASABE Meeting, Orlando, FL, USA, 17–20 July 2016. [Google Scholar] [CrossRef]
- Baker, B.J.; Allred, B.J.; Luckeydoo, L.M.; Fausey, N.R.; Clevenger, W.B.; Brown, L.C.; Hamsher, S.E. Ohio Wetland Reservoir Subirrigation System (WRSIS)—Preliminary Results. In Proceedings of the 8th International Drainage Symposium, St. Joseph, MI, USA, 21–24 March 2004; pp. 89–98. [Google Scholar]
- Lenhart, C.; Gordon, B.; Gamble, J.; Current, D.; Ross, N.; Herring, L.; Nieber, J.; Peterson, H. Design and Hydrologic Performance of a Tile Drainage Treatment Wetland in Minnesota, USA. Water 2016, 8, 549. [Google Scholar] [CrossRef]
- Canadian Council of Ministers of the Environment (CCME). Canadian Water Quality Guidelines for the Protection of Aquatic Life. Summary of Canadian Water Quality Guidelines for the Protection of Aquatic Life. Available online: http://www.halifax.ca/energy-environment/environment/documents/CWQG.PAL.summaryTable7.1.Dec2007.pdf (accessed on 11 June 2017).
- Tanner, C.C.; Sukias, J.P.S. Multiyear Nutrient Removal Performance of Three Constructed Wetlands Intercepting Tile Drain Flows from Grazed Pastures. J. Environ. Qual. 2011, 40, 620. [Google Scholar] [CrossRef] [PubMed]
- Van de Moortel, A.M.K.; Meers, E.; Pauw, N.D.; Tack, F.M.G. Effects of Vegetation, Season and Temperature on the Removal of Pollutants in Experimental Floating Treatment Wetlands. Water Air Soil Pollut. 2010, 212, 281–297. [Google Scholar] [CrossRef]
- Zebarth, B.J.; Drury, C.F.; Tremblay, N.; Cambouris, A.N. Opportunities for Improved Fertilizer Nitrogen Management in Production of Arable Crops in Eastern Canada: A Review. Can. J. Soil Sci. 2009, 89, 113–132. [Google Scholar] [CrossRef]
- Boutilier, L.; Jamieson, R.; Gordon, R.; Lake, C.; Hart, W. Performance of Surface-flow Domestic Wastewater Treatment Wetlands. Wetlands 2010, 30, 795–804. [Google Scholar] [CrossRef]
- Diaz, F.J.; O’Geen, A.T.; Dahlgren, R.A. Efficacy of constructed wetlands for removal of bacterial contamination from agricultural return flows. Agric. Water Manag. 2010, 97, 1813–1821. [Google Scholar] [CrossRef]
- Easton, J.H.; Gauthier, J.; Lalor, M.M.; Pitt, R. Die-off of Pathogenic E. coli 0157:H7 in Sewage Contaminated Waters. J. Am. Water Resour. Assoc. 2005, 41, 1187–1193. [Google Scholar] [CrossRef]
Figure 1.
(a) Overhead view of drainage area, wetland and reservoir; and (b) constructed wetland diagram (not in scale). Labeled are (A) tile drain outlets and sampling hut; (B) constructed wetlands (CW1 and CW2) including alternating deep and shallow zones with vegetation; (C) constructed wetland outlet sampling hut and adjacent control structures and emergency spillways; (D) reservoir, and (E) dam.
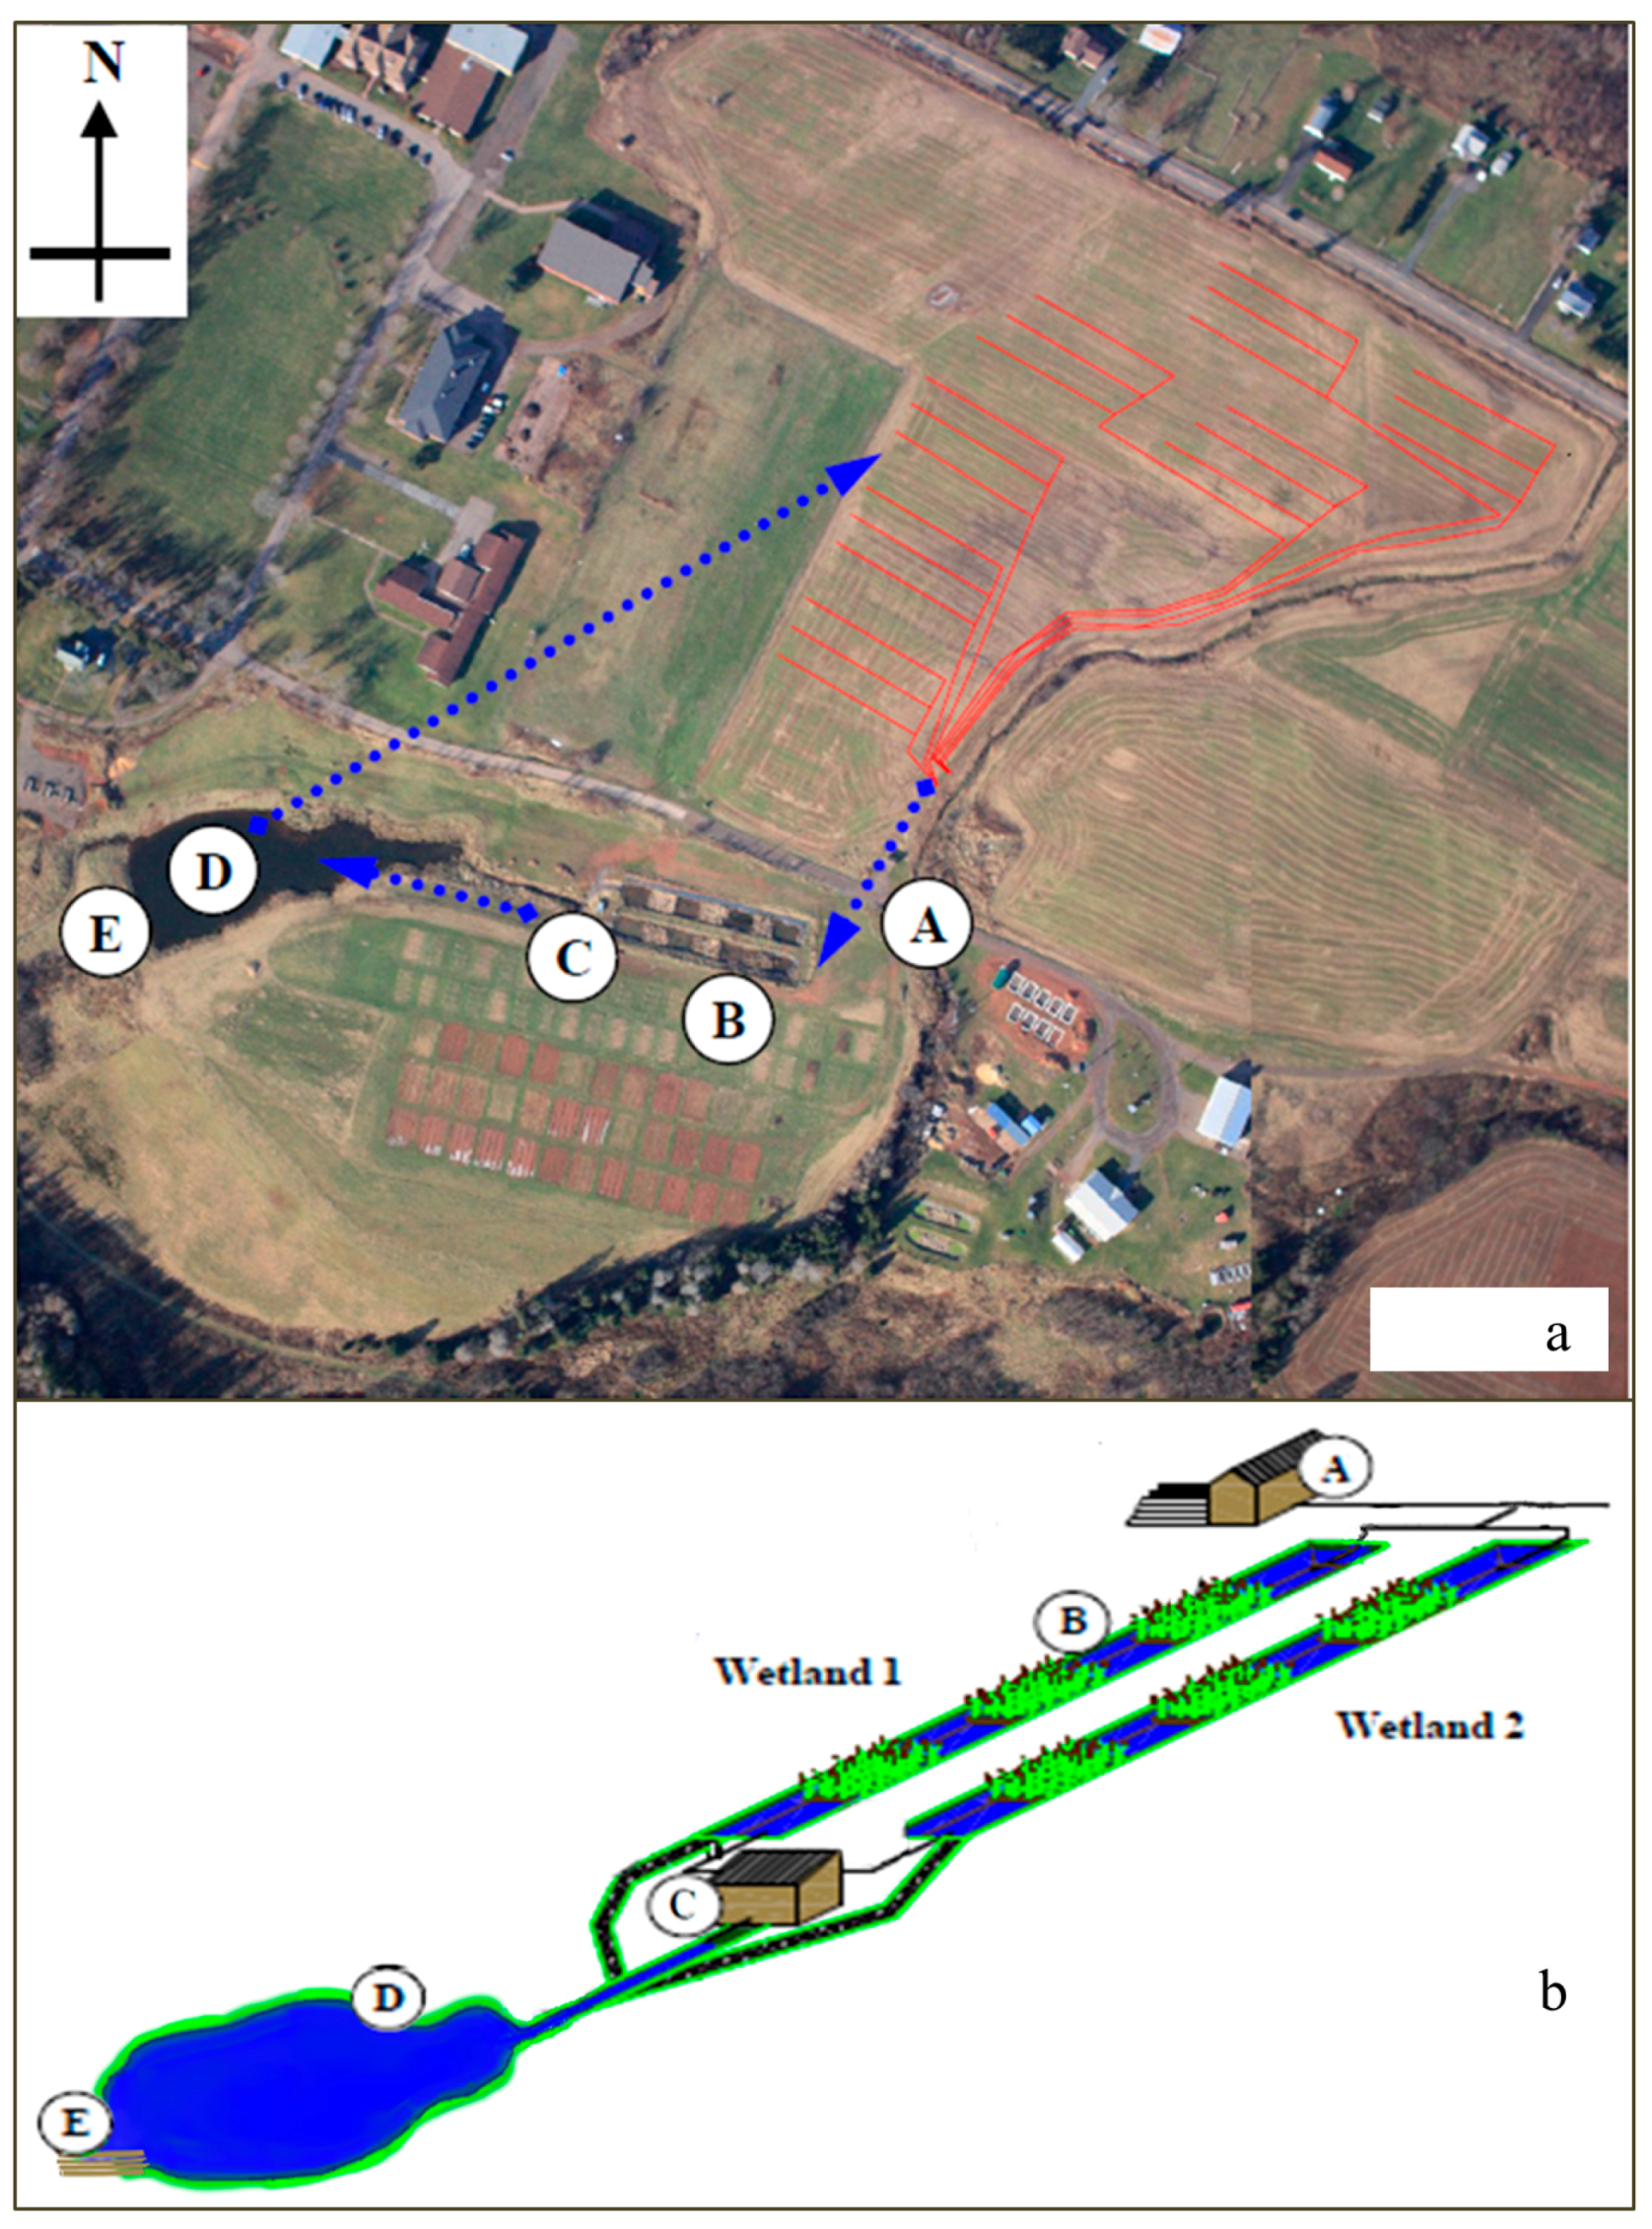
Figure 2.
Flow rates (m3 h−1) at the tile drainage outlet.

Figure 3.
Flow rates at the wetland inlet (m3 h−1; and standardized as a depth over the constructed wetland surface area per drained field surface area, mm h−1 ha−1), nitrate-nitrogen (NO3−-N) concentrations (mg L−1) and NO3−-N loads (kg ha−1) at the Wetland 2 (CW2) inlet and outlet. The date when all inflow was directed to CW2 is shown by vertical dashed line. The Health Canada Guideline for Canadian Drinking Water Quality (10 mg L−1) and Canadian Council of Ministers of the Environment (CCME) Canadian Water Quality Guideline for the Protection of Aquatic life (Freshwater) (3.0 mg L−1) are shown by the horizontal dashed lines.

Figure 4.
Flow rates (m3 h−1), flow rates standardized as a depth over the constructed wetland surface area per drained field surface area (mm h−1 ha−1), Escherichia coli (E. coli) concentrations (CFU 100 mL−1) and E. coli loads (108 CFU ha−1) at the Wetland 2 (CW2) inlet and outlet. The date when all inflow was directed to CW2 is shown by vertical dashed line. The Canadian Council of Ministers of the Environment (CCME) Canadian Water Quality Guideline for the Protection of Agriculture Water Uses (Irrigation Water) (100 CFU 100 mL−1) is shown by the horizontal dashed line.

Figure 5.
Constructed wetland 2 (CW2) tracer response curve during tracer study from 24 September 2008 (day 0) to 28 October 2008 (day 34). The measured residence time (d) is shown by the vertical dashed line. Due to water sampling being prematurely stopped before bromide (Br−) concentrations returning to background levels, the curve was linearly extrapolated from the last known concentration.
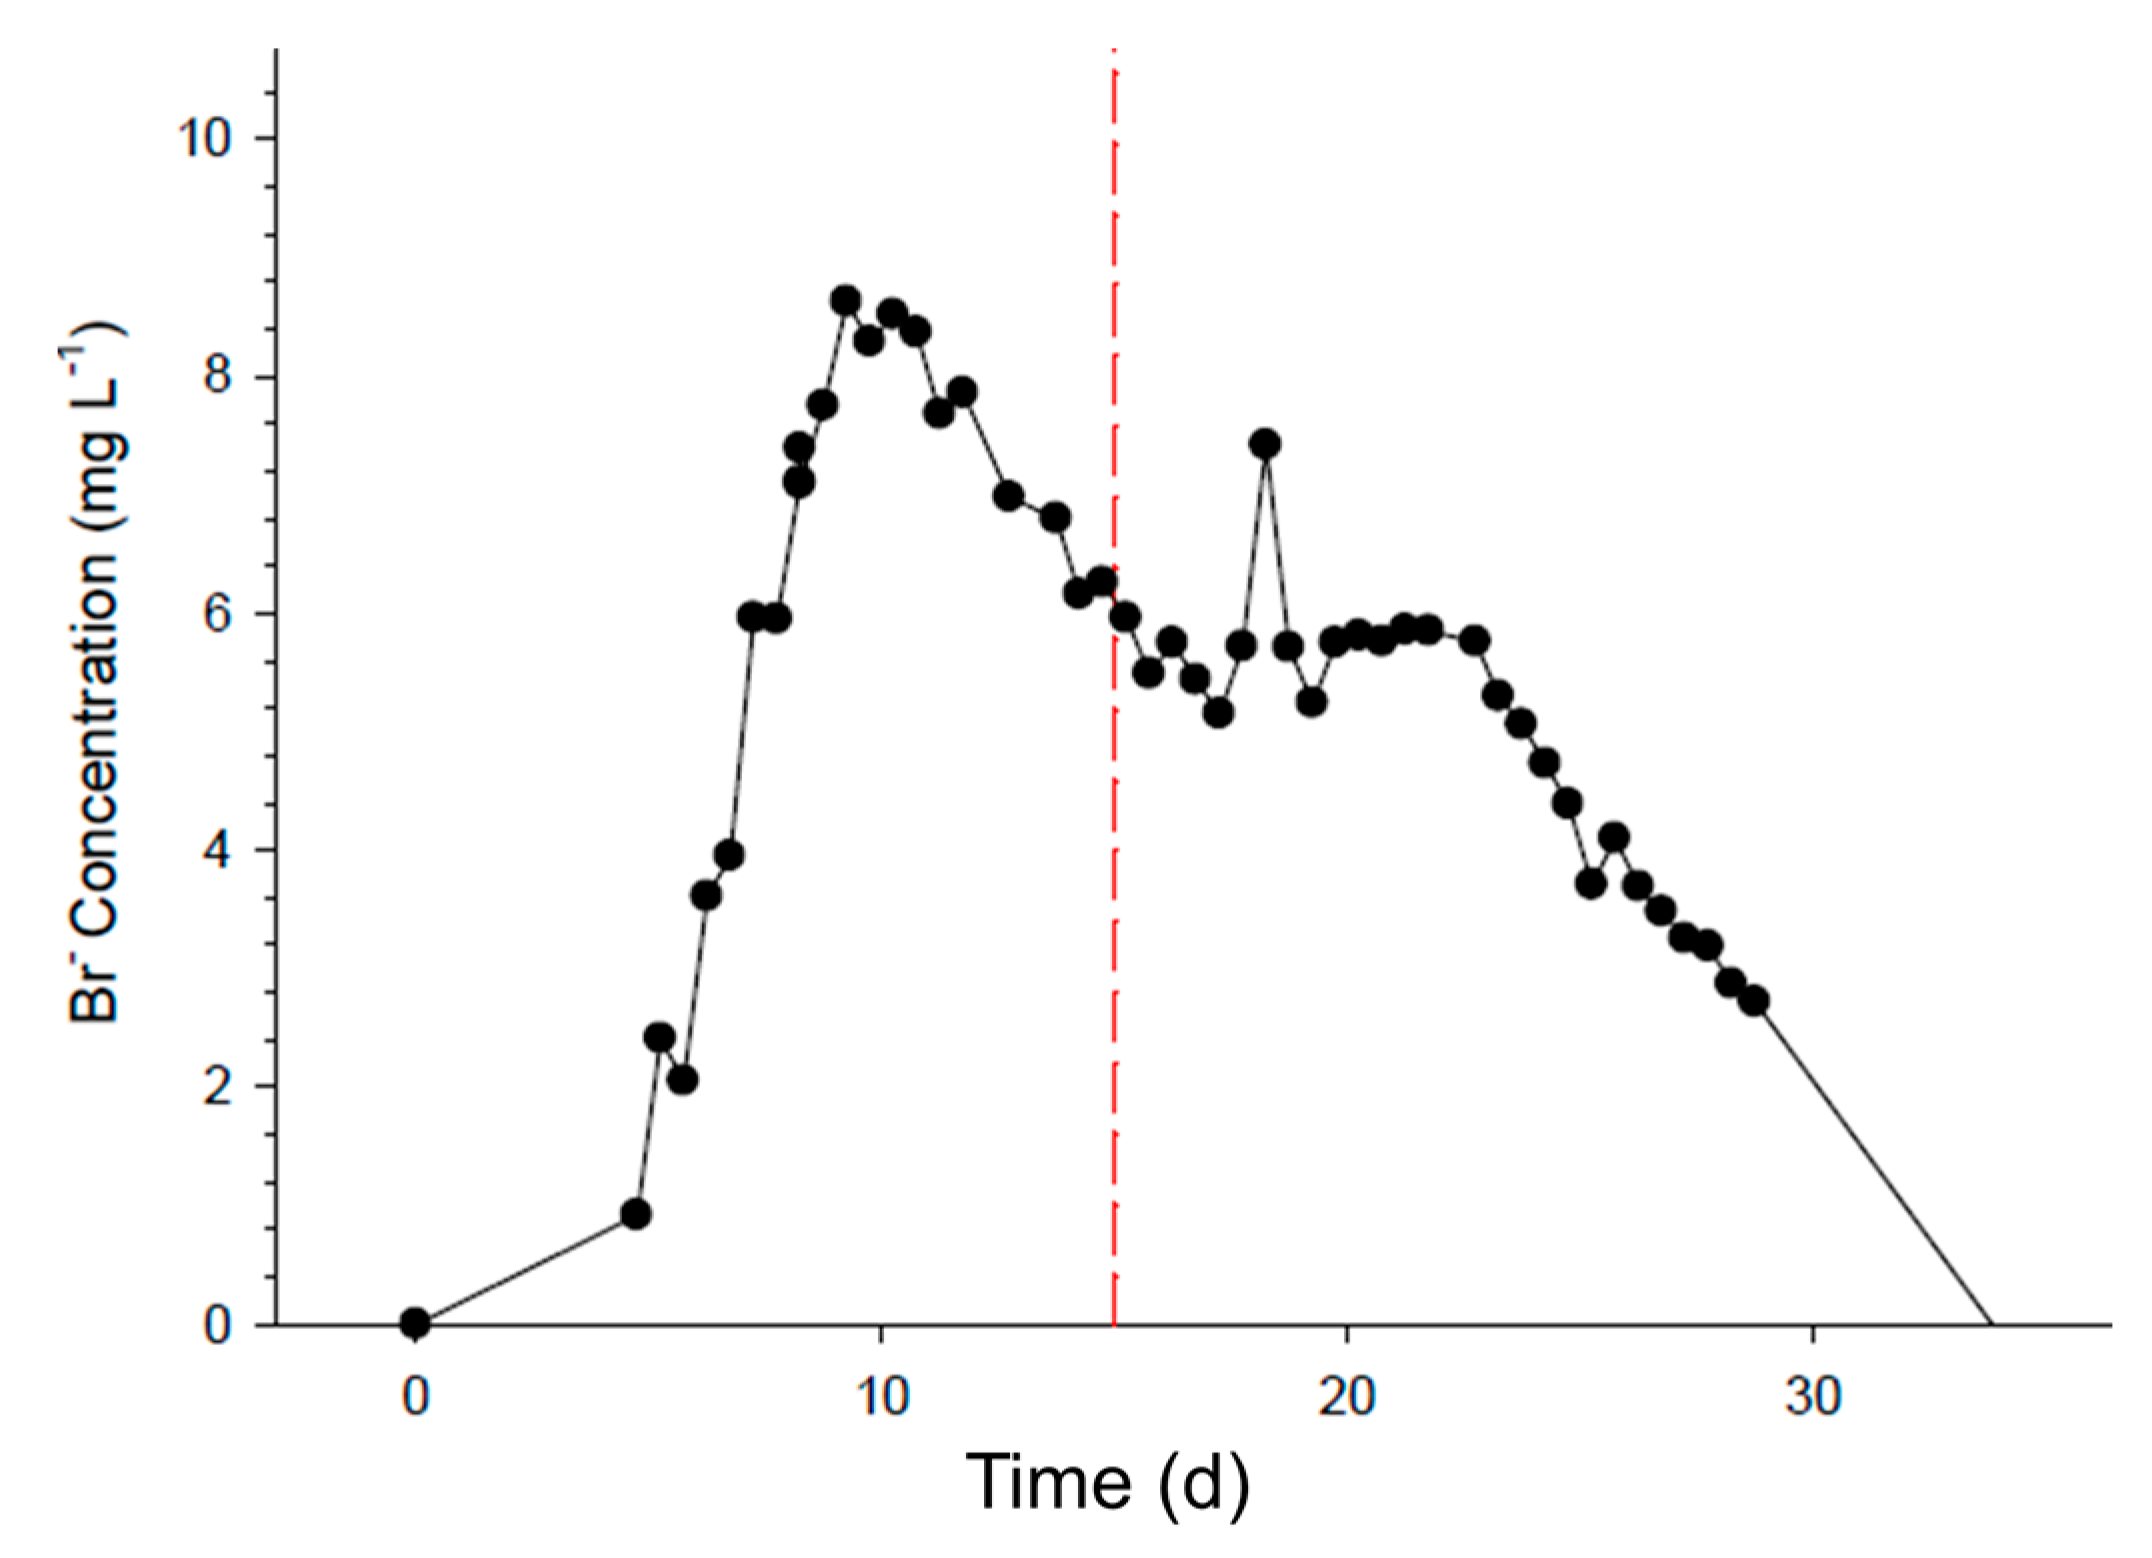
Figure 6.
Percentage (%) of the annual E. coli and nitrate-nitrogen loads in the tile drainage outflow by effluent flow rate range (m3 h−1).
Figure 6.
Percentage (%) of the annual E. coli and nitrate-nitrogen loads in the tile drainage outflow by effluent flow rate range (m3 h−1).


Table 1.
Monthly summary of meteorological parameters including precipitation (mm), air temperature (°C), and solar radiation (MJ m−2 d−1) from November 2007 to December 2008 and summary of climate normal from 1971 to 2000 (Debert Weather Station, Environment Canada).
Table 1.
Monthly summary of meteorological parameters including precipitation (mm), air temperature (°C), and solar radiation (MJ m−2 d−1) from November 2007 to December 2008 and summary of climate normal from 1971 to 2000 (Debert Weather Station, Environment Canada).
| Months | Precipitation | Temperature | Solar Radiation | ||
|---|---|---|---|---|---|
| (mm) | (mm) * | (°C) | (°C) * | (MJ m−2 d−1) | |
| November 2007 | 143 | 112 | 3 | 3 | 5 |
| December 2007 | 92 | 106 | –5 | −4 | 4 |
| January 2008 | 100 | 93 | −4 | −7 | 6 |
| February 2008 | 142 | 82 | −4 | −6 | 8 |
| March 2008 | 118 | 94 | −3 | −2 | 12 |
| April 2008 | 64 | 86 | 5 | 4 | 16 |
| May 2008 | 103 | 104 | 9 | 10 | 16 |
| June 2008 | 58 | 96 | 15 | 15 | 18 |
| July 2008 | 78 | 91 | 20 | 19 | 19 |
| August 2008 | 169 | 90 | 18 | 18 | 14 |
| September 2008 | 145 | 109 | 14 | 14 | 13 |
| October 2008 | 88 | 108 | 8 | 8 | 9 |
| November 2008 | 160 | 112 | 4 | 3 | 5 |
| December 2008 | 189 | 106 | −1 | −4 | 4 |
Note: * Normal climate from 1971 to 2000, on a monthly basis.
Table 2.
Crop and manure application rates (t ha−1) for the tile drained field from 2001 to 2008. The manure type was liquid dairy manure for each year, except in 2001 where it was solid manure.
Table 2.
Crop and manure application rates (t ha−1) for the tile drained field from 2001 to 2008. The manure type was liquid dairy manure for each year, except in 2001 where it was solid manure.
| Year | Crop Type | Manure Application Rate (t ha−1) |
|---|---|---|
| 2008 | Barley | 70 |
| 2007 | Soybeans | 20 |
| 2006 | Spring wheat | 85 |
| 2005 | Barley | 65 |
| 2004 | Soybeans | 25 |
| 2003 | Spring wheat | 25 |
| 2002 | Barley | 40 |
| 2001 | Soybeans | 23 |
Table 3.
Mean and maximum and minimum range of nitrate-nitrogen (NO3−-N) concentrations (mg L−1) and Escherichia coli (E. coli) concentrations (CFU 100 mL−1), annual loads (kg ha−1 or CFU ha−1) including % reductions between outflow and inflow for CW2 inflow, outflow, and reservoir outflow.
Table 3.
Mean and maximum and minimum range of nitrate-nitrogen (NO3−-N) concentrations (mg L−1) and Escherichia coli (E. coli) concentrations (CFU 100 mL−1), annual loads (kg ha−1 or CFU ha−1) including % reductions between outflow and inflow for CW2 inflow, outflow, and reservoir outflow.
| Wetland | Concentration Mean (Range) (mg L−1 or CFU 100 mL−1) | Load (kg ha−1) | Reduction (%) |
|---|---|---|---|
| NO3−-N inflow (n = 266) | 6.7 (2.68–13.6) | 18.1 | 67.4% |
| NO3−-N outflow (n = 390) | 2.2 (0.2–7.47) | 5.9 | |
| E. coli inflow (n = 231) | 122 † (0–3200) | 36.2 × 10⁸ ‡ | 63.3% |
| E. coli outflow (n = 301) | 42 † (0–1160) | 13.3 × 10⁸ ‡ | |
| Reservoir Out | |||
| NO3−-N (n = 55) | 1.21 (0.02–4.51) | ||
| E. coli (n = 64) | 178 † (0–2700) |
Notes: † Reported as CFU 100 mL−1; ‡ Reported as CFU ha−1.
© 2017 by the authors. Licensee MDPI, Basel, Switzerland. This article is an open access article distributed under the terms and conditions of the Creative Commons Attribution (CC BY) license (http://creativecommons.org/licenses/by/4.0/).
Share and Cite
MDPI and ACS Style
Haverstock, M.J.; Madani, A.; Baldé, H.; VanderZaag, A.C.; Gordon, R.J. Performance of an Agricultural Wetland-Reservoir-Irrigation Management System. Water 2017, 9, 472. https://doi.org/10.3390/w9070472
AMA Style
Haverstock MJ, Madani A, Baldé H, VanderZaag AC, Gordon RJ. Performance of an Agricultural Wetland-Reservoir-Irrigation Management System. Water. 2017; 9(7):472. https://doi.org/10.3390/w9070472
Chicago/Turabian StyleHaverstock, Michael J., Ali Madani, Hambaliou Baldé, Andrew C. VanderZaag, and Robert J. Gordon. 2017. "Performance of an Agricultural Wetland-Reservoir-Irrigation Management System" Water 9, no. 7: 472. https://doi.org/10.3390/w9070472
Note that from the first issue of 2016, this journal uses article numbers instead of page numbers. See further details here.