Fate of Trace Organic Compounds in Granular Activated Carbon (GAC) Adsorbers for Drinking Water Treatment


1
Berliner Wasserbetriebe, Research and Development, 10864 Berlin, Germany
2
Technische Universität Berlin, Chair of Water Quality Control, Strasse des 17. Juni 135, 10623 Berlin, Germany
*
Author to whom correspondence should be addressed.
Water 2017, 9(7), 479; https://doi.org/10.3390/w9070479
Submission received: 30 April 2017
/
Revised: 23 June 2017
/
Accepted: 26 June 2017
/
Published: 30 June 2017
(This article belongs to the Special Issue Assessment of Water Quality and Treatment Technologies in Potable Water Use)
Abstract
:Granular activated carbon (GAC) adsorbers for drinking water treatment were operated for approx. 14 months and the breakthrough of dissolved organic carbon (DOC) and trace organic chemicals (TOrCs) was monitored. Effluent concentration profiles of gabapentin and valsartan acid increase already at throughputs of <10,000 BV. The corresponding breakthrough curves flatten out without reaching the influent concentration level. This strongly indicates biological degradation of these substances in the GAC adsorbers under aerobic conditions, contributing to a more efficient use of GAC. The observed biodegradation in pilot GAC adsorbers also confirms recent reports of biodegradation of gabapentin and valsartan acid during managed aquifer recharge. Oxypurinol is comparatively well adsorbed and no breakthrough was observed during the experimental period. Adsorption capacity and breakthrough characteristics of oxypurinol appear very similar to carbamazepine. Breakthrough of GAC adsorbers operated with drinking water was compared to those of groundwater-fed adsorbers. The results show, that it is generally advisable to use previously aerated influents for GAC fixed-bed adsorbers because this can substantially improve biological removal of otherwise poorly adsorbable compounds and ensure full GAC accessibility for adsorbates by avoiding the undesirable formation of inorganic precipitates on adsorption sites.
Keywords:
GAC adsorption; oxypurinol; gabapentin; valsartan acid; carbamazepine; TOrCs; drinking water; groundwater1. Introduction
The trace organic chemicals (TOrCs) gabapentin, valsartan acid, oxypurinol and carbamazepine are mostly very polar and the effluents of municipal wastewater treatment plants have been shown to be a significant entry path into receiving surface waters [1]. This is particularly relevant in Berlin (Germany), where drinking water is produced from groundwater, whose supply strongly depends on bank filtration and artificial groundwater recharge. Approximately 70% of the extracted groundwater originates from these sources [2]. Drinking water treatment consists of iron and manganese removal by aeration, followed by rapid filtration. The produced drinking water is distributed without prior disinfection. About a quarter of the city area is protected as drinking water protection area. Thus, the city’s surface waters are important water resources used indirectly via bank filtration and managed aquifer recharge (MAR) to produce drinking water.
The pharmaceutical gabapentin was detected in the Berlin water cycle in 2014 and was assessed as largely persistent in bank filtration and drinking water treatment by aeration followed by rapid filtration [3]. However, both laboratory tests [4] and pilot studies using powdered activated carbon (PAC) for the removal of organic micro-pollutants as an additional advanced wastewater treatment step [5,6] show that gabapentin is biodegradable under aerobic conditions. Valsartan acid, a transformation product of angiotensin receptor blockers (“sartans”), is described as being poorly removed during bank filtration [3,7], but nearly complete removal (>90%) was observed in activated carbon filtration during drinking water treatment (Mülheim process) [7]. Oxypurinol, the pharmaceutically active metabolite of allopurinol, is highly persistent and occurs widely in wastewater treatment plant effluents. Therefore, it is currently being discussed as a possible new marker for the influence of WWTP effluents on surface waters and drinking water resources, groundwater and also drinking water [8]. The antiepileptic carbamazepine is generally characterized as persistent under most conditions, although partial removal under reducing conditions during bank filtration has been reported [9,10]. Its occurrence in the urban water cycle is well documented.
In order to evaluate treatment options for trace organics removal, the use of granular activated carbon (GAC) was tested at a pilot scale in one of Berlin’s waterworks. This study focused on the removal of selected TOrCs and the corresponding operation time of the adsorbers until breakthrough.
2. Materials and Methods
2.1. Water Quality
Two GAC fixed-bed adsorbers in series were fed with drinking water (DW) from the water works Berlin-Tegel (Germany). Table 1 shows typical water quality characteristics of the drinking water. In addition, a single adsorber was fed with un-aerated groundwater (GW) from a nearby production well. The well was among approximately 130 drinking water wells supplying the water works. Dissolved organic carbon concentrations in Berlin ground and drinking water are typically as high as 4.5 mg/L and can be characterized as non-biodegradable and, to a large extent, composed of humic substances [2].
2.2. GAC Pilot Plant
A scheme of the GAC pilot plant is shown in Figure 1. Each filter cell had a diameter of 1.30 m and a height of 1.50 m. The adsorber units were rented from Jacobi Carbons and were already filled with the granular activated carbon AquaSorb 5010 (8 × 30 mesh). The activated carbon manufacturer’s data state a specific surface area of approx. 1000 m2/g, an iodine number of at least 900 mg/g, and an apparent density of approx. 400 kg/m3. The adsorber units were operated in down-flow mode with a volumetric flow of 8 m3/h, resulting in an empty bed contact time (EBCT) of 15 min in the individual adsorber and a total of 30 min for the two adsorbers in series. The corresponding hydraulic loading rate (HLR) was 6 m/h.
The total throughput was determined using a water meter. The influent and effluent of the adsorbers were sampled twice a week during the first six months. Sampling was later reduced to once a week. During sampling, head loss and volumetric flow were routinely checked and adjusted if necessary. During the first 90 days of operation, the GW-fed adsorber was backwashed with drinking water every three weeks, and later the backwashing interval was shortened to once every two weeks. The DW-fed adsorbers were generally operated without backwashing, except for a single backwash of the first adsorber in series after approximately 270 days of operation.
2.3. Analytical Methods
The analytical procedures of the monitored water quality parameters are contained in the routine monitoring program of the Berlin water works and were performed according to standard operating procedures. Dissolved organic carbon (DOC) (TOC-L, Shimadzu, Kyoto, Japan) and ultraviolet absorbance at 254 nm (UVA254) (DR 5000, Hach Lange, Berlin, Germany) were analyzed according to DIN EN 1484 (H03) and DIN 38404-C03, respectively. The trace organics were quantified using a UHPLC-MS/MS multi-method as described elsewhere [13,14], using either a tandem mass spectrometer (Xevo-TQ-S, Waters, Milford, MA, USA) or a high-resolution mass spectrometer (Exactive PlusTM, Thermo Scientific, Bremen, Germany). A list of the quantified TOrCs and their limit of quantification is shown in Table S1. Iron and manganese were analyzed by an inductively-coupled plasma—optical emission spectrometry (iCAP 6000 Series, Thermo Scientific, Bremen, Germany) based on DIN EN ISO 11885 (E22).
3. Results and Discussion
3.1. Pilot Operation
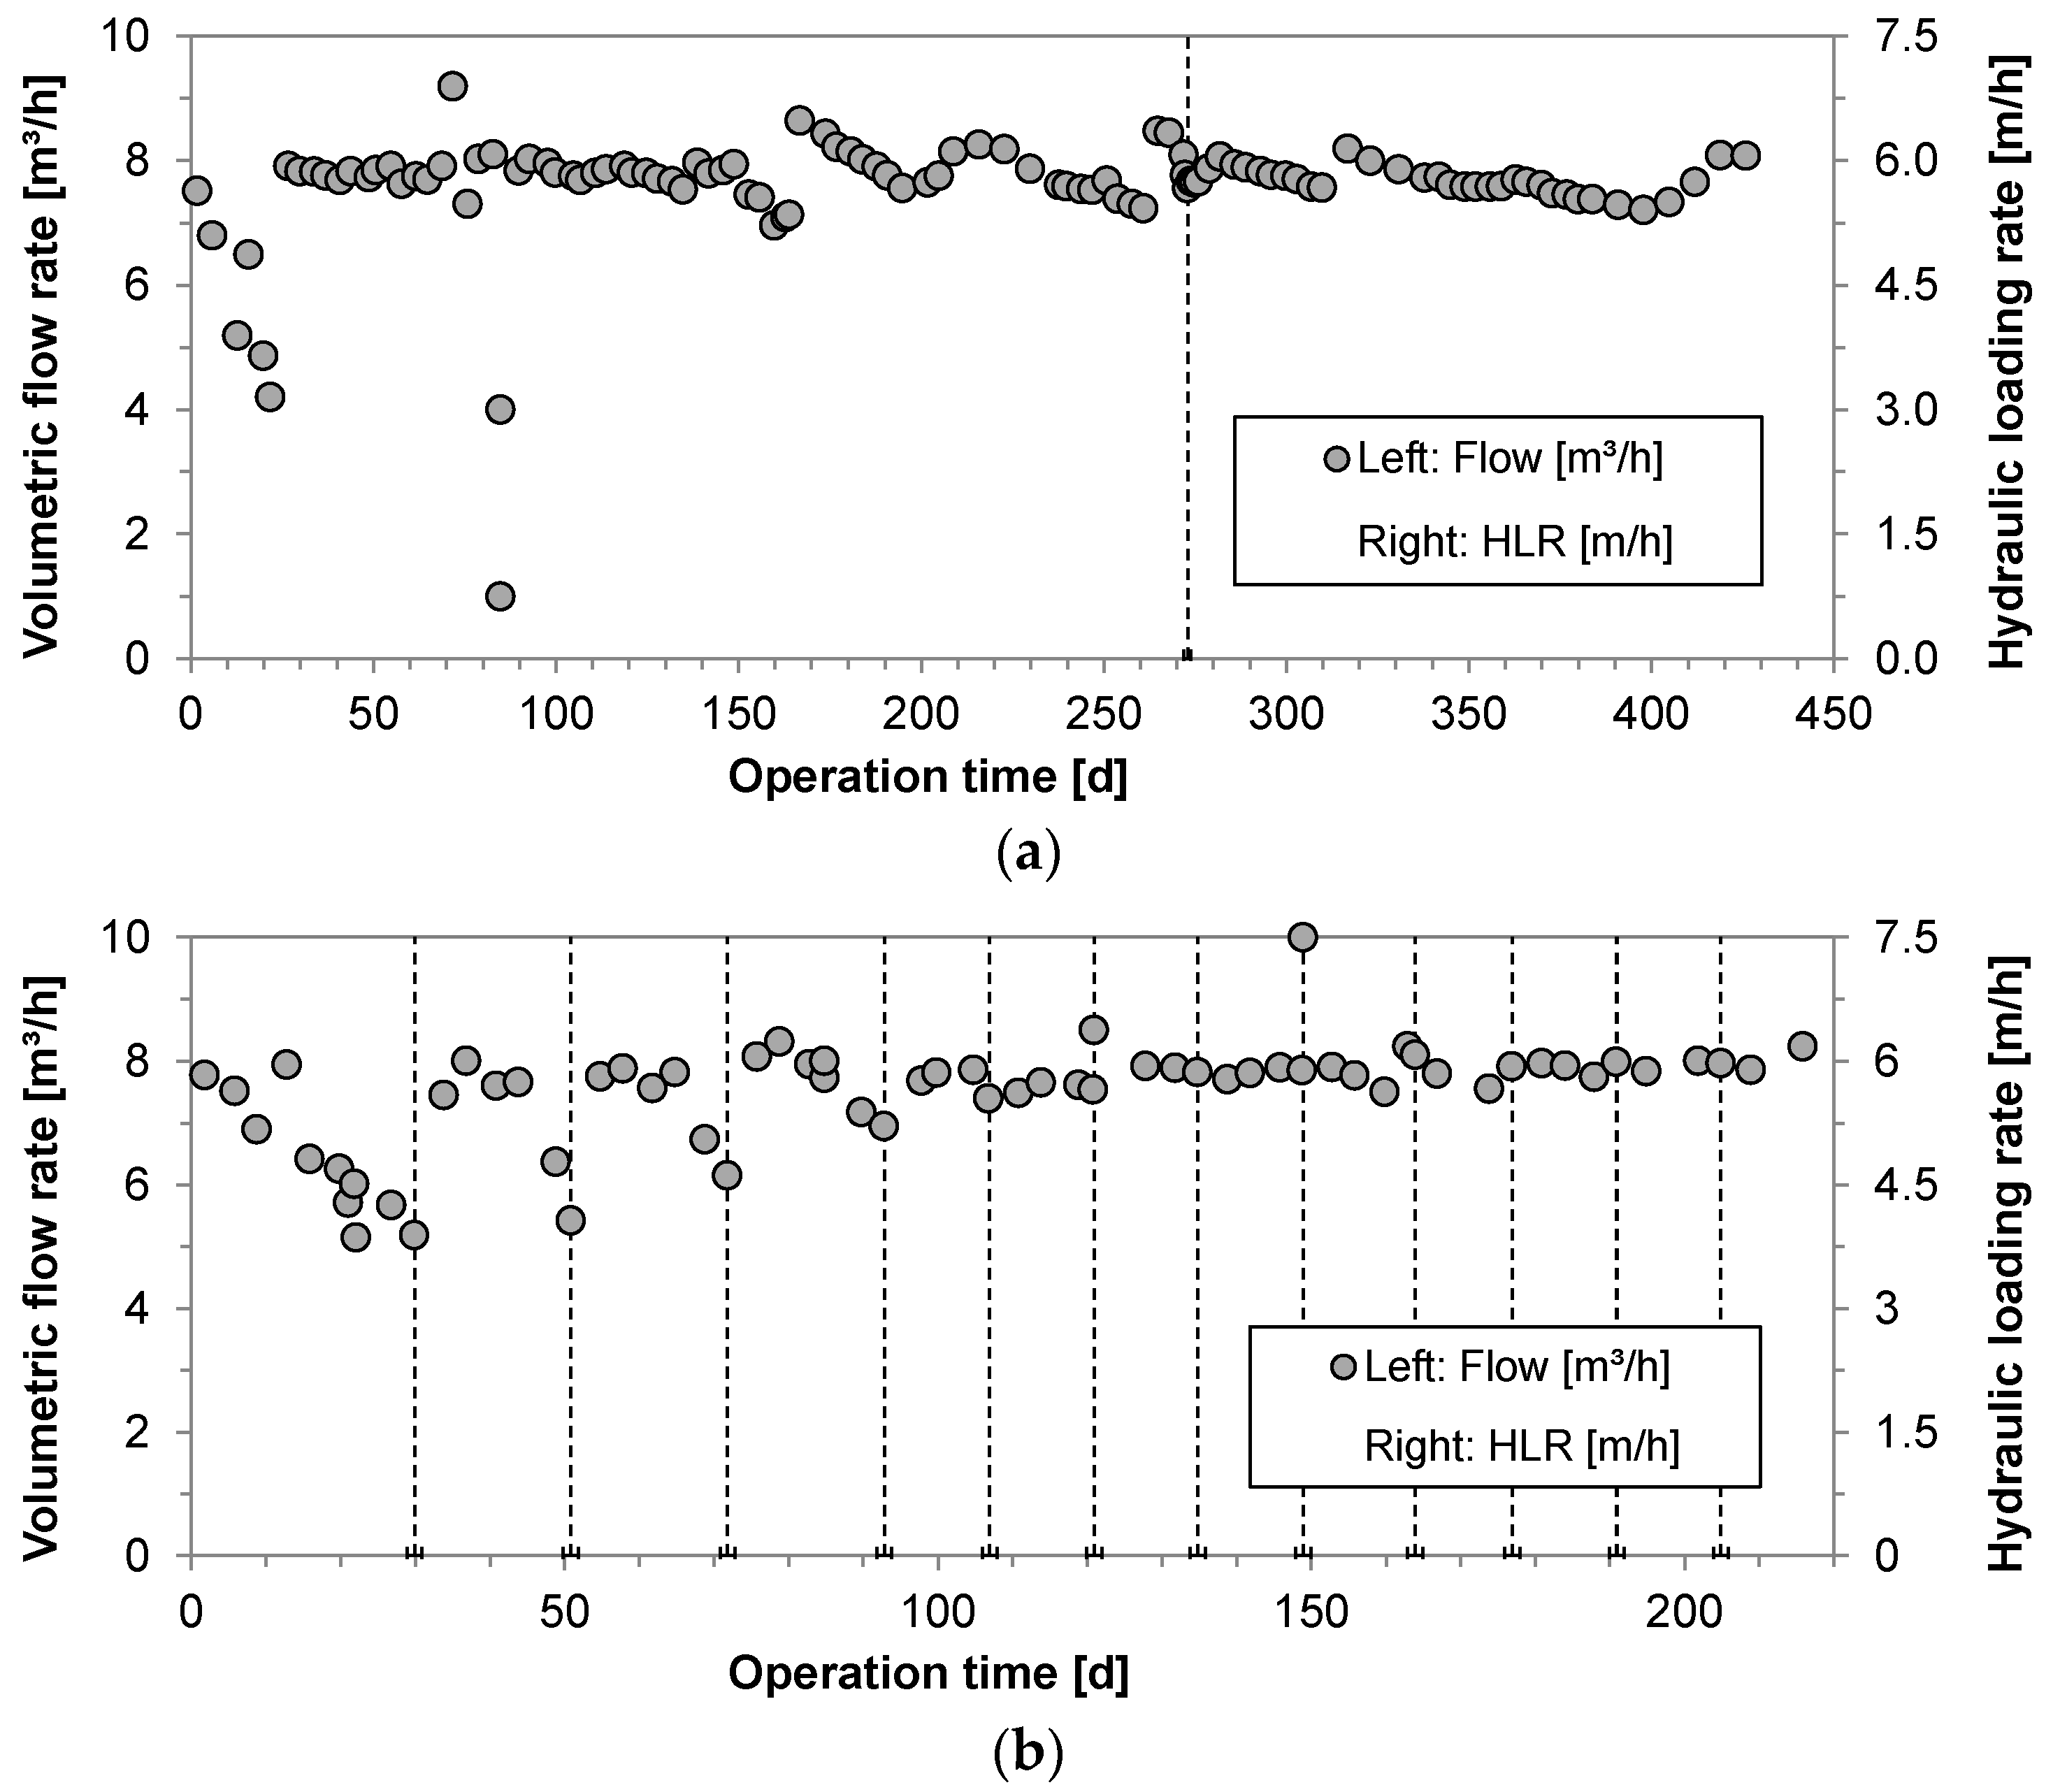
The GAC pilots have been in operation for approx. 14 months. More than 80,000 m3 of drinking water has been treated, which corresponds to more than 40,000 bed volumes (BV), based on the bed volume of a single adsorber and 20,000 BV of the combined bed of two adsorbers in series. Head loss in the DW adsorbers increased with duration of operation, but was always <0.4 bar until a throughput of 25,000 BV. When head loss exceeded 0.4 bar in the first adsorber, the adsorber was backwashed. Apart from that, the GAC adsorbers were operated without backwashing. Hydraulic loading was maintained at 6 ± 0.5 m/h (Figure 2a).
The GW-fed adsorber was operated until approximately 20,000 BV were reached, corresponding to 40,000 m3 of treated groundwater. Head loss increased much more rapidly and after three weeks, and hydraulic loading decreased to 3.5–4.5 m/h. Therefore, backwash intervals were shortened so that the hydraulic loading could be maintained constant at 6 ± 0.5 m/h (Figure 2b). Precipitation of ferric hydroxides in the influent of the fixed-bed filter was clearly visible.
3.2. Redox Parameters
In the DW-fed adsorbers, influent dissolved oxygen (DO) concentrations were approx. 7.4 mg/L and, thus, close to saturated conditions. This value was reduced by an average of 1.3 mg/L until the end of the first adsorber. In the second adsorber, an additional average of 2.0 mg/L DO is consumed (Figure 3a). Redox conditions in the DW-fed adsorbers were, therefore, kept oxic during the whole time. The decrease in DO concentration indicated biological degradation processes in the adsorbers.
In the GW-fed adsorbers, DO concentrations measured in the influent and effluent were below <0.2 mg/L. No removal of manganese or ammonia was observed, confirming low redox conditions in the adsorbers (Figure 3b). However, during the first two months of operation, the influent iron concentration of approximately 1.2 mg/L was completely removed. In the following months of operations, effluent iron concentrations rose until only approximately 50% of the iron in the influent was removed. This might be explained by oxygen present in the fixed-bed system and likely adsorbed on the fresh activated carbon. After the stored oxygen was used up, complete oxidation of the influent iron was no longer possible, although oxygen was still entering the system during backwash with oxygen-rich drinking water. Another explanation could the adsorption of positively-charged Fe ions onto the negatively-charged carbon, which resulted in breakthrough after the adsorption capacity of the iron had been reached. Visible ferric hydroxide precipitates in the backwash water might support the first hypothesis.
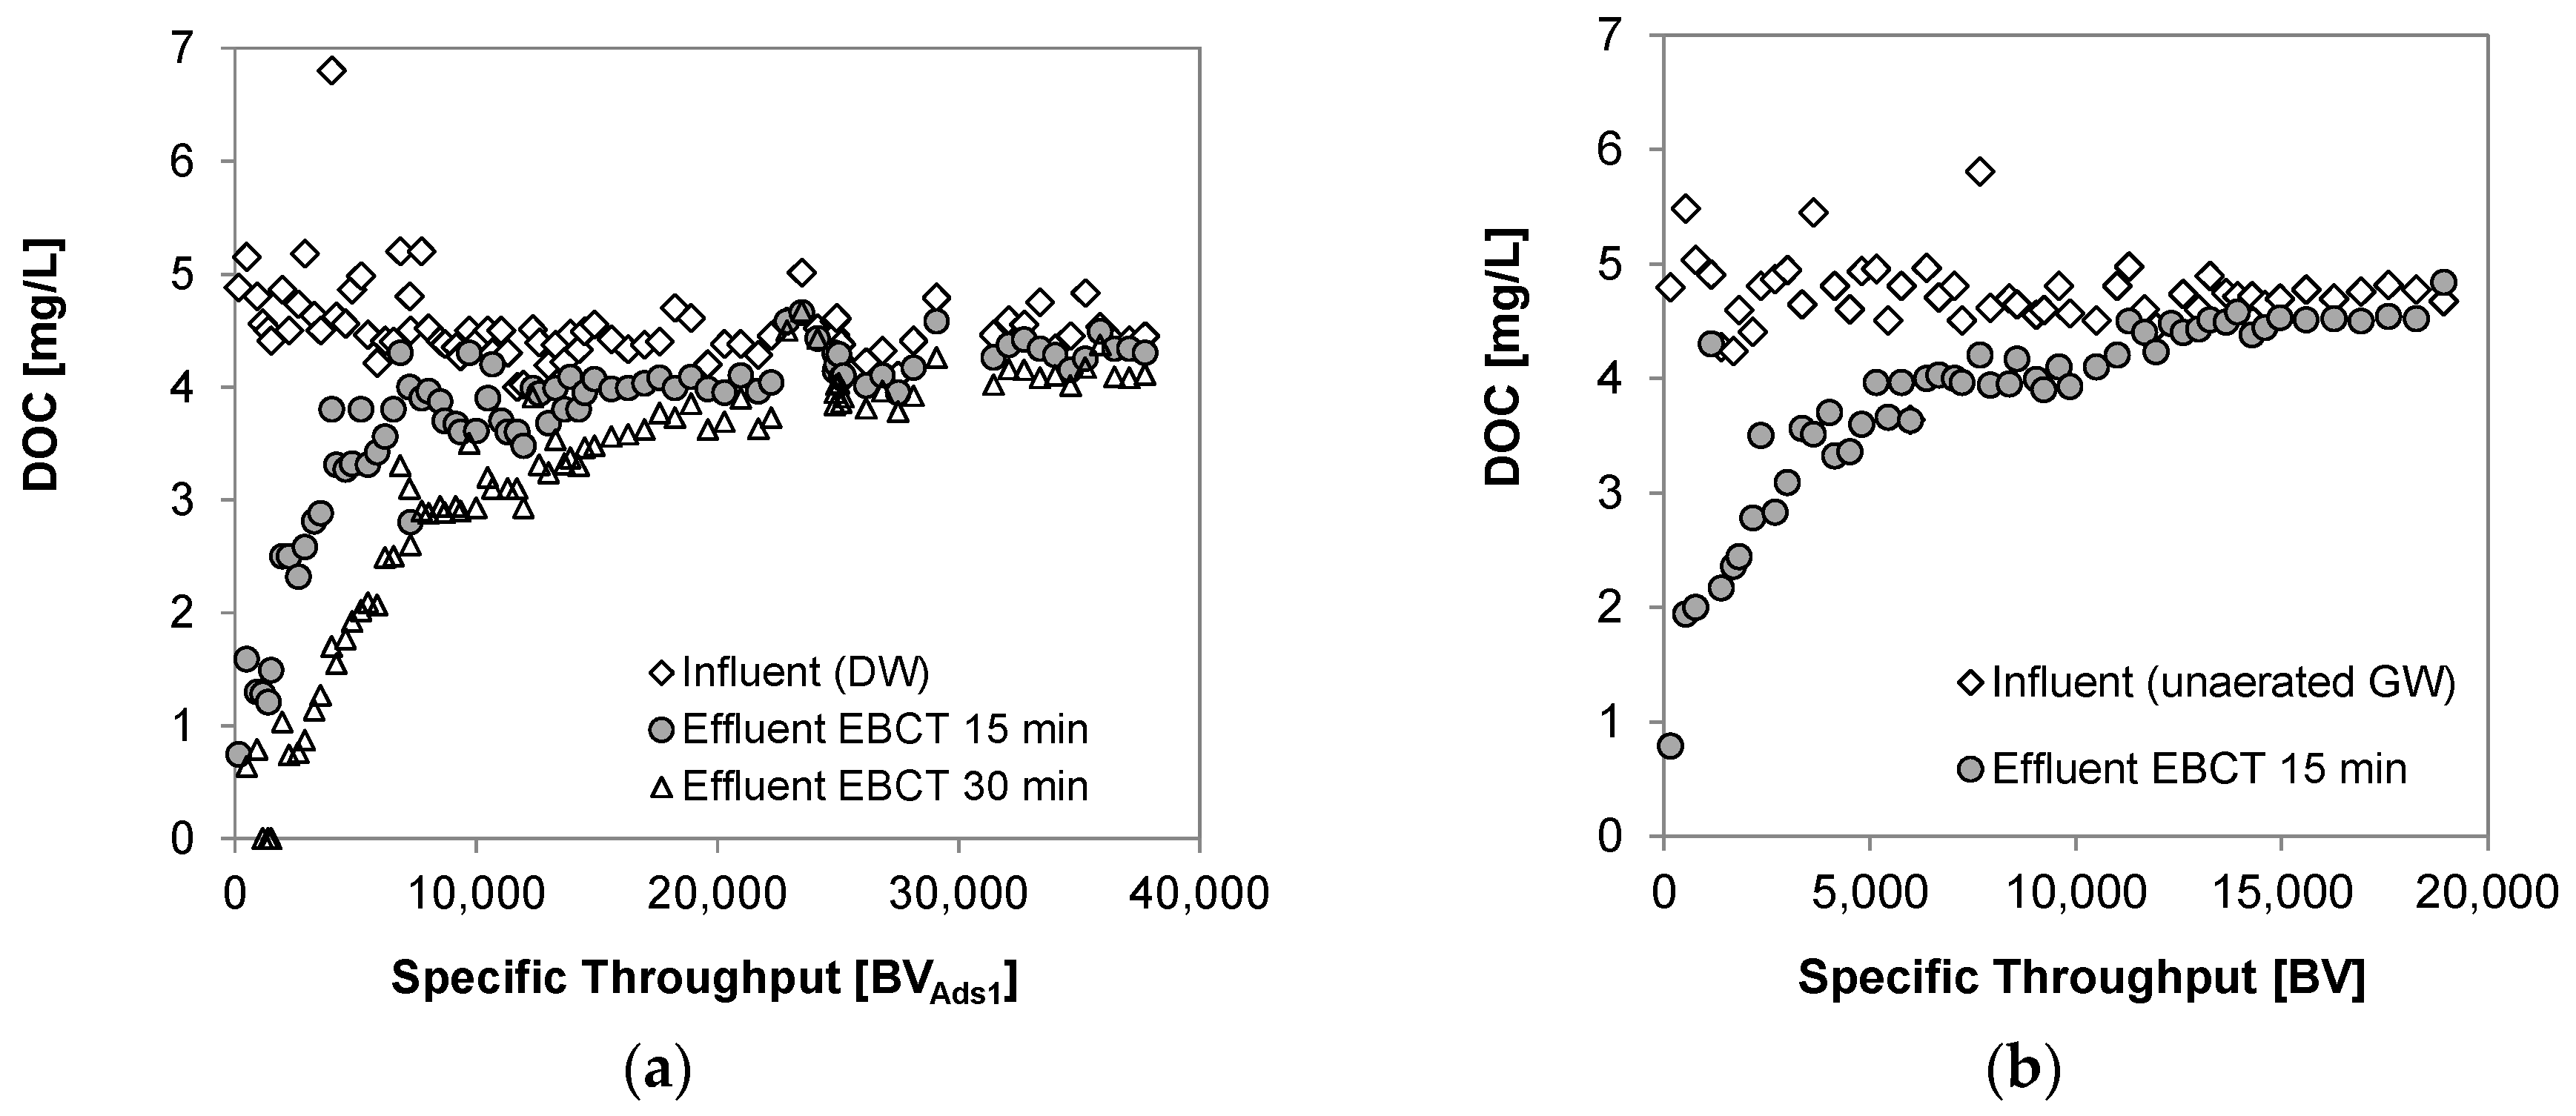
3.3. Breakthrough of Dissolved Organic Carbon
Natural organic matter (NOM)—measured as DOC—is a complex, multi-component mixture of unknown composition. The numerous compounds have different affinities to adsorb onto GAC. Therefore, the breakthrough of the sum parameter DOC cannot be directly compared to that of the individual TOrCs. However, DOC breakthrough curves can provide information on the average adsorbability of the multicomponent mixture, as well as on the biodegradability of DOC. Figure 4 shows the breakthrough curves for dissolved organic carbon (DOC). The influent DOC concentration in drinking water was relatively constant over the experimental period at about 4.6 mg/L. The effluent DOC concentration increased quickly, so that after 8000 BV, only 20% of the DOC was retained by the adsorbers. The breakthrough curve flattened and slowly approached the feed concentration. After approximately 37,000 BV complete breakthrough was reached, as the effluent concentration equaled the influent concentration. Since the downstream adsorber was operated with the effluent of the first adsorber, the breakthrough of the second adsorber showed an offset. The GW-fed adsorber showed very similar breakthrough characteristics with approximately 95% breakthrough after 20,000 BV. Plots of the relative breakthrough curves (c/c0) of both DW-fed adsorbers, as well as the GW-fed adsorber against the respective throughputs, showed high similarity and no offset (Figure S1). Accordingly, the DOC in Berlin ground and drinking water was not reduced further by biological processes in the fixed-bed systems, but removal depended largely on adsorption. The bulk organic compounds represented by DOC were adsorbable to a poor to medium extent, resulting in early DOC breakthrough. Part of the DOC was slowly transported into the adsorbent grain, as indicated by the long flat breakthrough curve. Mass transport and adsorption of DOC in the groundwater-fed system do not appear to be significantly hindered by ferric hydroxide deposits likely to be present on the adsorbent surface.
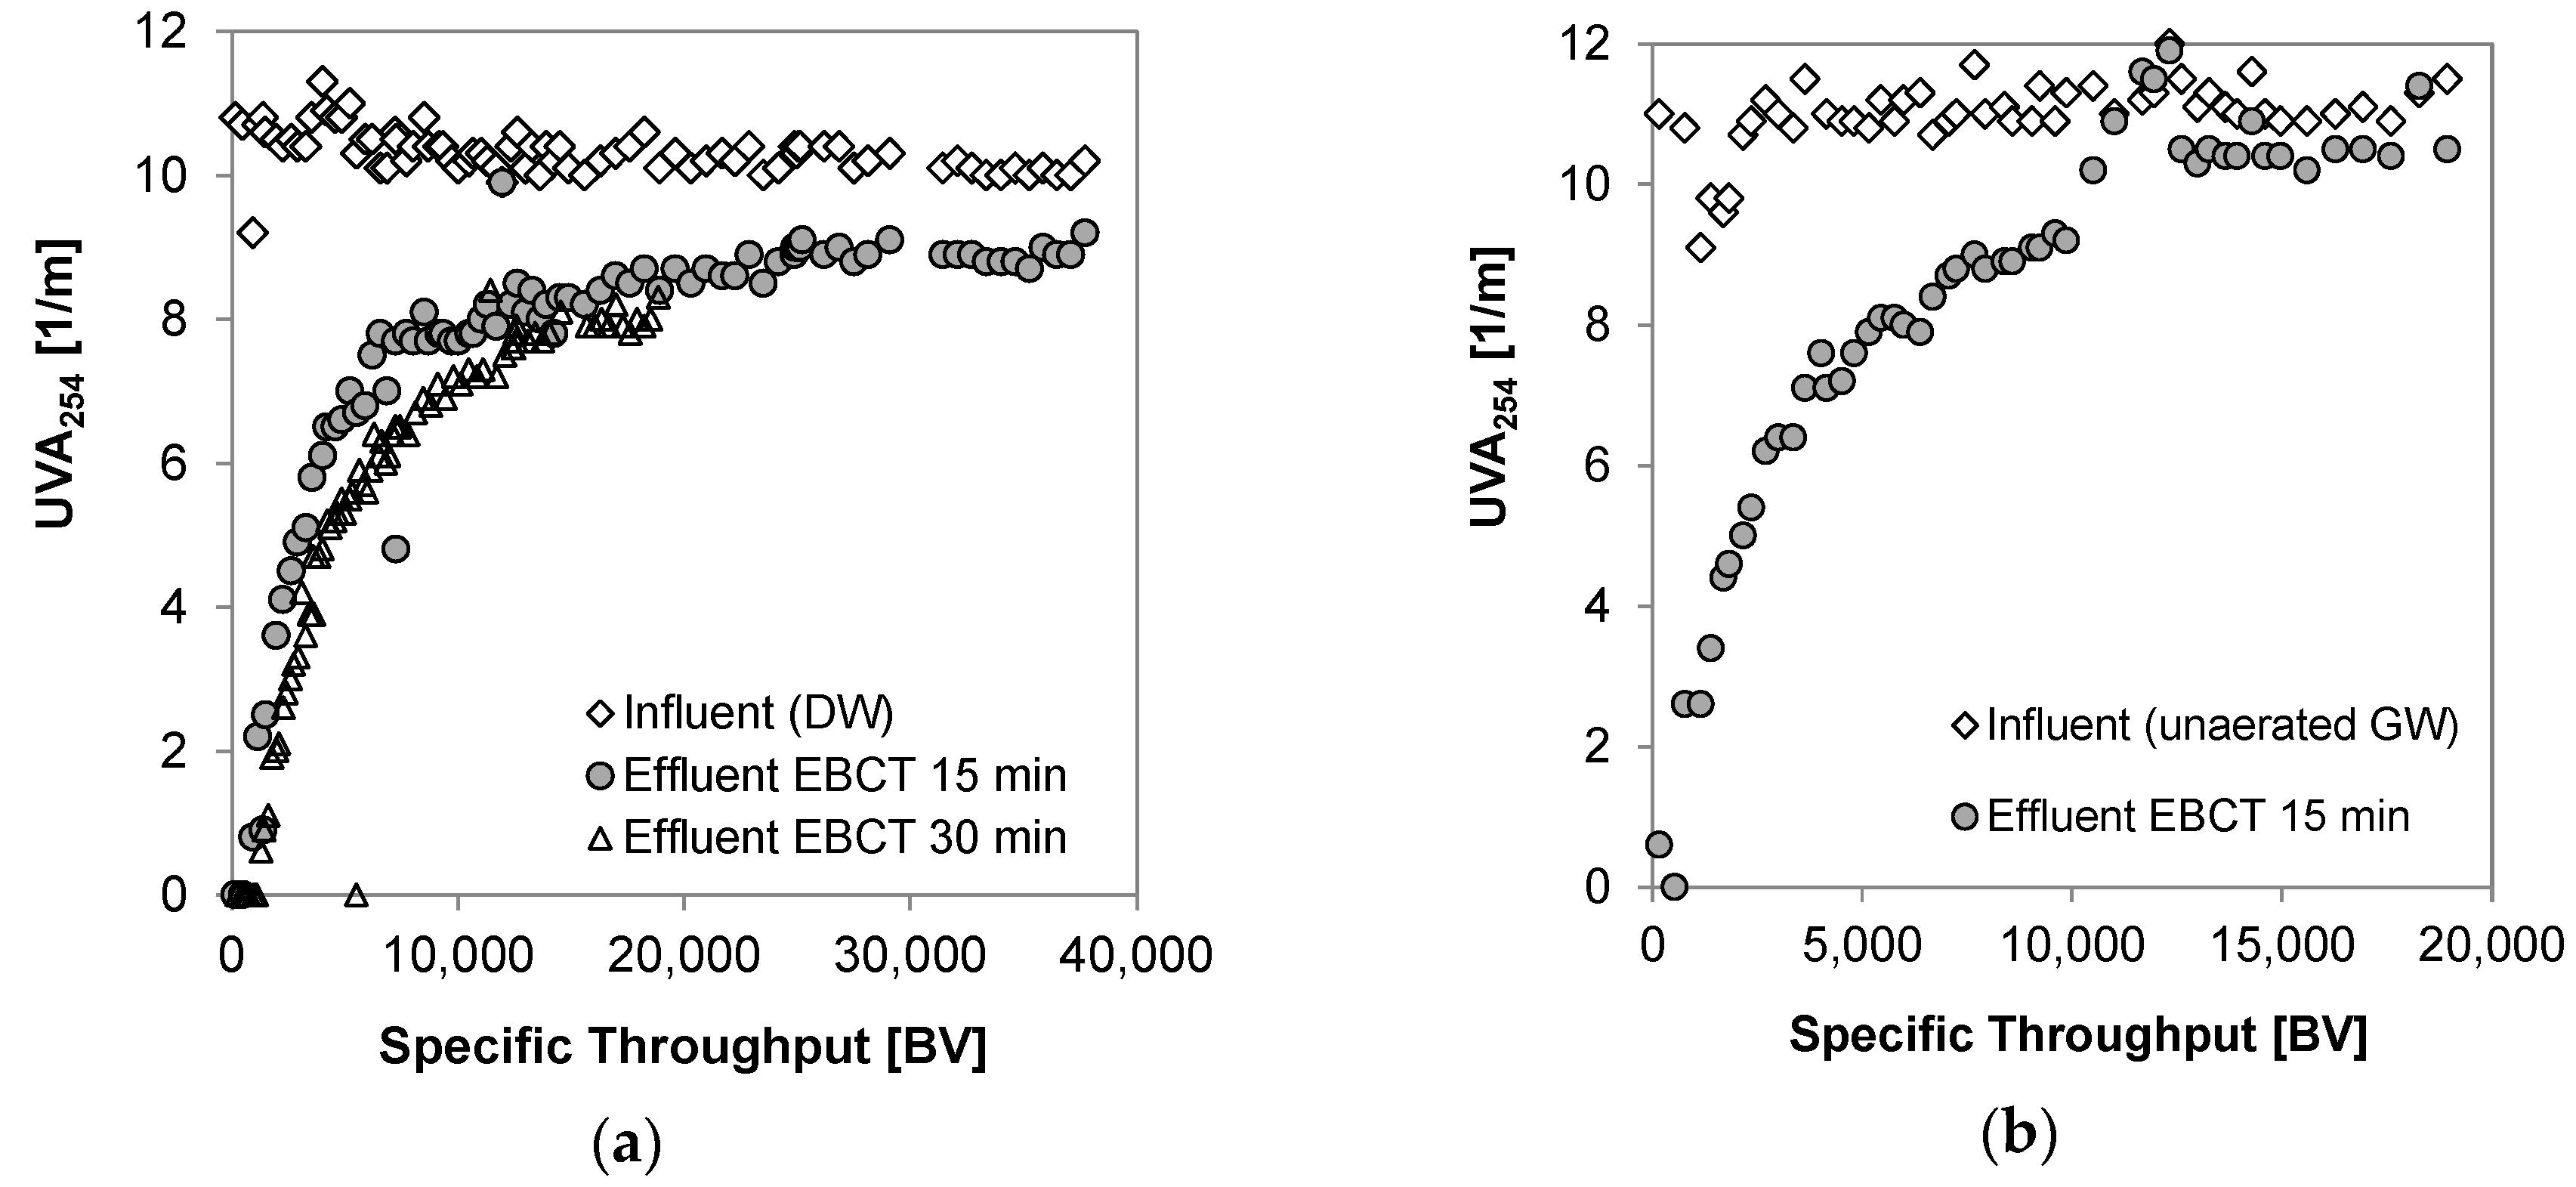
The breakthrough curves of UV absorbance at 254 nm (Figure 5) also showed an early breakthrough of UV-active bulk organic compounds with only 25% removal after 10,000 BV in the first DW-fed adsorber (15 min EBCT). However, effluent UVA254 approached the feed concentration extremely slowly after 10,000 BV. At 40,000 BV, roughly 10% of UV254 were still reduced in the first adsorber, indicating the biological transformation of UV-absorbing moieties within the bulk organics to less UV-absorbing compounds. This is underlined by the DOC breakthrough (cf. Figure 4) which approached the influent concentration at this throughput. Similar effects of preferred biodegradation of UV-absorbing compounds were shown in managed aquifer recharge systems treating groundwater from the same regional background as in the current study [15]. Another 10% concentration decrease was observed in the second adsorber, corresponding to a total EBCT of 30 min. On the other hand, breakthrough of UVA254 in the GW-fed adsorber occurred slightly earlier (15% removal after 10,000 BV) and effluent UVA254 approached the influent level quickly. This further indicated biological transformation of UV-absorbing moieties in the GAC columns under aerobic conditions.
3.4. Breakthrough of Trace Organic Chemicals
In the following, the breakthrough curves of the TOrCs gabapentin, valsartan acid, oxypurinol, and carbamazepine are discussed. The breakthrough curves for all 11 TOrCs related to throughput, as well as normalized effluent concentrations are shown in the supplementary material (Figures S2 and S3).
The concentrations of gabapentin and valsartan acid in the drinking water feed slowly decreased from 0.6 μg/L to 0.4 µg/L in the case of gabapentin and from 1.2 μg/L to 0.8 µg/L the case of valsartan acid (Figure 6). These variations of DW quality probably occurred due to changes in well operation, as well as changed operation of artificial groundwater recharge basins. Pharmaceutical consumption patterns and operational changes also influence TOrC concentrations in the upstream WWTP effluent and impacted surface water ultimately translating to changes in the generated drinking water. In contrast to the drinking water which originated from several groundwater wells, groundwater for the pilot experiments was exclusively from one nearby production well, which showed less variations.
Effluent concentrations of both TOrCs increased during the first 10,000 bed volumes and then maintained a relatively fixed level, with concentration fluctuations in the influent also visible in the effluent. This means that after approximately two months of operation, more than 50% of the influent valsartan acid and almost 30% of influent gabapentin were constantly removed by biological degradation in the filter bed of the DW-fed adsorbers. The relative biodegradation capacity in the second adsorber was even higher than in the first adsorber. Even after 39,000 BV (425 days of operation), a total of 40% gabapentin removal and 75% removal of valsartan acid were observed after sufficient contact time (EBCT 30 min). At lower contact time, approximately 20% of the influent gabapentin and roughly 50% of valsartan acid were removed (15 min EBCT after 39,000 BV). This behavior cannot be explained by adsorption alone. Instead, biodegradation under aerobic conditions [4] is confirmed in the adsorbers. The comparison with the identically-operated adsorber using un-aerated groundwater showed the necessity of dissolved oxygen for degradation of the two TOrCs mentioned above. Here, more than 95% breakthrough of valsartan acid and gabapentin occurred after 20,000 BV.
These results are in agreement with pilot studies on GAC fixed-bed adsorption [5] and PAC dosing [16] as advanced wastewater treatment steps, which clearly showed poor adsorbability of gabapentin, as well as indications for biodegradation of gabapentin in GAC fixed-bed and tertiary filtration systems. The documented biodegradation in pilot GAC adsorbers also confirms recent reports of biodegradation of gabapentin and valsartan acid during managed aquifer recharge. In soil column experiments, Hellauer et al. [15] showed gabapentin to be redox-sensitive, but significantly removed (53%), under oxic conditions. Earlier studies reporting gabapentin to be largely persistent in bank filtration [3] and SAT [17] might be explained by quick depletion of oxygen in the mentioned processes. Gabapentin-lactam was identified as the main transformation product of gabapentin [3]. Breakthrough curves of gabapentin-lactam are shown in Figure S2. Similarly, valsartan acid was recently shown to be removed in laboratory-scale soil columns under oxic conditions [15]. To clarify whether gabapentin and valsartan acid form other stable transformation products or will be mineralized, further research is needed. In order to confirm biological degradation of TOrCs and link it with biofilm growth on the GAC, rapid assays, such as adenosine tri-phosphate (ATP) determination, could be used to measure active biomass [18].
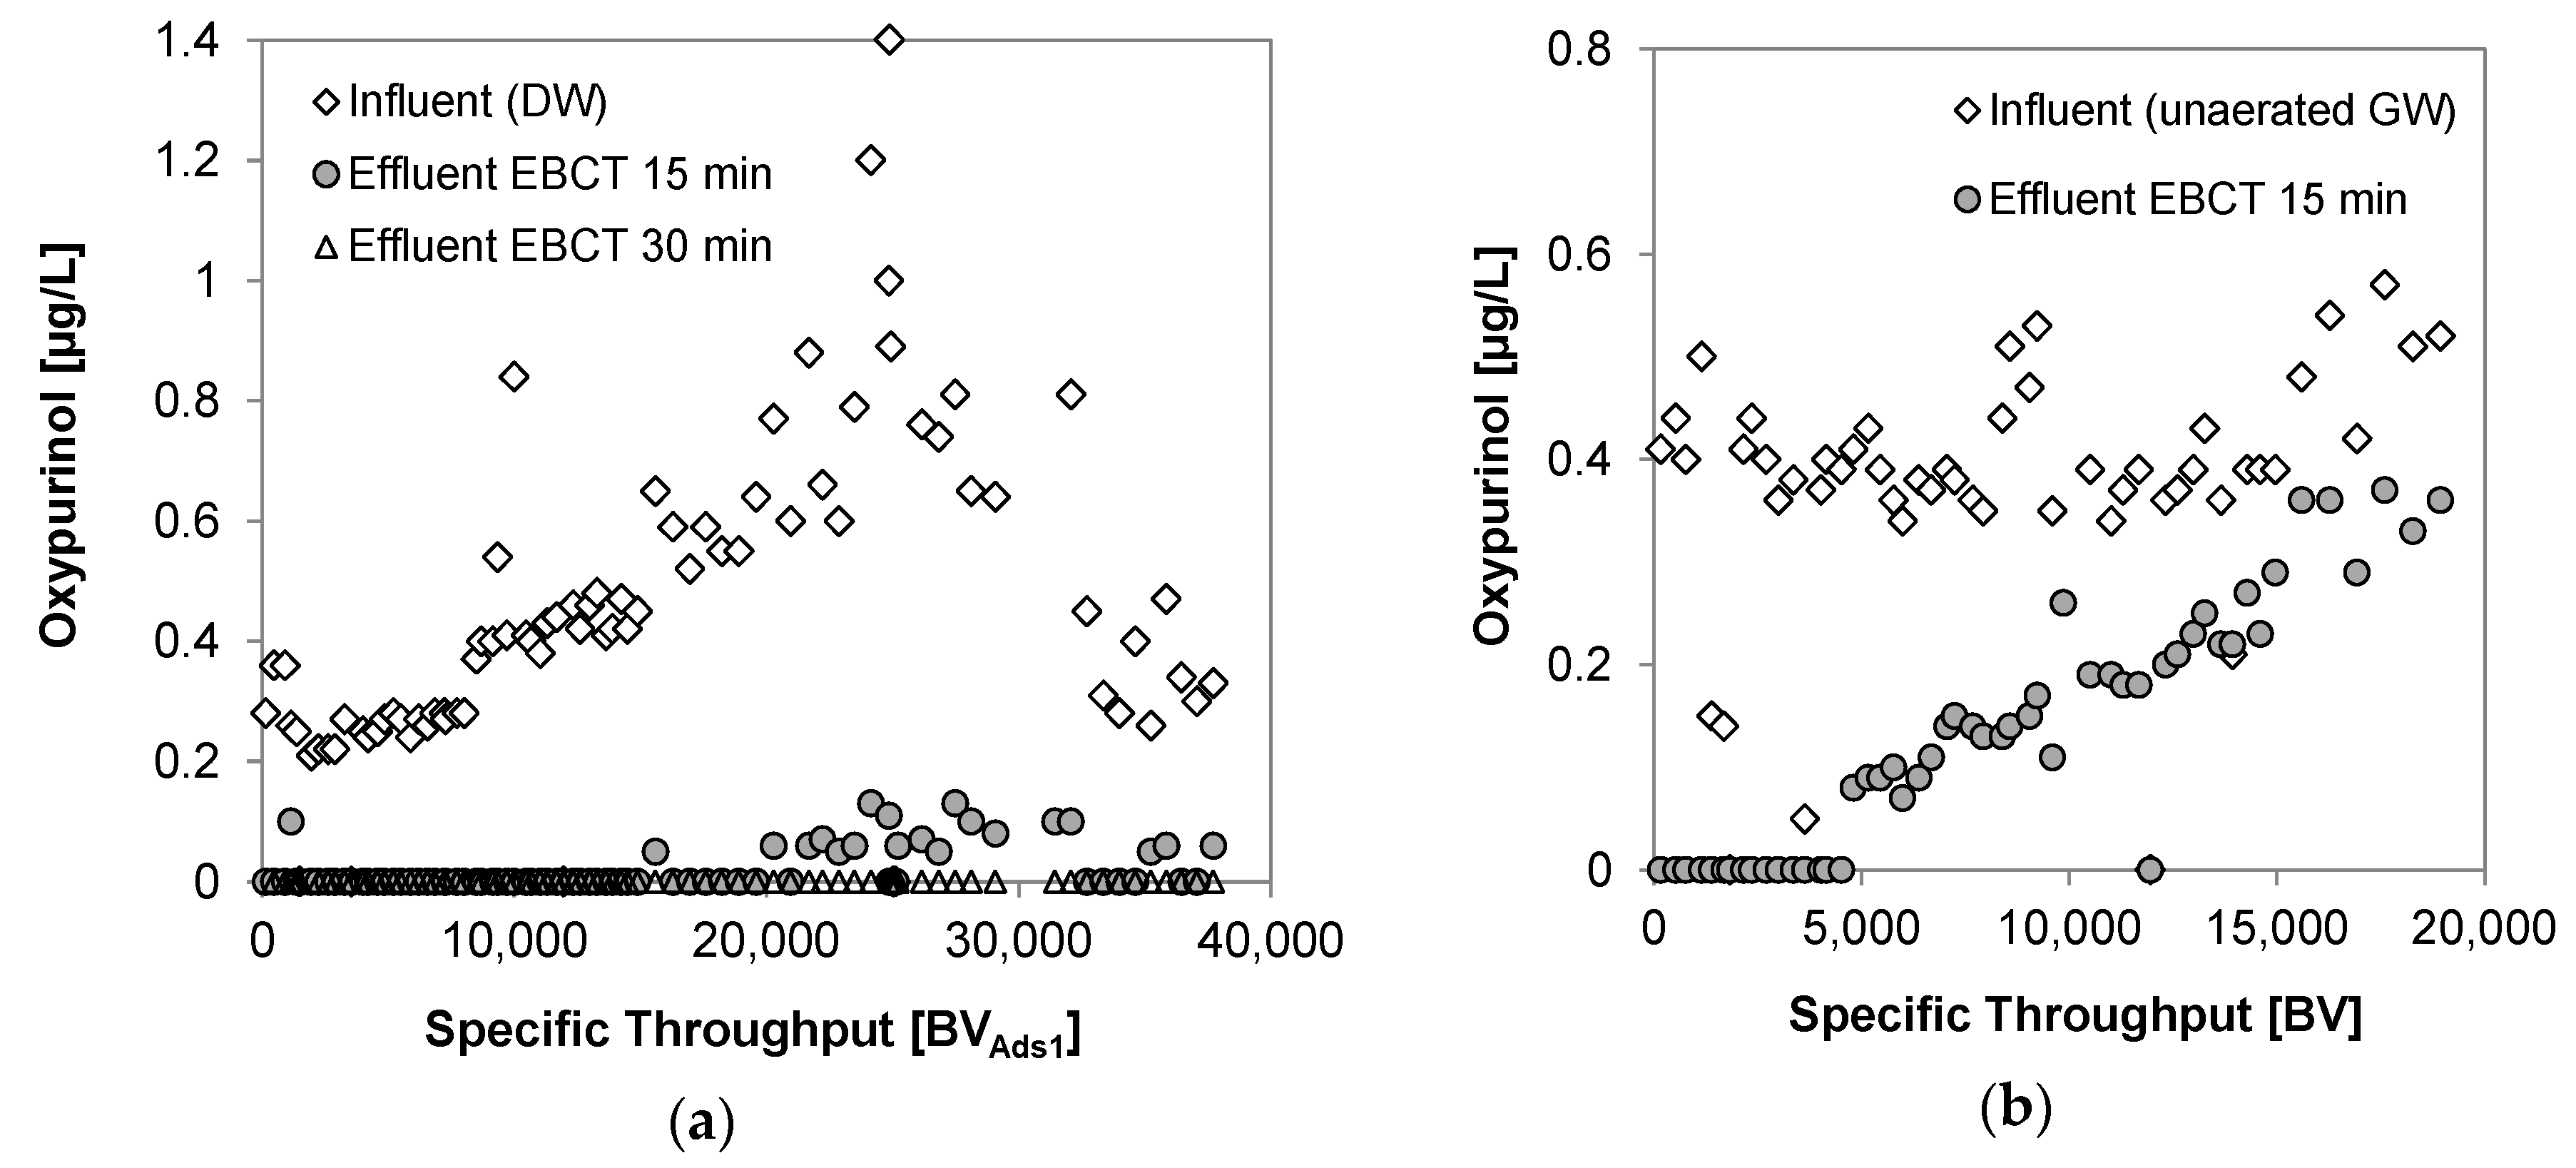
Figure 7 shows the breakthrough curves of oxypurinol and carbamazepine. The drinking water influent concentration of oxypurinol was initially about 0.3 μg/L, but rose to >1 μg/L, and then decreased after one year of operation. Even after 425 days of operation (39,000 BV), concentrations in the effluent of the second adsorber (EBCT 30 min) were below the limit of detection, and the effluent concentrations of the first adsorber were only slightly higher, ensuring >80% removal of oxypurinol at all times already after 15 min EBCT.
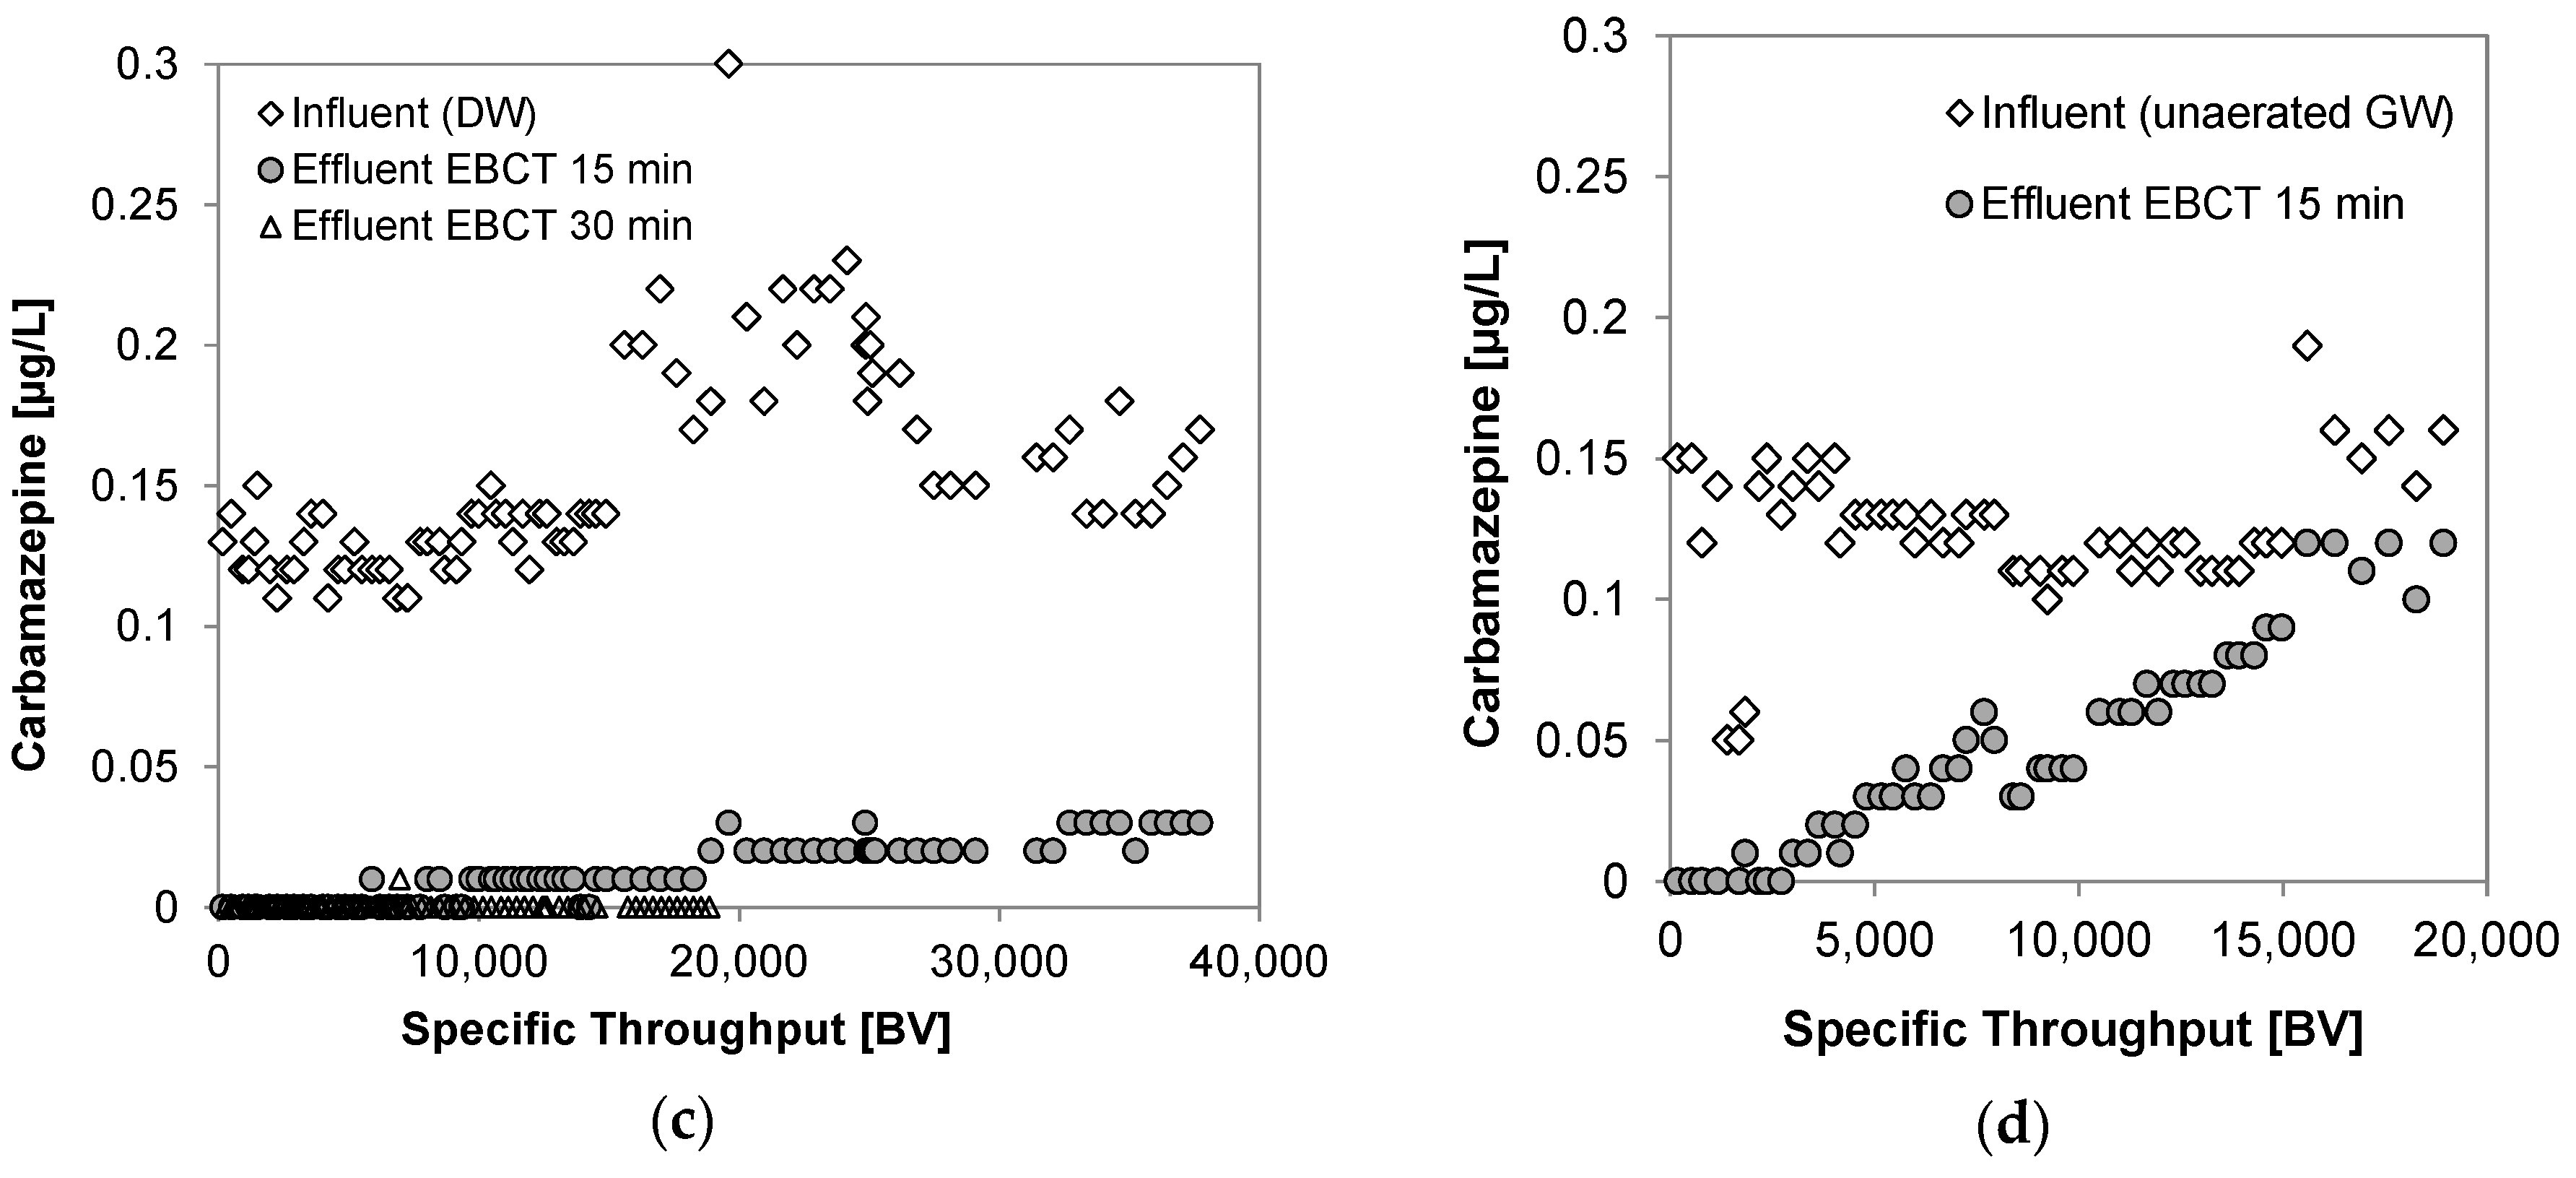
Breakthrough of carbamazepine showed similar characteristics. Although less distinctive, the carbamazepine influent concentration rose from approximately 0.13 to 0.23 µg/L and, again, decreased after about 25,000 BV. Carbamazepine is very persistent and well adsorbable [19], resulting in effluent concentrations below the limit of detection for the second adsorber (EBCT 30 min). Very similar to oxypurinol, approximately 80% carbamazepine removal occurred in the first adsorber, even after 39,000 BV. Thus, oxypurinol is readily adsorbable onto activated carbon at extents roughly comparable to carbamazepine. This finding could be of practical importance since mass-spectrometric monitoring of carbamazepine is generally less laborious: oxypurinol requires dimethyl sulfoxide for the preparation of standard solutions and most conventional HPLC columns cannot retain this substance due to its poor interaction with most C18 reversed phase columns which are commonly used for multi-residue analysis.
Interestingly, breakthrough of both carbamazepine and oxypurinol in the GW-fed adsorber occurred significantly faster than in the DW-fed adsorbers. Here, effluent concentrations of oxypurinol and carbamazepine reached 50% of the influent concentrations after around 15,000 and 12,000 BV, respectively. Since carbamazepine degradation has been exclusively reported under reducing conditions [9], this does not point to improved removal caused by biological transformation in the DW-fed adsorbers. Instead, carbamazepine adsorption in the un-aerated column could be hindered by ferric hydroxide precipitation which might effectively block or restrict activated carbon pores and hinder mass transport into the adsorbent. In this regard, breakthrough characteristics of carbamazepine and oxypurinol are rather different from DOC breakthrough, where no significant difference between drinking water and un-aerated groundwater can be observed. Activated carbon micro-pores are likely to be more accessible for small molecules such as carbamazepine and oxypurinol and might also be more strongly affected by ferric hydroxide precipitation. Mass transport of higher molecular weight compounds which represent a significant share of DOC will thus be less hindered by ferric hydroxide precipitation.
The molecules encompassed in the entity of background organic matter (measured as DOC) in typical ground and drinking waters have average molecular sizes in the range of 400–1200 g/mol [20]. This is larger than the molecular sizes of the examined organic micro-pollutants (~100–400 g/mol). Variable molecular sizes of organic compounds were associated with size differences of the preferably occupied pores and the corresponding competitive adsorption effects on the activated carbon internal surface [21,22,23]. Accordingly, the adverse effects of pore blocking materials (such as Fe-precipitates forming in the internal pore system of activated carbon) are likely to be different for organic molecules with different molecular sizes. Possibly, precipitates forming in a small pore would quickly block the entire pore, whereas precipitates forming in a larger pore would not block the entire pore as quickly.
4. Conclusions
The breakthrough behavior of gabapentin, valsartan acid, oxypurinol, and carbamazepine was studied in pilot-scale GAC fixed-bed adsorbers operated with drinking water and (un-aerated) groundwater to study the influence of empty bed contact time and redox conditions. The results showed clearly that gabapentin and valsartan acid were poorly removed by adsorption onto activated carbon. Instead, the observed moderate to high removal of gabapentin and valsartan acid were attributed to biodegradation in the GAC pilot adsorbers under aerobic conditions. This was confirmed by a decrease in dissolved oxygen concentrations in drinking water-fed adsorbers and significantly earlier breakthrough in an adsorber fed with un-aerated groundwater. Oxypurinol, which was only recently found in significant concentrations in ground and drinking waters, has been shown to be readily adsorbable and can be equally well removed by activated carbon adsorption as carbamazepine. For these two compounds, the performance of the groundwater-fed adsorber was poorer than that of the drinking water-fed adsorber. The likely reason is activated carbon pore blockage induced by iron/manganese precipitation in the groundwater-fed adsorber. Our results show that it is generally advisable to use previously-aerated influents for GAC fixed-bed adsorbers because (i) this can substantially improve biological removal of otherwise poorly-adsorbable compounds; (ii) it ensures full GAC accessibility for adsorbates by avoiding the undesirable formation of inorganic precipitates on adsorption sites; and (iii) it reduces the need for filter backwashing.
Supplementary Materials
The following are available online at: www.mdpi.com/2073-4441/9/7/479/s1, Figure S1. Normalized effluent concentration vs. throughput (breakthrough curves) for (a) DOC and (b) UV absorbance in two fixed-bed adsorbers in series fed with drinking water (DW, EBCT 15 and 30 min) and in a single fixed-bed adsorber fed with un-aerated groundwater (GW, EBCT 15 min). Figure S2. Normalized effluent concentration vs. throughput (breakthrough curves) for (a) acesulfame, (b) benzotriazole, (c) carbamazepine, (d) gabapentin, (e) gabapentin-lactam, and (f) tolyltriazole in two fixed-bed adsorbers in series fed with drinking water (DW, EBCT 15 and 30 min) and in a single fixed-bed adsorber fed with un-aerated groundwater (GW, EBCT 15 min). Figure S3. Normalized effluent concentration vs. throughput (breakthrough curves) for (a) primidone, (b) oxypurinol, (c) valsartan acid, (d) candesartan, and (e) olmesartan in two fixed-bed adsorbers in series fed with drinking water (DW, EBCT 15 and 30 min) and in a single fixed-bed adsorber fed with un-aerated groundwater (GW, EBCT 15 min). Table S1. List of monitored TOrCs.
Acknowledgments
Funding was received from the German Federal Ministry of Education and Research (BMBF) within the project TestTools and is gratefully acknowledged. The authors thank the laboratory and technical staff at Berliner Wasserbetriebe for TOrC analysis and technical assistance. Svea Stephan and Anne Ulrich are acknowledged for taking samples.
Author Contributions
Alexander Sperlich and Regina Gnirss conceived and designed the experiment; Mareike Harder and Alexander Sperlich performed the experiments and analyzed the data; Alexander Sperlich wrote the paper; and Frederik Zietzschmann and Regina Gnirss reviewed the manuscript. The final version was approved by all authors.
Conflicts of Interest
The authors declare no conflict of interest. The founding sponsors had no role in the design of the study; in the collection, analyses, or interpretation of data; in the writing of the manuscript, and in the decision to publish the results.
References
- Kasprzyk-Hordern, B.; Dinsdale, R.M.; Guwy, A.J. The removal of pharmaceuticals, personal care products, endocrine disruptors and illicit drugs during wastewater treatment and its impact on the quality of receiving waters. Water Res. 2009, 43, 363–380. [Google Scholar] [CrossRef] [PubMed]
- Grunheid, S.; Amy, G.; Jekel, M. Removal of bulk dissolved organic carbon (DOC) and trace organic compounds by bank filtration and artificial recharge. Water Res. 2005, 39, 3219–3228. [Google Scholar] [CrossRef] [PubMed]
- Van Baar, P. Entwicklung und Anwendung von UHPLC-MS Verfahren für Organische Spurenstoffe zur Bewertung der Sicherheit der Rohwasserressourcen der Wasserwerke der Stadt Berlin; Technische Universität Berlin: Berlin, Germany, 2015. [Google Scholar]
- Yu, J.T.; Bouwer, E.J.; Coelhan, M. Occurrence and biodegradability studies of selected pharmaceuticals and personal care products in sewage effluent. Agric. Water Manag. 2006, 86, 72–80. [Google Scholar] [CrossRef]
- Altmann, J.; Rehfeld, D.; Trader, K.; Sperlich, A.; Jekel, M. Combination of granular activated carbon adsorption and deep-bed filtration as a single advanced wastewater treatment step for organic micropollutant and phosphorus removal. Water Res. 2016, 92, 131–139. [Google Scholar] [CrossRef] [PubMed]
- Meinel, F.; Sperlich, A.; Jekel, M. Pilot-scale study of powdered activated carbon recirculation for micropollutant removal. Water Sci. Technol. 2016, 74, 927–934. [Google Scholar] [CrossRef] [PubMed]
- Nodler, K.; Hillebrand, O.; Idzik, K.; Strathmann, M.; Schiperski, F.; Zirlewagen, J.; Licha, T. Occurrence and fate of the angiotensin II receptor antagonist transformation product valsartan acid in the water cycle—A comparative study with selected beta-blockers and the persistent anthropogenic wastewater indicators carbamazepine and acesulfame. Water Res. 2013, 47, 6650–6659. [Google Scholar] [CrossRef] [PubMed]
- Funke, J.; Prasse, C.; Lutke Eversloh, C.; Ternes, T.A. Oxypurinol—A novel marker for wastewater contamination of the aquatic environment. Water Res. 2015, 74, 257–265. [Google Scholar] [CrossRef] [PubMed]
- Konig, A.; Weidauer, C.; Seiwert, B.; Reemtsma, T.; Unger, T.; Jekel, M. Reductive transformation of carbamazepine by abiotic and biotic processes. Water Res. 2016, 101, 272–280. [Google Scholar] [CrossRef] [PubMed]
- Wiese, B.; Massmann, G.; Jekel, M.; Heberer, T.; Dünnbier, U.; Orlikowski, D.; Grützmacher, G. Removal kinetics of organic compounds and sum parameters under field conditions for managed aquifer recharge. Water Res. 2011, 45, 4939–4950. [Google Scholar] [CrossRef] [PubMed]
- Berliner Wasserbetriebe. Analysedaten des Wasserwerks Tegel. Available online: http://www.bwb.de/content/language1/downloads/WW_Analysedaten_2016_tegel_.pdf (accessed on 28 April 2017).
- Dieter, H.H. Health related guide values for drinking-water since 1993 as guidance to assess presence of new analytes in drinking-water. Int. J. Hyg. Environ. Health 2014, 217, 117–132. [Google Scholar] [CrossRef] [PubMed]
- Wode, F.; Reilich, C.; van Baar, P.; Dünnbier, U.; Jekel, M.; Reemtsma, T. Multiresidue analytical method for the simultaneous determination of 72 micropollutants in aqueous samples with ultra high performance liquid chromatography-high resolution mass spectrometry. J. Chromatogr. A 2012, 1270, 118–126. [Google Scholar] [CrossRef] [PubMed]
- Wode, F.; van Baar, P.; Dünnbier, U.; Hecht, F.; Taute, T.; Jekel, M.; Reemtsma, T. Search for over 2000 current and legacy micropollutants on a wastewater infiltration site with a UPLC-high resolution MS target screening method. Water Res. 2015, 69, 274–283. [Google Scholar] [CrossRef] [PubMed]
- Hellauer, K.; Mergel, D.; Ruhl, A.; Filter, J.; Hübner, U.; Jekel, M.; Drewes, J. Advancing Sequential Managed Aquifer Recharge Technology (SMART) Using Different Intermediate Oxidation Processes. Water 2017, 9, 221. [Google Scholar] [CrossRef]
- Altmann, J.; Sperlich, A.; Jekel, M. Integrating organic micropollutant removal into tertiary filtration: Combining PAC adsorption with advanced phosphorus removal. Water Res. 2015, 84, 58–65. [Google Scholar] [CrossRef] [PubMed]
- Onesios, K.M.; Bouwer, E.J. Biological removal of pharmaceuticals and personal care products during laboratory soil aquifer treatment simulation with different primary substrate concentrations. Water Res. 2012, 46, 2365–2375. [Google Scholar] [CrossRef] [PubMed]
- Velten, S.; Hammes, F.; Boller, M.; Egli, T. Rapid and direct estimation of active biomass on granular activated carbon through adenosine tri-phosphate (ATP) determination. Water Res. 2007, 41, 1973–1983. [Google Scholar] [CrossRef] [PubMed]
- Jekel, M.; Dott, W.; Bergmann, A.; Dunnbier, U.; Gnirss, R.; Haist-Gulde, B.; Hamscher, G.; Letzel, M.; Licha, T.; Lyko, S.; et al. Selection of organic process and source indicator substances for the anthropogenically influenced water cycle. Chemosphere 2015, 125, 155–167. [Google Scholar] [CrossRef] [PubMed]
- Huber, S.A.; Balz, A.; Abert, M.; Pronk, W. Characterisation of aquatic humic and non-humic matter with size-exclusion chromatography–organic carbon detection–organic nitrogen detection (LC-OCD-OND). Water Res. 2011, 45, 879–885. [Google Scholar] [CrossRef] [PubMed]
- Li, Q.; Snoeyink, V.L.; Mariñas, B.J.; Campos, C. Pore blockage effect of NOM on atrazine adsorption kinetics of PAC: The roles of PAC pore size distribution and NOM molecular weight. Water Res. 2003, 37, 4863–4872. [Google Scholar] [CrossRef] [PubMed]
- Matsui, Y.; Knappe, D.R.U.; Iwaki, K.; Ohira, H. Pesticide Adsorption by Granular Activated Carbon Adsorbers. 2. Effects of Pesticide and Natural Organic Matter Characteristics on Pesticide Breakthrough Curves. Environ. Sci. Technol. 2002, 36, 3432–3438. [Google Scholar] [CrossRef] [PubMed]
- Zietzschmann, F.; Worch, E.; Altmann, J.; Ruhl, A.S.; Sperlich, A.; Meinel, F.; Jekel, M. Impact of EfOM size on competition in activated carbon adsorption of organic micro-pollutants from treated wastewater. Water Res. 2014, 65, 297–306. [Google Scholar] [CrossRef] [PubMed]
Figure 1.
Scheme of the GAC pilot: (a) two fixed-bed adsorbers in series fed with drinking water; (b) single fixed-bed adsorber fed with un-aerated groundwater. Sampling and pressure measuring points (PIR) are indicated.
Figure 1.
Scheme of the GAC pilot: (a) two fixed-bed adsorbers in series fed with drinking water; (b) single fixed-bed adsorber fed with un-aerated groundwater. Sampling and pressure measuring points (PIR) are indicated.
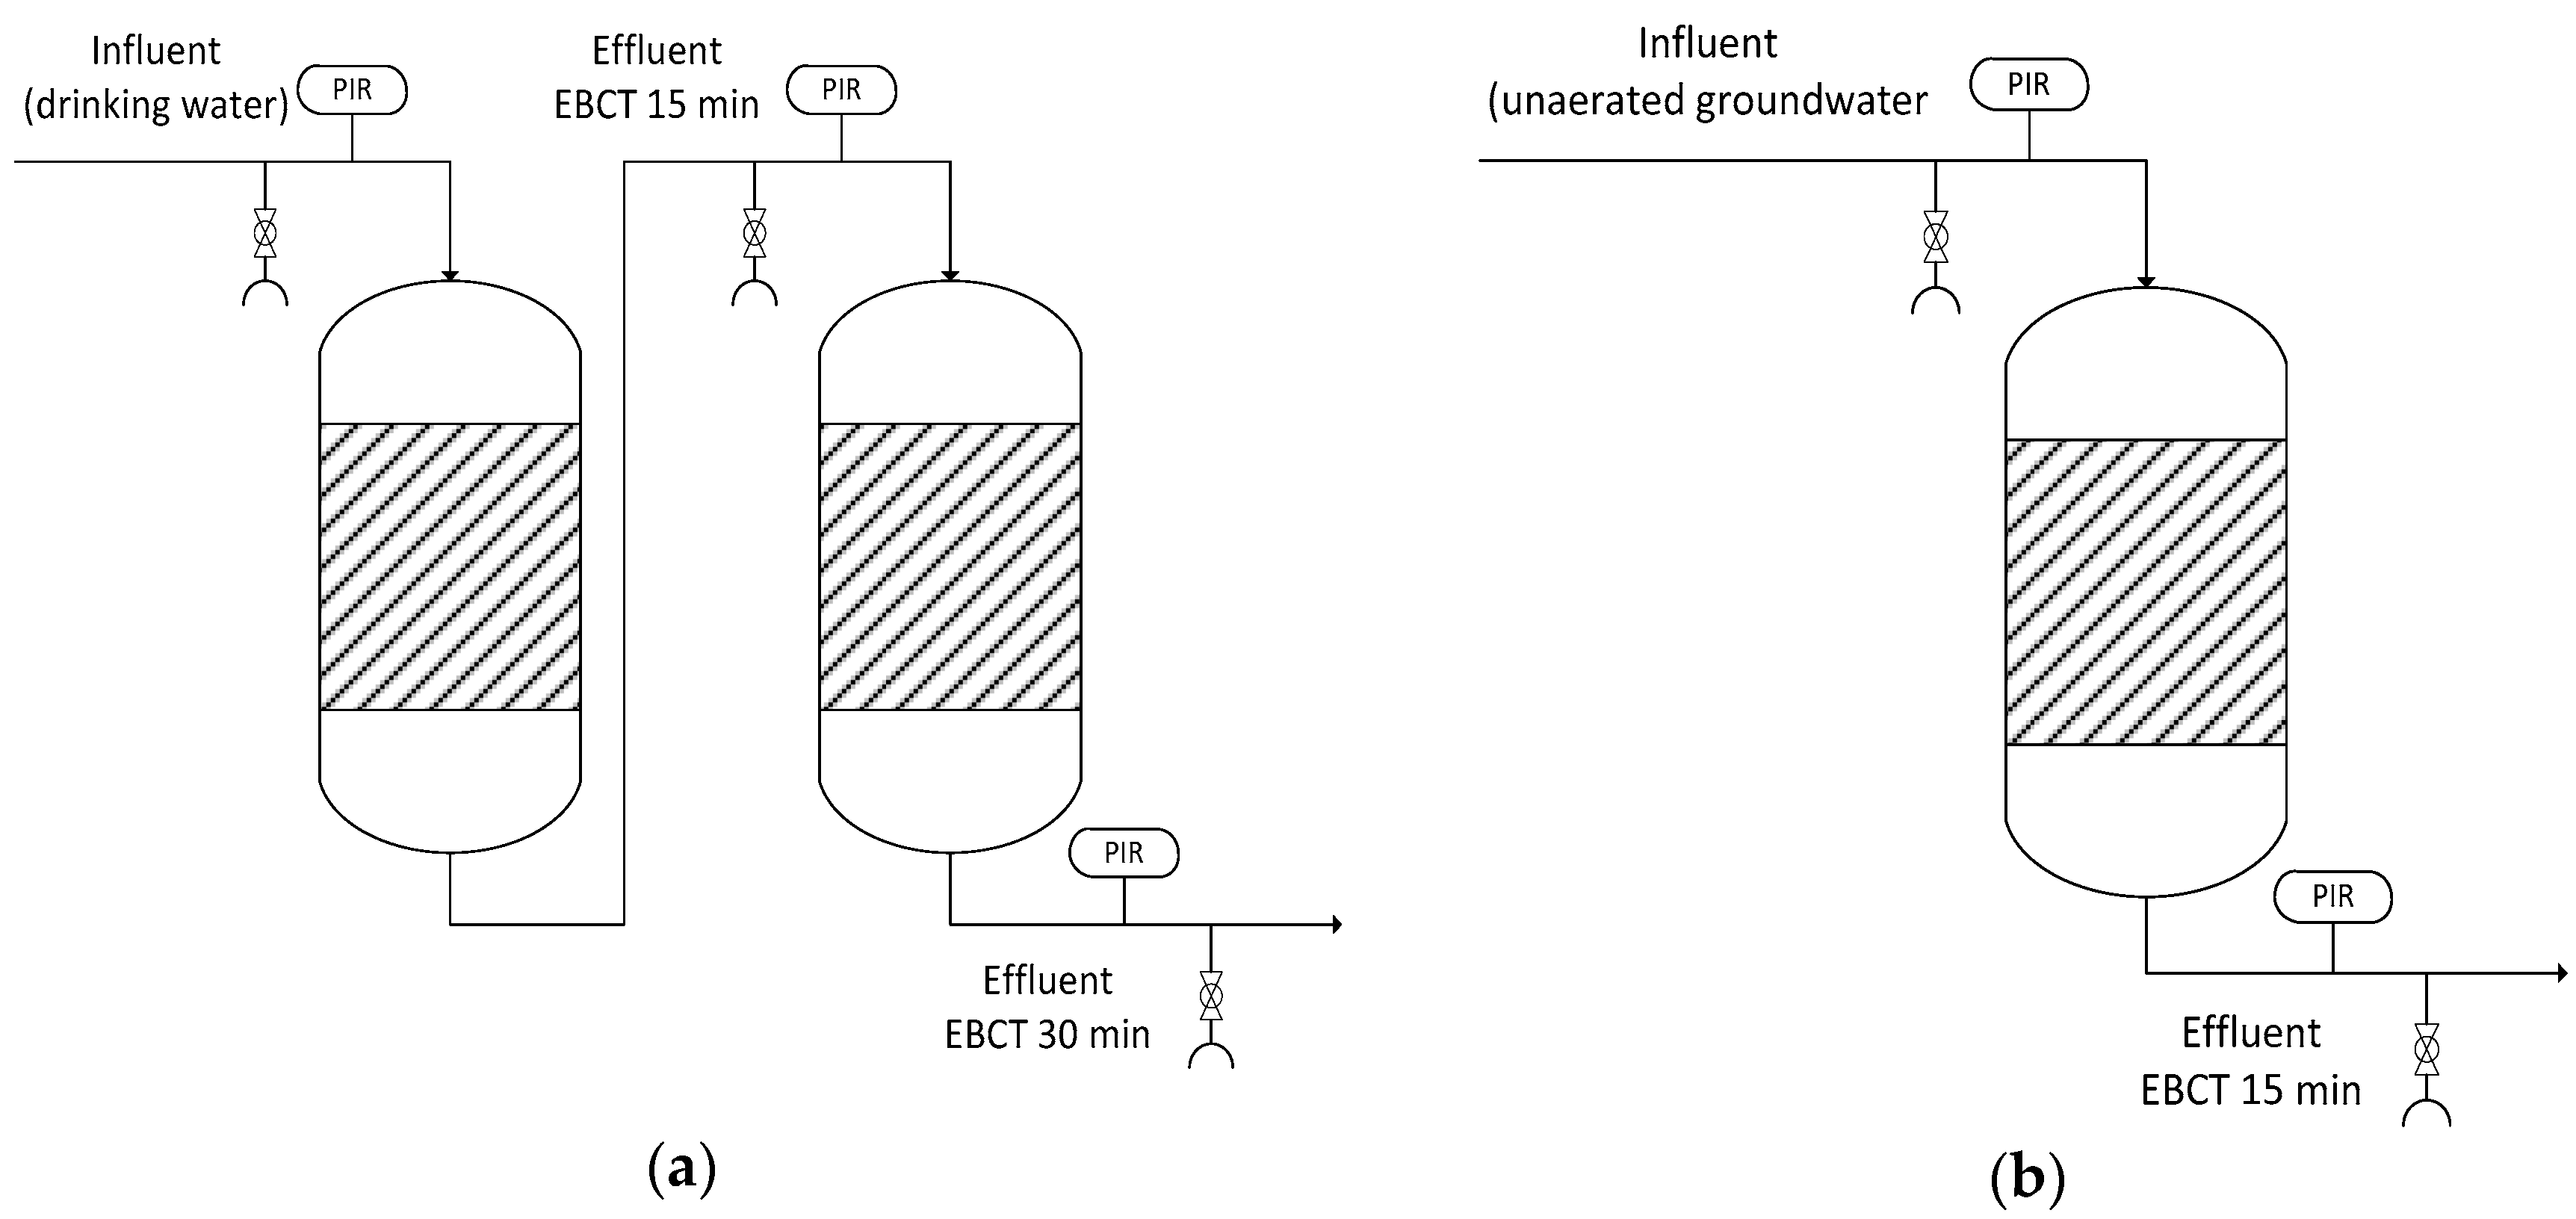
Figure 2.
Volumetric and hydraulic loading rate (HLR) during operation of (a) two fixed-bed adsorbers in series fed with drinking water; and (b) a single fixed-bed adsorber fed with un-aerated groundwater. Backwashes are indicated by dotted lines.
Figure 2.
Volumetric and hydraulic loading rate (HLR) during operation of (a) two fixed-bed adsorbers in series fed with drinking water; and (b) a single fixed-bed adsorber fed with un-aerated groundwater. Backwashes are indicated by dotted lines.

Figure 3.
(a) Dissolved oxygen concentration in the influent and effluents of two DW-fed fixed-bed adsorbers in series (n = 49); (b) Dissolved oxygen, total iron (Fe), dissolved manganese (Mn), and ammonia (NH4+) concentration in the influent and effluent of a GW-fed fixed-bed adsorber (n = 18–53).
Figure 3.
(a) Dissolved oxygen concentration in the influent and effluents of two DW-fed fixed-bed adsorbers in series (n = 49); (b) Dissolved oxygen, total iron (Fe), dissolved manganese (Mn), and ammonia (NH4+) concentration in the influent and effluent of a GW-fed fixed-bed adsorber (n = 18–53).
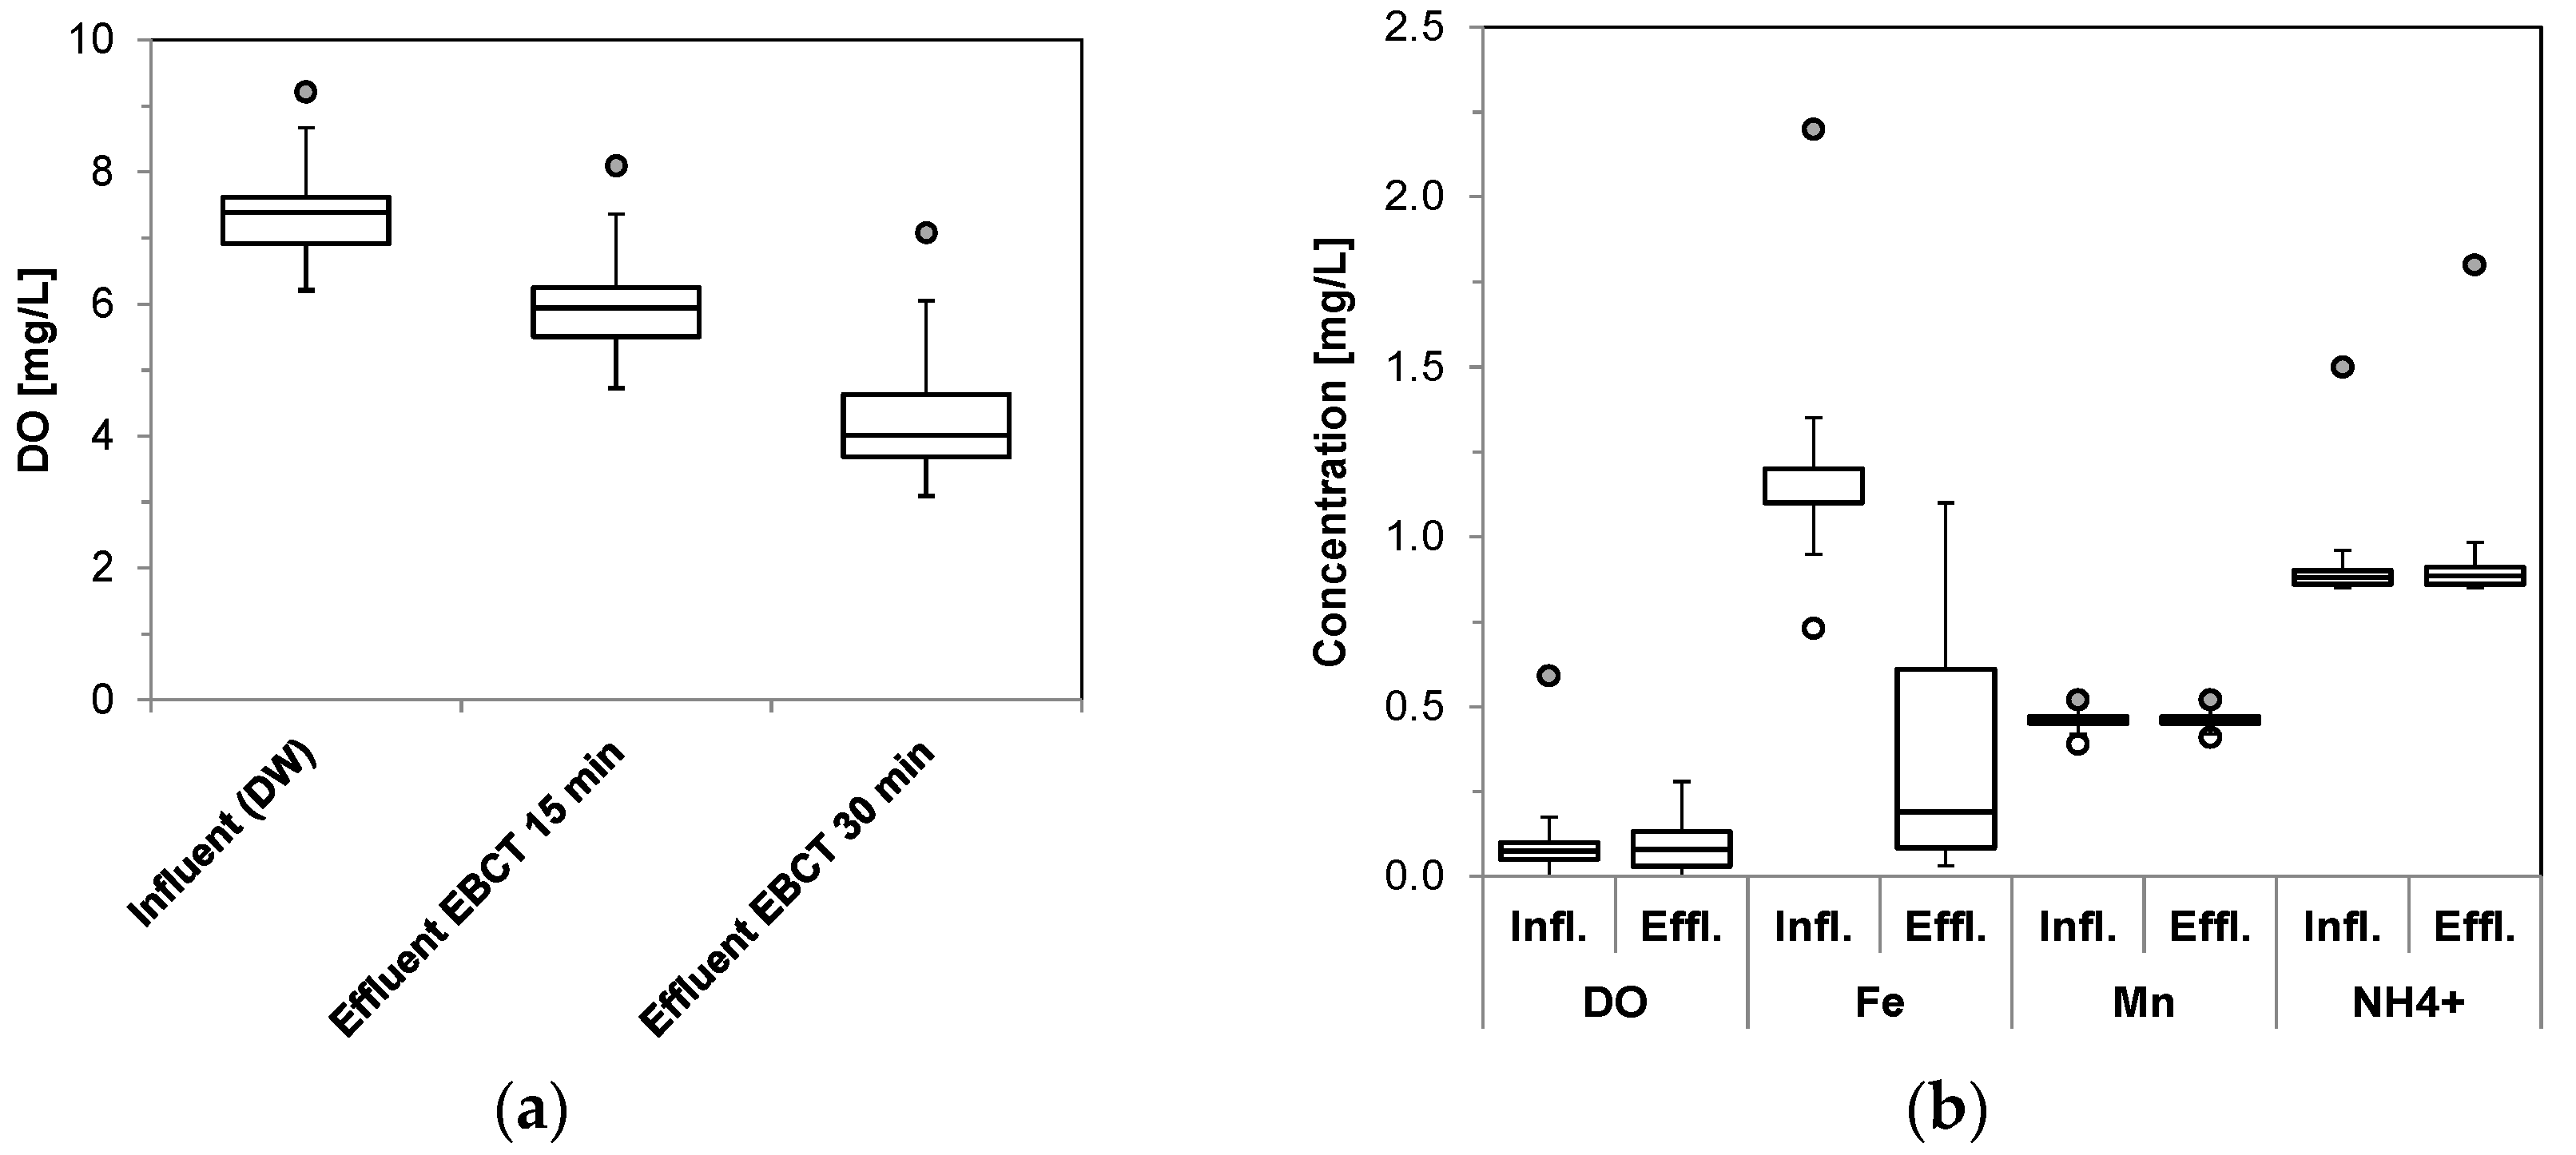
Figure 4.
Concentrations of DOC in (a) the influent and effluents of the first and second DW-fed adsorbers vs. throughput and in (b) the influent and effluent of the GW-fed adsorber.
Figure 4.
Concentrations of DOC in (a) the influent and effluents of the first and second DW-fed adsorbers vs. throughput and in (b) the influent and effluent of the GW-fed adsorber.

Figure 5.
UVA254 breakthrough curves of (a) two fixed-bed adsorbers in series fed with drinking water; and (b) a single fixed-bed adsorber fed with un-aerated groundwater.
Figure 5.
UVA254 breakthrough curves of (a) two fixed-bed adsorbers in series fed with drinking water; and (b) a single fixed-bed adsorber fed with un-aerated groundwater.

Figure 6.
Breakthrough curves for (a,b) gabapentin and (c,d) valsartan acid in two fixed-bed adsorbers in series fed with drinking water (left) and a single fixed-bed adsorber fed with unaerated groundwater (right).
Figure 6.
Breakthrough curves for (a,b) gabapentin and (c,d) valsartan acid in two fixed-bed adsorbers in series fed with drinking water (left) and a single fixed-bed adsorber fed with unaerated groundwater (right).
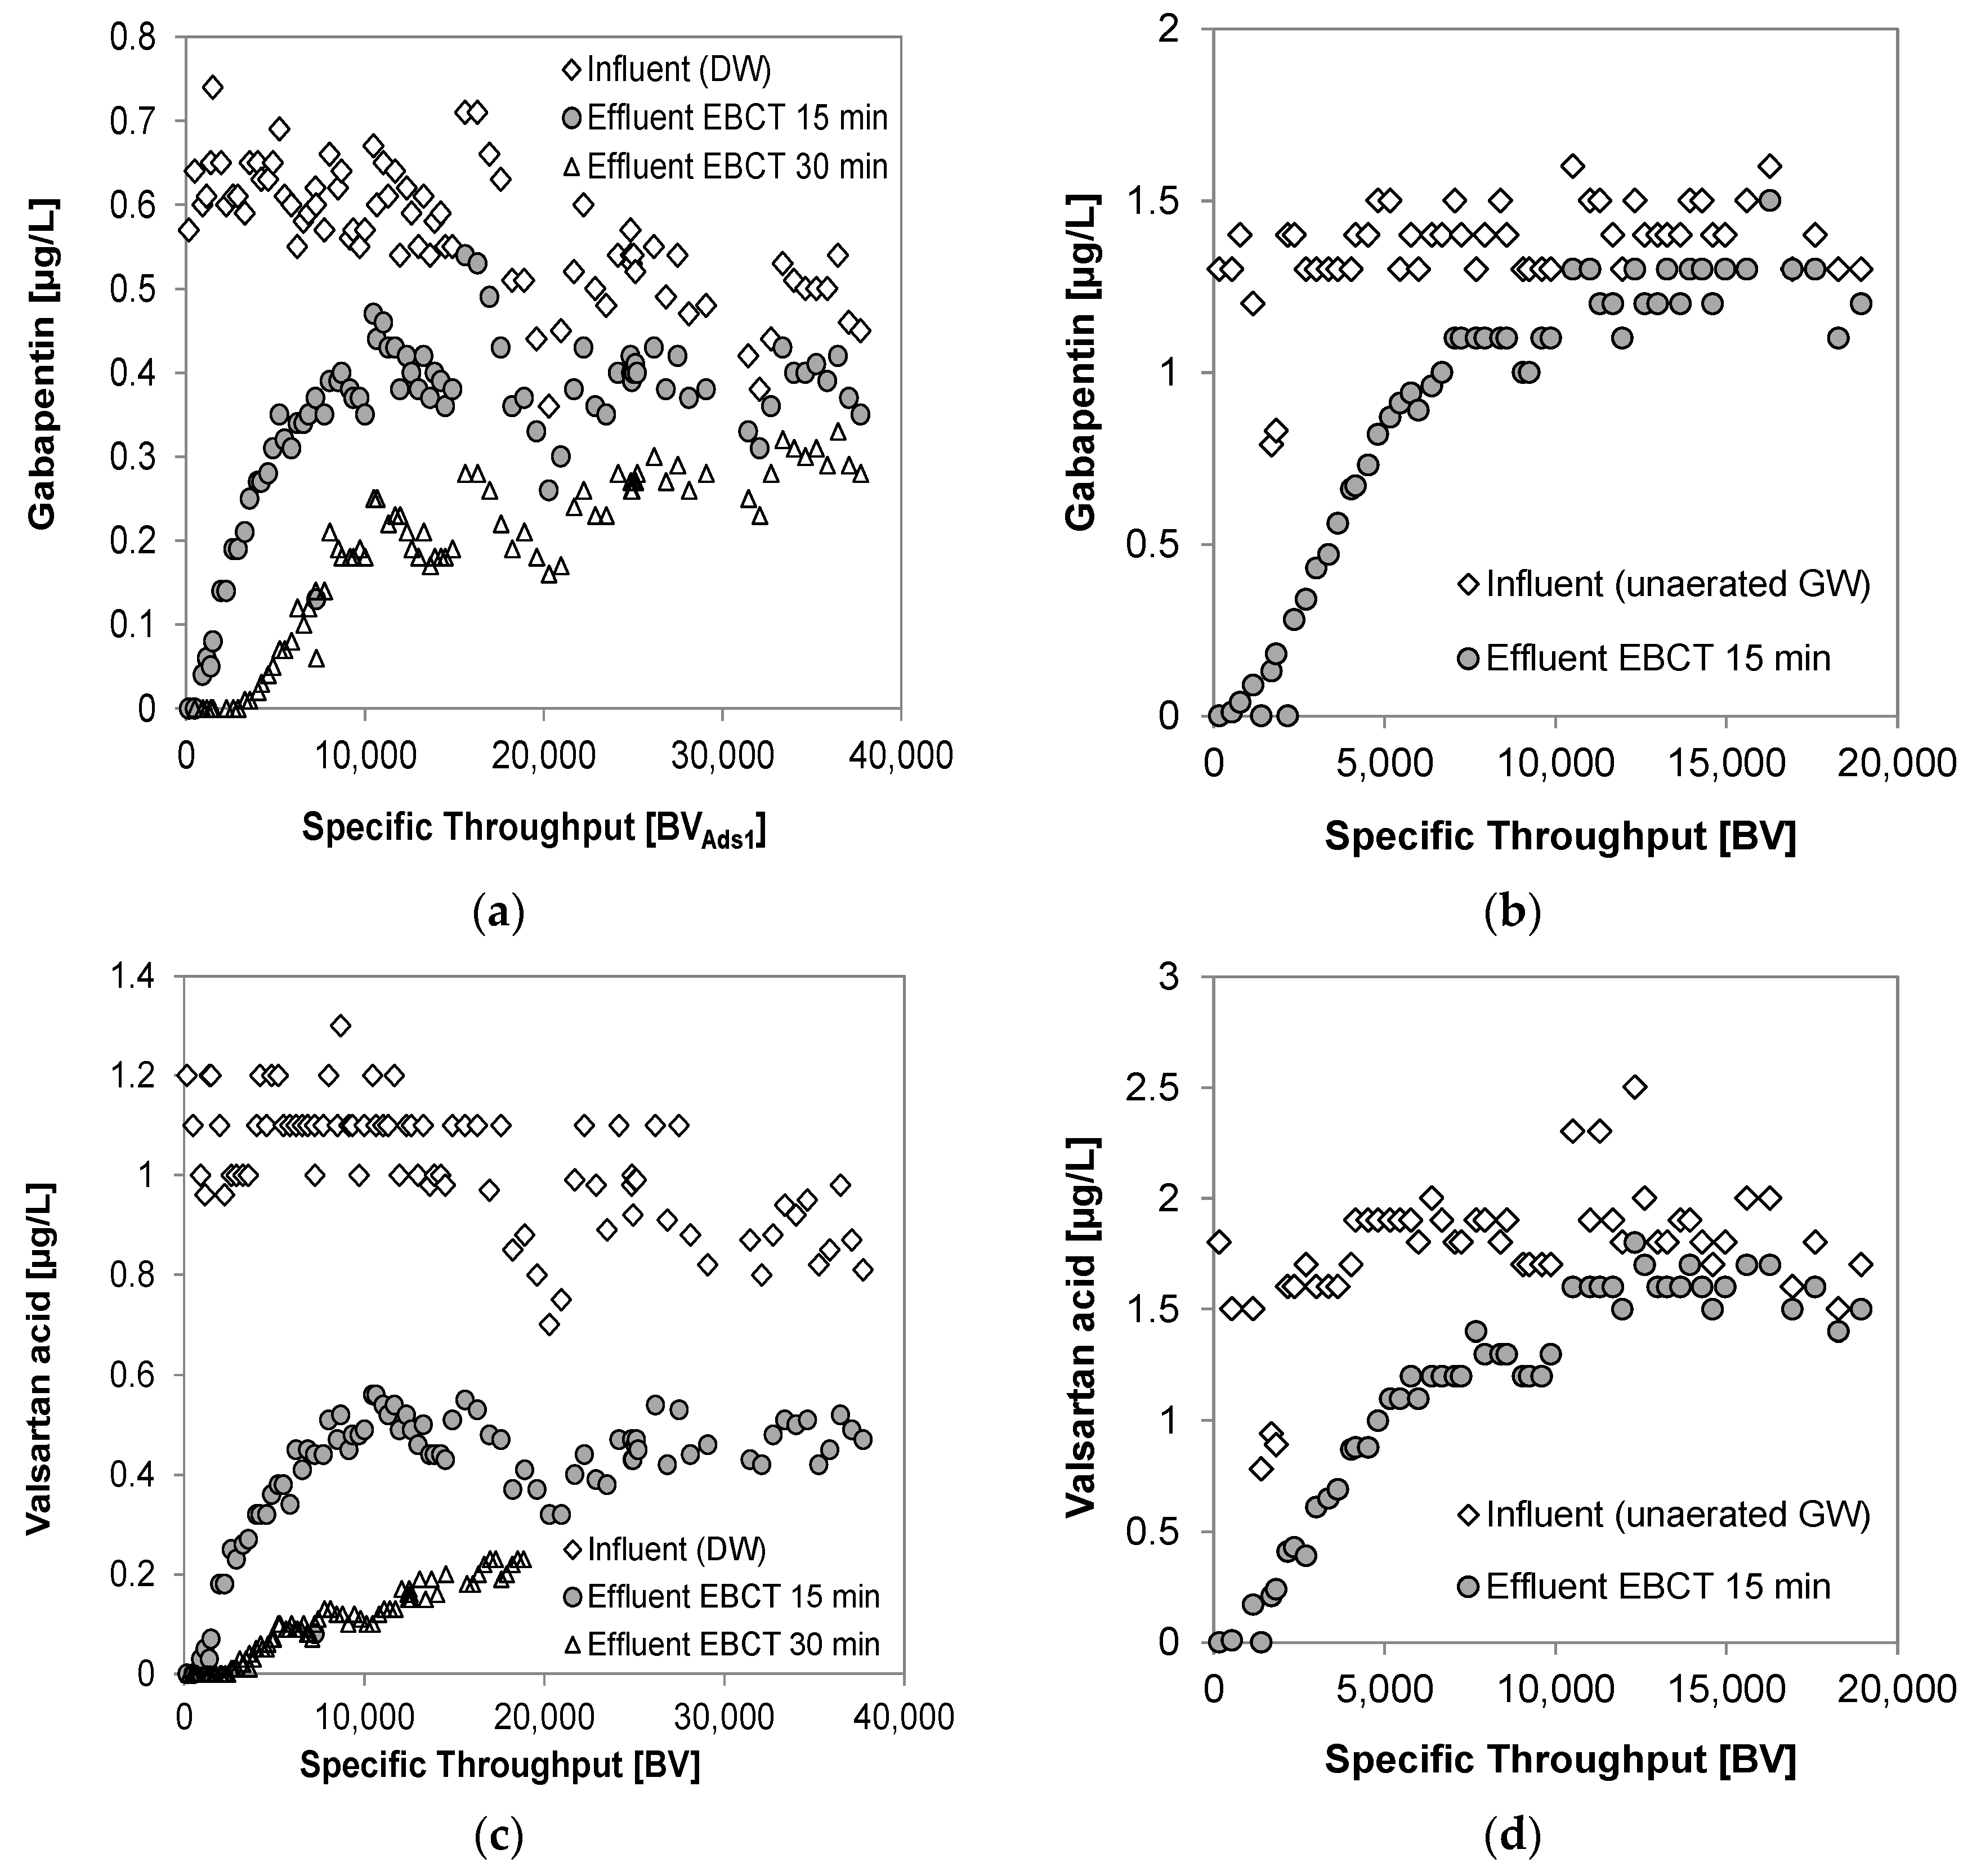
Figure 7.
Breakthrough curves for (a,b) oxypurinol and (c,d) carbamazepine in two fixed-bed adsorbers in series fed with drinking water (left) and a single fixed-bed adsorber fed with un-aerated groundwater (right).
Figure 7.
Breakthrough curves for (a,b) oxypurinol and (c,d) carbamazepine in two fixed-bed adsorbers in series fed with drinking water (left) and a single fixed-bed adsorber fed with un-aerated groundwater (right).


Table 1.
Drinking water quality data from Berlin-Tegel (Germany), annual median values, 2016 [11].
Table 1.
Drinking water quality data from Berlin-Tegel (Germany), annual median values, 2016 [11].
| Parameter | Median Value | Limit Value 1 | HRIV 2 |
|---|---|---|---|
| Iron (mg/L) | <0.03 | 0.2 | - |
| Manganese (mg/L) | <0.005 | 0.05 | - |
| Conductivity (µS/cm) | 750 | 2790 | - |
| Turbidity (NTU) | <0.2 | 1.0 | - |
| pH | 7.5 | 6.5–9.5 | - |
| Temperature (°C) | 12.9 | - | - |
| Dissolved oxygen (mg/L) | 8.0 | - | - |
| TOC (mg/L) | 4.5 | - | - |
| UVA254 (L/m) | 10.4 | - | - |
| Colour (L/m) | 0.3 | 0.5 | - |
| Carbamazepine (µg/L) | 0.13 | - | 0.3 |
| Gabapentin (µg/L) | 0.55 | - | 1.0 |
| Oxypurinol (µg/L) | 0.43 | - | 0.3 |
| Valsartan acid (µg/L) | 1.0 | - | 0.3 |
Notes: 1 German drinking water ordinance TrinkwV 2001; 2 Health-related indication values are set by the German Environment Agency [12].
© 2017 by the authors. Licensee MDPI, Basel, Switzerland. This article is an open access article distributed under the terms and conditions of the Creative Commons Attribution (CC BY) license (http://creativecommons.org/licenses/by/4.0/).
Share and Cite
MDPI and ACS Style
Sperlich, A.; Harder, M.; Zietzschmann, F.; Gnirss, R. Fate of Trace Organic Compounds in Granular Activated Carbon (GAC) Adsorbers for Drinking Water Treatment. Water 2017, 9, 479. https://doi.org/10.3390/w9070479
AMA Style
Sperlich A, Harder M, Zietzschmann F, Gnirss R. Fate of Trace Organic Compounds in Granular Activated Carbon (GAC) Adsorbers for Drinking Water Treatment. Water. 2017; 9(7):479. https://doi.org/10.3390/w9070479
Chicago/Turabian StyleSperlich, Alexander, Mareike Harder, Frederik Zietzschmann, and Regina Gnirss. 2017. "Fate of Trace Organic Compounds in Granular Activated Carbon (GAC) Adsorbers for Drinking Water Treatment" Water 9, no. 7: 479. https://doi.org/10.3390/w9070479
Note that from the first issue of 2016, this journal uses article numbers instead of page numbers. See further details here.