Kinetic Modelling of the Removal of Multiple Heavy Metallic Ions from Mine Waste by Natural Zeolite Sorption


Faculty of Engineering and Architectural Science, Department of Civil Engineering, Ryerson University, Toronto, ON M5B 2K3, Canada
*
Author to whom correspondence should be addressed.
Water 2017, 9(7), 482; https://doi.org/10.3390/w9070482
Submission received: 17 May 2017
/
Revised: 21 June 2017
/
Accepted: 27 June 2017
/
Published: 1 July 2017
(This article belongs to the Special Issue Treatment of Wastewater and Drinking Water through Advanced Technologies)
Abstract
:This study investigates the sorption of heavy metallic ions (HMIs), specifically lead (Pb2+), copper (Cu2+), iron (Fe3+), nickel (Ni2+) and zinc (Zn2+), by natural zeolite (clinoptilolite). These HMIs are combined in single-, dual-, triple-, and multi-component systems. The batch mode experiments consist of a total initial concentration of 10 meq/L normality for all systems, acidified to a pH of 2 by concentrated nitric (HNO3) acid. A zeolite dosage of 4 g per 100 mL of synthetic nitrate salt aqueous solution is applied, for a contact period of 5 to 180 min. Existing kinetic models on HMIs sorption are limited for multi-component system combinations. Therefore, this study conducts kinetic analysis by both reaction and diffusion models, to quantify the sorption process. The study concludes that the process correlates best with the pseudo-second-order (PSO) kinetic model. In the multi-component system combining all five HMIs, the initial sorption rate and theoretical equilibrium capacity are determined as 0.0033 meq/g·min and 0.1159 meq/g, respectively. This provides significant insight into the mechanisms associated with the sorption process, as well as contributing to the assessment of natural zeolite as a sorbent material in its application in industrial wastewater treatment.
1. Introduction
Acid mine drainage (AMD) is a primary source of contamination, as waterways are prone to both the direct and unintended discharge of mineral mining and processing effluent [1]. AMD is formed by the oxidization of an iron sulphide (pyrite), and possess a low pH level, high specific conductivity, high concentrations of iron, aluminium and manganese, and trace amounts of toxic heavy metals. The bacterium Acidithiobacillus ferrooxidans has been reported to accelerate the oxidation process of various metal sulphides, depending on the pH level of the aqueous solution in the mine [2]. The presence of these heavy metallic ions (HMIs) is a threat to the peripheral environment and the ecological system. They are non-biodegradable pollutants and accumulate in living organisms, causing various diseases and disorders [3,4,5,6,7]. The proficiency and demand for proper evaluation and predication of water quality has grown, in order to protect the surrounding water resources [8,9]. Environmental management is significant in any industry, which is a controlling factor for economic advancement, profitable development and the protection of the water resources at risk of future AMD contamination [9]. The environmental impact assessment (EIA) of large developments, such as industrial mining, is of great importance. The ecological, environmental, and socio-economic effects of these developments must be thoroughly evaluated. With this in mind, the EIA must establish both quantitative and qualitative standards with regards to modelling predication [10]. The industry is faced with a challenge to supply the demand for a simple, robust, and cost-efficient solution, in order to address local contaminate sources and water regulations [11].
The process of sorption as an industrial wastewater treatment method [1,12] has developed among researchers, demonstrating industrial viability and effectiveness, cost efficiency and environmental sustainability [13,14]. This process refers to every type of capture of a substance via physical, chemical, and electrostatic means; from the external surface of solids as well as from the internal surfaces of porous solids or liquids. Specifically, HMI uptake is attributed to both adsorption (on the surface of the micropores) and ion exchange (through the framework pores and channels) mechanisms [15]. Both involve a mass transfer from a fluid to a solid phase, and the total charge sorbed and desorbed is explicitly the same as required by the electro-neutrality principle. Therefore, it is generally accepted to consider adsorption and ion exchange as sorption for a unified treatment process [16,17].
Existing literature has demonstrated the investigation of various sorbent materials, which include activated carbon, natural zeolites, clay minerals (i.e., bentonite, kaolin), biomaterials (i.e., peat, sawdust), and low-cost adsorbents (i.e., agricultural waste, industrial byproducts) [18,19]. Natural zeolites in have garnered particular research interest due to their coexisting molecular sieve action, ion exchange and catalytic properties [12,20,21]. Zeolite is a hydro-aluminosilicate, with primary building units of silicon-aluminum oxygen (tetrahydra). Its three-dimensional framework contains cations, Na+, Ca2+, Mg2+, and K+, expressed as co-ions in solution. This framework encompasses complex rings that create an open, homogenous, microporous structure of voids and channels [20]. The co-ions that leave the zeolite’s framework are replaced by an equivalent amount of counterions. In order to meet its electro-neutrality requirement, when the counterion moves out into solution, the zeolite is left with an electric surplus charge to be compensated for by taking up another counterion; the total counterion content (in equivalents) remains constant, regardless of the ionic composition [16] (p. 250). Zeolite is comprised of various phases: (1) zeolite and the external sorbate solution, (2) molten salt and zeolite at equilibrium, and (3) the ‘solvent vapour’ (water), a thermodynamic reference point with a profound effect on the reaction (i.e., attainment rate and exchange position at equilibrium). There are both thermodynamic and kinetic aspects to ion exchange, being a stoichiometric process between the phases to maintain electro-neutrality. The chemical reaction involves cations initially present in separate phases moving between two phases, until equilibrium within each phase is achieved [22]. Available exchange sites have been referred to as ‘two-way traffic in a one-way street’ [16] (p. 186). The amount of solvent that the crystalline is able to uptake depends on the internal volume, defined by the lattice channels’ width and intra-crystalline voids, and on the volume occupied by counterions found in solution. The sorption process is a reversible phenomenon that depends on factors such as the molecular size, swelling pressure, sieve action, solution concentration, and temperature [16]. Overall, one of the most significant properties of zeolite is its high cation exchange capacity [21] and selectivity of certain metals [23], and is considered as a strong candidate for the removal of wastewater contaminants loaded with HMIs [24].
In recent years, the study of sorption kinetics has attracted a lot of interest among researchers due to its importance in sorbent material assessment and subsequent application in the wastewater treatment industry [25]. Sorption kinetics defines the reaction pathways and uptake rates, along with residence times at which the equilibrium point is reached at the solid–solution interface. The physical as well as the chemical composition of the sorbent material influences the sorption kinetics and controlling mechanisms [26]. A proper understanding of the mechanisms involved is not complete without experimental data on the simultaneous sorption of the heavy multi-metallic ions that are prevalent in industrial effluent, and an analysis on the uptake and rate of interference of these HMIs in combination [14,16]. With the significant sorption research that has been undertaken, however, data are still very limited on kinetic analysis [1,27] of the number of HMIs in different multi-component system combinations, with sorption by zeolite in its natural form [11,18,28,29]. In light of this, the objective of the current study is to investigate the use of kinetic modelling to study the rate of the overall sorption process of five commonly occurring HMIs, specifically lead (Pb2+), copper (Cu2+), iron (Fe3+), nickel (Ni2+) and zinc (Zn2+), by natural zeolite. To better understand how the removal of various ions may be affected by the presence of other HMIs, the experimental investigation will be carried out in increasing complexities, by combining the ions in single-, dual-, triple-, and multi-component aqueous solution systems. Various kinetic models, based on the reaction and diffusion concepts, will be considered in this study. It is envisaged that this kinetic analysis of the experimental data consisting of multiple HMIs in different combinations will provide significant insight into the mechanisms associated with the sorption process for AMD treatment [25].
2. Materials and Methods
2.1. Zeolite Sample Material
The natural zeolite mineral form clinoptilolite is used in this research. Among the 40 known types, clinoptilolite is well documented and found in large deposits all over the world [18,30]. This global abundance provides significant progress for future industrial wastewater treatment technology development. This study employs a mineral sample composed primarily of 85–95% clinoptilolite and is sourced from a deposit located in Preston, Idaho, USA (CAS No. 12173-10-3) [31]. Its general chemical formula is , with a cation exchange capacity of 180–220 meq/100 g and a pH range from 7–8.64. It has a maximum water retention and an overall specific surface area of 55 wt % and 24.9 m2/g, respectively. Typical elemental analysis indicates that various elements, including sodium, calcium, magnesium, potassium, as well as lead, copper, iron, and zinc, constitute its structure. No significant concentrations of toxic trace elements are present in its composition, nor are trace metal elements water soluble. The low clay content unique to this sample ensures low dust content, with a harder and more resistant structure [31]. The mineral sample is applied in its natural state, without any chemical modifications, to minimize all associated costs and environmental impacts of this study. Based on extensive preliminary investigations within the mechanical particle size range of 0.420 to 1.41 mm (standard mesh −14 + 40) [32], this study employs the specific fraction of 0.841 to 1.19 mm (standard mesh −16 + 20) as a controlled parameter in all experiments [33]. The sieved zeolite is exposed to a cleaning cycle, which involves rinsing in deionized distilled water to remove residual debris and dust, and drying at 80 ± 3 °C for 24 h to remove any residual moisture [34].
2.2. Kinetic Experimental Procedure
The Canada-Wide Survey of Acid Mine Drainage [35] is based on a census of 30 mines with 75 corresponding stream codes, located across Canada. Various mine types, such as copper-zinc and nickel-copper, and waste from different sources that include mine water, tailings pond water, seepage/runoff/streams, tailings effluent, and treatment/collection systems, are reported. Based on metal processing mines at the time of this survey, the metals predominately found in AMD streams include lead, copper, iron, nickel, and zinc. The Canadian Minister of Justice Metal Mining Effluent Regulations outline the authorized limits of deleterious substances (Schedule 4) [36], for cyanide, lead, copper, lead, nickel, and zinc. Lead in particular is considered an acute toxic priority [37]. Due to a greater presence in Ontario mines presented by Wilson [35] and the strict limitations required by the Canadian Government [36], this study focuses on lead (Pb2+), copper (Cu2+), iron (Fe3+), nickel (Ni2+) and zinc (Zn2+) found in AMD [30].
The removal efficiency order is indicative of how the adsorptive nature of zeolite for each ion varies among the different component systems [29]. Overall, this selectivity or preference of zeolite for one cation compared to another (at given equilibrium conditions and composition) [22] is stronger for the counterion of higher valence, increasing with dilution of solution and strongest with ion exchange of high internal molality. The counterions’ valences affect the ‘electro-selectivity’ of zeolite. The preference is also stronger for smaller solvated equivalent volumes, and forms stronger ionic bonds with fixed ionic groups [16]. The cations present in the sorbent have valences that differ from those in solution. Consequently, as the dilution increases, the selectivity of the sorbent for the ion with a higher valence also increases. Accordingly, comparative analysis of various metal ions should be conducted at the same normality and temperature, in order to minimize the changes observed in isotherm configuration with dilution [29].
The synthetic metallic ion solutions are prepared from analytical grade nitrate salts of Pb(NO3)2 (CAS No. 10099-74-8), Cu(NO3)2·3H2O (CAS No. 10031-43-3), Fe(NO3)3·9H2O (CAS No. 7782-61-8), Ni(NO3)2·6H2O (CAS No. 13478-00-7), and Zn(NO3)2·6H2O (CAS No. 10196-18-6), respectively, in deionized distilled water. The HMIs are combined to maintain a total normality of 0.01 N (10 meq/L), as adopted by Inglezakis et al. [23,29] for meaningful comparison. The corresponding HMI concentrations are approximately 1036 mg/L for Pb2+, 318 mg/L for Cu2+, 186 mg/L for Fe3+, for 293 mg/L Ni2+, and 327 mg/L for Zn2+. It is important to note that this study systematically increases the HMI combinations to develop a more comprehensive understanding of how the presence of multiple HMIs influences the sorption process kinetics, as follows:
- single-component system—10 meq/L per metal,(lead [P], copper [C], iron [F], nickel [N], zinc [Z]);
- dual-component system [D]—5.0 meq/L per metal(lead-copper [D-PC], lead-iron [D-PF], lead-nickel [D-PN], lead-zinc [D-PZ],copper-iron [D-CF], copper-nickel [D-CN], iron-zinc [D-FZ], nickel-zinc [D-NZ]);
- triple-component system [T]—3.3 meq/L per metal (lead-copper-iron), and;
- multi-component system [M]—2.0 meq/L per metal (all five metals).
It is important to note that the existence of HMIs in AMD is very mine-specific, and the concentrations fluctuate extensively. Confounding factors, such as the sorption phenomena, interactions along the AMD migration pathway, or other site-specific features that are not seasonal, have an overriding impact on many AMD stream characteristics [35]. The Canada-Wide Survey of Acid Mine Drainage [35] further reports that copper concentrations tend to be highest in the spring and lowest in the fall (both moderate trends); iron (weak trend) and lead (strong trend) concentrations tend to be highest in the winter; zinc concentrations tend to be highest in the spring (weak trend) and lowest in the summer and fall (strong trend). A moderate trend towards the occurrence of the highest concentration of sulphate occurs in the winter, and a strong trend towards the occurrence of the lowest concentration in the spring [35]. The survey also reveals that the average of seasonal mean HMI concentrations of waste streams to be 0.5 for Pb2+, 2 for Cu2+, 100 for Fe3+, 2.5 for Ni2+, and 35 mg/L for Zn2+. Motsi et al. [38] investigates the sorption of heavy metals from AMD by natural zeolite. Kinetic studies involved combining Fe3+, Cu2+, Zn2+, and Mn2+ at initial concentrations of 400, 20, 120, and 20 mg/L, respectively. Actual mine samples are also collected by Motsi et al. [38], with concentrations of Fe3+, Cu2+, Zn2+, Mn2+, Al3+, As3+ and Cd2+ as 200, 12, 85, 15, 15, 9, and 1 mg/L, respectively. This demonstrates that real-life fluctuations of HMIs in AMD are widespread. The five HMIs are combined to a total 10 meq/L aqueous solution concentration to maintain an efficient, conservative structure to this present study.
The initial pH levels of the solution must be attentively selected, ensuring balance among all ionic species involved. Consequently, the influent stock is acidified with concentrated nitric (HNO3) acid (CAS No. 7697-37-2) to a pH level of less than 2 [39] to prevent precipitation of the metal ions [12,29]. The sorption tests are conducted in batch mode by mixing the synthetic heavy metallic ion solutions, and based on preliminary investigations [32], combined with a dosage of 4 g of zeolite per 100 mL solution. The mixture is agitated on a bench-top orbital shaker with triple-eccentric drive at 400 r/min set at 22°C, for a 5 to 180 minute contact period. In all experiments, the solute and sorbent are separated through a 0.45 μm filter syringe after the reaction.
2.3. Analytical Procedure
The HMI concentrations are analysed in their aqueous phase by Inductively Coupled Plasma–Atomic Emission Spectroscopy (ICP-AES) technology (Optima 7300 DV, Part No. N0770796, Serial No. 077C8071802, Firmware Version 1.0.1.0079, Perkin Elmer Inc.), with corresponding WinLab32 Software (Version 4.0.0.0305). Among the various atomic spectrometry techniques (i.e., Flame AA, Graphite Furnace AA, ICP-MS), ICP-AES allows the complete atomization of the elements in a given sample, which minimizes the potential for chemical interferences. It is considered as a true multi-element technique with exceptional sample throughput, and with a very wide range of analytical signal intensity [40]. The primary wavelengths of each HMI element targeted are 327.393 (Cu), 238.204 (Fe), 231.604 (Ni), 220.353 (Pb), and 206.200 (Zn), respectively. Analysis is conducted with a plasma setting in radial view (to concentrations of greater than 1 mg/L), auto sampling of 45 seconds normal time at a rate of 1.5 mL/min, and a processing setting of 3 to 5 points per peak with 2 point spectral corrections. The calibration curve is generated through ‘linear calculated intercept’ by applying a stock blank and a multi-element Quality Control Standard 4 with 1, 10, 50, 90, and 100 mg/L concentrations (as per Standard Methods Part 3000) [39]. The quantifiable detection limits (QDL) for the primary wavelengths in radial view are 0.05 µg/mL for Cu, Fe, Ni, and Zn, and 0.1 µg/mL for Pb. Afterward, the ‘through zero’ calibration is applied to verify that a majority of the trace ions detected are within acceptable QDL levels.
The sorbed amount of HMI is calculated from the difference between the starting concentration and its concentration in the filtered samples’ supernatant. Triplicate readings and their mean concentrations in calibration units are generated in mg/L by the ICP-AES software. During every ICP-AES analytical session, quality control methods are applied, and the median 50 mg/L calibration standard is chosen as an additional sample to act as a reference point for all experimental sets. Three major check parameters are selected to evaluate the calibration quality. First, the percent relative standard deviation (%RSD) reports an average of 0.597%, which is well within the ≤3% limit. The triplicate concentration of the median standard detects an average of 51.62 mg/L, and is within 5% of the known value. Finally, the correlation coefficient of each HMI primary wavelength analyte generates an average of 0.999821, which is very close to unity. Therefore, these check parameters indicate that the data is relatively accurate and the experimental replicates are reliable based on the calibration relationship established [41].
2.4. Sorption Kinetics Principles and Model Selection
The accuracy of modelling prediction is dependent on the various open boundary conditions, model parameters selected, and numerical method(s) implemented. The model input parameters in particular are of great significance, which must be based on various optimal criteria, such as ecological considerations and strong linear correlation [9]. The variation in sorption kinetics of the selected HMIs is attributed to the specific crystalline structure of the natural zeolite sorbent, and is controlled by various mechanisms [1,16,22]. Kinetic modelling is a powerful tool to assess the performance of sorbent materials and to comprehend these fundamental mechanisms involved in the sorption process. This is classified as follows [1,25], where either one sole-step or multiple phases have a predominate impact [42]:
- Reaction-Type ModelChemisorption—chemical reaction at the sites of the functional ionic groups within the zeolite and focuses on the process as a whole.
- Diffusion-Type Model
- Film Diffusion—diffusion of counterions in the adherent layer surrounding the zeolite (between the external solution and crystal surface).
- Intra-Particle Diffusion—diffusion of counterions in the solute within the zeolite pores and/or along the pore walls.
- Mass Action—sorption or desorption between the active sites and the sorbate material.
The sorption capacity is a significant parameter in the kinetic modelling process. Based on the ratio of 4 g zeolite to a 100 mL HMI solution, the sorption uptake is calculated by Equation (1) [9,10,22]:
where (in meq/g) is the sorbed uptake of HMI at time (in min), and are the HMI concentrations in solution (in meq/L) initially and after time , respectively, is the solution volume (in L), and is the zeolite mass (in g).
For the present study, both sorption kinetic classifications have been studied, and those considered in the model selection process are discussed in the following subsections.
2.4.1. Reaction-Type Models
In order to analyse sorption reaction kinetics, correlations between the sorption uptake of the HMIs with respect to time were analysed. The following models were taken into consideration.
Pseudo-First-Order Rate Equation
This model is considered to be earliest to represent the liquid-solid phase sorption process, relating the capacity to rate [25]. This kinetic model is given in Equation (2); by applying the boundary conditions of and , its solution and linearized form are given in Equations (3) and (4), respectively [11,25]:
where and are sorption capacity (the amount of HMI sorbed per unit weight of sorbent) (in meq/g) at equilibrium and at time (in min), respectively; and is the pseudo-first order rate constant (in min−1). According to this model, a plot of versus would provide a linear trend [42]. Previous research efforts have demonstrated that this equation does not fit the data well for the complete contact time range [11,42,43].
Pseudo-Second-Order Rate Equation
The pseudo-second-order (PSO) model implies that the rate-limiting step is by chemical adsorption (chemisorption), involving valent forces through sharing or electron exchange between the sorbent material and the HMIs in solution. The sorption rate depends on the amount of ions on the sorbent surface at time and what is sorbed at equilibrium [25]. This kinetic model is given in Equation (5). By applying the boundary conditions of and , its linearized form is given in Equation (6) and rearranged in Equation (7) [1,4,11,25]:
where is the initial sorption rate (in meq/g·min) as approaches zero [44], and is the PSO rate constant (in g/meq·min). These constants are determined by a plot of the linearized form (Equation (6)) of versus [11,25,26,44]. This model has effectively demonstrated the sorption process of various contaminants, including metal ions, and organic substances in an aqueous state [25,42,43,45].
Elovich’s Equation
This model was developed to predominately describe the sorption interactions between the gas phase onto a heterogeneous solid [25], but has also represented sorption of contaminants from aqueous solutions [42]. The relationship is given in Equation (8) [25,42,43]:
where is the amount of gas sorbed at time , is the desorption constant (in g/meq), and is the initial sorption rate (in meq/g·min). According to this model, a plot of versus would provide a linear trend [42].
2.4.2. Diffusion-Type Models
Sorption kinetics may be described from a systematic point of view. Of the three steps involved in the diffusion kinetic category described above, mass action is very rapid, and therefore considered negligible in kinetic analysis [25]. The Weber–Morris intra-particle diffusion (IPD) model and its parameters provide significant information in order to determine whether film diffusion or intra-particle diffusion is the rate-limiting step. The IPD model demonstrates that in numerous sorption studies, the ion solute uptake varies almost proportionately with rather than with time [11,25,26]. If diffusion is the sorption mechanism, then the plot of versus , as expressed in Equation (9) is linear [11,25,26,42,43]:
where (in meq/g·min) is the intra-particle diffusion rate constant, and (in meq/g) is a constant representing the thickness of the boundary layer [42,43]; the greater the value, the greater the boundary layer effect. Further, the intra-particle diffusion mechanism specifically is the sole-limiting step when this plot intersects the origin [25,42]. When the sorption process is controlled by more than one diffusion mechanism, then the data plot deviates from the origin with a multi-linear trend. The initial steep phase implies that the external resistance to mass transfer surrounding the particles is significant, representing macropore and mesopore diffusion. The second gradual phase implies micropore intra-particle diffusion as the rate-limiting step [42].
The mechanism study conducted by Sprynskyy et al. [4] demonstrates that the sorption of HMIs (Pb2+, Cu2+, Ni2+, Cd2+) by natural zeolite is a heterogeneous process with three distinct stages. First, a very fast (instantaneous) uptake occurs within the first 30 min, observed for four HMIs at three different concentrations. This is followed by inversion due to desorption prevalence, observed predominantly for Ni2+ at all concentrations and overall increases for all four HMIs at higher metal concentrations. Finally, a slower uptake increase of all four HMIs is observed, with a majority of Ni2+ occurring in the first stage. In the kinetic studies of HMI uptake (Fe3+, Cu2+, Mn2+, Zn2+) by natural zeolite conducted by Motsi et al. [38], the initial stage of rapid adsorption occurs within the first 40 min of contact. This is when all of the adsorption sites are available for cation interaction to occur, and when the concentration difference between the influent stock and sorbent–sorbate interface is very high. Inglezakis et al. [23] credits this period to ion exchange in the micropores on the zeolite particles’ surface. During the second stage, desorption prevalence is most likely caused by slower diffusion of exchangeable co-ions within the internal network (Ca2+, Na+, K+) of the zeolite crystalline framework, and consequently occupies the exchange positions on the surface to the counterions (HMIs) in solution. During the third stage, a gradual sorption in the micropores within the crystalline occurs. Deceleration in the close micropores within the framework is connected by poor access as well as by more intensive sorption in comparison with in the surface micropores.
Jovanovic et al. [45] summarize several literature review findings of kinetic models of the sorption of HMIs from aqueous solutions by natural clinoptilolite. Although not valid in all conditions, the PSO model was selected by the researchers as the best representation of the sorption process. However, the system specific presumptions of operative conditions (i.e., sorbent particle size, counterions’ initial concentration, temperature, pH level, agitation, etc.) must be stated, which affect the mechanisms involved. The experimental data that fits to the PSO model indicates that chemisorption (chemical reaction) is the rate-limiting step [1], which is the case if the rate coefficient is constant for each operative condition. As shown in the research conducted by Motsi et al. [1], if any of these conditions are not satisfied, chemisorption is not the rate-determining step even if the data fits the PSO kinetic model well. Motsi et al. [1] determined that intra-particle diffusion is the primary rate-determining step in the uptake of HMIs (Fe3+, Cu2+, Mn2+, Zn2+) by natural zeolite and suggested that electric transference during intra-particle diffusion is a significant event in the sorption process.
Based on the above discussion and preliminary research findings, the study presented in this paper will be carried out with these two selected models: (1) the PSO reaction model and (2) the IPD model. The objective is to observe the various uptake rates and mechanisms associated of the two models, thereby resulting in an assessment and comparison of the final performance of the two kinetic models developed from distinctly different premises.
3. Results and Discussion
3.1. Acidity Levels
Previous research conducted by Ciosek and Luk [32] investigates the selective interaction of natural zeolite with HMIs, with the explicit focus of the sorption of the lead (Pb2+) ion; both quantitatively and qualitatively. Its critical review of literature reveals that the acidity of the aqueous solution affects the uptake of these HMIs, which is supported by the findings of Ersoy and Celik [24] and Inglezakis et al. [29]. This influence of acidity is particularly the case for HMIs that are in rather low preference by zeolite. The initial pH level of the solution must be attentively selected to ensure a balance among all ionic species. The goal is to avoid precipitation; for once precipitated, the ions of interest cannot be sorbed. Also, the structural stability of the sorbent should not be compromised. For example, the structure of clinoptilolite breaks down at pH levels below 1 in a process termed ‘dealumination’ [29].
The two-way reversible relationship between the hydrolysis and hydration of metals [29] is presented in Equation (10). At a lower acidity, the reaction is shifted to the left and more highly charged metal complexes are formed [29], with inorganic ligands such as OH— [46].
However, this condition is not favourable as the hydrogen cation (H+) is considered as a competitive ion to the targeted HMIs in solution during the sorption process, adversely affecting the overall uptake [29]. The degree of metal complex formation depends on the pH level as well as the ionic composition and HMI of interest. Accordingly, the metal speciation influences the sorbent’s removal efficiency and the preference to a given metal is affected by the metal complex characteristics [29] that predominate at a given pH level [46].
The acidity effects on the uptake of Pb2+, Cu2+, Fe3+, Cr3+ investigated by Inglezakis et al. [29] determined that the lead ion uptake in particular remained stable in a pH rage of 2 to 4; which is an indication of the high preferential level by that of zeolite. The kinetic study conducted by Kocaba et al. [26] invested a pH range of 1–10 on the removal of Cd2+, Cu2+, and Ni2+. The sorption percentages were increased sharply after a pH of 4 for all HMIs. The sorption of Ni2+ remains almost constant up to a pH of 2, and increased sharply beyond this level. The uptake of Ni2+ reached 86.5% at a pH of 6, to a maximum uptake of 91.9% at a pH of 10. The sorption of Cu2+ increased sharply after a pH of 4 to reach 75.4% uptake, then increased gradually to 88.9% at a pH of 6 then 97.6% at a pH 10. The pH of 6 was chosen as the optimum studying pH to avoid precipitation of HMIs. Generally, it was observed that sorption of HMIs increased by increasing the pH value. Most of the heavy metal ions tend to form precipitation at pH higher than 6, which limits this process greatly. Bektas and Kara [11] reported that the removal of lead ions by clinoptilolite occurs by ion exchange and physical adsorption when the pH level is below 6, and the precipitation of Pb2+ ions in the form of Pb(OH)2 increases above this pH level. Therefore, the sorption of HMIs by zeolite is challenging to quantify at a pH level greater than 6, and the actual sorption could be masked by precipitation [26].
With these major conclusions taken into consideration, the prepared influent stock was acidified to a level of 2 to avoid the risk of precipitation [29], and was prepared consistently for all HMI component system combinations. Following sorbate-sorbent contact, the pH is observed to be steady throughout the sorption process. The maximum recorded pH values are 2.16, 2.21, 2.19, and, 2.17 for the single-, dual-, triple-, and multi-component systems, respectively; for both at day of zeolite exposure and the day after of filtered sample. The pH levels of the prepared influent stock and filtered effluent are also observed to be consistent during refrigerated storage prior to dilution preparation for elemental analysis. Further evaluation of the Canada-Wide Survey of Acid Mine Drainage [35] reports a seasonal average of a majority of the mines surveyed to have documented pH values ranging from 2 to 5. This present study was conducted in the conservative manner, with all pH values documented to be below this reported average and within comparability. By maintaining very low pH levels in the batch experiments and the use of highly soluble nitrate salts, the precipitation of the HMIs is avoided. Additional trials verified that the filtered and unfiltered HMI influent stock concentrations are the same, indicating both effective dilution practices and complete solubility. Therefore, the concentration of each HMI before and after batch sorption is exclusively in soluble form.
3.2. Heavy Metallic Ion Levels
The ICP-AES results of the various component systems at 3 contact hours are summarized in Table 1, Table 2 and Table 3. The primary wavelengths ‘Analyte’ are given in Column 1, and the ‘Sample ID’ in Column 2 provides the systems’ influent stock (S) and 180 contact minute data. In order to keep all concentrations within the calibration range of 0–100 mg/L, the samples were diluted by 50% with deionized distilled water, indicated by the superscript value. As observed in the quality control measures for the calibration standard, the %RSD values are low and all within <3% as given in Column 3, which is indicative that the data is accurate and the experimental replicates are reliable [41]. Triplicate readings and their mean concentrations in calibration units in mg/L are presented in Column 4. The dilution factors in Column 2 are applied to the triplicate concentrations, and the corresponding HMI concentrations are given in Column 5. By applying Equation (1), the uptake sorption capacity is given in Column 6. The percent removal after 180 contact minutes is calculated in Column 7. Before kinetic analysis is conducted, the overall removal efficiency order indicates that the lead ion (Pb2+) is highest compared to the four other HMIs investigated. This order is consistently high regardless of the component system combinations [27,28].
Figure 1 represents the percent removal of the total HMIs found in the single-lead [P], triple-(lead-copper-iron) [T], and multi-[M] component systems over the 3 hour analysis period. The HMIs are progressively added to the aqueous solution while maintaining the total HMI concentration of 10 meq/L. The overall uptake is reduced from [P] to [T] by 0.0599 meq/g or 31.23%, and from [T] to [M] by 0.0334 meq/g or 25.28%. It is visually evident that the each HMI in solution distinctively impacts the overall uptake. An equilibrium state has yet to be reached based on the established experimental conditions. Yet, the curve-to-plateau trend shows three distinct stages, where rapid uptake is observed within the first 45 contact minutes; as demonstrated by Sprynskyy et al. [4] and Motsi et al. [38]. This is a first glimpse in this study of zeolite’s preference for the HMIs to be investigated, indicative of the long-term trends.
3.3. Sorption Kinetics
The selected kinetic relationships are analysed for all five HMIs and component systems, in both their individual and total combinations. The PSO rate constants and correlation coefficients are summarized in Table 4. Based on the linearized form of Equation (6), the slope (m) and y-intercept (b) values are interpreted to determine the theoretical sorption at equilibrium (), overall sorption rate constant (), and initial sorption rate (). The IPD rate constants and correlation coefficients are summarized in Table 5. Based on Equation (9), the slope and y-intercept represent the corresponding diffusion rate constant () and boundary constant (), respectively.
An impressive performance is observed in the correlation coefficient (CC) for both models of all the component system combinations. For the PSO model, 64.1% of the data falls within 0.95–1.0 CC range (excellent), while 84.6% has a CC of over 0.90 (good), and 87.2% has a CC over 0.85 (acceptable). For the IPD model, Equation (9) is applied in two scenarios with respect to the origin. For the first scenario (at originA), 64.1% of the data falls within the excellent range, while 82.1% within the good range and 87.2% within the acceptable range. For the second scenario (deviation from originB), 79.5% of the data falls within the excellent range, while 94.9% within the good range. It is important to note that the boundary constant () values observed are very small to be considered negligible, with 35.9% of the data showing a negative value with no physical meaning [42,43]. When comparing the diffusion rate constant () values, an average of positive values differs by only 0.0004 meq/g·min between the two scenarios, demonstrating that the slopes () are very similar. Although a stronger CC is observed when deviation from the origin, it may be stated with confidence that intra-particle diffusion is the leading diffusion mechanism to represent the sorption process. Of the excellent CC range, the data correlated at 0.99 or above to unity is only 4.0% (1 of 25) by the IPD model while 48.0% (12 of 25) by the PSO model. As discussed by Bektas and Kara [11], a stronger correlation is observed by the PSO kinetic rate expression.
A significantly low correlation is observed for the singular uptake of the Zn2+ ion in the [D-PZ], [D-FZ], [D-NZ], and [M] component systems when observed by the PSO model. The Ni2+ ion in the [N], [D-PN], [D-CN] and [D-NZ] component systems also demonstrates a weaker correlation in its singular uptake when observed by the IPD model. However, due to zeolite’s lower selectivity to these ions, the overall uptake in each combined component system is not significantly affected by these incurred outliers. Based on the initial sorption rate determined by the PSO kinetic model given in Table 4, the single-component system of lead (Pb2+) [P] achieves the greatest rate at 0.0046 meq/g·min among the HMI investigated. In the dual-component systems, the overall uptake of HMI containing Pb2+ was on average 0.0037 meq/g·min. For the dual-component systems without Pb2+, the uptake rate was on average 0.0016 meq/g·min. The initial sorption rate in the triple- and multi-component systems were observed as 0.0042 and 0.0033 meq/g·min, respectively. This kinetic analysis has demonstrated that the initial uptake rate is most improved with the presence of lead.
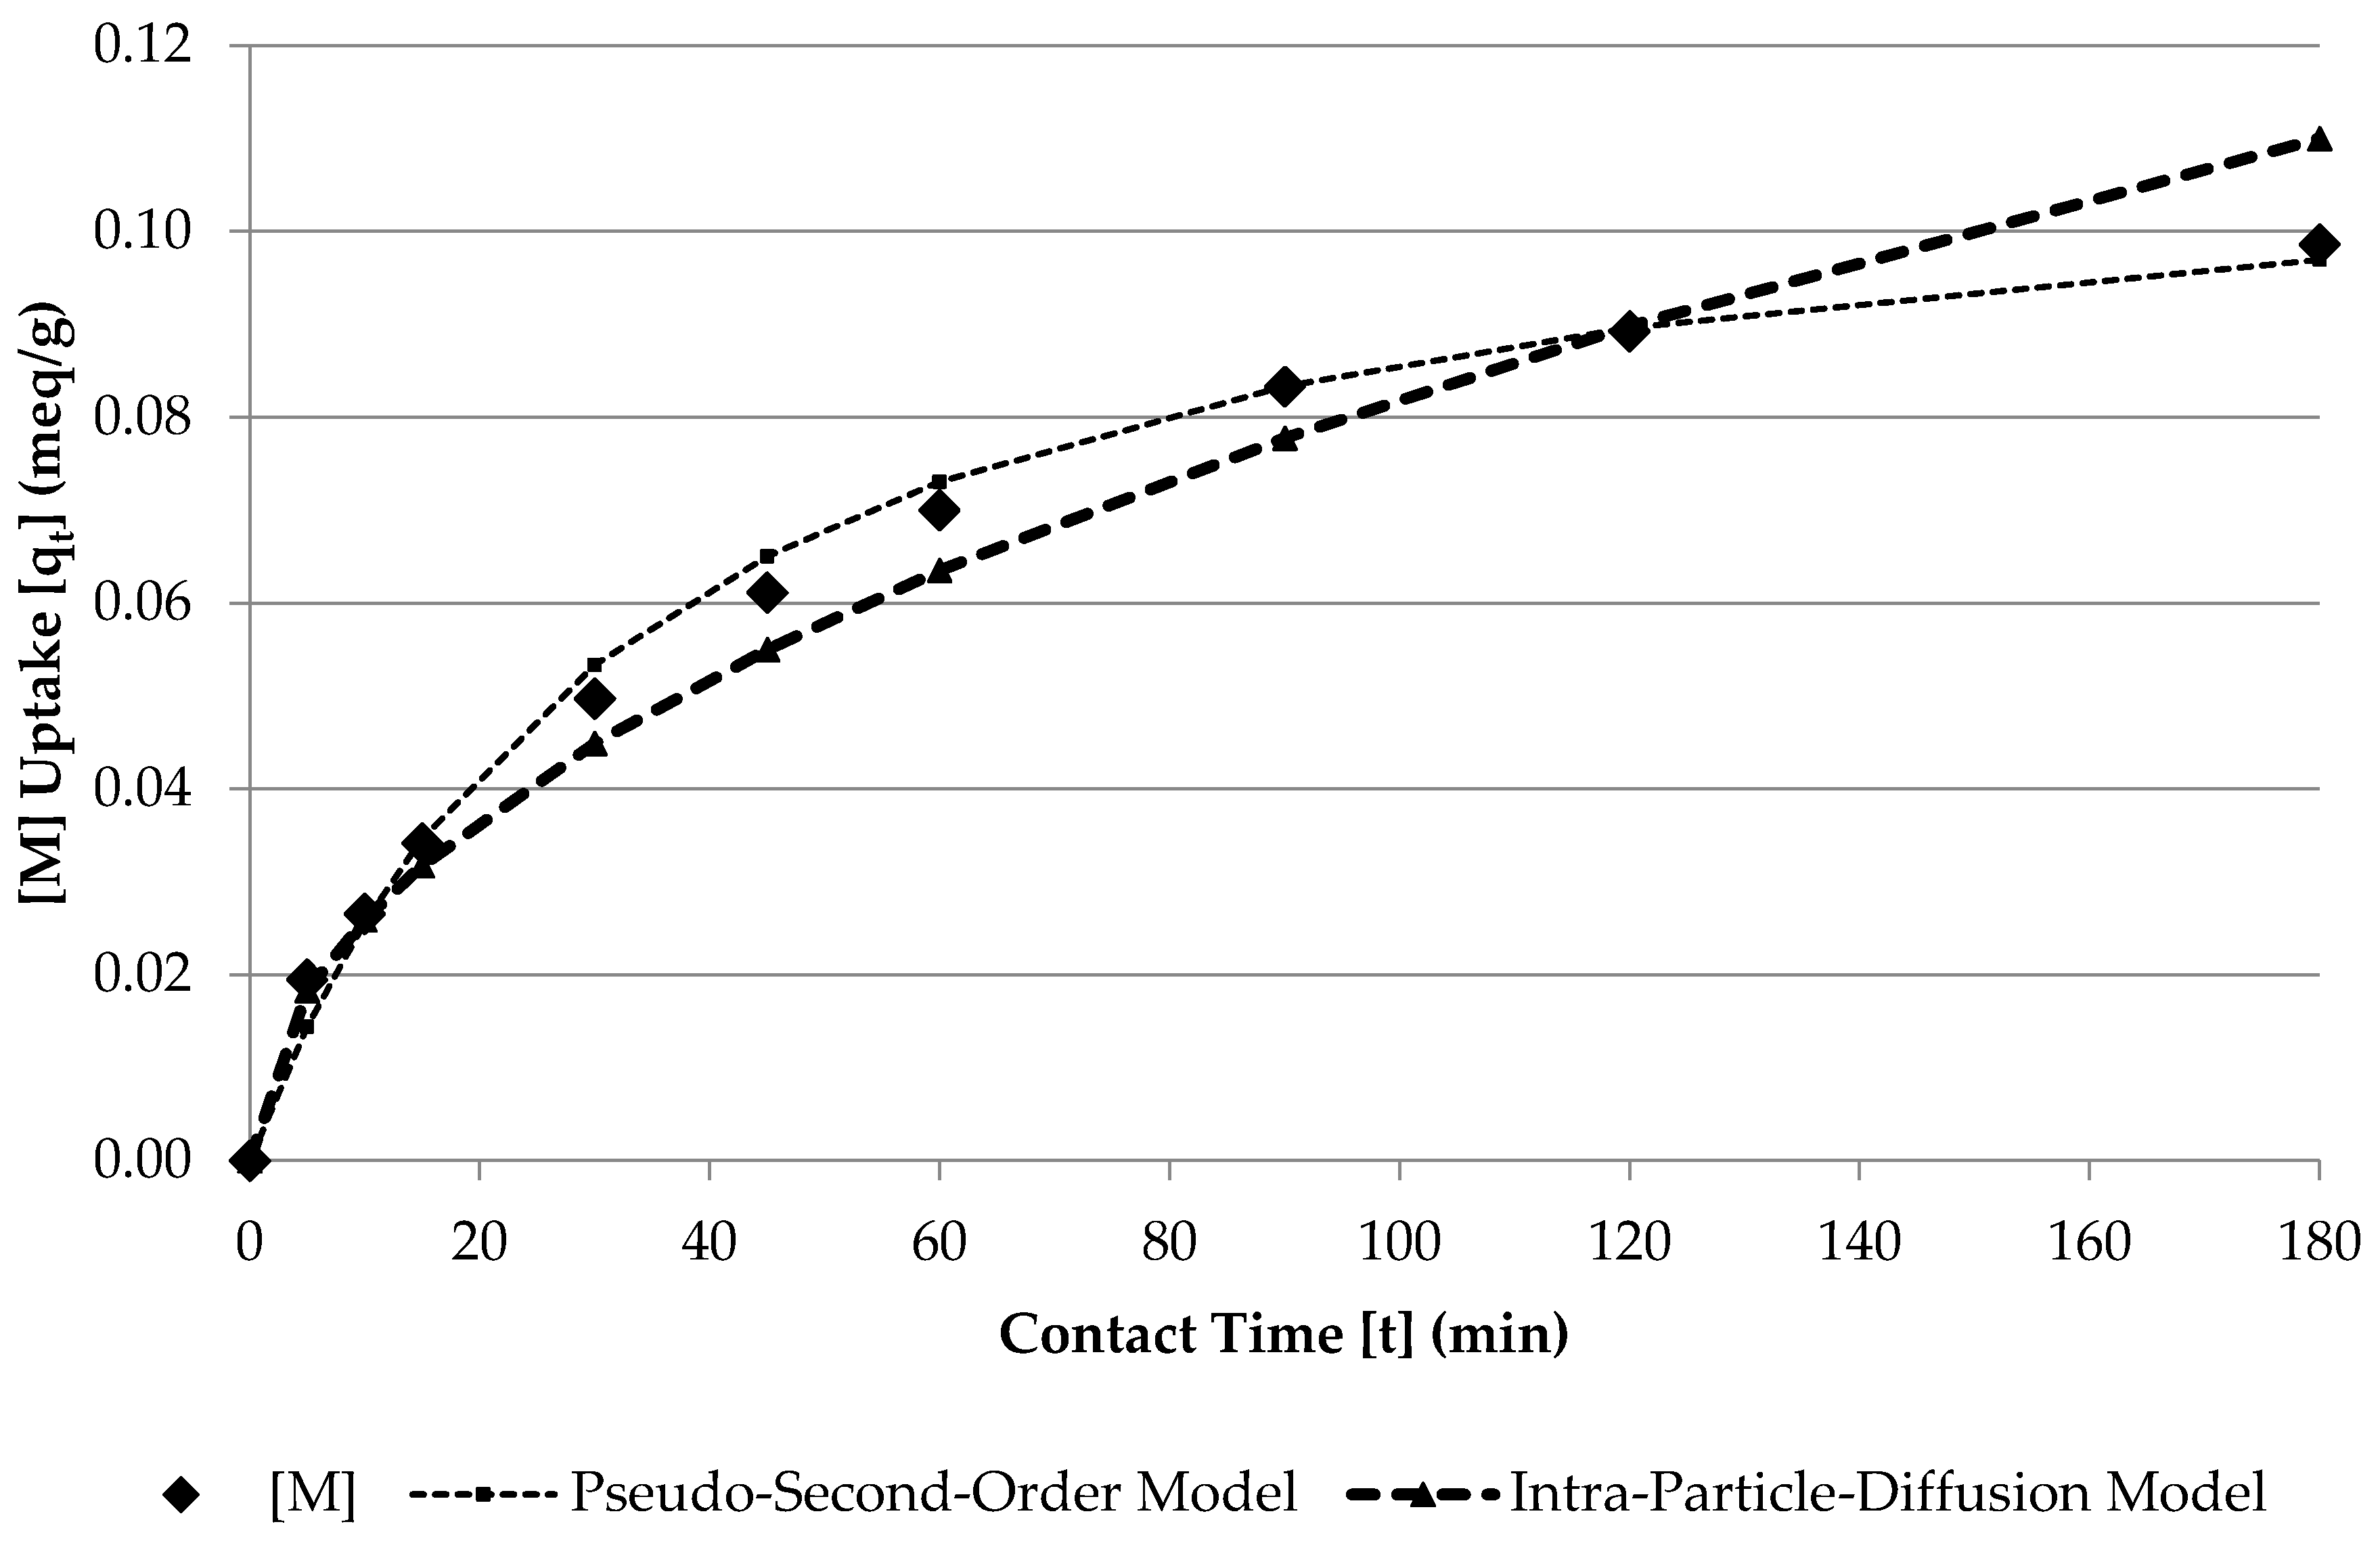
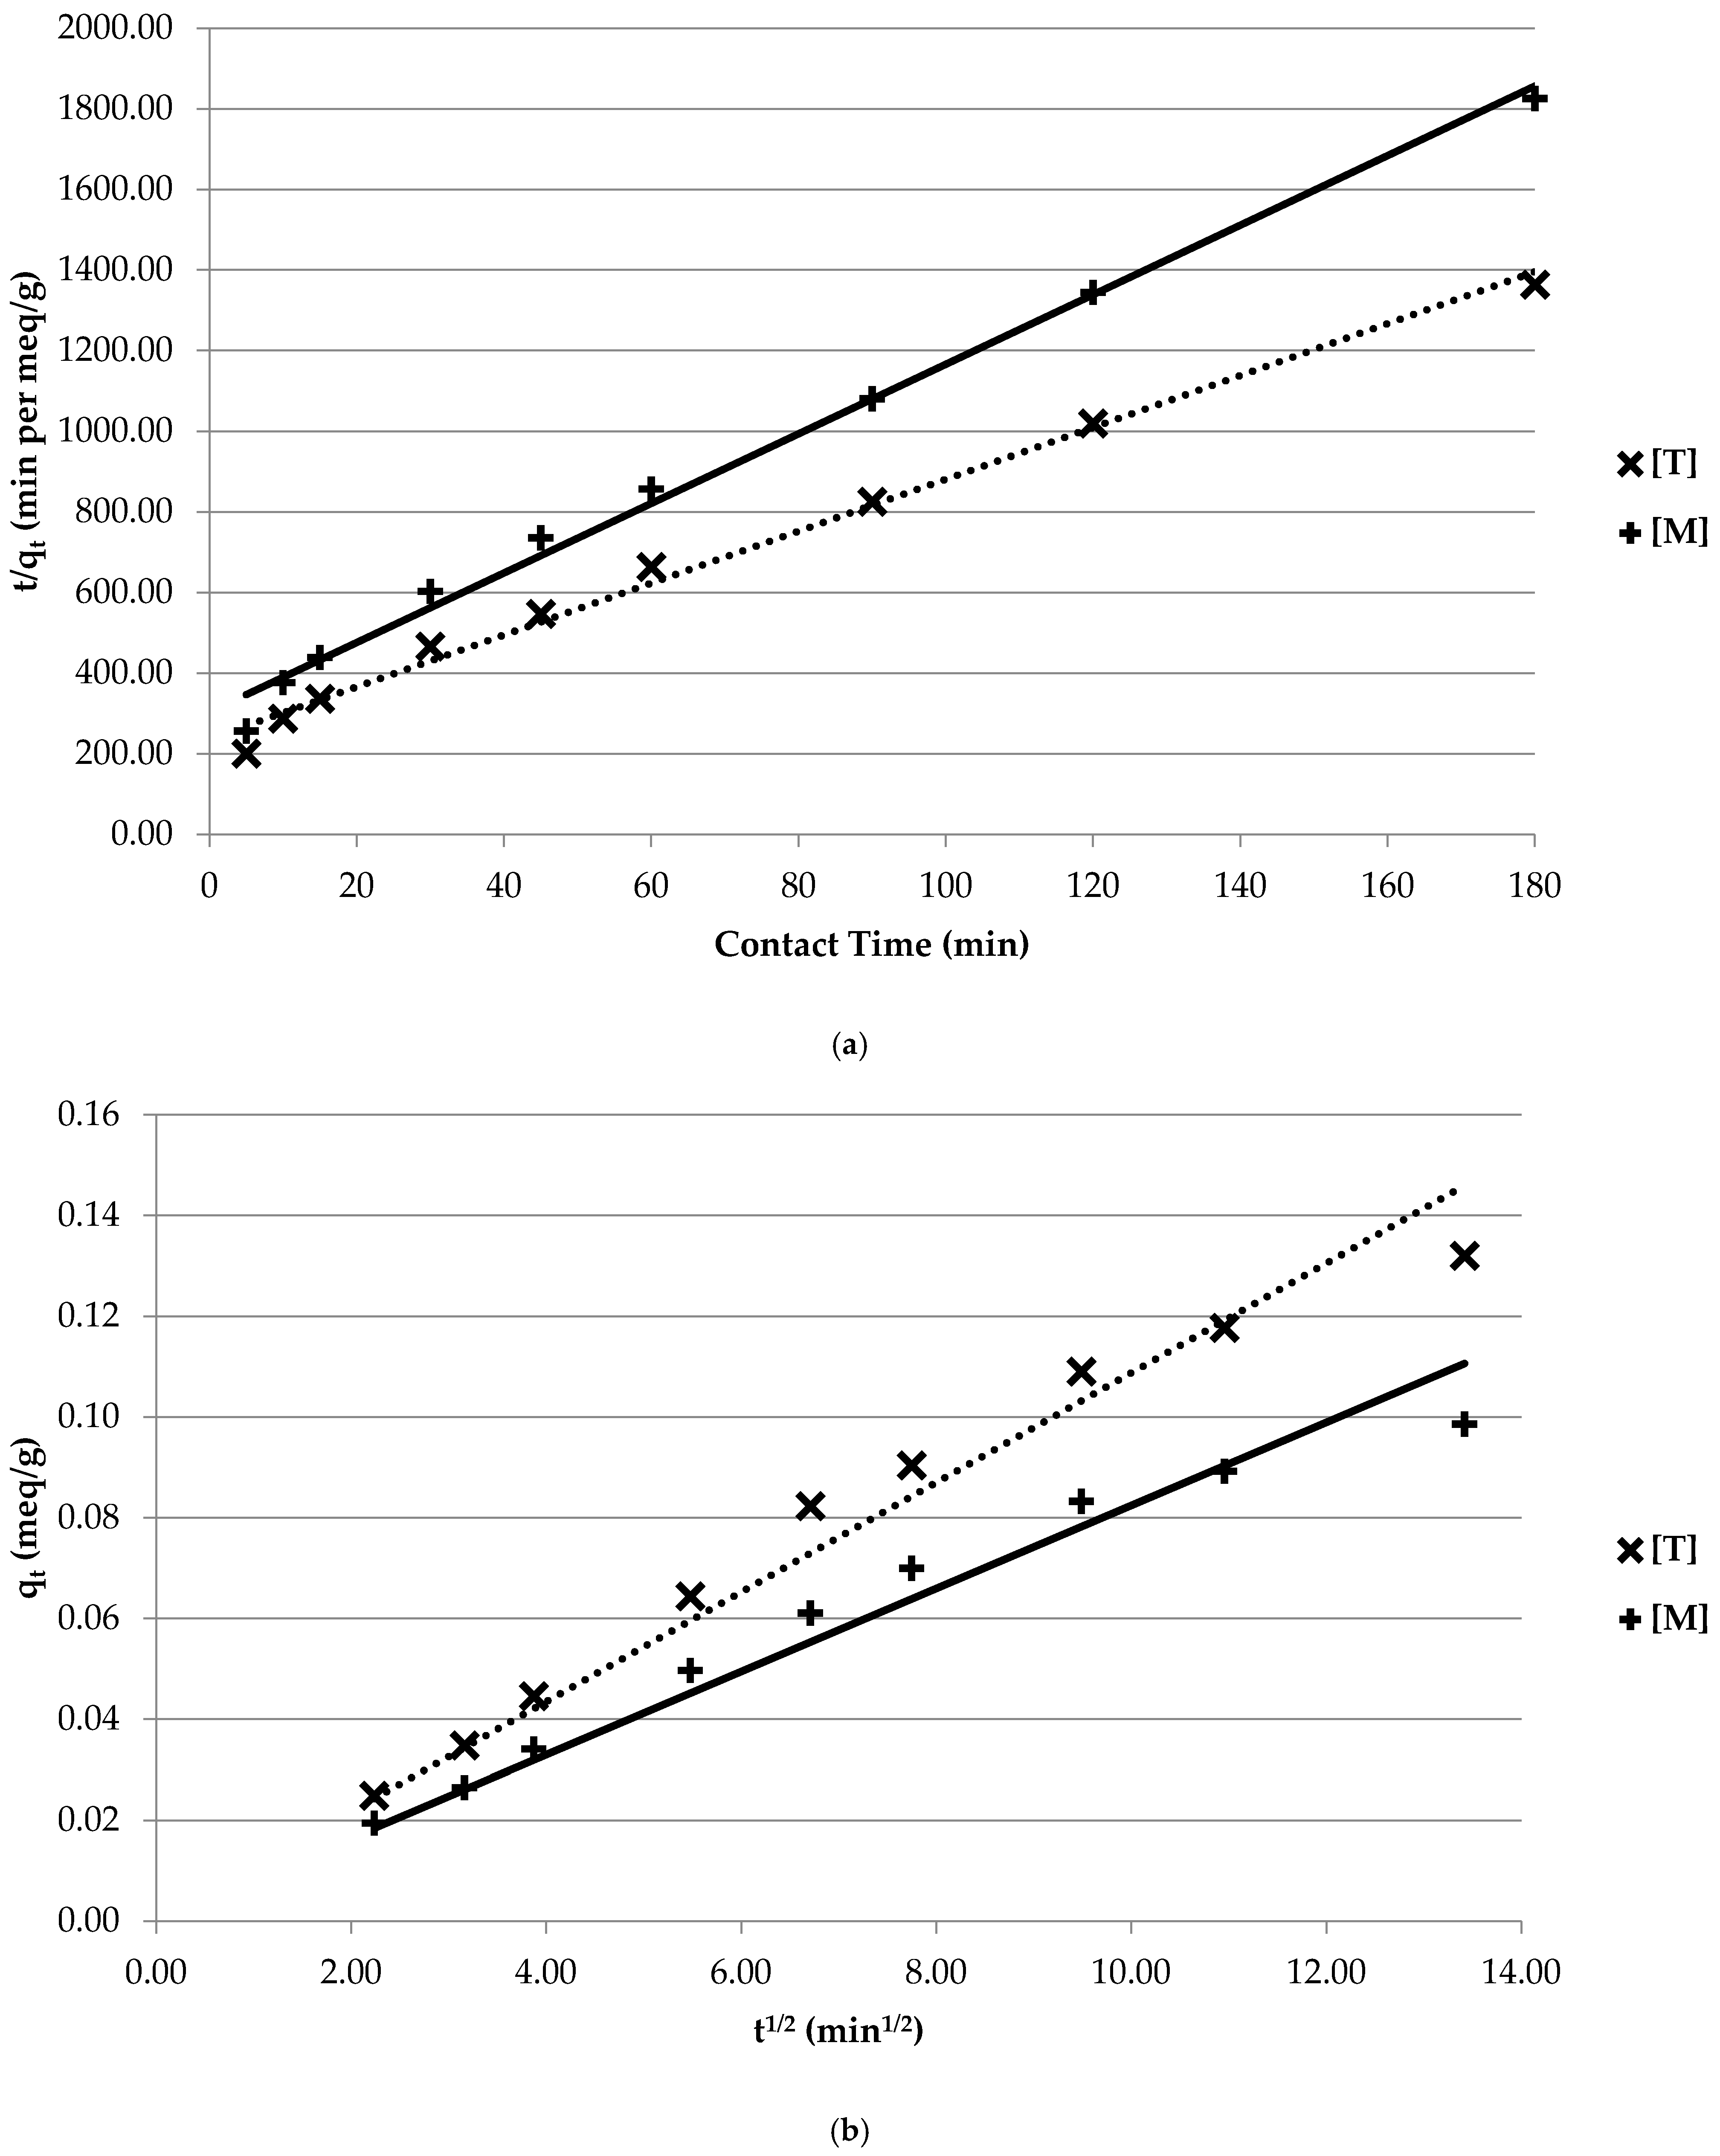
The trendlines’ equations displayed in Table 4 and Table 5 are applied to the kinetic models for the total HMI uptake of the various component systems, and shown for visual comparisons in Figure 2, Figure 3 and Figure 4. Figure 5 presents the uptake () of all five HMIs in the [M] multi-component system over the three-hour contact period, with both kinetic models applied in linearized form based on Equation (7) and excluding the boundary constant of Equation (9). It is observed that even for this most complicated system containing all five HMIs [M], it is evident that a stronger correlation, at a CC of 0.9931, is achieved with the PSO rate model.
The data presented in Table 6 provide compelling insight into the removal efficiency and the zeolite’s selectivity to the five HMIs investigated in this study. When comparing the total HMI uptake at three contact hours to the theoretical equilibrium values generated by the PSO model of each system, an average of 83.5% of the equilibrium uptake is achieved. In the single-component systems, the uptake of [P] is highest, followed by [F], [C], [Z], and [N]. Only 78.7% of [P] at equilibrium is achieved, whereas 93.5% of [N] at equilibrium is observed. At the opposite end of removal efficiency, there is this significant difference in overall uptake. In the dual-component systems, the [D-PF] is the greatest uptake and the [D-NZ] is the least. The overall HMI uptake is increased by an average of approximately 0.0778 meq/g or 151.6% when combined with Pb2+; when comparing [C], [F], [N], and [Z] to [D-PC], [D-PF], [D-PN] and [D-PZ], respectively. For the dual-systems without Pb2+, the presence of Fe3+ improves the uptake in [D-CF] and [D-FZ] by 53.2% and 58.1%, respectively; the Ni2+ hinders the overall uptake in [D-CN] and [D-NZ] by 9.0% and 37.1%, respectively. The combination of lead, copper and iron in the triple-component system increases the [D-PC] and [D-CF] by 5.2% and 61.5%, respectively; but the inclusion of Cu2+ decreases the [D-PF] by 9.8%. Once again, the Pb2+ ion has the greatest improvement to the overall uptake of a given system. In the multi-component system, the introduction of Ni2+ and Zn2+ impedes on the total HMI uptake in the triple system [T] by 25% for both the experimental and theoretical equilibrium data. This demonstrates that each HMI impacts the zeolite’s ability to sorb those co-ions in solution.
As reported in Table 6, the zeolite removal efficiency order based on the experimental and theoretically derived equilibrium HMI uptake data is observed as Pb2+ >> Fe3+ > Cu2+ > Zn2+ > Ni2+. This selectivity trend is also observed in other experimental findings, including Wang and Peng [18], Inglezakis et al. [23,29]. Current research on the HMI sorption capacity of natural zeolites and other sorbent materials is summarized in Table 7. Accordingly, the natural zeolite employed in this study compare favourably and within trend based on the major findings of current research endeavours.
It is important to note that the process variables of the zeolite source and particle size, initial concentration, temperature, pH level, as well as agitation speed were kept constant in this study. This was maintained in order to create a purposeful experimental design, with feasibility, to best observe the impact of the heavy metallic ions in combination. Although the pseudo-second-order kinetic model has demonstrated the strongest representation of the data in uptake over time, to declare the reaction based mechanism of chemisorption as the overall rate-limiting step is not the objective of this study. Accordingly, the variation of the process variables would be required to make that statement. Rather, this study has investigated simultaneous sorption of the HMIs, with the uptake and rate of interference of these HMIs in numerous component system combinations quantified. The selected reaction and diffusion kinetic models demonstrated in this study have provided greater insight into the associated mechanisms prior to equilibrium of the overall sorption process.
4. Conclusions
The sorption kinetics of the multiple heavy metallic ions (HMIs) predominantly found in mine wastewater has been investigated. With the systematic experimental design of five HMIs and zeolite in its natural state, the sorption uptake rate and subsequent interference of these HMIs in combination has been quantified and modelled. Both the pseudo-second-order (PSO) and intra-particle diffusion kinetic model demonstrate a very strong correlation of the extensive experimental data. However, the PSO model demonstrated a stronger performance, and further contributed to the assessment of the zeolite mineral performance and the fundamental mechanisms associated with the sorption process. Usually, the equilibrium sorption capacity is unknown. The process of chemisorption is significantly slow, and the sorbed amount is smaller than that at equilibrium. Study limitations include the fact that the time required to reach equilibrium is very long in various sorption systems. Although rapid uptake was observed in the first 45 min, the desired balanced state is achieved beyond the analysis period of kinetic analysis. A significant improvement to this study would be to extend the three-hour contact time, in order to associate the equilibrium state capacity experimentally and theoretically, as well as evaluate various operative conditions to generate further insight into associated mechanisms. Nevertheless, the PSO model provides insight of the sorption capacity, initial sorption rate and overall rate coefficients devoid of any parameter in advance [44]. Future work on this research project will focus on the interaction of heavy metallic ions in the multi-component system combination using natural zeolite in continuous mode, with the design of an innovative dual-column fixed bed reactor sorption treatment system. This research has demonstrated that natural zeolite is an effective sorbent medium alternative in the removal of HMIs found in industrial wastewater, and has contributed to the further development of treatment systems.
Acknowledgments
This research was conducted with the financial support of an NSERC Discovery Grant to Grace K. Luk.
Author Contributions
Amanda L. Ciosek and Grace K. Luk conceived and designed the experiments; Amanda L. Ciosek performed the experiments and analytical simulations, and analysed the data; Amanda L. Ciosek and Grace K. Luk wrote the paper.
Conflicts of Interest
The authors declare no conflict of interest.
References
- Motsi, T.; Rowson, N.A.; Simmons, M.J.H. Kinetic studies of the removal of heavy metals from acid mine drainage by natural zeolite. Int. J. Miner. Process. 2011, 101, 42–49. [Google Scholar] [CrossRef]
- Akcil, A.; Koldas, S. Acid Mine Drainage (AMD): Causes, treatment and case studies. J. Clean. Prod. 2006, 14, 1139–1145. [Google Scholar] [CrossRef]
- Erdem, E.; Karapinar, N.; Donat, R. The removal of heavy metal cations by natural zeolites. J. Colloid Interface Sci. 2004, 280, 309–314. [Google Scholar] [CrossRef] [PubMed]
- Sprynskyy, M.; Buszewski, B.; Terzyk, A.P.; Namiesnik, J. Study of the selection mechanism of heavy metal (Pb2+, Cu2+, Ni2+, and Cd2+) adsorption on clinoptilolite. J. Colloid Interface Sci. 2006, 304, 21–28. [Google Scholar] [CrossRef] [PubMed]
- Acheampong, M.A.; Meulepas, R.J.W.; Leans, P.N.L. Removal of heavy metals and cyanide form gold mine wastewater. J. Chem. Technol. Biotechnol. 2010, 85, 590–613. [Google Scholar] [CrossRef]
- Acheampong, M.A. Sustainable Gold Mining Wastewater Treatment by Sorption Using Low-Cost Materials. Ph.D. Thesis, UNESCO-IHE Institute of Water Education, Delft, The Netherlands, 2013. [Google Scholar]
- Nezamzadeh-Ejhieh, A.; Shahanshahi, M. Modification of clinoptilolite nano-particles with hexadecylpyridynium bromide surfactant as an active component of Cr(VI) selective electrode. J. Ind. Eng. Chem. 2013, 19, 2026–2033. [Google Scholar] [CrossRef]
- Muttil, N.; Chau, K.W. Machine learning paradigms for selecting ecologically significant input variables. Eng. Appl. Artif. Intell. 2007, 20, 735–744. [Google Scholar] [CrossRef]
- Wang, W.C.; Xu, D.M.; Chau, K.W.; Lei, G.J. Assessment of river water quality based on theory of variable fuzzy sets and fuzzy binary comparison method. Water Resour. Manag. 2014, 28, 4183–4200. [Google Scholar] [CrossRef]
- Zhao, M.Y.; Cheng, C.T.; Chau, K.W.; Li, G. Multiple criteria data envelopment analysis for full ranking units associated to environment impact assessment. Int. J. Environ. Pollut. 2006, 28, 448–464. [Google Scholar] [CrossRef]
- Bektas, N.; Kara, S. Removal of lead from aqueous solutions by natural clinoptilolite: Equilibrium and kinetic studies. Sep. Purif. Technol. 2004, 39, 189–200. [Google Scholar] [CrossRef]
- Wang, C.; Li, J.; Sun, X.; Wang, L.; Sun, X. Evaluation of zeolites synthesized from fly ash as potential adsorbents for wastewater containing heavy metals. J. Environ. Sci. 2009, 21, 127–136. [Google Scholar] [CrossRef]
- Anari-Anaraki, M.; Nezamzadeh-Ejhieh, A. Modification of an Iranian clinoptilolite nano-particles by hexadecyltrimethyl ammonium cationic surfactant and dithizone for removal of Pb(II) from aqueous solution. J. Colloid Interf. Sci. 2015, 440, 272–281. [Google Scholar] [CrossRef] [PubMed]
- Borandegi, M.; Nezamzadeh-Ejhieh, A. Enhanced removal efficiency of clinoptilolite nano-particles toward Co(II) from aqueous solution by modification with glutamic acid. Colloids Surfaces A Physicochem. Eng. Asp. 2015, 479, 35–45. [Google Scholar] [CrossRef]
- Curkovic, L.; Cerjan-Stefanovic, S.; Filipan, T. Metal ion exchange by natural and modified zeolites. Wat. Res. 1997, 31, 1379–1382. [Google Scholar] [CrossRef]
- Helfferich, F. Equilibria; Kinetics. In Ion Exchange; Series in Advanced Chemistry; McGraw-Hill Book Company: New York, NY, USA, 1962; pp. 95–322. [Google Scholar]
- Inglezakis, V.J.; Poulopoulos, S.G. Chapter 4—Adsorption and Ion-Exchange (Kinetics). In Adsorption, Ion Exchange and Catalysis—Design of Operations and Environmental Applications, 1st ed.; Elsevier Science: Amsterdam, The Netherlands, 2006; pp. 262–266, ISBN-13: 978-0-444-52783-7. [Google Scholar]
- Wang, S.; Peng, Y. Natural zeolites as effective adsorbents in water and wastewater treatment. Chem. Eng. J. 2010, 156, 11–24. [Google Scholar] [CrossRef]
- Fu, F.; Wang, Q. Removal of heavy metal ions from wastewaters: A review. J. Environ. Manag. 2011, 92, 407–418. [Google Scholar] [CrossRef] [PubMed]
- Tsitsishvili, G.V. Perspectives of Natural Zeolite Applications. Occurrence. In Properties and Utilization of Natural Zeolites—2nd International Conference 1985; Akademiai Kiado: Budapest, Hungary, 1988; pp. 367–393. [Google Scholar]
- Nezamzadeh-Ejhieh, A.; Shirzadi, A. Enhancement of the photocatalytic activity of Ferrous Oxide by doping onto the nano-clinoptilolite particles towards photodegradation of tetracycline. Chemosphere 2014, 107, 136–144. [Google Scholar] [CrossRef] [PubMed]
- Bekkum, H.V.; Flanigen, E.M.; Jansen, J.C. Ion-Exchange in Zeolites. In Introduction to Zeolite Science and Practice—Studies in Surface Science and Catalysis, 1st ed.; Elsevier Science: Zeist, The Netherlands, 1991; Volume 58, pp. 359–390. [Google Scholar]
- Inglezakis, V.J.; Loizidou, M.D.; Grigoropoulou, H.P. Equilibrium and kinetic ion exchange studies of Pb2+, Cr3+, Fe3+ and Cu2+ on natural clinoptilolite. Water Res. 2002, 36, 2784–2792. [Google Scholar] [CrossRef]
- Ersoy, B.; Celik, M.S. Electrokinetic properties of clinoptilolite with mono- and multivalent electrolytes. Micropor. Mesopor. Mater. 2002, 55, 305–312. [Google Scholar] [CrossRef]
- Qiu, H.; Lv, L.; Pan, B.C.; Zhang, Q.J.; Zhang, W.M.; Zhang, Q.X. Critical review in adsorption kinetic models. J. Zhejiang Univ. Sci. A 2009, 18, 716–724. [Google Scholar] [CrossRef]
- Kocaoba, S.; Orhan, Y.; Akyuz, T. Kinetics and equilibrium studies of heavy metal ions removal by use of natural zeolite. Desalination 2007, 214, 1–10. [Google Scholar] [CrossRef]
- Oter, O.; Akcay, H. Use of natural clinoptilolite to improve, water quality: Sorption and selectivity studies of lead(II), copper(II), zinc(II), and nickel(II). Water Environ. Res. 2007, 79, 329–335. [Google Scholar] [CrossRef] [PubMed]
- Panayotova, M.; Velikov, B. Kinetics of Heavy Metal Ions Removal by Use of Natural Zeolite. J. Environ. Sci. Health 2002, 37, 139–147. [Google Scholar] [CrossRef]
- Inglezakis, V.J.; Loizidou, M.D.; Grigoropoulou, H.P. Ion exchange of Pb2+, Cu2+, Fe3+, and Cr3+ on natural clinoptilolite: Selectivity determination and influence of acidity on metal uptake. J. Colloid Interface Sci. 2003, 261, 49–54. [Google Scholar] [CrossRef]
- Wingenfelder, U.; Hansen, C.; Furrer, G.; Schulin, R. Removal of Heavy Metals from Mine Waters from Natural Zeolites. Environ. Sci. Technol. 2005, 39, 4606–4613. [Google Scholar] [CrossRef] [PubMed]
- Bear River Zeolite Co. Inc. Zeolite—Specifications and MSDS. Available online: http://www.bearriverzeolite.com (accessed on 1 September 2012 and 1 April 2017).
- Ciosek, A.L.; Luk, G.K. Lead Removal from Mine Tailings with Multiple Metallic Ions. Int. J. Water Wastewater Treat 2017, 3, 1–9. [Google Scholar] [CrossRef]
- Inglezakis, V.J.; Hadjiandreou, K.J.; Loizidou, M.D.; Grigoropoulou, H.P. Pretreatment of Natural Clinoptilolite in a Laboratory-Scale Ion Exchange Packed Bed. Water Res. 2001, 35, 2161–2166. [Google Scholar] [CrossRef]
- Inglezakis, V.J.; Papadeas, C.D.; Loizidou, M.D.; Grigoropoulou, H.P. Effects of Pretreatment on Physical and Ion Exchange Properties of Natural Clinoptilolite. Environ. Technol. 2001, 22, 75–82. [Google Scholar] [CrossRef] [PubMed]
- Wilson, L.J. Canada-Wide Survey of Acid Mine Drainage Characteristics. Project Report 3.22.1—Job No. 50788. Mineral Sciences Laboratories Division Report MSL 94–32 (CR). Ontario Ministry of Northern Development and Mines. Mine Environment Neutral Drainage (MEND) Program: Canada, 1994. Available online: http://mend-nedem.org/wp-content/uploads/2013/01/3.22.1.pdf (accessed on 30 October 2014).
- Canadian Minister of Justice—Metal Mining Effluent Regulations. Consolidation SOR/2002-222. Justice Laws—Government of Canada. Available online: http://laws-lois.justice.gc.ca (accessed on 1 September 2014).
- Kragovic, M.; Dakovic, A.; Markovic, M.; Krstic, J.; Gatta, G.D.; Rotiroti, N. Characterization of lead sorption by natural and Fe (III)-modified zeolite. Appl. Surf. Sci. 2013, 283, 764–774. [Google Scholar] [CrossRef]
- Motsi, T.; Rowson, N.A.; Simmons, M.J.H. Adsorption of heavy metals from acid mine drainage by natural zeolite. Int. J. Miner. Process. 2009, 92, 42–48. [Google Scholar] [CrossRef]
- Rice, E.W.; Baird, R.B.; Eaton, A.D.; Clesceri, L.S. Part 1000-Introduction, Part 3000-METALS. In Standard Methods for the Examination of Water and Wastewater, 22nd ed.; APHA, AWWA, WEF: Washington, DC, USA, 2012; pp. 1.1-68–3.1-112. ISSN 978-087553-013-0. [Google Scholar]
- Perkin Elmer Inc. Atomic Spectroscopy—A Guide to Selecting the Appropriate Technique and System: World Leader in AA, ICP-OES, and ICP-MS; Perkin Elmer Inc.: Waltham, MA, USA, 2011. [Google Scholar]
- Perkin Elmer Inc. WinLab32 for ICP—Instrument Control Software, version 5.0; Perkin Elmer Inc.: Waltham, MA, USA, 2010. [Google Scholar]
- Fierro, V.; Torne-Fernandez, V.; Montane, D.; Celzard, A. Adsorption of phenol onto activated carbons having different textural and surface properties. Micropor. Mesopor. Mater. 2008, 111, 276–284. [Google Scholar] [CrossRef]
- Olu-Owolabi, B.I.; Diagboya, P.N.; Adebowale, K.O. Evaluation of pyrene sorption—Desorption on tropical soils. J. Environ. Manag. 2014, 137, 1–9. [Google Scholar] [CrossRef] [PubMed]
- Ho, Y.; Ofomaja, A.E. Pseudo-second-order model for lead ion sorption from aqueous solutions onto palm kernel fiber. J. Hazard. Mater. 2006, B129, 137–142. [Google Scholar] [CrossRef] [PubMed]
- Jovanovic, M.; Rajic, N.; Obradovic, B. Novel kinetic model of the removal of divalent heavy metal ions from aqueous solutions by natural clinoptilolite. J. Hazard. Mater. 2012, 233, 57–64. [Google Scholar] [CrossRef] [PubMed]
- Ouki, S.K.; Kavannagh, M. Treatment of metals-contaminated wastewaters by use of natural zeolites. Water. Sci. Technol. 1999, 39, 115–122. [Google Scholar] [CrossRef]
- Bosso, S.T.; Enzweiler, J. Evaluation of heavy metal removal from aqueous solution onto scolecite. Water. Res. 2002, 36, 4795–4800. [Google Scholar] [CrossRef]
- Cincotti, A.; Mameli, A.; Locci, A.M.; Orru, R.; Cao, G. Heavy metals uptake by Sardinian natural zeolites: Experiment and modeling. Ind. Eng. Chem. Res. 2006, 45, 1074–1084. [Google Scholar] [CrossRef]
Figure 1.
Total HMI percent removal versus contact time.
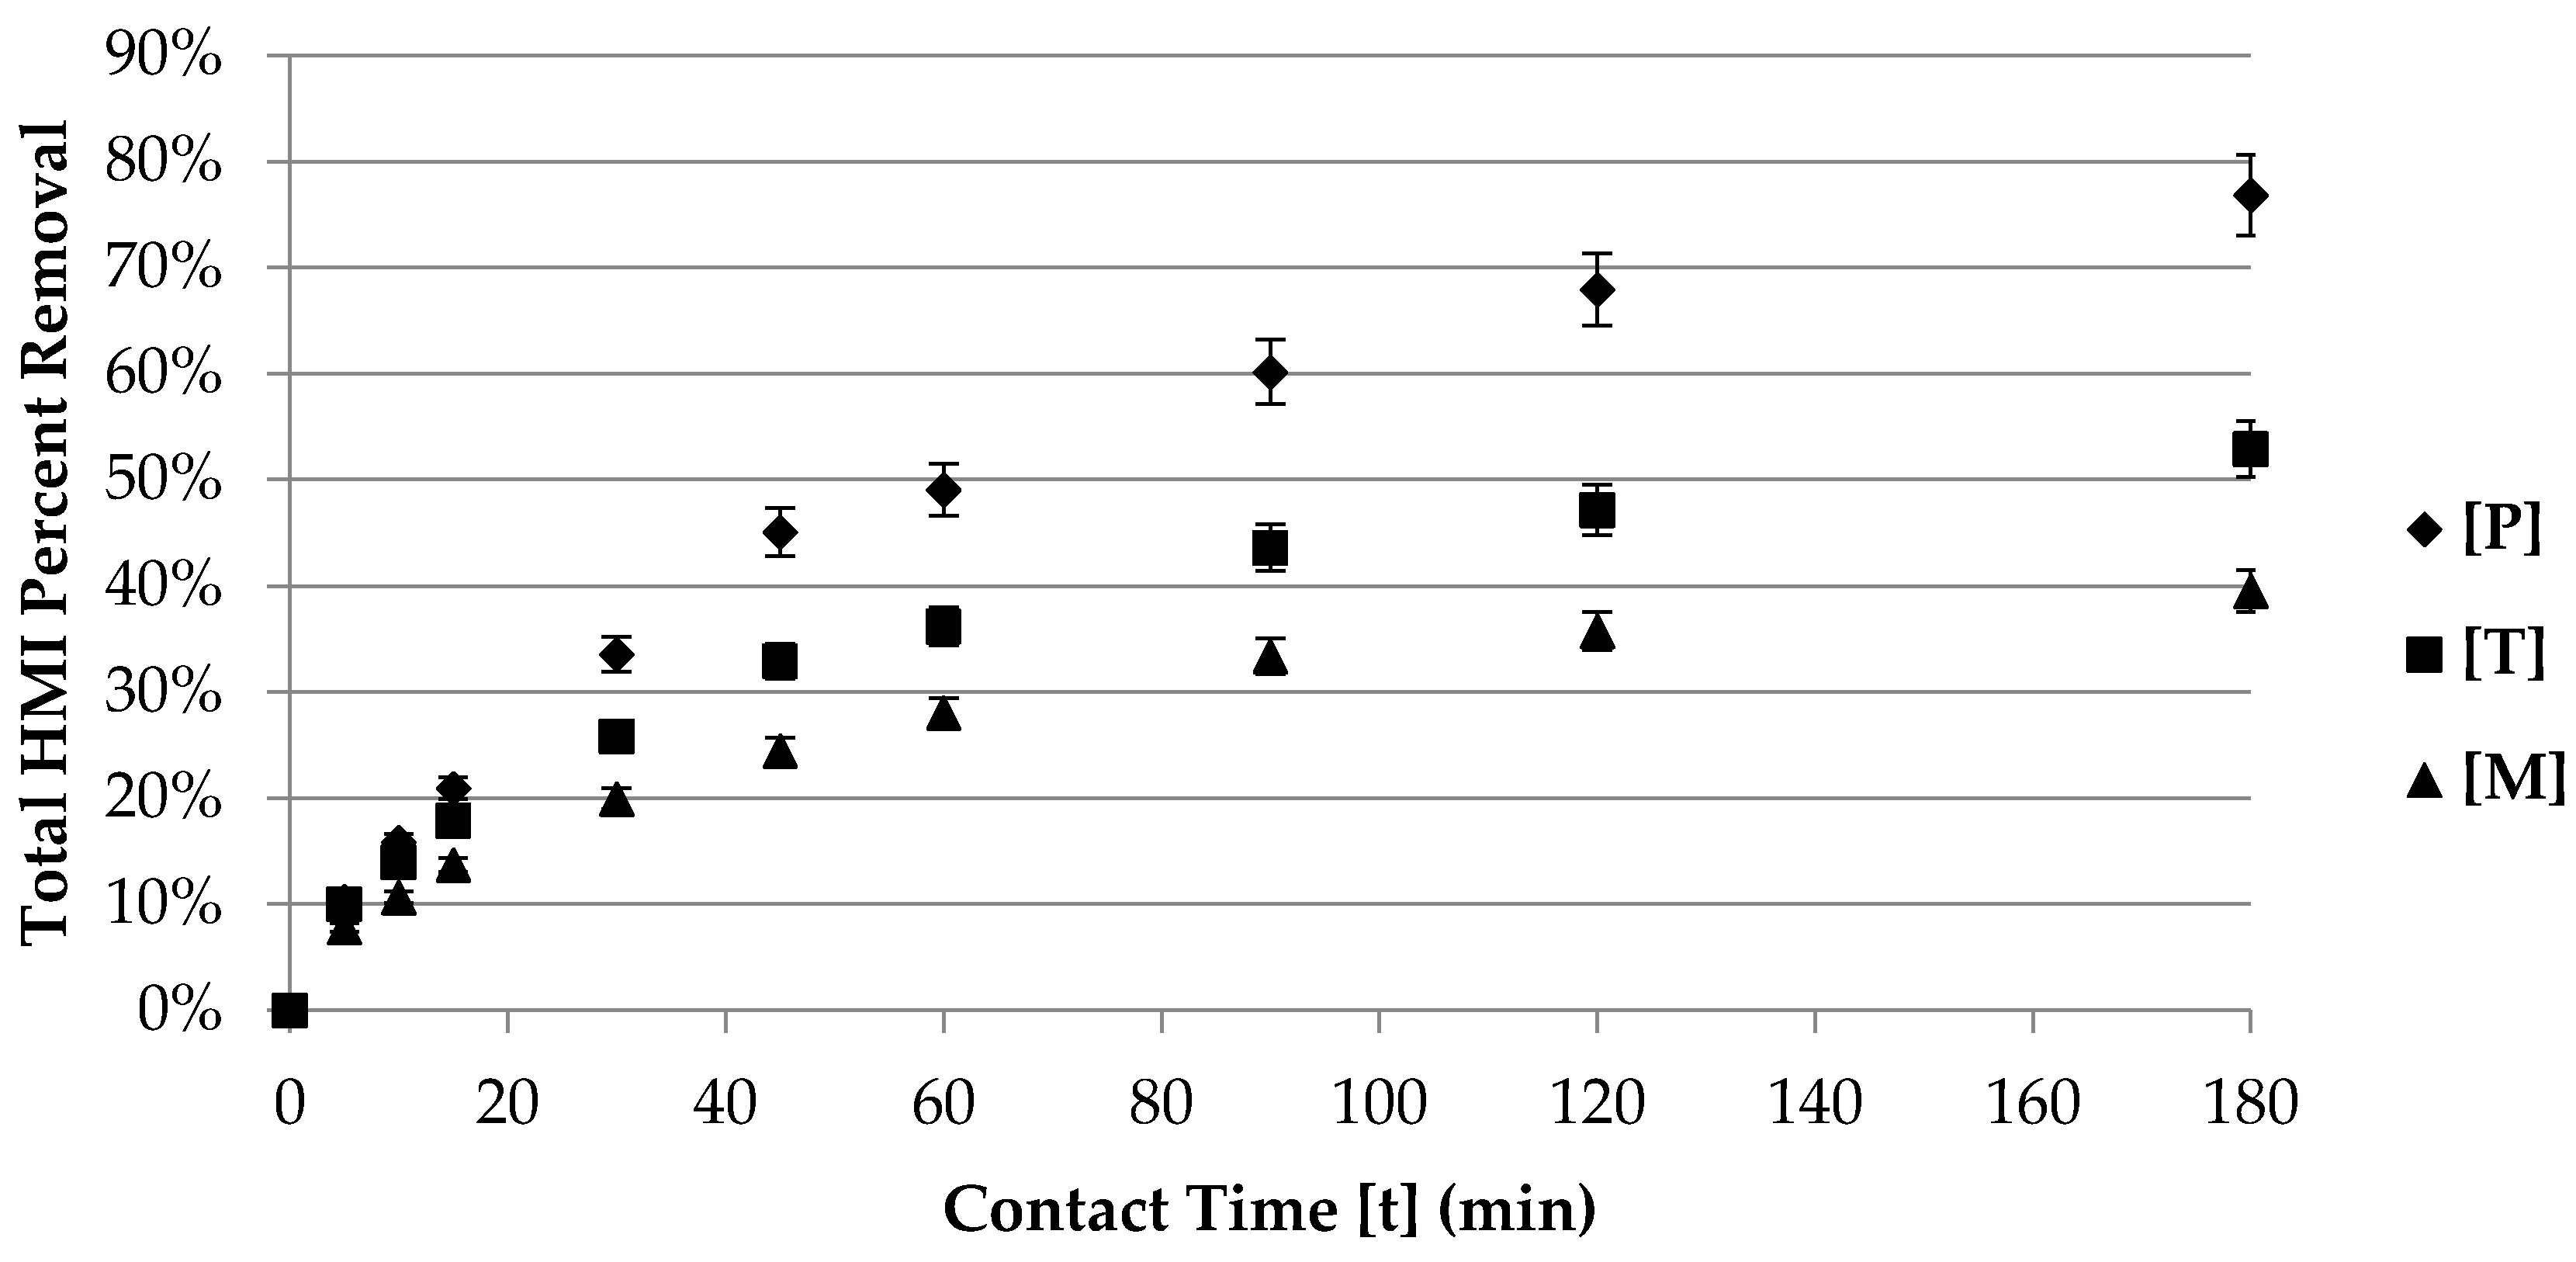
Figure 2.
Single-component system kinetic model plots: (a) pseudo-second-order; (b) intra-particle diffusion.
Figure 2.
Single-component system kinetic model plots: (a) pseudo-second-order; (b) intra-particle diffusion.

Figure 3.
Dual-component system kinetic model plots: (a) pseudo-second-order; (b) intra-particle diffusion.
Figure 3.
Dual-component system kinetic model plots: (a) pseudo-second-order; (b) intra-particle diffusion.
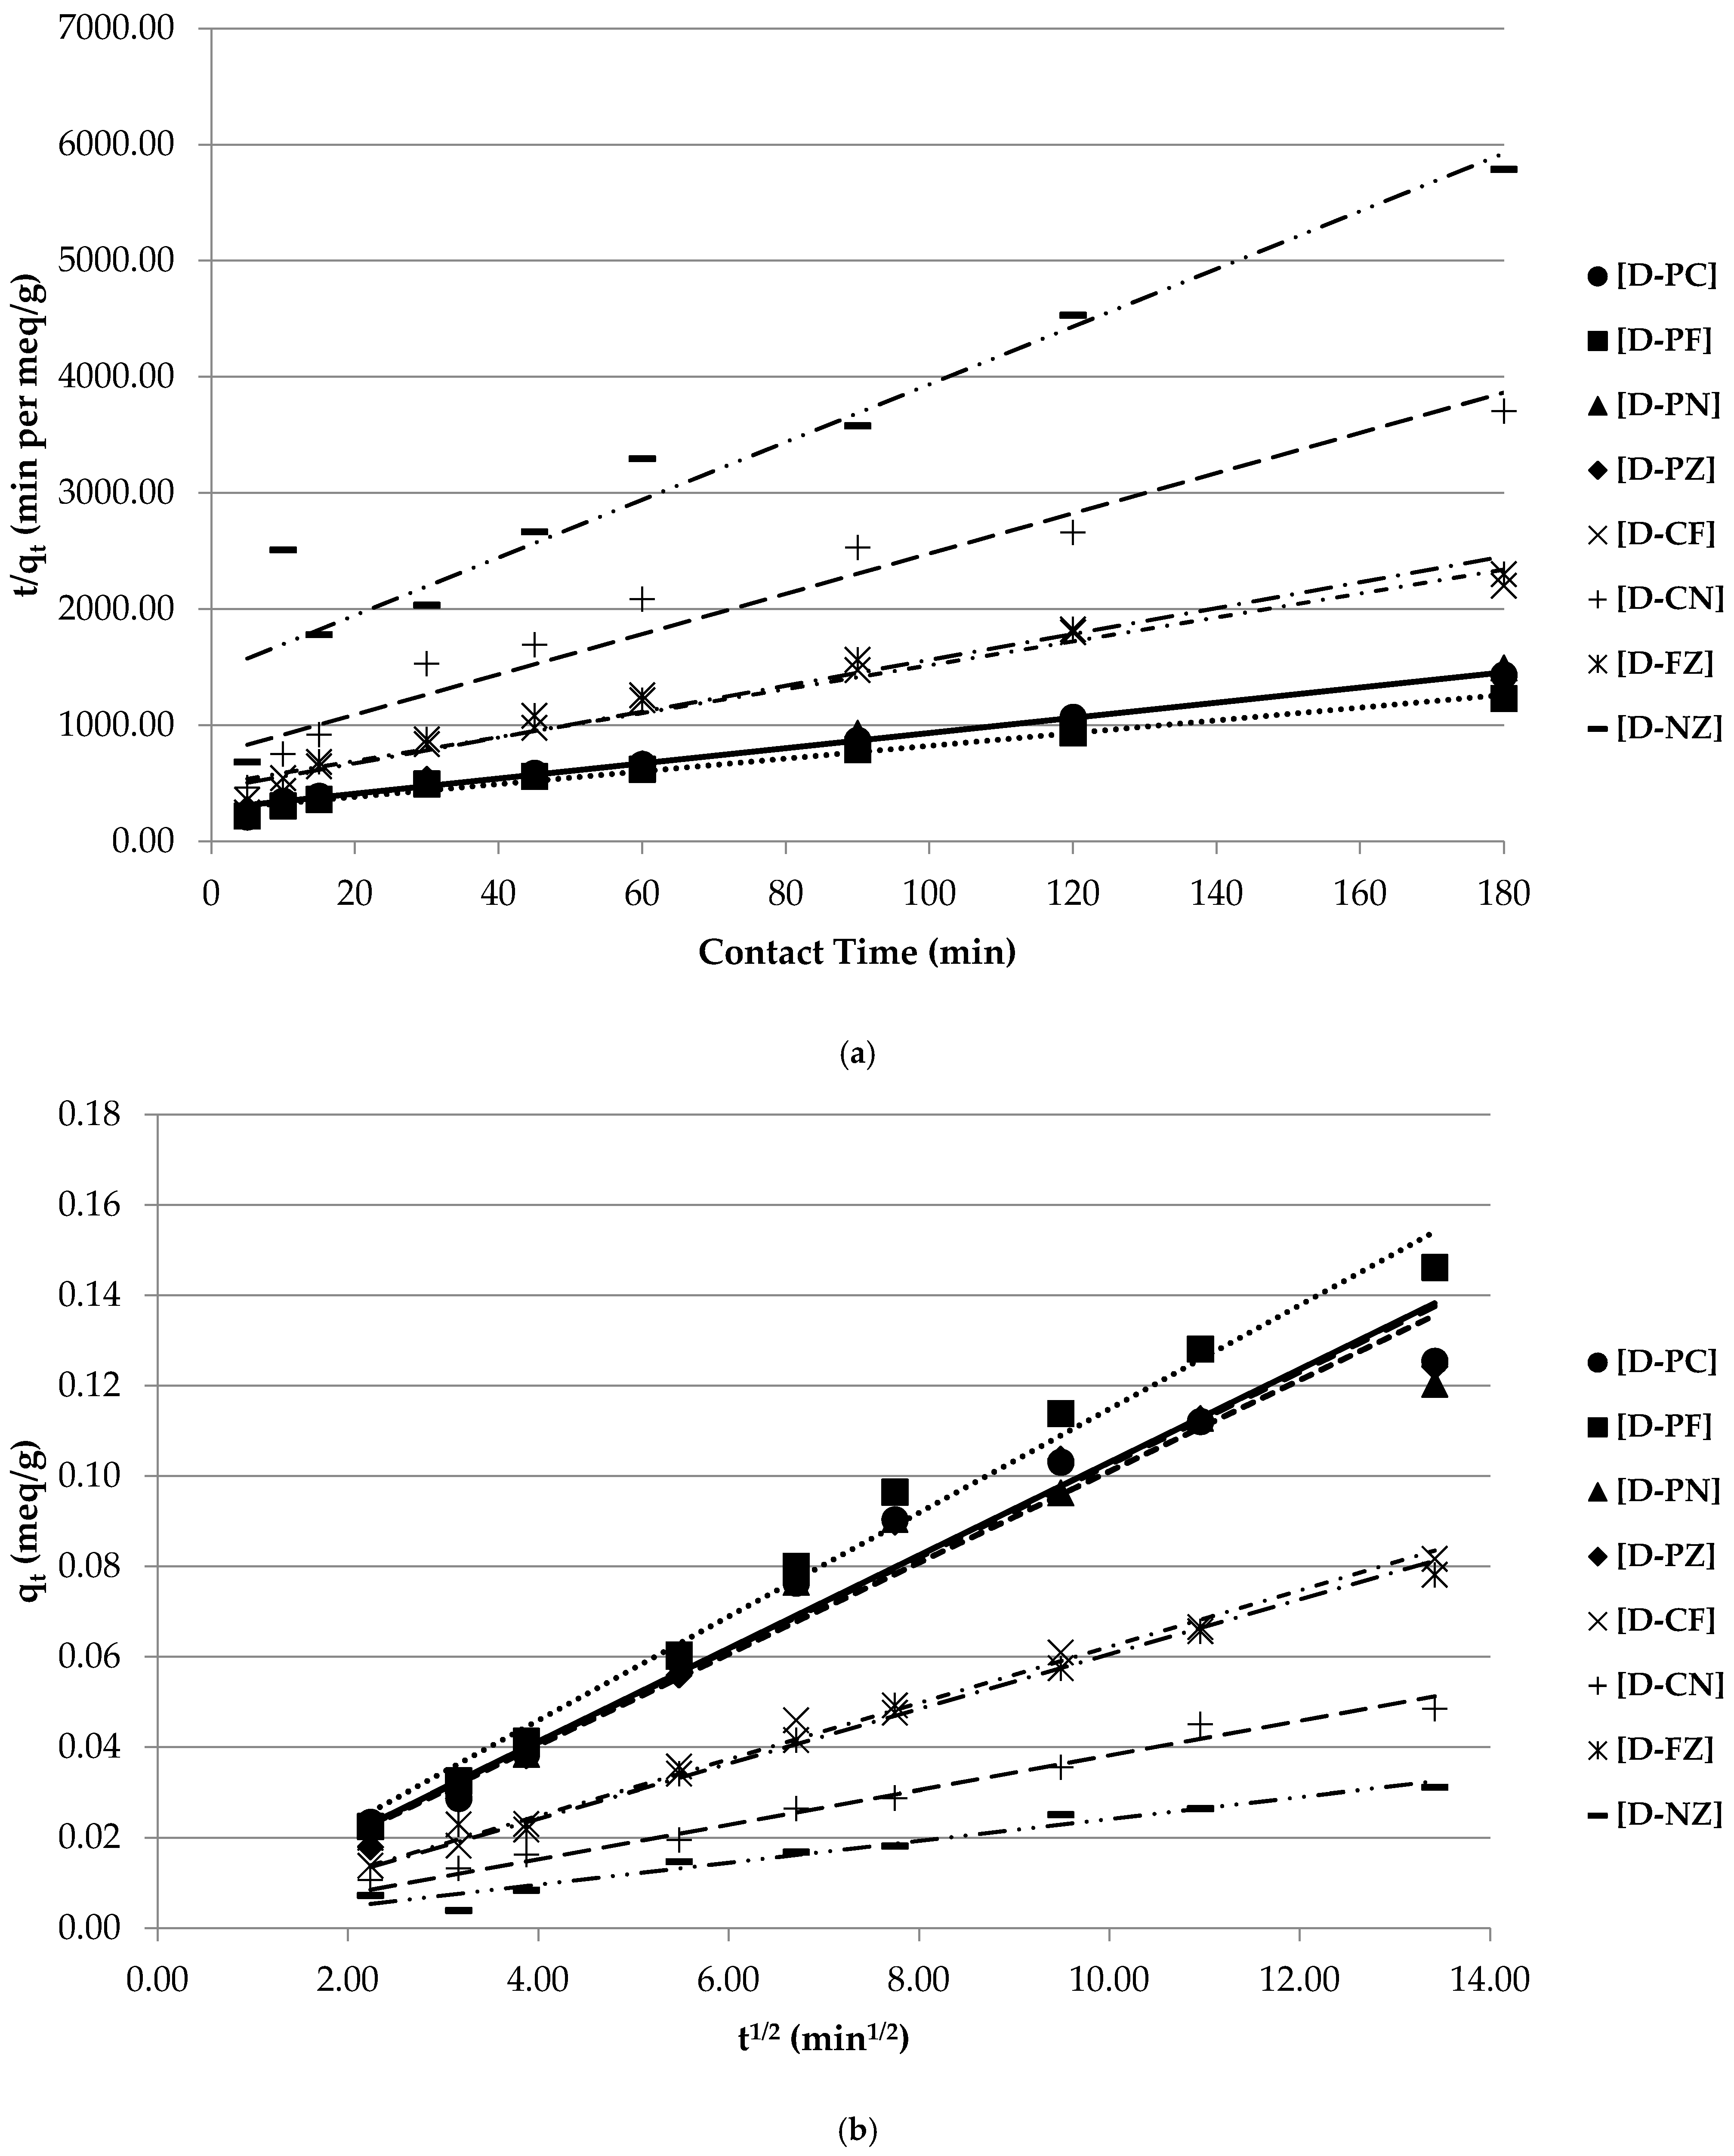
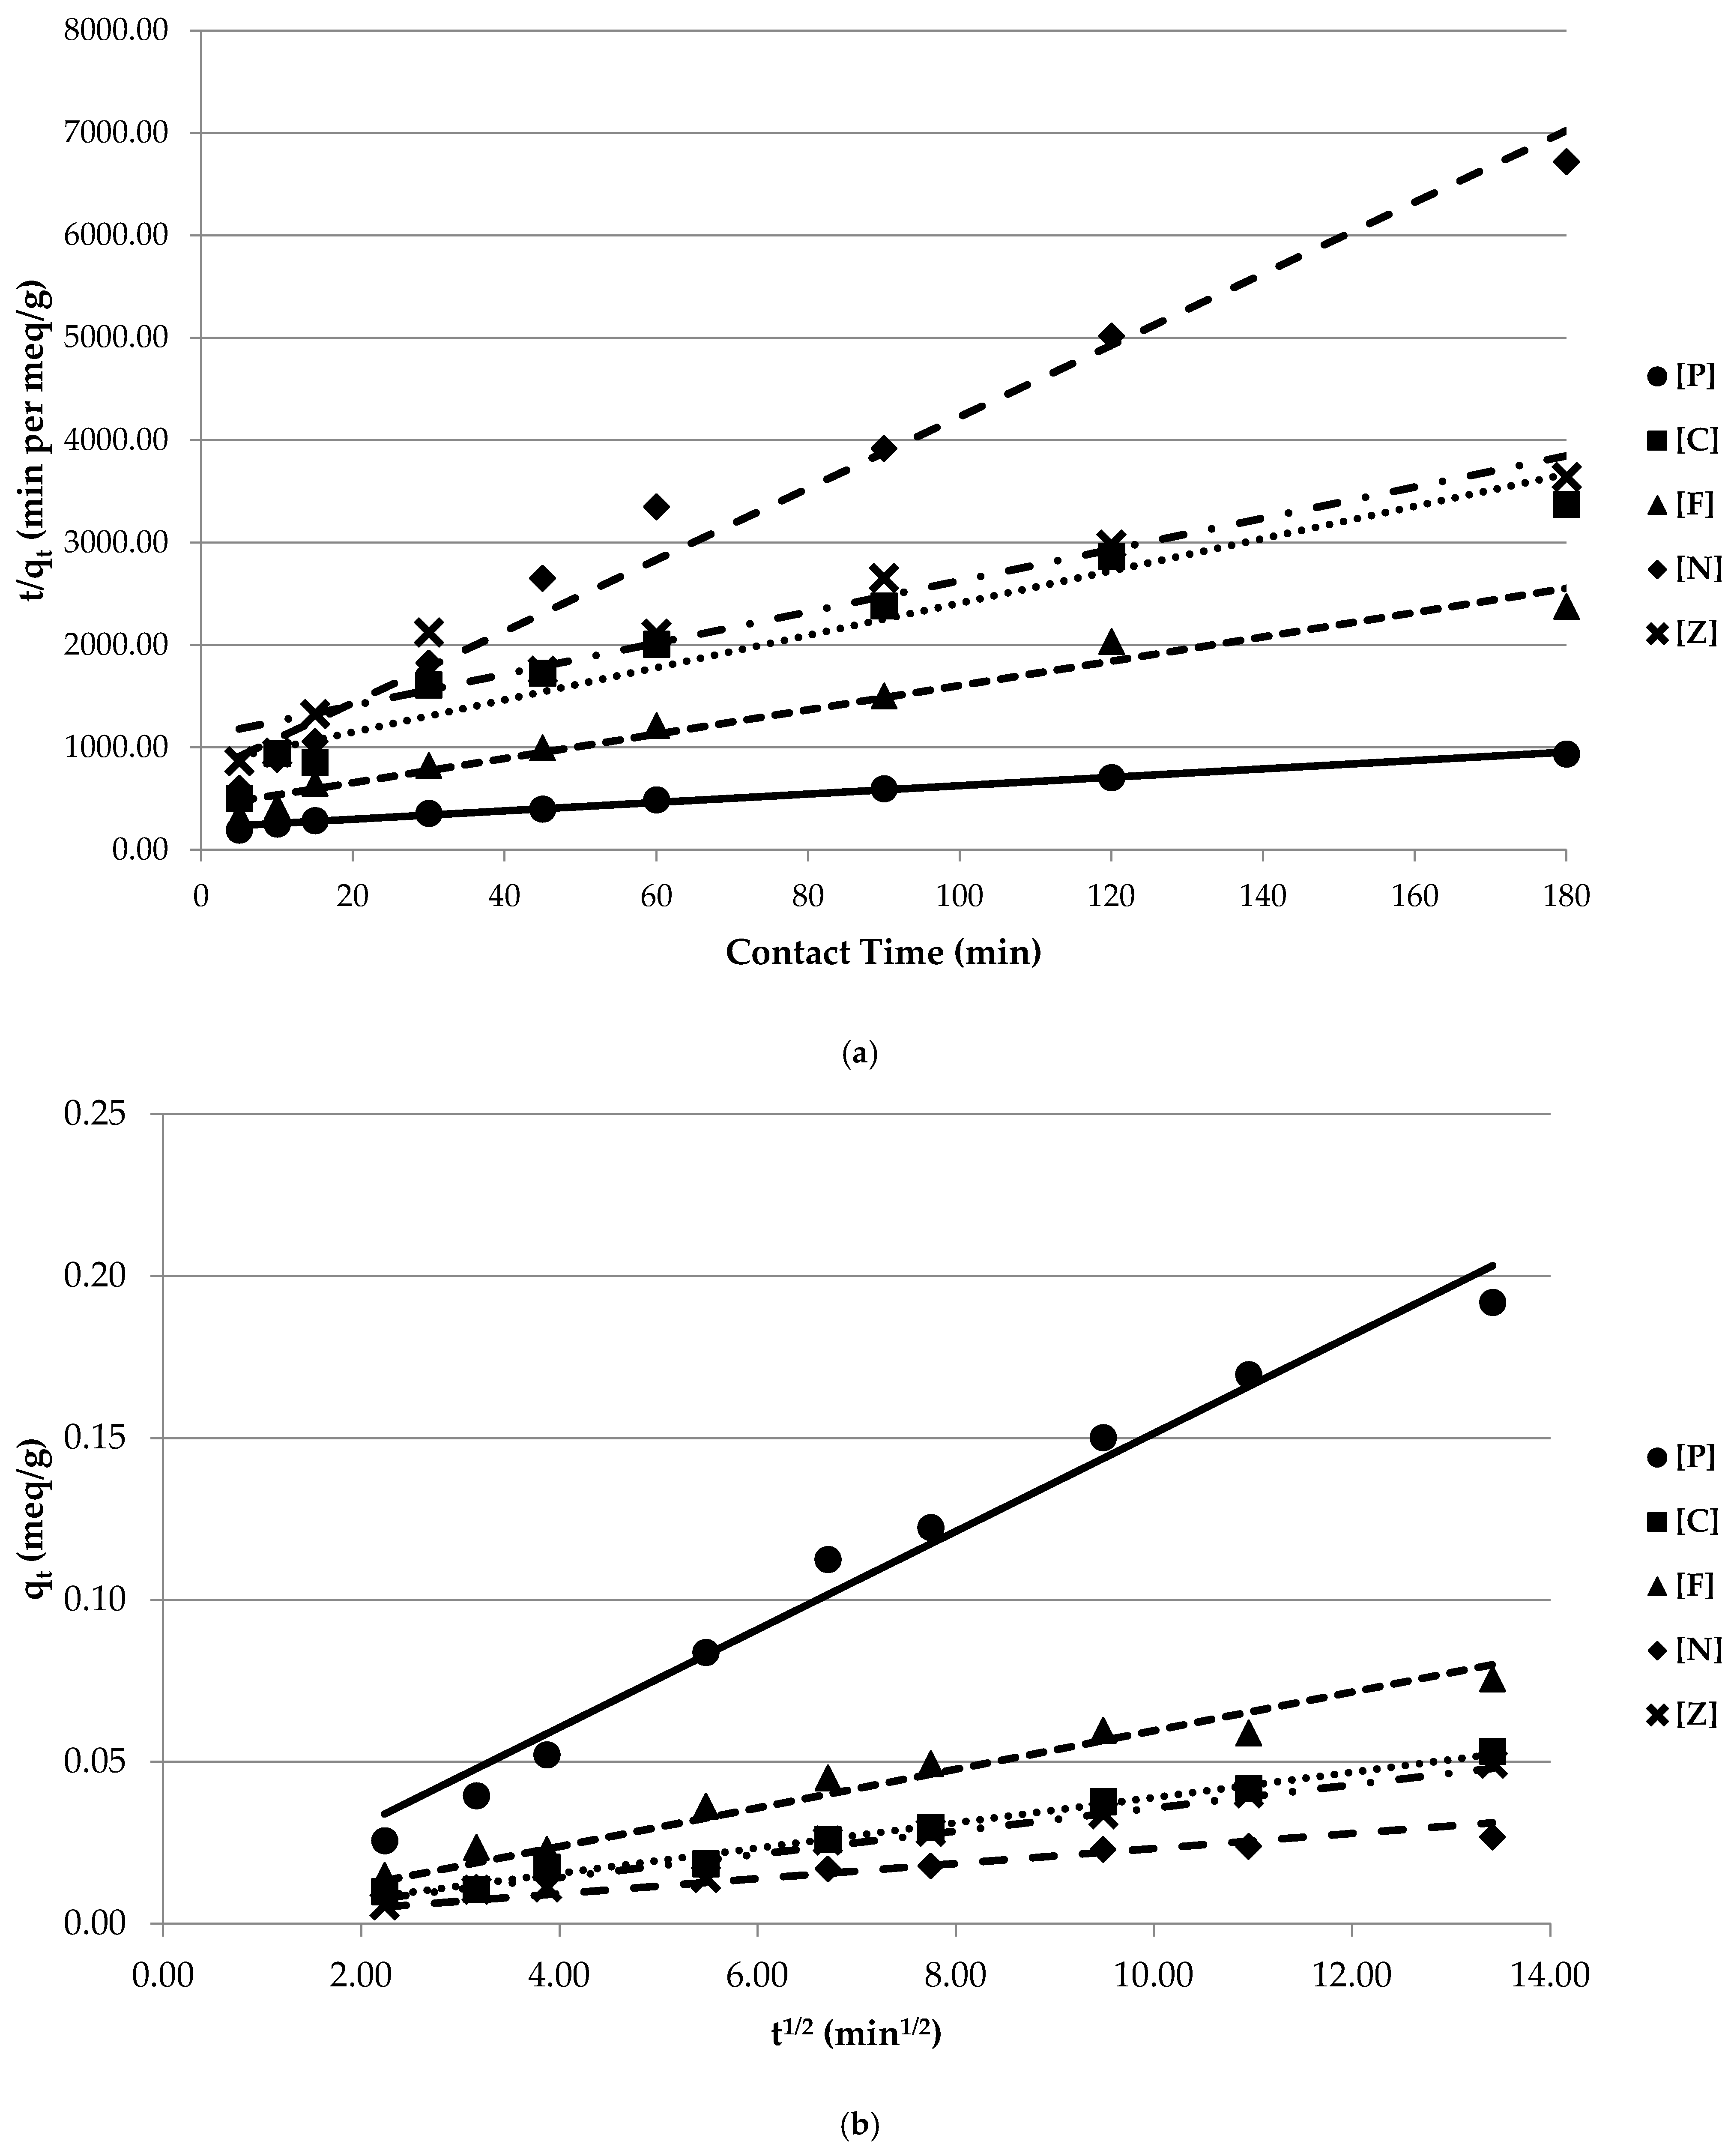
Figure 4.
Triple- and multi- component system kinetic model plots: (a) pseudo-second-order; (b) intra-particle diffusion.
Figure 4.
Triple- and multi- component system kinetic model plots: (a) pseudo-second-order; (b) intra-particle diffusion.

Figure 5.
Multi-component system—uptake over time alongside kinetic models.

Table 1.
ICP-AES HMI results of the single-component systems.
| 1 | 2 | 3 | 4 | 5 | 6 | 7 |
|---|---|---|---|---|---|---|
| Analyte | Sample ID | %RSD | Concentration (mg/L) | meq/g | %R | |
| Triplicate Mean (Calib) | DIL | |||||
| Pb | [P]-S4 | 0.24 | 75.93 | 1214.81 | 0.1919 | 76.8 |
| 220.353 | [P]1803 | 0.59 | 35.20 | 281.63 | ||
| Cu | [C]-S2 | 0.40 | 105.37 | 421.49 | 0.0533 | 21.4 |
| 327.393 | [C]1802 | 0.16 | 82.84 | 331.37 | ||
| Fe | [F]-S1 | 0.53 | 105.83 | 211.65 | 0.0757 | 30.3 |
| 238.204 | [F]1801 | 0.55 | 73.73 | 147.46 | ||
| Ni | [N]-S2 | 0.32 | 87.30 | 349.19 | 0.0268 | 10.7 |
| 231.604 | [N]1802 | 0.36 | 77.92 | 311.69 | ||
| Zn | [Z]-S2 | 1.10 | 104.67 | 418.68 | 0.0494 | 19.8 |
| 206.200 | [Z]1802 | 0.74 | 83.94 | 335.77 | ||
Table 2.
ICP-AES HMI results of the dual-component systems.
| 1 | 2 | 3 | 4 | 5 | 6 | 7 | 1 | 2 | 3 | 4 | 5 | 6 | 7 |
|---|---|---|---|---|---|---|---|---|---|---|---|---|---|
| Analyte | Sample ID | %RSD | Concentration (mg/L) | meq/g | %R | Analyte | Sample ID | %RSD | Concentration (mg/L) | meq/g | %R | ||
| Triplicate Mean (Calib) | DIL | Triplicate Mean (Calib) | DIL | ||||||||||
| Pb | [D-PC]-S3 | 0.13 | 75.47 | 603.79 | 0.1102 | 88.3 | Cu | [D-CF]-S1 | 0.90 | 95.76 | 191.51 | 0.0283 | 22.7 |
| 220.353 | [D-PC]1802 | 0.59 | 17.68 | 70.73 | 327.393 | [D-CF]1801 | 0.58 | 74.06 | 148.13 | ||||
| Cu | [D-PC]-S3 | 0.11 | 24.18 | 193.44 | 0.0153 | 12.2 | Fe | [D-CF]-S1 | 2.75 | 50.61 | 101.21 | 0.0534 | 42.8 |
| 327.393 | [D-PC]1802 | 0.61 | 42.44 | 169.77 | 238.204 | [D-CF]1801 | 0.70 | 28.95 | 57.90 | ||||
| Pb | [D-PF]-S3 | 0.42 | 75.98 | 607.82 | 0.0992 | 79.5 | Cu | [D-CN]-S1 | 0.50 | 94.92 | 189.85 | 0.0361 | 28.9 |
| 220.353 | [D-PF]1802 | 0.54 | 31.19 | 124.77 | 327.393 | [D-CN]1801 | 0.40 | 67.46 | 134.92 | ||||
| Fe | [D-PF]-S3 | 0.31 | 13.01 | 104.11 | 0.0471 | 37.7 | Ni | [D-CN]-S1 | 0.23 | 80.53 | 161.06 | 0.0125 | 10.0 |
| 238.204 | [D-PF]1802 | 0.45 | 16.21 | 64.82 | 231.604 | [D-CN]1801 | 0.48 | 72.48 | 144.96 | ||||
| Pb | [D-PN]-S3 | 0.82 | 77.16 | 617.29 | 0.1112 | 89.1 | Fe | [D-FZ]-S1 | 2.31 | 51.15 | 102.30 | 0.0546 | 43.7 |
| 220.353 | [D-PN]1802 | 0.68 | 16.81 | 67.22 | 238.204 | [D-FZ]1801 | 0.20 | 28.78 | 57.56 | ||||
| Ni | [D-PN]-S3 | 0.86 | 21.05 | 168.37 | 0.0092 | 7.40 | Zn | [D-FZ]-S1 | 2.69 | 90.55 | 181.09 | 0.0236 | 18.9 |
| 231.604 | [D-PN]1802 | 0.12 | 38.99 | 155.94 | 206.200 | [D-FZ]1801 | 0.22 | 73.43 | 146.85 | ||||
| Pb | [D-PZ]-S3 | 1.01 | 76.78 | 614.22 | 0.1105 | 88.5 | Ni | [D-NZ]-S1 | 1.22 | 80.15 | 160.31 | 0.0067 | 5.4 |
| 220.353 | [D-PZ]1802 | 0.50 | 17.68 | 70.72 | 231.604 | [D-NZ]1801 | 3.49 | 75.85 | 151.71 | ||||
| Zn | [D-PZ]-S3 | 0.92 | 23.46 | 187.65 | 0.0138 | 11.0 | Zn | [D-NZ]-S1 | 1.30 | 89.51 | 179.02 | 0.0244 | 19.6 |
| 206.200 | [D-PZ]1802 | 0.83 | 41.75 | 166.98 | 206.200 | [D-NZ]1801 | 3.84 | 71.99 | 143.99 | ||||
Table 3.
ICP-AES HMI results of the triple- and multi-component systems.
| 1 | 2 | 3 | 4 | 5 | 6 | 7 |
|---|---|---|---|---|---|---|
| Analyte | Sample ID | %RSD | Concentration (mg/L) | meq/g | %R | |
| Triplicate Mean (Calib) | DIL | |||||
| Pb | [T]-S2 | 1.27 | 100.05 | 400.21 | 0.0750 | 90.2 |
| 220.353 | [T]1801 | 0.21 | 19.66 | 39.32 | ||
| Cu | [T]-S2 | 1.16 | 33.76 | 135.03 | 0.0158 | 19.0 |
| 327.393 | [T]1801 | 1.58 | 54.70 | 109.40 | ||
| Fe | [T]-S2 | 0.59 | 17.23 | 68.92 | 0.0412 | 49.5 |
| 238.204 | [T]1801 | 1.81 | 17.40 | 34.80 | ||
| Pb | [M]-S1 | 0.53 | 117.76 | 235.52 | 0.0469 | 94.0 |
| 220.353 | [M]1800 | 0.67 | 14.20 | 14.20 | ||
| Cu | [M]-S1 | 1.96 | 37.58 | 75.16 | 0.0109 | 21.9 |
| 327.393 | [M]1800 | 0.99 | 58.74 | 58.74 | ||
| Fe | [M]-S1 | 2.26 | 20.52 | 41.03 | 0.0281 | 56.2 |
| 238.204 | [M]1800 | 1.24 | 17.97 | 17.97 | ||
| Ni | [M]-S1 | 0.56 | 32.87 | 65.75 | 0.0045 | 9.10 |
| 231.604 | [M]1800 | 1.48 | 59.76 | 59.76 | ||
| Zn | [M]-S1 | 2.23 | 35.99 | 71.98 | 0.0082 | 16.5 |
| 206.200 | [M]1800 | 1.63 | 60.12 | 60.12 | ||
Table 4.
Pseudo-second-order data.
| SYSTEM | CC | Equilibrium Sorption | Sorption Rate Constant | Initial Sorption Rate | ||
|---|---|---|---|---|---|---|
| (meq/g) | (g/meq·min) | (meq/g·min) | ||||
| [P] | 4.098 | 217.01 | 0.9926 | 0.244 | 0.077 | 0.0046 |
| [C] | 15.750 | 836.09 | 0.9291 | 0.063 | 0.297 | 0.0012 |
| [F] | 11.872 | 419.08 | 0.9708 | 0.084 | 0.336 | 0.0024 |
| [N] | 34.919 | 739.14 | 0.9806 | 0.029 | 1.650 | 0.0014 |
| [Z] | 15.237 | 1106,10 | 0.9147 | 0.066 | 0.210 | 0.0009 |
| [D-PC]-Pb | 7.474 | 299.43 | 0.9941 | 0.134 | 0.187 | 0.0033 |
| [D-PC]-Cu | 55.217 | 2840,90 | 0.9282 | 0.018 | 1.073 | 0.0004 |
| [D-PC] | 6.596 | 269.78 | 0.9906 | 0.152 | 0.161 | 0.0037 |
| [D-PF]-Pb | 7.692 | 448.41 | 0.9904 | 0.130 | 0.132 | 0.0022 |
| [D-PF]-Fe | 18.375 | 727.45 | 0.9703 | 0.054 | 0.464 | 0.0014 |
| [D-PF] | 5.489 | 275.71 | 0.9837 | 0.182 | 0.109 | 0.0036 |
| [D-PN]-Pb | 7.465 | 284.48 | 0.9957 | 0.134 | 0.196 | 0.0035 |
| [D-PN]-Ni | 109.750 | 3126,00 | 0.5378 | 0.009 | 3.853 | 0.0003 |
| [D-PN] | 6.976 | 254.36 | 0.9914 | 0.143 | 0.191 | 0.0039 |
| [D-PZ]-Pb | 7.436 | 293.22 | 0.9973 | 0.134 | 0.189 | 0.0034 |
| [D-PZ]-Zn | 40.653 | 5898,50 | 0.4358 | 0.025 | 0.280 | 0.0002 |
| [D-PZ] | 6.534 | 280.74 | 0.9946 | 0.153 | 0.152 | 0.0036 |
| [D-CF]-Cu | 21.169 | 2683,00 | 0.9629 | 0.047 | 0.167 | 0.0004 |
| [D-CF]-Fe | 16.655 | 581.48 | 0.9750 | 0.060 | 0.477 | 0.0017 |
| [D-CF] | 10.297 | 488.73 | 0.9703 | 0.097 | 0.217 | 0.0020 |
| [D-CN]-Cu | 21.936 | 1271,30 | 0.9453 | 0.046 | 0.379 | 0.0008 |
| [D-CN]-Ni | 72.008 | 1686,80 | 0.9498 | 0.014 | 3.074 | 0.0006 |
| [D-CN] | 17.329 | 747.04 | 0.9471 | 0.058 | 0.402 | 0.0013 |
| [D-FZ]-Fe | 16.438 | 502.40 | 0.9778 | 0.061 | 0.538 | 0.0020 |
| [D-FZ]-Zn | 28.869 | 3101,00 | 0.6387 | 0.035 | 0.269 | 0.0003 |
| [D-FZ] | 11.140 | 451.04 | 0.9554 | 0.090 | 0.275 | 0.0022 |
| [D-NZ]-Ni | 133.600 | 999.38 | 0.9731 | 0.007 | 17.860 | 0.0010 |
| [D-NZ]-Zn | 19.459 | 3808,80 | 0.3642 | 0.051 | 0.099 | 0.0003 |
| [D-NZ] | 24.852 | 1452,00 | 0.9113 | 0.040 | 0.425 | 0.0007 |
| [T]-Pb | 11.194 | 394.10 | 0.9980 | 0.089 | 0.318 | 0.0025 |
| [T]-Cu | 48.524 | 3252,90 | 0.9141 | 0.021 | 0.724 | 0.0003 |
| [T]-Fe | 21.496 | 721.14 | 0.9807 | 0.047 | 0.641 | 0.0014 |
| [T] | 6.438 | 237.29 | 0.9918 | 0.155 | 0.175 | 0.0042 |
| [M]-Pb | 18.593 | 465.67 | 0.9990 | 0.054 | 0.742 | 0.0021 |
| [M]-Cu | 58.274 | 6429,20 | 0.8600 | 0.017 | 0.528 | 0.0002 |
| [M]-Fe | 31.695 | 989.38 | 0.9830 | 0.032 | 1.015 | 0.0010 |
| [M]-Ni | 190.820 | 5086,10 | 0.9747 | 0.005 | 7.159 | 0.0002 |
| [M]-Zn | −51.894 | 2,5482,00 | 0.1723 | -0.019 | 0.106 | 0.0000 |
| [M] | 8.630 | 303.14 | 0.9931 | 0.116 | 0.246 | 0.0033 |
Table 5.
Intra-particle diffusion data.
| SYSTEM | Diffusion Rate Constant A | CCA | SYSTEM | Diffusion Rate Constant B | Boundary Constant B | CCB |
|---|---|---|---|---|---|---|
| (meq/g·min1/2) | (meq/g·min1/2) | (meq/g) | ||||
| [P] | 0.015 | 0.9818 | [P] | 0.016 | −0.004 | 0.9828 |
| [C] | 0.004 | 0.9882 | [C] | 0.004 | −0.000 | 0.9883 |
| [F] | 0.006 | 0.9548 | [F] | 0.005 | 0.006 | 0.9747 |
| [N] | 0.002 | 0.6930 | [N] | 0.002 | 0.007 | 0.9629 |
| [Z] | 0.004 | 0.9729 | [Z] | 0.004 | −0.003 | 0.9846 |
| [D-PC]-Pb | 0.009 | 0.9597 | [D-PC]-Pb | 0.009 | 0.004 | 0.9627 |
| [D-PC]-Cu | 0.001 | 0.9658 | [D-PC]-Cu | 0.001 | 0.000 | 0.9669 |
| [D-PC] | 0.010 | 0.9662 | [D-PC] | 0.010 | 0.004 | 0.9690 |
| [D-PF]-Pb | 0.008 | 0.9790 | [D-PF]-Pb | 0.008 | −0.004 | 0.9827 |
| [D-PF]-Fe | 0.004 | 0.9860 | [D-PF]-Fe | 0.003 | 0.003 | 0.9951 |
| [D-PF] | 0.012 | 0.9873 | [D-PF] | 0.012 | −0.001 | 0.9876 |
| [D-PN]-Pb | 0.009 | 0.9569 | [D-PN]-Pb | 0.009 | 0.005 | 0.9622 |
| [D-PN]-Ni | 0.001 | 0.4479 | [D-PN]-Ni | 0.001 | 0.002 | 0.5521 |
| [D-PN] | 0.010 | 0.9527 | [D-PN] | 0.009 | 0.007 | 0.9616 |
| [D-PZ]-Pb | 0.009 | 0.9542 | [D-PZ]-Pb | 0.009 | 0.004 | 0.9576 |
| [D-PZ]-Zn | 0.001 | 0.9088 | [D-PZ]-Zn | 0.001 | −0.002 | 0.9378 |
| [D-PZ] | 0.010 | 0.9639 | [D-PZ] | 0.010 | 0.003 | 0.9649 |
| [D-CF]-Cu | 0.002 | 0.9523 | [D-CF]-Cu | 0.002 | −0.004 | 0.9933 |
| [D-CF]-Fe | 0.004 | 0.9666 | [D-CF]-Fe | 0.004 | 0.005 | 0.9902 |
| [D-CF] | 0.006 | 0.9923 | [D-CF] | 0.006 | 0.001 | 0.9925 |
| [D-CN]-Cu | 0.003 | 0.9888 | [D-CN]-Cu | 0.003 | −0.001 | 0.9915 |
| [D-CN]-Ni | 0.001 | 0.6540 | [D-CN]-Ni | 0.001 | 0.003 | 0.9089 |
| [D-CN] | 0.004 | 0.9795 | [D-CN] | 0.004 | 0.002 | 0.9843 |
| [D-FZ]-Fe | 0.005 | 0.9332 | [D-FZ]-Fe | 0.004 | 0.007 | 0.9906 |
| [D-FZ]-Zn | 0.002 | 0.9303 | [D-FZ]-Zn | 0.002 | −0.002 | 0.9494 |
| [D-FZ] | 0.006 | 0.9777 | [D-FZ] | 0.006 | 0.005 | 0.9907 |
| [D-NZ]-Ni | 0.001 | −0.2510 | [D-NZ]-Ni | 0.000 | 0.003 | 0.6264 |
| [D-NZ]-Zn | 0.002 | 0.9348 | [D-NZ]-Zn | 0.002 | −0.004 | 0.9801 |
| [D-NZ] | 0.002 | 0.9605 | [D-NZ] | 0.002 | −0.000 | 0.9605 |
| [T]-Pb | 0.006 | 0.9434 | [T]-Pb | 0.006 | 0.005 | 0.9536 |
| [T]-Cu | 0.001 | 0.9747 | [T]-Cu | 0.001 | −0.001 | 0.9826 |
| [T]-Fe | 0.003 | 0.9622 | [T]-Fe | 0.003 | 0.004 | 0.9900 |
| [T] | 0.011 | 0.9668 | [T] | 0.010 | 0.008 | 0.9761 |
| [M]-Pb | 0.004 | 0.8584 | [M]-Pb | 0.004 | 0.007 | 0.9130 |
| [M]-Cu | 0.001 | 0.9473 | [M]-Cu | 0.001 | −0.001 | 0.9851 |
| [M]-Fe | 0.002 | 0.9465 | [M]-Fe | 0.002 | 0.003 | 0.9886 |
| [M]-Ni | 0.000 | 0.8566 | [M]-Ni | 0.000 | 0.001 | 0.9251 |
| [M]-Zn | 0.001 | 0.8479 | [M]-Zn | 0.001 | −0.002 | 0.9720 |
| [M] | 0.008 | 0.9585 | [M] | 0.008 | 0.007 | 0.9713 |
A ; B
Table 6.
Experimental total (180 min) and theoretical equilibrium HMI uptake system observations.
| SYSTEM | (meq/g) | % Achieved of at 3 h | OBSERVATION | |||||
|---|---|---|---|---|---|---|---|---|
| SINGLE HMI | [P] | 0.1919 | 0.2440 | 78.7 | Highest Single Uptake of 76.8% for [P] | |||
| [C] | 0.0533 | 0.0635 | 84.0 | |||||
| [F] | 0.0757 | 0.0842 | 89.8 | |||||
| [N] | 0.0268 | 0.0286 | 93.5 | Lowest Single Uptake of 10.7% for [N] | ||||
| [Z] | 0.0494 | 0.0656 | 75.3 | |||||
| DUAL [D] | [PC] | 0.1255 | 0.1516 | 82.7 | ||||
| [PF] | 0.1462 | 0.1822 | 80.3 | Highest [D] Uptake of 58.5% for [PF] | ||||
| [PN] | 0.1204 | 0.1433 | 84.0 | |||||
| [PZ] | 0.1243 | 0.1530 | 81.2 | |||||
| [CF] | 0.0817 | 0.0971 | 84.1 | |||||
| [CN] | 0.0486 | 0.0577 | 84.1 | |||||
| [FZ] | 0.0782 | 0.0898 | 87.1 | |||||
| [NZ] | 0.0311 | 0.0402 | 77.3 | Lowest [D] Uptake of 12.4% for [NZ] | ||||
| TRIPLE [T] | 0.1320 | 0.1553 | 85.0 | [D-PC] | Increased | 5.2% | 2.5% | |
| [D-PF] | Decreased | 9.8% | 14.7% | |||||
| [D-CF] | Increased | 61.5% | 59.9% | |||||
| MULTI [M] | 0.0986 | 0.1159 | 85.1 | [D-PC] | Decreased | 21.4% | 23.6% | |
| [D-PF] | Decreased | 32.6% | 36.4% | |||||
| [D-CF] | Increased | 20.7% | 19.3% | |||||
| [T] | Decreased | 25.3% | 25.4% | |||||
Table 7.
The sorption trends of heavy metallic ions on various sorbent materials.
| Sorbent Material | HMI | Sorption Trends | Reference | |
|---|---|---|---|---|
| American 85–95% Clinoptilolite | (meq/g) | This Study | ||
| Pb2+ | 0.1919 | 0.2440 | ||
| Fe3+ | 0.0757 | 0.0842 | ||
| Cu2+ | 0.0533 | 0.0635 | ||
| Zn2+ | 0.0494 | 0.0656 | ||
| Ni2+ | 0.0268 | 0.0286 | ||
| Pb2+ >> Fe3+Cu2+ > Zn2+ > Ni2+ | ||||
| Brazilian Zeolite (Scolecite) | Cu2+ | 130 μeq/g | Bosso and Enzweiler (2002) [47] | |
| Zn2+ | 64 μeq/g | |||
| Pb2+ | 56 μeq/g | |||
| Ni2+ | 31 μeq/g | |||
| Co2+ | 7.8 μeq/g | |||
| Cd2+ | 3.2 μeq/g | |||
| Cu2+ >> Zn2+ > Pb2+ > Ni2+ > Co2+ > Cd2+ | ||||
| Turkish 70% Clinoptilolite | Co2+ | 77.96% (0.448 meq/g) | Erdem et al. (2004) [2] Wang and Peng (2010) [18] | |
| Cu2+ | 66.10% (0.282 meq/g) | |||
| Zn2+ | 45.96% (0.268 meq/g) | |||
| Mn2+ | 19.84% (0.153 meq/g) | |||
| Co2+ > Cu2+ > Zn2+ > Mn2+ | ||||
| Ukrainian 75% Clinoptilolite | Pb2+ | 27.7 mg/g | Sprynskyy et al. (2006) [4] | |
| Cu2+ | 25.76 mg/g | |||
| Ni2+ | 13.03 mg/g | |||
| Cd2+ | 4.22 mg/g | |||
| Pb2+ > Cu2+ > Cd2 > Ni2+ | ||||
| Sardinian 40–70% Clinoptilolite | Pb2+ | 0.34 meq/g | Cincotti et al. (2006) [48] | |
| Cu2+ | 0.27–1.2 meq/g | |||
| Zn2+ | 0.1 meq/g | |||
| Cd2+ | 0.05-0.19 meq/g | |||
| Pb2+ > Cu2+ > Cd2+ ≅ Zn2+ | ||||
| Turkish Zeolite(Clinoptilolite and Heulandite) | Single- | Multi- | Oter and Akcay (2007) [27] Wang and Peng (2010) [18] | |
| Pb2+ | 0.730 meq/g | 0.299 meq/g | ||
| Zn2+ | 0.251 meq/g | 0.108 meq/g | ||
| Cu2+ | 0.227 meq/g | 0.022 meq/g | ||
| Ni2+ | 0.173 meq/g | 0.017 meq/g | ||
| Pb2+ > Zn2+ > Cu2+ > Ni2+ | ||||
| Turkish Clinoptilolite | Fe3+ | 6.41 mg/g | Motsi et al. (2009) [38] | |
| Zn2+ | 1.60 mg/g | |||
| Cu2+ | 0.44 mg/g | |||
| Mn2+ | 0.37 mg/g | |||
| Fe3+ > Zn2+ > Cu2+ > Mn2+ | ||||
| Brine Sediments | Zn2+ | 4.85 mg/g | Fu and Wang (2011) [19] | |
| Cu2+ | 2.58 mg/g | |||
| Sawdust Materials | Zn2+ | 4.69 mg/g | ||
| Cu2+ | 2.31 mg/g | |||
| Dried Marine Green Macroalga Algal Biomass | Cu2+ | 1.46 mmol/g | ||
| Zn2+ | 1.97 mmol/g | |||
| Rhizopus Oryzae Fungi Biomass | Cu2+ | 19.4 mg/g (Natural) | ||
| 43.7 mg/g (NaOH-treated) | ||||
© 2017 by the authors. Licensee MDPI, Basel, Switzerland. This article is an open access article distributed under the terms and conditions of the Creative Commons Attribution (CC BY) license (http://creativecommons.org/licenses/by/4.0/).
Share and Cite
MDPI and ACS Style
Ciosek, A.L.; Luk, G.K. Kinetic Modelling of the Removal of Multiple Heavy Metallic Ions from Mine Waste by Natural Zeolite Sorption. Water 2017, 9, 482. https://doi.org/10.3390/w9070482
AMA Style
Ciosek AL, Luk GK. Kinetic Modelling of the Removal of Multiple Heavy Metallic Ions from Mine Waste by Natural Zeolite Sorption. Water. 2017; 9(7):482. https://doi.org/10.3390/w9070482
Chicago/Turabian StyleCiosek, Amanda L., and Grace K. Luk. 2017. "Kinetic Modelling of the Removal of Multiple Heavy Metallic Ions from Mine Waste by Natural Zeolite Sorption" Water 9, no. 7: 482. https://doi.org/10.3390/w9070482
Note that from the first issue of 2016, this journal uses article numbers instead of page numbers. See further details here.