Article

Changes in Reference Evapotranspiration and Its Contributing Factors in Jiangsu, a Major Economic and Agricultural Province of Eastern China

1
Collaborative Innovation Center on Forecast and Evaluation of Meteorological Disasters, Jiangsu Key Laboratory of Agricultural Meteorology, School of Applied Meteorology, Nanjing University of Information Science & Technology, Nanjing 210044, China
2
Department of Disaster Management, Begum Rokeya University, Rangpur 5400, Bangladesh
3
Anhui Meteorological Institute, Anhui Province Atmospheric Science and Satellite Remote Sensing Key Laboratory, Hefei 230031, China
4
Meteorological Service Centre for Jiangsu Province, Nanjing 210008, China
*
Author to whom correspondence should be addressed.
These authors contributed equally to this work.
Water 2017, 9(7), 486; https://doi.org/10.3390/w9070486
Submission received: 10 April 2017 / Revised: 14 June 2017 / Accepted: 30 June 2017 / Published: 2 July 2017

Abstract

:
Reference evapotranspiration (ETref) is a key parameter of hydro-meteorological studies as well as water resource planning. In this study, we adopted the Penman–Monteith FAO 56 model to estimate ETref and through the differential equation and detrending method to determine sensitivities and the contributions of four meteorological parameters to ETref based on daily weather data from 60 stations of Jiangsu province during 1961–2015. Results reveal that ETref and its trends in the three sub-regions of the Jiangsu province had a significant spatial heterogeneity. A significant decreasing tendency of ETref (p < 0.001) was observed in the Huaibei region, while a slightly increasing tendency was identified in the Jianghuai and Sunan regions. These changes of ETref were caused by a significant increasing trend in air temperature (TA) and significant decreasing trends in wind speed (WS), sunshine duration (SD) as well as a non-significant change trend in actual vapor pressure (VP). However, the VP was the meteorological parameter to which ETref was most sensitive, whereas ETref was more sensitive to TA and SD in the summer but less so in the winter; the least sensitive factor, WS, had the opposite trend. Across the whole region, WS contributed most to ETref, followed by SD, while the positive contribution of TA to ETref could not offset the negative contributions of WS and SD. Although the effect of VP on changes in ETref is small, it could not be ignored, especially in the winter. The reverse relationship between increasing TA and decreasing ETref, namely the “evaporation paradox,” occurred in Jiangsu province. Thus, the outcomes of this study will contribute to thorough insight into the response to changes in ETref to the provincial water planning and management in eastern China.

1. Introduction

Reference evapotranspiration (ETref) plays a vital role in climatological and hydrological researches, where spatial and temporal variations are a key indicator of changing climate and water resource allocation [1,2]. The study of spatial and temporal changes of ETref has drawn much attention in recent decades to regional-scale hydro-climatic change because of its nexus in the water resource management and terrestrial ecosystems [3,4,5,6]. Additionally, ETref not only plays a role in estimating agricultural water requirements, but also in irrigation scheduling and management [7]. Therefore, knowledge into the changes of ETref and its precise estimation responses to climate change conditions has become more important ever [8,9], particularly in the context of climate warming starting in the 1970s [10].
Meteorological factors and ETref have changed drastically in the recent decade, due to the anthropogenic activities and land use changes [11,12,13]. In the last century, mean air temperature has risen by 0.6 °C globally on average, and mean temperature has also increased by 0.5–0.8 °C in China [10]. Despite an increasing trend in the air temperature, a significant number of works have found decreasing pan evaporation and ETref in many parts of the world, including China [14,15,16], Australia [17], New Zealand [18], Canada [3], India [19], Thailand [20], and Mexico [21]. This has led to the coinage of the term “evaporation paradox” introduced by Brutsaert and Parlange [22]. However, the reason for its occurrence is still debatable [23]. Hobbins et al. [24] showed that the pan evaporation paradox is an indicator of the close linkage between actual evaporation and potential evaporation. Meanwhile, other researchers have also reported some strong proofs in accordance with the opinion of Hobbins et al. [24] that decreasing rates of ETref are responsible not only for the rise in air temperature but also for other meteorological factors such as the reduction in wind speed, solar radiation, and relative humidity [25,26].
The Penman–Monteith FAO 56 model suggested by the Food and Agriculture Organization (FAO) has been regarded as a robust and universally accepted method for calculating ETref [27,28]. From the Penman–Monteith method, it is evident that most climatic parameters are affected by ETref, including air temperature, wind speed, relative humidity, and sunshine duration, as well as net radiation. In addition, various attribution analysis techniques have been applied to determine the contribution of climatic factors on ETref changes. The most widely used technique is a sensitivity coefficient analysis, which has been employed to measure the changes of ETref in response to an observed change of climatic parameters [23,29]. However, this method does not investigate the evaporative process, but only shows the relative contributions of climatic factors on ETref changes. Xu et al. [8] have developed a technique for analyzing the relative change of evaporation demand through statistical and mathematical modeling. This mathematical approach has been commonly used to calculate the relative changes in ETref analysis. For instance, Xu et al. [8], Li et al. [30], Liu et al. [31], and Huo et al. [32] used this technique for an attribution analysis of change in ETref in different regions of China. Similarly, in the present study, we successfully apply this technique to Jiangsu province in eastern China.
However, Liu et al. [15] showed a reverse relationship between rising temperature and reducing evaporation in southwest China, which appeared to represent a paradoxical situation and decreases the contribution of wind speed to the ETref changes to compensate for the increased contribution of mean air temperature. Wang et al. [23] found that the contributions of solar radiation, wind speed, and relative humidity are the major driving factors for the decrease in ETref for the three-river source region of China. Hence, further evaluation is essential to determine the relationship between climatic factors that causes changes in ETref in Jiangsu province. Attribution analysis of changes in ETref will involve a detrending method that will be discussed in detail in this study.
Evapotranspiration (ET), an important climatic parameter that mainly controls the water balance process, has a great impact on hydro-meteorology processes under a changing climate [33,34]. In water-limited regions, changes in ETref will be the result of changes in ET (and so the water balance), whereas in energy-limited regions they drive changes in ET. The change of ETref is a key component of hydro-meteorological studies in Jiangsu province. Several regional studies have documented the ETref in the Yangtze River basin [8,35,36]. Furthermore, a few studies have assessed the spatial distribution and temporal changes in the ETref trends and its magnitude and spatial patterns of ETref trends in eastern China. However, so far, changes in ETref and its contributing factors in Jiangsu province have yet to be investigated thoroughly, and the province is located in the Yangtze River Delta, which contributes to the highest GDP in economy and is an emerging developed region. As an important economic province, Jiangsu also ranks at the top in terms of agricultural systems in China. This province has distinctive monsoon climatic characteristics, which makes it inherently sensitive to climate change [37]. It is therefore important to investigate changes in ETref trends and its contributing factors, which can provide a theoretical basis and scientific guidance for the management and allocation of water resources in Jiangsu province. The goals of this study are to explore the spatial–temporal trends in ETref in the Jiangsu province based on weather data from 60 stations during 1961–2015, and to estimate sensitivities and contributing factors to changes in ETref through a detrending method applied to the Penman–Monteith FAO 56 model. It is anticipated that the outcomes of this study will provide better guidance for agricultural production and economic development in this vital region.

2. Materials and Methods

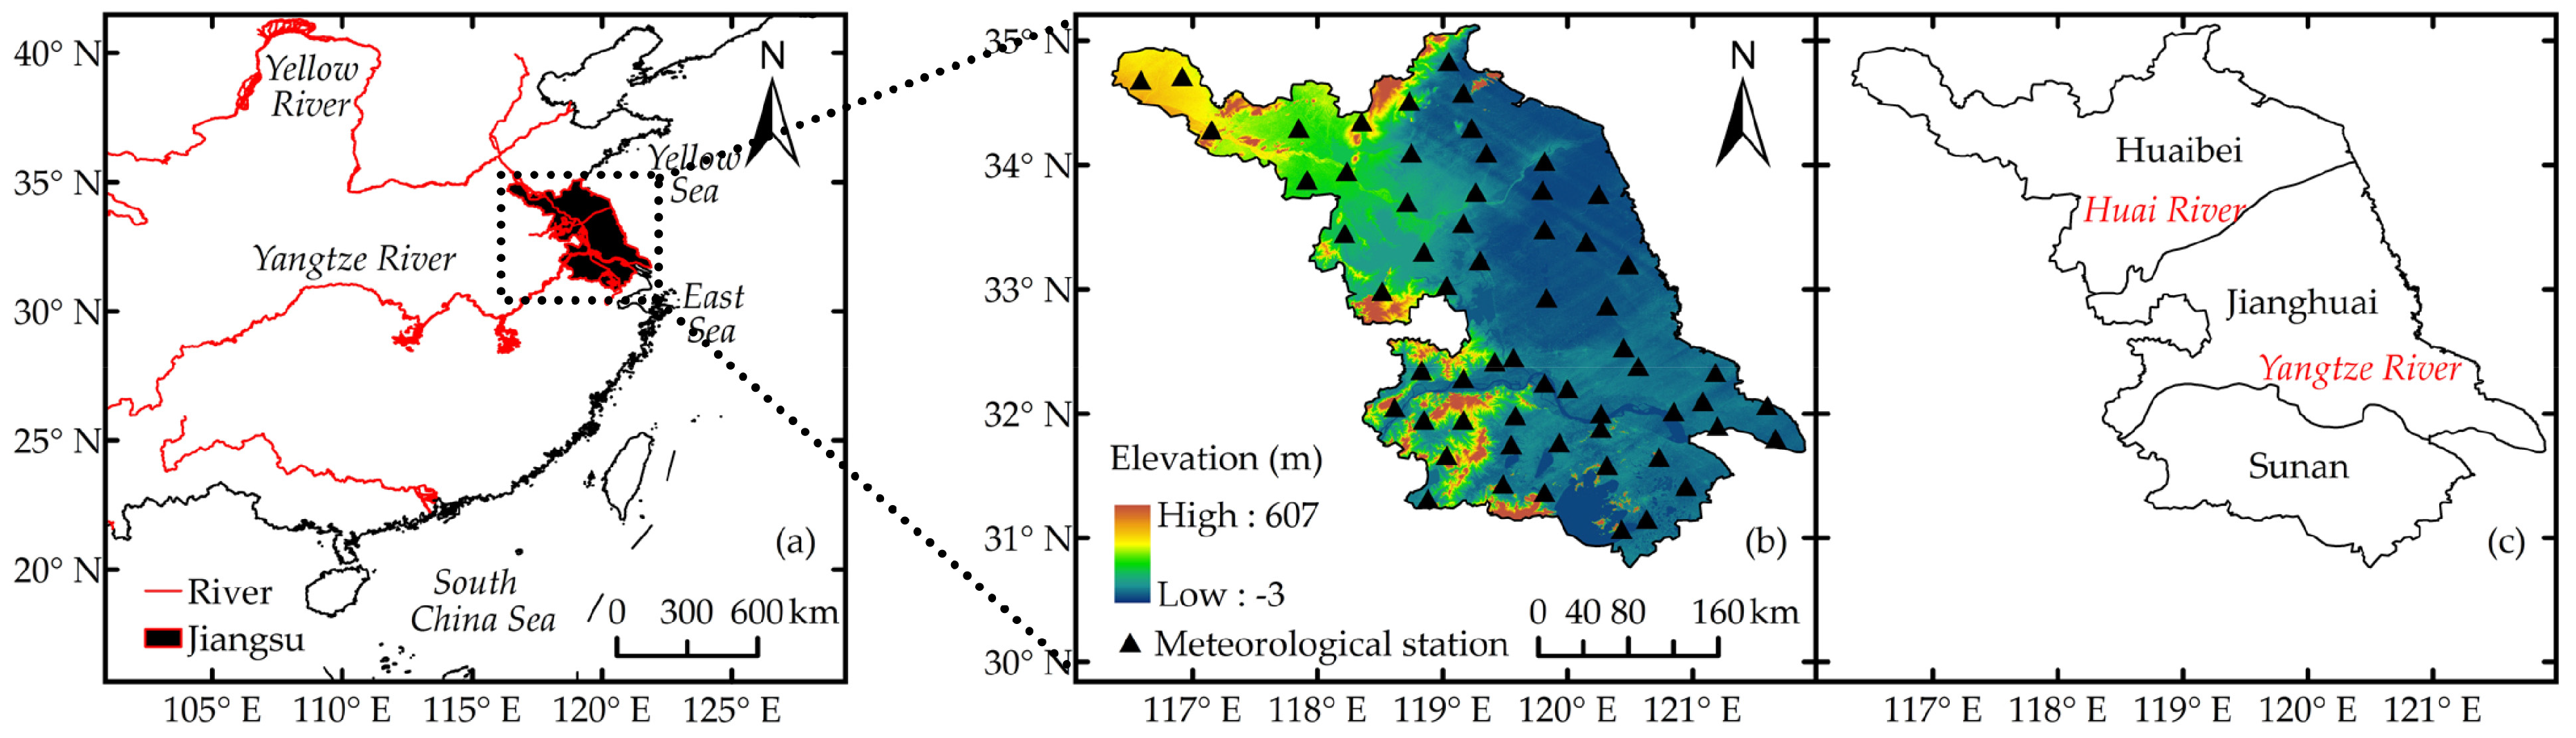
2.1. Study Area and Data Source

Jiangsu province is located on the eastern coast of China and at the lower reaches of the Yangtze River and Huai River, which across its south and north, respectively, cover an area of 1.03 × 10⁵ km2. The terrain primarily consists of plains, including the southern Jiangsu plain (south of Yangtze River), the middle Jianghuai plain (between Yangtze River and Huai River) and the northern Huang-Huai plain (north of Huai River), which comprises about 70% of the provincial area (Figure 1). The study area belongs to the East Asian monsoon zone and the transition between a subtropical zone and a warm temperate zone, which has distinct monsoon climate characteristics. Generally, the large area of the southern Huai River belongs to subtropical humid monsoon climate, the northern area belongs to temperate semi-humid monsoon climate [38]. There is a clear discrepancy between four seasons, the sunshine duration is 2000~2600 h, mean temperature is 13~16 °C, the frost-free period is about 200~240 days, and mean precipitation is 800 mm~1200 mm on an annual scale, with more than 60% of rainfall occurring during the summer season [39].
The locations of meteorological stations and the elevation are shown in Figure 1. The Jiangsu Province is divided into Huaibei, Jianghuai, and Sunan regions on the basis of two major rivers (Huai River and Yangtze River) and their regional climate characteristics. The basic climatic characteristics of the three sub-regions and the whole Jiangsu province are shown in Table 1. As seen from Table 1, the annual mean temperature (15.09 °C), the mean relative humidity (76.15%), wind speed (2.79 m·s−1), sunshine duration (2116.07 h), and annual reference evapotranspiration (892.24 mm) have been observed for the last 55 years (1961–2015) in the whole of Jiangsu province.
Ground-based daily meteorological data from 60 meteorological stations provided by the Jiangsu Meteorological Information Centre (JMIC) of the China Meteorological Administration (CMA) including the daily mean temperature (T, °C), maximum temperature (Tmax, °C) and minimum temperature (Tmin, °C), precipitation (P, mm), sunshine duration (SD, h), wind speed (WS, m·s−1) at 10 m height, and relative humidity (RH, %) during 1961–2015. The station dataset is checked by the JMIC. In addition, this study has performed routine quality checks and error correction for data following the techniques defined by Peterson et al. [40]. The four seasons are spring (March–May), summer (June–August), autumn (September–November), and winter (December–February of the next year).

2.2. Penman–Monteith FAO 56 Model for ETref Estimation

The Penman–Monteith FAO 56 model is a broadly accepted method for estimating ETref suggested by the Food and Agriculture Organization (FAO) of the United Nations [27]. The method employed in this study because it is physically based and integrates physiological characteristics and aerodynamic variables. According to the Penman–Monteith FAO 56 model, the ETref is estimated by the following:
E T r e f = 0.408 Δ ( R n G ) + γ 900 ( T + 273 ) u 2 ( e s e a ) Δ + γ ( 1 + 0.34 u 2 ) ,
where E T r e f is the reference crop evapotranspiration (mm·d−1), Δ is the slope of temperature variation with saturated vapor pressure (kPa·°C−1), R n is the net solar radiation flux (MJ·m−2·d−1), and G is the soil heat flux density (MJ·m−2·d−1), which is negligible relative to R n , especially for vegetated coverage and at daily time steps, thus it may be ignored and G = 0. γ is a psychrometric constant (kPa·°C−1), T is the daily mean air temperature (°C), u 2 is the wind speed at 2 m height (m·s−1), e s is the saturation vapor pressure (kPa), and e a is the actual vapor pressure (kPa).
For the calculation of ETref, wind speed at 2 m height can be converted from the wind speed measured at 10 m based on the Penman–Monteith FAO 56 model as follows:
u 2 = u z 4.87 ln ( 67.8 z 5.42 ) ,
where z is the measured height above the ground surface (m) and u 2 and u z are the wind speed at 2 and z meters height, respectively.
In this study, the total net solar radiation in the background is estimated based on the measured data of sunshine duration, combined with the Angstrom formula [41], which is given below:
R s = ( a s + b s n N ) R a ,
where R s is the daily total solar radiation reaching the ground (MJ·m−2·d−1), n is the daily measured sunshine duration hours (h), N is the greatest possible sunshine duration hours (h), R a is the extraterrestrial solar radiation (MJ·m−2·d−1), and a s and b s are the regression coefficients—according to Chen et al. [42], the values were set to 0.19 and 0.53, respectively. Equations (4)–(6) are used to estimate incoming shortwave and outgoing long-wave radiation:
R n s = ( 1 α ) R s
R n = R n s R n l
R n l = σ ( T max , K 4 + T min , K 4 2 ) ( 0.34 0.14 e a ) ( 1.35 R s R s o 0.35 ) ,
where R n s is the net incoming shortwave radiation (MJ·m−2·d−1), α (=0.23) is the albedo of the reference grassland, R n l is the net outgoing long wave radiation (MJ·m−2·d−1), σ is the Stefan–Boltzmann constant (=4.903 × 10⁻⁹ MJ·K−4·m−2·d−1), R s o is the calculated clear-sky radiation (MJ·m−2·d−1), and R s / R s o is the relative shortwave radiation. Detailed calculation procedures can be found in Chapter 3 of the FAO Irrigation and Drainage paper No. 56 [27].

2.3. Statistical Test for Trend Analysis

The Mann–Kendall (MK) statistical test [43,44] is a rank-based nonparametric method that has been extensively applied to the analysis of trends in reference evapotranspiration and related meteorological factors in hydro-meteorological time series data. One advantage of this MK test is that the dataset does not require the underlying data to follow a specific distribution. It can handle non-normality, missing values, or seasonality and is reliable for biased variables [45,46]. A nonparametric MK test was employed to show the trend variation in annual and seasonal ETref for each region in this study. Positive (negative) normalized Z values from the MK test indicate rising (declining) trends, respectively. An absolute Z value of the MK test exceeding 1.96 indicates that ETref has a significant change trend at the 95% confidence level, while an extremely noteworthy change trend was identified at the 99% significant level for the absolute Z value of the MK test more than 2.56. Additionally, to identify whether a trend exists, the Theil–Sen slope estimator developed by Sen [47] was used to determine the extent of a trend. This technique has been generally applied to detect the slope of a trend line in a hydro-meteorological time series dataset [48].

2.4. Spatial Interpolation Method for ETref

The IDW (Inverse Distance Weighted), a simpler numerical method, was used to investigate the spatial distribution of ETref in Jiangsu province. It has been widely applied to the spatial interpolation of climatic and hydrological point data like ETref [49], as well as rainfall [50]. Among various interpolation techniques, the IDW method was employed for the spatial distribution in the present study due to its easiness and estimated accuracy in comparison with other interpolation models like kriging. So we calculated the annual average estimated ETref at each station and then spatially interpolated it. All spatial interpolations were accomplished using ArcGIS 9.3 software (Environmental Systems Research Institute (ESRI), Redlands, CA, USA). The justification for using the IDW method is that this technique can compute the spatially interpolated values very fast and accurately.

2.5. Calculation of Sensitivity Coefficient

To identify the sensitivity of ETref related to climatic factors, a mathematically based sensitivity coefficient proposed by McCuen [29] in 1974 was applied in this study. Equation (7) is used to calculate the sensitivity of ETref as a mathematical basis:
S ( v i ) = lim Δ v i / v i ( Δ E T r e f / E T r e f Δ v i / v i ) = E T r e f v i × v i E T r e f ,
where S ( v i ) is the non-dimensional sensitivity coefficient of E T r e f with respect to the climate variable ( v i ). Positive (negative) sensitivity coefficients indicate that E T r e f increases or decreases with increases in the climate variable v i (where v i is TA, VP, WS or SD). The absolute value measures the effect a given climate variable has on E T r e f . E T r e f / v i was calculated by partial differentiation of Equation (1); the detailed calculations can be found in the appendix of this paper.

2.6. Detrending Method

To evaluate the contributions of key meteorological factors to the change trend of ETref quantitatively, the detrending method, a statistical and mathematical operation of removing trend from the series, was employed in this study [8,30,31]. This is a simple but effective method. The main step of this method calculated by simple linear regression is demonstrated as follows:
g ^ t = b ^ t + a ^ ,
where b ^ and a ^ are the fitted linear regression coefficient and constant, respectively. g ^ t is the fitted trend in time t . Then we removed the trend by subtracting the value of the trend line from the original data. Furthermore, to avoid negative values (e.g., VP, WS, and SD), the detrended dataset is currently defined as below:
y t = x t g ^ t + g ^ 1 ,
where x t is the original time series of meteorological factors, g ^ 1 , corresponds to the first value of g ^ t , and y t is the ultimate detrended time series.
After removing the change trend in key meteorological factors, recalculating the ETref by using the detrended data series of one stationary meteorological factor and using the original data of remaining variables, comparing the recalculated ETref with the original value, the difference between them is identified as the contributions of that variable to the change trend of ETref. In order to quantify the contribution, an assessment index R is used to calculate by the following:
R = i = 1 n E T 0 0 i E T 0 R i E T 0 0 i ,
where E T 0 0 and E T 0 R represent the original and recalculated ETref, respectively. n denotes the length of the time series. The larger the absolute value of R , the greater the contribution of that meteorological variable to the change trend of ETref. R > 0 , R < 0 and R = 0 indicate that the trend in that meteorological variable has a positive, negative, or no contribution to the trend in ETref, respectively.

3. Results

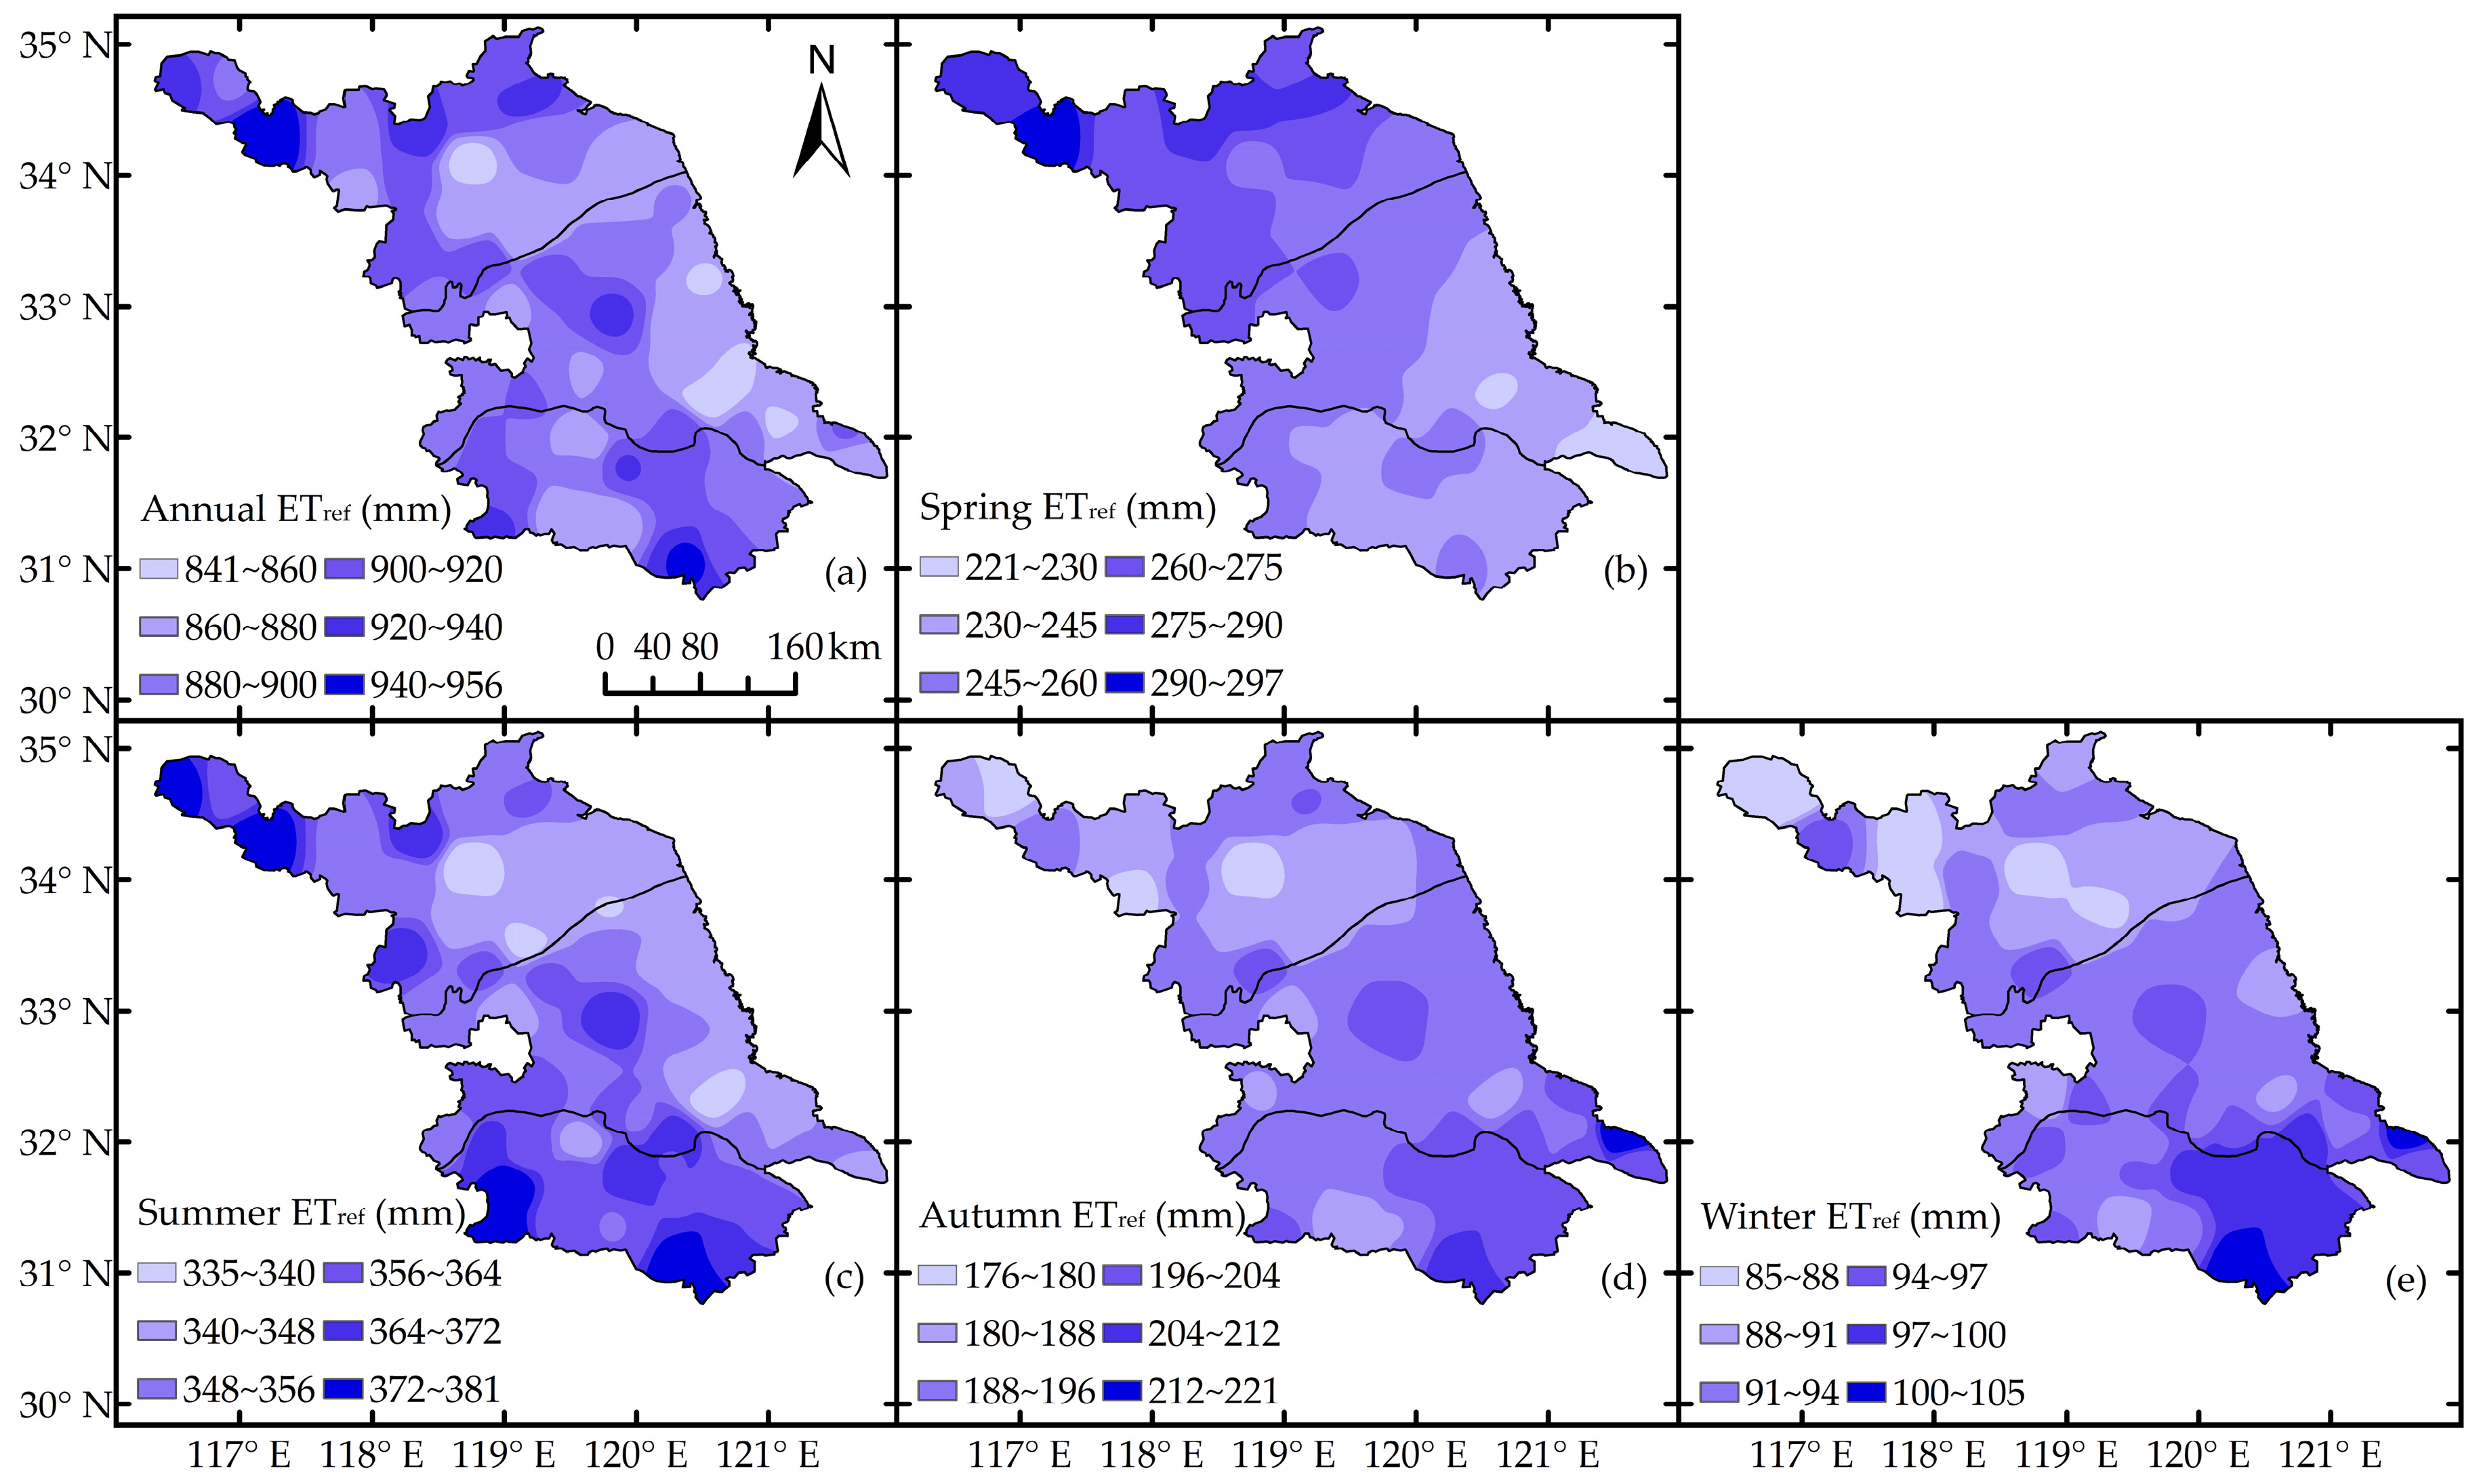
3.1. Spatial Distribution of Seasonal and Annual ETref

Different spatial distributions of seasonal and annual ETref are shown in Figure 2. The ETref was higher in summer (335 mm~381 mm), followed by spring (221 mm~297 mm), autumn (176 mm~221 mm), and winter (85 mm~105 mm). The mean annual ETref over the whole Jiangsu province was about 892 mm during 1961–2015 (Table 1). In spring, the highest value was found in the Huaibei region. However, in the summer season, the spatial distribution of ETref showed a discrepancy, where the highest values were noticed in the Sunan region. Compared to the two seasons like autumn and winter, which had a similar spatial distribution of ETref, the higher value was observed in the southeast part of Jiangsu province (Sunan and Jianghuai region). In general, the annual spatial distribution of ETref had a relatively high value in northwest and south parts and low value in the central part of Jiangsu province (Figure 2a).

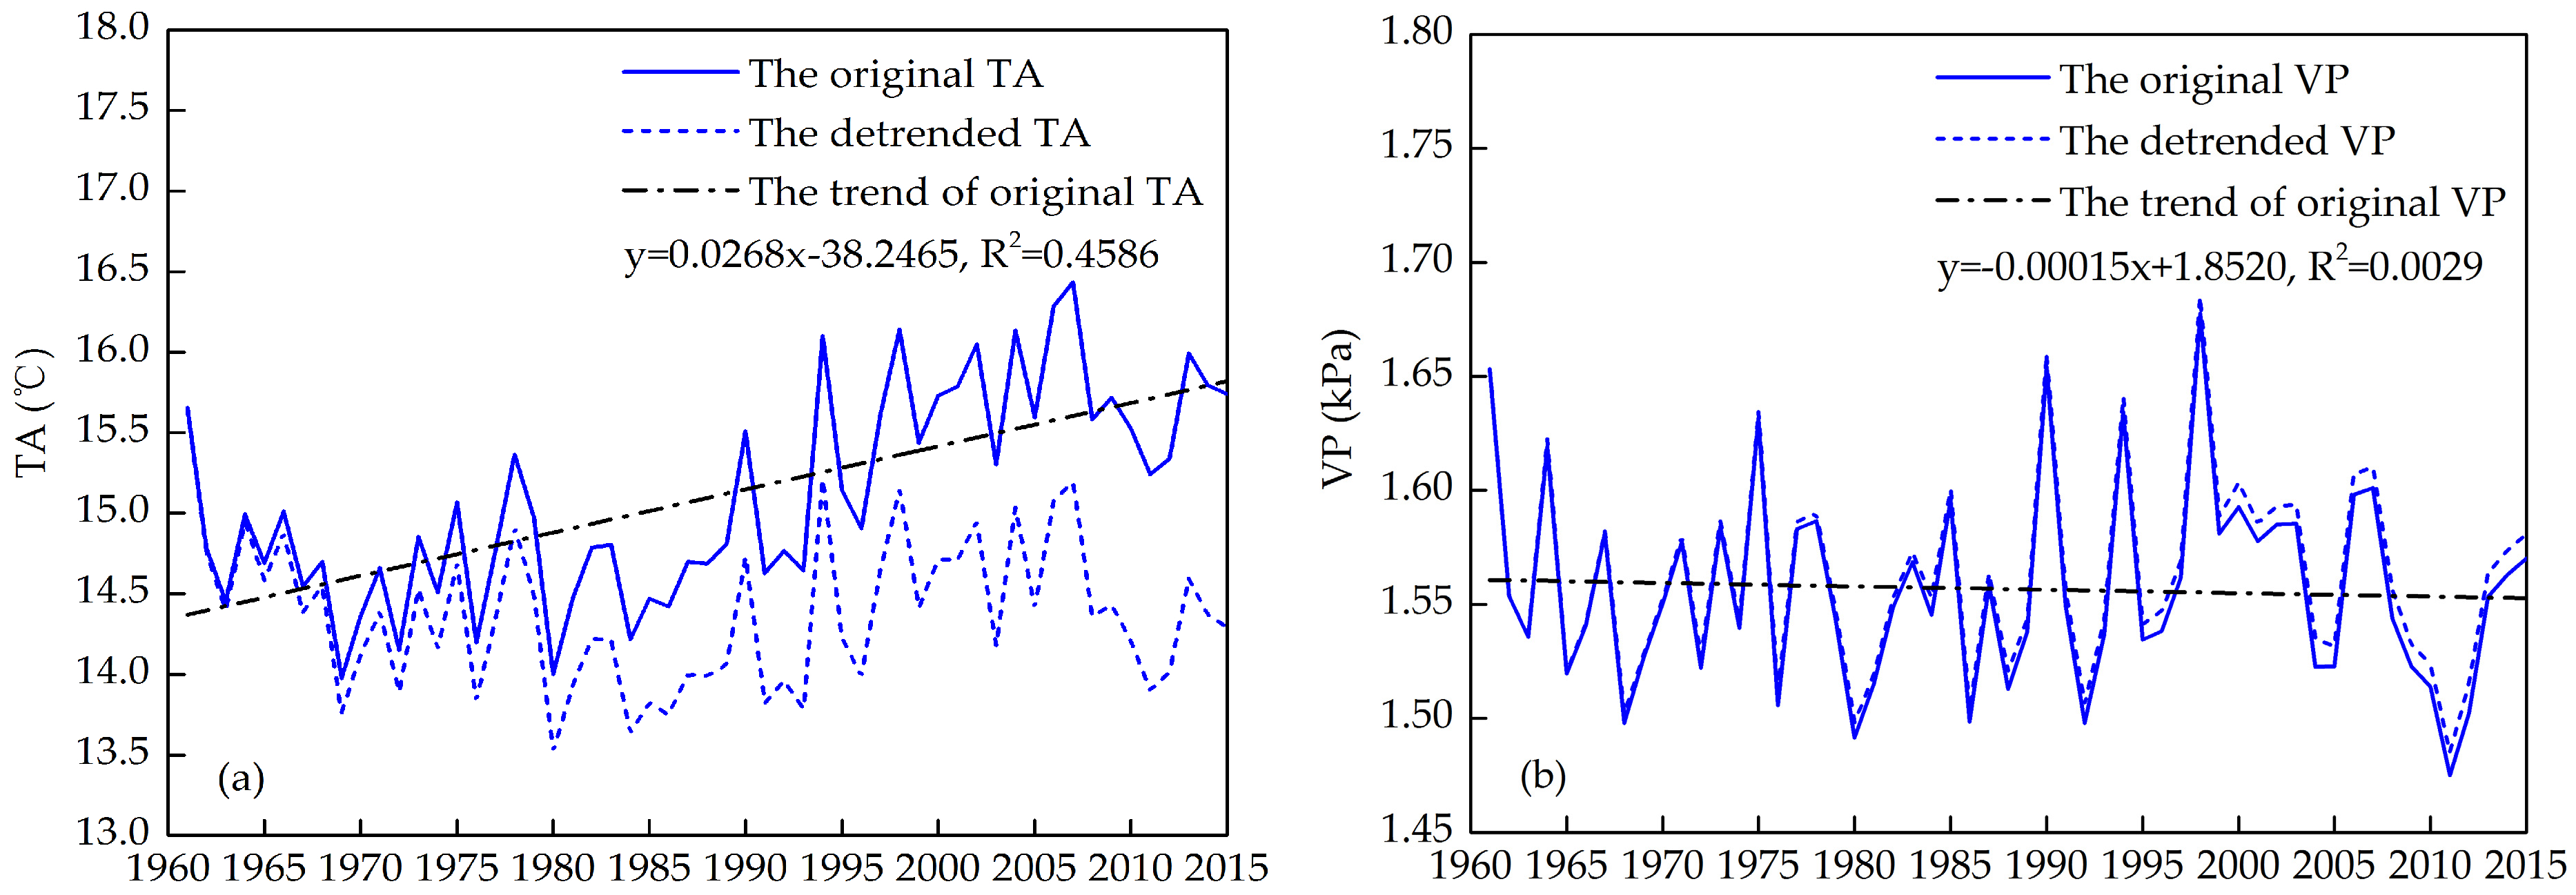
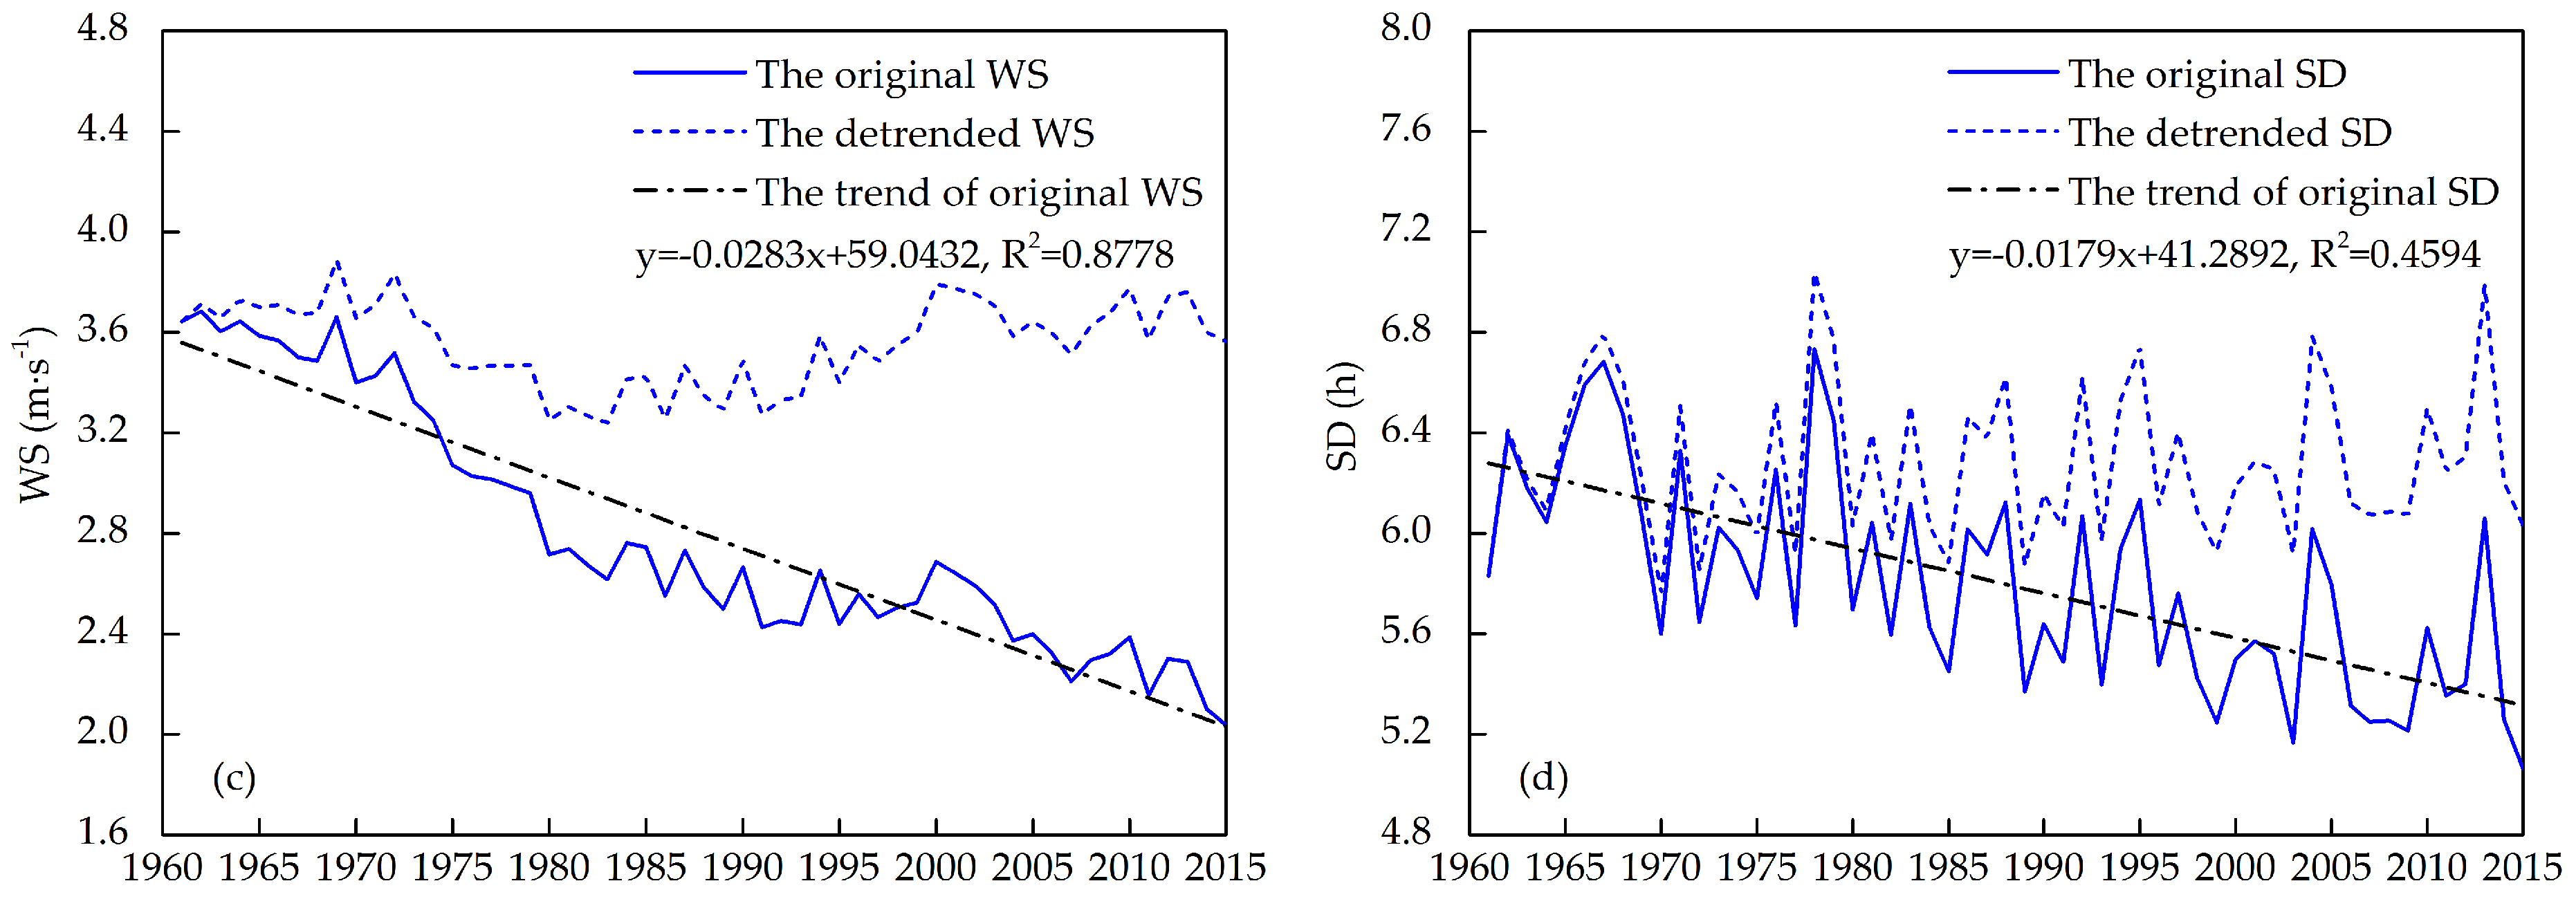
3.2. Temporal Trends in Seasonal ETref and Climatic Factors

Table 2 presents the results of temporal trend for ETref. On the annual scale, the ETref values showed a slightly insignificant decreasing trend (−0.245 mm·a−2) in the whole of Jiangsu province. A significant decreasing tendency (at 99.9% confidence level) was identified in the Huaibei region (−1.468 mm·a−2), whereas a slightly increasing trend of ETref was observed in the Jianghuai (0.207 mm·a−2) and Sunan (0.592 mm·a−2) regions.
ETref showed a significant increasing tendency in spring and decreasing tendency in the summer, with rates of 0.526 mm·a−2 and −0.701 mm·a−2, respectively, at the seasonal scale. The trend of ETref in winter was lower than in autumn. ETref in spring showed an increasing trend, especially significant in the Jianghuai and Sunan regions. The most significant decreasing trend of ETref was presented in the summer, particularly in Huaibei. A slight increasing trend was shown in the whole region in autumn, mainly due to the slight significant declining trend in Huaibei region combined with the slight significant increasing trends in Jianghuai and Sunan regions. Despite a decreasing trend shown in winter for the Huaibei region, the whole region exhibited a slight increasing trend, mainly due to the contributions of the slight increasing trends in the Jianghuai and Sunan regions.
The slopes of linear trends in climatic factors are shown in Table 3. Mean temperature in different seasons and regions revealed a significant increasing tendency, except for the summer season. On the contrary, wind speed and sunshine duration were shown to have significant declining trends, in addition to the sunshine duration in spring, which demonstrated a slight decreasing trend in the Huaibei region and a slight increasing trend in the Jianghuai and Sunan regions. However, compared to the other three climatic factors, the change trend of VP is too small, only exhibiting a significant downward trend in summer, except for the Huaibei region.

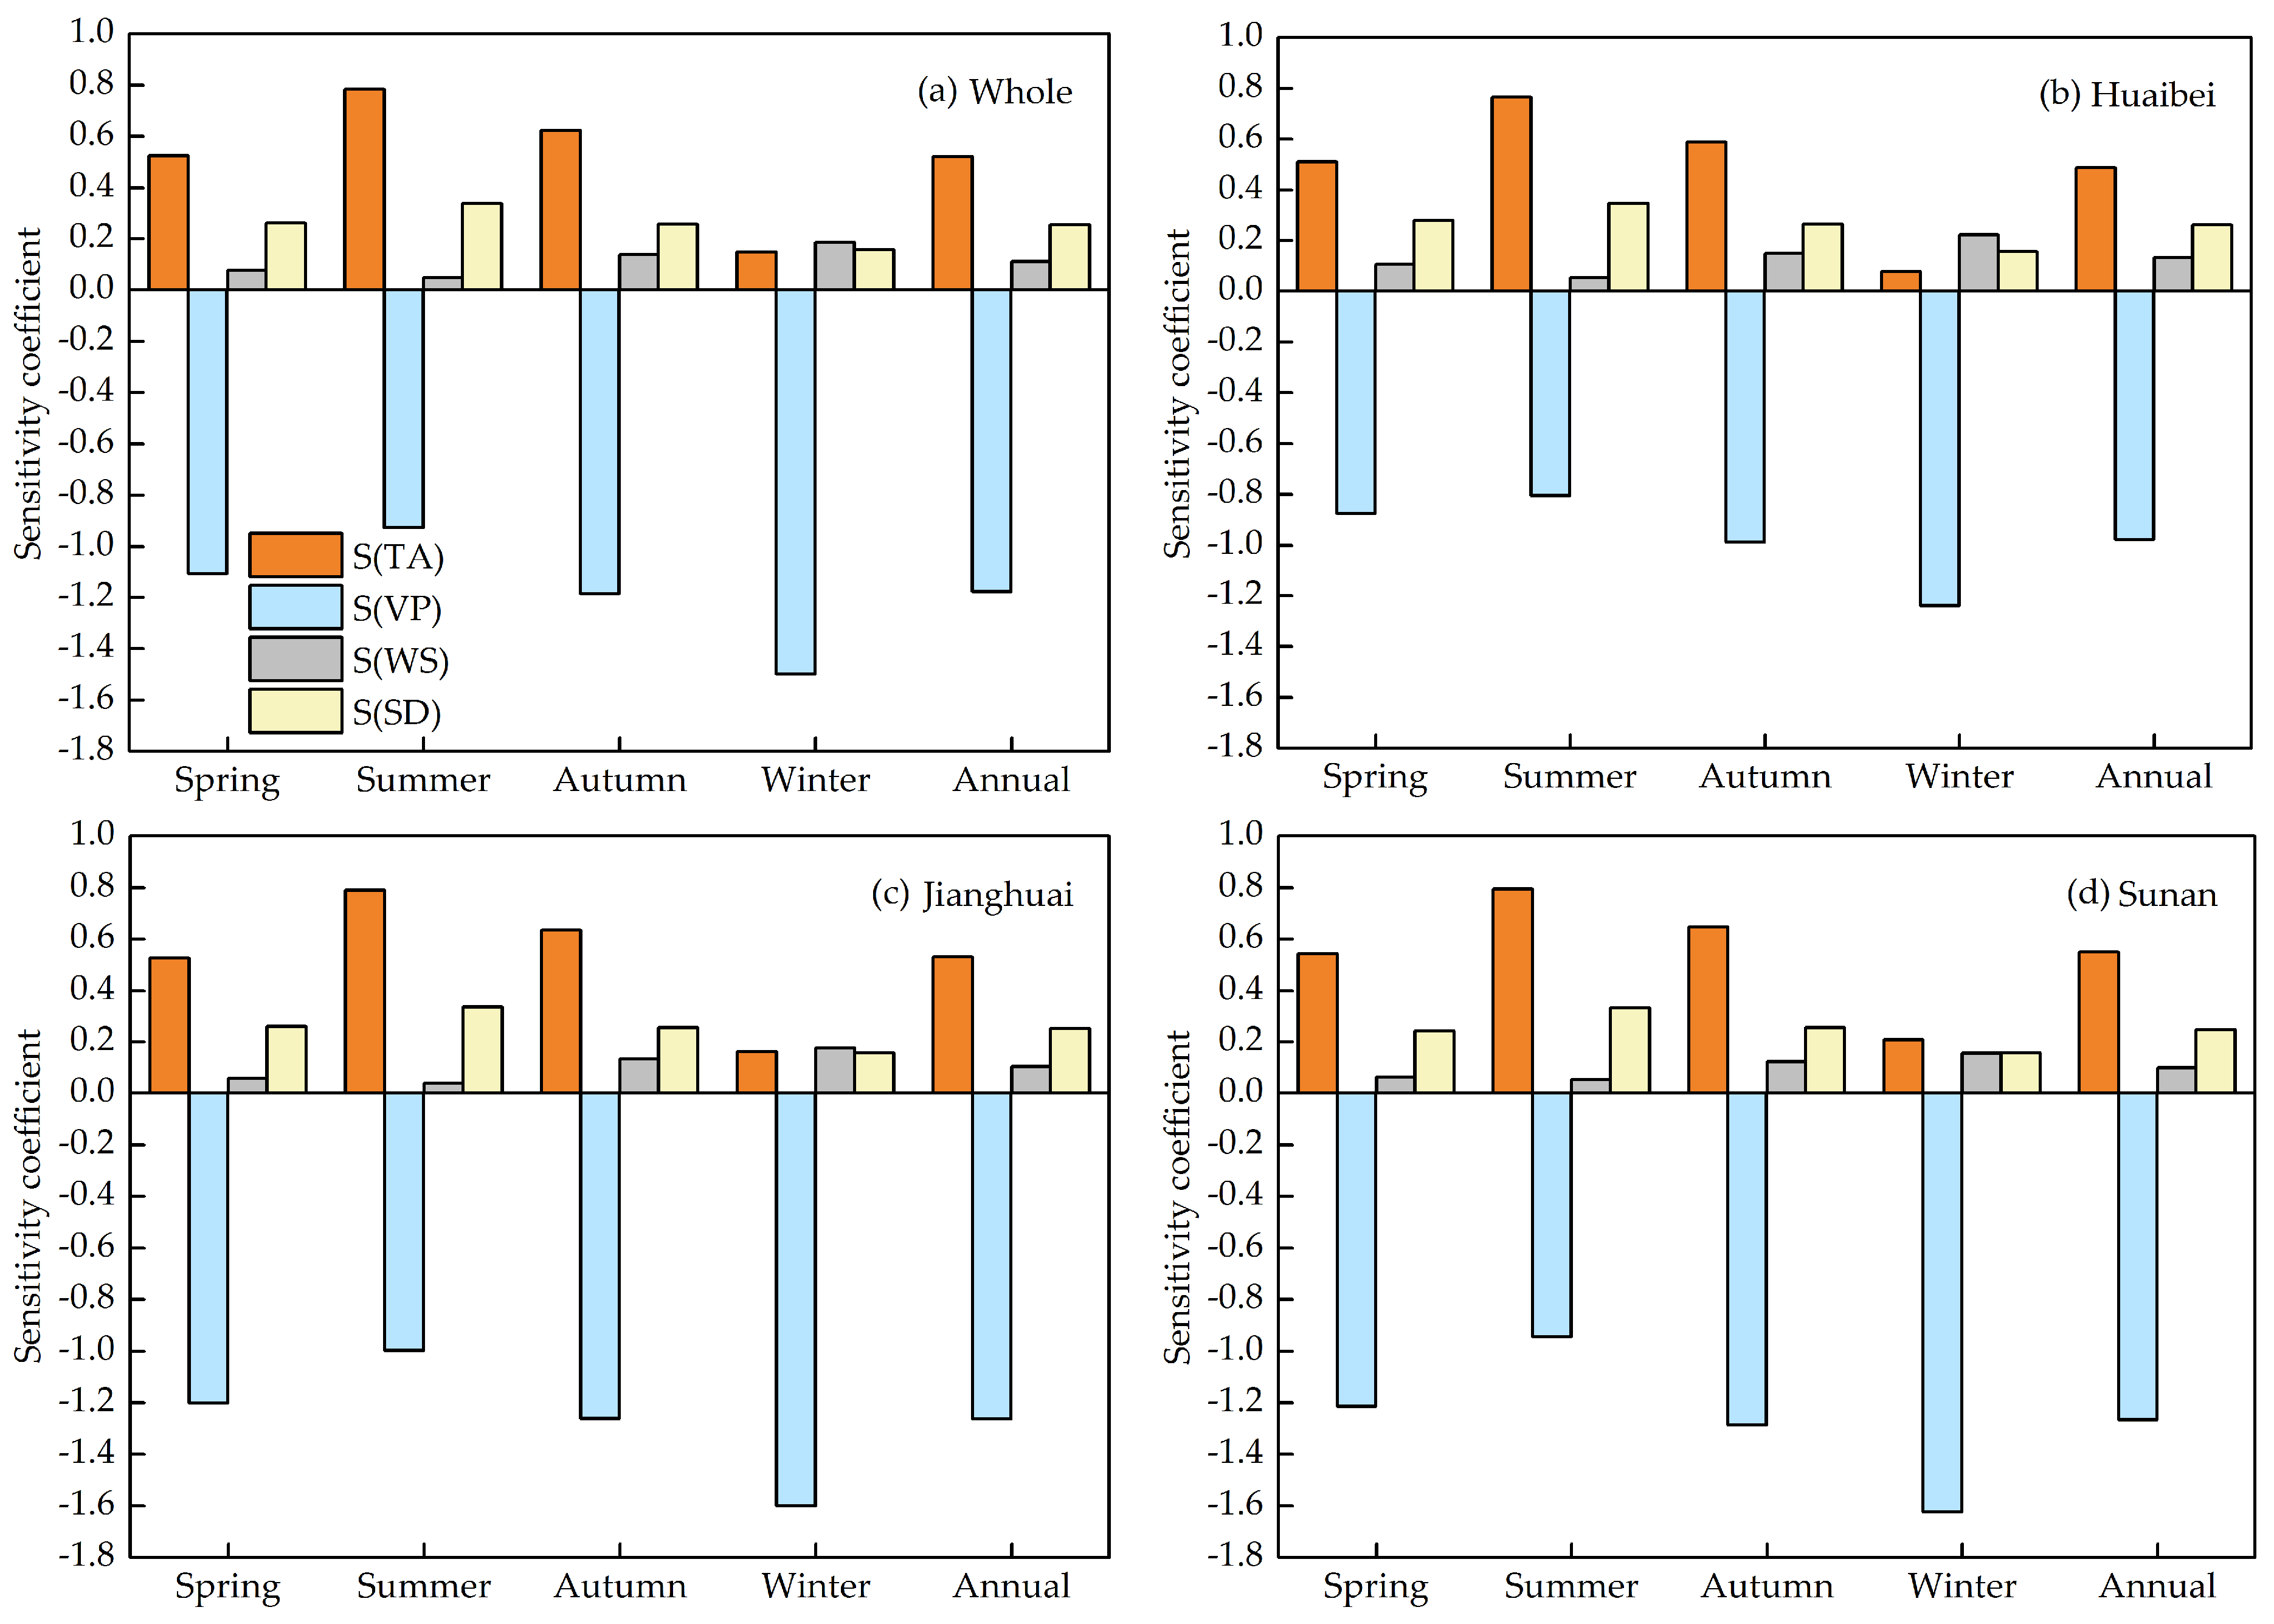
3.3. Sensitivity Coefficients of ETref to Climatic Factors

The sensitivity coefficients of seasonal and annual trends of ETref to each climatic factor by partial derivative are displayed in Figure 3. There are clear differences in the sensitivity characteristics for the four climatic factors and a slight discrepancy exists in the three regions of Jiangsu province. Generally, TA (air temperature), WS (wind speed), and SD (sunshine duration) produced a positive effect, whereas the VP (actual vapor pressure) had an adverse effect on seasonal and annual ETref. The results show that S(TA) and S(SD) were larger in the summer, but smaller in the winter, indicating that ETref was most sensitive to TA and SD in the summer compared to other seasons. The sensitivity coefficient of ETref to climatic factors ranked in a sequence as VP > TA > SD > WS. It can be said that the actual vapor pressure (VP) and air temperature (TA) were the greatest sensitive factors, while wind speed (WS) was shown to be the least sensitive factor of ETref, contrary to TA and SD, which had a relatively higher value in winter but lower in summer (Figure 3).

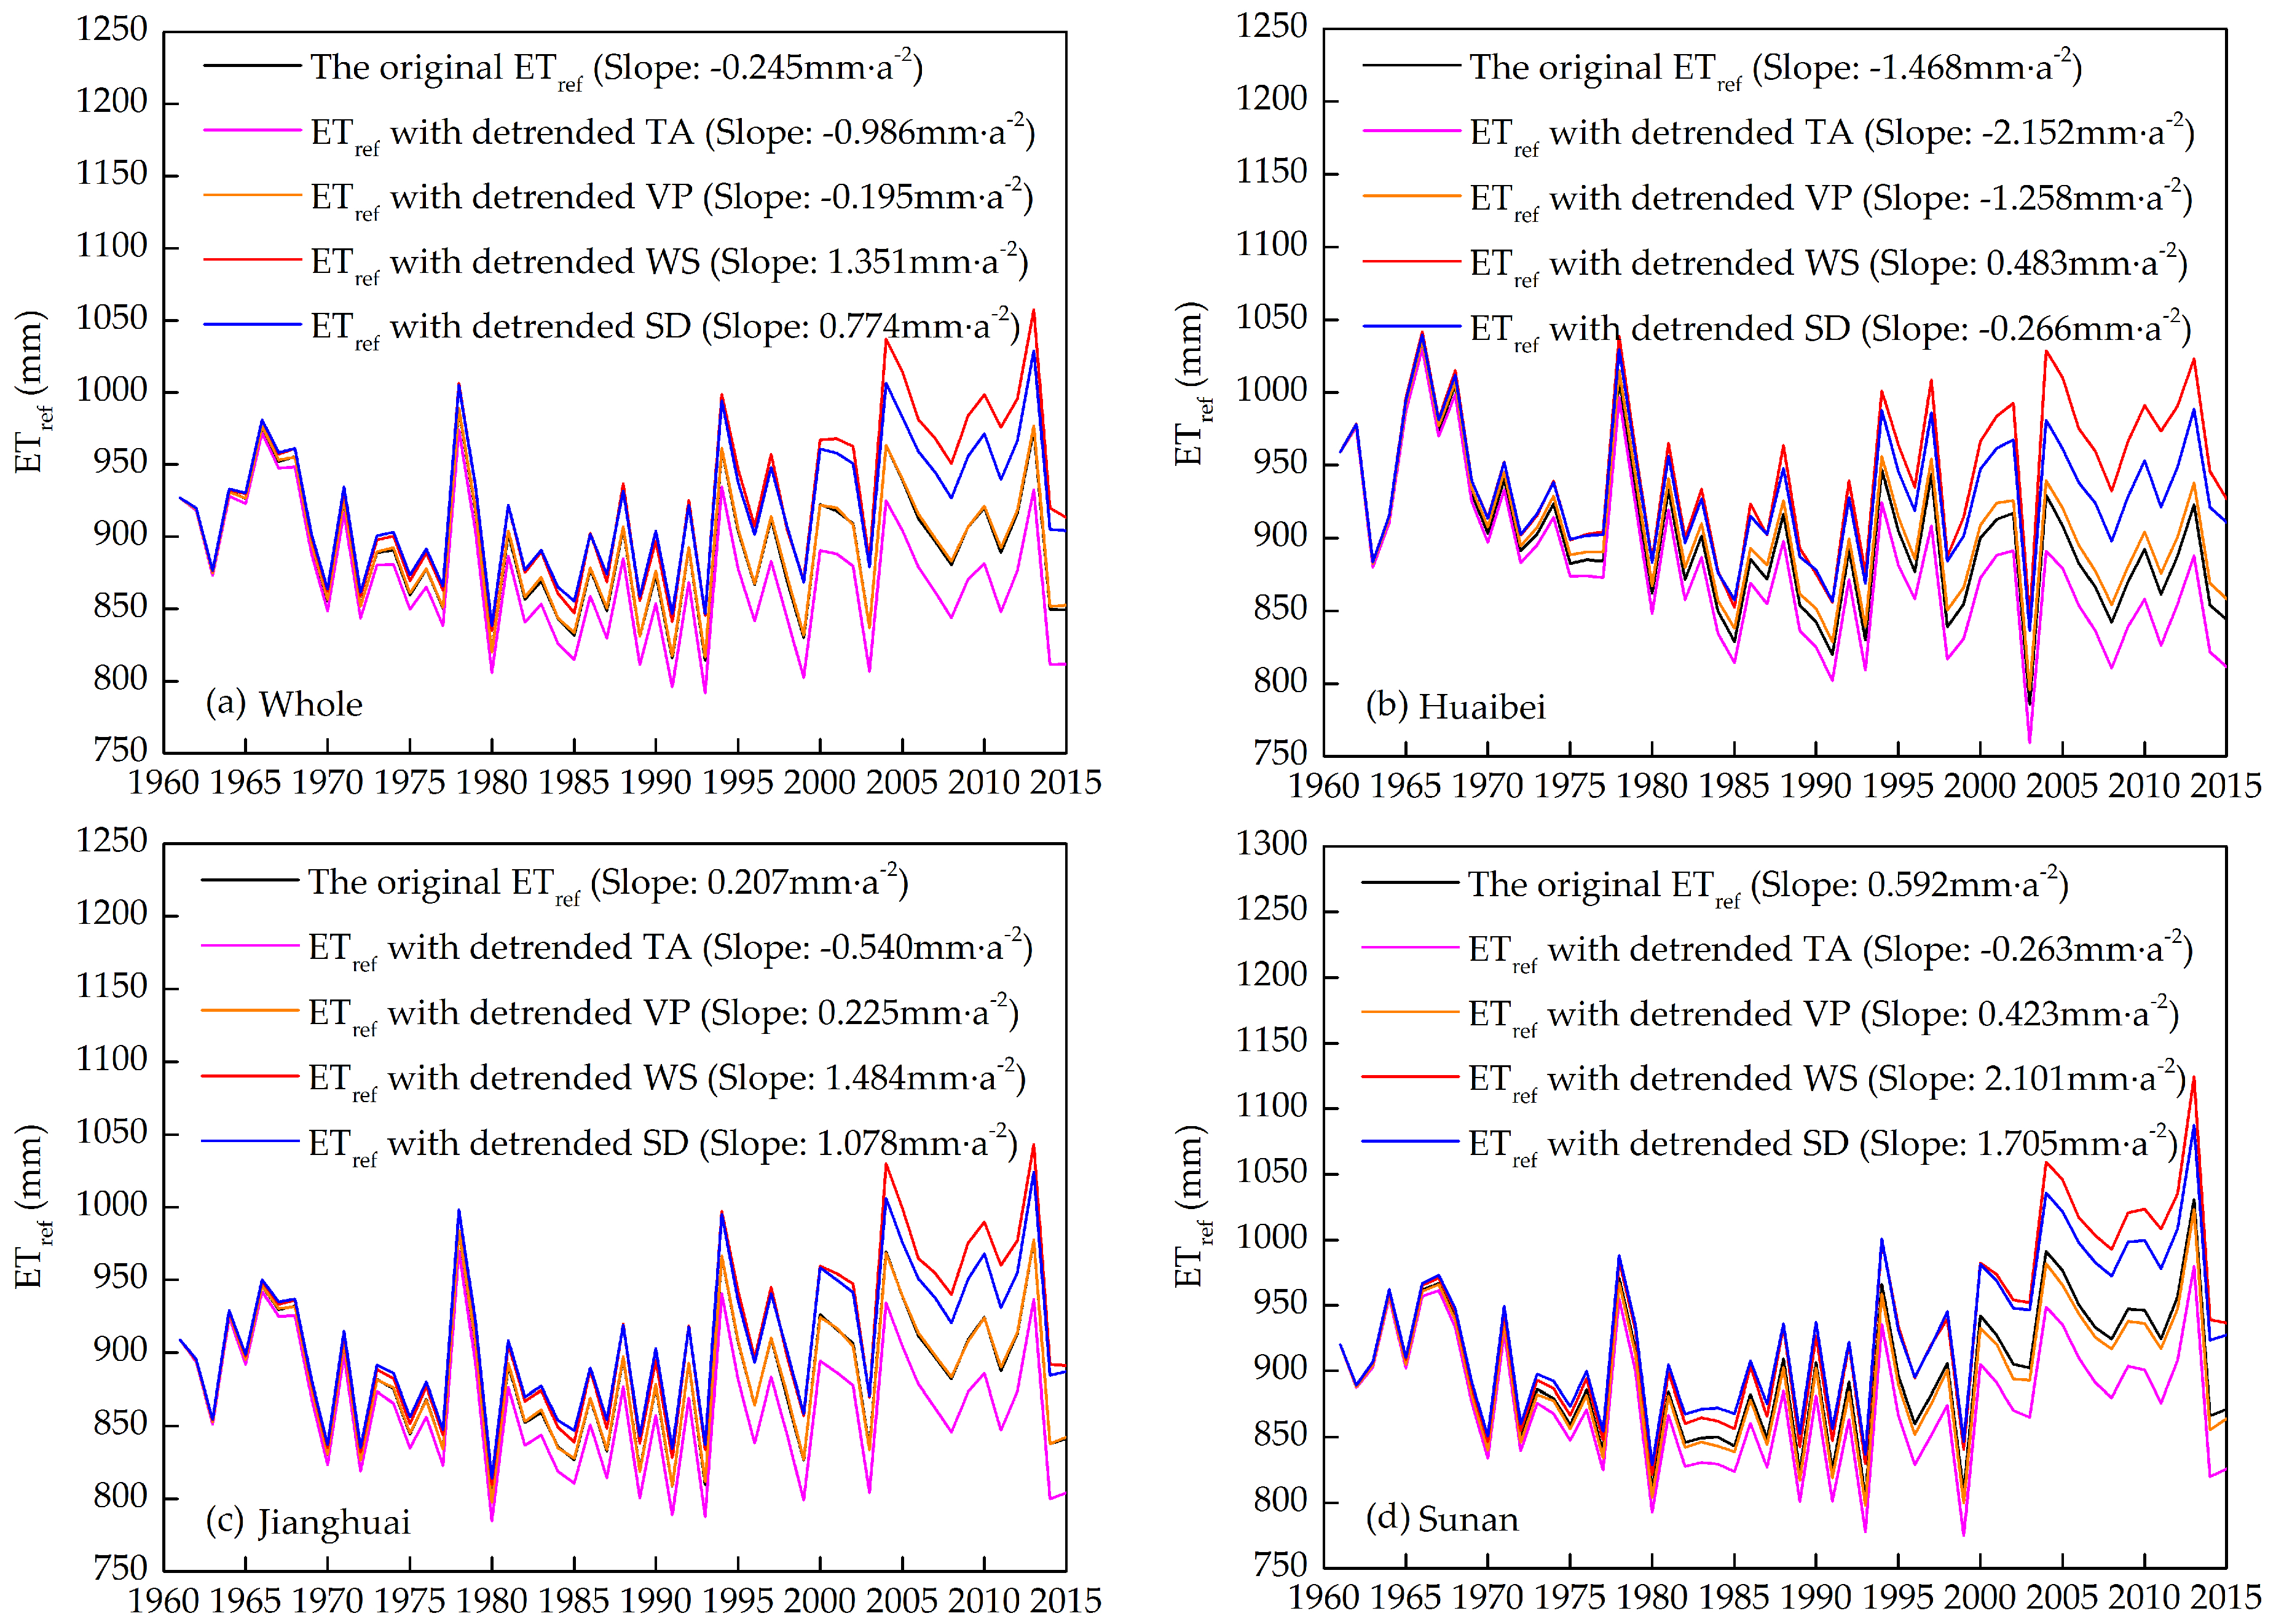
3.4. Contributions of Climatic Factors to the Trends in ETref

The original and detrended climatic factors over the whole Jiangsu province are presented in Figure 4. Noticeable differences can be seen between the original and detrended datasets for each climatic factor, with a negative trend for TA and positive trends for VP, WS, and SD. The detrended TA was lower than the original data series, whereas the detrended VP, WS, and SD were higher than the original data series, especially the most obvious difference in WS. However, the difference between the original and detrended data series of VP was smaller than for the other three climatic factors at an annual scale in the whole region.
To understand a change event in seasonal and annual ETref due to the contributing factors, it is essential to analyze the contribution of each climatic factor to the change in seasonal and annual ETref. Results in Figure 5 demonstrate that the most important climatic factor dominating the trends in annual ETref on the whole Jiangsu province followed the order WS > SD > TA > VP. In general, the ETref recalculated with detrended TA and detrended VP was smaller than that calculated from the original climatic factors. On the contrary, the ETref recalculated with detrended WS and detrended SD was larger than that calculated from the original climatic factors. In other words, TA and VP had positive contributions to ETref, except VP in the Huaibei region, which exhibited a negative contribution, while WS and SD showed the opposite ones. In the end, the negative contributions would offset the positive one.
On the annual scale, the contributions of WS and SD were greater than the total contributions of TA and VP, indicating a downward trend of ETref in the whole of Jiangsu province. Nevertheless, the variations of the climatic factors in three sub-regions caused different contributions to ETref. Similar results of ETref calculated with detrended WS, SD, and TA can be found in each sub-region of Jiangsu province; however, a small but interesting difference can be obtained between the original ETref and the recalculated ETref with detrended VP in the three sub-regions. The recalculated ETref with detrended VP was higher than that calculated from the original climatic factors in the Huaibei region; on the contrary, the result was opposite in the Sunan region, which exhibited a lower value compared with the original ETref. The reverse results demonstrated the varying trend of VP in the annual scale, which had been detected in Table 3; this also means it plays an important role in the contribution of an ETref trend across the different regions to some extent, although the variation is small and non-significant. From the results presented above, the contribution of ETref was a synergistic effect of various climatic factors; for example, significant decreasing WS and SD were the most crucial factors for the decreasing trend in ETref. TA was the main contributing factor to the increasing trend in ETref in each region of Jiangsu province, followed by WS and SD. The non-significant trend in VP made the smallest contribution to the trend of ETref; however, it could not be ignored due to the variability and the effect of the contribution to ETref, as well as being the most sensitive factor to ETref. In contrast, the contribution of WS was greater than other factors.
On the seasonal scale, due to the limited space, we established an assessment index R that was used to quantify the contributions of TA, VP, WS, and SD to the change trends of ETref. Similar findings like Figure 5 can be obtained from Table 4, where TA had a positive contribution to the trend of ETref; however, WS and SD had an adverse contribution in most regions except Jianghuai and Sunan in spring. In spring, the contribution of TA was the largest, followed by WS and SD except for the Huaibei region, whereas WS made a much greater contribution, followed by TA, VP, and SD. In summer, the contribution of SD played a dominant role in each region. In autumn, the contribution of WS was larger than other climatic factors, followed by TA, SD, and VP. Meanwhile, in winter, the contribution of the WS to ETref was much stronger than in the other three seasons. TA was the unique positive contributing factor, followed by WS, which led to an increasing trend in ETref. However, contrary to our expectations, the contribution of VP was much greater than in other seasons, and it also exhibited a negative contribution to ETref. This also confirmed the importance of VP, which has been discussed above, especially in the winter for the whole region.

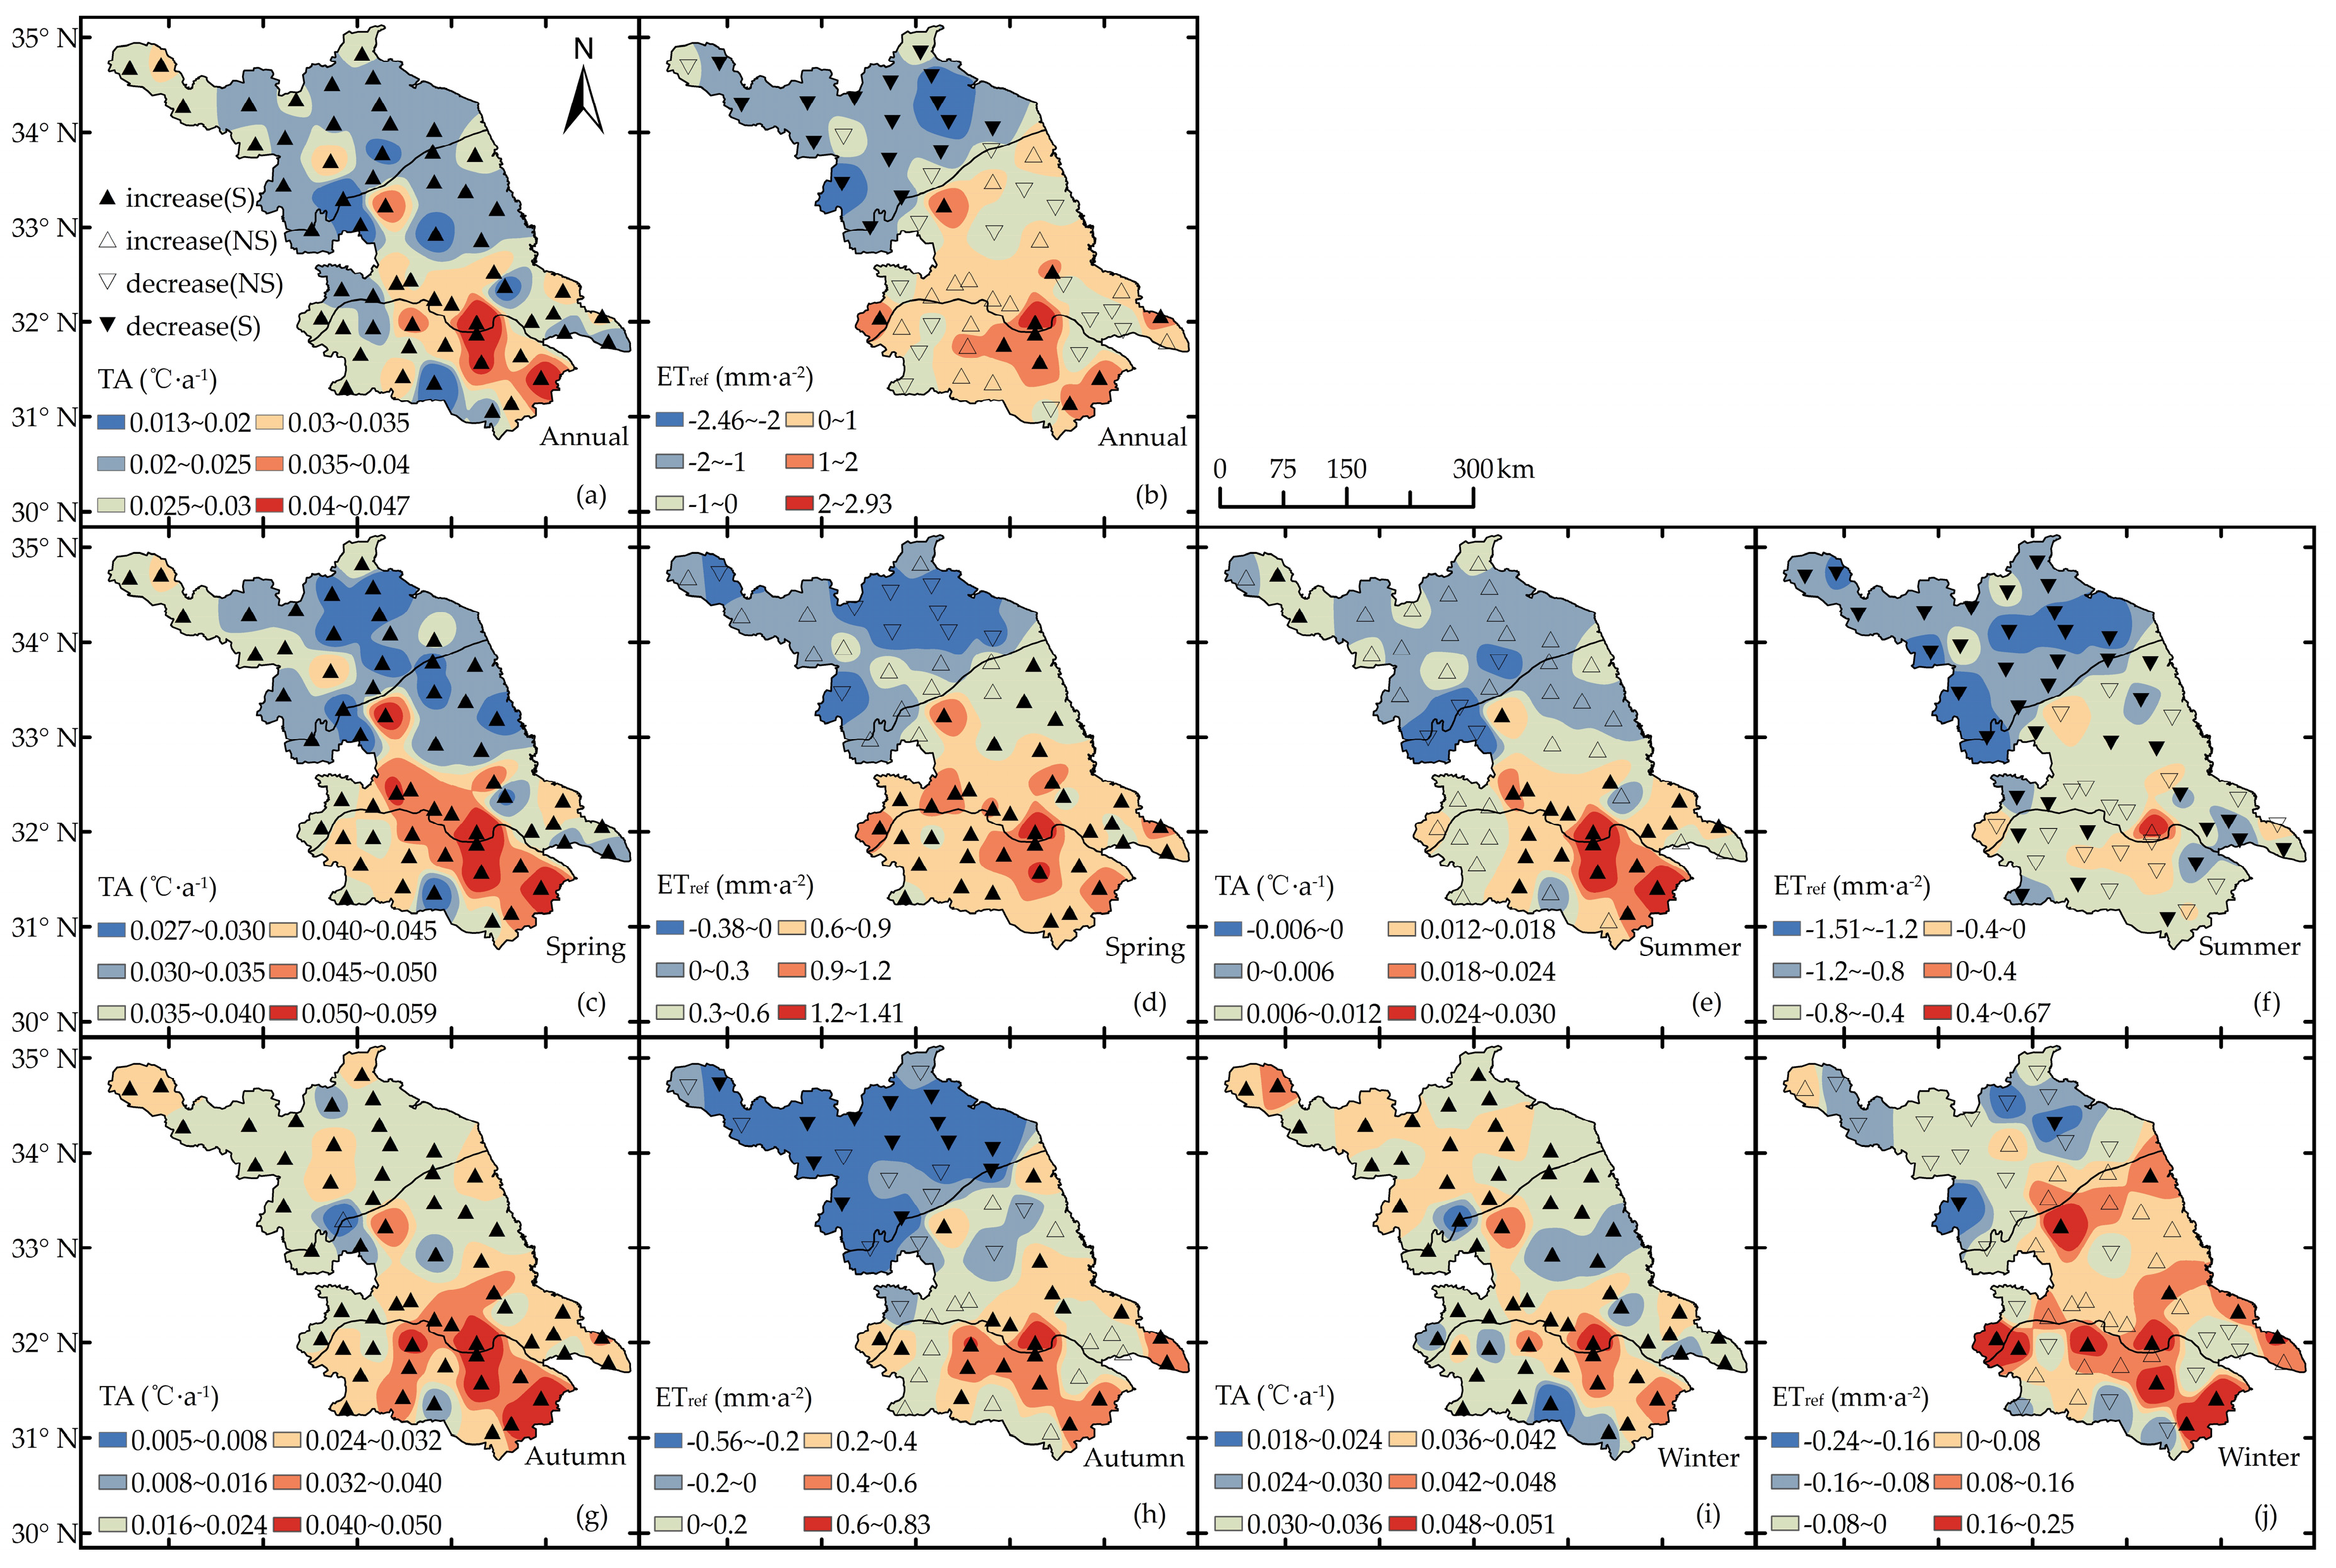
3.5. Evaporation Paradox Analysis with Trends of TA and ETref

The evaporation paradox has become a debatable issue against the backdrop of global climate warming and decreasing evaporation scenarios [23]. It can be seen from Figure 6 that the mean temperature (1961–2015) had a significant increase in the whole of Jiangsu province when the rate of climatic tendency ranged between 0.013 °C·a−1 and 0.047 °C·a−1, with an especially high rate in the Jianghuai and Sunan regions. The climatic trend rate of ETref ranged between −2.46 mm·a−2 and 2.93 mm·a−2, indicating a distinctly various distribution on the spatial scale. A positive trend of ETref was found in the Jianghuai and Sunan regions, while a significant overall downward trend was observed in Huaibei; the reason is the decrease of WS and SD, despite being accompanied by a significant increase in TA.
Meanwhile, in the spring, the distribution of the TA was the same as the annual—both strong increasing tendencies. ETref increased significantly in Jianghuai and Sunan and had increasing and decreasing trends, both insignificant, in Huaibei. In summer, a significant increasing trend of TA showed in southeast Jiangsu province; moreover, the increasing trend in other regions was insignificant. ETref showed a downward trend, especially significant in Huaibei and along the lower Yangtze River Basin. In autumn, both the TA and ETref were similar to the annual scale distribution. In the winter, a significant downward trend of ETref existed only in Huaibei, although a strong upward trend of TA was exhibited in the whole of Jiangsu province. These results indicated that the evaporation paradox was apparent in Jiangsu province, especially in summer and in the Huaibei region in autumn, and also on an annual scale.

4. Discussions

4.1. Change Trend of ETref and Its Contributing Factors

This study is driven by the need to know why ETref has changed in Jiangsu province and what factors are responsible. This study, therefore, applied physical modeling to determine the sensitivity of ETref to different climatic factors and a detrending method to identify the main contributions of climatic factors to ETref changes. In the current research, decreasing and increasing trends were found in Jiangsu province. A decreasing trend showed in annual and summer ETref, while an increasing trend was observed in spring, autumn, and winter ETref for the whole province.
The results in this study highlighted the greater sensitivity of ETref in Jiangsu province to TA, followed by SD during the summer, when ETref reached its peak position. VP had a much higher impact on ETref than the other three climatic factors, especially in the winter, when ETref reached its lowest. WS had the smallest influence on the ETref estimation, with a higher sensitivity in the winter but lower in the summer. The sensitivity of seasonal and annual ETref to climatic factors was variable in different regions. Furthermore, the declining ETref trend was more sensitive to VP in the present study. Our findings provide a new perspective for further study, due to the fact that previous research usually chose relative humidity as the influence factor, such as in the basins of the Yangtze River, Tao’er River, and Wei River in China [4,8,51,52,53]. However, the variation of ETref was most sensitive to WS in the basins of the Shiyang River and Jinghe River [11,54]. In addition, TA and Rn were the utmost sensitive parameters in the Haihe River basin and Poyang Lake catchment in China [55,56]. It can be said that ETref has various responses to meteorological factors in various regions of China.
The contributions of climatic factors to the changes in ETref were also diverse in various regions. In this study, WS was the primary variable, followed by SD to annual ETref across the whole of Jiangsu province, which was similar to the outcomes reported by Wang et al. [36] in the Yellow River basin. Zhang et al. [57] indicated that the decreasing trend in ETref was due to a decrease in WS and Rn across the Tibetan Plateau. However, WS and TA were the predominant factors contributing to its inter-annual variation in Northwest China [58]. Results of changes in ETref and its contributing factors in Jiangsu province agreed with the conclusion of Gao et al. [59], who showed that WS was the chief factor, followed by Rn in the west of the Liao River basin. In addition, we found that VP is also an important influence factor, especially in winter in the whole region, although the change trend of VP is very small.
As the decreasing WS had been widely reported in various regions, Zhang et al. [60] proposed that the weakening atmospheric circulation may be the explanation for the WS decreasing. However, the significant weakened East Asian Monsoon is also closely linked to decreasing WS [26,61]. In addition, the increase of terrestrial surface roughness due to the increased vegetation coverage, such as the afforestation put forward by Vautard et al. [62], could also explain the decreasing WS. Meanwhile, the significantly decreasing SD also made a negative contribution to the decreasing ETref, closely followed by WS, especially in the summer, while the functional mechanism of the decreasing SD is still a matter for debate. A significant number of studies have shown that decreasing solar radiation had occurred in different regions before 1980s [63,64]; however, this decreasing trend has been mitigated since the 1990s, via the phenomenon we call “From dimming to Brightening” [65,66,67]. Combined with the sunshine duration in Figure 4, this phenomenon is seemingly not evident in Jiangsu province. Meanwhile, some recent studies have shown that the decreasing SD is mainly caused by the increased regional cloud cover [65,68] and increasing aerosol loading from anthropogenic emissions of pollutants [69,70], coupled with significant declining WS. These phenomena were confirmed by Zhang et al. [71] in east and south China. Furthermore, due to the absence of measured solar radiation, the parameters (a and b) in the Angstrom formula might vary across the past 55 years as the aerosol optical depths have changed in this region. This is an important potential constraint on the observed effects of changes in Rn on ETref, which will surely have been underestimated as a result of using this approximation of Rs from the sunshine duration.

4.2. Evaporation Paradox

The “evaporation paradox” is a controversial topic that has earned attention among researchers worldwide [22,72]. The results indicated that the evaporation paradox was apparent in Jiangsu province, mainly in the summer and in Huaibei region in the autumn. Furthermore, the significant increase in TA in Jiangsu province appeared to be in agreement with the global warming reported in recent decades [10]. However, interestingly, TA showed a significant result with the decrease of ETref (Table 2 and Table 3). These findings disagree with the earlier results of Ye et al. [56], Liu and Zeng [73], and Li et al. [74]. The “evaporation paradox” occurred due to the significant decrease of WS and SD in the whole of Jiangsu province. The strong influences on ETref from these contributing factors compensate for the decrease of ETref from the significant increase in TA, resulting in an overall decrease in ETref. Such findings are echoed by the similar works of Roderick and Farquhar [17,18], Xu et al. [8], Cong et al. [14], and Zuo et al. [52]. However, it is evident that ETref has decreased in many parts of the world in the context of global warming. Xu et al. [75] summarized the major reason: higher air temperature leads to more powerful atmospheric water holding capacity, resulting in an increase of cloud cover and a decline of solar radiation reaching the Earth’s surface.

4.3. Influence on Agricultural Production and Water Management

Jiangsu is a major agricultural province in China, and main crops such as winter wheat and single-season rice have been greatly affected by climate change, especially in regions with variable climate [38]. Decreasing wind speed (WS), sunshine duration (SD), actual vapor pressure (VP), and increasing air temperature (TA) were the driving forces behind a slightly decreasing ETref in the Jiangsu province, and climate change may complicate impacts on agricultural production and water resource management. The significantly decreasing ETref in summer may be responsible for greater water reserves and an increase in regional vegetation cover and crop production, especially the cultivation of single-season rice across the whole of Jiangsu province, which further assists with irrigation water resource distribution and management. Meanwhile, excessive rainfall caused frequent floods in summer; this should be paid more attention, especially in the Huaibei region, which belongs to the Huai River Basin [76]. However, the increasing ETref in autumn would not be suitable for the seeding of winter wheat in Jianghuai and Sunan, and could affect crop growth and development. Moreover, the slight increase in ETref in the winter would reduce the soil moisture and be harmful for the overwintering of winter wheat. More seriously, the significant increase in ETref in spring may inhibit the reviving and jointing of winter wheat and would likely increase the frequency of spring droughts, despite the abundant rainfall in this province of eastern China. However, the significant decrease i ETref in Huaibei region in summer, autumn, and on an annual scale would promote single-season rice and winter wheat growth, whereas the slight decreasing trend of ETref in the winter and the increasing trend in the spring could not be ignored.
For the past few years, with the rapid increase of population and intensified land utilization, the rising problems of regional water resources and ecological environment have been increasingly highlighted. These issues deserve more attention in future studies on how the changes of annual and seasonal ETref are associated with potential and actual evapotranspiration. Integration with remote sensing techniques will be important to determine the subsequent effect on the regional water balance of Jiangsu province in the light of population growth, urbanization, and climate change.

5. Conclusions

This research examined the spatiotemporal changes in reference evapotranspiration (ETref) based on the Penman–Monteith FAO 56 model in Jiangsu province, a major economic and agricultural province of eastern China, by studying the daily weather data of 60 meteorological stations from 1961 to 2015. In addition, physical and mathematical modeling and the detrending method were applied to determine the sensitivity of ETref and the main contributing climatic factors to ETref. The following findings were drawn from this study:
(1)
Decreasing and increasing trends were identified in Jiangsu province at seasonal and annual scales. A significant declining trend of ETref was observed in the Huaibei region, while other regions demonstrated a slight rising trend of ETref. ETref also showed a significant increasing tendency in spring and a decreasing tendency in summer.
(2)
VP was the most sensitive climatic factor, followed by TA, SD, and WS in each region. ETref was more sensitive to TA and SD in the summer but less so in the winter; however, the sensitivities of WS and VP to ETref were the opposite in Jiangsu province.
(3)
The contribution of ETref was a synergistic effect of various climatic factors; significantly decreasing WS and SD were the most crucial factors contributing to the decreasing trend in ETref, while TA was the main contributing factor for the increasing trend in ETref, followed by WS and SD. The non-significant trend in VP made the smallest contribution to the trend of ETref; however, it could not be ignored due to the variability and the effect of the contribution to ETref, as well as being the most sensitive factor to ETref, especially in winter.
(4)
It was evident that the phenomenon of evaporation paradox was apparent in Jiangsu province, especially in the summer and in the Huaibei region in the autumn.
(5)
In summary, these results will provide a theoretical background and practical guidance for future water resource distribution and management and lay the basis for the future study of agricultural water requirements and economic development in the whole of Jiangsu province in the scenario of climate change.

Acknowledgments

Thanks to the editors and two anonymous reviewers for all the constructive comments and useful suggestions that helped us to upgrade the quality of this paper substantially. We also acknowledge the financial support from the China Special Fund for Meteorological Research in the Public Interest (GYHY201506001) and the National Natural Science Foundation of China (Grant No. 41405111).

Author Contributions

Shuanghe Shen supervised the research. Ronghao Chu and Meng Li analyzed the data, conceived, designed, and performed the research. Abu Reza Md. Towfiqul Islam modified and polished the English in this paper. Wen Cao proposed some constructive suggestions about the methods. Sulin Tao and Ping Gao provided the meteorological data.

Conflicts of Interest

The authors declare no conflict of interest.

Appendix A.

The specific derived expressions for sensitivity coefficients:
We divided Equation (1) into two parts as follows: the radiative (ETrad) and aerodynamic (ETaero) components:
E T r e f = E T r a d + E T a e r o = 0.408 Δ ( R n G ) Δ + γ ( 1 + 0.34 u 2 ) + γ 900 T + 273 u 2 ( e s e a ) Δ + γ ( 1 + 0.34 u 2 ) e s = 0.6108 exp ( 17.27 T T + 237.3 ) Δ = 4098 × [ 0.6108 exp ( 17.27 T T + 237.3 ) ] ( T + 237.3 ) 2 = 4098 × e s ( T + 237.3 ) 2 P = 101.3 ( 273 + T 0.0065 h 273 + T ) 5.26 ,
where P is atmospheric pressure (kPa) and h is the elevation above sea level.
γ = 0.00163 P λ ,
where λ is the latent heat of vaporization, 2.45 (MJ·kg−1).
TA (Air mean temperature):
e s T = e s ( 17.27 × 237.3 × ( 1 ) × ( 237.3 + T ) 2 )
Δ T = 4098 e s T ( 237.3 + T ) 2 + 4098 × e s × ( 2 ) ( 237.3 + T ) 3
P T = 101.3 × 5.26 × ( 1 0.0065 × h 273 + T ) 4.26 × 0.0065 × h ( 273 + T ) 2
γ T = 0.00163 × P T λ + 0.00163 × P × 0.002361 λ 2
R n T = 4.903 × 10 9 ( ( T max + 273 ) 4 + ( T min + 273 ) 4 2 ) × ( 0.14 × 0.5 × ( e s × R H ) 0.5 × R H × e s T ) × ( 1.35 × R s R s o 0.35 )
E T r a d = 0.408 ( R n G ) × Δ Δ + γ ( 1 + 0.34 u 2 ) = E T r a d _ A × E T r a d _ B
E T r a d E T r a d _ A = 1 × R n T × 0.408 × Δ Δ + γ ( 1 + 0.34 u 2 )
E T r a d E T r a d _ B = 0.408 × R n × [ Δ T Δ + γ ( 1 + 0.34 u 2 ) Δ × ( Δ T + γ T × ( 1 + 0.34 u 2 ) ) ( Δ + γ ( 1 + 0.34 u 2 ) ) 2 ]
E T r a d T = E T r a d E T r a d _ A + E T r a d E T r a d _ B
E T a e r o = [ 900 γ Δ + γ ( 1 + 0.34 u 2 ) ] × [ u 2 × e s × ( 1 R H ) ] × [ 1 273 + T ] = E T a e r o _ A × E T a e r o _ B × E T a e r o _ C
E T a e r o E T a e r o _ A = [ 900 × ( γ T ( Δ + γ ( 1 + 0.34 u 2 ) ) γ ( Δ T + γ T ( 1 + 0.34 u 2 ) ) ( Δ + γ ( 1 + 0.34 u 2 ) ) 2 ) ] × E T a e r o _ B × E T a e r o _ C
E T a e r o E T a e r o _ B = [ u 2 × ( 1 R H ) × e s T ] × E T a e r o _ A × E T a e r o _ C
E T a e r o E T a e r o _ C = [ 1 ( 273 + T ) 2 ] × E T a e r o _ A × E T a e r o _ B
E T a e r o T = E T a e r o E T a e r o _ A + E T a e r o E T a e r o _ B + E T a e r o E T a e r o _ C
E T r e f T = E T r a d T + E T a e r o T
VP (Actual vapor pressure):
E T r a d V P = 4.903 × 10 9 × [ ( T max + 273 ) 4 + ( T min + 273 ) 4 2 ] × ( 0.14 ) × 0.5 × e a 0.5     × ( 1.35 R s R s o 0.35 ) × 0.408 Δ Δ + γ ( 1 + 0.34 u 2 )
E T a e r o V P = γ 900 273 + T × u 2 Δ + γ ( 1 + 0.34 u 2 )
E T r e f V P = E T r a d V P + E T a e r o V P
WS (Wind speed):
E T r a d W S = ( 0.408 × Δ × R n ) × ( 1 ) × ( Δ + γ ( 1 + 0.34 u 2 ) ) 2 × γ × 0.34
E T a e r o = u 2 × [ γ 900 T + 273 ( e s e a ) Δ + γ ( 1 + 0.34 u 2 ) ] = E T a e r o _ A × E T a e r o _ B
E T a e r o E T a e r o _ A = γ 900 T + 273 ( e s e a ) Δ + γ ( 1 + 0.34 u 2 )
E T a e r o E T a e r o _ B = [ γ × 900 273 + T × u 2 × e s × ( 1 R H ) ] × ( 1 ) × [ Δ + γ ( 1 + 0.34 u 2 ) ] 2 × γ × 0.34
E T a e r o W S = E T a e r o E T a e r o _ A + E T a e r o E T a e r o _ B
E T r e f W S = E T r a d W S + E T a e r o W S
SD (Sunshine duration):
R n R s = ( 1 0.23 ) 4.093 × 10 9 × [ ( T max + 273 ) 4 + ( T min + 273 ) 4 2 ] × ( 0.34 0.14 × e a ) × 1.35 × R s R s o 2
E T r e f R s = E T r a d R s = R n R s × 0.408 Δ Δ + γ ( 1 + 0.34 u 2 )
E T r e f S D = E T r a d S D = E T r a d R s × 0.5 × R a N
  1. References

  2. Jhajharia, D.; Shrivastava, S.K.; Sarkar, D.; Sarkar, S. Temporal characteristics of pan evaporation trends under the humid conditions of northeast India. Agric. For. Meteorol. 2009, 149, 763–770. [Google Scholar] [CrossRef]
  3. Sentelhas, P.C.; Gillespie, T.J.; Santos, E.A. Evaluation of FAO Penman—Monteith and alternative methods for estimating reference evapotranspiration with missing data in Southern Ontario, Canada. Agric. Water Manag. 2010, 97, 635–644. [Google Scholar] [CrossRef]
  4. Burn, D.H.; Hesch, N.M. Trends in evaporation for the Canadian Prairies. J. Hydrol. 2007, 336, 61–73. [Google Scholar] [CrossRef]
  5. Shan, N.; Shi, Z.; Yang, X.; Gao, J.; Cai, D. Spatiotemporal trends of reference evapotranspiration and its driving factors in the Beijing-Tianjin Sand Source Control Project Region, China. Agric. For. Meteorol. 2015, 200, 322–333. [Google Scholar] [CrossRef]
  6. Tabari, H.; Aeini, A.; Talaee, P.H.; Some’e, B. Spatial distribution and temporal variation of reference evapotranspiration in arid and semi-arid regions of Iran. Hydrol. Process. 2012, 26, 500–512. [Google Scholar] [CrossRef]
  7. Zhang, C.; Shen, Y.; Liu, F.; Meng, L. Changes in reference evapotranspiration over an agricultural region in the Qinghai-Tibetan plateau, China. Theor. Appl. Climatol. 2016, 123, 107–115. [Google Scholar] [CrossRef]
  8. Gao, X.; Peng, S.; Wang, W.; Xu, J.; Yang, S. Spatial and temporal distribution characteristics of reference evapotranspiration trends in Karst area: A case study in Guizhou Province, China. Meteorol. Atmos. Phys. 2016, 128, 677–688. [Google Scholar] [CrossRef]
  9. Xu, C.; Gong, L.; Jiang, T.; Chen, D.; Singh, V.P. Analysis of spatial distribution and temporal trend of reference evapotranspiration and pan evaporation in Changjiang (Yangtze River) catchment. J. Hydrol. 2006, 327, 81–93. [Google Scholar] [CrossRef]
  10. Srivastava, P.; Han, D.; Ramirez, M.; Islam, T. Comparative assessment of evapotranspiration derived from NCEP and ECMWF global datasets through Weather Research and Forecasting model. Atmos. Sci. Lett. 2013, 14, 118–125. [Google Scholar] [CrossRef]
  11. Solomon, S.; Qin, D.; Manning, M.; Chen, Z.; Marquis, M.; Averyt, K.; Miller, H. Contribution of Working Group I to the Forth Assessment Report of the Intergovernmental Panel on Climate Change; Cambridge University Press: Cambridge, UK, 2007. [Google Scholar]
  12. Xu, L.; Shi, Z.; Wang, Y.; Zhang, S.; Chu, X.; Yu, P.; Xiong, W.; Zuo, H.; Wang, Y. Spatiotemporal variation and driving forces of reference evapotranspiration in Jing River Basin, northwest China. Hydrol. Process. 2015, 29, 4846–4862. [Google Scholar] [CrossRef]
  13. Xie, H.; Zhu, X.; Yuan, D. Pan evaporation modelling and changing attribution analysis on the Tibetan Plateau (1970–2012). Hydrol. Process. 2015, 25, 2164–2177. [Google Scholar] [CrossRef]
  14. Liu, Q.; McVicar, T.R. Assessing climate change induced modification of Penman potential evaporation and runoff sensitivity in a large water-limited basin. J. Hydrol. 2012, 464, 352–362. [Google Scholar] [CrossRef]
  15. Cong, Z.T.; Yang, D.W.; Ni, G.H. Does evaporation paradox exist in China? Hydrol. Earth Syst. Sci. 2009, 13, 357–366. [Google Scholar] [CrossRef]
  16. Liu, T.; Li, L.; Lai, J.; Liu, C.; Zhuang, W. Reference evapotranspiration change and its sensitivity to climate variables in southwest China. Theor. Appl. Climatol. 2016, 125, 499–508. [Google Scholar] [CrossRef]
  17. Yang, H.; Yang, D. Climatic factors influencing changing pan evaporation across China from 1961 to 2001. J. Hydrol. 2012, 414, 184–193. [Google Scholar] [CrossRef]
  18. Roderick, M.L.; Farquhar, G.D. Changes in Australian pan evaporation from 1970 to 2002. Int. J. Climatol. 2004, 24, 1077–1090. [Google Scholar] [CrossRef]
  19. Roderick, M.L.; Farquhar, G.D. Changes in New Zealand pan evaporation since the 1970s. Int. J. Climatol. 2005, 25, 2031–2039. [Google Scholar] [CrossRef]
  20. Chattopadhyay, N.; Hulme, M. Evaporation and potential evapotranspiration in India under conditions of recent and future climate change. Agric. For. Meteorol. 1997, 87, 55–73. [Google Scholar] [CrossRef]
  21. Limjirakan, S.; Limsakul, A. Trends in Thailand pan evaporation from 1970 to 2007. Atmos. Res. 2012, 108, 122–127. [Google Scholar] [CrossRef]
  22. Breña-Naranjo, J.A.; Laverde, M.A.; Pedrozo-Acuña, A. Changes in pan evaporation in Mexico from 1961 to 2010. Int. J. Climatol. 2016, 23, 361–387. [Google Scholar] [CrossRef]
  23. Brutsaert, W.; Parlange, M. Hydrologic cycle explains the evaporation paradox. Nature 1998, 396, 30–30. [Google Scholar] [CrossRef]
  24. Wang, J.; Wang, Q.; Zhao, Y.; Li, H.; Zhai, J.; Shang, Y. Temporal and spatial characteristics of pan evaporation trends and their attribution to meteorological drivers in the Three-River Source Region, China. J. Geophys. Res. Atmos. 2015, 120, 6391–6408. [Google Scholar] [CrossRef]
  25. Hobbins, M.T.; Ramírez, J.A.; Brown, T.C. Trends in pan evaporation and actual evapotranspiration across the conterminous US: Paradoxical or complementary? Geophys. Res. Lett. 2004, 31, 405–407. [Google Scholar] [CrossRef]
  26. Rotstayn, L.; Roderick, M.; Farquhar, G.D. A simple pan-evaporation model for analysis of climate simulations: Evaluation over Australia. Geophys. Res. Lett. 2006, 33, 254–269. [Google Scholar] [CrossRef]
  27. Mcvicar, T.; Roderick, M.; Donohue, R.; Li, L.; Niel, T.G.V.; Thomas, A.; Grieser, J.; Jhajharia, D.; Himri, Y.; Mahowald, N.M.; et al. Global review and synthesis of trends in observed terrestrial near-surface wind speeds: Implications for evaporation. J. Hydrol. 2012, 416–417, 182–205. [Google Scholar] [CrossRef]
  28. Allen, R.G.; Pereira, L.S.; Raes, D.; Smith, M. Crop evapotranspiration-Guidelines for computing crop water requirements-FAO Irrigation and drainage paper 56. FAO Rome 1998, 300, D05109. [Google Scholar]
  29. Liu, X.; Zhang, D. Trend analysis of reference evapotranspiration in Northwest China: The roles of changing wind speed and surface air temperature. Hydrol. Process. 2013, 27, 3941–3948. [Google Scholar] [CrossRef]
  30. McCuen, R.H. A sensitivity and error analysis of procedures used for estimating evaporation. JAWRA J. Am. Water Resour. Assoc. 1974, 10, 486–497. [Google Scholar] [CrossRef]
  31. Li, Z.; Li, Z.; Xu, Z.; Zhou, X. Temporal variations of reference evapotranspiration in Heihe River basin of China. Hydrol. Res. 2013, 44, 904–916. [Google Scholar] [CrossRef]
  32. Liu, Q.; Yang, Z.; Cui, B.; Sun, T. The temporal trends of reference evapotranspiration and its sensitivity to key meteorological variables in the Yellow River Basin, China. Hydrol. Process. 2010, 24, 2171–2181. [Google Scholar] [CrossRef]
  33. Huo, Z.; Dai, X.; Feng, S.; Kang, S.; Huang, G. Effect of climate change on reference evapotranspiration and aridity index in arid region of China. J. Hydrol. 2013, 492, 24–34. [Google Scholar] [CrossRef]
  34. Li, Z.; Feng, Q.; Liu, W.; Wang, T.; Gao, Y.; Wang, Y.; Cheng, A.; Li, J.; Liu, L. Spatial and temporal trend of potential evapotranspiration and related driving forces in Southwestern China, during 1961–2009. Quat. Int. 2014, 336, 127–144. [Google Scholar]
  35. Liu, X.; Zhang, D.; Luo, Y.; Liu, C. Spatial and temporal changes in aridity index in northwest China: 1960 to 2010. Theor. Appl. Climatol. 2013, 112, 307–316. [Google Scholar] [CrossRef]
  36. Wang, Y.; Jiang, T.; Bothe, O.; Fraedrich, K. Changes of pan evaporation and reference evapotranspiration in the Yangtze River basin. Theor. Appl. Climatol. 2007, 90, 13–23. [Google Scholar] [CrossRef]
  37. Wang, W.; Shao, Q.; Peng, S.; Xing, W.; Yang, T.; Luo, Y.; Yong, B.; Xu, J. Reference evapotranspiration change and the causes across the Yellow River Basin during 1957–2008 and their spatial and seasonal differences. Water Resour. Res. 2012, 48. [Google Scholar] [CrossRef]
  38. Shen, S.H.; Yang, S.B.; Zhao, Y.X.; Xu, Y.L.; Zhao, X.Y.; Wang, Z.Y.; Liu, J.; Zhang, W.W. Simulating the rice yield change in the middle and lower reaches of the Yangtze River under SRES B2 scenario. Acta Ecol. Sin. 2011, 31, 40–48. [Google Scholar] [CrossRef]
  39. Tao, S.; Shen, S.; Li, Y.; Wang, Q.; Gao, P.; Mugume, I. Projected crop production under regional climate change using scenario data and modeling: Sensitivity to chosen sowing date and cultivar. Sustainability 2016, 8, 214. [Google Scholar] [CrossRef]
  40. Pan, A.D.; Cao, Y.; Chen, H.S. Impacts of climate change on food-crops production in Jiangsu Province from 1986 to 2010. Trans. Atmos. Sci. 2013, 36, 217–228. [Google Scholar]
  41. Peterson, T.C.; Easterling, D.R.; Karl, T.R.; Groisman, P.; Nicholls, N.; Plummer, N.; Torok, S.; Auer, I.; Boehm, R.; Gullett, D.; et al. Homogeneity adjustments of in situ atmospheric climate data: A review. Int. J. Climatol. 1998, 18, 1493–1517. [Google Scholar] [CrossRef]
  42. Angstrom, A. Solar and terrestrial radiation. Report to the international commission for solar research on actinometric investigations of solar and atmospheric radiation. Q. J. R. Meteorol. Soc. 1924, 50, 121–126. [Google Scholar] [CrossRef]
  43. Chen, R.; Kang, E.; Yang, J.; Lu, S.; Zhao, W. Validation of five global radiation models with measured daily data in China. Energy Convers. Manag. 2004, 45, 1759–1769. [Google Scholar] [CrossRef]
  44. Mann, H.B. Nonparametric test against trend. Econometrica 1945, 13, 245–259. [Google Scholar] [CrossRef]
  45. Kendall, M.G. A new measure of rank correlation. Biometrika 1938, 30, 81–93. [Google Scholar] [CrossRef]
  46. Shen, Y.; Liu, C.; Liu, M.; Zeng, Y.; Tian, C. Change in pan evaporation over the past 50 years in the arid region of China. Hydrol. Process. 2010, 24, 225–231. [Google Scholar] [CrossRef]
  47. Zheng, H.; Liu, X.; Liu, C.; Dai, X.; Zhu, R. Assessing contributions to panevaporation trends in Haihe River Basin, China. J. Geophys. Res. 2009, 114, 144–153. [Google Scholar] [CrossRef]
  48. Sen, P. Estimates of the regression coefficient based on Kendall’s tau. J. Am. Stat. Assoc. 1968, 63, 1379–1389. [Google Scholar] [CrossRef]
  49. Yue, S.; Pilon, P.; Cavadias, G. Power of the Mann-Kendall and Spearman’s rho tests for detecting monotonic trends in hydrological series. J. Hydrol. 2002, 259, 254–271. [Google Scholar] [CrossRef]
  50. Ma, Q.; Zhang, J.; Sun, C.; Guo, E.; Zhang, F. MengmengWang Changes of reference evapotranspiration and Its relationship to dry/wet conditions based on the aridity index in the Songnen grassland, northeast China. Water 2017, 9, 316. [Google Scholar] [CrossRef]
  51. Basistha, A.; Arya, D.S.; Goel, N.K. Spatial Distribution of Rainfall in Indian Himalayas—Study of Uttarakhand Region. Water Resour. Manag. 2008, 22, 1325–1346. [Google Scholar] [CrossRef]
  52. Gong, L.; Xu, C.; Chen, D.; Halldin, S.; Chen, Y.D. Sensitivity of the Penman-Monteith reference evapotranspiration to key climatic variables in the Changjiang (Yangtze River) basin. J. Hydrol. 2006, 329, 620–629. [Google Scholar] [CrossRef]
  53. Zuo, D.; Xu, Z.; Yang, H.; Liu, X. Spatiotemporal variations and abrupt changes of potential evapotranspiration and its sensitivity to key meteorological variables in the Wei River basin, China. Hydrol. Process. 2012, 26, 1149–1160. [Google Scholar] [CrossRef]
  54. Liang, L.; Li, L.; Zhang, L.; Li, J.; Li, B. Sensitivity of penman-monteith reference crop evapotranspiration in Tao’er River Basin of northeastern China. Chin. Geogr. Sci. 2008, 18, 340–347. [Google Scholar] [CrossRef]
  55. Zhang, X.; Kang, S.; Zhang, L.; Liu, J. Spatial variation of climatology monthly crop reference evapotranspiration and sensitivity coefficients in Shiyang river basin of northwest China. Agric. Water Manag. 2010, 97, 1506–1516. [Google Scholar] [CrossRef]
  56. Tang, B.; Tong, L.; Kang, S.; Zhang, L. Impacts of climate variability on reference evapotranspiration over 58 years in the Haihe river basin of north China. Agric. Water Manag. 2011, 98, 1660–1670. [Google Scholar] [CrossRef]
  57. Ye, X.; Li, X.; Liu, J.; Xu, C.; Zhang, Q. Variation of reference evapotranspiration and its contributing climatic factors in the Poyang Lake catchment, China. Hydrol. Process. 2014, 28, 6151–6162. [Google Scholar] [CrossRef]
  58. Zhang, Y.; Liu, C.; Tang, Y.; Yang, Y. Trends in pan evaporation and reference and actual evapotranspiration across the Tibetan Plateau. J. Geophys. Res. Atmos. 2007, 112, 1103–1118. [Google Scholar] [CrossRef]
  59. Cao, W.; Shen, S.; Duan, C. Temporal-spatial variations of potential evapotranspiration and quantification of the causes in Northwest China. Acta Ecol. Sin. 2012, 32, 3394–3403. [Google Scholar]
  60. Gao, Z.; He, J.; Dong, K.; Bian, X.; Li, X. Sensitivity study of reference crop evapotranspiration during growing season in the West Liao River basin, China. Theor. Appl. Climatol. 2016, 124, 865–881. [Google Scholar] [CrossRef]
  61. Zhang, X.; Ren, Y.; Yin, Z.; Lin, Z.; Zheng, D. Spatial and temporal variation patterns of reference evapotranspiration across the Qinghai-Tibetan Plateau during 1971–2004. J. Geophys. Res. 2009, 114, 4427–4433. [Google Scholar] [CrossRef]
  62. Xu, M.; Chang, C.; Fu, C.; Qi, Y.; Robock, A.; Robinson, D.; Zhang, H. Steady decline of east Asian monsoon winds, 1969–2000: Evidence from direct ground measurements of wind speed. J. Geophys. Res. 2006, 111, 906–910. [Google Scholar] [CrossRef]
  63. Vautard, R.; Cattiaux, J.; Yiou, P.; Thépaut, J.; Ciais, P. Northern Hemisphere atmospheric stilling partly attributed to an increase in surface roughness. Nat. Geosci. 2010, 3, 756–761. [Google Scholar] [CrossRef]
  64. Stanhill, G.; Cohen, S. Global dimming: A review of the evidence for a widespread and significant reduction in global radiation with discussion of its probable causes and possible agricultural consequences. Agric. For. Meteorol. 2001, 107, 255–278. [Google Scholar] [CrossRef]
  65. Liepert, B. Observed reductions of surface solar radiation at sites in the United States and worldwide from 1961 to 1990. Geophys. Res. Lett. 2002, 29. [Google Scholar] [CrossRef]
  66. Stjern, C.W.; Kristj’ansson, J.E.; Hansen, A.W. Global dimming and global brightening-an analysis of surface radiation and cloud cover data in northern Europe. Int. J. Climatol. 2008, 29, 643–653. [Google Scholar] [CrossRef]
  67. Wild, M. Global dimming and brightening: A review. J. Geophys. Res. Atmos. 2009, 114. [Google Scholar] [CrossRef]
  68. Wild, M.; Gilgen, H.; Roesch, A.; Ohmura, A.; Long, C.N.; Dutton, E.G.; Forgan, B.; Kallis, A.; Russak, V.; Tsvetkov, A. From dimming to brightening: Decadal changes in solar radiation at Earth’s surface. Science 2005, 308, 847–850. [Google Scholar] [CrossRef] [PubMed]
  69. Norris, J.R.; Wild, M. Trends in aerosol radiative effects over Europe inferred from observed cloud cover, solar ”dimming”, and solar ”brightening”. J. Geophys. Res. Atmos. 2007, 112. [Google Scholar] [CrossRef]
  70. Qian, Y.; Wang, W.; Leung, L.R.; Kaiser, D.P. Variability of solar radiation under cloud-free skies in China: The role of aerosols. Geophys. Res. Lett. 2007, 34. [Google Scholar] [CrossRef]
  71. Che, H.Z.; Shi, G.Y.; Zhang, X.Y.; Arimoto, R.; Zhao, J.Q.; Xu, L.; Wang, B.; Chen, Z.H. Analysis of 40 years of solar radiation data from China, 1961–2000. Geophys. Res. Lett. 2005, 32. [Google Scholar] [CrossRef]
  72. Zhang, Q.; Xu, C.Y.; Chen, X. Reference evapotranspiration changes in China: Natural processes or human influences? Theor. Appl. Climatol. 2011, 103, 479–488. [Google Scholar] [CrossRef]
  73. Roderick, M.L.; Farquhar, G.D. The cause of decreased pan evaporation over the past 50 years. Science 2002, 298, 1410–1411. [Google Scholar] [PubMed]
  74. Liu, C.; Zeng, Y. Changes of pan evaporation in the recent 40 years in the Yellow River Basin. Water Int. 2004, 29, 510–516. [Google Scholar] [CrossRef]
  75. Li, Y.; Liang, K.; Bai, P.; Feng, A.; Liu, L.; Dong, G. The spatiotemporal variation of reference evapotranspiration and the contribution of its climatic factors in the Loess Plateau, China. Environ. Earth Sci. 2016, 75, 1–14. [Google Scholar] [CrossRef]
  76. Xu, Y.; Xu, Y.; Wang, Y.; Wu, L.; Li, G.; Song, S. Spatial and temporal trends of reference crop evapotranspiration and its influential variables in Yangtze River Delta, eastern China. Theor. Appl. Climatol. 2016, 1–14. [Google Scholar] [CrossRef]
  77. He, Y.; Ye, J.; Yang, X. Analysis of the spatio-temporal patterns of dry and wet conditions in the Huai River Basin using the standardized precipitation index. Atmos. Res. 2015, 166, 120–128. [Google Scholar] [CrossRef]
Figure 1. Map showing Jiangsu province: (a) location; (b) meteorological station (▲) and elevation; (c) sub-regions and rivers.
Water 09 00486 g001
Figure 2. Spatial distribution of seasonal and annual ETref in Jiangsu Province during 1961–2015. Note: (a)–(e) represent ETref in annual, spring, summer, autumn, and winter seasons respectively.
Water 09 00486 g002
Figure 3. Sensitivities of seasonal and annual ETref in relation to climatic factors in (a) Whole, (b) Huaibei, (c) Jianghuai, and (d) Sunan regions of the Jiangsu province from 1961 to 2015.
Water 09 00486 g003
Figure 4. The original and detrended climatic factors (a) TA, (b) VP, (c) WS, and (d) SD for the whole of Jiangsu province during 1961−2015.
Water 09 00486 g004aWater 09 00486 g004b
Figure 5. Contributions of climatic factors to the trends in ETref in (a) Whole, (b) Huaibei, (c) Jianghuai, and (d) Sunan regions of the Jiangsu province during 1961–2015.
Water 09 00486 g005
Figure 6. Spatial distributions of climate tendency rates of the TA and ETref from 1961 to 2015 in Jiangsu province. Note: S and NS represent significant and non-significant trends at the 0.05 level of the TA and ETref, respectively. (a), (c), (e), (g), and (i) represent the trends of TA in annual, spring, summer, autumn, and winter seasons, respectively, (b), (d), (f), (h), and (j) represent the trends of ETref in annual, spring, summer, autumn and winter seasons, respectively.
Water 09 00486 g006
Table 1. Basic climatic characteristics of three sub-regions and the whole of Jiangsu province during 1961–2015.
RegionTA (°C)RH (%)WS (m·s−1)SD (h)ETref (mm)
Huaibei14.3072.962.542250.34898.66
Jianghuai15.1577.412.942098.33883.72
Sunan15.9477.712.851986.46899.74
Whole15.0976.152.792116.07892.24
Table 2. Temporal trends for seasonal and annual ETref (mm·a−2) in each region of Jiangsu province from 1961 to 2015.
RegionSpringSummerAutumnWinterAnnual
βZβZβZβZβZ
Huaibei0.0390.09−1.093 ***−4.31−0.300 **−2.66−0.076−0.84−1.468 ***−3.53
Jianghuai0.675 **3.18−0.581 *−1.970.1251.350.0670.940.2070.67
Sunan0.815 ***3.89−0.597 +−1.800.307 **2.990.0730.940.5921.18
Whole0.526 **2.70−0.701 **−2.920.0460.610.0140.12−0.245−0.74
Note: +, *, ** and *** indicate the significance level of 0.1, 0.05, 0.01, and 0.001, respectively. β is the estimated slope of ETref trends, β > 0 and β < 0 indicate an increasing and a decreasing trend, respectively.
Table 3. Temporal trends for climatic factors in Jiangsu province from 1961 to 2015.
VariableSeasonHuaibeiJianghuaiSunanWhole
TA (°C·a−1)Spring0.0348 ***0.0382 ***0.0439 ***0.0391 ***
Summer0.00530.01130.0151 *0.0111
Autumn0.0221 ***0.0261 ***0.0336 ***0.0267 ***
Winter0.0390 ***0.0319 ***0.0333 ***0.0344 ***
Annual0.0242 ***0.0267 ***0.0310 ***0.0274 ***
VP (kPa·a−1)Spring0.000858−0.000089−0.0008650.000022
Summer−0.000753−0.001831 *−0.002048 **−0.001572 *
Autumn0.0007620.000396−0.0002480.000382
Winter0.0006670.0006820.0006580.000644
Annual0.000512−0.000223−0.000563−0.000007
WS (m·s−1·a−1)Spring−0.0398 ***−0.0293 ***−0.0307 ***−0.0332 ***
Summer−0.0297 ***−0.0194 ***−0.0217 ***−0.0230 ***
Autumn−0.0301 ***−0.0228 ***−0.0244 ***−0.0251 ***
Winter−0.0334 ***−0.0281 ***−0.0310 ***−0.0305 ***
Annual−0.0341 ***−0.0250 ***−0.0268 ***−0.0279 ***
SD (h·a−1)Spring−0.00420.00790.00710.0049
Summer−0.0442 ***−0.0392 ***−0.0417 ***−0.0420 ***
Autumn−0.0207 **−0.0092−0.0104 +−0.0121 *
Winter−0.0238 ***−0.0170 **−0.0151 **−0.0190 **
Annual−0.0239 ***−0.0152 ***−0.0169 ***−0.0179 ***
Note: +, *, ** and *** indicate the significance level of 0.1, 0.05, 0.01, and 0.001, respectively.
Table 4. Values of assessment index R for quantifying the contributions of climatic factors to the change trends of seasonal ETref in each region of Jiangsu province.
RegionSpringSummerAutumnWinter
TAVPWSSDTAVPWSSDTAVPWSSDTAVPWSSD
Huaibei1.69−0.70−2.97−0.370.140.23−1.53−4.101.17−0.62−3.46−1.282.99−2.39−5.59−0.64
Jianghuai1.970.04−1.560.530.360.74−0.81−3.691.29−0.37−2.11−0.362.51−2.25−3.26−0.58
Sunan2.210.74−1.730.510.590.85−1.12−4.091.640.10−2.23−0.662.52−2.16−3.46−0.75
Whole1.95−0.02−2.050.240.350.62−1.11−3.911.34−0.32−2.52−0.702.65−2.27−3.98−0.64
Note: Values in bold face indicate the dominant contributing factors.

