Variability of Spatially Grid-Distributed Precipitation over the Huaihe River Basin in China

 ,
, 
Abstract
:1. Introduction
2. Data and Methods
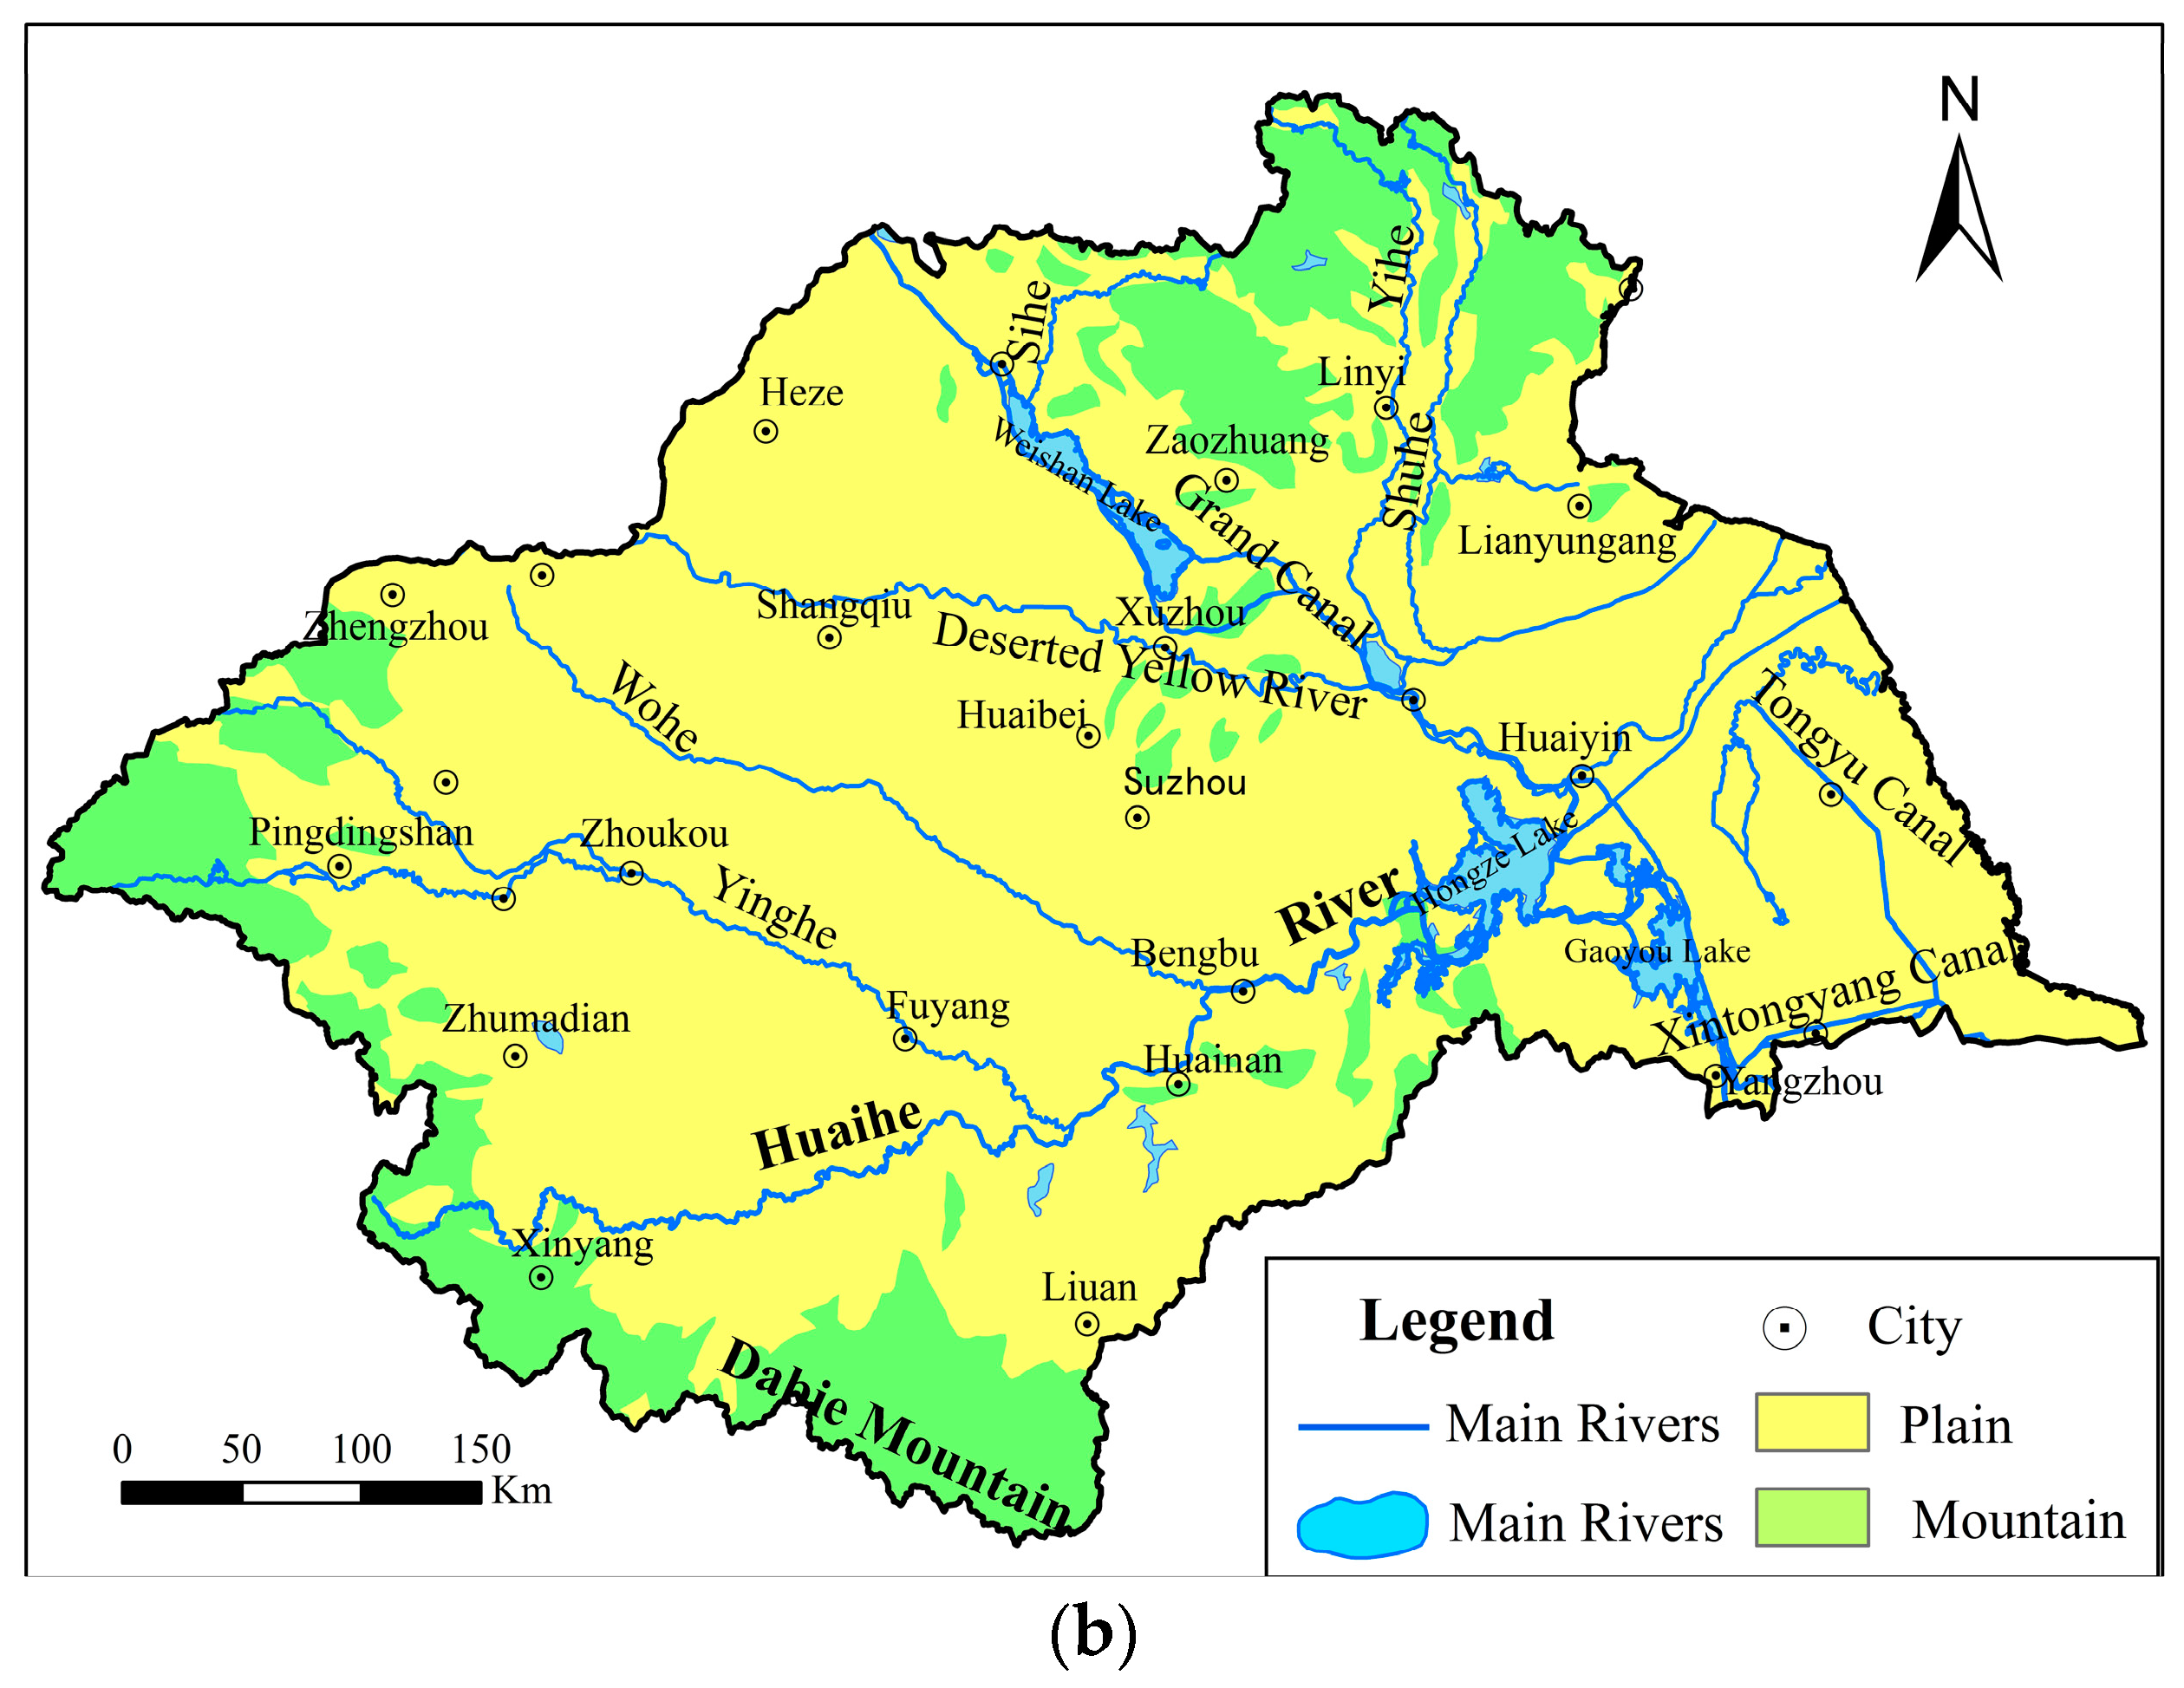
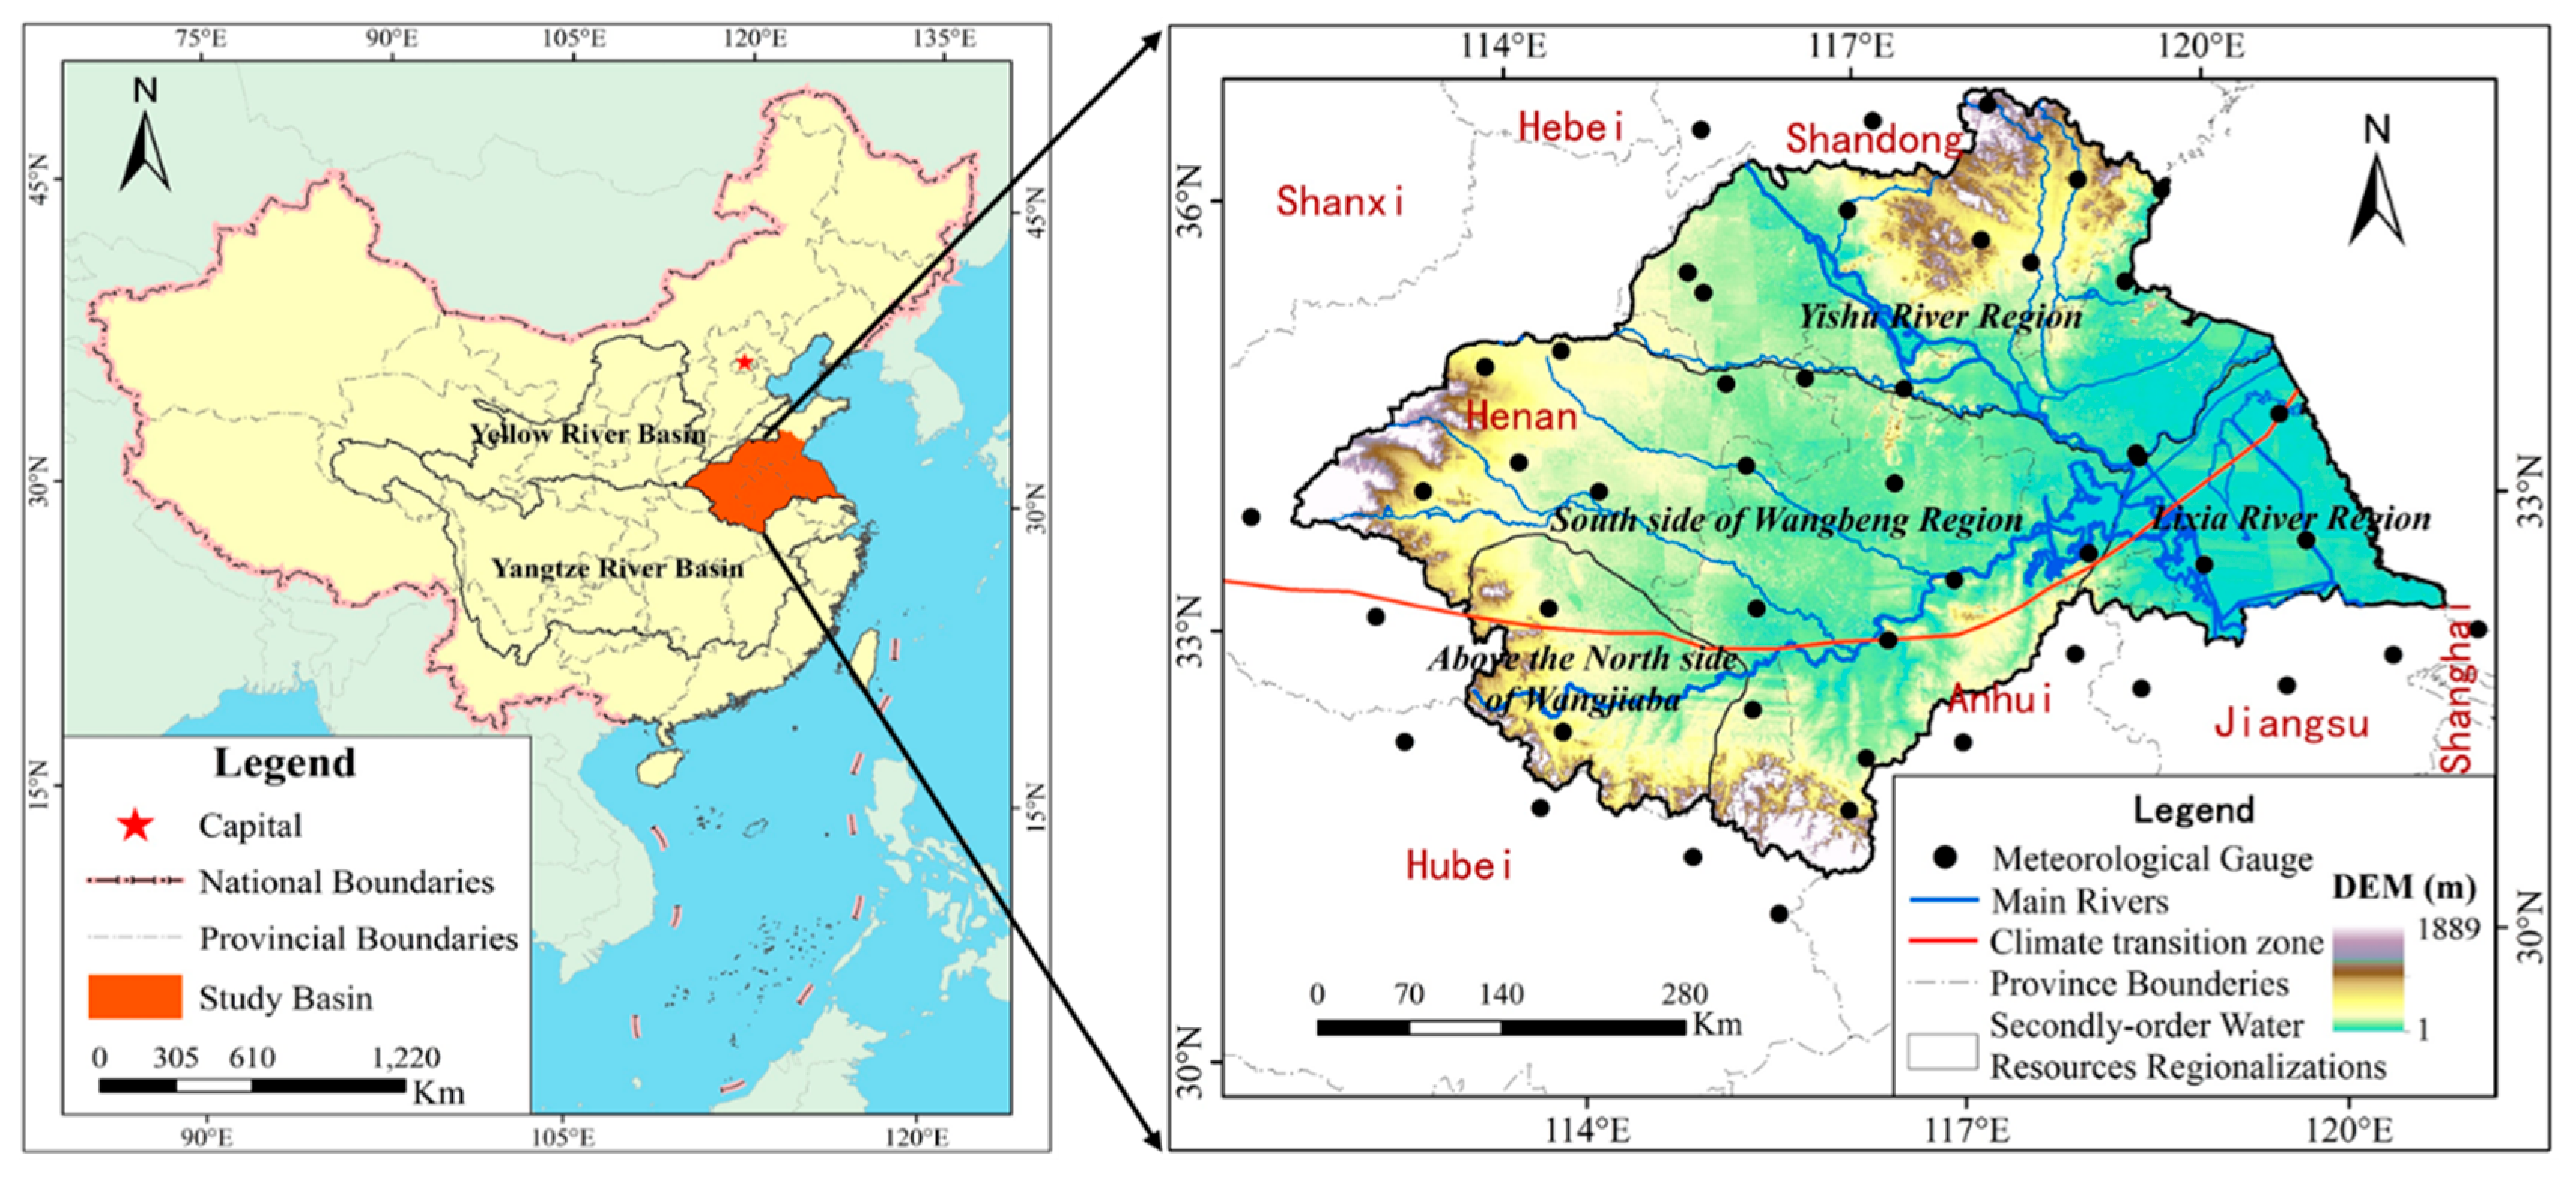
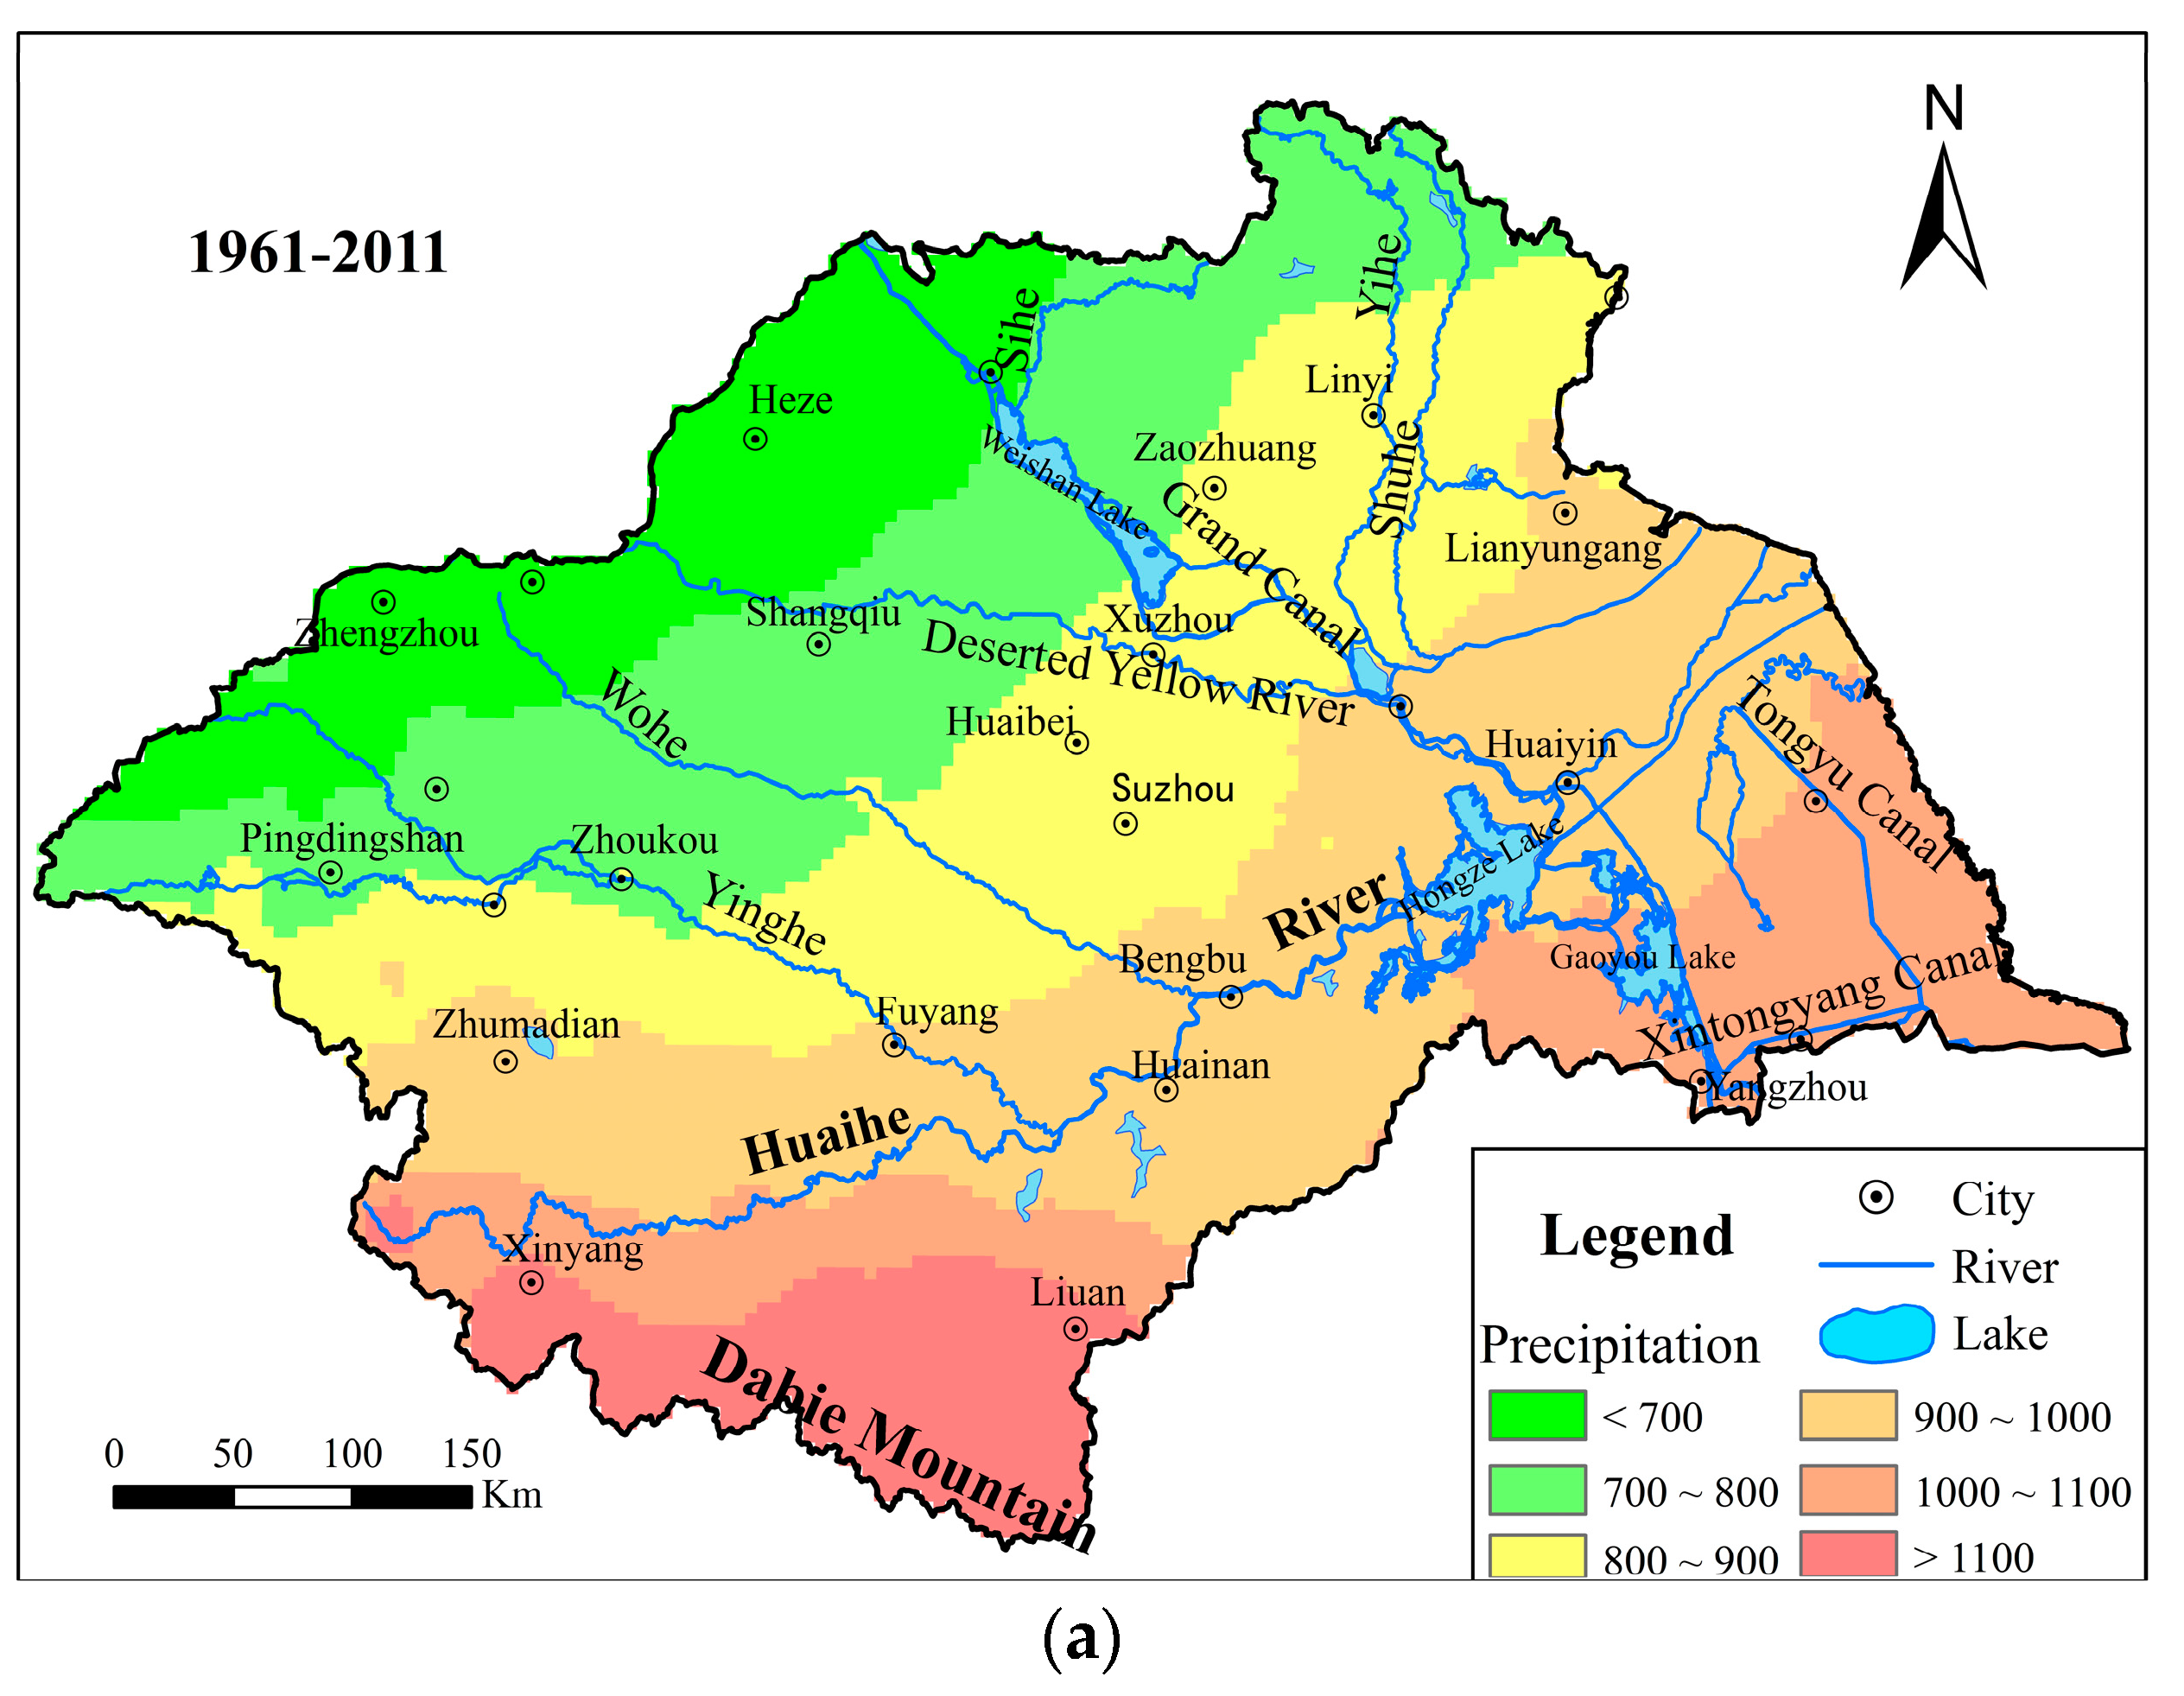
2.1. Study Area
2.2. Data
2.3. Methods
2.3.1. Linear Regression Method
2.3.2. Coefficients of Variation
2.3.3. Pettitt Test
2.3.4. Wavelet Analysis
3. Results
3.1. Spatial Variations of Annual Precipitation
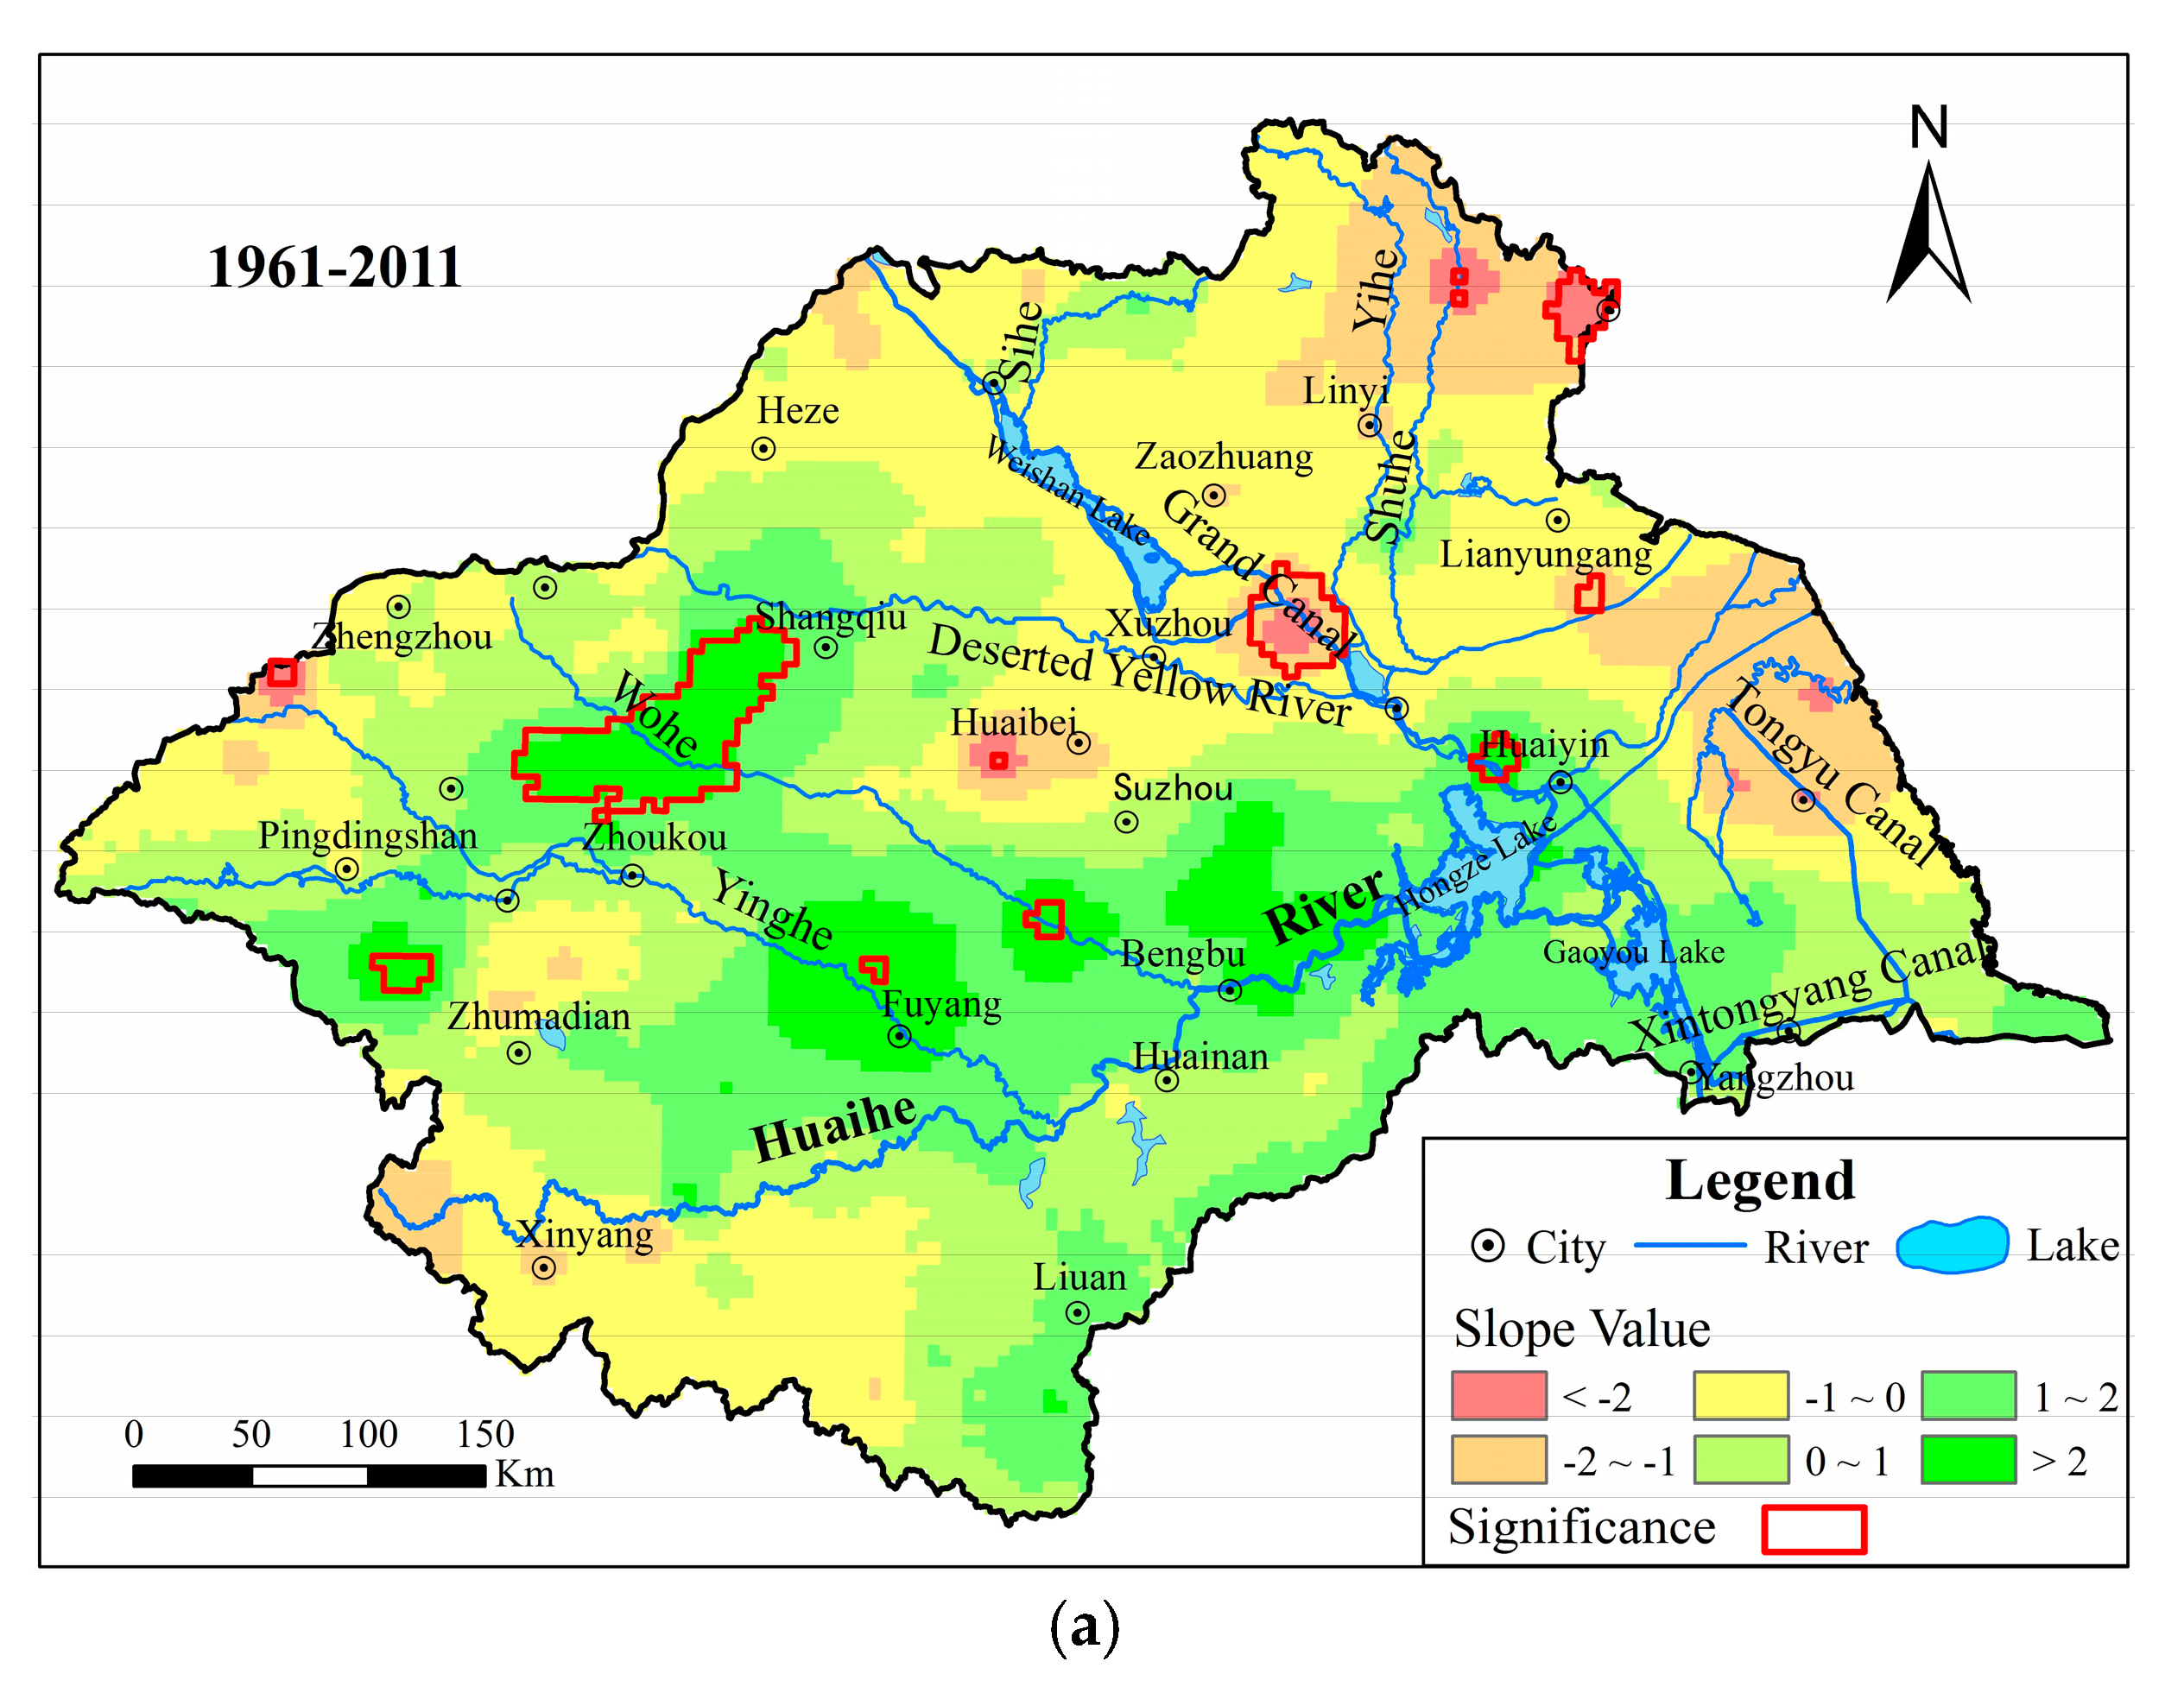
3.1.1. Trends of Annual Precipitation
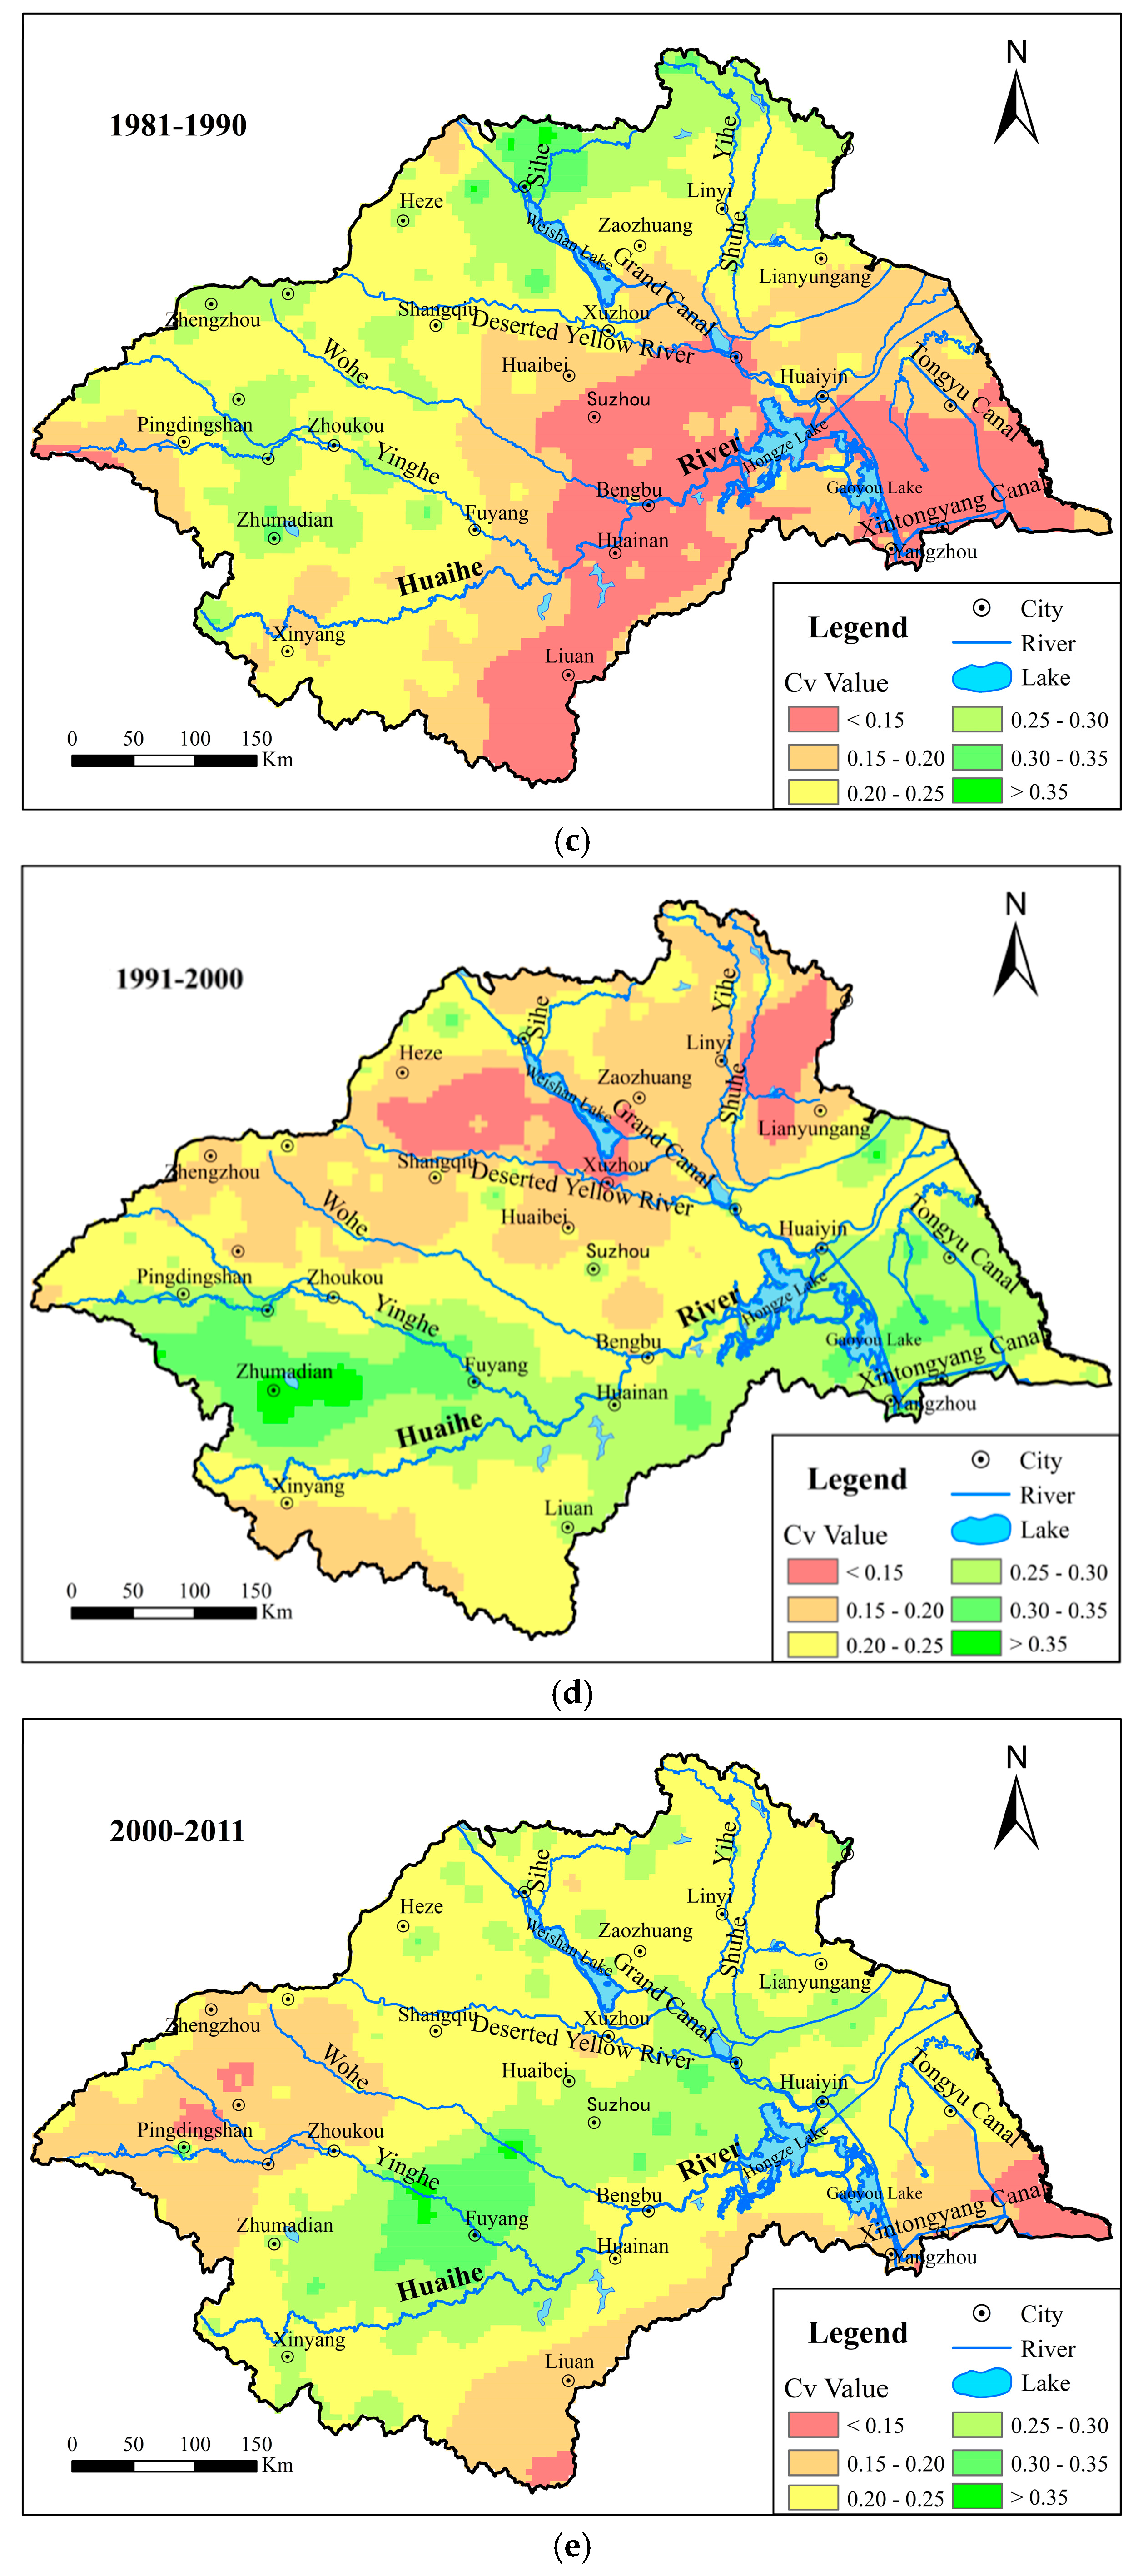
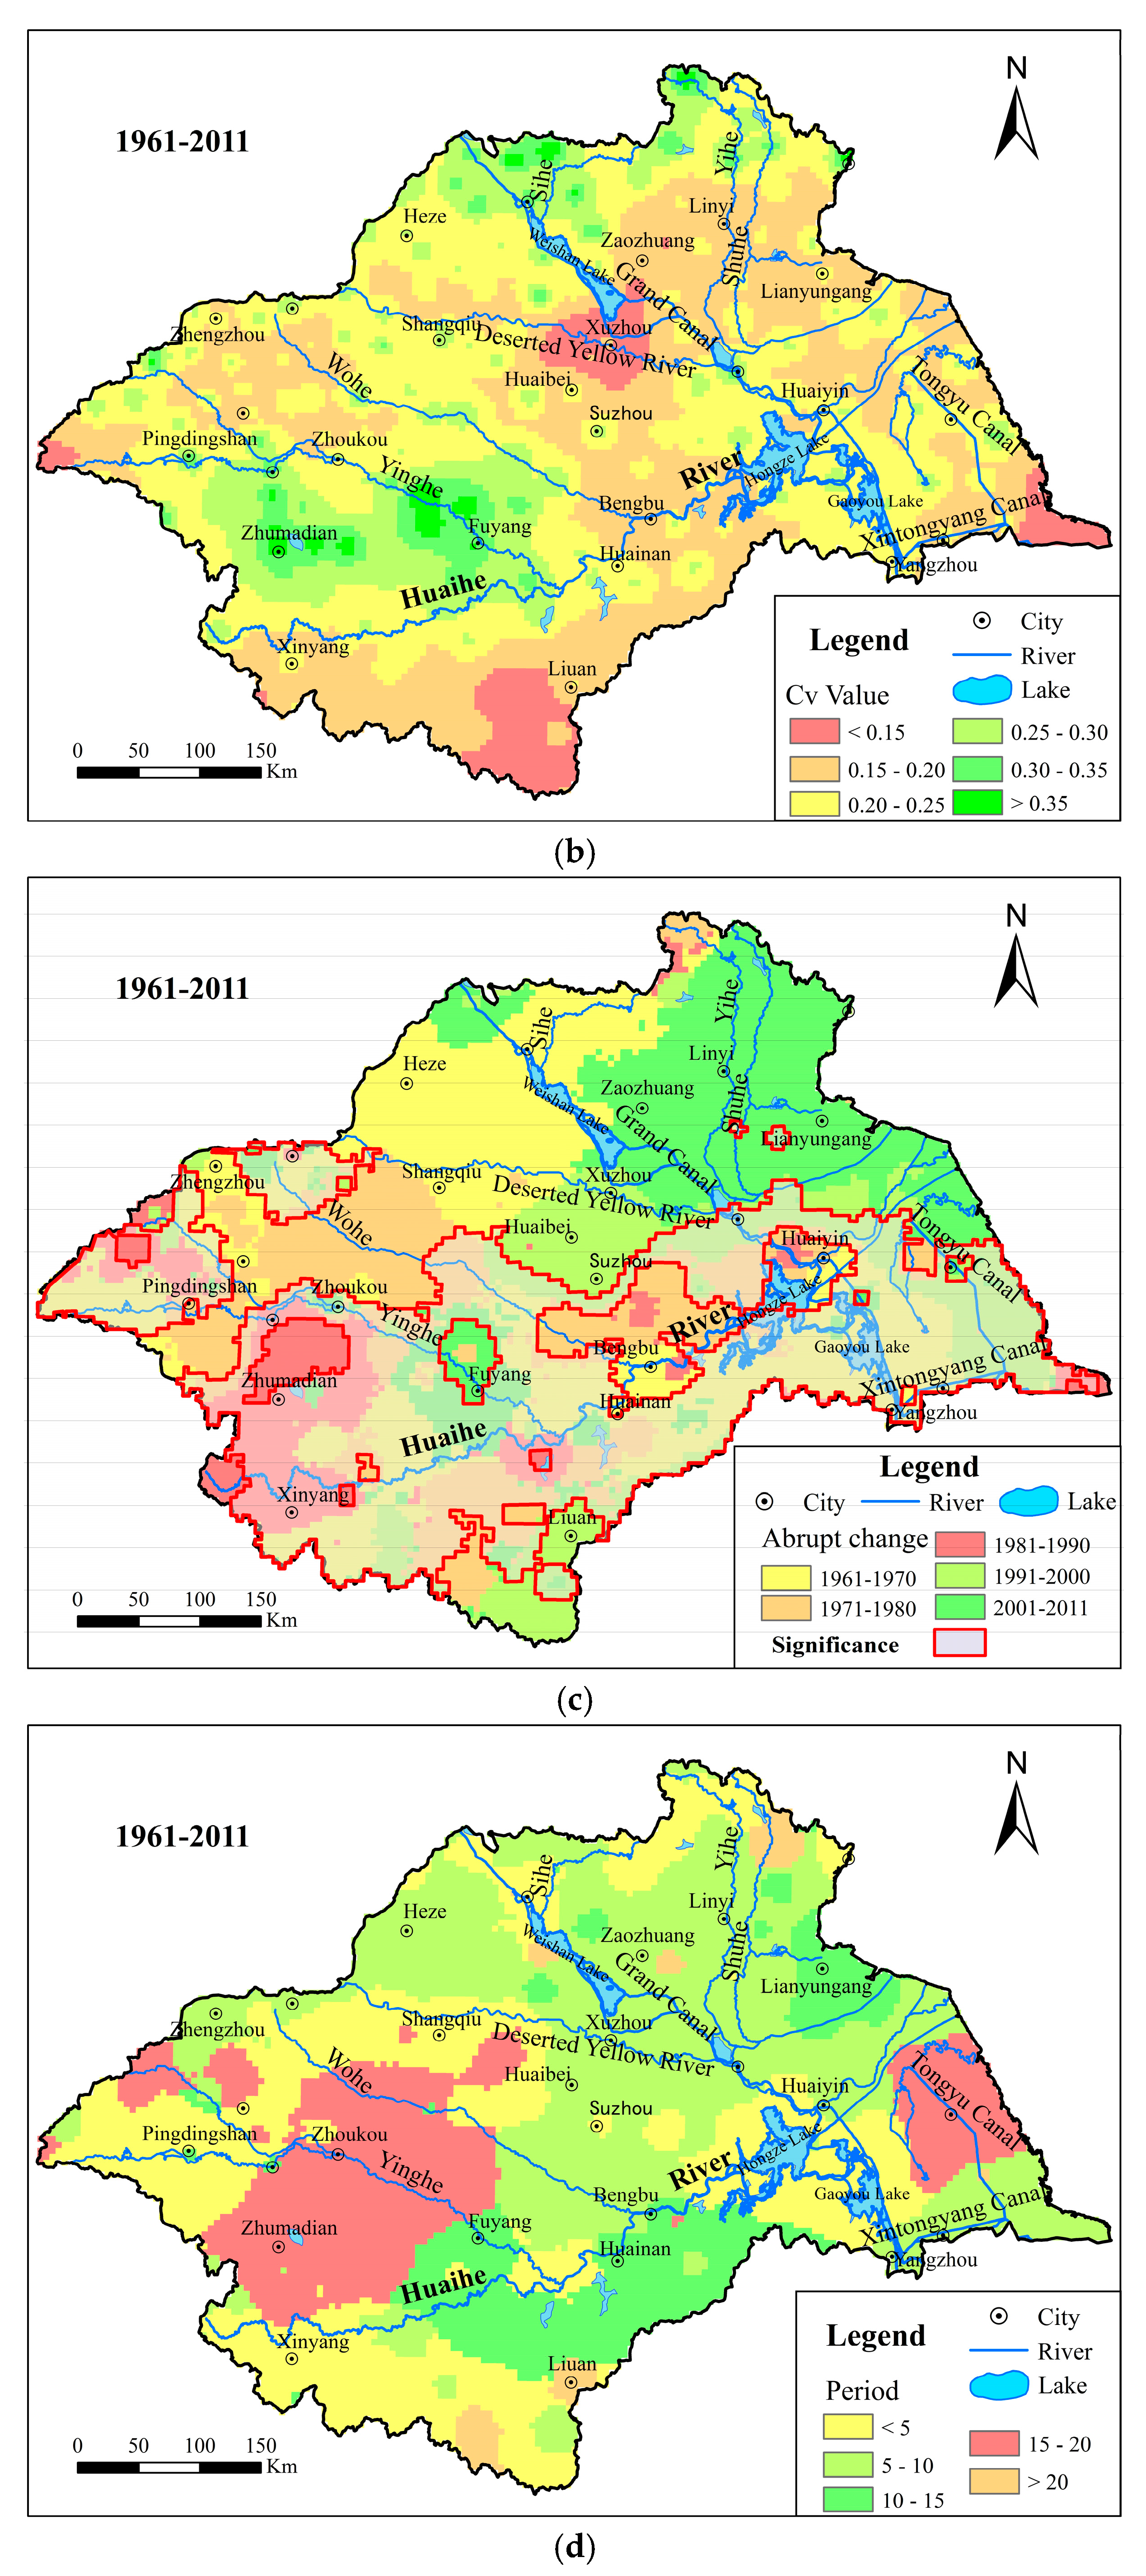
3.1.2. Randomicity of Annual Precipitation
3.1.3. Abrupt Change of Annual Precipitation
3.1.4. Periodicity of Annual Precipitation
3.2. Spatial Variations of Inter-Decadal Precipitation
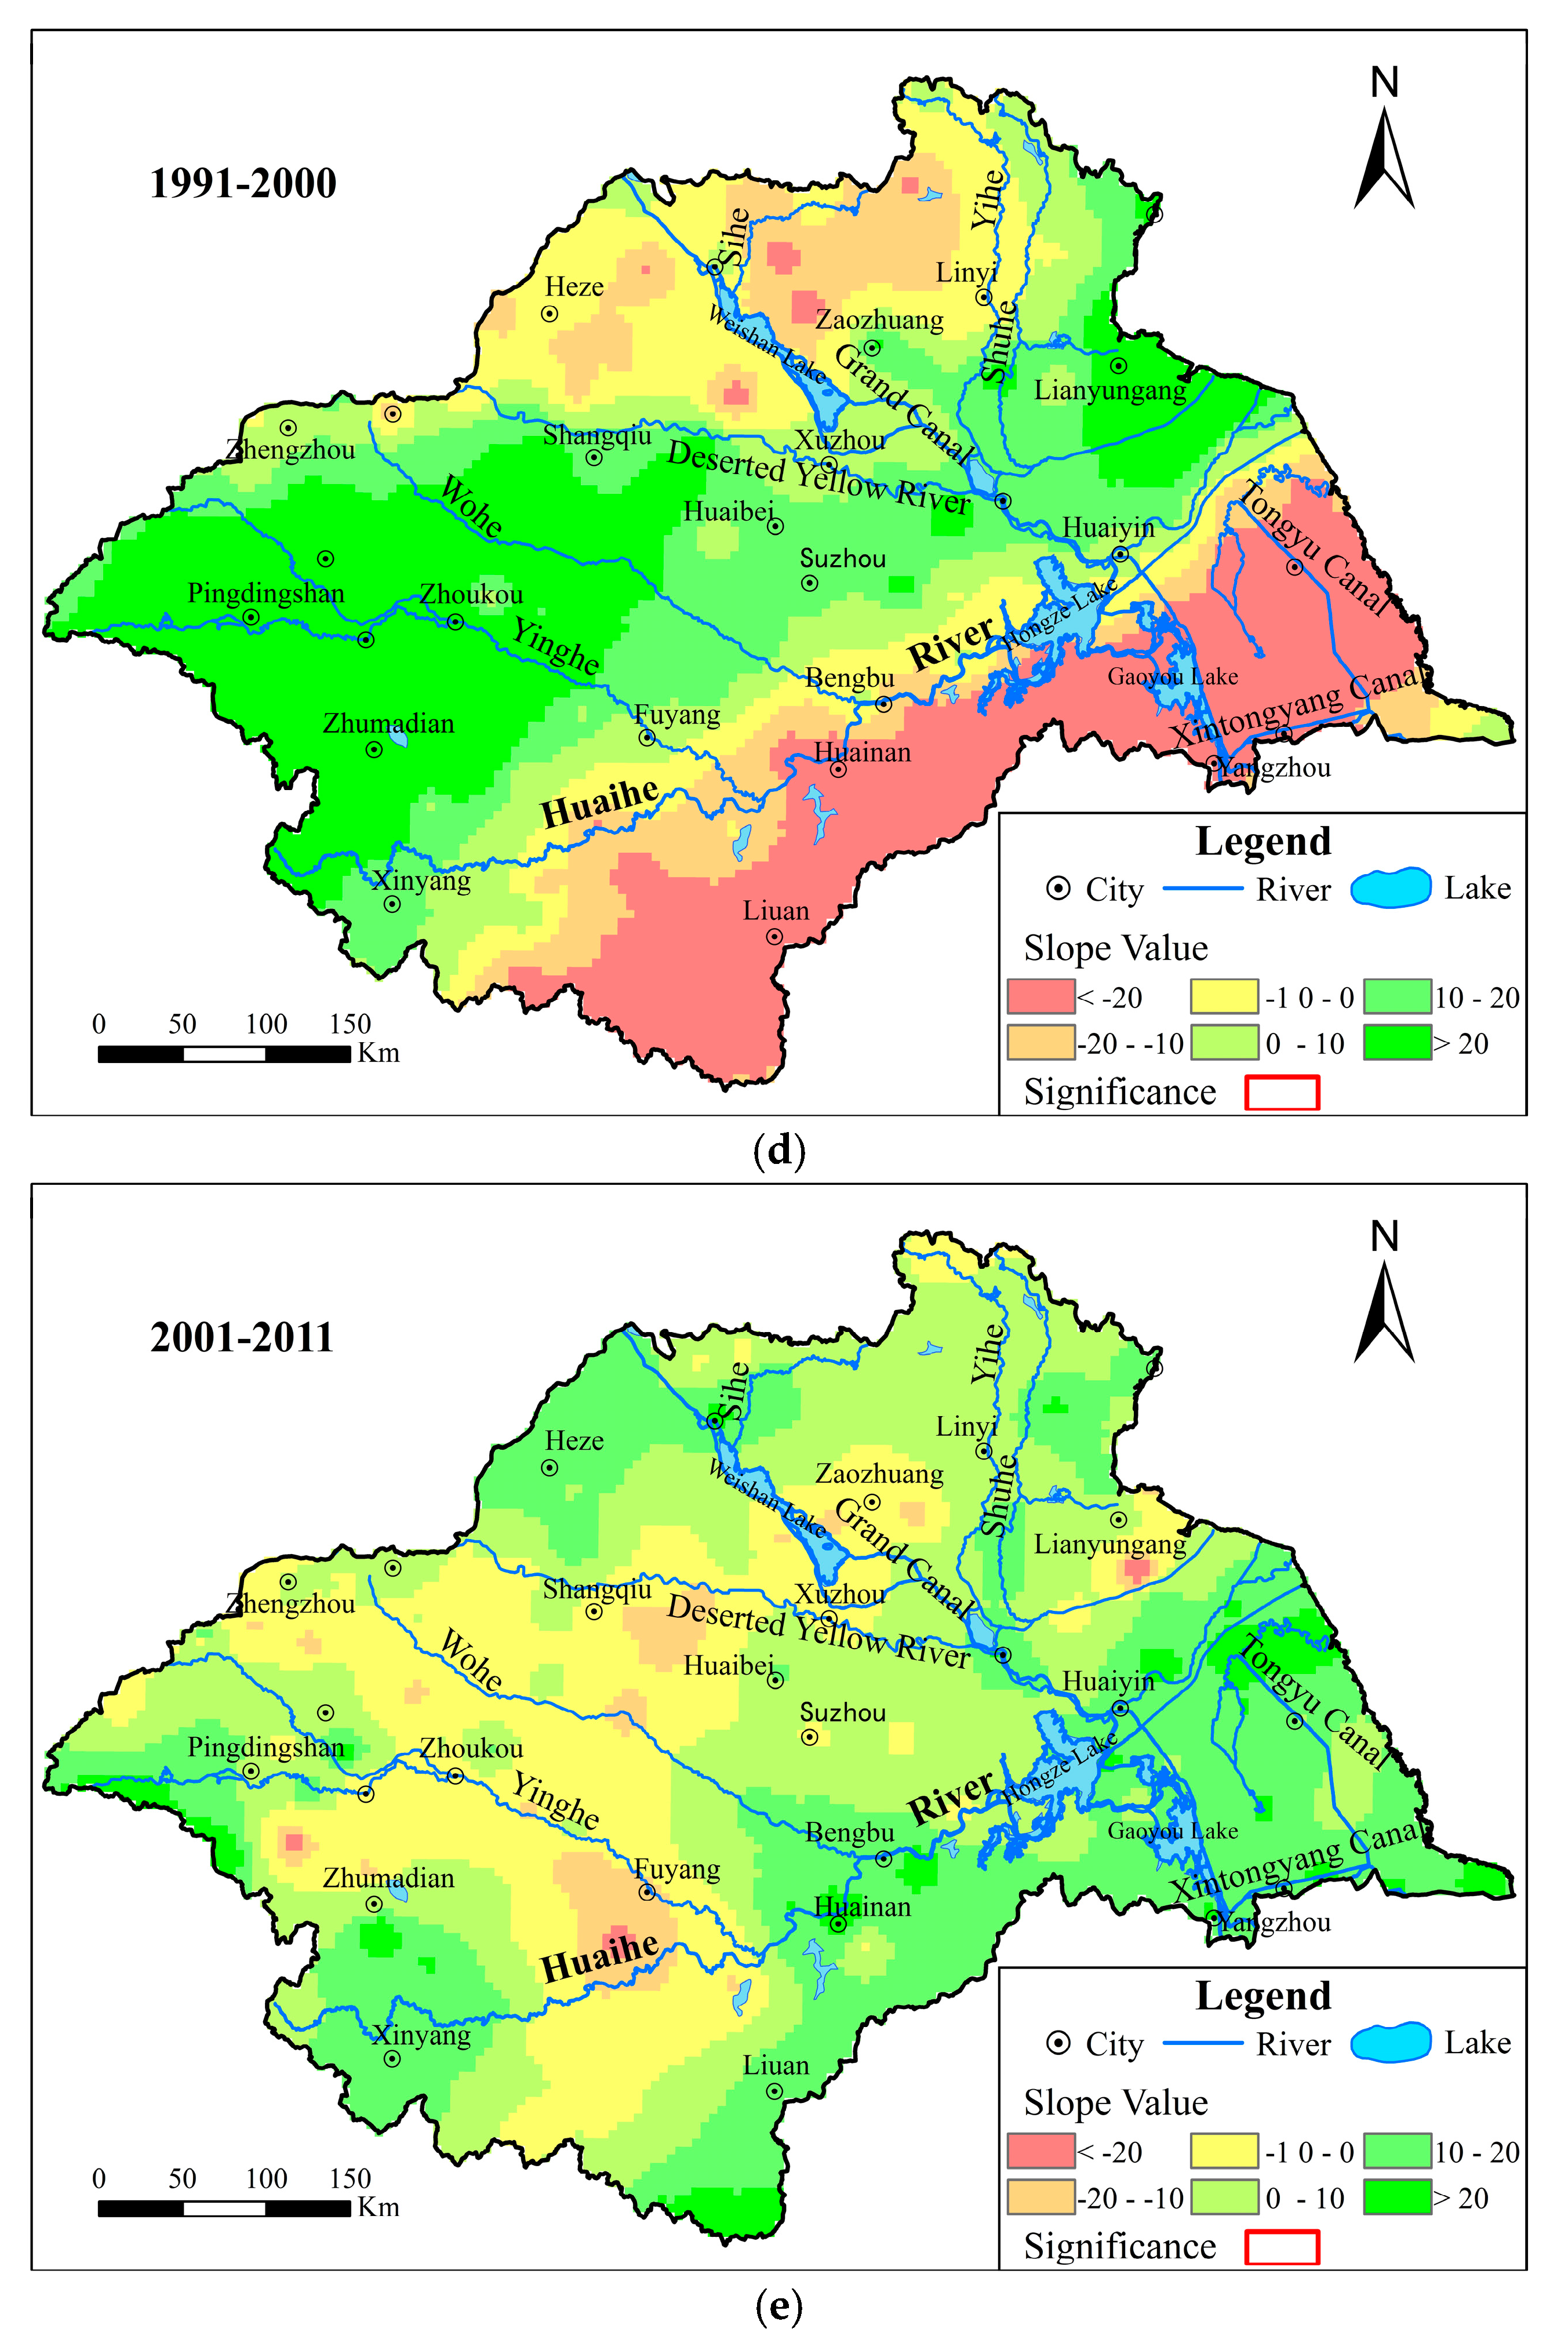
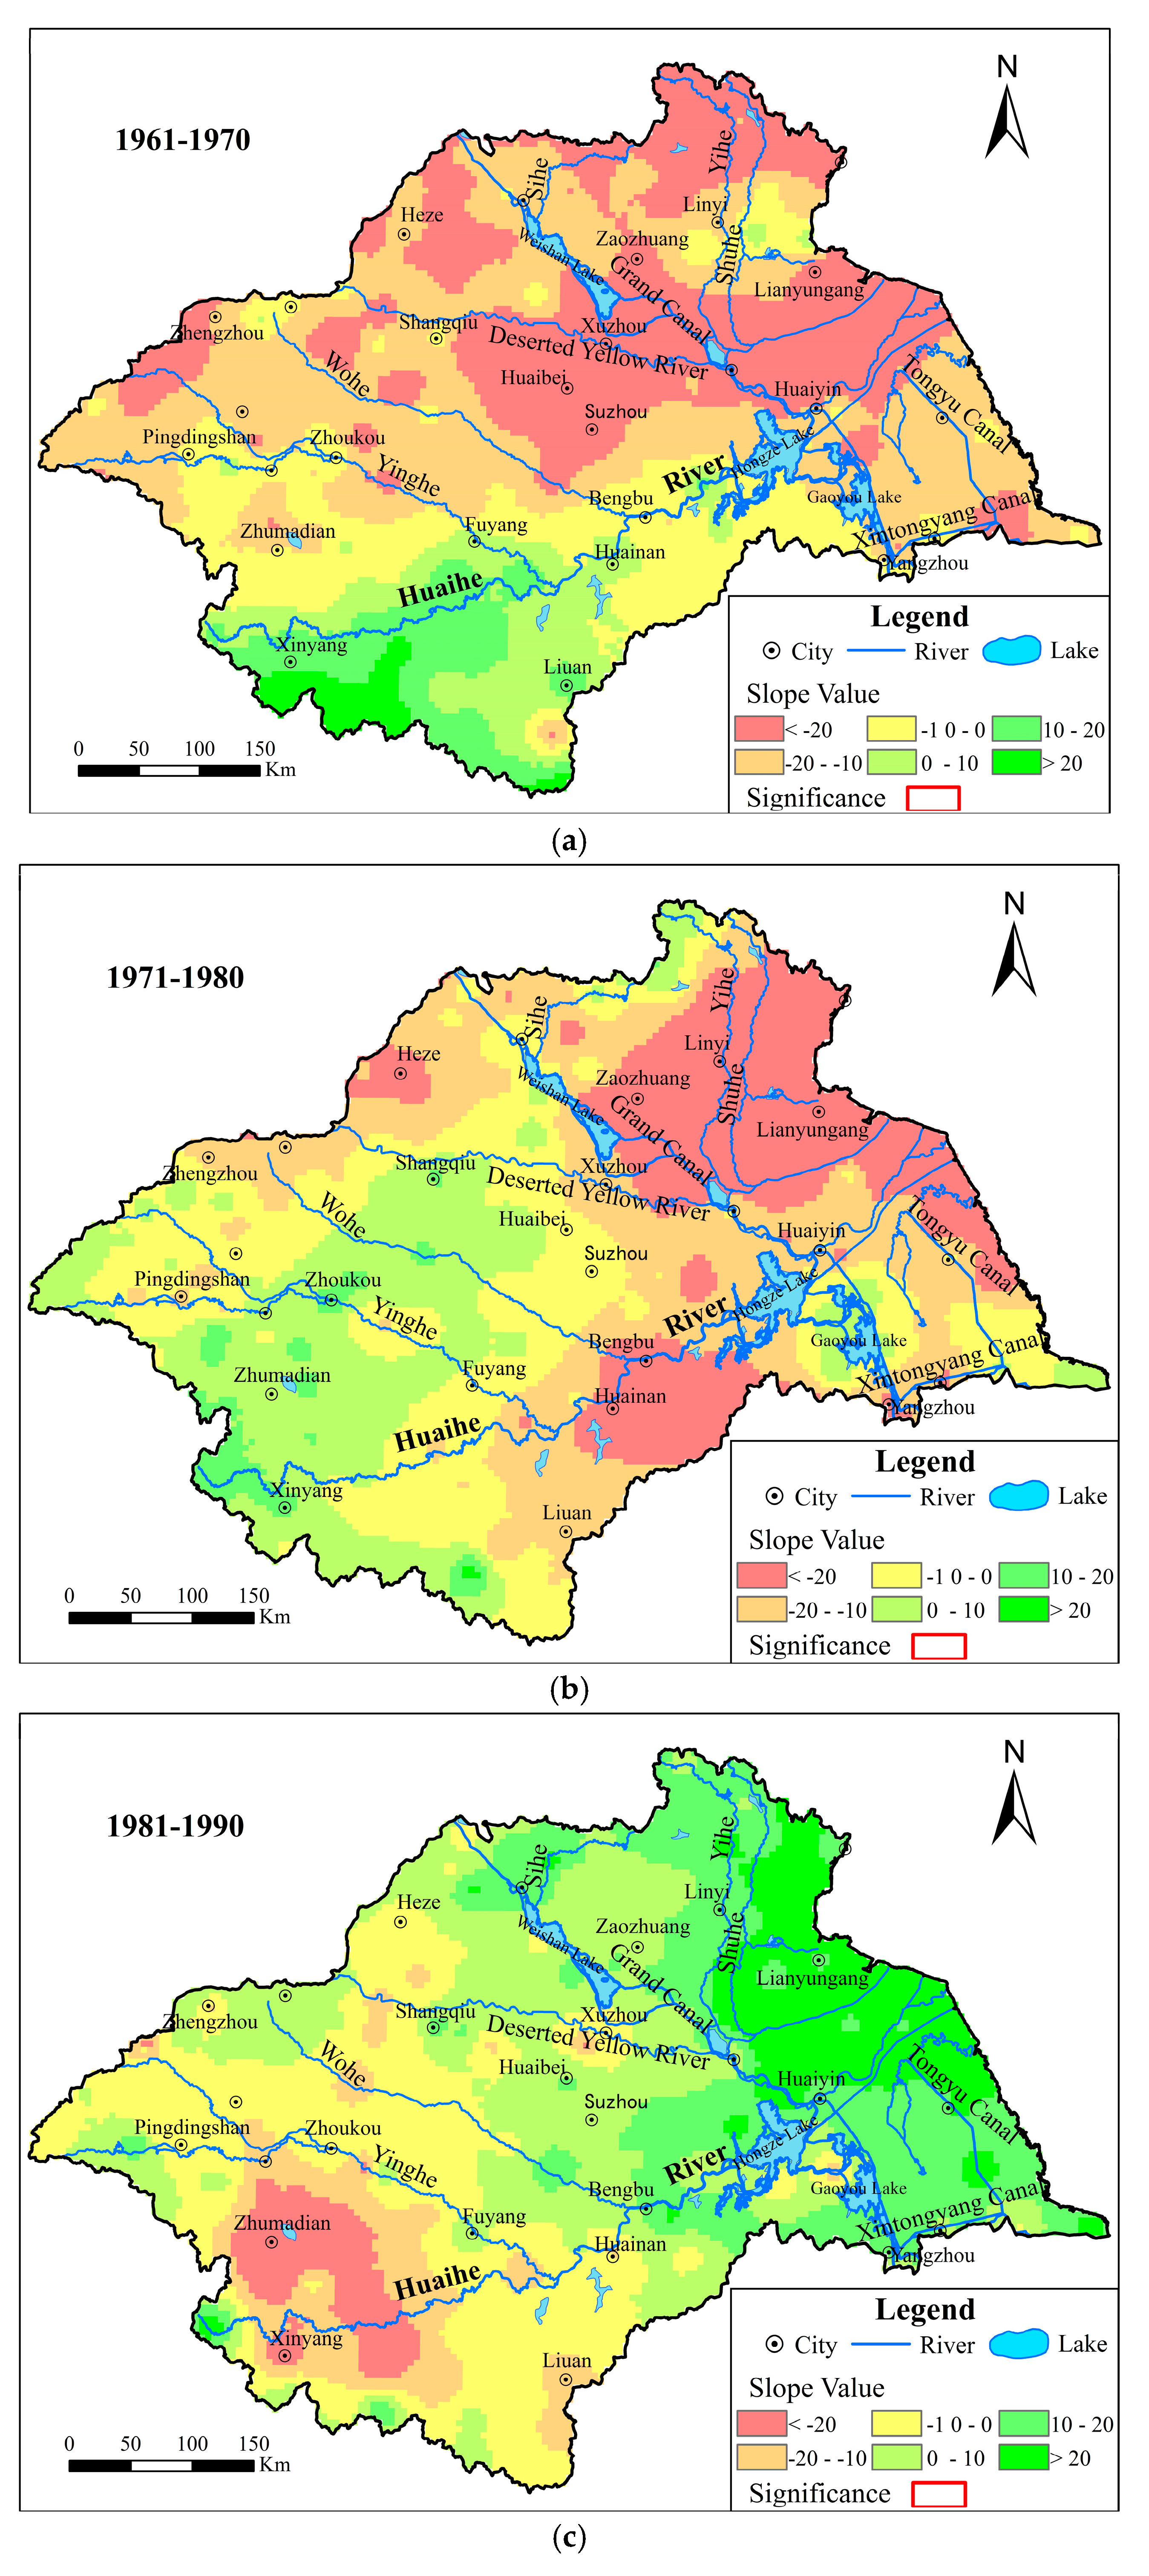
3.2.1. Trends of Inter-Decadal Precipitation
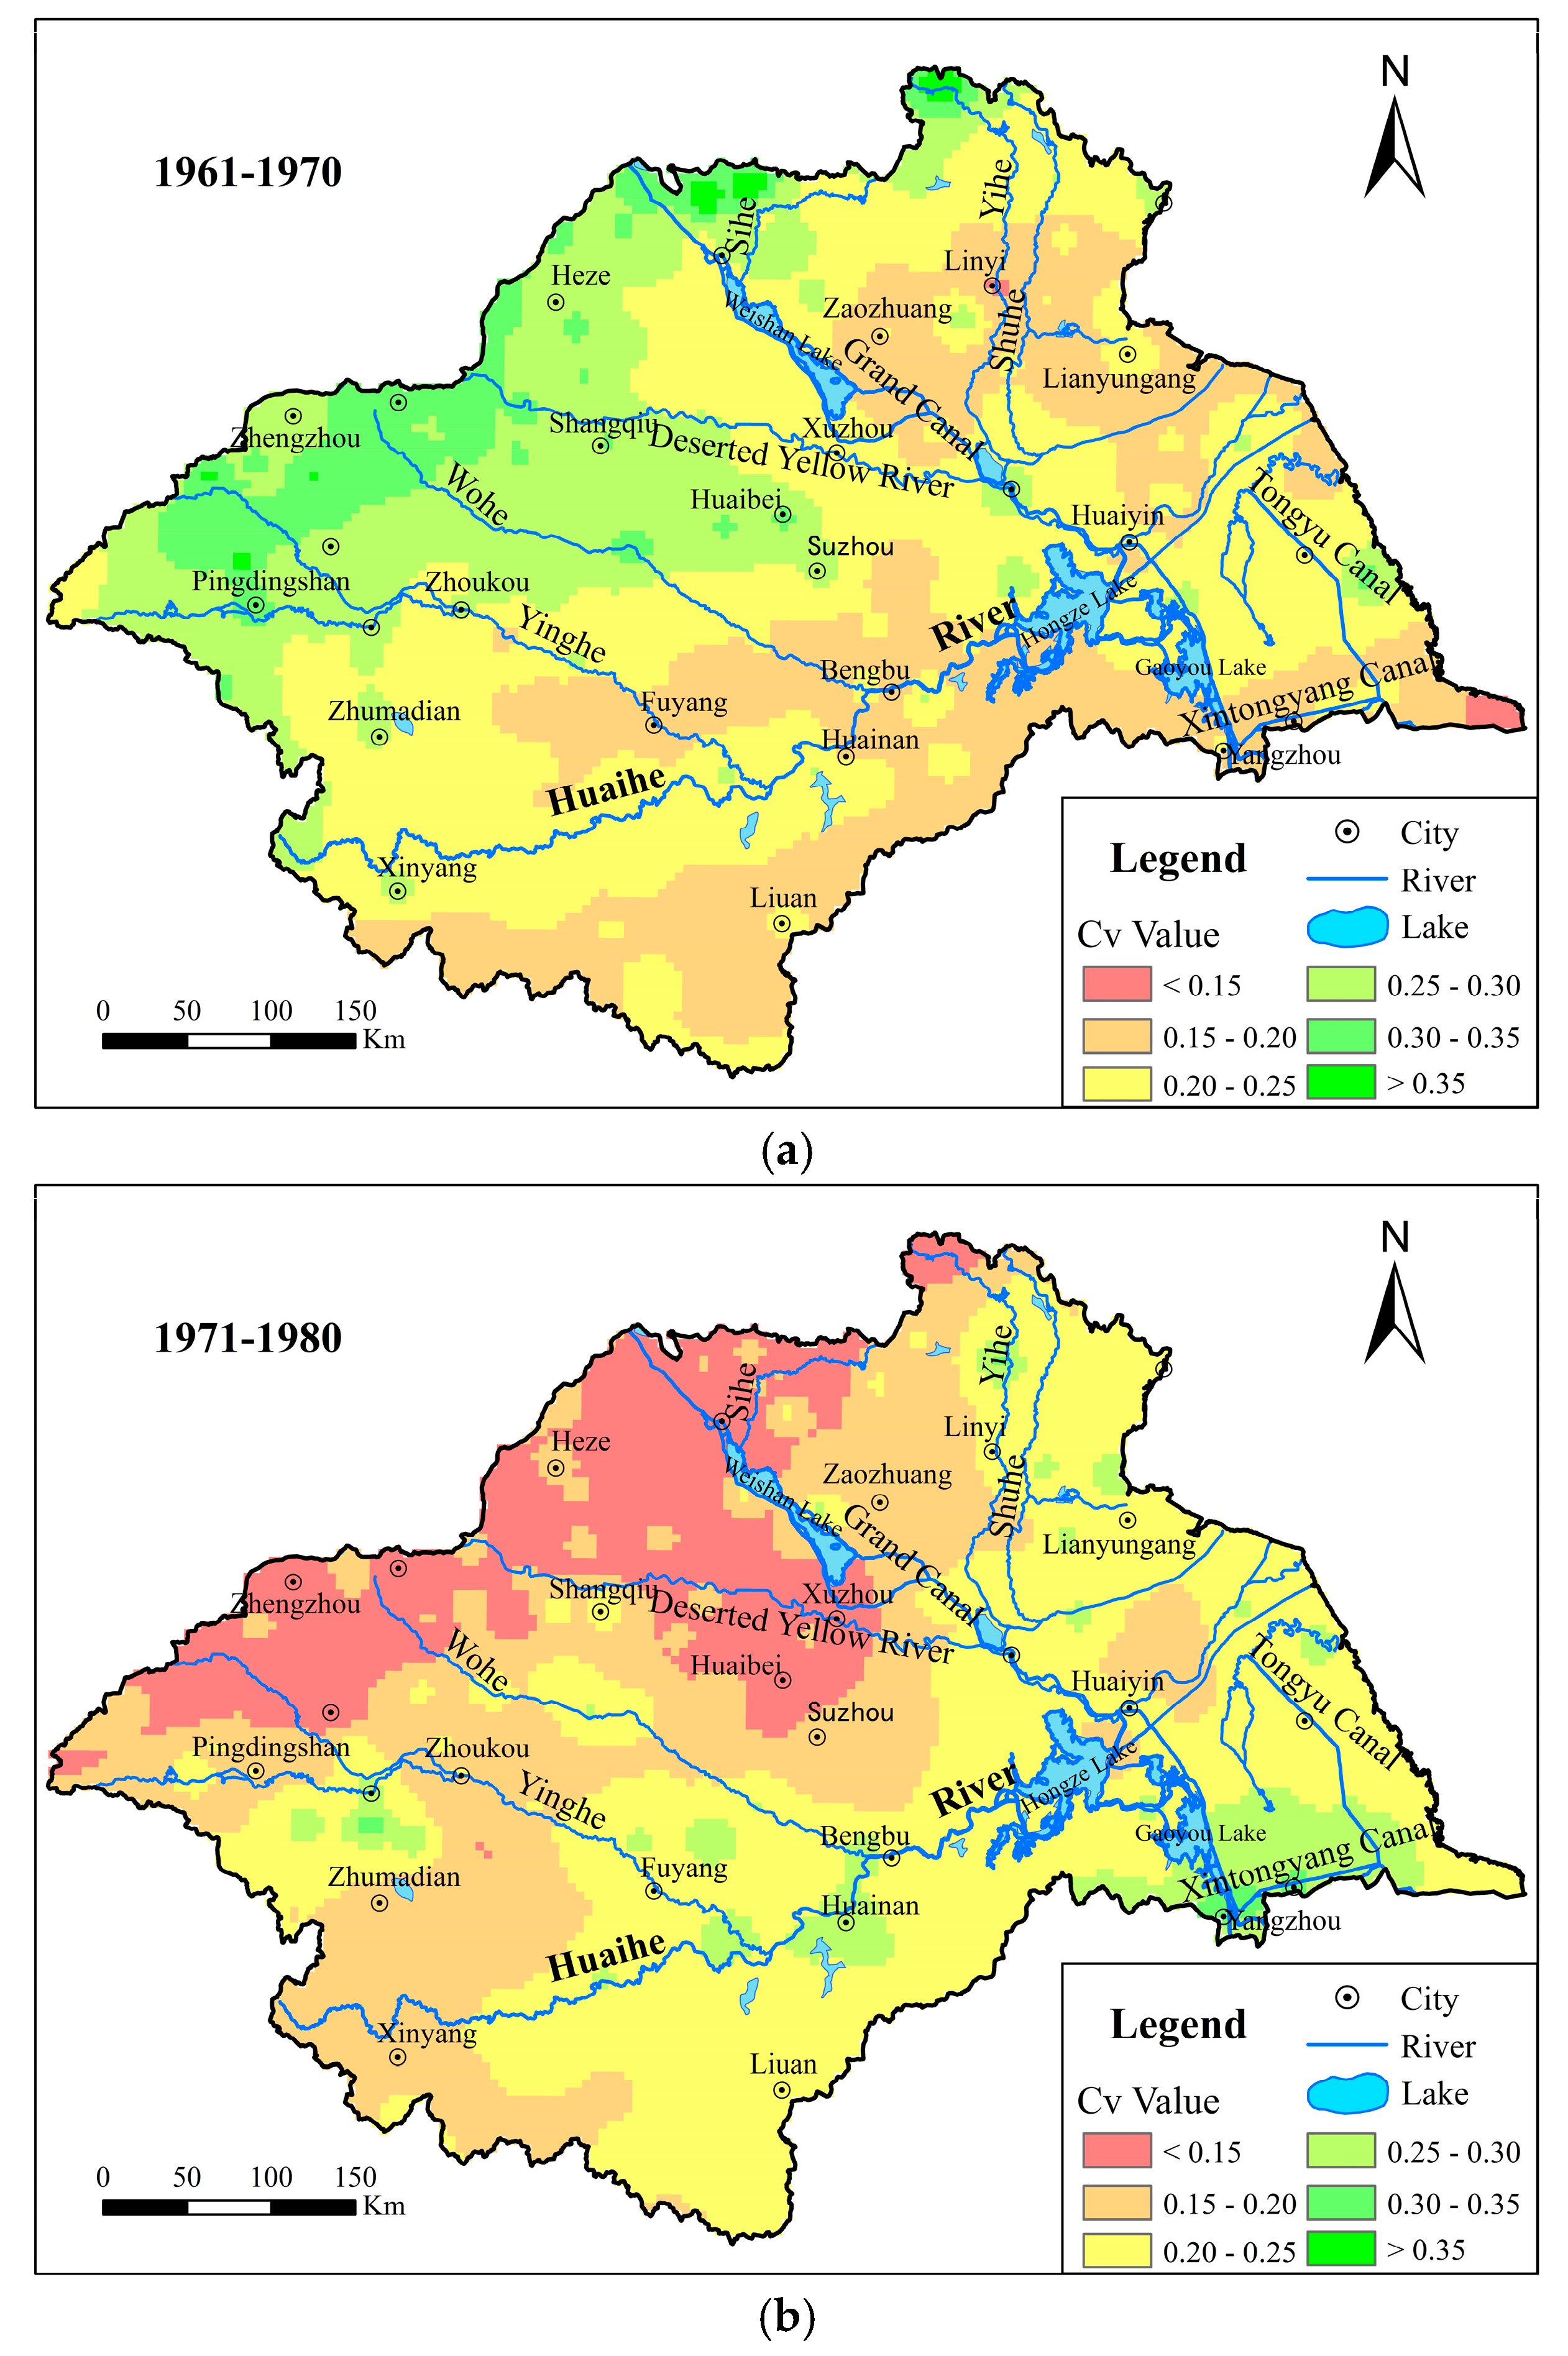
3.2.2. Randomicity of Inter-Decadal Precipitation
4. Discussion
4.1. Trends of the Precipitation
4.2. Randomicity of Precipitation
4.3. Abrupt Change of Precipitation
4.4. Periodicity of Precipitation
4.5. Advice for Management Implications in a Basin
4.6. Future Challenges
5. Conclusions
Acknowledgments
Author Contributions
Conflicts of Interest
References
- Limsakul, A.; Singhruck, P. Long-term trends and variability of total and extreme precipitation in Thailand. Atmos. Res. 2016, 169, 301–317. [Google Scholar] [CrossRef]
- Oguntunde, P.G.; Abiodun, B.J.; Lischeid, G. Precipitation trends in Nigeria, 1901–2000. J. Hydrol. 2011, 411, 207–218. [Google Scholar] [CrossRef]
- Sayemuzzaman, M.; Jha, M.K. Seasonal and annual precipitation time series trend analysis in North Carolina, United States. Atmos. Res. 2014, 137, 183–194. [Google Scholar] [CrossRef]
- Wang, X.; Cui, G.; Wu, F.; Li, C.H. Analysis of temporal-spatial precipitation variations during the crop growth period in the Lancang River basin, southwestern China. Ecol. Eng. 2015, 76, 47–56. [Google Scholar] [CrossRef]
- Xia, J.; She, D.X.; Zhang, Y.Y.; Du, H. Spatio-temporal trend and statistical distribution of extreme precipitation events in Huaihe River Basin during 1960–2009. J. Geogr. Sci. 2012, 22, 195–208. [Google Scholar] [CrossRef]
- Chang, H.; Kwon, W.-T. Spatial variations of summer precipitation trends in South Korea, 1973–2005. Environ. Res. Lett. 2007, 2, 45012–45019. [Google Scholar] [CrossRef]
- Chatterjee, S.; Khan, A.; Akbari, H.; Wang, Y.P. Monotonic trends in spatio-temporal distribution and concentration of monsoon precipitation (1901–2002), West Bengal, India. Atmos. Res. 2016, 182, 54–75. [Google Scholar] [CrossRef]
- Irannezhad, M.; Marttila, H.; Chen, D.; Kløve, B. Century-long variability and trends in daily precipitation characteristics at three Finnish stations. Adv. Clim. Chang. Res. 2016, 7, 54–59. [Google Scholar] [CrossRef]
- Zhao, C.Y.; Wang, Y.; Zhou, X.Y.; Cui, Y.; Liu, Y.L.; Shi, D.M.; Yu, H.M.; Liu, Y.Y. Changes in climatic factors and extreme climate events in Northeast China during 1961–2010. Adv. Clim. Chang. Res. 2013, 4, 92–102. [Google Scholar]
- Tabari, H.; Abghari, H.; Hosseinzadeh Talaee, P. Temporal trends and spatial characteristics of drought and precipitation in arid and semiarid regions of Iran. Hydrol. Process. 2012, 26, 3351–3361. [Google Scholar] [CrossRef]
- Zhang, W.; Pan, S.M.; Cao, L.G.; Cai, X.; Zhang, K.X.; Xu, Y.H.; Xu, W. Changes in extreme climate events in eastern China during 1960–2013: A case study of the Huaihe River Basin. Quat. Int. 2015, 380, 22–34. [Google Scholar] [CrossRef]
- Chen, Y.N.; Xu, C.C.; Hao, X.M.; Ye, Z.X. Fifty-year climate change and its effect on annual runoff in the Tarim River Basin, China. Quat. Int. 2009, 208, 53–61. [Google Scholar]
- Tabari, H.; Talaee, P.H. Temporal variability of precipitation over Iran: 1966–2005. J. Hydrol. 2011, 396, 313–320. [Google Scholar] [CrossRef]
- Tian, Q.; Prange, M.; Merkel, U. Precipitation and temperature changes in the major Chinese river basins during 1957–2013 and links to sea surface temperature. J. Hydrol. 2016, 536, 208–221. [Google Scholar] [CrossRef]
- Fu, G.B.; Yu, J.J.; Yu, X.B.; Ouyang, R.L.; Zhang, Y.C.; Wang, P.; Liu, W.B.; Min, L.L. Temporal variation of extreme precipitation events in China, 1961–2009. J. Hydrol. 2013, 487, 48–59. [Google Scholar] [CrossRef]
- Liu, Q.; Yang, Z.; Cui, B. Spatial and temporal variability of annual precipitation during 1961–2006 in Yellow River Basin, China. J. Hydrol. 2008, 361, 330–338. [Google Scholar] [CrossRef]
- Liu, Y.; Li, X.; Zhang, Q.; Guo, Y.F.; Gao, G.; Wang, J.P. Simulation of regional temperature and precipitation in the past 50 years and the next 30 years over China. Quat. Int. 2010, 212, 57–63. [Google Scholar] [CrossRef]
- Liu, H.Y.; Gao, Q. Contribution rate of driving factors on the rainfall-sediment relationship of Longhe River watershed in the Three Gorges Reservoir region. Sci. Soil Water Conserv. 2015, 13, 1–8. [Google Scholar]
- Portmann, R.W.; Solomon, S.; Hegerl, G.C. Spatial and seasonal patterns in climate change, temperatures, and precipitation across the United States. Proc. Natl. Acad. Sci. USA 2009, 106, 7324–7329. [Google Scholar] [CrossRef] [PubMed]
- Keggenhoff, I.; Elizbarashvili, M.; Amiri-Farahani, A.; King, L. Trends in daily temperature and precipitation extremes over Georgia, 1971–2010. Weather Clim. Extrem. 2014, 4, 75–85. [Google Scholar] [CrossRef]
- Beecham, S.; Chowdhury, R.K. Temporal characteristics and variability of point precipitation: A statistical and wavelet analysis. Int. J. Climatol. 2010, 30, 458–473. [Google Scholar]
- Sang, Y.F.; Singh, V.P.; Gong, T.; Xu, K.; Sun, F.; Liu, C.; Liu, W.; Chen, R. Precipitation variability and response to changing climatic condition in the Yarlung Tsangpo River basin, China. J. Geophys. Res. Atmos. 2016, 121, 8820–8831. [Google Scholar] [CrossRef]
- Wang, R.; Li, C. Spatiotemporal analysis of precipitation trends during 1961–2010 in Hubei province, central China. Theor. Appl. Clim. 2016, 124, 385–399. [Google Scholar] [CrossRef]
- Karpouzos, D.K.; Kavalieratou, S.; Babajimopoulos, C. Trend analysis of precipitation data in Pieria Region (Greece). Eur. Water 2010, 30, 31–40. [Google Scholar]
- Shi, P.; Rui, X.F. Comparison and improvement of spatial rainfall interpolation methods. J. Hohai Univ. (Nat. Sci.) 2005, 33, 361–365. (In Chinese) [Google Scholar]
- Mohamed, A.S. Reliabilty Estimation of Rainfall-Runoff Models; State University of New York: New York, NY, USA, 1999. [Google Scholar]
- Shi, P.; Ma, X.X.; Chen, X.; Qu, S.M.; Zhang, Z.C. Analysis of variation trends in precipitation in an upstream catchment of Huai River. Math. Probl. Eng. 2013, 2013, 1262–1268. [Google Scholar] [CrossRef]
- Zhou, Y.K.; Wang, L.C.; Peng, X.Y.; Zhang, J. Chaotic dynamics of the flood series in the Huaihe river basin. J. Hydrol. 2002, 258, 100–110. [Google Scholar] [CrossRef]
- Song, X.S.; Yan, D.H.; Wang, Y.H.; Wang, Y. Analysis on the evolution of drought and flood class in the east-central Huang-Huai-Hai plain over the last 540 years basing on Markov model. J. Hydrol. Eng. 2013, 12, 1425–1432. (In Chinese) [Google Scholar]
- Yang, Z.Y.; Yuan, Z.; Yan, D.H.; Weng, B. Study of spatial and temporal distribution and multiple characteristics of drought and flood in Huang-Huai-Hai River basin. Adv. Water Sci. 2013, 24, 617–625. (In Chinese) [Google Scholar]
- Croley, T.E., II; Hartmann, H.C. Resolving Thiessen polygons. J. Hydrol. 1985, 76, 363–379. [Google Scholar] [CrossRef]
- China Meteorological Data Service Center (CMDC). Available online: http://data.cma.cn/data/cdcdetail/dataCode/SURF_CLI_CHN_MUL_DAY.html (accessed on 20 March 2012).
- Yang, M.M.; Zhong, P.A.; Wei, P. Study on precipitation evolution rule of Huaihe River Basin in main flood period. Water Resour. Power 2012, 30, 37–40. [Google Scholar]
- Wei, F.Y. Xiandai Qiuhou Tongji Zhenduan Yu Yuce Jishu; China Meteorological Press: Beijing, China, 2007; pp. 99–104.
- Li, M.; Xia, J.; Chen, S.M.; Meng, D.J. Wavelet analysis on annual precipitation around 300 Years in Beijing Area. J. Nat. Resour. 2011, 6, 1001–1011. (In Chinese) [Google Scholar]
- Teoh, W.L.; Khoo, M.B.C.; Castagliola, P.; Yeong, W.C.; Teh, S.Y. Run-sum control charts for monitoring the coefficient of variation. Eur. J. Oper. Res. 2017, 257, 144–158. [Google Scholar] [CrossRef]
- Aerts, S.; Haesbroeck, G.; Ruwet, C. Multivariate coefficients of variation: Comparison and influence functions. J. Multivar. Anal. 2015, 142, 183–198. [Google Scholar] [CrossRef]
- Dong, X.G.; Gu, W.Z.; Meng, X.X.; Liu, H.B. Change features of precipitation events in Shandong Province from 1961 to 2010. Acta Geogr. Sin. 2014, 69, 661–671. (In Chinese) [Google Scholar] [CrossRef]
- Xia, J.; Ou, C.P.; Huang, G.H.; Wang, Z.G. The analysis of Haihe River Basin hydro-meteorological spatio-temporal variability based on GIS and information difference measure. J. Nat. Resour. 2007, 22, 409–415. (In Chinese) [Google Scholar]
- Wang, X.J.; He, M.R.; Shang, M.T. Evolution law of precipitation in Yulin. J. Arid Land Resour. Environ. 2011, 25, 103–108. (In Chinese) [Google Scholar]
- Yan, D.H.; Han, D.M.; Wang, G.; Yuan, Y.; Hu, Y.; Fang, H.Y. The evolution analysis of flood and drought in Huai River Basin of China based on monthly precipitation characteristics. Nat. Hazards 2014, 73, 849–858. [Google Scholar] [CrossRef]
- Jin, Y.; Yan, A.; Jiang, P.A.; Wang, Z.; Wang, X.J. Spatial variability of filed soil water in Manas River Basin. Xinjiang Agric. Sci. 2013, 50, 1554–1559. (In Chinese) [Google Scholar]
- Pettitt, A.N. A non-parametric approach to the change-point problem. J. R. Stat. Soc. 1979, 28, 126–135. [Google Scholar] [CrossRef]
- Zhang, Y.M.; Tian, Y.; Lei, X.H.; Song, W.Z.; Jiang, Y.Z. Change characteristics of water resources in Sanchahe Upstream over past 50 years. J. China Hydrol. 2016, 36, 79–84. [Google Scholar]
- Yi, H.; Shu, H. The improvement of the Morlet wavelet for multi-period analysis of climate data. Comptes Rendus Geosci. 2012, 344, 483–497. [Google Scholar] [CrossRef]
- Hermida, L.; López, L.; Merino, A.; Berthet, C.; Gercía-Ortega, E.; Sánchez, J.L.; Dessens, J. Hailfall in southwest France: Relationship with precipitation, trends and wavelet analysis. Atmos. Res. 2015, 156, 174–188. [Google Scholar] [CrossRef]
- Zhang, S.Y.; Wang, J.H.; Zhai, J.Q.; Li, H.H.; Zhao, Y.; Wang, Q.M.; Zhang, W. Characteristics analysis of time serial of rainfall in the Northern part of Haihe River Basin from 1956 to 2012. South-to-North Water Transf. Water Sci. Technol. 2016, 14, 36–42. (In Chinese) [Google Scholar]
- Domingues, M.O.; Mendes, O.; da Costa, A.M. On wavelet techniques in atmospheric sciences. Adv. Space Res. 2005, 35, 831–842. [Google Scholar] [CrossRef]
- Li, D.; Guo, Z. Some aspects of ecological modeling developments in China. Ecol. Model. 2000, 132, 3–10. [Google Scholar] [CrossRef]
- Kovács, J.; Hatvani, I.G.; Korponai, J.; Kovács, I.S. Morlet wavelet and autocorrelation analysis of long-term data series of the Kis-Balaton water protection system (KBWPS). Ecol. Eng. 2010, 36, 1469–1477. [Google Scholar] [CrossRef]
- Labat, D. Recent advances in wavelet analyses: Part 1. A review of concepts. J. Hydrol. 2005, 314, 275–288. [Google Scholar] [CrossRef]
- Lu, Z.G.; Zhang, X.H.; Huo, J.L.; Wang, K.Q.; Xie, X.P. The evolution characteristics of the extreme precipitation in Huaihe river basin during 1960–2008. J. Meteorol. Sci. 2011, 31, 74–80. [Google Scholar]
- Xing, W.Q.; Wang, W.Q.; Wu, Y.Q.; An, G.Y. Change properties of precipitation concentration in Huaihe River Basin. Water Resour. Power 2011, 29, 1–5. [Google Scholar]
- Zhang, D.D.; Yan, D.H.; Wang, Y.C.; Lu, F.; Wu, D. Changes in extreme precipitation in the Huang-Huai-Hai River basin of China during 1960–2010. Theor. Appl. Clim. 2015, 120, 195–209. [Google Scholar] [CrossRef]
- Zhou, L.G.; Dai, S.B. Spatial and temporal variation characteristics of heavy rainfall in the Huaihe River Basin in recent 60 years. South-to-North Water Transf. Water Sci. Technol. 2015, 5, 847–852. (In Chinese) [Google Scholar]
- Yuan, Z.; Yang, Z.Y.; Zheng, X.D.; Yuan, Y. Spatial and temporal variations of precipitation in Huaihe River Basin in resent 50 years. South-to-North Water Transf. Water Sci. Technol. 2012, 10, 98–103. (In Chinese) [Google Scholar]
- Xu, M.; Chang, C.P.; Fu, C.; Qi, Y.; Robock, A.; Robinson, D.; Zhang, H.M. Steady decline of East Asian monsoon winds, 1969–2000: Evidence from direct ground measurements of wind speed. J. Geophys. Res. Atmos. 2006, 111, 906–910. [Google Scholar] [CrossRef]
- Zhou, L.T. Impact of East Asian winter monsoon on precipitation over southeastern China and its dynamical process. Int. J. Clim. 2011, 31, 677–686. [Google Scholar] [CrossRef]
- Wang, H.J.; He, S.P. Weakening relationship between East Asian winter monsoon and ENSO after mid-1970s. Chin. Sci. Bull. 2012, 57, 3535–3540. [Google Scholar] [CrossRef]
- Wang, Y.; Cao, M.K.; Tao, B.; Li, K.R. The characteristics of spatio-temporal patterns in precipitation in China under the background of global climate change. Geogr. Res. 2006, 25, 1031–1040. (In Chinese) [Google Scholar]
- Gu, W.L.; Wang, J.J.; Zhu, Y.Y.; Sun, C.R. Annual distribution of precipitation over the Huaihe River Basin. Resour. Environ. Yangtze Basin 2010, 19, 429–434. (In Chinese) [Google Scholar]
- Wang, K.; Chu, D.; Yang, Z. Flood control and management for the transitional Huaihe River in China. Procedia Eng. 2016, 154, 703–709. [Google Scholar]
- Wang, J.; Liu, G.J.; Lu, L.L.; Zhang, J.M.; Liu, H.Q. Geochemical normalization and assessment of heavy metals (Cu, Pb, Zn, and Ni) in sediments from the Huaihe River, Anhui, China. Catena 2015, 129, 30–38. [Google Scholar] [CrossRef]
- Ye, J.Y.; Huang, Y.; Zhang, C.L.; Li, Z.J. Characteristics of precipitation days and intensity over the Huaihe River basin in flood season during recent 50 years. J. Lake Sci. 2013, 25, 583–592. (In Chinese) [Google Scholar]
- Wang, S.; Tian, H.; Ding, X.J.; Xie, W.S.; Tao, Y. Analysis of extreme precipitation events in rainy season over Huaihe River Basin from 1961 to 2008. Meteorol. Sci. Technol. 2012, 40, 87–91. (In Chinese) [Google Scholar]
- Wang, S.; Xie, W.S.; Tang, W.A.; Tao, Y.; Ding, X. Change characteristics of day and night precipitation in Huaihe River Basin in 1961–2009. Chin. J. Ecol. 2011, 30, 2881–2887. (In Chinese) [Google Scholar]
- Dai, X.G.; Wang, P.; Chou, J.F. Multi-scale characteristics of precipitation in rainy season and summer monsoon decadal decay in North China. Chin. Sci. Bull. 2003, 48, 2483–2487. (In Chinese) [Google Scholar] [CrossRef]
- Wang, J.T.; Liang, S.X.; Yu, H. Analysis of water potential in Huaihe River Basin during 2000 to 2009. China Flood Drought Manag. 2011, 21, 21–24. (In Chinese) [Google Scholar]
- Li, C.; Han, G.R.; Sun, Y. Anomalous features of Northeast cold vortex in late 50 a and its correlation with rainfall in Huaihe river valley. J. Meteorol. Sci. 2015, 35, 216–222. (In Chinese) [Google Scholar] [CrossRef]
- Wang, S.; Tian, H.; Ding, X.J.; Xie, W.S.; Tao, Y. Climate characteristics of precipitation and phenomenon of drought-flood abrupt alternation during main floods season in Huaihe River Basin. Chin. J. Agrometeorol. 2009, 30, 31–34. (In Chinese) [Google Scholar]
- Gao, C.; Jiang, T.; Zhai, J.Q. Analysis and precipitation of climate in the Huaihe River Basin. Chin. J. Agrometeorol. 2012, 33, 8–17. (In Chinese) [Google Scholar] [CrossRef]
- Wang, J.C.; Guo, J.X.; Xu, J.; Li, F. Multi-time scales change characteristics and relationship of meteorological variables in the upper and middle regions of the Huaihe River Basin in recent 55 years. Sci. Geogr. Sin. 2017, 37, 611–619. [Google Scholar] [CrossRef]
- Hu, Y.M.; Ding, Y.H.; Liao, F. A classification of the precipitation patterns during the Yangtze-Huaihe meiyu period for recent 52 years. Acta Meteorol. Sin. 2010, 68, 235–247. (In Chinese) [Google Scholar]
- Liu, F.H.; Chen, X.; Chen, X.W.; Song, S. Relations hip between temperature change in climate boundary and summer precipitation over the Huaihe River basin. Clim. Environ. Res. 2010, 15, 169–178. (In Chinese) [Google Scholar]
- Wang, Y.; Zhang, Q.; Zhang, S.; Chen, X.H. Spatial and temporal characteristics of precipitation in the Huaihe River Basin and its response to ENSO events. Sci. Geogr. Sin. 2016, 36, 128–134. [Google Scholar] [CrossRef]
- Xin, Z.B.; Xie, Z.R. The impact of ENSO events on Huaihe River Basin’s precipitation. Sci. Meteorol. Sin. 2005, 25, 346–354. [Google Scholar]
- Shi, P.; Qiao, X.Y.; Chen, X.; Zhou, M.; Qu, X.X.; Zhang, Z.C. Spatial distribution and temporal trends in daily and monthly precipitation concentration indices in the upper reaches of the Huai River, China. Stoch. Environ. Res. Risk Assess. 2014, 28, 201–212. [Google Scholar] [CrossRef]
- Trenberth, K.E. Changes in precipitation with climate change. Clim. Res. 2011, 47, 123–138. [Google Scholar] [CrossRef]


© 2017 by the authors. Licensee MDPI, Basel, Switzerland. This article is an open access article distributed under the terms and conditions of the Creative Commons Attribution (CC BY) license (http://creativecommons.org/licenses/by/4.0/).
Share and Cite
Yu, Z.-L.; Yan, D.-H.; Ni, G.-H.; Do, P.; Yan, D.-M.; Cai, S.-Y.; Qin, T.-L.; Weng, B.-S.; Yang, M.-J. Variability of Spatially Grid-Distributed Precipitation over the Huaihe River Basin in China. Water 2017, 9, 489. https://doi.org/10.3390/w9070489
Yu Z-L, Yan D-H, Ni G-H, Do P, Yan D-M, Cai S-Y, Qin T-L, Weng B-S, Yang M-J. Variability of Spatially Grid-Distributed Precipitation over the Huaihe River Basin in China. Water. 2017; 9(7):489. https://doi.org/10.3390/w9070489
Chicago/Turabian StyleYu, Zhi-Lei, Deng-Hua Yan, Guang-Heng Ni, Pierre Do, Deng-Ming Yan, Si-Yu Cai, Tian-Ling Qin, Bai-Sha Weng, and Mei-Jian Yang. 2017. "Variability of Spatially Grid-Distributed Precipitation over the Huaihe River Basin in China" Water 9, no. 7: 489. https://doi.org/10.3390/w9070489