Water Use of Fossil Energy Production and Supply in China


1
Institute of Geographical Sciences and Natural Resources Research, Chinese Academy of Sciences, 11A Datun Road, Chaoyang District, Beijing 100101, China
2
College of Resource and Environment, University of Chinese Academy of Sciences, No. 19A Yuquan Road, Beijing 100049, China
*
Authors to whom correspondence should be addressed.
Water 2017, 9(7), 513; https://doi.org/10.3390/w9070513
Submission received: 31 May 2017
/
Revised: 3 July 2017
/
Accepted: 5 July 2017
/
Published: 12 July 2017
Abstract
:Fossil energy and water resources are both important for economic and social development in China, and they are tightly interlinked. Fossil energy production consumes large amounts of water, and it is essential to investigate the water footprint of fossil energy production (WFEP) in China. In addition, fossil energy is supplied to consumers in China by both domestic and foreign producers, and understanding the water footprint of fossil energy supply (WFES) is also highly significant for water and energy development programs in the long-term. The objectives of this paper were to provide an estimation of the blue component of WFEP and WFES in China for the period from 2001 to 2014, and to evaluate the impact on water resources from energy production, the contribution of internal and external WFES, and water-energy related issues of the international energy trade by applying water footprint analysis based on the bottom-up approach. The results indicate that generally, the WFEP and WFES in China both maintained steady growth before 2013, with the WFEP increasing from approximately 3900 million m3/year to 10,400 million m3/year, while the WFES grew from 3900 million m3/year to 11,600 million m3/year. The fossil energy production caps of the 13th Five Year Plan can bring the water consumed for fossil energy production back to a sustainable level. Over the long-term, China’s energy trade plan should also consider the water and energy resources of the countries from which fossil energy is imported.
1. Introduction
Energy and water resources are tightly interlinked, and they are both vital to the economic and social development of human beings [1,2,3]. Almost every stage of the energy supply chain requires water consumption, such as the extraction, processing, and power generation of coal, oil, and gas [4,5,6]. The energy sector, following the agriculture sector, is the second largest water user in the world and is exerting increased pressures on the earth’s freshwater resources in the form of water consumption and pollution [7]. The inconsistency of the increasing global energy demand and water shortage has led a number of researchers to make the energy-water nexus issue a new research focus [8,9,10].
China is facing a water shortage and water pollution due to its industrialization and urbanization. The country is rich in water resources (containing 6% of the world’s water resources), but the per capita water availability (approximately 2100 m3) is less than one quarter of the world average [11]. Due to the rise in energy consumption, the environment and energy-water nexus issues have become increasingly prominent [5,12]. To address this situation, China continues to develop alternative energy strategies and push towards a clean energy plan [13,14], including wind, solar, and biological energy. However, China’s non-fossil fuels, as a share of primary energy consumption, are still relatively low due to energy efficiency and economic problems [15]. The primary energy consumption structure and the energy consumption in China from 2001 to 2020 (the date for the years 2001, 2005, 2010, and 2015 were extracted from China Energy Statistical Yearbook 2015 [16], and date for the year 2020 was extracted from the ‘13th Five Year Plan for energy’ section published by the National Development and Reform Commission [17]) show that fossil energy has been the foundation of the country’s national economy and social development and holds a pivotal status in China. Coal always occupies about 60% of the proportion of primary energy consumption, followed by oil and gas (and the consumption of gas has generally increased). The proportion of fossil fuels (coal, oil, and natural gas) in primary energy consumption has always been large over the past 15 years [16], and their use will still be at a high level in the next few years, even though the fossil fuel consumption control strategy rose to prominence in China’s 13th Five Year Plan (2016–2020) [17]. Thus, a holistic analysis of the water necessary for fossil energy in China is significant for the future development of China’s energy landscape and water resource management.
In recent years, literature on the water-energy nexus has increased, with most of the studies integrating the water and energy system in terms of physical linkages and region-specific water for energy projects being widely carried out in Spain [18], the United Kingdom [19], the United States [20], and the Middle East-North Africa (MENA) region [21]. These studies provided an overarching investigation of water consumption for electrical energy at the national scale or presented a scenario and economic analysis under the influence of future energy and water policy in the typical areas [19,20]. In China, numerous studies have also been performed on the water-energy nexus by many scholars from different fields related to water resources and energy resources. Pan et al. provided China-specific quantitative information on water withdrawal and consumption in the coal supply chain, and they also presented a scenario analysis for water use in China’s coal supply chain in 2020 and 2030 [22]. Zhang and Anadon investigated the life cycle water use in China’s energy sectors and the water-consumption-related environmental impacts using a mixed-unit multiregional input-output (MRIO) model [5]. To present a spatial distribution of the water-energy nexus, Zhang et al. also explored the water withdrawal and consumption for thermal power generation and the associated water stress at the catchment level in China, based on spatial data [23]. Qin et al. used a technology-based, bottom-up method to assess water currently used in China’s energy sector and analyze possible scenarios of water use in 2030 influenced by technology and policy changes. This analysis provided a holistic analysis of both energy and water-for-energy resources from the initial resources to the services, and it answered a key question of whether or not the energy sector would likely comply with the “3 Red Lines”; however, it did not focus on the water-energy nexus issues of the international energy trade [24]. In previous studies, water-energy nexus research in China mainly focused on life cycle assessment of power generation and coal resources, but there appears to be minimal literature on the investigation of the water footprint of fossil energy production (WFEP), which is the water directly and indirectly required for energy production [25], or the water footprint of the fossil energy international trade. Although water used for thermal power generation is an important focus, the water concerns in fossil energy production processes have become more apparent in China. In addition, there is a large amount of water resources also embedded in the world energy trade. The net virtual water import hidden in the fossil energy trade increased over sevenfold in the past 14 years (2001–2014) in China, as reported by Duan and Chen [26]. By the water footprint, some scientific literatures have also been performed to estimate the water requirements of biofuel production from energy crops, providing an indication of the feasibility of using energy crops for biofuels from a water perspective [27]. Compared to the water footprint for energy production from fossil energy, that for biofuel production needs to focus more on green water. Fossil energy is supplied to consumers in China by both domestic and foreign producers. Therefore, understanding the water footprint of fossil energy supply (WFES) is highly relevant for developing well-informed national policies when analyzing the WFEP.
The objective of this paper is to evaluate the blue component of WFEP and WFES using the bottom-up approach for fossil energy in China for the period from 2001 to 2014, and to also discuss external dependency, the impacts on domestic water resources, and policy implications. The definition of fossil energy refers to coal, oil, and natural gas (including liquefied natural gas), and the consumption of water use adopted in this study also obeyed the widely accepted notion of the blue water footprint, without considering the categories of green water and gray water, since the blue water shortfall is compounded compared with the green water, especially for the energy sector [25]. In Section 2, we describe the data acquisition and methodology for the evaluation of the WFEP and WFES. The results from the trend analysis for the blue component of WFEP and WFES during the 14 years are presented in Section 3. A discussion of the results, the water footprint of the international fossil energy trade, and the sustainability assessment for the water use of fossil energy are provided in Section 4. Based on the above content, the study aimed to address three key issues: (1) the changes in the blue component of WFEP and WFES in China’s fossil energy sector during the period from 2001 to 2014; (2) the water-energy nexus of the international fossil energy trade; and (3) the water-related implications of China’s 13th Five Year Plan on the water use sustainability assessment for fossil energy.
2. Methodology
2.1. Data Acquisition
This research estimated the blue component of WFEP and WFES by energy type. Data on imports, exports, and domestic production for these were mainly extracted from the China Energy Statistical Yearbook 2010 and 2015 (the latest dataset can be acquired in China) [16,28], supplemented with data from International Energy Agency (IEA) databases [29]. The data on the water available (the water availability of this study refers to the total water supply, which mainly includes all the available ground and surface water for life, industry, agriculture, and ecological environment annually reported by China Water Resources Bulletin) from 2001 to 2014 in China, used for the evaluation of the water resource utilization for fossil energy, were obtained from the official reports on water resources (China Water Resources Bulletin for the years from 2001 to 2014) [30]. Data on future energy production and the supply of water resources were mainly extracted from the 13th Five Year Plan for energy and water resources [17].
The water requirement content (WRC) was defined by reviewing previous studies on the use of water for fossil energy production [31,32] and designated water consumption in this study. Table 1 shows the WRCs for fossil energy production. The selection of technologies deployed for energy production has an important effect on the water consumption factor (WCF). Therefore, the existing WCFs for fossil energy production have varied substantially in previous studies. In China, approximately 95% of the coal mines are underground mines, which consume much more water than surface coal mining. Over 80% of oil wells are onshore oil fields that consume freshwater, while there is assumed to be less than 20% that are offshore oil fields only requiring saline water. In this context, the estimation of water consumption for the domestic production of coal and oil followed these assumptions. However, water consumption estimates for the external supplies of the two energies used the average WCFs, according to the study by Spang et al. [33], which can reflect the most common production techniques, since limited data can be obtained on specific WCFs in different countries. The adopted WCF for natural gas was a unified value for both domestic production and external supplies, and it was assumed that the gas was produced from gas reservoirs but not in combination with oil [34].
2.2. Estimation of the WFEP and WFES
Water footprint is defined as the water volume per unit of product or the water volume per unit of time, and that of a production process refers to the water volume per unit of time [25]. In this study, the blue component of water footprint is expressed in terms of the blue water consumption for fossil energy production in one year (unit: m3/year). In general, the water footprint can be evaluated by the bottom-up approach [24,31,36,37] or by the top-down approach [38,39,40]. The top-down approach can be categorized further into production and consumption-based approaches for the estimation of water footprint [40], and is usually used for environmental analyses by the economic input–output analysis [36]. The bottom-up approach is usually used to establish the detailed individual production and consumption processes [40]. It estimates the water requirements by multiplying energy production by water intensity, while calculating the WFEP by multiplying the energy production by the WRC of energy production [36,40]. The method is very flexible and simple, and it performs the analysis using the data in different layers, although double-counting is a possibility [25]. Thus, this paper adopted the bottom-up approach for the estimation of the WFEP by multiplying the energy production by the WCF. The WFES was designated the sum of both internal and external water footprints in this paper. The internal WFES was calculated by the WFEP minus the water footprint of export energy, while the external WFES was estimated by multiplying the import energy product by the WCF-based on the bottom-up approach. Equations (1)–(3) describe the estimation of the WFEP for coal, oil, and natural gas, respectively, and equations 4 and 5 define the calculation of the internal and external WFES for fossil energy, respectively.
where stands for the WFEP for coal, stands for coal production, and and represent the WCF for underground coal mining and surface coal mining, respectively. The constant 0.95 represents the proportion of the underground coal mines while 0.05 refers to the proportion of the surface coal mining.
where stands for the WFEP for oil, stands for oil production, and and represent the WCF for onshore and offshore oil exploitation, respectively. The constant 0.80 represents the proportion of the onshore oil fields while 0.20 refers to the proportion of the offshore ones.
where stands for the WFEP for oil, stands for natural gas production, and is the WCF for gas extraction.
where stands for the internal WFES for fossil energy, stands for the external WFES and stands for the water footprint of export energy commodities. These estimates were all based on the assumption that the import commodities were all manufactured abroad, while the export commodities were all produced domestically.
2.3. Analysis of the Impact on Water Resources of Energy Production and the External Dependency Based on Water and Energy
The water pressure index (WPI), as described in Equation (6) (higher values indicate higher water pressures), was introduced in this paper to evaluate the impact on water resources of fossil energy production in China.
where stands for the water footprint of fossil energy and stands for the water available in China.
To provide a better illustration of the impact on water resources from fossil energy production and policy changes, a sustainability evaluation of water use for energy production during the periods of China’s 10th, 11th, 12th, and 13th Five Year Plans (the fossil energy production caps of the 13th Five Year Plan as a future scenario) was undertaken in this study using the following equations, according to the study of Qi et al. [41].
where and stand for the water footprint of fossil energy in the target unit at time i+n and i, respectively, and n is the interval of the calculation period. is the water footprint rate of change, which reflects the change rates of water use for fossil energy production in the calculation period.
where and stand for water available in the target unit at time i+n and i, respectively, and n is the interval of the calculation period. is the water availability rate of change, which reflects the rates of change in water availability in the calculation period.
where stands for the water sustainability index (calculated by the ratio between the absolute value of and the absolute value of ), reflecting the sustainability of water use for fossil energy production. When the and are both greater than zero, the water use for fossil energy production can be considered as sustainable with the of less than one, otherwise to be considered as unsustainable with the value of larger than one.
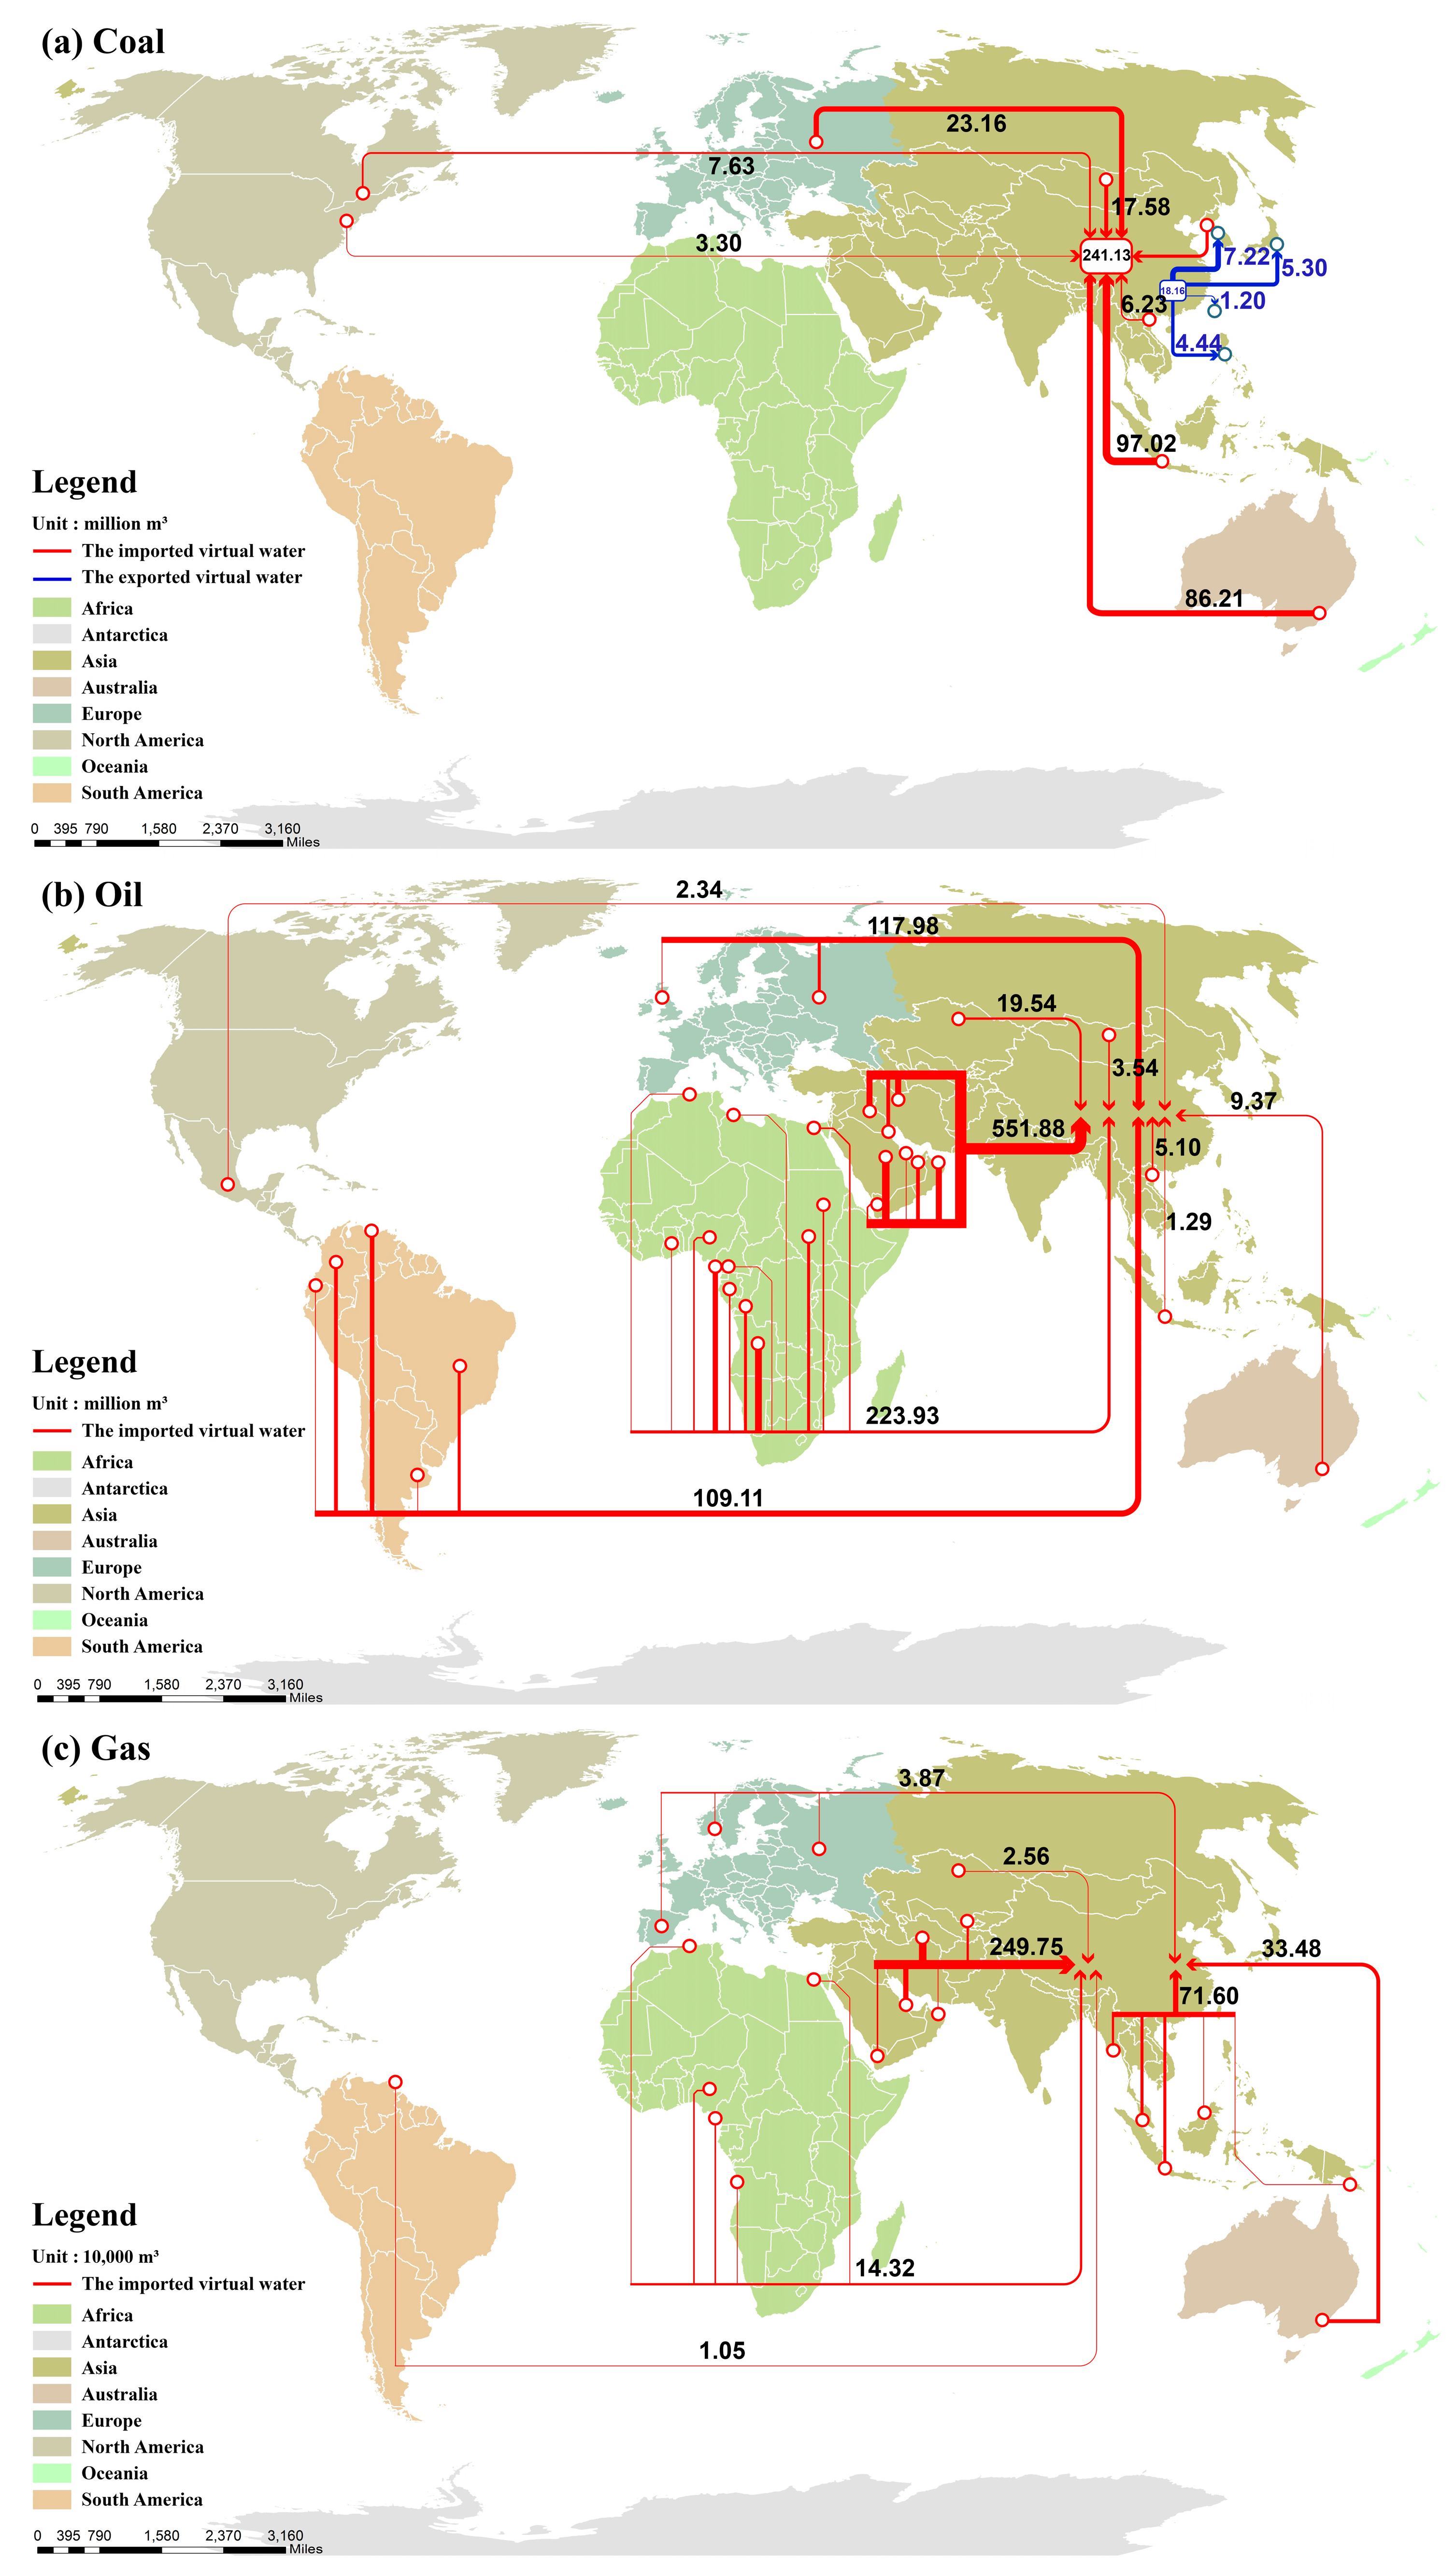
To discuss the external dependency of water resource utilization based on the fossil energy trade, we took the situation of 2014 as an example to present the spatial flow of the net virtual water in the country’s international energy trade since these were the latest data that could be obtained in China. The bottom-up approach (multiplying the amount of production imported/exported by nation by the virtual water content reported by Spang et al. [32]) was adopted in this paper to calculate the virtual water embodied in the fossil energy trade in 2014 in China. The net virtual water is the difference between the imported virtual water and the exported virtual water.
3. Results and Analysis
3.1. Water Footprint of Fossil Energy Production in China
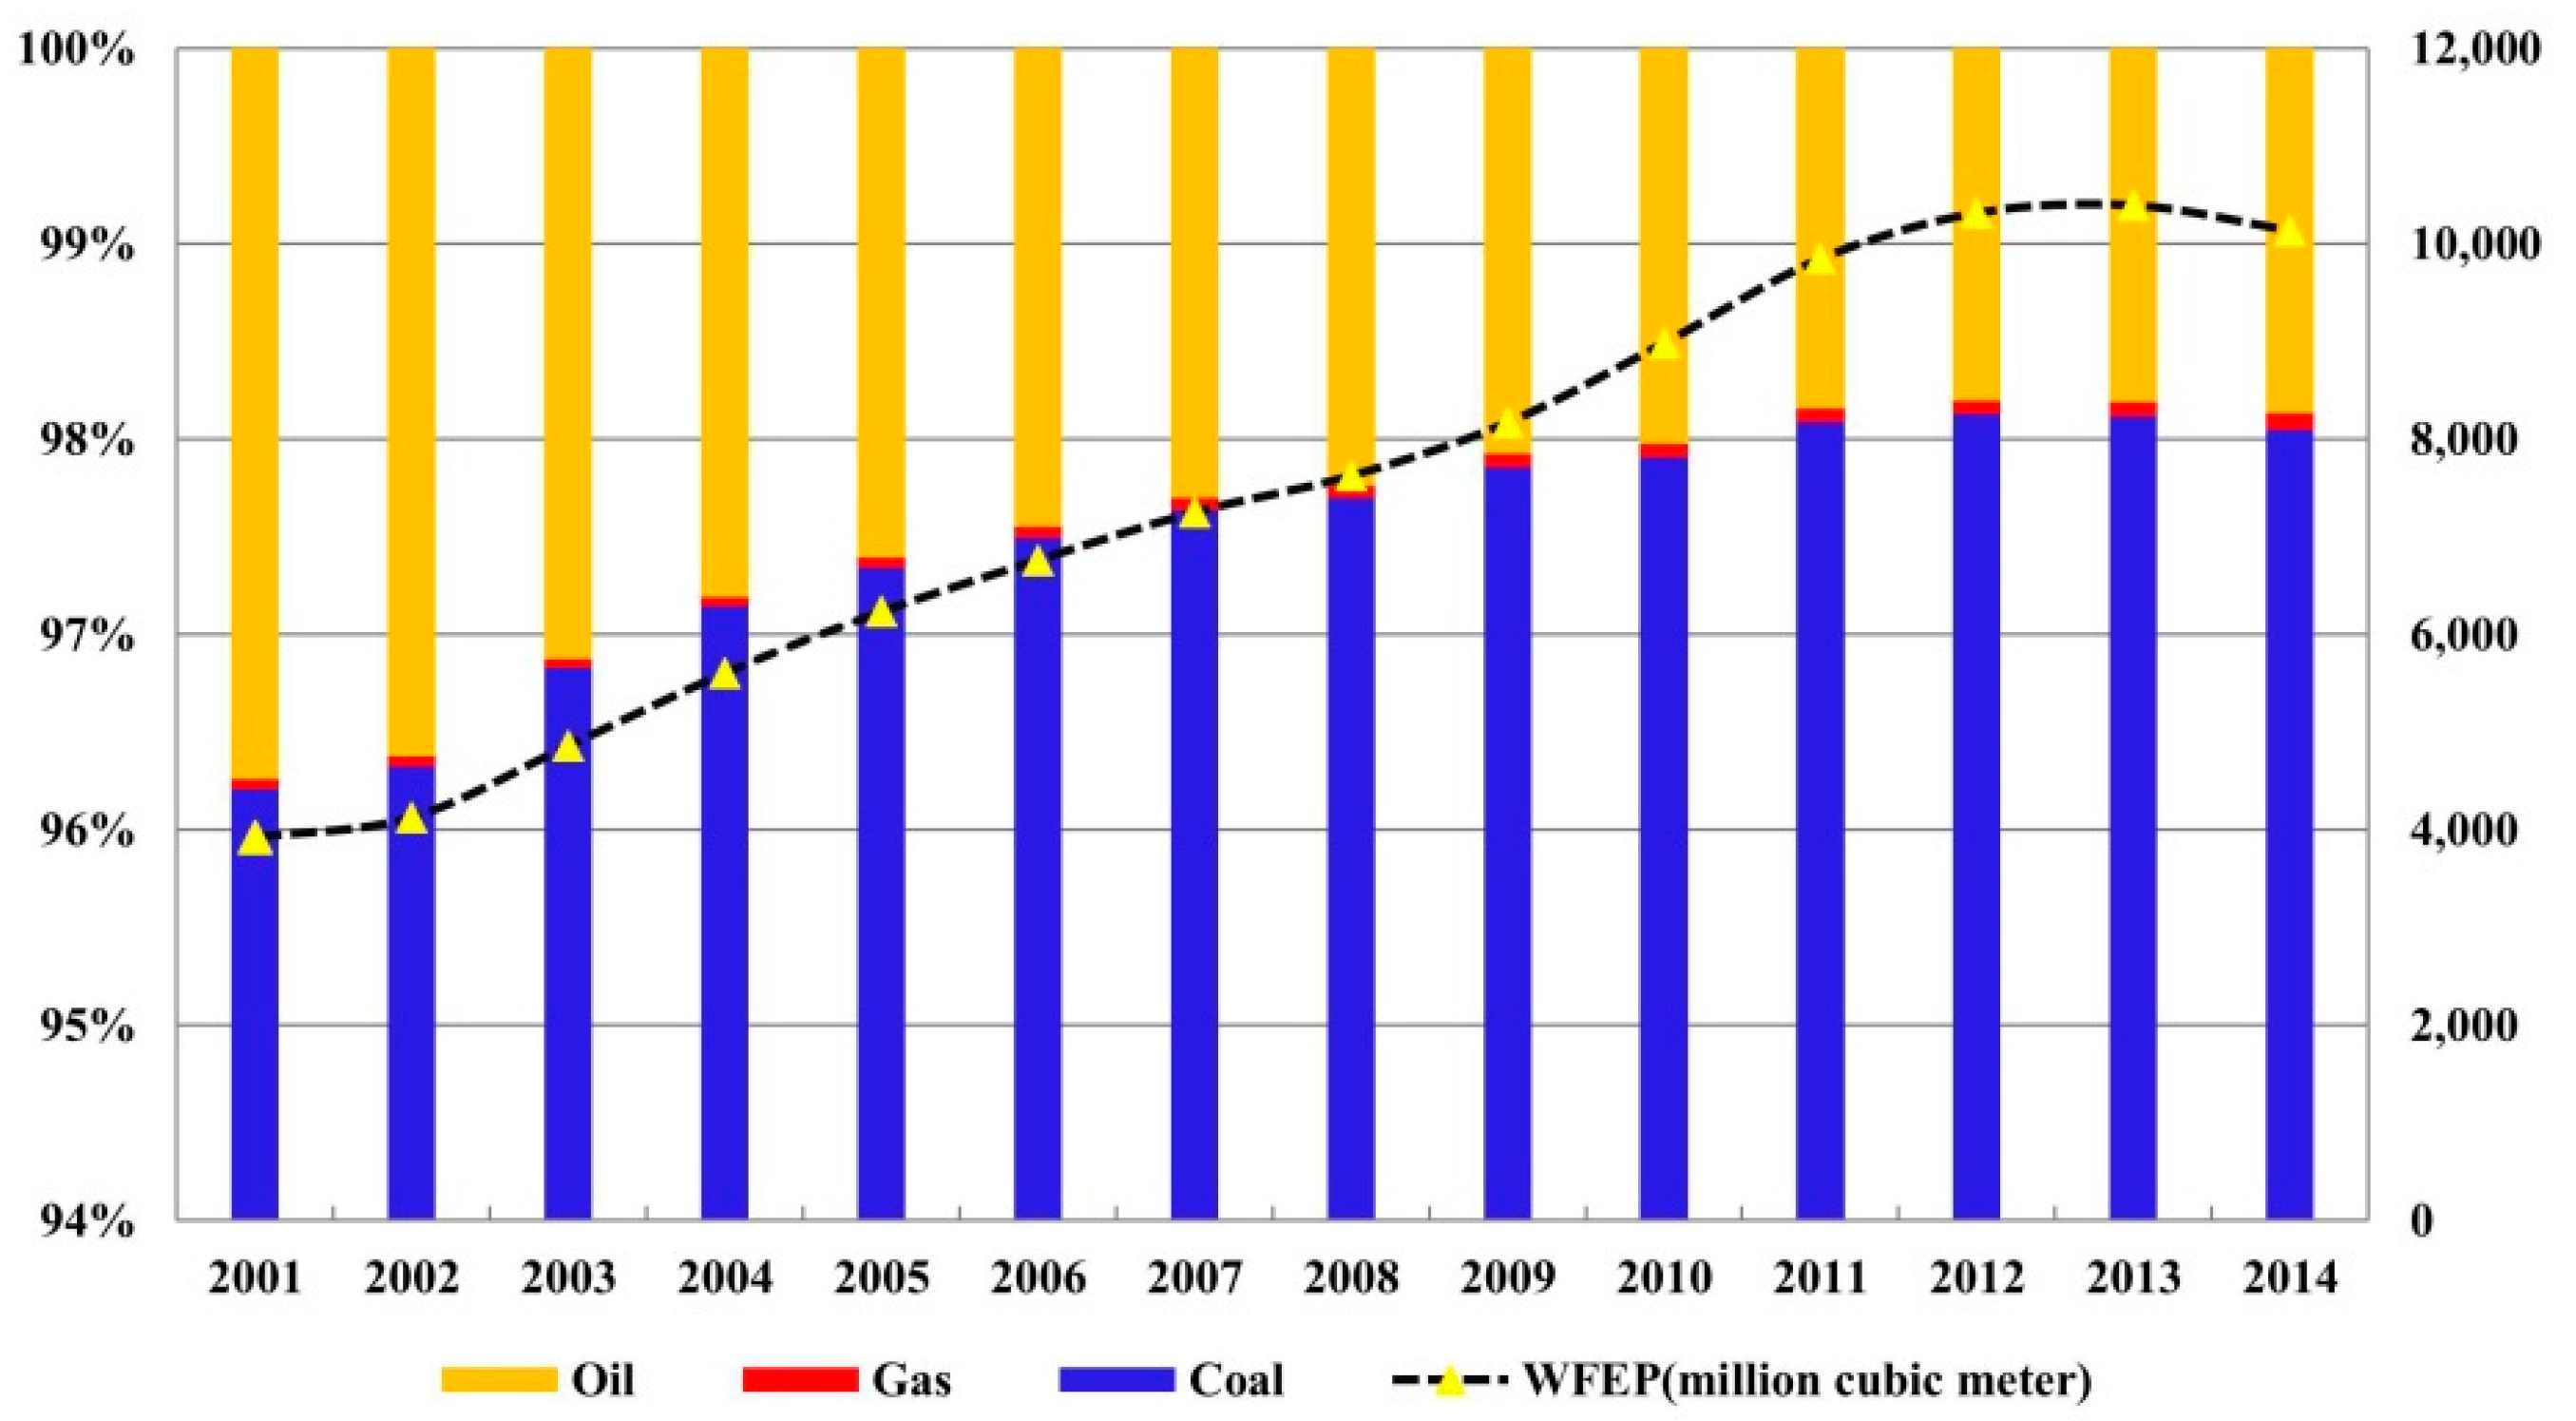
Figure 1 shows the blue component of WFEP (hereafter referred to as the WFEP) in China for the period from 2001 to 2014. The WFEP in 2014 in China was approximately 10,138.9 million m3, approximately 2.6 times that in 2001. Coal’s share of the total WFEP rose steadily and reached a maximum in 2012. By contrast, oil’s share continuously reduced before 2012 and subsequently increased in 2013 and 2014. In general, the trend in the WFEP was upward for all three fuels over the past 14 years, and each showed slight declines in individual years (such as oil in 2009 and coal in 2014). For the WFEP of coal, the reason for the decrease in 2014 was mainly due to production, and it first dropped in 2001 under the new energy restructuring situation. For oil production, it first dropped in 2009 and may have been affected by the financial crisis. Although gas made up only a tiny percentage of the WFEP during the 14 years, that percentage consistently grew, with an average annual growth rate of approximately 26%, and the share may continue to expand.
3.2. Water Footprint of the Fossil Energy Supply in China
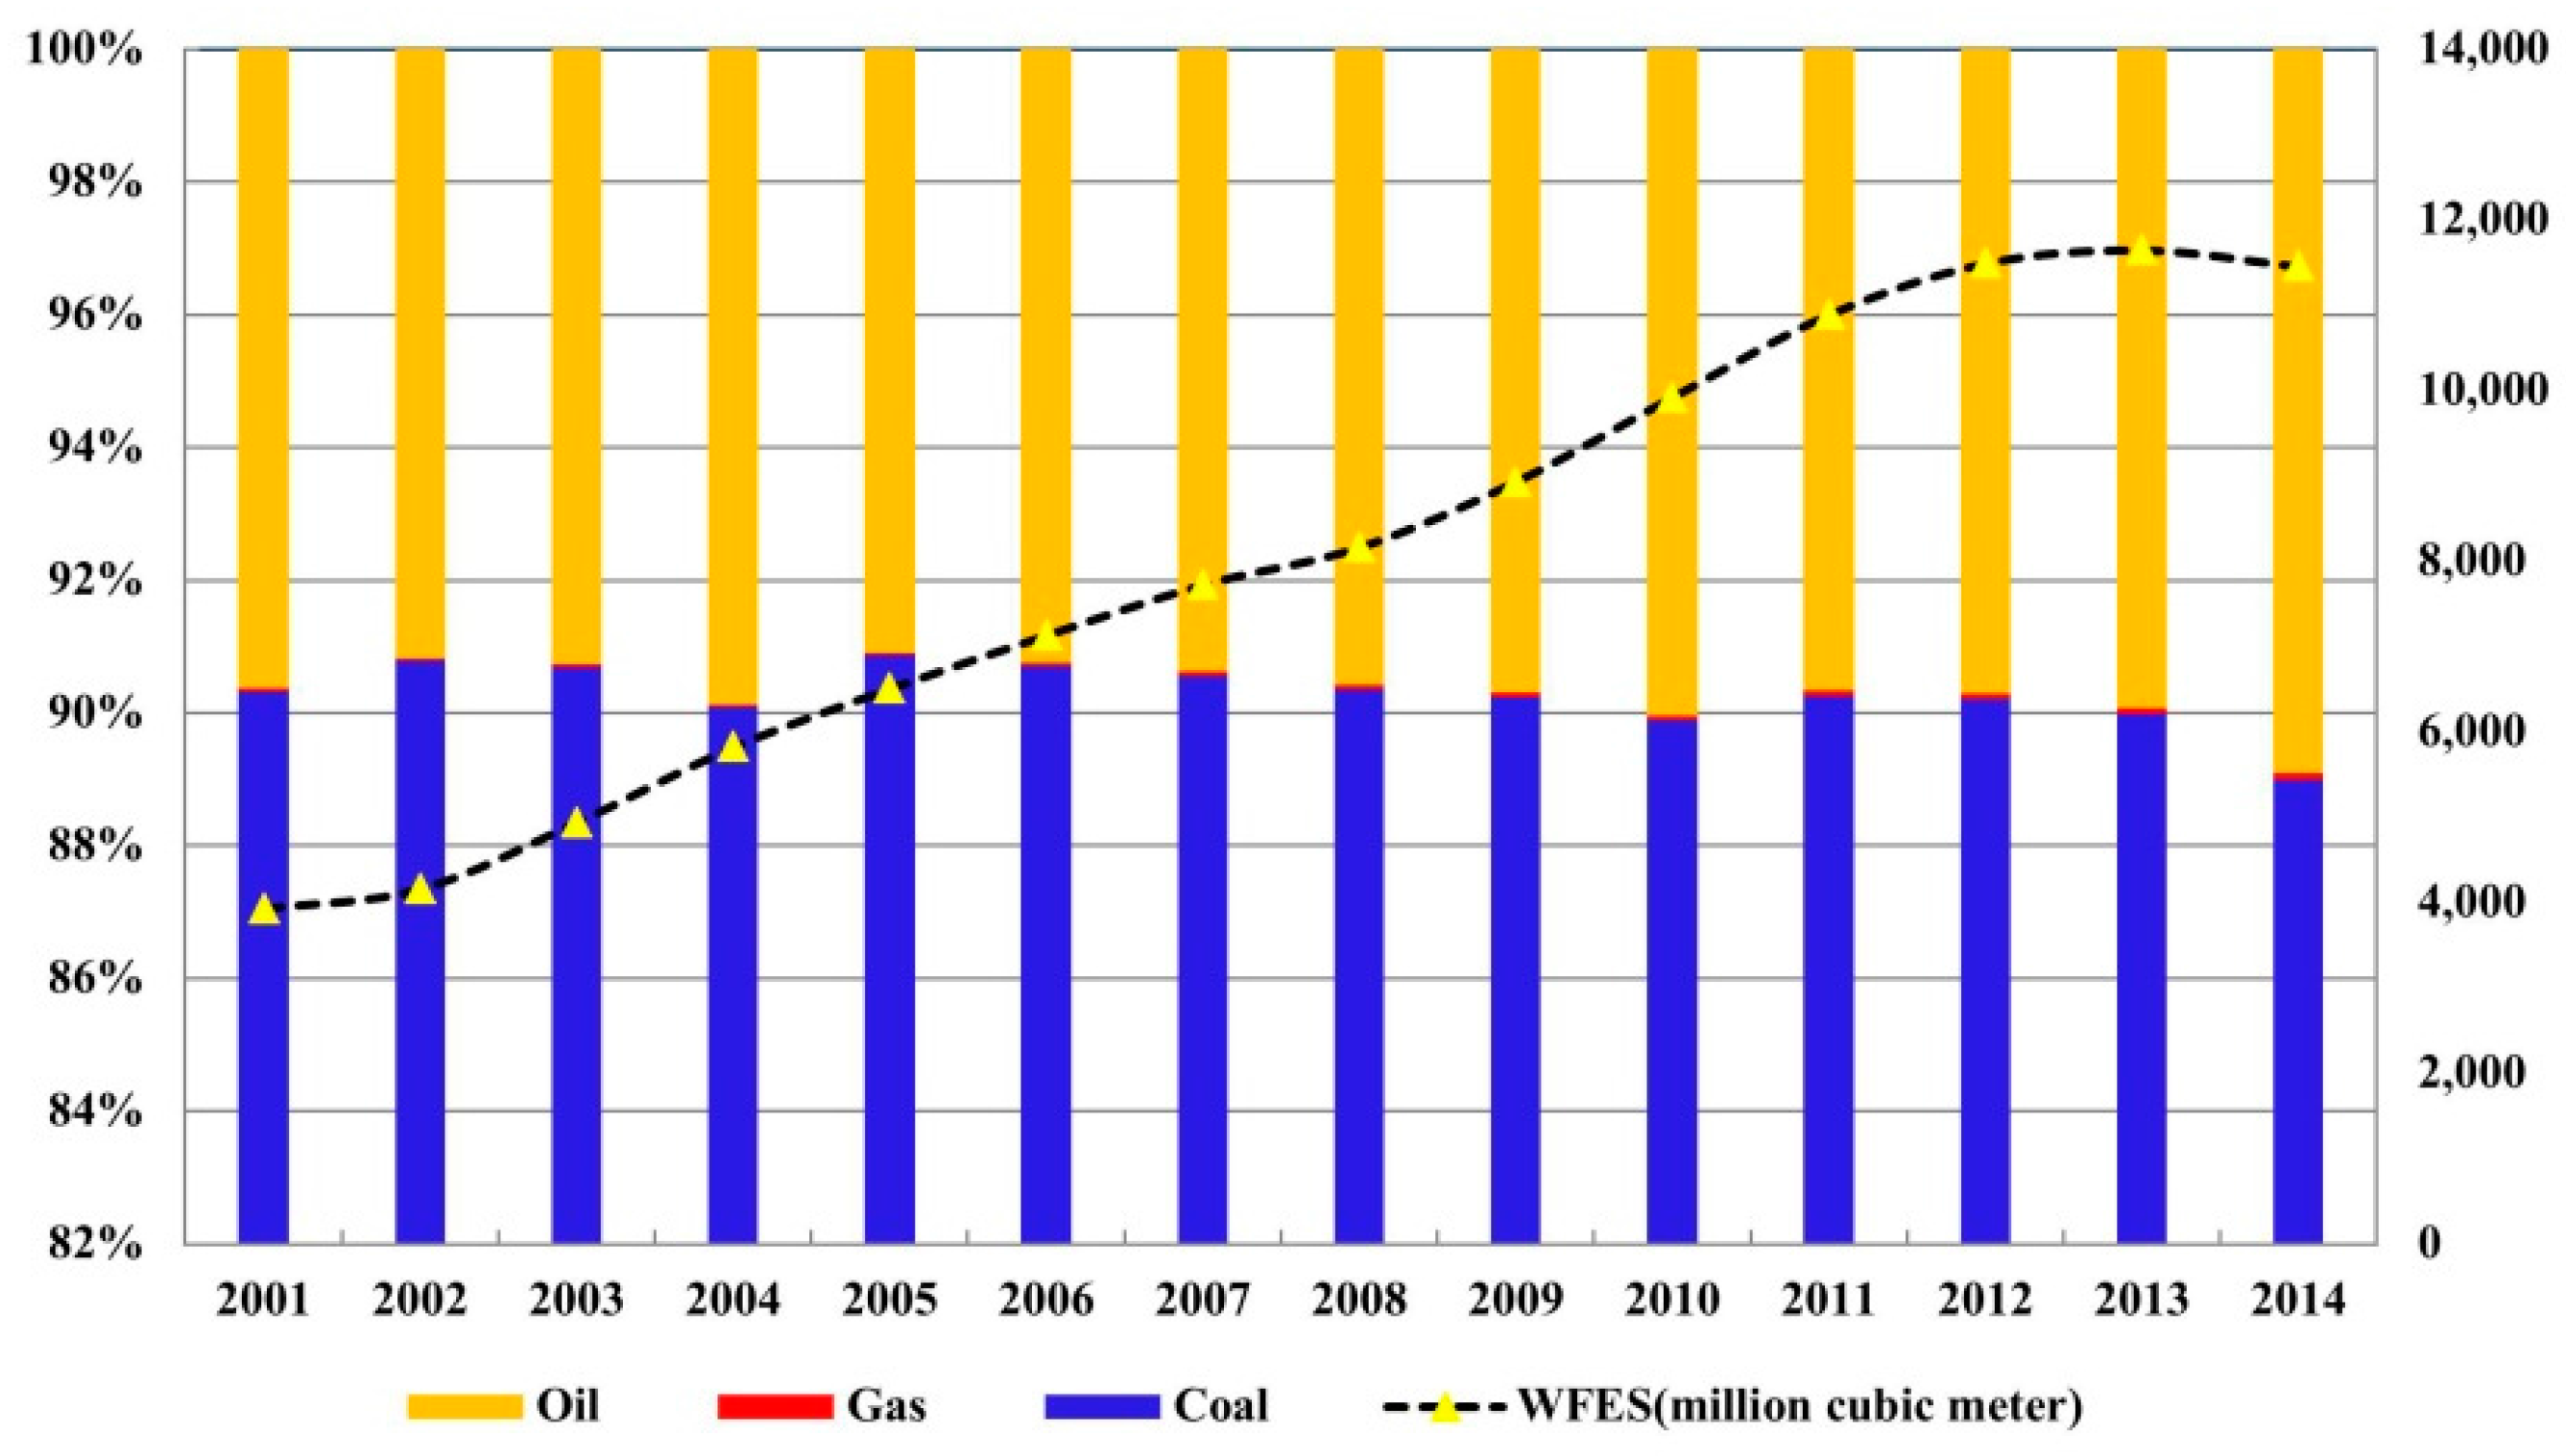
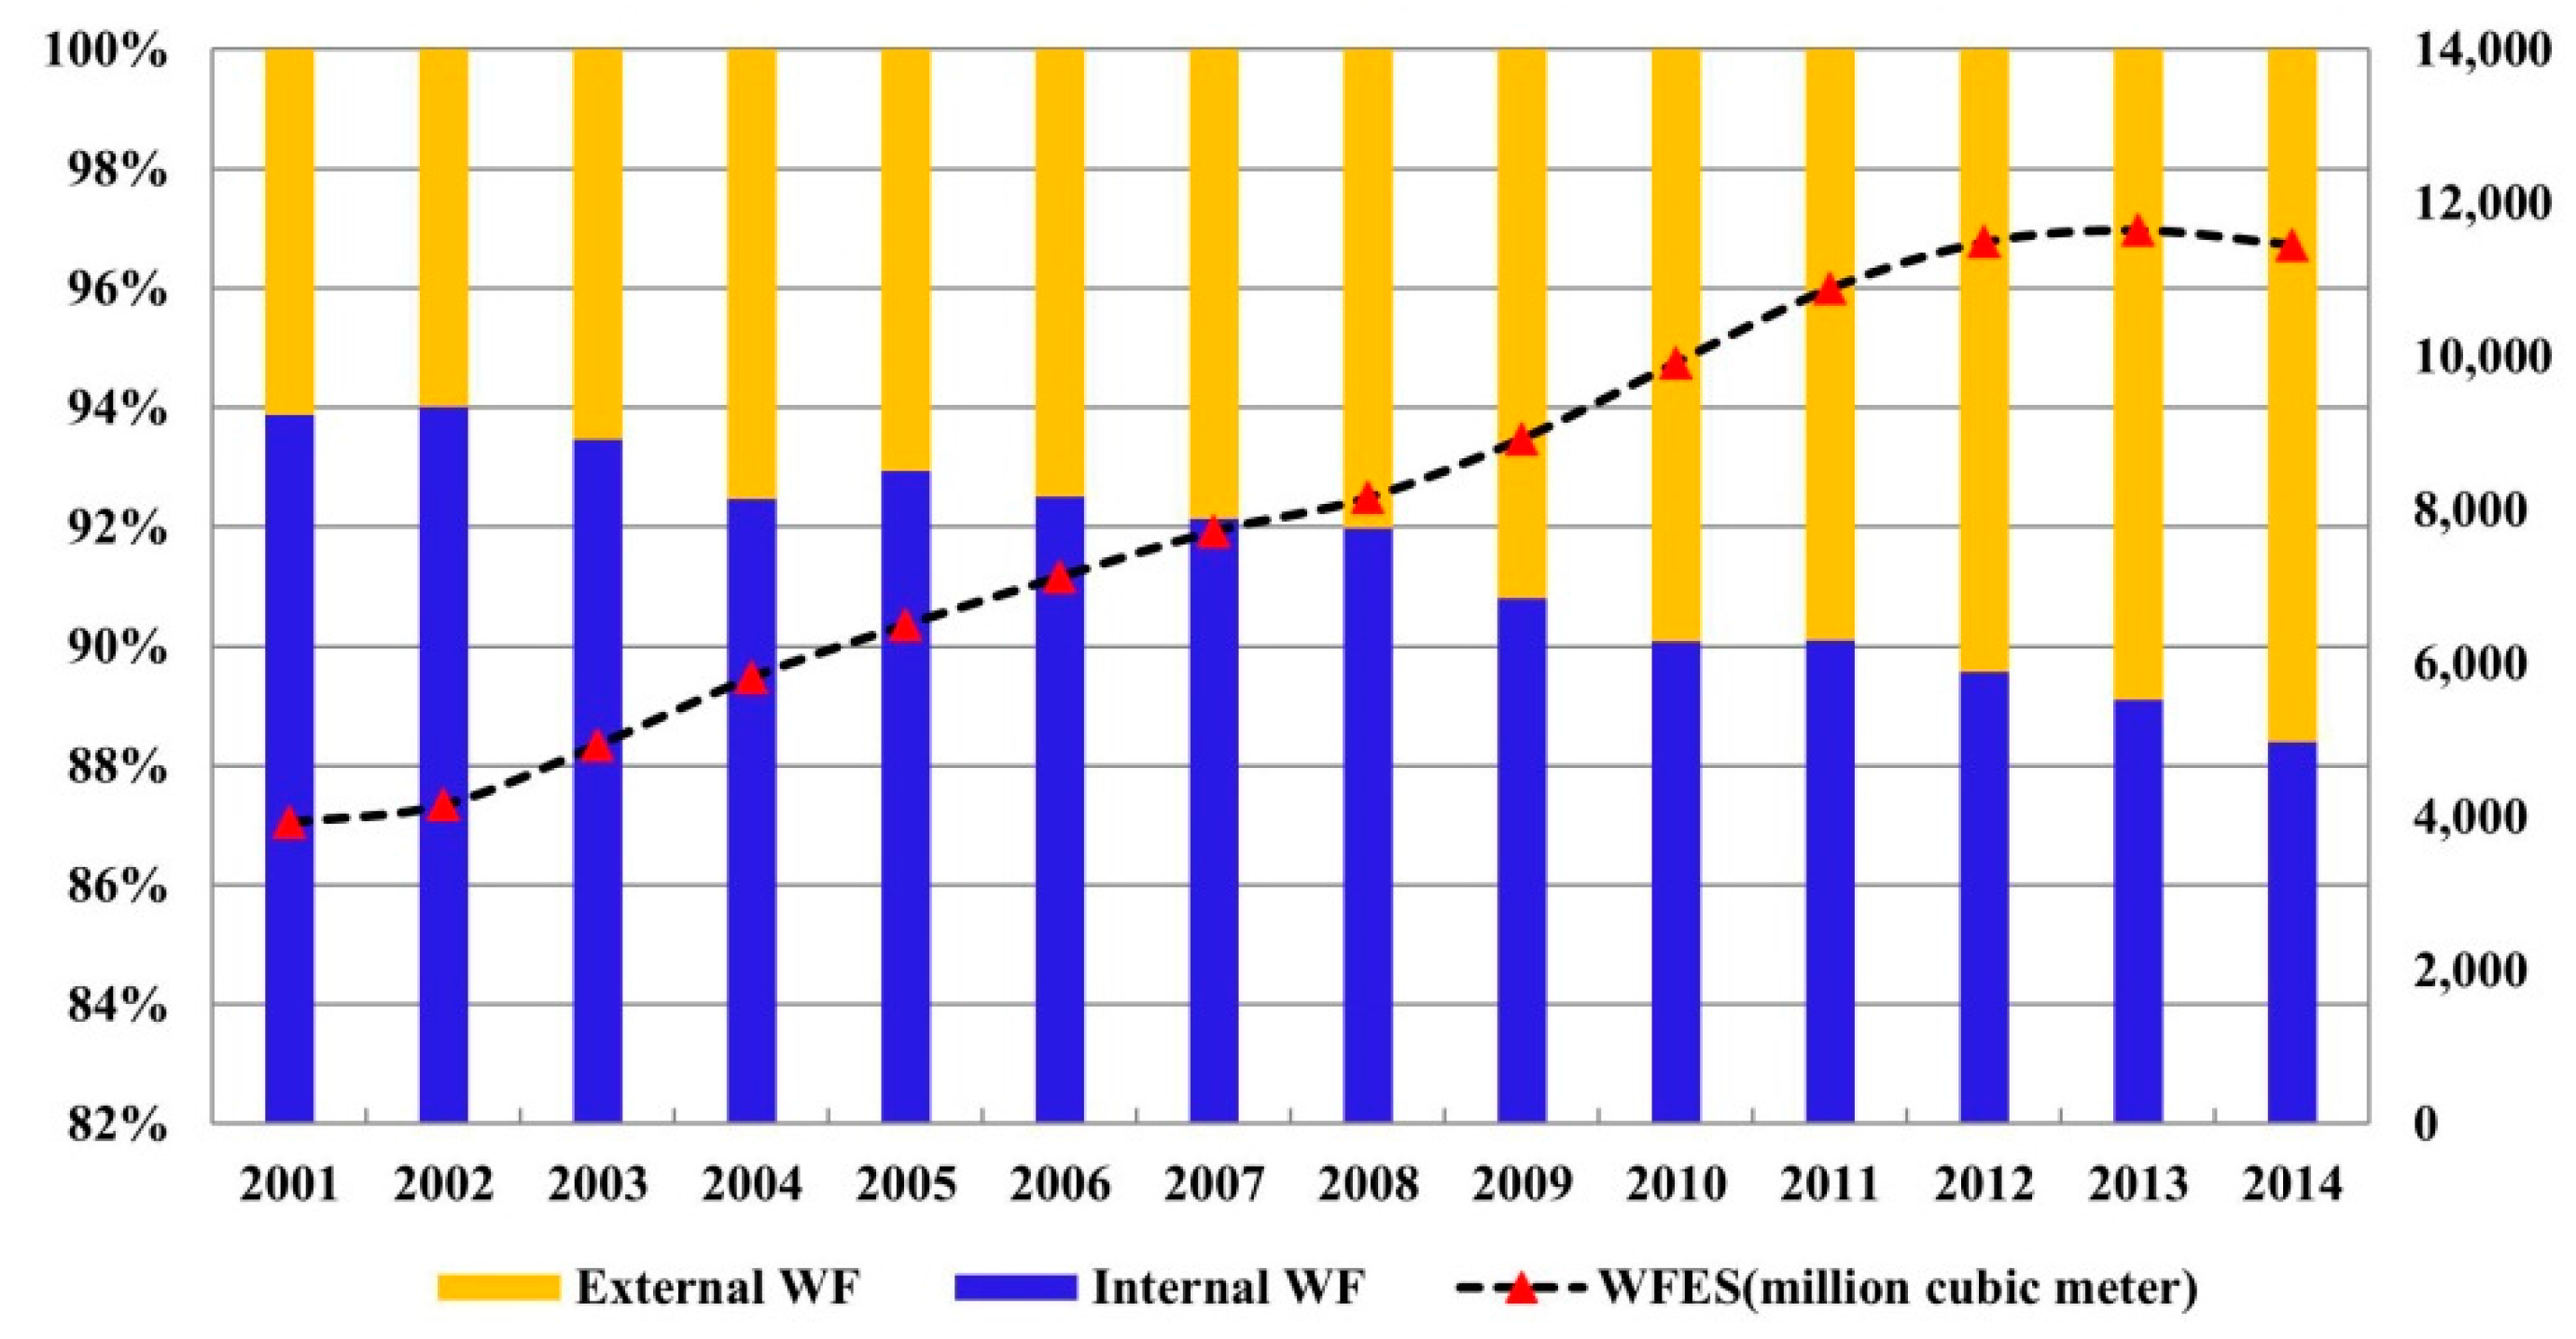
Figure 2 shows the blue component of WFES (hereafter referred to as the WFSP) in China from 2001 to 2014. The overall appearance is similar to that for WFEP. The WFES in 2014 in China was 11,452.8 million m3, approximately 3.0 times that in 2001. The total share of coal was the largest and maintained a relatively high level of water. Compared with the situation for WFEP, the WFES for oil had a larger proportion and experienced a sharp increase during the 14 years. This result was because China imports most of its oil and thus depends on water in foreign countries. Much like the situation for WFEP, the WFES for natural gas progressively increased from 2001 to 2014, the water consumption mainly depended on domestic resources before 2005, and then it gradually switched to foreign suppliers. Figure 3 shows the contribution to the water footprint of traded energy and the internal and external WFESs. In general, the internal WFES accounted for a large share of that in China, basically maintaining a level between 88% and 94%, which illustrates that the water for fossil energy in China was mainly supplied by domestic resources, except for oil. For a long time, the coal supplies in China have consumed large amounts of water, and it is essential, at least in the short-term, for the country to relieve water pressure by properly increasing coal imports and adjusting the energy structure. In contrast, the external WFES drastically changed during the period, and this was especially apparent in recent years. This change was due to the large proportion of oil resources imported from foreign countries over the 14 years and the expansion of natural gas imports since 2005.
3.3. Impact on Water Resources of Energy Production in China
Figure 4 shows that the WPI continued to increase until 2012 and then it slightly decreased in 2013 and 2014. This result indicates that the increase in the consumption of fossil energy resources in China escalated the water pressure in China, although this was somewhat mitigated in the last two years. Thus, the energy-water nexus in China should not only focus on water for energy generation, but it should also pay more attention to the extraction of the energy source for power generation. Fossil energy production has given rise to issues related to water security in China.
Based on the above indicators ( and mentioned in Section 2.3), we explored the sustainability of water use for energy production during the four “Five Year Plans” (Table 2) using the evaluation method of Qi et al., which has also been used to explore the water use for energy production in Dalian, China [41]. The increase in the consumption of fossil energy resources in the past three Five Year Plans contributed to the unsustainability of water consumption for fossil energy production in China, and caused a deterioration of the environment. To achieve the fossil energy production caps of the 13th Five Year Plan and constrain fossil fuel consumption, it is essential to bring the water consumed by fossil fuel consumption back to a reasonable level.
4. Discussion
4.1. External Dependency Based on Water and Energy
Based on the results of the blue water footprint of fossil energy supply, the external WFES significantly increased over recent years, especially for oil, as its external WFES was much greater than the internal WFES, and it will continue to increase with the increase in oil in the near future [42]. That will introduce an interesting issue related to energy security in China. Although it is not obvious, there still exists the threat that the primary energy suppliers to China might experience water crises. Figure 5a–c shows the spatial flow of net virtual water hidden in the fossil energy trade in 2014 in China. In 2014, there were 9 countries that exported virtual water of more than 1 million m3 to China by the international coal trade. The top five countries were Indonesia, Australia, Russia, Mongolia, and Korea, and the total exported was approximately 238.1 million m3. From the oil trade, China gained approximately 1069.8 million m3 of virtual water from more than 30 countries in 2014. They were mainly distributed in the Middle East, Africa, and South America, the top five countries were Saudi Arabia, Angola, Russia, Oman, and Iraq, and the amount of water from these countries accounted for approximately 60% of the total. Unlike the overall map of oil, the sources of virtual water hidden in the gas trade were mainly from the Middle East, Central Africa, Southeast Asia, and Australia. The total virtual water was approximately 3.8 million m3. The top five countries were Turkmenistan, Qatar, Australia, Malaysia, and Indonesia, and they accounted for approximately 80% of the total. Throughout the spatial flow of the net virtual water hidden in fossil energy, China was highly dependent on foreign demand for fossil energy and imported large amounts of virtual water by the energy trade, such as for oil. China imported 6.6 million barrels of oil per day in 2015, which accounted for about 25% of the overall total (and that might increase further to 62% in 2035). Importing fossil fuels from water-abundant regions instead of water-scarce regions could improve the water-scarce situation in China. However, based on the analysis of the estimation of net virtual water in the international energy trade in 2014, more than 60% of virtual water imported to China has come from United Arab Emirates and Saudi Arabia, where the situation is much worse than that of China [43]. The fact is, it has hardly changed in the short term because there are plentiful energy sources in those regions. The Belt One and Road (B&R), proposed by China in 2013, is a development strategy and framework that aims to enhance the economic links among countries in Asia and Europe [44]. Given this situation, China should pay more attention to regional water security problems. It is suggested that these could be solved through the adjustment of energy flows, the strengthening of fossil energy importation from water-abundant regions (such as the Mekong regions), the adjustment of trade structure, and the exportation of agricultural products to important energy trading partners of China (which are also water-scarce regions), in order to achieve harmonious development of water resources. It is firmly considered that putting forward the scientific virtual water strategy might mitigate the regional (especially for the essential energy trade countries where the water shortages areas exist) water scarcity by the international trade of China’s B&R policy and also meet China’s energy security needs.
4.2. Limitation of the Study
This paper advanced the study of the blue water footprint in fossil energy production and supply from 2001 to 2014 in China. It is expected to serve as a valuable reference for policy makers and academic researchers. However, some uncertainties, which could affect the results, were ignored here. The WCFs used in this research were selected by reviewing previous studies, which may have introduced bias when calculating the WFEP and WFES. Generally, the WCFs for energy production differed across countries for various technological and production condition reasons, but data on the accurate water consumption for fossil energy production could not be acquired for China. The WCFs used for the estimation of the WFEP and WFES were consolidated according to the previous literature, and these estimations had been well applied in studies by Qin et al. [24] and Spang et al. [33]. Therefore, it was thought that they were the “optimal” values to be used in this study. In addition, using the average values to estimate WRC also involves a limitation, since it water use efficiency (natural resource use efficiency can provide quantitative information, but it needs to include multiple complex considerations [45]) is ignored in this study. Moreover, the grey water footprint, which is not included in this study, is considered as a valuable indicator to distinguish between different sorts of pollution and to assess the sustainability of water pollution produce by humans [46]. However, detailed data on the water quality standard and natural background concentration for the most critical water body is generally lacking in China at the current time. We therefore obeyed a widely accepted notion that mainly focuses on the blue water footprint and took the grey water footprint as a limitation to this study. Hence, given the complexities of the problem, systematic studies are required if higher-quality data are to be obtained in the future.
5. Conclusions
The purpose of this paper was to estimate the WFEP and WFES (the blue component of water footprint in this study) from 2001 to 2014 in China, as well as to evaluate the impact on water resources of energy production and the contribution of internal and external WFES and water-energy related issues of the international energy trade by applying the water footprint analysis method (the bottom-up method). In general, the WFEP in China maintained steady growth, from approximately 3900 million m3/year to 10,400 million m3/year during the period 2001–2013, and slightly declined in 2014. Much like the overall picture for WFEP, the WFES also continued to grow before 2013 and reached a maximum of approximately 11,600 million m3/year, which was approximately three times that of the maximum in 2001. The water-energy nexus for fossil energy production should be given more attention, and it is quite important to obey the fossil energy production caps of the 13th Five Year Plan to bring the water consumed by production back to a sustainable level. Too much reliance on fossil energy imports from water shortage regions might cause energy security issues in China. We suggested long-term policies, such as the adjustment of energy flows and the trade structure to achieve harmonious development of regional water resources, thus seeking to ensure the country’s energy security needs by the implementation of B&R.
Supplementary Materials
The following are available online at www.mdpi.com/2073-4441/9/7/513/s1, Figure S1: The virtual water embedded in the coal trade in 2014 in China (million m3): (a) Import and (b) Export. Countries with virtual water of more than 1 million m3 are listed in the figure, Figure S2: The virtual water embedded in the import oil trade in 2014 in China (million m3). Countries with virtual water of more than 1 million m3 are listed in the figure. Note: The virtual water embedded in the export oil trade in 2014 was less than 1 million m3, so these values are not listed here, Figure S3: The virtual water embedded in the import gas trade in 2014 in China (million m3). Countries with virtual water of more than 10,000 m3 are listed in the figure. Note: Gas was mainly exported to Hong Kong and Macao in 2014, so these values are not listed here, Table S1: The WFEP for fossil energy in China from 2001 to 2014 (million m3/year).
Acknowledgments
This work was supported and funded by the National Natural Science Foundation of China (Grant No. 41571509) and the Ministry of Science and Technology of China (2016YFC0503507).
Author Contributions
G.L. and D.J. contributed to all aspects of this work; R.D., and J.F. conducted data analysis and wrote the main manuscript text; M.H. made some useful comments and gave some useful suggestions to this work. All authors reviewed the manuscript.
Conflicts of Interest
The authors declare no conflicts of interest.
References
- Healy, R.W.; Alley, W.M.; Engle, M.A.; McMahon, P.B.; Bales, J.D. The Water-Energy Nexus: An Earth Science Perspective; U.S. Geological Survey: Reston, VA, USA, 2015.
- Kostecki, R.; Rao, P.; Gadgil, A. Water-Energy Nexus: The Role of Technology and Engineering. Annu. Rev. Environ. Resour. 2017, 42. [Google Scholar] [CrossRef]
- Hamiche, A.M.; Stambouli, A.B.; Flazi, S. A review of the water-energy nexus. Renew. Sustain. Energy Rev. 2016, 65, 319–331. [Google Scholar] [CrossRef]
- Huang, W.; Ma, D.; Chen, W. Connecting water and energy: Assessing the impacts of carbon and water constraints on China’s power sector. Appl. Energy 2017, 185, 1497–1505. [Google Scholar] [CrossRef]
- Zhang, C.; Anadon, L.D. Life Cycle Water Use of Energy Production and Its Environmental Impacts in China. Environ. Sci. Technol. 2013, 47, 14459–14467. [Google Scholar] [CrossRef] [PubMed]
- Tan, C.; Zhi, Q. The Energy-water Nexus: A literature Review of the Dependence of Energy on Water. Energy Procedia 2016, 88, 277–284. [Google Scholar] [CrossRef]
- Hightower, M.; Pierce, S.A. The energy challenge. Nature 2008, 452, 285–286. [Google Scholar] [CrossRef] [PubMed]
- Zhou, Y.; Li, H.; Wang, K.; Bi, J. China’s energy-water nexus: Spillover effects of energy and water policy. Glob. Environ. Chang. 2016, 40, 92–100. [Google Scholar] [CrossRef]
- Keairns, D.; Darton, R.; Irabien, A. The energy-water-food nexus. Annu. Rev. Chem. Biomol. Eng. 2016, 7, 239–262. [Google Scholar] [CrossRef] [PubMed]
- Gulati, M. The energy and water nexus: The case for an integrated approach for the green economy in South Africa. In Earth, Wind and Fire; Research and Policy Development to Advance a Green Economy in South Africa: Johannesburg, South Africa, 2016; pp. 141–160. [Google Scholar]
- Global Water Partnership (GWP). China’s Water Resources Management Challenge: The ‘Three Red Lines’; Elanders: Stockholm, Sweden, 2015. [Google Scholar]
- Guan, D.; Hubacek, K. Assessment of regional trade and virtual water flows in China. Ecol. Econ. 2007, 61, 159–170. [Google Scholar] [CrossRef]
- Wang, L.; Patel, P.L.; Yu, S.; Liu, B.; McLeod, J.; Clarke, L.E.; Chen, W. Win–Win strategies to promote air pollutant control policies and non-fossil energy target regulation in China. Appl. Energy 2016, 163, 244–253. [Google Scholar] [CrossRef]
- Lewis, J.I.; Fridley, D.G.; Price, L.K.; Lu, H.; Romankiewicz, J.P. Understanding China’s non–fossil energy targets. Science 2015, 350, 1034–1036. [Google Scholar] [CrossRef] [PubMed]
- Ratnavathi, C.V.; Chakravarthy, S.K.; Komala, V.V.; Chavan, U.D.; Patil, J.V. Sweet Sorghum as Feedstock for Biofuel Production: A Review. Sugar Tech. 2011, 13, 399–407. [Google Scholar] [CrossRef]
- National Bureau of Statistics of China (NBS). China Energy Statistical Yearbook 2015; China Statistics Press: Beijing, China, 2015. [Google Scholar]
- Brødsgaard, K.E. China’s 13th Five-Year Plan: A Draft Proposal. Cph. J. Asian Stud. 2016, 33, 97–105. [Google Scholar]
- Willaarts, B.; Lechon, Y.; de la Rúa, C.; Garrido, A. Adopting a Water-Food-Energy nexus approach to explore the synergies and trade-offs of food-water policies in Spain. EGU Gen. Assem. Conf. Abstr. 2016, 18, 9754. [Google Scholar]
- Byers, E.A.; Hall, J.W.; Amezaga, J.M. Electricity generation and cooling water use: UK pathways to 2050. Glob. Environ. Chang. 2014, 25, 16–30. [Google Scholar] [CrossRef]
- DeNooyer, T.A.; Peschel, J.M.; Zhang, Z.; Stillwell, A.S. Integrating water resources and power generation: The energy–water nexus in Illinois. Appl. Energy 2016, 162, 363–371. [Google Scholar] [CrossRef]
- Siddiqi, A.; Anadon, L.D. The water–energy nexus in Middle East and North Africa. Energy Policy 2011, 39, 4529–4540. [Google Scholar] [CrossRef]
- Pan, L.; Liu, P.; Ma, L.; Li, Z. A supply chain based assessment of water issues in the coal industry in China. Energy Policy 2012, 48, 93–102. [Google Scholar] [CrossRef]
- Zhang, C.; Zhong, L.; Fu, X.; Wang, J.; Wu, Z. Revealing Water Stress by the Thermal Power Industry in China Based on a High Spatial Resolution Water Withdrawal and Consumption Inventory. Environ. Sci. Technol. 2016, 50, 1642–1652. [Google Scholar] [CrossRef] [PubMed]
- Qin, Y.; Curmi, E.; Kopec, G.M.; Allwood, J.M.; Richards, K.S. China’s energy-water nexus—Assessment of the energy sector’s compliance with the “3 Red Lines” industrial water policy. Energy Policy 2015, 82, 131–143. [Google Scholar] [CrossRef]
- Hoekstra, A.Y.; Chapagain, A.K.; Aldaya, M.M.; Mekonnen, M.M. The Water Footprint Assessment Manual. Setting the Global Standard. Soc. Environ. Account. J. 2011, 31, 181–182. [Google Scholar]
- Duan, C.; Chen, B. Virtual Water Embodied in International Energy Trade of China. Energy Procedia 2016, 88, 94–99. [Google Scholar] [CrossRef]
- Miglietta, P.P.; De Leo, F.; Pizzi, S. The Water Footprint of Energy Crops for the Support of Italian Biodisel Production. In Proceedings of the XXVII Congresso Nazionale di Scienze Merceologiche-Qualità & Innovazione per una Economia Circolare ed un Futuro Sostenibile, Viterbo, Italy, 2–4 March 2016. [Google Scholar]
- NBS. China Energy Statistical Yearbook 2010; China Statistics Press: Beijing, China, 2010. [Google Scholar]
- IEA. International Energy Agency (IEA) Databases. Available online: http://www.iea.org/statistics/ (accessed on 10 January 2017).
- Ministry of Water Resources (MWR). Official Reports on Water Resources 2001–2015; Ministry of Water Resources: Beijing, China, 2015.
- Mulder, K.; Hagens, N.; Fisher, B. Burning water: A comparative analysis of the energy return on water invested. Ambio J. Hum. Environ. 2010, 39, 30–39. [Google Scholar] [CrossRef]
- Gheewala, S.H.; Silalertruksa, T.; Nilsalab, P.; Mungkung, R.; Perret, S.R.; Chaiyawannakarn, N. Implications of the biofuels policy mandate in Thailand on water: The case of bioethanol. Bioresour. Technol. 2013, 150, 457–465. [Google Scholar] [CrossRef] [PubMed]
- Spang, E.S.; Moomaw, W.R.; Gallagher, K.S.; Kirshen, P.H.; Marks, D.H. The water consumption of energy production: An international comparison. Environ. Res. Lett. 2014, 9, 105002. [Google Scholar] [CrossRef]
- Williams, E.; Simmons, J.E. Water in the Energy Industry: An Introduction; BP International Ltd.: Sunbury-on-Thames, UK, 2013. [Google Scholar]
- Tsinghua-BP Clean Energy Centre. Water Issues in the Coal Supply Chain in China; ESC Project Report; Tsinghua University: Beijing, China, 2011. [Google Scholar]
- Okadera, T.; Chontanawat, J.; Gheewala, S.H. Water footprint for energy production and supply in Thailand. Energy 2014, 77, 49–56. [Google Scholar] [CrossRef]
- Miller, R.E.; Blair, P.D. Input-Output Analysis: Foundations and Extensions; Cambridge University Press: Cambridge, UK, 2009. [Google Scholar]
- Okadera, T.; Watanabe, M.; Xu, K. Analysis of Water Demand and Water Pollutant Discharge Using A Regional Input–Output Table: An Application to the City of Chongqing, Upstream of the Three Gorges Dam in China. Ecol. Econ. 2006, 58, 221–237. [Google Scholar] [CrossRef]
- Zhang, Z.; Shi, M.; Yang, H.; Chapagain, A. An Input–output Analysis of Trends in Virtual Water Trade and the Impact on Water Resources and Uses in China. Econ. Syst. Res. 2011, 23, 431–446. [Google Scholar] [CrossRef]
- Okadera, T.; Geng, Y.; Fujita, T.; Dong, H.; Liu, Z.; Yoshida, N.; Kanazawa, T. Evaluating the Water Footprint of the Energy Supply of Liaoning Province, China: A Regional Input–output Analysis Approach. Energy Policy 2015, 78, 148–157. [Google Scholar] [CrossRef]
- Rui, Q.I.; Geng, Y.; Zhu, Q.H. Evaluation of Regional Water Resources Utilization Based on Water Footprint Method (in Chinese with English abstract). J. Nat. Resour. 2011, 26, 486–495. [Google Scholar]
- Tian, C. China’s 2015 oil import and exports International Petroleum Economics (in Chinese with English abstract). Int. Pet. Econ. 2016, 24, 44–53. [Google Scholar]
- United Nations World Water Assessment Programme (WWAP). The United Nations World Water Development Report 2015: Water for a Sustainable World; United Nations Educational, Scientific and Cultural Organizations: Paris, France, 2016. [Google Scholar]
- Yang, M.; Yang, L.; Hu, Z. Pattern Evolution and Challenges of Trades between China and Indo-China Peninsula Countries under the Background of “One Belt and One Road” (in Chinese with English abstract). Trop. Geogr. 2015, 35, 655–663. [Google Scholar]
- Toma, P.; Massari, S.; Miglietta, P.P. Natural resource use efficiency and economic productivity. In Life Cycle Approaches to Sustainable Regional Development; Massari, S., Sonnemann, G., Balkau, F., Eds.; Routledge-Taylor and Francis Group: Abingdon-on-Thames, UK, 2016; pp. 143–148. [Google Scholar]
- Miglietta, P.P.; Toma, P.; Fanizzi, F.P.; De Donno, A.; Coluccia, B.; Migoni, D.; Bagordo, F.; Serio, F. A Grey Water Footprint Assessment of Groundwater Chemical Pollution: Case Study in Salento (Southern Italy). Sustainability 2017, 9, 799–808. [Google Scholar] [CrossRef]
Figure 1.
The blue component of WFEP in China from 2001 to 2014. Please refer to Supplement Table S1 for the calculated values.
Figure 1.
The blue component of WFEP in China from 2001 to 2014. Please refer to Supplement Table S1 for the calculated values.

Figure 2.
The blue component of WFES in China from 2001 to 2014. Please refer to Supplement Table S1 for the calculated values.
Figure 2.
The blue component of WFES in China from 2001 to 2014. Please refer to Supplement Table S1 for the calculated values.

Figure 3.
The internal and external blue component of WFESs in China from 2001 to 2014.

Figure 4.
The impact on water resources of energy production in China from 2001 to 2014.

Figure 5.
The spatial flow of net virtual water hidden in fossil energy [(a) coal; (b) oil; and (c) gas] trade in 2014 in China. Notes: Countries with net virtual water of more than 1 million m3, embedded in the coal and oil trades, and more than 10,000 m3, embedded in gas trade, are presented in the figure. Please refer to Supplement Figures S1–S3 for more details.

Table 1.
The WRCs for fossil energy production.
| Fossil Energy | WCF | References |
|---|---|---|
| Surface coal mining (m3 per tonne) a | 0.936 | Tsinghua-BP Clean Energy Centre [35] |
| Underground coal mining (m3 per tonne) a | 2.652 | Tsinghua-BP Clean Energy Centre [35] |
| Coal established (m3/GJ) | 0.043 | Spang et al. [33] |
| Crude oil offshore (barrels of water per barrel of oil) b | 0.0 | Williams and Simmons [34] |
| Crude oil onshore (barrels of water per barrel of oil) | 1.0 | Williams and Simmons [34] |
| Crude oil established (m3/GJ) c | 0.081 | Spang et al. [33] |
| Gas (m3/TJ) | 1.6 | Williams and Simmons [34] |
Notes: a Approximately 22% of water withdrawn is recycled and reused in coal production, and the rest is consumed [22]; b one barrel of water per barrel of oil equals 26.4 m3/TJ; c GJ: gigajoule.
Table 2.
The sustainability evaluation of water use for fossil energy production in different periods.
Table 2.
The sustainability evaluation of water use for fossil energy production in different periods.
| Planning Period | Sustainability | |||
|---|---|---|---|---|
| 10th Five Year Plan | 0.012 | 0.589 | 49.641 | unsustainable |
| 11th Five Year Plan | 0.069 | 0.441 | 6.389 | unsustainable |
| 12th Five Year Plan | 0.012 | 0.128 | 10.584 | unsustainable |
| 13th Five Year Plan | 0.099 | 0.006 | 0.059 | sustainable |
© 2017 by the authors. Licensee MDPI, Basel, Switzerland. This article is an open access article distributed under the terms and conditions of the Creative Commons Attribution (CC BY) license (http://creativecommons.org/licenses/by/4.0/).
Share and Cite
MDPI and ACS Style
Lin, G.; Jiang, D.; Duan, R.; Fu, J.; Hao, M. Water Use of Fossil Energy Production and Supply in China. Water 2017, 9, 513. https://doi.org/10.3390/w9070513
AMA Style
Lin G, Jiang D, Duan R, Fu J, Hao M. Water Use of Fossil Energy Production and Supply in China. Water. 2017; 9(7):513. https://doi.org/10.3390/w9070513
Chicago/Turabian StyleLin, Gang, Dong Jiang, Rui Duan, Jingying Fu, and Mengmeng Hao. 2017. "Water Use of Fossil Energy Production and Supply in China" Water 9, no. 7: 513. https://doi.org/10.3390/w9070513
Note that from the first issue of 2016, this journal uses article numbers instead of page numbers. See further details here.