Comparison of Four Nitrate Removal Kinetic Models in Two Distinct Wetland Restoration Mesocosm Systems

1
Department of Biological Systems Engineering and School of Natural Resources, University of Nebraska-Lincoln, 217 L.W. Chase Hall, P.O. Box 830730, Lincoln, NE 68583-0730, USA
2
Biological and Agricultural Engineering, Box 7625, North Carolina State University Campus, Raleigh, NC 27695, USA
*
Author to whom correspondence should be addressed.
Water 2017, 9(7), 517; https://doi.org/10.3390/w9070517
Submission received: 27 April 2017
/
Revised: 6 July 2017
/
Accepted: 9 July 2017
/
Published: 13 July 2017
(This article belongs to the Special Issue Treatment Wetlands for Nutrient Removal)
Abstract
:The objective of the study was to determine the kinetic model that best fit observed nitrate removal rates at the mesocosm scale in order to determine ideal loading rates for two future wetland restorations slated to receive pulse flow agricultural drainage water. Four nitrate removal models were investigated: zero order, first order decay, efficiency loss, and Monod. Wetland mesocosms were constructed using the primary soil type (in triplicate) at each of the future wetland restoration sites. Eighteen mesocosm experiments were conducted over two years across seasons. Simulated drainage water was loaded into wetlands as batches, with target nitrate-N levels typically observed in agricultural drainage water (between 2.5 and 10 mg L−1). Nitrate-N removal observed during the experiments provided the basis for calibration and validation of the models. When the predictive strength of each of the four models was assessed, results indicated that the efficiency loss and first order decay models provided the strongest agreement between predicted and measured NO3-N removal rates, and the fit between the two models were comparable. Since the predictive power of these two models were similar, the less complicated first order decay model appeared to be the best choice in predicting appropriate loading rates for the future full-scale wetland restorations.
1. Introduction
Over the next decade the United States is expected to continue and intensify its focus on ecological systems and their capacity to store water and improve water quality [1,2]. The impacts of increased pollutant loads from non-point sources continue to threaten important economic and recreational aquatic ecosystems. These growing pollutant loads have the potential to further impair drinking water, as well as continue to threaten important aquatic dependent industries and recreational water-based environments [3].
Many of the environmental pressures in coastal regions have been linked directly to the drainage systems that were implemented to alter areas with wetland characteristics (e.g., high water tables, hydric soils, and hydrophytic vegetation) into highly productive farmland [4,5,6]. Each year an estimated 13 million tons of nitrogen (N) are purchased to incorporate into cropland soils in the United States enabling crop production to sustain the continually growing world population [7]. Fertilizer applications have been reported to be the dominant N input in most sensitive watersheds found in the Southeastern and Mississippi River regions [8]. Furthermore, reactive nitrogen in drainage water entering sensitive freshwater and marine ecosystems has been found to harmfully alter these systems (e.g., acidification, toxic algae blooms, hypoxia, contamination of drinking water aquifers, loss of biodiversity) [3,9,10,11,12].
Negative ecological impacts from draining wetland environments could be reversed in part by restoring wetlands. Mitigation or conservation programs that invest resources into strategically positioned wetland restoration projects in sensitive watersheds could help lead to a reversal in both declining wetland ecosystem structure and water quality trends. Recent studies have been conducted to improve restored wetland designs to offer additional water quality ecosystem services that may have not been originally a part of the ecosystem. For example, strategically placed wetlands in coastal landscapes receiving pumped agricultural drainage water have been reported to not only enhance wetland hydrology, but provide reduction of nutrient, sediment, and fecal bacteria up to 97% from incoming drainage water [13,14]. However, N removal rates, particularly nitrate-N (NO3-N) which is significant in agricultural drainage water, can be variable in wetland systems depending on such factors as wetland to watershed ratio, soil type, wetland ecosystem type, residence time, and loading rates [15,16,17]. To promote the increased application of wetlands to improve watershed health, the development of improved wetland removal process design tools for sensitive watersheds are needed.
A significant body of work has been completed to determine the N removal capacity of agricultural, municipal wastewater, and stormwater treatment wetlands [18,19,20,21]. However, N removal in constructed and restored surface pulse flow wetlands continues to be based primarily on simple zero and first-order decay models with few studies completed to investigate alternative N removal kinetic models [22,23,24]. Some researchers have identified several potential drawbacks to using zero and first order decay approaches, particularly regarding utilizing models originally developed for constant flow municipal applications in intermittent flow agricultural settings [25,26].
Restoration success evaluations are rarely completed because project funds often are predominately earmarked for construction of on-the-ground projects [27]. Therefore, the utilization of wetland mesocosms may be a more cost effective alternative to enhance our understanding of N processes prior to full-scale construction and provide useful predictions of the NO3-N assimilation and removal capacity of these systems[25,28,29,30].
In this study, the potential to reduce NO3-N concentrations at two future wetland restoration sites in eastern North Carolina was evaluated. Resultant freshwater pulses from developed and drained agricultural land that contain excess nutrients, sediment, and fecal bacteria, have likely contributed to the lower quality of shellfishing waters in these areas [31]. Restored forested pulse flow wetlands, which are planned for these sites, are one type of wetland that has been found to provide water treatment, flood abatement, biodiversity, and carbon storage in coastal regions [32]. A series of laboratory mesocosm experiments were completed to determine the best kinetic model to predict NO3-N removal rates in the two distinct wetland systems. This was vitally important to maximize the hydrologic and nutrient assimilation and removal potential for these future restored wetlands because the amount of drainage water pumped to the wetland area will assist in restoring a more natural wetland hydroperiod and equal the reduction of drainage water currently pumped directly to a nearby sensitive estuary. The study was unique because eighteen NO3-N removal studies were completed to capture differences of each wetland’s NO3-N removal capacity with respect to N loading and season. Findings provided from this study were intended to guide wetland designers as to the best method to predict NO3-N removal capacity in wetland systems that will receive an intermittent load of water with relatively low concentrations of NO3-N.
The primary objectives of this study were to: (1) Create a dataset of NO3-N removal observations over varying seasons, N loadings, and antecedent conditions for two pulse flow wetland environments at the mesocosm scale; (2) Evaluate the fit of four NO3-N removal models (zero order, first order decay, efficiency loss, and Monod) with observed daily NO3-N removal observations; and (3) Provide predictions for the maximum drainage water volumes that can be pumped into the future restored wetlands based on the kinetic model that best fit and was most practical for observed NO3-N removal datasets.
2. Materials and Methods
2.1. Experimental Setup
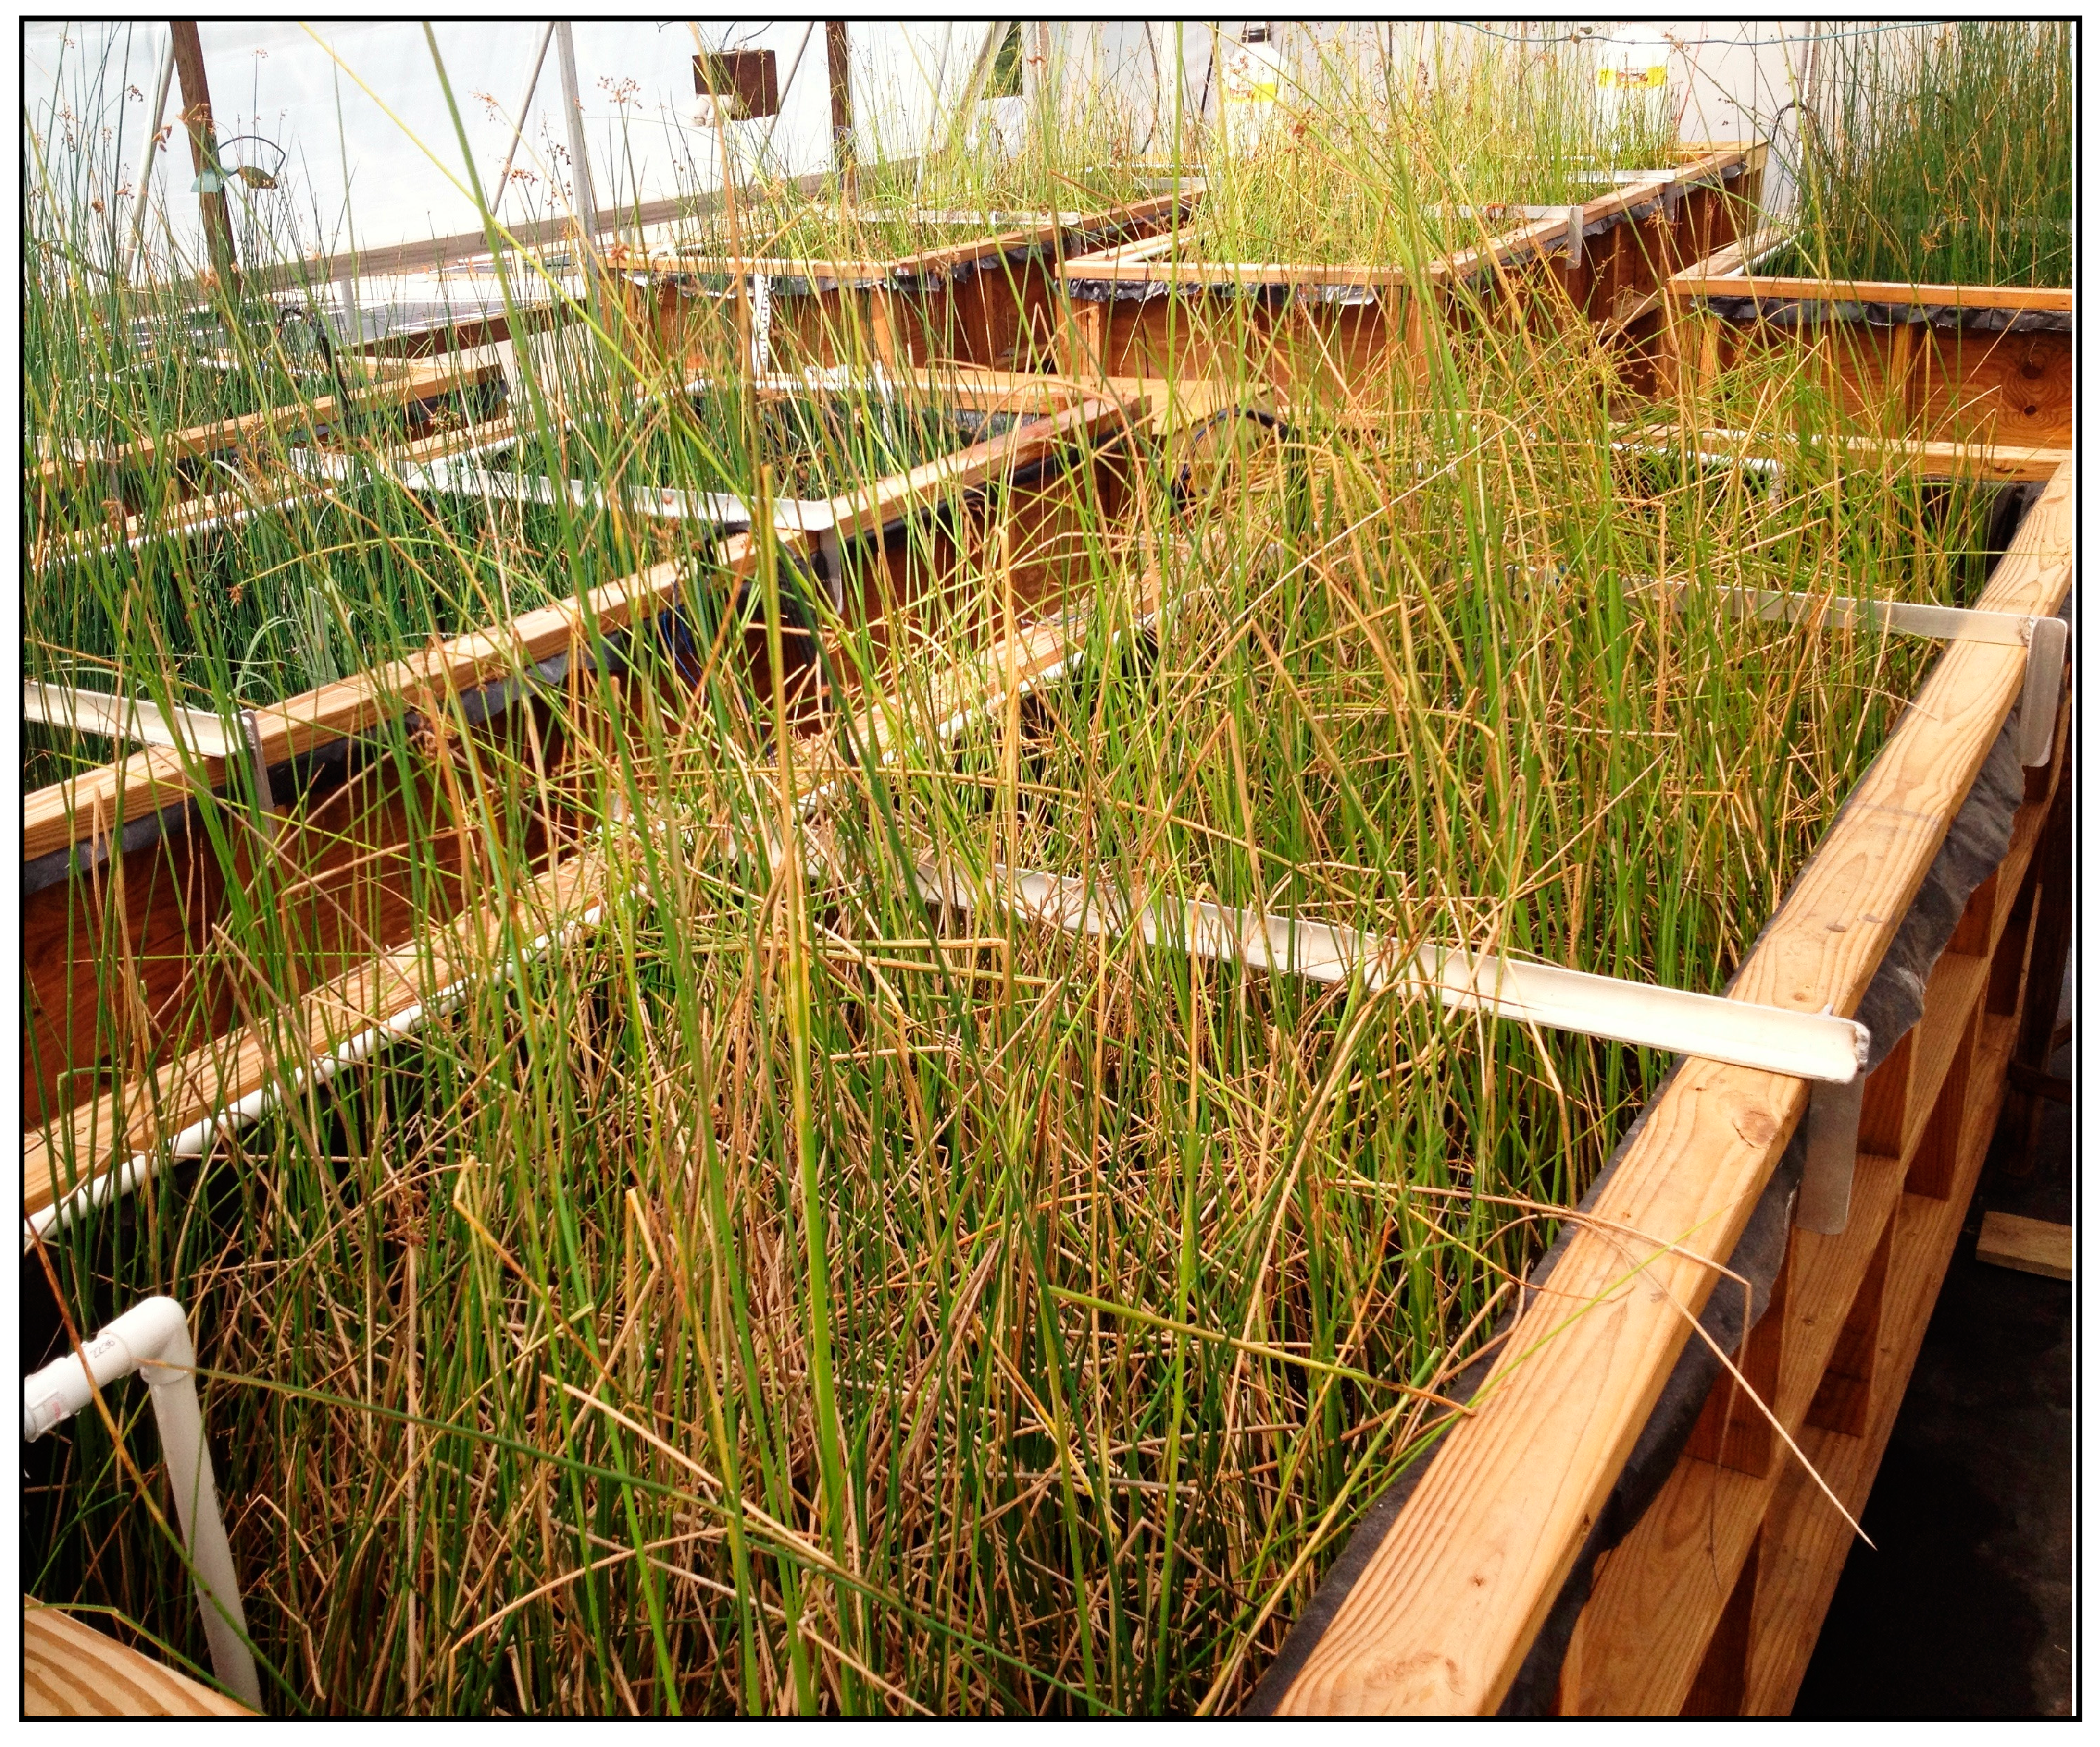
Six large wetland mesocosms (3.5 m long × 0.9 m wide × 0.75 m deep) were constructed in a greenhouse near North Carolina State University 16 months prior to the initial experiment (Figure 1). Details of the mesocosm construction and experiments can be found elsewhere [33]. The soil/water interface is where critical biogeochemical transformations occur in wetlands; therefore, using restoration site soils was a critical component for the success of estimating site specific NO3-N removal rates for these wetlands. In summary, soils were excavated directly from the future restoration sites to be used in the study. Three randomized mesocosm replicates were loaded with Scuppernong soil (a poorly drained, organic soil typically associated with Pocosins), while three more were loaded with Deloss soil (a poorly drained, mineral soil typically associated with marine terraces). The Scuppernong and Deloss wetland mesocosms will be referred to as WET-Org and WET-Min, respectively, for the remainder of this article. Soft-stemmed bulrush (Schoenoplectus tabernaemontani) was chosen because other researchers have successfully utilized this plant to study wetland nutrient dynamics at the mesocosm scale [24,34]. Additionally, the above and belowground biomass of S. tabernaemontani can establish quickly with careful attention to the plant requirements. Three smaller mesocosms served as controls for the experiment and had only the simulated drainage water. Each wetland mesocosm was outfitted with a recirculation system to replicate the conditions of drainage water moving slowly through a wetland. Steady state flow was maintained through each wetland mesocosm by collecting water along one end of the mesocosm and pumping the water through a linear PVC apparatus to the other end of the mesocosm. Pumping rates were adjusted such that average turnover time of water in each mesocosm was approximately once a day. Complete details of the mesocosm setup can be found elsewhere [34].
2.2. Wetland Mesocosm Experiments
Eighteen batch experiments were conducted between September 2012 and September 2014 (16 months after mesocosm construction and planting) to capture differences with respect to N loading and season of each wetland’s NO3-N removal capacity. The experiments were conducted as batch studies, with each mesocosm loaded with identical hydraulic and nutrient loading rates during each experiment (Table 1). Initial NO3-N concentrations were varied during the study at ranges commonly found in agricultural drainage water at each restoration site (2.5–10 mg L−1). The base target load was 0.6 g NO3-N m−2. The load represented an 18 cm water depth and 2.5 mg L−1 NO3-N concentration, which is the most frequent loading expected at the future wetland restoration sites. Higher target loads that varied between 0.9 g NO3-N m−2 and 3.6 g NO3-N m−2 and water depths of 18 to 30 cm were also evaluated during the batch studies. Stage gages were permanently placed in each mesocosm to observe average water depth within the mesocosm at the beginning of each experiment and used for calculations discussed below. Each batch experiment lasted 7 to 10 days. More detailed methods for the initiation of each batch run can be found elsewhere [34].
2.3. Sampling Plan and Analysis
Grab water quality samples were collected from the recirculation system on days 0, 1, 2, 3, 5, and 7 during all batch runs and in 14 of 18 batch runs on day 10. Samples were then analyzed for NO3-N after being filtered through 0.45 μm filters. All water quality analyses of the grab samples were conducted in the Soil Science Environmental and Agricultural Testing Service Lab (SSC-EATS) with a Quikchem 8000 (Lachat, Milwaukee, WI, USA) using the cadmium reduction method (EPA Method 353.2). Evapotranspiration rates were calculated for NO3-N concentration adjustments based on the changes in the water depth measured on a stage gage in each mesocosm over the course of each experiment. Additionally, water temperature in each wetland mesocosm was monitored hourly using 8k HOBO pendant temperature sensors (Onset Computer Corporation, Bourne, MA, USA).
2.4. Apparent NO3-N Removal Calculations
Area-based NO3-N removal rates (JNN, mg m−2 d−1) were determined on a daily basis during each experiment.
where, Ci was the initial NO3-N load applied to each mesocosm (mg) at the beginning of each timestep, Ct was the NO3-N remaining in the mesocosm water at each timestep (mg), A was the surface area of the wetland mesocosm (m2), and t was the timestep or mean residence time of water held within the wetland mesocosm system. Determination of the removal rates for a particular experiment were terminated when Ct < 0.05 mg L−1 [35].
2.5. NO3-N Removal Kinetic Models
Four models were considered to predict NO3-N removal: zero order (ZO), first order decay (FO), efficiency loss (EL), and Monod (M). The zero order, first order, and Monod models were chosen because they have been used to model NO3-N removal in wetlands in past experiments [25,36]. The efficiency loss model was chosen because to our knowledge it had not been explored prior to this study in wetlands, but has been observed to model NO3-N removal well in streams [37,38,39]. Observations from the first nine of the eighteen completed batch run experiments were used to determine removal rate coefficients, which varied in NO3-N load and season. Coefficients were calculated using NO3-N concentrations 24 h following NO3-N loading to allow initial concentrations to stabilize in each mesocosm and final NO3-N concentrations for each model. The kinetic model fits were then evaluated using the remaining nine experimental datasets from the batch run experiments [40].
2.5.1. Zero Order (ZO) Model
The most simplistic quantitative model, the zero order model (ZO), assumes contaminant reduction is independent of NO3-N concentration. Zero order NO3-N models have been used to model NO3-N removal in wetlands assuming a constant consumption rate of NO3-N [41,42]. Therefore, the JZO, the area based NO3-N removal rate (g m−2 d−1), would be constant. These systems can be characterized by a linear NO3-N concentration profile, which is often unrealistic in systems with longer residence times that allow NO3-N to become limited. The model assumes the system is closed, anoxic, completely or partially mixed, independent of hydraulic loading rates, and insignificantly influenced by other kinetic reactions occurring within the system [43]. The model can be expressed as [44]:
where, C1 was the NO3-N concentration in the wetland mesocosm 24 h after simulated drainage was added to allow the system to be well mixed (mg L−1), tF−1 was the mean residence time or period the water was held within the wetland mesocosm system after the water was well mixed (24 h) until Ct < 0.05 mg L−1 (d) [35], CF was the NO3-N concentration at end of the analysis (mg L−1), and D was initial average water depth (m).
Once the JZO was estimated using observed NO3-N removal datasets from the first 9 of the 18 mesocosm experiments, Ct was predicted using the following equation for the remaining 9 batch experiments:
where, CApplied is the NO3-N concentration in simulated drainage water applied to the wetland mesocosm on Day 0 of the experiments.
2.5.2. First Order Decay (FO) Model
The second model, the first order decay model (FO), assumes NO3-N reduction rates are directly proportional to NO3-N concentration [45]. Therefore, removal rates (JFO) increase linearly with NO3-N concentration assuming removal efficiency does to not change in relation to NO3-N load [46]. The model also assumes that the substrate concentration is significantly smaller than the half-saturation constant (Ks, the concentration supporting an uptake rate of 50% of the maximum rate), the system is well mixed, has no significant influences from water losses or gains, and is dependent on only one reactant [14,43,47,48]. The ρFO, the mass transfer coefficient (cm d−1), accounts for the intrinsic ability for the soil to retain NO3-N by including depth, which is often ignored by using other removal rate constants (i.e., k (d−1)) in first order decay model evaluations. The model can be expressed mathematically as [37]:
After ρFO was determined using the first 9 of the 18 mesocosm experiments, daily Ct values were predicted using the following first order decay equation for the remaining 9 batch experiments:
2.5.3. Efficiency Loss (EL) Model
The third model, the efficiency loss model (EL), is similar to the first order decay model, but it accounts for the efficiency of the process rate relative to NO3-N concentration decline over time [45]. The surficial removal rates are proportional to the NO3-N concentration ‘to the α’, in which α, the rate order, is less than 1. Indeed, it has been theoretically shown in systems that have diffusion only processes and perfectly flat sediment, water column NO3-N removal rates are ½ order rates [49] The efficiency loss model thus essentially implies the apparent removal rate above an actual uneven sediment, which results in the exchange surface area that is higher than the projected area and must be adjusted to a rate between 0.5 and 1. Similar to the first order decay rate model, the model assumes that the substrate concentration is significantly smaller than Ks, the system is well mixed, and has no significant influences from water losses or gains. However, the model assumes a power relationship represented by the coefficient α, in which the order is less than 1. The model can be expressed as:
where ρEL was the mass transfer coefficient (cm d−1), α was a unitless constant that varies between 0 and 1. The model was evaluated empirically in R Studio (2015) [50] to solve for α and ρEL for individual mesocosms using 9 of the 18 batch run datasets.
To test the model, daily Ct values were then predicted for the remaining 9 batch experiments, using the ρEL and averaged α values not used to determine removal coefficients. Observed NO3-N concentrations were compared to predicted daily NO3-N concentrations (Ct) from the mesocosm studies that were calculated using the following equation:
2.5.4. Monod (M) Model
The fourth model evaluated was the Monod model (M), also referred to as the Michaelis-Menten model for theoretical considerations, which often represents biologically mediated reactions that display first order decay kinetics at low concentrations and zero order kinetics at higher concentrations, resulting in a hyperbolic relationship between JM and NO3-N concentrations. Zero order kinetics has been observed when NO3-N concentrations exceeded biological demand of the system, while first order decay kinetics have been observed when NO3-N concentrations are below the biological demand of the system [51]. Therefore, the model ultimately interpolates between a zero order and first order decay models. The model assumes there are no intermediate or product inhibitions and the system is at steady state [52]. The model can be expressed as:
where JM was the area based NO3-N loss rate (mg m−2 d−1), Jmax was the maximum removal rate achieved by the system (mg m−2 d−1), and Ks (mg L−1) was the half-saturation constant. Ks and Jmax were determined graphically using a Lineweaver-Burke plot with observed values from batch experiments [53]. Daily JM values were then calculated using the remaining 9 of 18 batch experiments with Equation 5, the empirically determined constants, and daily NO3-N concentrations.
More specifically, Ks was the concentration at which point the NO3-N removal rate was at half of the maximum NO3-N removal rate (Jmax) for the WET-Min and WET-Org systems. The relationship between JM and Cf was evaluated using a Lineweaver-Burke plot to empirically determine the maximum areal removal rate (Jmax) and the half-saturation constants (Ks) for the Monod model for each treatment (WET-Min and WET-Org) and replicate.
2.6. Temperature Adjustment of Removal Rate Coefficients
The effect of temperature on the estimated removal coefficients of each batch run (J or ρ) was determined using a modified Arrhenius relationship [54]:
where X was either J, the area based NO3-N loss (mg m−2 d−1) at temperature T (°C), or ρ, the mass transfer coefficient (cm d−1) at temperature T (°C), X20 was either J20, the area based NO3-N loss (mg m−2 d−1) at 20 °C, or ρ20, the mass transfer coefficient (cm d−1) at 20 °C, and θ was an empirical temperature coefficient. A linear form was used to estimate J20 and ρ20 were determined for each treatment using the first 9 of the 18 batch run datasets.
2.7. Statistical Evaluation
The accuracy and the reliability of the four models for predicting NO3-N removal rates were compared utilizing three statistical parameters that are described in Table 2 [55,56]: coefficient of determination (R2), relative root mean square error (RRMSE), and model efficiency (MEF). The statistical parameters were used to evaluate the correlation, differences, and variations between the predicted and measured NO3-N removal rates only in the 9 batch experiments that were used to validate the removal rate models.
3. Results
3.1. NO3-N Removal and Areal Removal Rates
Hydraulic loading and water quality observations during the batch studies are presented in Table 3. Prior to each batch experiment, average daily recirculation rates were adjusted to 0.5 or 1 m3 d−1 depending on depth to allow drainage water to turnover within each mesocosm once a day. Applied drainage water had NO3-N concentrations within 10–20% of the initial target concentrations.
Significant NO3-N reduction was observed in both the WET-Min and WET-Org wetland systems during all batch runs, with NO3-N reductions as high as 99%. The highest removal rates were observed during the growing season, as expected. NO3-N removal in both wetland systems were significantly affected during fall and winter months when plants began to die back, average water temperatures were colder, and dissolved oxygen concentrations were higher, all of which likely limited plant and microbial uptake and inhibited denitrification [58,59]. These findings support the importance of developing removal coefficients at a base temperature (J20 or ρ20) that can be adjusted dependent on average water temperatures to more accurately predict fluctuations in wetland NO3-N removal rates [60].
Average and daily areal NO3-N removal rates were higher in the WET-Min mesocosms when compared to the WET-Org wetland mesocosms. Average removal rates in the WET-Min system ranged from 62 to 603 mg m−2 d−1, while the WET-Org wetland systems had removal rates from 59 to 344 mg m−2 d−1 during the growing season when water temperatures were above 12 °C, with the exception of one fall experiment. Average removal rates dramatically decreased once water temperatures fell below 12 °C. Observed NO3-N removal rates from this study were similar to removal rates found in other microcosm and mesocosm wetland NO3-N removal studies during the growing season. Gebremariam and Beutel reported comparable NO3-N removal rates (175–500 mg m−2 d−1) in an evaluation of surface flow constructed treatment wetland mesocosms spiked with NO3-N at 15 mg L−1 during the summer [61]. Stringfellow et al. investigated three wetland restoration substrates receiving agricultural drainage water during the growing season utilizing microcosms and reported mean areal NO3-N removal rates of 142–380 g m−2 d−1, also consistent with the estimated wetland mesocosm NO3-N removal rates in this study [52]. At a larger scale, a constructed surface flow wetland macrocosm study supplied with NO3-N concentrations of 8–10 mg L−1 observed NO3-N removal rates to be as high as 834 mg N m−2 d−1 [62].
3.2. Model Calibrations
Observed daily NO3-N concentrations from the first 9 of 18 batch experiments were used to calibrate models and determine kinetic constants for each model. Potential impacts of water depth and temperature were also investigated during the calibration stage of the models.
The zero and first order decay kinetic coefficients were calculated using data observed from each batch run experiment for individual mesocosms (Equations (2) and (4)). The zero order kinetic model had R2 values that ranged between 0.78 and 0.99 with an average of 0.97 in the WET-Min system, while the WET-Org systems had R2 values that ranged from 0.81 to 0.99 with an average of 0.97. In contrast, WET-Min treatments had R2 values that ranged between 0.70 and 0.99 with an average of 0.95 in the first order decay models, while the WET-Org systems had R2 values that ranged from 0.73 to 0.99 with an average of 0.94 for individual batch runs. The lower R2 values were observed during the winter months when average water temperature was below 12 °C. All evaluations during the growing season had R2 values above 0.90 for both the zero and first order decay fits to observed datasets.
The efficiency loss model was evaluated in R Studio to empirically solve for ρEL and α in each mesocosm during the first 9 batch experiments using daily NO3-N concentration observations at each sampling point. The two unknown values (α and ρEL) were determined for seven of the nine batch run datasets and resulted in good fits based on outputs from the R Studio model (p > 0.01 for ρEL and p > 0.2 for α). The WET-Min treatments had an R2 values that ranged between 0.93 and 0.99 with an average of 0.98, while the WET-Org systems had R2 values that ranged from 0.95 and 0.99 with an average of 0.98.
R studio was unable to solve for α values in the efficiency loss model in a two batch runs when NO3-N removal periods were short or when the NO3-N change over time resembled a zero or first order decay relationship, which resulted in an α equal to 0 or 1, respectively. Therefore, α values that represented the individual wetland systems were difficult to determine since empirically determined α values often varied between 0 and 1 within the same treatment and batch run. Correlations between the α values and season, NO3-N load, temperature and DO were not observed. However, differences between the α values and water depth were observed particularly in the WET-Min wetland systems. Consequently, α values empirically determined in R Studio were separated into treatment and initial water depths (18 and 30 cm). Average α values were then calculated based on initial water depth for each treatment and used as the initial input of α for the efficiency loss model to fit observed NO3-N removal rates in the 9 of 18 batch run experiments used for calibration. The α values were then adjusted until the best fit was found between observed and predicted values.
The Monod model constants (Ks and Jmax) were estimated graphically using the first 9 of the 18 batches. Jmax and Ks were then averaged across replicates of each treatment. The Monod model had R2 values that ranged from 0.19 to 0.95 with an average R2 of 0.65 in the WET-Min systems, while R2 values ranged from 0.13 to 0.99 with an average R2 of 0.55 in the WET-Org systems.
3.3. Temperature Adjustment for Removal Rate Coefficients
Removal rate coefficients for 20 °C were calculated for each mesocosm and model utilizing the first 9 of 18 batch run datasets and the Arrhenius relationship. Individual mesocosm values were then averaged for each treatment (i.e., each batch θ obtained for WET-Min and WET-Org was an average of the three replicates). Computed values can be found along with published values from past mesocosm and full-scale wetland studies for comparison in Table 4. To our knowledge, no studies have reported using the efficiency loss and zero order models at the mesocosm scale, therefore, comparisons were made with full-scale systems. In general, our results were consistent with observed values from past published wetland studies.
3.4. Validation of Kinetic Model Fits
Observed NO3-N removal rates from the remaining 9 batch run datasets (not used for calculating removal rate coefficients and other kinetic coefficients) were used to compare the daily predicted values produced by each of the developed kinetic models and evaluate the goodness of fit for each model. Kinetic coefficients were adjusted for average water temperature in each batch run. A regression of the predicted vs. observed removal rates for each of the four models are displayed in Figure 2.
4. Discussion
4.1. Prediction Power
The fit of the zero order and Monod models were weak between the predicted and observed values for all statistical parameters (Figure 2). Both models consistently under predicted the removal rates for all NO3-N loads. The weak fits between the predicted and observed removal rates were not surprising. Based on the assumption for the zero order model, removal rates are not affected by changes in initial NO3-N concentrations, which tend to be observed only when NO3-N concentrations at high (>200 mg L−1) [36,64]. However, these models were evaluated due to little, if any literature, has evaluated these models for pulse flow systems. During every season, as NO3-N loads increased the observed removal rates also increased. Therefore, the assumptions required to use the zero order model were not met for these systems. Additionally, Ks values, empirically calculated as 5.96 mg L−1 for the WET-Min system and 5.63 mg L−1 for the WET-Org system, were similar to Co (initial concentrations) and thus did not meet the definition of the half saturation constant required to make the continued use of the Monod model justifiable.
Zero and Monod kinetic models are often used in wastewater treatment wetland systems where high initial NO3-N concentrations allow for the systems to become saturated resulting in a maximum removal rate (JZO), which in this case would be equivalent to the Jmax of the Monod kinetic model. However, based on observed removal rates, the wetland mesocosm systems never reached a saturation point, which resulted in poor estimates for the removal coefficients for both models. Therefore, based on observations in this study, these predictive models are not recommended for wetlands loaded with low NO3-N concentrations.
Stronger statistical results were observed for the first order decay and efficiency loss models with R2 ≥ 0.84 (Figure 2). Each of these models are dependent on initial NO3-N loads and do not require the determination of saturation coefficients such as Ks. Additionally, the first order model and the efficiency models had similar fits. The stronger predictive power of the first order decay and efficiency loss models compared to the zero and Monod models was due to chemical and physical based assumptions of the mathematical theories in terms of NO3-N reduction. Chemically the zero order model assumes substrate concentrations at all points within the water column is notably greater than half-saturation concentrations, while the Monod model required NO3-N saturated conditions at least one point during the experiments. NO3-N half-saturation constants can only be determined once the systems are saturated (meaning the microbial and biomass pools are removing the maximum amount of NO3-N) [25], which was never observed during these experiments. In contrast, the first order and efficiency loss models do not require a saturation point. Physically, the water was recirculated slowly within the mesocosms, as expected in the future restored wetlands, which likely enhanced the ability of NO3-N to reach denitrifying hot-spots through advection and diffusion in the system [65], which further limited these systems from becoming saturated.
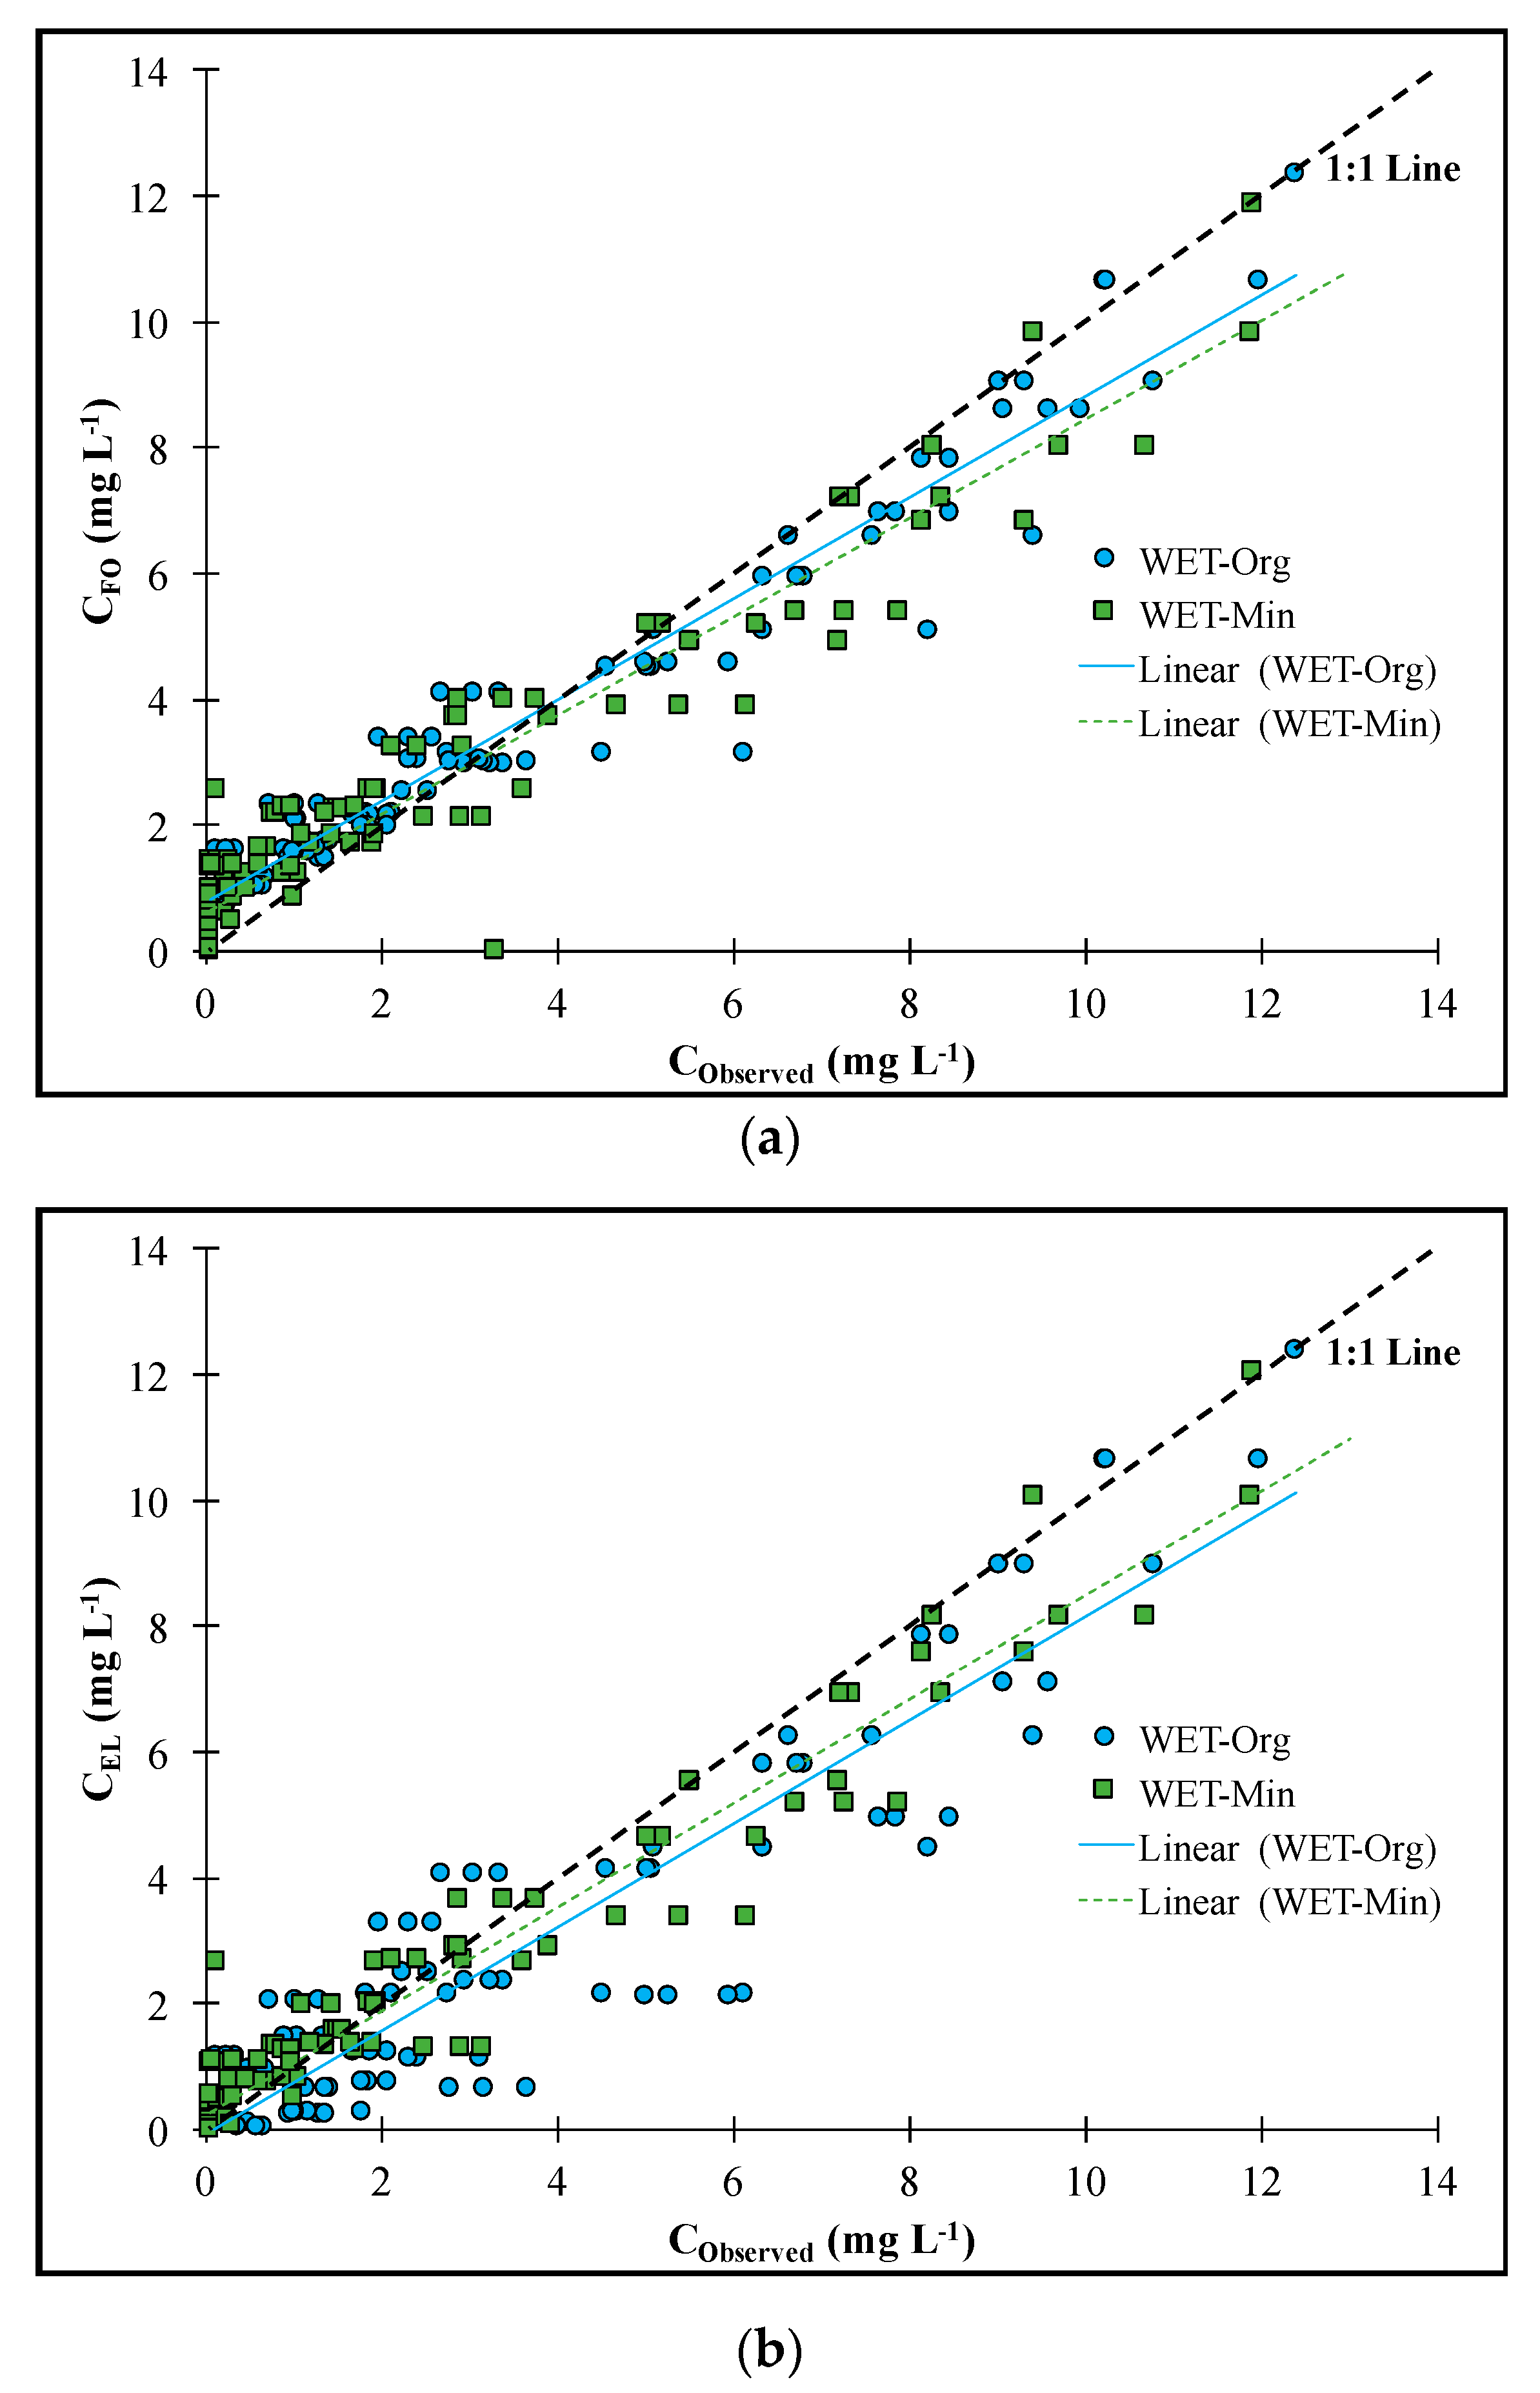
Both the first order decay and efficiency loss models were further assessed to determine if defined parameters, particularly retention time, impacted the prediction power of the models. Residence time of surface water in the full-scale wetland environments must stay within the range of 1 to 10 days to preserve established and recently planted trees [66,67]. Therefore, both predicted and observed values were compared (Figure 3). Figure 3 shows the first order decay model has a tendency to over predict NO3-N concentrations at values < 3 to 4 mg L−1, while the model typically under predicts NO3-N concentrations at values > 3 to 4 mg L−1 for both the WET-Min and WET-Org wetland mesocosms systems (Figure 3a). Similarly, the efficiency loss model typically under predicted at higher NO3-N concentrations (Figure 3b).
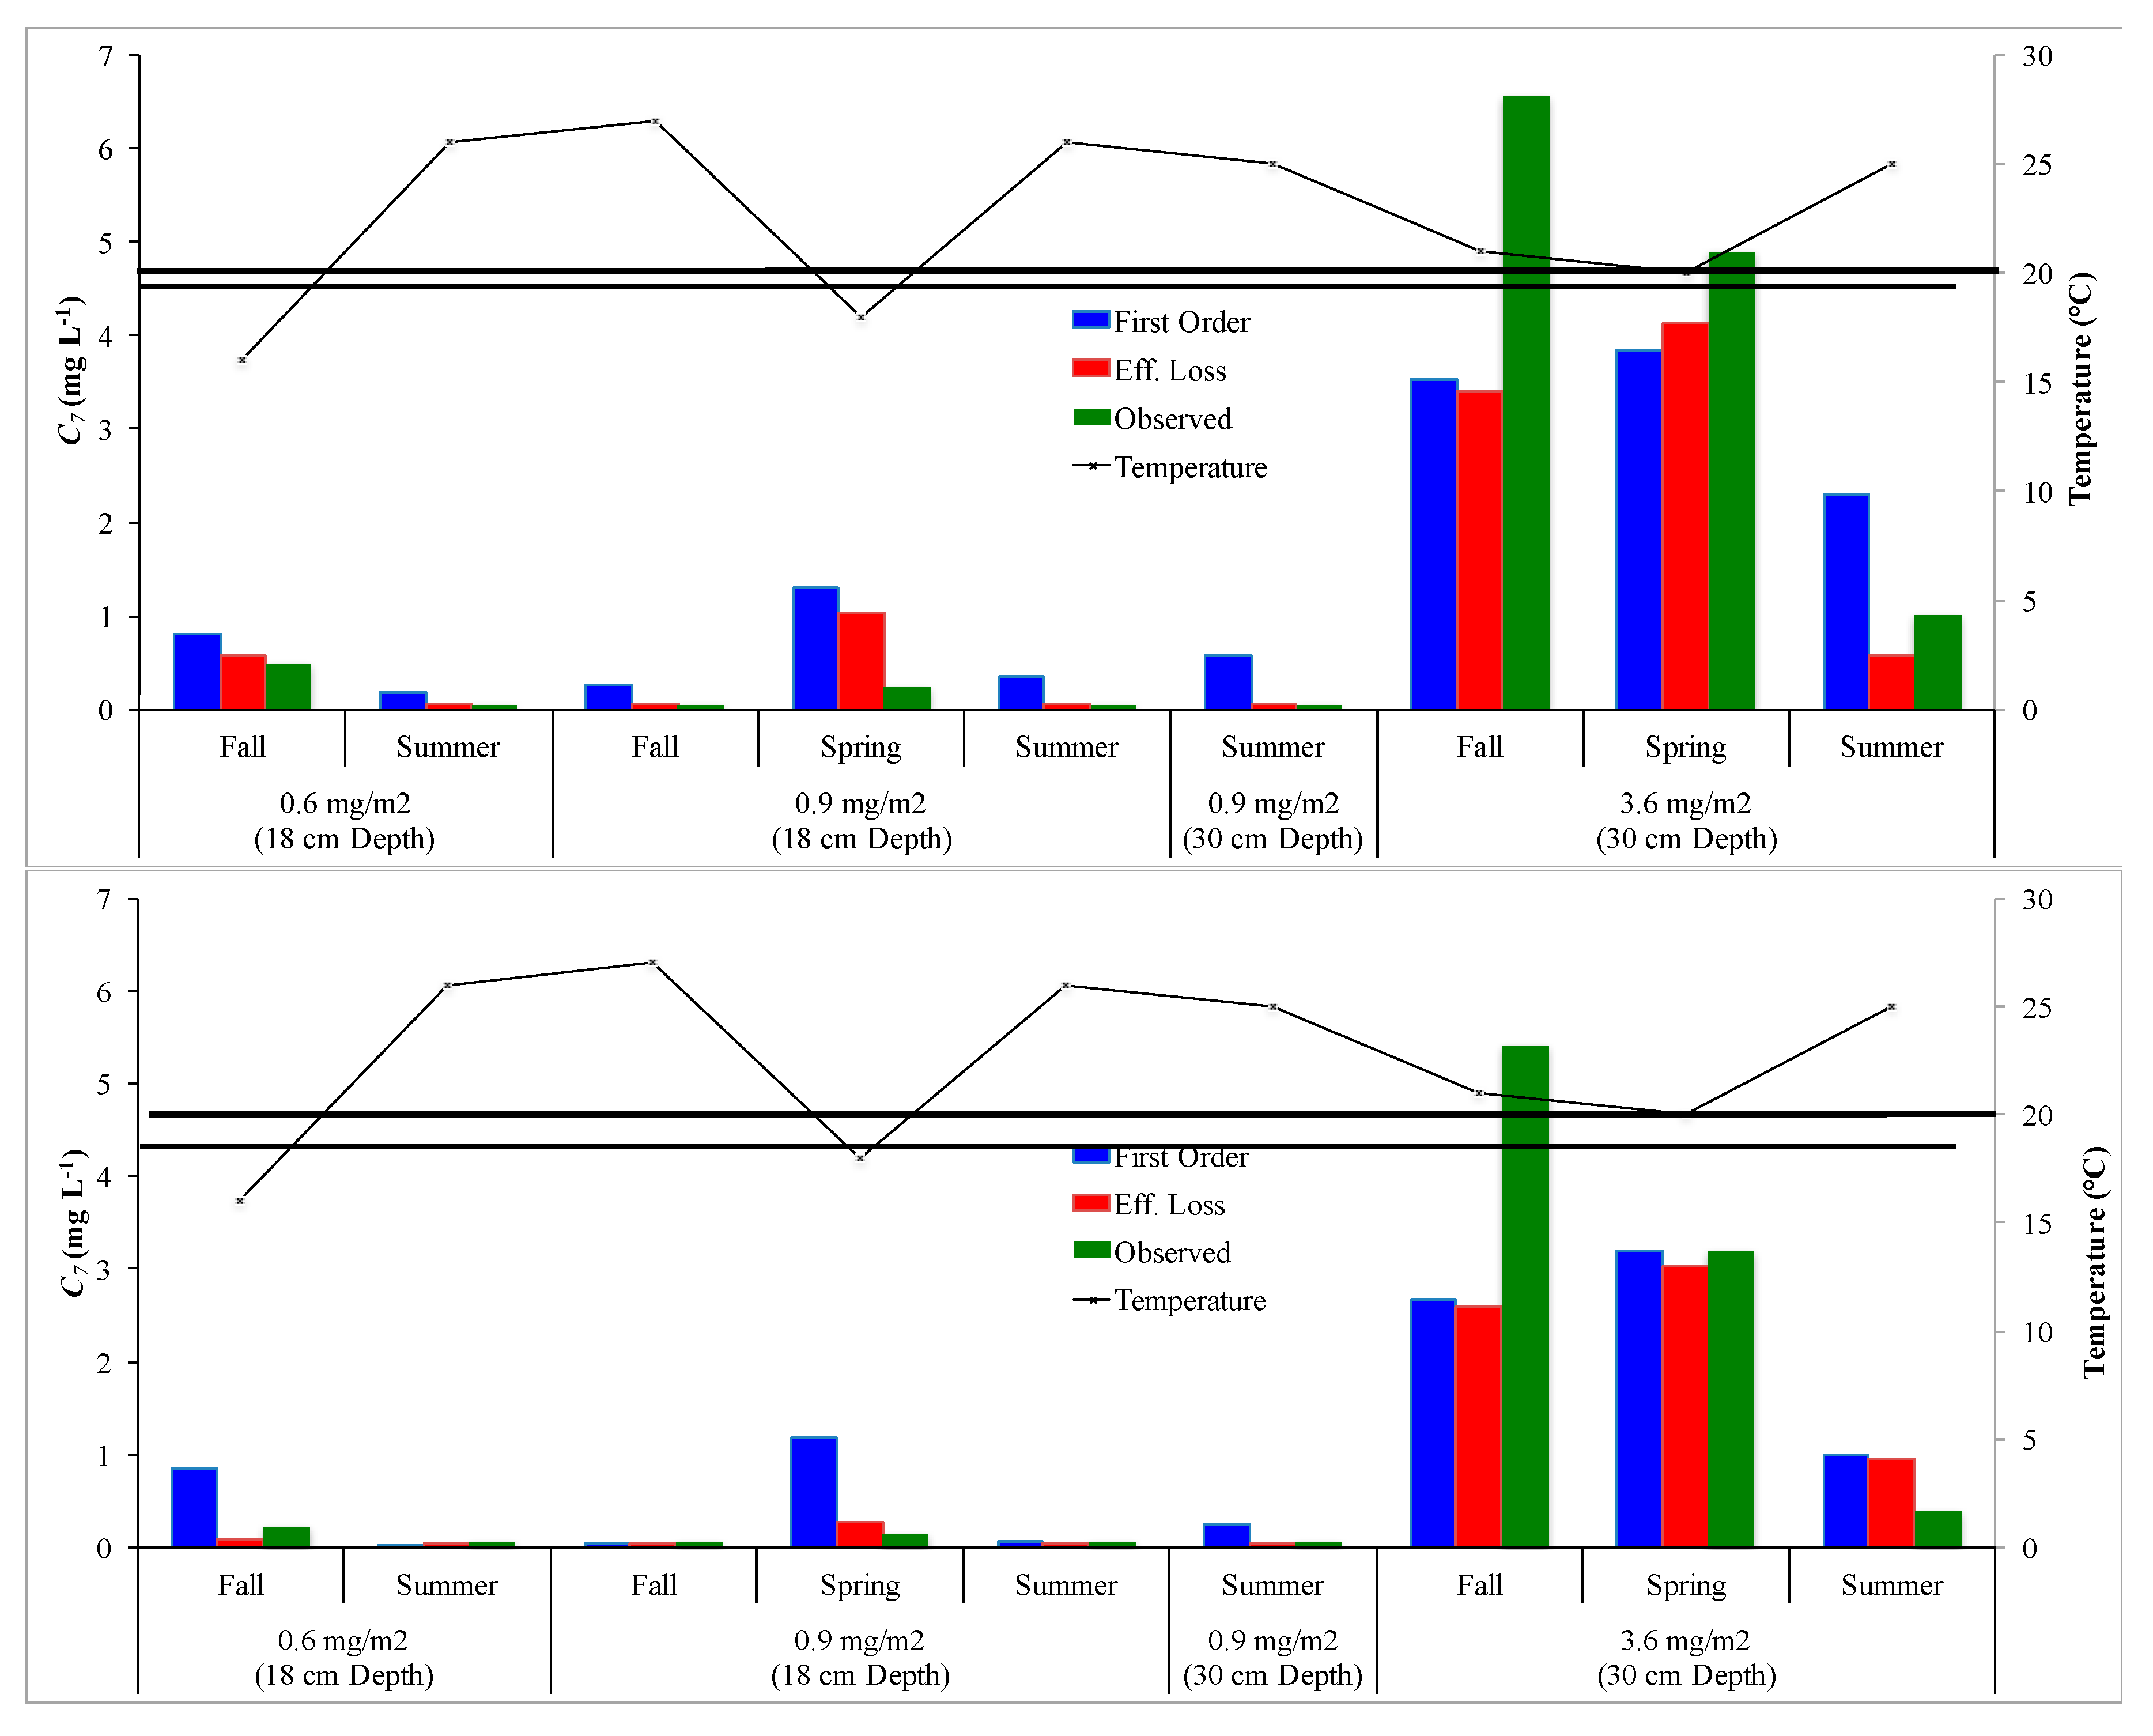
Additionally, to further examine the prediction power of the first order and efficiency loss models, the predicted C7 values (NO3-N concentrations after 7 days within the wetland mesocosm) for the first order decay and efficiency loss models were examined and compared to observed NO3-N concentrations for the 9 batch run experiments used for validation (Figure 4).
The efficiency loss model under predicted observed day 7 NO3-N concentrations on average by 0.38 mg L−1, with a maximum under prediction of 3.15 mg L−1 and over prediction of 0.79 mg L−1 in the WET-Org systems. In comparison, also in the WET-Org systems, the first order decay model under predicted observed day 7 NO3-N concentrations on average 0.03 mg L−1, with a maximum under prediction of 3.03 mg L−1 and over prediction of 1.28 mg L−1. Similarly, the efficiency loss model in the WET-Min system under predicted observed NO3-N concentrations on average 0.27 mg L−1, with a maximum under prediction of 2.81 mg L−1 and over prediction of 0.57 mg L−1. The first order decay model in the WET-Min systems under predicted NO3-N concentrations on average 0.03 mg L−1, with a maximum under prediction of 2.72 mg L−1 and over prediction of 1.04 mg L−1. Therefore, based on the assessment, both the first order decay model had a tendency to over predict NO3-N concentrations at lower NO3-N concentrations (< 3 to 4 mg L−1), while both models typically under predicted NO3-N concentrations at higher NO3-N concentrations values (> 3 to 4 mg L−1), which was consistent with model results in Figure 3.
Model fits between predicted and observed NO3-N removal rates in both the first order decay and efficiency loss models were similar (Figure 2). However, in the efficiency loss model the α constant must be empirically calculated for several batch runs to be accurately determined for alternative systems than the ones evaluated in this study, which is often not practical for wetland designers. Additionally, the first order decay model is expected to provide slightly more conservative predictions than the efficiency loss model particularly during the growing season when water retention times are most critical for wetland tree survival. Therefore, the first order decay model was determined as the most suitable prediction model for NO3-N removal rates to be used in the design of these future wetland restoration systems.
4.2. Theoretical Wetland Predictions
To demonstrate the use of the first order decay NO3-N removal model determined at the mesocosm scale in this study, an initial estimate of the maximum hydrologic loading capacity for two future 210 ha wetland restorations (with the modeled soil types) were conducted. The sites were expected to receive agricultural drainage with NO3-N concentrations on average of 2.5 mg L−1. Possible target NO3-N effluent concentrations considered were 0.1 mg L−1 (96% reduction), 0.5 mg L−1 (80% reduction), 1.0 mg L−1 (60% reduction), and 1.75 mg L−1 (30% reduction). The maximum acceptable hydrologic loading rates for the wetlands to achieve these target effluent concentrations were determined across a range of average water temperatures.
Based on the estimated removal rates, the maximum loading rates of agricultural drainage water that could be applied were determined to meet the range of target outflow concentrations at the outlet of wetland areas (Ceff) utilizing the following equation [24,68]:
where L is the maximum loading rate into the wetland (m d−1), Ceff is the effluent NO3-N concentration (mg L−1), Cin is the influent NO3-N concentration (mg L−1), T is the temperature (°C), ρ20 is the NO3-N mass transfer coefficient (0.049 m d−1 and 0.041 m d−1 for the WET-Min and WET-Org systems, respectively) at 20 °C, n is the porosity (approximately 0.95 in surface flow wetlands), and θ (1.15 and 1.09 for the WET-Min and WET-Org systems, respectively). The ρ20 and θ were values determined by fitting observed data from the mesocosm batch experiments to first order decay model (Table 4).
Maximum hydrologic loading capacities for the two wetland systems for the various NO3-N removal goals and average water temperatures can be found in Table 5. Based on an aggressive 96% removal goal, the wetland restorations similar to the WET-Min and WET-Org mesocosm systems were predicted to have the capability to receive 1.5 and 1.2 cm day−1 of drainage water, respectively, assuming the drainage water has NO3-N concentrations of 2.5 mg L−1 and an average water temperature of 20 °C. Current local rules developed for watersheds such as the Neuse and Tar-Pamlico in North Carolina require non-point source N pollution to be reduced by only 30%. If this were the treatment goal, and under the same assumptions described earlier, wetland restorations similar to the WET-Min and WET-Org mesocosm systems would have the capacity to receive up to 13.1 and 10.8 cm day−1 of drainage water, respectively, to meet the target NO3-N removal threshold.
5. Conclusions
In this study, the potential removal rates of NO3-N for two distinct pulse flow wetland environments slated to receive agricultural drainage water in future wetland restoration projects were evaluated at the mesocosm scale. Three kinetic models that are often utilized to predict NO3-N removal rates within wetland systems and one that has never been evaluated (efficiency loss) were assessed. Based on the results of this study, the following conclusions were drawn:
- The first order decay and efficiency loss kinetic models provided stronger statistical agreement between predicted and measured NO3-N removal rates compared to other models.
- The first order decay model was determined the most practical model due to its conservative predictions, simplicity, and reasonable fit compared to the efficiency loss model, NO3-N removal rates developed at the mesocosm scale have also been reported to be conservative estimates for full-scale wetlands. Therefore, the first order decay model should provide reasonable but conservative predictions of NO3-N removal rates, particularly if maximum residence times are limited, such as to ensure tree survivability during the growing season in restored forested wetlands.
- ρ20 values determined for the first order decay model for NO3-N removal in the WET-Min and WET-Org wetland mesocosms were 4.9 cm d−1 and 4.1 cm d−1. θ values were estimated to be 1.15 and 1.09 for the WET-Min and WET-Org systems, respectively. These values can be used to develop informed water management plans for the restoration sites. This is important to ensure the wetlands are not loaded with NO3-N that exceeds their assimilation capacity; a situation that would lead to higher NO3-N export and possible unintended eutrophication of downstream water bodies.
Acknowledgments
The project was supported with funds provided by the North Carolina Sea Grant and the Water Resources Research Institute of the University of North Carolina Research Grant. Additionally, the research described in this article has been funded in part by the United State Protection Agency (EPA) under the Science to Achieve Results (STAR) Graduate Fellowship Program. EPA has not officially endorsed this publication and the views expressed herein may not reflect the views of the EPA. Collaborators that made this project possible include Wilson Daughtry, the North Carolina Coastal Federation (NCCF), Mattamuskeet Drainage Association, U.S. Fish and Wildlife Service (USFWS), and Natural Resource Conservation Service (NRCS). Special thanks to Maggie Rabiipour, Mary Curtis, Randall Etheridge, Yo-Jin Shiau, Jacob Wiseman, Kathleen Bell, L.T. Woodlief, and Nicole Mathis for field assistance.
Author Contributions
Tiffany L. Messer and Michael R. Burchell conceived and designed the experiments; Tiffany L. Messer performed the experiments, analyzed the data, and drafted the manuscipt; François Bírgand contributed to the delvelopment of the modeling methods and analysis; Tiffany L. Messer, Michael R. Burchell and François Bírgand all provided significant conributions to the interpretation of the results and various editions of the manuscript.
Conflicts of Interest
The authors declare no conflict of interest. The founding sponsors had no role in the design of the study; in the collection, analyses, or interpretation of data; in the writing of the manuscript, and in the decision to publish the results.
References
- Rudd, M.A.; Fleishman, E. Policymakers’ and Scientists’ Ranks of Research Priorities for Resource-Management Policy. Bioscience 2014, 64, 219–228. [Google Scholar] [CrossRef]
- Fleishman, E.; Blockstein, D.E.; Hall, J.A.; Mascia, M.B.; Rudd, M.A.; Scott, J.M.; Sutherland, W.J.; Bartuska, A.M.; Brown, A.G.; Christen, C.A.; et al. Top 40 Priorities for Science to Inform US Conservation and Management Policy. Bioscience 2011, 61, 290–300. [Google Scholar] [CrossRef]
- US EPA. Nonpoint Source Pollution: The Nation’s Largest Water Quality Problem; U.S. Environmental Protection Agency: Washington, DC, USA, March 1996.
- Zedler, J.B.; Kercher, S. Wetland Resources: Status, Trends, Ecosystem Services, and Restorability. Annu. Rev. Environ. Resour. 2005, 30, 39–74. [Google Scholar] [CrossRef]
- Zedler, J.B. Wetlands at Your Service: Reducing Impacts of Agriculture at the Watershed Scale. Front. Ecol. Environ. 2012, 1, 65–72. [Google Scholar] [CrossRef]
- Dahl, T.E.; Allord, G.J. Technical Aspects of Wetlands: History of Wetlands in the Conterminous United States. Natl. Water Summ. Wetl. Resour. Tech. Asp. Wetl. 1996, 2425, 19–26. [Google Scholar]
- US EPA. Nutrient Policy and Data: Commercial Fertilizer Purchased; U.S. Environmental Protection Agency: Washington, DC, USA, 2012.
- Hong, B.; Swaney, D.P.; Howarth, R.W. Estimating net anthropogenic nitrogen inputs to U.S. watersheds: Comparison of methodologies. Environ. Sci. Technol. 2013, 47, 5199–5207. [Google Scholar] [CrossRef] [PubMed]
- Carnicer, J.; Sardans, J.; Stefanescu, C.; Ubach, A.; Bartrons, M.; Asensio, D.; Peñuelas, J. Global biodiversity, stoichiometry and ecosystem function responses to human-induced C-N-P imbalances. J. Plant Physiol. 2015, 172, 82–91. [Google Scholar] [CrossRef] [PubMed]
- Ribaudo, M.; Delgado, J.; Hansen, L.; Livingston, M.; Mosheim, R.; Williamson, J. Nitrogen in Agricultural Systems: Implications For Conservation Policy; ERR-127; U.S. Department of Agriculture: Quilcene, WA, USA, 2011.
- Matson, P.A.; Parton, W.; Power, A.; Swift, M. Agricultural intensification and ecosystem properties. Science 1997, 277, 504–509. [Google Scholar] [CrossRef] [PubMed]
- Vitousek, P.; Aber, J.D.; Howarth, R.W.; Likens, G.E.; Matson, P.A.; Schindler, D.W.; Schlesinger, W.K.; Tilman, D.G. Human Alteration of the Global Nitrogen Cycle: Sources and Consequences. Ecol. Appl. 1997, 7, 737–750. [Google Scholar] [CrossRef]
- Ardón, M.; Morse, J.L.; Doyle, M.W.; Bernhardt, E.S. The Water Quality Consequences of Restoring Wetland Hydrology to a Large Agricultural Watershed in the Southeastern Coastal Plain. Ecosystems 2010, 13, 1060–1078. [Google Scholar] [CrossRef]
- Chescheir, G.M.; Gilliam, J.W.; Skaggs, R.W.; Broadhead, R.G. Nutrient and sediment removal in forested wetlands receiving pumped agricultural drainage water. Wetlands 1991, 11, 87–103. [Google Scholar] [CrossRef]
- Bruland, G.L.; Richardson, C.J. Comparison of soil organic matter in created, restored and paired natural wetlands in North Carolina. Wetl. Ecol. Manag. 2006, 14, 245–251. [Google Scholar] [CrossRef]
- Arheimer, B.; Wittgren, H.B. Modelling nitrogen removal in potential wetlands at the catchment scale. Ecol. Eng. 2002, 19, 63–80. [Google Scholar] [CrossRef]
- Woltemade, C.J. Ability of Restored Wetlands to Reduce Nitrogen and Phosphorus Concentrations in Agricultural Drainage Water. J. Soil Water Conserv. 2000, 55, 303–309. [Google Scholar]
- Saeed, T.; Sun, G. A review on nitrogen and organics removal mechanisms in subsurface flow constructed wetlands: Dependency on environmental parameters, operating conditions and supporting media. J. Environ. Manag. 2012, 112, 429–448. [Google Scholar] [CrossRef] [PubMed]
- Saeed, T.; Sun, G. Kinetic modelling of nitrogen and organics removal in vertical and horizontal flow wetlands. Water Res. 2011, 45, 3137–3152. [Google Scholar] [CrossRef] [PubMed]
- Kadlec, R.H. Nitrate dynamics in event-driven wetlands. Ecol. Eng. 2010, 36, 503–516. [Google Scholar] [CrossRef]
- Lee, C.; Fletcher, T.D.; Sun, G. Nitrogen removal in constructed wetland systems. Eng. Life Sci. 2009, 9, 11–22. [Google Scholar] [CrossRef]
- Comín, F.A.; Sorando, R.; Darwiche-Criado, N.; García, M.; Masip, A. A protocol to prioritize wetland restoration and creation for water quality improvement in agricultural watersheds. Ecol. Eng. 2014, 66, 10–18. [Google Scholar] [CrossRef]
- Kumar, J.L.G.; Zhao, Y.Q. A review on numerous modeling approaches for effective, economical and ecological treatment wetlands. J. Environ. Manag. 2011, 92, 400–406. [Google Scholar] [CrossRef] [PubMed]
- Burchell, M.R.; Skaggs, R.W.; Lee, C.R.; Broome, S.; Chescheir, G.M.; Osborne, J. Substrate organic matter to improve nitrate removal in surface-flow constructed wetlands. J. Environ. Qual. 2007, 36, 194–207. [Google Scholar] [CrossRef] [PubMed]
- Karpuzcu, M.E.; Stringfellow, W.T. Kinetics of nitrate removal in wetlands receiving agricultural drainage. Ecol. Eng. 2012, 42, 295–303. [Google Scholar] [CrossRef]
- Kadlec, R.H. The inadequacy of first-order treatment wetland models. Ecol. Eng. 2000, 15, 105–119. [Google Scholar] [CrossRef]
- Chapman, M.G.; Underwood, Z.J. The need for practical scientific protocol to measure successful restoration. Wetl. Aust. J. 2000, 19, 28–49. [Google Scholar]
- Ahn, C.; Mitsch, W.J. Scaling considerations of mesocosm wetlands in simulating large created freshwater marshes. Ecol. Eng. 2002, 18, 327–342. [Google Scholar] [CrossRef]
- Bachand, P.A.M.; Horne, A.J. Denitrification in constructed free-water surface wetlands: II. Effects of vegetation and temperature. Ecol. Eng. 1999, 14, 17–32. [Google Scholar] [CrossRef]
- Kangas, P.; Adey, W. Mesocosms and ecological engineering. Ecol. Eng. 1996, 6, 1–5. [Google Scholar] [CrossRef]
- US EPA. National Estuary Program Costal Condition Report—NEP CCR Factsheet: Chapter 4; U.S. Environmental Protection Agency: Washington, DC, USA, 2007.
- Adame, M.F.; Hermoso, V.; Perhans, K.; Lovelock, C.E.; Herrera-Silveira, J.A. Selecting cost-effective areas for restoration of ecosystem services. Conserv. Biol. 2015, 29, 493–502. [Google Scholar] [CrossRef] [PubMed]
- Kadlec, R.H.; Tanner, C.C.; Hally, V.M.; Gibbs, M.M. Nitrogen spiraling in subsurface-flow constructed wetlands: Implications for treatment response. Ecol. Eng. 2005, 25, 365–381. [Google Scholar] [CrossRef]
- Messer, T.L.; Burchell, M.R.; Birgand, F.; Broome, S.W.; Chescheir, G.M. Nitrate removal potential of restored wetlands loaded with agricultural drainage water: A mesocosm scale experimental approach. Ecol. Eng. 2017, 106, 541–554. [Google Scholar] [CrossRef]
- Shih, S.S.; Zeng, Y.Q.; Lee, H.Y.; Otte, M.L.; Fang, W.T. Tracer experiments and hydraulic performance improvements in a treatment pond. Water 2017, 9, 1–16. [Google Scholar] [CrossRef]
- Bachand, P.A.M. Effects of Managing Vegetative Species, Hydraulic Retention Time, Wetland Age and Water Depth on Removing Nitrate from Nitrified Wastewater in Constructed Wetland Macrocosms in the Prado Basin, Riverside County, California. Ph.D. Dissertation, University of California, Berkeley, CA, USA, 1996. [Google Scholar]
- Turlan, T.; Birgand, F.; Marmonier, P. Comparative use of field and laboratory mesocosms for in-stream nitrate uptake measurement. Ann. Limnol.-Int. J. Limnol. 2007, 43, 41–51. [Google Scholar] [CrossRef]
- Birgand, F.; Aveni-Deforge, K.; Smith, B.; Horstman, M.; Gerling, A.B.; Carey, C.C. First report of a novel multiplexer pumping system coupled to a water quality probe to collect high temporal frequency in situ water chemistry measurements at multiple sites. Limnol. Oceanogr. Methods 2016, 767–783. [Google Scholar] [CrossRef]
- O’Brien, J.M.; Hamilton, S.K.; Podzikowski, L.; Ostrom, N. The fate of assimilated nitrogen in streams: An in situ benthic chamber study. Freshw. Biol. 2012, 57, 1113–1125. [Google Scholar] [CrossRef]
- Bowie, G.L.; Mills, W.B.; Porcella, D.B.; Campbell, C.L.; Pagenkopf, J.R.; Rupp, G.L.; Johnson, K.M.; Chan, P.W.H.; Gherini, S.A. Rates, Constants, and Kinetics Formulations in Surface Water Quality Modeling; US EPA: Athens, GA, USA, 1985.
- Anderson, C.J.; Mitsch, W.J. Effect of Pulsing on Macrophyte Productivity and Nutrient Uptake: A Wetland Mesocosm Experiment. Am. Midl. Nat. 2005, 154, 305–319. [Google Scholar] [CrossRef]
- Horne, A.J. Nitrogen removal from waste treatment pond or activated sludge plant effluents with free-surface wetlands. Water Sci. Technol. 1995, 31, 341–351. [Google Scholar] [CrossRef]
- Bekins, B.A.; Warren, E.; Godsy, E.M. A comparison of zero-order, first order, and Monod biotransformation models. Groundwater 1998, 36, 261–268. [Google Scholar] [CrossRef]
- Bollag, J.M.; Stotzky, G. Soil Biochemisiry; Marcel Dekker, Inc.: New York, NY, USA, 2000; Volume 10. [Google Scholar]
- O’Brien, J.M.; Dodds, W.K.; Wilson, K.C.; Murdock, J.N.; Eichmiller, J. The saturation of N cycling in Central Plains streams: 15N experiments across a broad gradient of nitrate concentrations. Biogeochemistry 2007, 84, 31–49. [Google Scholar] [CrossRef]
- Aumen, N. Concepts and Methods for Assessing Solute Dynamics in Stream Ecosystems A. J. N. Am. Benthol. Soc. 1990, 9, 95–119. [Google Scholar]
- Böhlke, J.K.; Antweiler, R.C.; Harvey, J.W.; Laursen, A.E.; Smith, L.K.; Smith, R.L.; Voytek, M.A. Multi-scale measurements and modeling of denitrification in streams with varying flow and nitrate concentration in the upper Mississippi River basin, USA. Biogeochemistry 2009, 93, 117–141. [Google Scholar] [CrossRef]
- Reddy, K.R.; Patrick, W.H.; Phillips, R.E. The Role of Nitrate Diffusion in Determining the Order and Rate of Denitrification in Flooded Soil: I. Experimental Results. Soil Sci. Soc. Am. J. 1978, 42, 268–272. [Google Scholar] [CrossRef]
- Christensen, S.; Simkins, S.; Tiedje, J.M. Spatial Variation in Denitrification: Dependency of Activity Centers on the Soil Environment. Soil Sci. Soc. Am. J. 1990, 54, 1608. [Google Scholar] [CrossRef]
- RStudio Team. RStudio: Integrated Development for R; RStudio, Inc.: Boston, MA, USA, 2015. [Google Scholar]
- Messer, J.J.; Brezonik, P.L. Laboratory evaluation of kinetic parameters for lake sediment denitrification models. Ecol. Model. 1984, 21, 277–286. [Google Scholar] [CrossRef]
- Stringfellow, W.T.; Karpuzcu, M.E.; Spier, C.; Hanlon, J.S.; Graham, J. Sizing mitigation wetlands in agricultural watersheds. Water Sci. Technol. 2013, 67, 40–46. [Google Scholar] [CrossRef] [PubMed]
- Lineweaver, H.; Burk, D. The determination of enzyme dissociation constants. J. Am. Chem. Soc. 1934, 56, 658–666. [Google Scholar] [CrossRef]
- Dzakpasu, M.; Hofmann, O.; Scholz, M.; Harrington, R.; Jordan, S.N.; McCarthy, V. Nitrogen removal in an integrated constructed wetland treating domestic wastewater. J. Environ. Sci. Health A Toxic Hazard. Subst. Environ. Eng. 2011, 46, 742–750. [Google Scholar] [CrossRef] [PubMed]
- Naz, M.; Uyanik, S.; Yesilnacar, M.I.; Sahinkaya, E. Side-by-side comparison of horizontal subsurface flow and free water surface flow constructed wetlands and artificial neural network (ANN) modelling approach. Ecol. Eng. 2009, 35, 1255–1263. [Google Scholar] [CrossRef]
- Youssef, M.A.; Skaggs, R.W.; Chescheir, G.M.; Gilliam, J.W. Field evaluation of a model for predicting nitrogen losses from drained lands. J. Environ. Qual. 2006, 35, 2026–2042. [Google Scholar] [CrossRef] [PubMed]
- Janssen, P.H.M.; Heuberger, P.S.C. Calibration of process-oriented models. Ecol. Model. 1995, 83, 55–66. [Google Scholar] [CrossRef]
- Smith, L.K.; Voytek, M.A.; Böhlke, J.K.; Harvey, J.W. Denitrification in nitrate-rich streams: Application of N2:Ar and 15N-tracer methods in intact cores. Ecol. Appl. 2006, 16, 2191–2207. [Google Scholar] [CrossRef]
- Mulholland, P.J.; Valett, H.M.; Webster, J.R.; Thomas, S.A.; Cooper, L.W.; Hamilton, S.K.; Kellogg, W.K.; Peterson, B.J. Stream denitrification and total nitrate uptake rates measured using a field 15 N tracer addition approach. Limnol. Ocean. 2004, 49, 809–820. [Google Scholar] [CrossRef]
- Puckett, L.J. Hydrogeologic controls on the transport and fate of nitrate in ground water beneath riparian buffer zones: Results from thirteen studies across the United States. Water Sci. Technol. 2004, 49, 47–53. [Google Scholar] [PubMed]
- Gebremariam, S.Y.; Beutel, M.W. Nitrate removal and DO levels in batch wetland mesocosms: Cattail (Typha spp.) versus bulrush (Scirpus spp.). Ecol. Eng. 2008, 34, 1–6. [Google Scholar] [CrossRef]
- Horne, A.J.; Bachand, P.A. Denitrification in constructed free-water surface wetlands: I. Very high nitrate removal rates in a macrocosm study. Ecol. Eng. 2000, 14, 9–15. [Google Scholar]
- Wollheim, W.M.; Harms, T.K.; Peterson, B.J.; Morkeski, K.; Hopkinson, C.S.; Stewart, R.J.; Gooseff, M.N.; Briggs, M.A. Nitrate uptake dynamics of surface transient storage in stream channels and fluvial wetlands. Biogeochemistry 2014, 120, 239–257. [Google Scholar] [CrossRef]
- Rossi, F.; Motta, O.; Matrella, S.; Proto, A.; Vigliotta, G. Nitrate removal from wastewater through biological denitrification with OGA 24 in a batch reactor. Water 2015, 7, 51–62. [Google Scholar] [CrossRef]
- Kadlec, R.H. Constructed Marshes for Nitrate Removal. Crit. Rev. Environ. Sci. Technol. 2012, 42, 934–1005. [Google Scholar] [CrossRef]
- Petru, B.J.; Chescheir, G.M.; Ahn, C. Assessment of water budgets and the hydrologic performance of a created mitigation wetland-A modeling approach. Ecol. Eng. 2014, 71, 667–676. [Google Scholar] [CrossRef]
- Teskey, R.O.; Hinckley, T.M. Impact of Water Level Changes on Woody Riparian and Wetland Communities. Volume 2: Southern Forest Region; U.S. Fish and Wildlife Service: Washington, DC, USA, 1977.
- Reed, S.C.; Brown, D.S. Subsurface Flow Wetlands: A Performance Evaluation. Water Environ. Res. 1995, 67, 244–248. [Google Scholar] [CrossRef]
Figure 1.
Wetland mesocosm laboratory [34].
Figure 1.
Wetland mesocosm laboratory [34].

Figure 2.
Relationship between observed and predicted wetland mesocosm average NO3-N removal rates determined using (a) zero order, (b) First Order Decay, (c) Efficiency Loss, and (d) Monod kinetic models. Rate constants used in calculations were adjusted for daily average water temperature. Statistical acronyms represent: Coefficient of determination (R2), Relative root mean square error (RRMSE), and Model efficiency (MEF)). Kinetic acronyms represent: Zero order (ZO), first order decay (FO), efficiency loss (EL), and Monod (M) models.
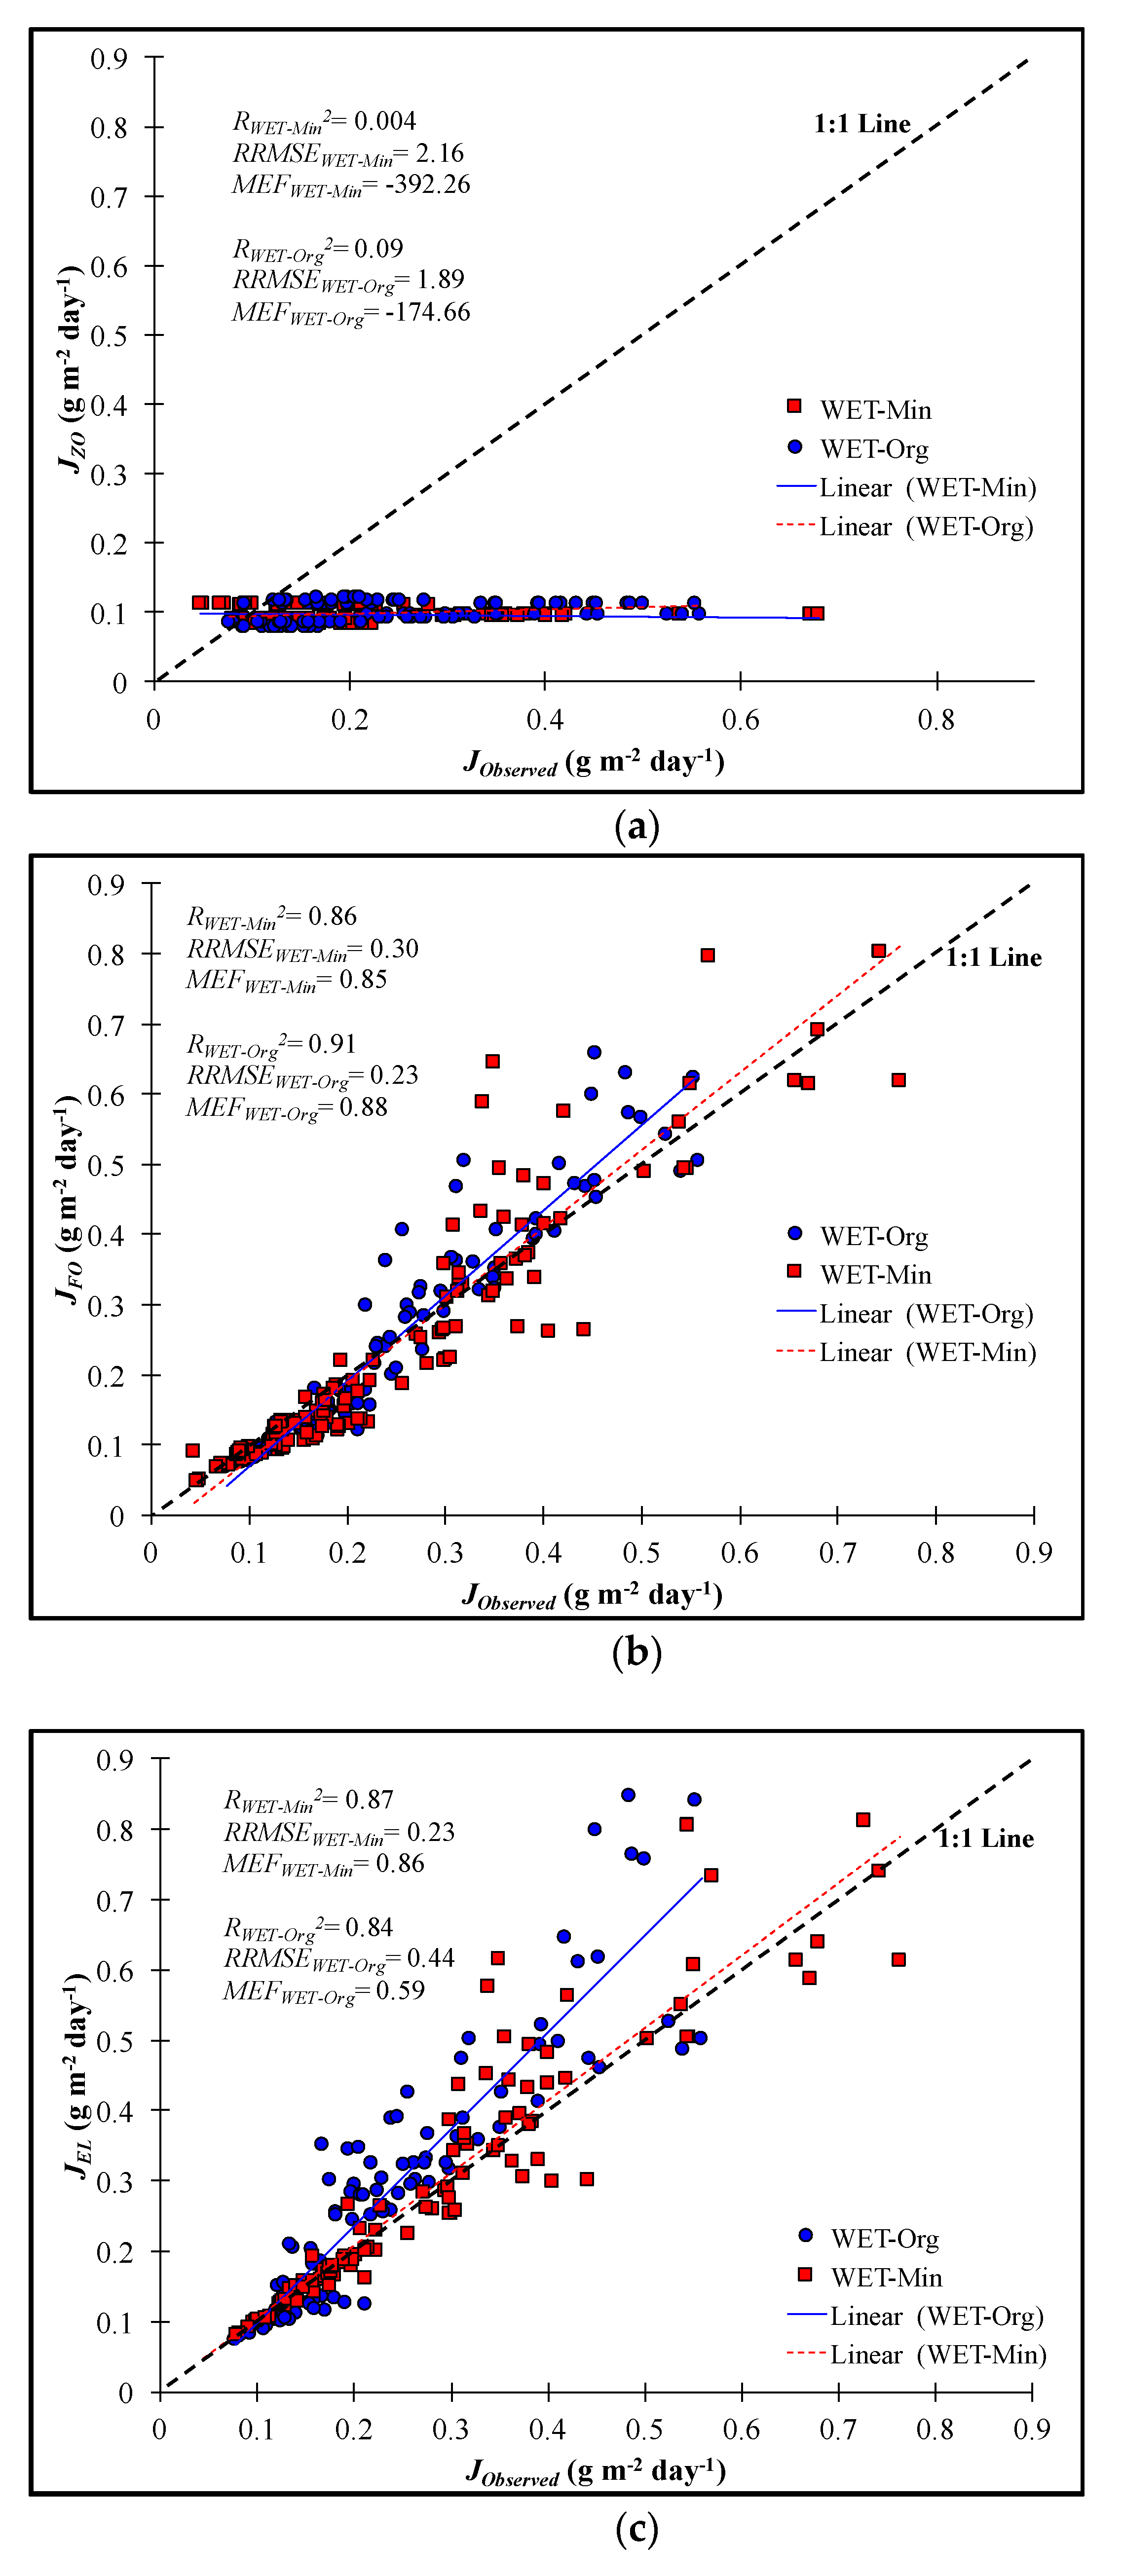
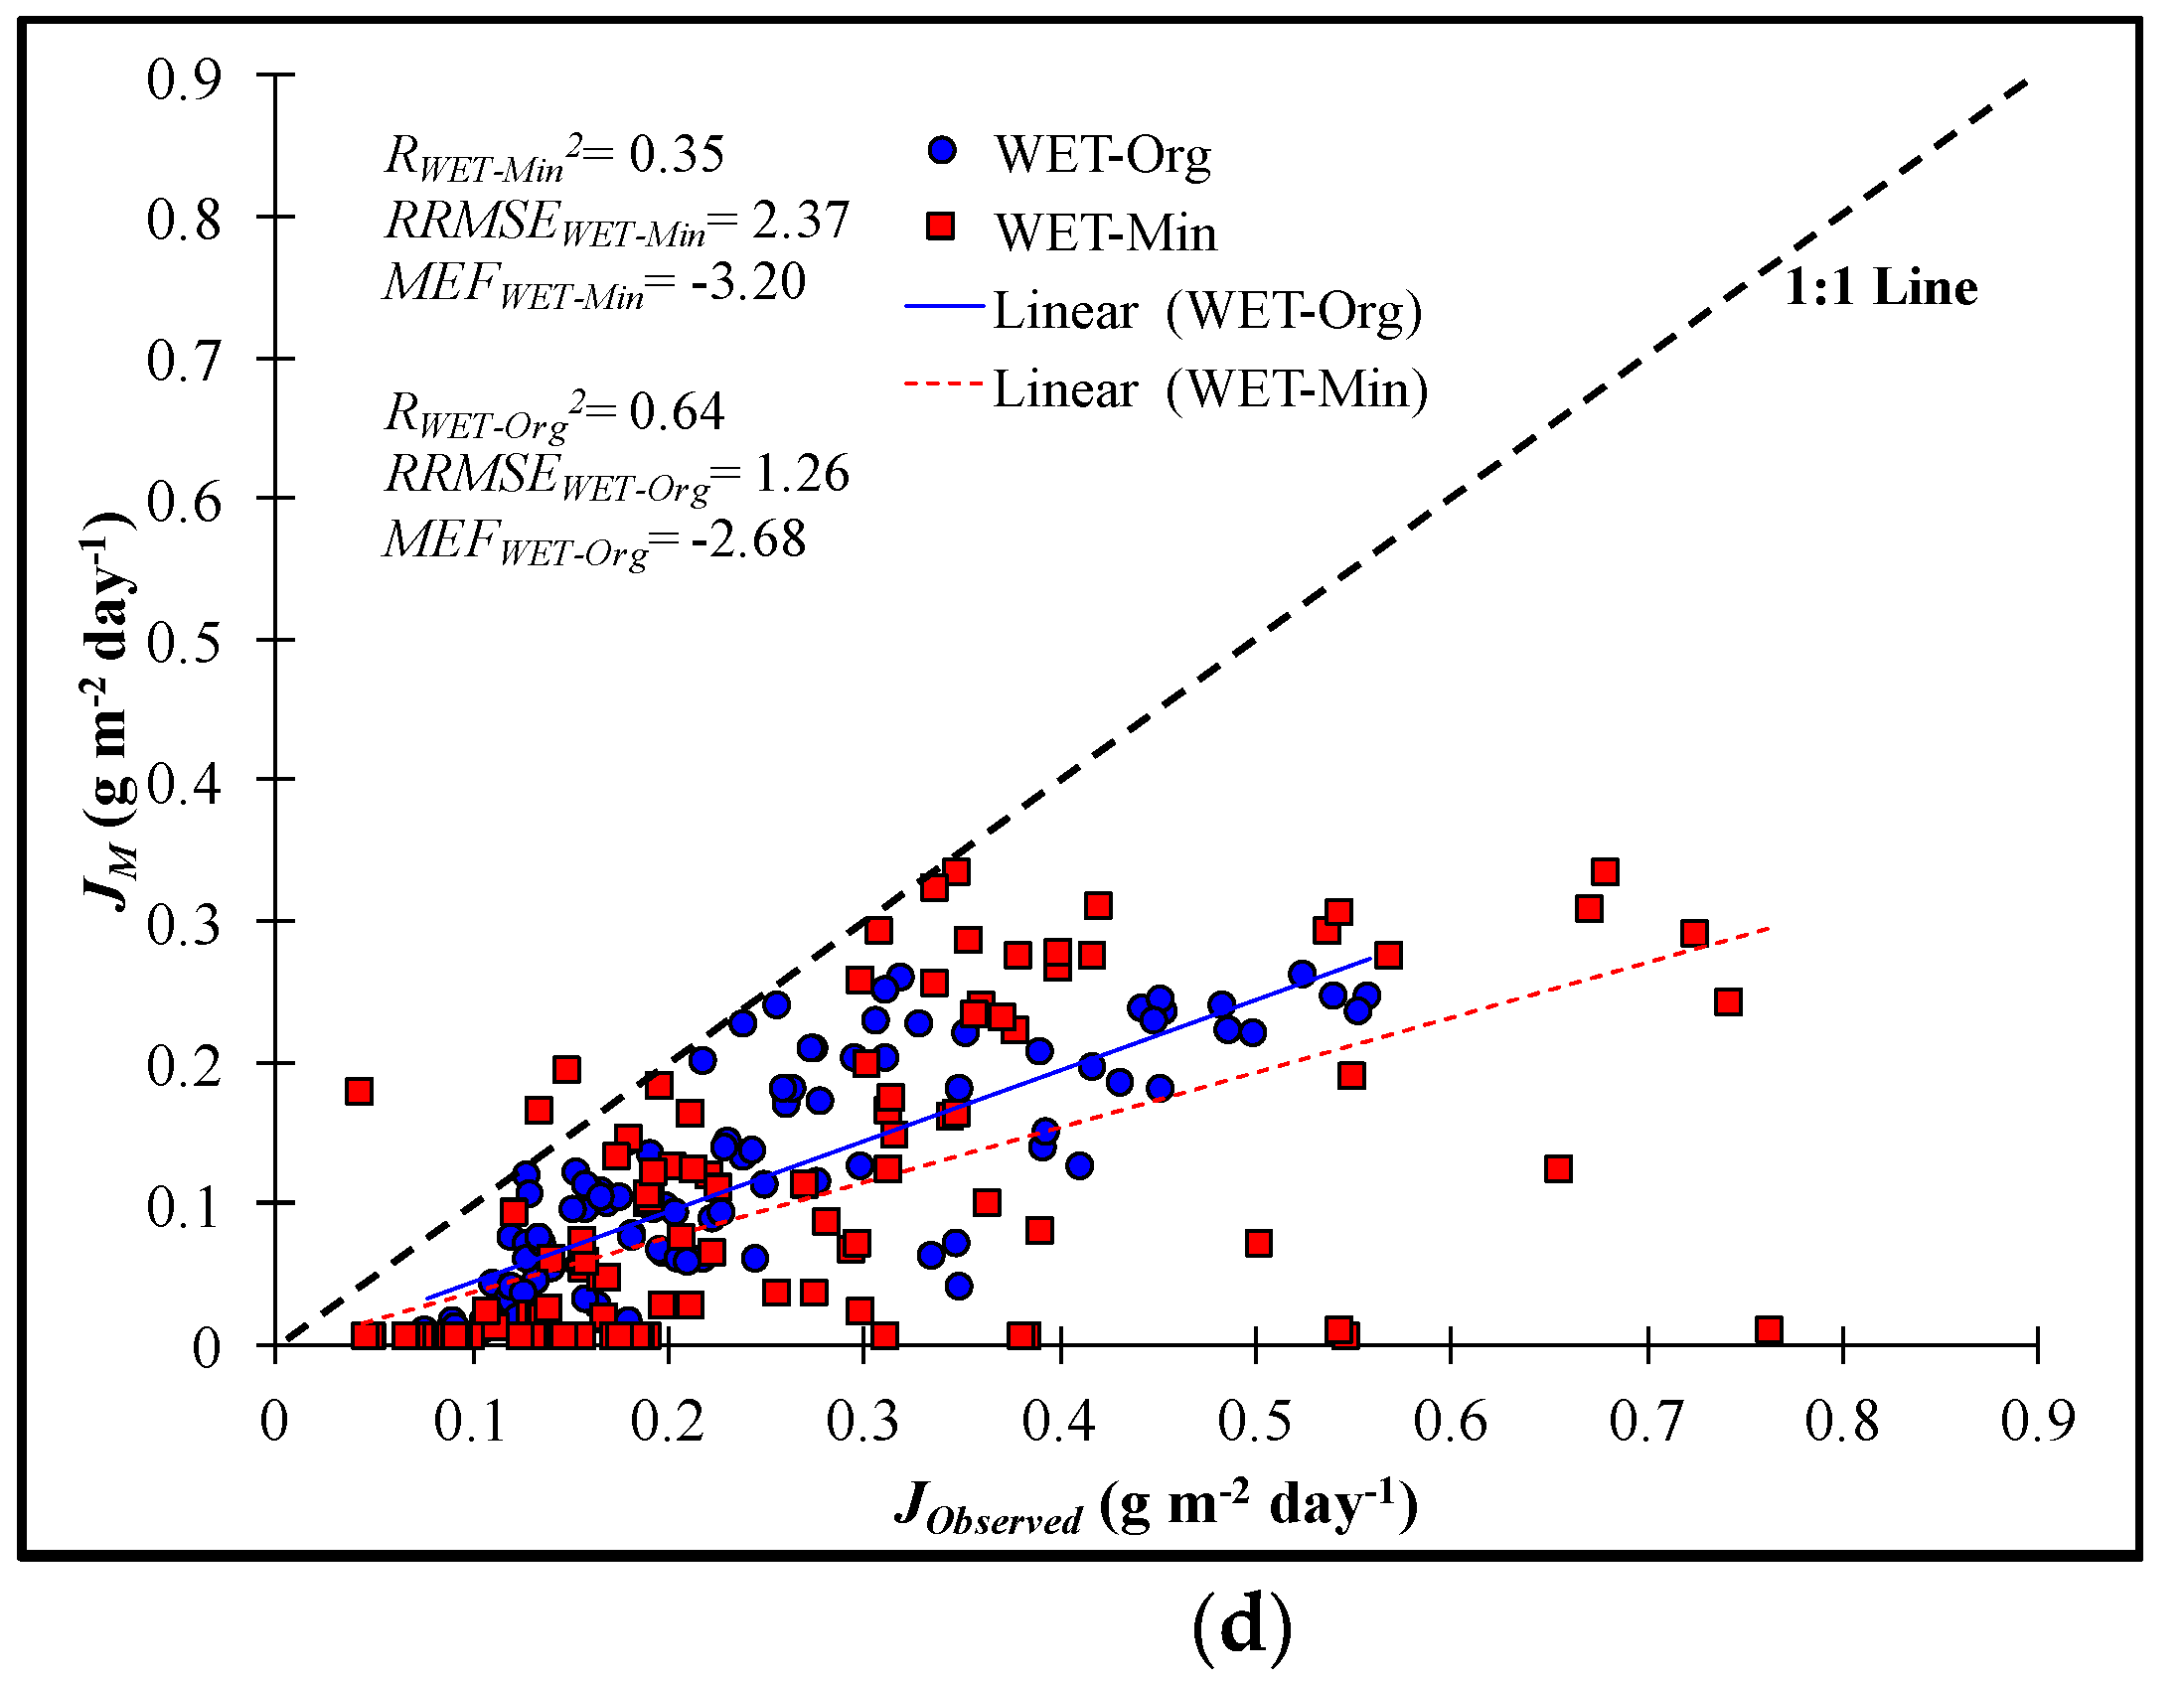
Figure 3.
Regression of the (a) first order decay and (b) efficiency loss kinetic models for correlating predicted and observed NO3-N removal rates for the WET-Org and WET-Min restored wetland mesocosm systems.
Figure 3.
Regression of the (a) first order decay and (b) efficiency loss kinetic models for correlating predicted and observed NO3-N removal rates for the WET-Org and WET-Min restored wetland mesocosm systems.

Figure 4.
Predicted C7 values (NO3-N concentrations after 7 days within the wetland mesocosm) for the first order decay model, efficiency loss model, and observed NO3-N concentrations in the WET-Org (top) and WET-Min (bottom) restored wetland systems during the 9 batch run experiments used for model validation. Black line designates an average water temperature of 20 °C.


Table 1.
Summary of wetland mesocosm batch experiments [34].
Table 1.
Summary of wetland mesocosm batch experiments [34].
| Season | Date | Experiment Period | Average Daily Water Temperature | Water Depth Prior to Loading | Water Depth after Loading | Target NO3-N | Target NO3-N Load |
|---|---|---|---|---|---|---|---|
| Day/Month/Year | Days | °C | cm | mg L−1 | g N m−2 | ||
| Fall a | 25/9–4/10/12 | 10 | 22 | 4 | 30 | 2.5 | 0.9 |
| Fall a | 16/10–26/10/12 | 10 | 17 | 4 | 18 | 5 | 0.9 |
| Fall a | 5/11–15/11/12 | 10 | 11 | 18 | 30 | 10 | 2.2 |
| Fall b | 24/9–4/10/13 | 10 | 21 | 4 | 30 | 10 | 3.6 |
| Fall b | 15/10–25/10/13 | 10 | 16 | 4 | 18 | 2.5 | 0.6 |
| Fall b | 2/9–9/9/14 | 7 | 27 | −5 † | 20 | 2.5 | 0.9 |
| Winter a | 22/1–1/2/13 | 10 | 9 | 4 | 15 | 2.5 | 0.6 |
| Winter a | 11/2–21/2/13 | 10 | 11 | 4 | 18 | 5 | 0.9 |
| Spring a | 28/5–7/6/13 | 10 | 25 | 4 | 18 | 2.5 | 0.6 |
| Spring b | 8/4–18/4/14 | 10 | 18 | 4 | 18 | 5 | 0.9 |
| Spring b | 21/4–1/5/14 | 10 | 20 | 4 | 30 | 10 | 3.6 |
| Spring b | 27/5–6/6/14 | 10 | 25 | 4 | 30 | 2.5 | 0.9 |
| Summer a | 2/7–12/7/13 | 10 | 27 | 4 | 30 | 2.5 | 0.9 |
| Summer a | 6/8–16/8/13 | 10 | 27 | 4 | 30 | 5 | 2.0 |
| Summer a | 20/8–27/8/13 | 7 | 25 | 4 | 30 | 2.5 | 0.9 |
| Summer b | 13/6–20/6/14 | 7 | 26 | 4 | 18 | 2.5 | 0.6 |
| Summer b | 22/7–1/8/14 | 10 | 26 | 4 | 30 | 10 | 3.6 |
| Summer b | 12/8–19/8/14 | 7 | 25 | 4 | 18 | 5 | 0.9 |
Notes: † Negative value indicates water level below wetland surface; a Mesocosms batch experiments used for model calibration; b Mesocosms batch experiments used for model validation.
| Acronym | Parameter | Definition | Range | Increased Strength as Approaches: | Equation |
|---|---|---|---|---|---|
| R2 | Coefficient of determination: | Measures the extent of linear correlation between two datasets. | 0–1 | 1 | |
| RRMSE | Relative root mean square error: | Measures the differences between the predicted and the measured values. | 0–∞ | 0 | |
| MEF | Model efficiency: | Measures the variations accounted for by the model. | −∞ to 1 | 1 |
Pi = predicted dataset; Oi = observed dataset; , = mean values of P, O datasets, n = # of evaluated batch runs.
Table 3.
Summary of selected water quality parameters during batch experiments and NO3-N removal rate means ± standard deviations (SD).
Table 3.
Summary of selected water quality parameters during batch experiments and NO3-N removal rate means ± standard deviations (SD).
| Season | Mean Water Temperature | Water Depth | Load | Mean NO3-N (Initial–Final) | Time Required to Achieve Reported % Reduction | Mean NO3-N % Reduction | JNN ± SD (Min to Max Between Daily Sampling) | JNN ± SD (Average for Day 0 to Final Sampling Day) | |||||
|---|---|---|---|---|---|---|---|---|---|---|---|---|---|
| WET-Min | WET-Org | WET-Min | WET-Org | WET-Min | WET-Org | WET-Min | WET-Org | WET-Min | WET-Org | ||||
| °C | cm | g m−2 d−1 | ---------------mg L−1------------ | --------------d--------------- | ----------------%-------------- | -----------mg m−2 d−1---------- | -----------mg m−2 d−1---------- | ||||||
| Fall 2013 | 18 | 18 | 0.6 | 3.56–0.22 | 3.56–0.14 | 7 † | 10 | 94 | 96 | 49 to 162 | 33 to 214 | 134 ± 4 | 103 ± 18 |
| Winter 2013 | 9 | 15 | 0.6 | 2.28–1.02 | 2.28–1.00 | 10 | 10 | 55 | 56 | 4 to 88 | 4 to 17 | 14 ± 3 | 13 ± 1 |
| Spring 2013 | 25 | 18 | 0.6 | 3.45–0.89 | 3.45–0.13 | 3 † | 7 † | 74 | 96 | 37 to 194 | 17 to 153 | 116 ± 21 | 72 ± 3 |
| Summer 2014 | 26 | 18 | 0.6 | 3.38–0.13 | 3.38–0.53 | 3.3 † | 3.3 † | 96 | 84 | 57 to 153 | 85 to 197 | 183 ± 38 | 127 ± 6 |
| Fall 2012 | 17 | 18 | 0.9 | 4.7–0.91 | 5.00–0.99 | 10 | 10 | 81 | 80 | 36 to 117 | 15 to 127 | 69 ± 13 | 59 ± 16 |
| Winter 2013 | 11 | 18 | 0.9 | 6.13–2.63 | 6.13–2.94 | 10 | 10 | 57 | 52 | 23 to 99 | 18 to 212 | 56 ± 15 | 42 ± 14 |
| Spring 2014 | 20 | 18 | 0.9 | 6.02–0.14 | 6.02–0.23 | 6.9 † | 6.9 † | 98 | 96 | 46 to 148 | 12 to 346 | 127 ± 28 | 88 ± 16 |
| Summer 2014 | 26 | 18 | 0.9 | 6.49–0.35 | 6.49–0.10 | 3 † | 5 † | 95 | 98 | 170 to 451 | 107 to 374 | 322 ± 61 | 215 ± 34 |
| Fall 2012 | 22 | 30 | 0.9 | 2.35–0.15 | 2.35–0.72 | 9 | 9 | 94 | 69 | 46 to 109 | 21 to 86 | 62 ± 9 | 63 ± 16 |
| Fall 2014 † | 27 | 20 | 0.9 | 3.25–0.33 | 3.25–0.09 | 3 † | 4.9 † | 90 | 97 | 80 to 349 | 125 to 262 | 275 ± 23 | 173 ± 1 |
| Spring 2014 | 26 | 30 | 0.9 | 3.29–0.11 | 3.29–0.38 | 5 † | 5 † | 97 | 89 | 103 to 276 | 123 to 205 | 216 ± 44 | 164 ± 5 |
| Summer 2013 | 27 | 30 | 0.9 | 3.09–0.36 | 3.09–0.09 | 5 † | 10 | 88 | 97 | 105 to 178 | 57 to 202 | 137 ± 18 | 98 ± 9 |
| Summer 2013 | 25 | 30 | 0.9 | 3.66–0.27 | 3.66–0.27 | 6.8 † | 6.8 † | 93 | 93 | 4 to 274 | 76 to 242 | 144 ± 4 | 144 ± 5 |
| Fall 2012 | 11 | 30 | 2.2 | 6.44–3.41 | 6.52–3.17 | 10 | 10 | 47 | 51 | 32 to 88 | 6 to 281 | 45 ± 2 | 176 ± 12 |
| Summer 2013 | 27 | 30 | 2.0 | 3.66–0.27 | 6.64–1.01 | 6.9 † | 6.9 † | 95 | 85 | 138 to 452 | 119 to 373 | 283 ± 17 | 212 ± 31 |
| Fall 2013 | 16 | 30 | 3.6 | 14.32–2.84 | 14.32–4.47 | 10.2 | 10.2 | 80 | 69 | 186 to 388 | 115 to 298 | 316 ± 2 | 260 ± 40 |
| Spring 2014 | 25 | 30 | 3.6 | 11.88–1.19 | 11.88–3.19 | 10.1 | 10.1 | 90 | 73 | 175 to 453 | 146 to 400 | 288 ± 14 | 234 ± 5 |
| Summer 2014 | 25 | 30 | 3.6 | 12.97–0.38 | 12.97–1.01 | 7 † | 9.9 | 97 | 92 | 171 to 868 | 198 to 452 | 603 ± 140 | 344 ± 8 |
Note: † % reduction was 100% on the following sampling day.
Table 4.
List of areal NO3-N removal rate coefficients and efficiency loss constants (α) for average water temperature of 20 °C [19,24,42,61,63].
| Wetland System | Initial Target Concentration (mg L−1) | NO3-N Removal Rate Coefficients for T20 | EL Constant (α) (Unitless) | Reference | |||
|---|---|---|---|---|---|---|---|
| JZO (mg m−2 d−1) * [θ: R2] | ρFO (cm d−1) * [θ: R2] | ρEL (cm d−1) * [θ: R2] | Jmax (g m−2 d−1) * [θ: R2] | ||||
| WET-Min | 2.5–15 | 94 ± 11 [1.03 ± 0.10: 0.58 to 0.66] | 4.9 ± 0.8 [1.15 ± 0.02: 0.89 to 0.98] | 10.2 [1.10: 0.72] | 0.50 ± 0.08 [No Correlation] | 0.6 (15 cm depth) 0.7 (30 cm depth) | This study |
| WET-Org | 2.5–15 | 92 ± 8 [1.04 ± 0.01: 0.06 to 0.15] | 4.1 ± 1.0 [1.09 ± 0.06: 0.82 to 0.93] | 8.0 [1.18: 0.67] | 0.38 ± 0.1 [No Correlation] | 0.7 (15 cm depth) 0.7 (30 cm depth) | This study |
| Constructed Treatment Mesocosm | 19 | 2.1–2.9 | Gebremariam and Beutel (2008) | ||||
| Lab Scale Wetland | 0.0–12.1 | 0.25 | Saeed et al., 2011 | ||||
| Surface-Flow Constructed Mesocosm | 32–117 | 5.7–16.5 | Burchell et al., 2007 | ||||
| Fluvial Wetlands | 0.1–3.7 | 3–9.3 | Not Reported | Wollheim et al., 2014 | |||
| Free Surface Constructed Wetlands | 10–26 | 200–5000 | Horne, 1995 | ||||
Note: * [θ: R2] represents the calculated theta and R2 to determine the NO3-N coefficients at average water temperature T = 20 °C.
Table 5.
Predicted maximum hydrologic loading capacities for the future restored wetlands assuming n of 0.95, and Cin of 2.5 mg L−1 using the first order decay kinetic model.
Table 5.
Predicted maximum hydrologic loading capacities for the future restored wetlands assuming n of 0.95, and Cin of 2.5 mg L−1 using the first order decay kinetic model.
| NO3-N % Reduction | 96% | 80% | 60% | 30% | ||||
|---|---|---|---|---|---|---|---|---|
| Target Ceff (mg L−1) | 0.1 | 0.5 | 1.0 | 1.75 | ||||
| Avg. Water Temperature (°C) | WET-Min (cm Day−1) | WET-Org (cm Day−1) | WET-Min (cm Day−1) | WET-Org (cm Day−1) | WET-Min (cm Day−1) | WET-Org (cm Day−1) | WET-Min (cm Day−1) | WET-Org (cm Day−1) |
| 10 | 0.4 | 0.5 | 0.7 | 1.0 | 1.3 | 1.8 | 3.2 | 4.6 |
| 15 | 0.7 | 0.8 | 1.4 | 1.6 | 2.5 | 2.7 | 6.5 | 7.0 |
| 20 | 1.5 | 1.2 | 2.9 | 2.4 | 5.1 | 4.2 | 13.1 | 10.8 |
| 25 | 2.9 | 1.8 | 5.8 | 3.7 | 10.3 | 6.5 | 26.4 | 16.6 |
| 30 | 5.9 | 2.8 | 11.7 | 5.7 | 20.6 | 10.0 | 53.0 | 25.6 |
© 2017 by the authors. Licensee MDPI, Basel, Switzerland. This article is an open access article distributed under the terms and conditions of the Creative Commons Attribution (CC BY) license (http://creativecommons.org/licenses/by/4.0/).
Share and Cite
MDPI and ACS Style
Messer, T.L.; Burchell, M.R.; Bírgand, F. Comparison of Four Nitrate Removal Kinetic Models in Two Distinct Wetland Restoration Mesocosm Systems. Water 2017, 9, 517. https://doi.org/10.3390/w9070517
AMA Style
Messer TL, Burchell MR, Bírgand F. Comparison of Four Nitrate Removal Kinetic Models in Two Distinct Wetland Restoration Mesocosm Systems. Water. 2017; 9(7):517. https://doi.org/10.3390/w9070517
Chicago/Turabian StyleMesser, Tiffany L., Michael R. Burchell, and François Bírgand. 2017. "Comparison of Four Nitrate Removal Kinetic Models in Two Distinct Wetland Restoration Mesocosm Systems" Water 9, no. 7: 517. https://doi.org/10.3390/w9070517
Note that from the first issue of 2016, this journal uses article numbers instead of page numbers. See further details here.