An Integrated Method for Interval Multi-Objective Planning of a Water Resource System in the Eastern Part of Handan

1
College of Water Conservancy and Hydropower, Hebei University of Engineering, Handan 056021, China
2
State Key Laboratory of Simulation and Regulation of Water Cycle in River Basin, China Institute of Water Resources and Hydropower Research, Beijing 100038, China
3
The Administrative Center for China’s Agenda 21, Beijing 100038, China
*
Author to whom correspondence should be addressed.
Water 2017, 9(7), 528; https://doi.org/10.3390/w9070528
Submission received: 9 May 2017
/
Revised: 28 June 2017
/
Accepted: 12 July 2017
/
Published: 16 July 2017
(This article belongs to the Special Issue Modeling of Water Systems)
Abstract
:In this study, an integrated solving method is proposed for interval multi-objective planning. The proposed method is based on fuzzy linear programming and an interactive two-step method. It cannot only provide objectively optimal values for multiple objectives at the same time, but also effectively offer a globally optimal interval solution. Meanwhile, the degree of satisfaction related to different objective functions would be obtained. Then, the integrated solving method for interval multi-objective planning is applied to a case study of planning multi-water resources joint scheduling under uncertainty in the eastern part of Handan, China. The solutions obtained are useful for decision makers in easing the contradiction between supply of multi-water resources and demand from different water users. Moreover, it can provide the optimal comprehensive benefits of economy, society, and the environment.
1. Introduction
At present, there are a great number of contradictions in the water resources management system. First of all, different from pure pursuit of economic benefit in the past [1,2], social and environmental benefits are being paid more and more attention with the enhancement of the public’s consciousness on environmental protection [3]. Secondly, as a results of the implementation of South-to-North water diversion project, how to use the transferred water and local water effectively has become a difficult issue in many parts of China [4,5,6,7]. Thirdly, there have been serious contradictions between water supply and demand, water shortage and water pollution, as well as the competition among water users [8]. In addition, water resources systems can be complex with uncertainties which may exist in technical, social, environmental, political, and financial factors [9,10]. For example, there are serious water resource problems in the eastern part of Handa, China: (a) the distribution of water resources is uneven since the main surface water of Handan (Yuecheng and Dongwushi reservoirs) are located in the western part of Handan [11]; (b) the groundwater is seriously over-exploited because it is the most important source for agriculture which is the main industry [12]; (c) transferred water and local water conservancy projects cannot be organically combined, and thus cannot realize the maximum benefit of transferred water [13]; (d) there is a serious competition among different water users [14,15]. Therefore, it is desired to develop effective multi-objective optimization methods for water resource management under such contradictions and uncertainties.
Multi-objective linear programming (MOLP) is an effective method for problems with many goals. In the past decades, MOLP was developed and applied in many water resources management systems [16,17,18,19,20,21,22]. Han et al. demonstrated a reasonable allocation model for urban multi-source water to multi-user in Dalian city through using the step method [23]. Su et al. presented a multi-objectives allocation model of water resources and applied it in the Shiyang River basin [24]. Yang et al. improved a multi-objective evolutionary optimization algorithm and applied for hydropower reservoir operations in the California Oroviille-Thermalito complex [25]. However, in actual problems, there are many uncertain factors in water resources systems, such as rainfall events, inflow of river, benefit of water use, and the quantity of water demand [8,13,26,27,28]. All these uncertain factors influence the parameters definition of a system model. Therefore, a great number of uncertain multi-objective linear programming models were proposed to handle different uncertainties [16,29,30,31,32,33,34,35,36]. Among them, interval multi-objective linear programming model was an effective technique for problems with conflicts among the objectives and interval uncertainty [8]. For MOLP, there are many solving methods, such as the weighted sum method [37], ε-constraint method [38], objective programming method [39], interactive methods [40], pareto-dominated methods [41], and new dominance methods [42]. Fuzzy programming is one of the new dominance methods and has been widely studied [43,44]. It can effectively convert MOLP into single objective linear programming by introducing the flexible index [37]. The advantage of fuzzy programming is that the transform process is objective without subjective information, and it is an analytical method without iteration error. However, it is difficult to solve interval multi-objective linear programming models with interval coefficients in both objectives and constraints [8,16,29]. Previously, several scholars made great efforts to develop solutions methods for the interval linear programming models [45,46,47,48,49,50]. Among them, the improved two-step method (ITSM) proposed by Wang and Huang was proved to be a simple and effective method for interval linear programming without violation [50].
Therefore, the aim of this paper is to present an integrated approach for interval multi-objective planning by coupling the fuzzy programming and ITSM. The decision makers can make tradeoffs among a more valid range of multi-objectives, and then a viable solution with interval form can be obtained. The proposed model is applied to multiple water resources joint scheduling in the eastern part of Handan, China. The rational scheduling model pursues the maximum integration benefits of economy, society, and environment under uncertainty. At last, the comparison between the integrated approach and weighted sum method is provided to prove objectivity and stability of the proposed method in this paper. It is an effective method to promote the sustainable utilization of water resources and social development in the study area.
2. Methodology
2.1. IMOLP Model
According to Wu et al. [16], a general interval multi-objective planning problem can be formulated as follows:
Subject to:
where and are the interval objective functions. , , , , and ( means a set of interval data).
2.2. Integrated Solving Method
Before solving model (1), it is necessary to introduce the improved two-step method (ITSM) for interval linear programming (ILP) [50]. According to Huang et al. [45], a general ILP problem can be formulated as follows:
Subject to:
Based on ITSM, model (2) can be converted into two deterministic sub-models, which correspond to the upper and lower bounds of objective function value, respectively. Since the objective function is to be maximized, the sub-model corresponding to should first be calculated, and then the lower bound sub-model (corresponding to ) can be formulated on the basis of the result of the upper bound sub-model. Specifically, the two sub-models (3) and (4) for and individually are:
Subject to:
Subject to:
where means the former k coefficients in the objective function are positive, while means the rest coefficients are negative. Through solving the above two sub-models successively, the values of , and can be obtained based on model (3), while the values of , and should be taken based on model (4).Thus, the solution of model (2) can be obtained by integrating the results of models (3) and (4), which are shown as follows:
It is known that the single objective has a unified and simple solution. So the solution of multi-objective programming is generally on the basis of the single objective programming algorithm. According to Wang [37] and Huang et al. [45], model (1) can be transformed into an interval fuzzy linear planning problem (IFLP) by coupling the fuzzy programming. The IFLP model can be shown as follows:
Subject to:
where is the decision variable that relates to the satisfaction degree for the fuzzy decision; , , , and mean the upper and lower bounds of and individually, and the values of , and are the flexible indexes for and respectively. In detail, , , , and are the solutions of the single objective function (1a) with constraints (1c) and (1d); , , , and are the solutions of the single objective function (1b) with constraints (1c) and (1d). Under this condition, it can be known that model (6) is actually an interval single objective linear programming. Therefore, its solution can be calculated by ITSM and shown as follows:
And thus, the values of and can be obtained by calculating the Equations (1a) and (1b) based on Equation (7b), which are shown as follows:
3. Application
3.1. The Study Area Profile
The eastern part of Handan is 4271 square kilometers, accounting for 36% of the total area of Handan, and the geographical position is 36°6′–36°57′ in north latitude, longitude 114°24′–115°29′. Administrative division includes Linzhang County, Cheng’an County, Guangping County, Quzhou County, Jize County, Daming County, Wei Country, Guantao County, and Qiu County, which is shown in Figure 1.
In the study area, the water resources include surface water, transferred water, groundwater, and recycled water. The surface water includes Yuecheng reservoir water, Dongwushi reservoir water, and Wei River. Yuecheng reservoir is located in the western mountainous area of Ci County, mainly supplying to provinces of Hebei and Henan. The project affords domestic water, agricultural water, industrial water, and ecological water for each region of Handan. Dongwushi reservoir is located in the western mountainous area of Ci County. It provides industrial water, agricultural water, and ecological water for each region in the eastern part of Handan every year. Wei River belongs to level one in the river level, with a total length of 70 km. It originates in the Taihang Mountain foothills of Xinxiang, and flows through Wei County and Daming County, importing Fuyang River into Guantao County. The transferred water includes the South-to-North water and Yellow River water.
3.2. Forecast of Water Demand and Supply under Uncertainty
Based on the development planning of the eastern part of Handan, the water demand includes municipality, industry, agriculture and ecology, in which the domestic water demand contains urban and rural domestic water demands. In this paper, the first three water demands are predicted by the quota method, and the ecological water demand is forecasted by direct method [51]. In planning level year, the upper and lower water demands for each water user take 80% and 120% of the planning water demand respectively in every administrative region, which are shown in Table 1.
The precipitation, surface water resources, groundwater resources, transferred water resources, and the total volume of water resources were analyzed for Handan city by Wang and Li [52]. Accordingly, the amount of available water supply in the eastern part of Handan can be obtained and is shown in Table 2.
3.3. Application Model
Based on the current relevant national policies and local water resources planning, the proposed interval multi-objective planning model regards 2013 as present level year and regards 2020 as planning level year in the study area. The water resources in this model will refer to surface water, groundwater, diversion, and recycled water. Targets will include economic, social, and environmental benefits. Constraints will contain the water supply capacity, water requirement, water conveyance capacity, pollution emission of chemical oxygen demand (COD), and variable nonnegative constraint. Then collected data are imported into the model, through the model operation and debugging, the specific optimization results are obtained. The proposed model is as follows:
3.3.1. Objective Function
Economic benefit target (with the goal of maximizing the net benefit of water supply).
Social benefit target (minimizing water resources shortage used to indirectly reflect the social benefit).
Environmental target (with target of minimizing the sum of chemical oxygen demand that is main pollution emission area).
3.3.2. Constraints
Water supply capacity constraints:
Water demand constraints:
Carrying capacity constraints:
COD pollution emissions constraints:
Variable nonnegative constraints:
where:
- k: The research regions, k = 1 (Daming County), 2 (Wei County), 3 (Quzhou County), 4 (Qiu County), 5 (Jize County), 6 (Guangping County), 7 (Cheng’an County), 8 (Linzhang County), 9 (Guantao County);
- : Headwaters, i = 1 (surface water), 2 (transferred water), 3 (groundwater), 4 (recycled water);
- j: Water users, j = 1 (industrial water), 2 (domestic water), 3 (agricultural water), 4 (ecological water);
- : The net benefit coefficient of every water sector in each region;
- : Each user’s water allocation;
- : Each user’s water demand;
- : The content of pollutants that each user emissions sewage;
- : The coefficient of sewage;
- : The content of COD in the pollutants;
- : Water distribution relationship;
- : Supply amount;
- : The minimized water requirement;
- : Rated water demand;
- : The biggest water conveyance capacity of the water conveyance project;
- : The provisions of the COD emissions.
Based on the solving method depicted in Section 2, model (8) can be converted into an IFLP model with one objective. And then the IFLP model is decomposed into two deterministic submodels and solved sequentially by ITSM to obtain the interval solutions [50]. The specific solution process can be summarized as follows.
- Step 1.
- Solve ILP models with the objective being (8a) and constraints being (8d–h), the objective being (8b) and constraints being (8d–h), objective being (8c) and constraints being (8d–h) by ITSM individually, in order to obtain the flexible indexes for each objective and formulate IFLP model for model (8).
- Step 2.
- Transform IFLP model into two submodels, where the upper bound () is first solved because the objective is to maximize .
- Step 3.
- Solve the submodel and obtain solutions of and .
- Step 4.
- Formulate the objective function and relevant constraints of the submodel based on ITSM.
- Step 5.
- Solve the submodel and obtain solutions of and .
- Step 6.
- Obtain the values of all objectives by calculating (8a–c) based on and .
- Step 7.
- Integrate solutions of the two submodels and all objectives’ values, and the optimal results can be expressed as , , , , and .
- Step 8.
- Stop.
4. Results and Discussion
4.1. Results Analysis
Through solving the interval multi-objective programming model by the above depicted integrated method, both of the objective function values and water resources allocation schemes can be obtained by solving model (8), which can be seen in Table 3, Table 4, Table 5, Table 6 and Table 7 and Figure 2, Figure 3, Figure 4 and Figure 5. Table 3 shows the results of objective function values, it is noted that the upper bound of is corresponding to the upper bound of model (8), meaning higher degree of satisfaction and higher risk of violating the constraints. And the lower bound of is corresponding to the lower bound of model (8), meaning lower degree of satisfaction and lower risk of violating the constraints. Specifically, the value of for model (8) is 0.986, and the corresponding values for economic, social, and environmental are 434.01 × 10⁶ China Yuan (CNY), 79.57 × 10⁶ m3, and 0.045 × 10⁶ kg, individually. Conversely, the value of for model (8) is 0.981, and the corresponding values for economic, social, and environmental are 410.23 × 10⁶ CNY, 70.21 × 10⁶ m3, and 0.039 × 10⁶ kg, respectively.
In detail, Figure 2 shows the amount of water allocated to municipality in each region from different water resources. It can be seen that the total amount of domestic water demand is [129.25, 146.25] × 106 m3, while the amount of water which is allocated to municipality is [129.25, 140.25] × 106 m3. So the water shortage is 6 × 10⁶ m3 with the average deficiency rate being 4.1% under the upper water demand, and the top two water shortage counties are Guangping County and Guantao County, whose deficit rate are 18% and 14.6% respectively. The amount of water allocated to municipality in Daming County, Linzhang County, and Wei County is very large, which accounts for about 65.3% of the total.
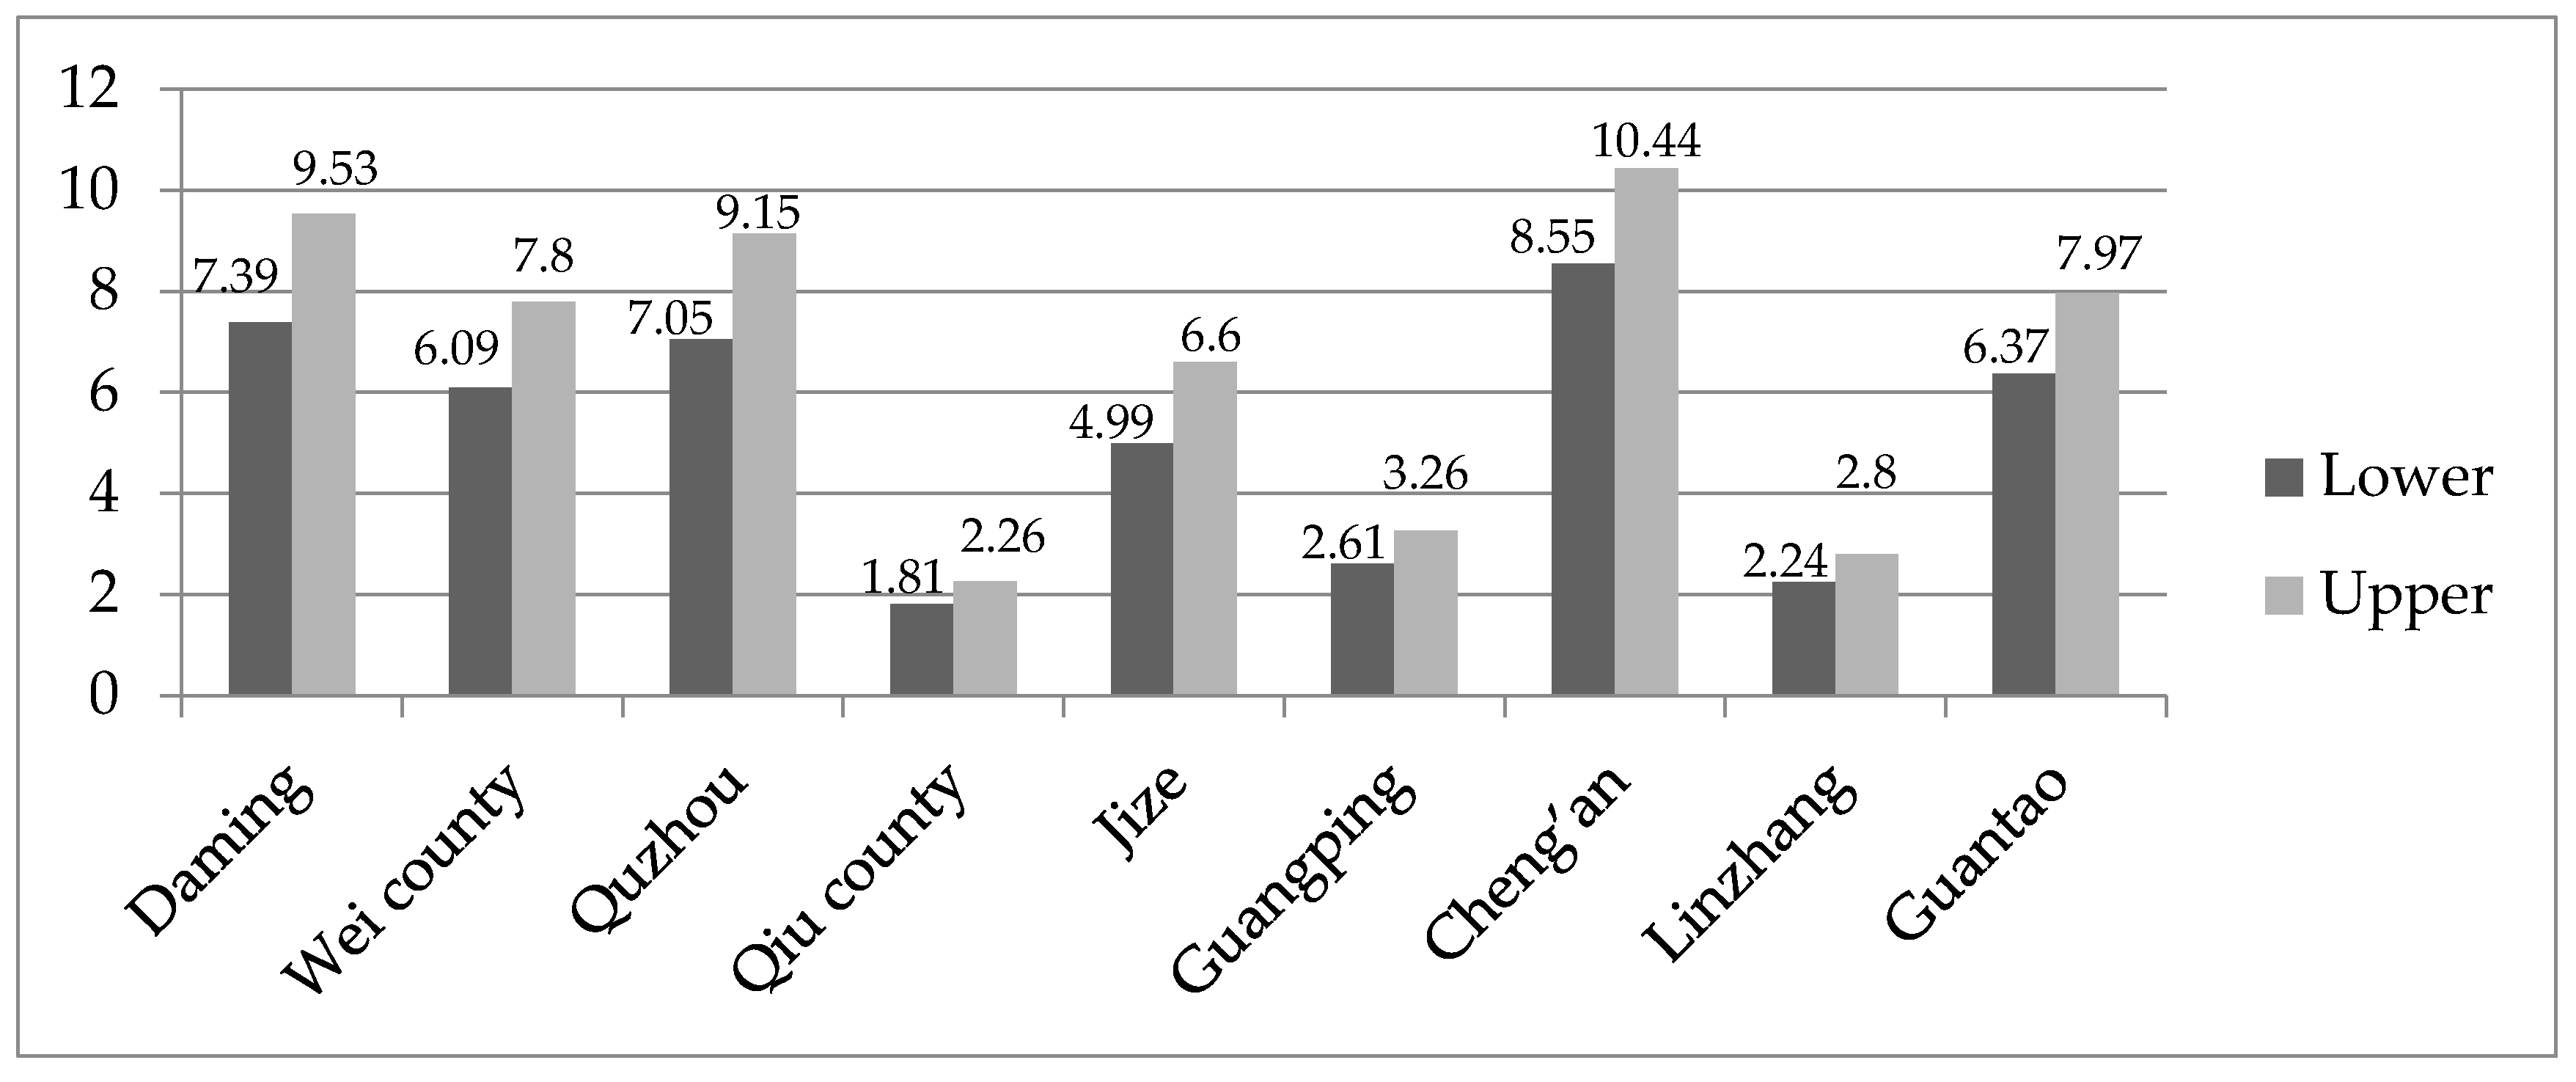
Figure 3 is the result of total water quantity allocated to ecology in each region from different water resources. It is noted that the total amount of ecological water demand is [9.60, 9.92] × 106 m3, the amount of allocated water to ecology is 9.85 × 10⁶ m3. When the water demand equals the upper bound, the water deficiency is 0.07 × 10⁶ m3 with the average deficiency rate being 0.7%, and the same deficit rate happened in every administrative County.
Figure 4 represents the total water quantity of allocating to industry in every region from various water resources. It can be obtained that the total amount of industrial water demand is [46.30, 67.85] × 106 m3, the amount of water which is allocated to industry is [47.10, 59.81] × 106 m3. So the water deficit is 8.04 × 10⁶ m3 with the average water deficiency rate being 11.8% under the upper water demand, and the top three water shortage counties are Quzhou County (15%), Jize County (12%), and Wei County (13%), whose deficiency rate are larger than the average water deficiency rate.
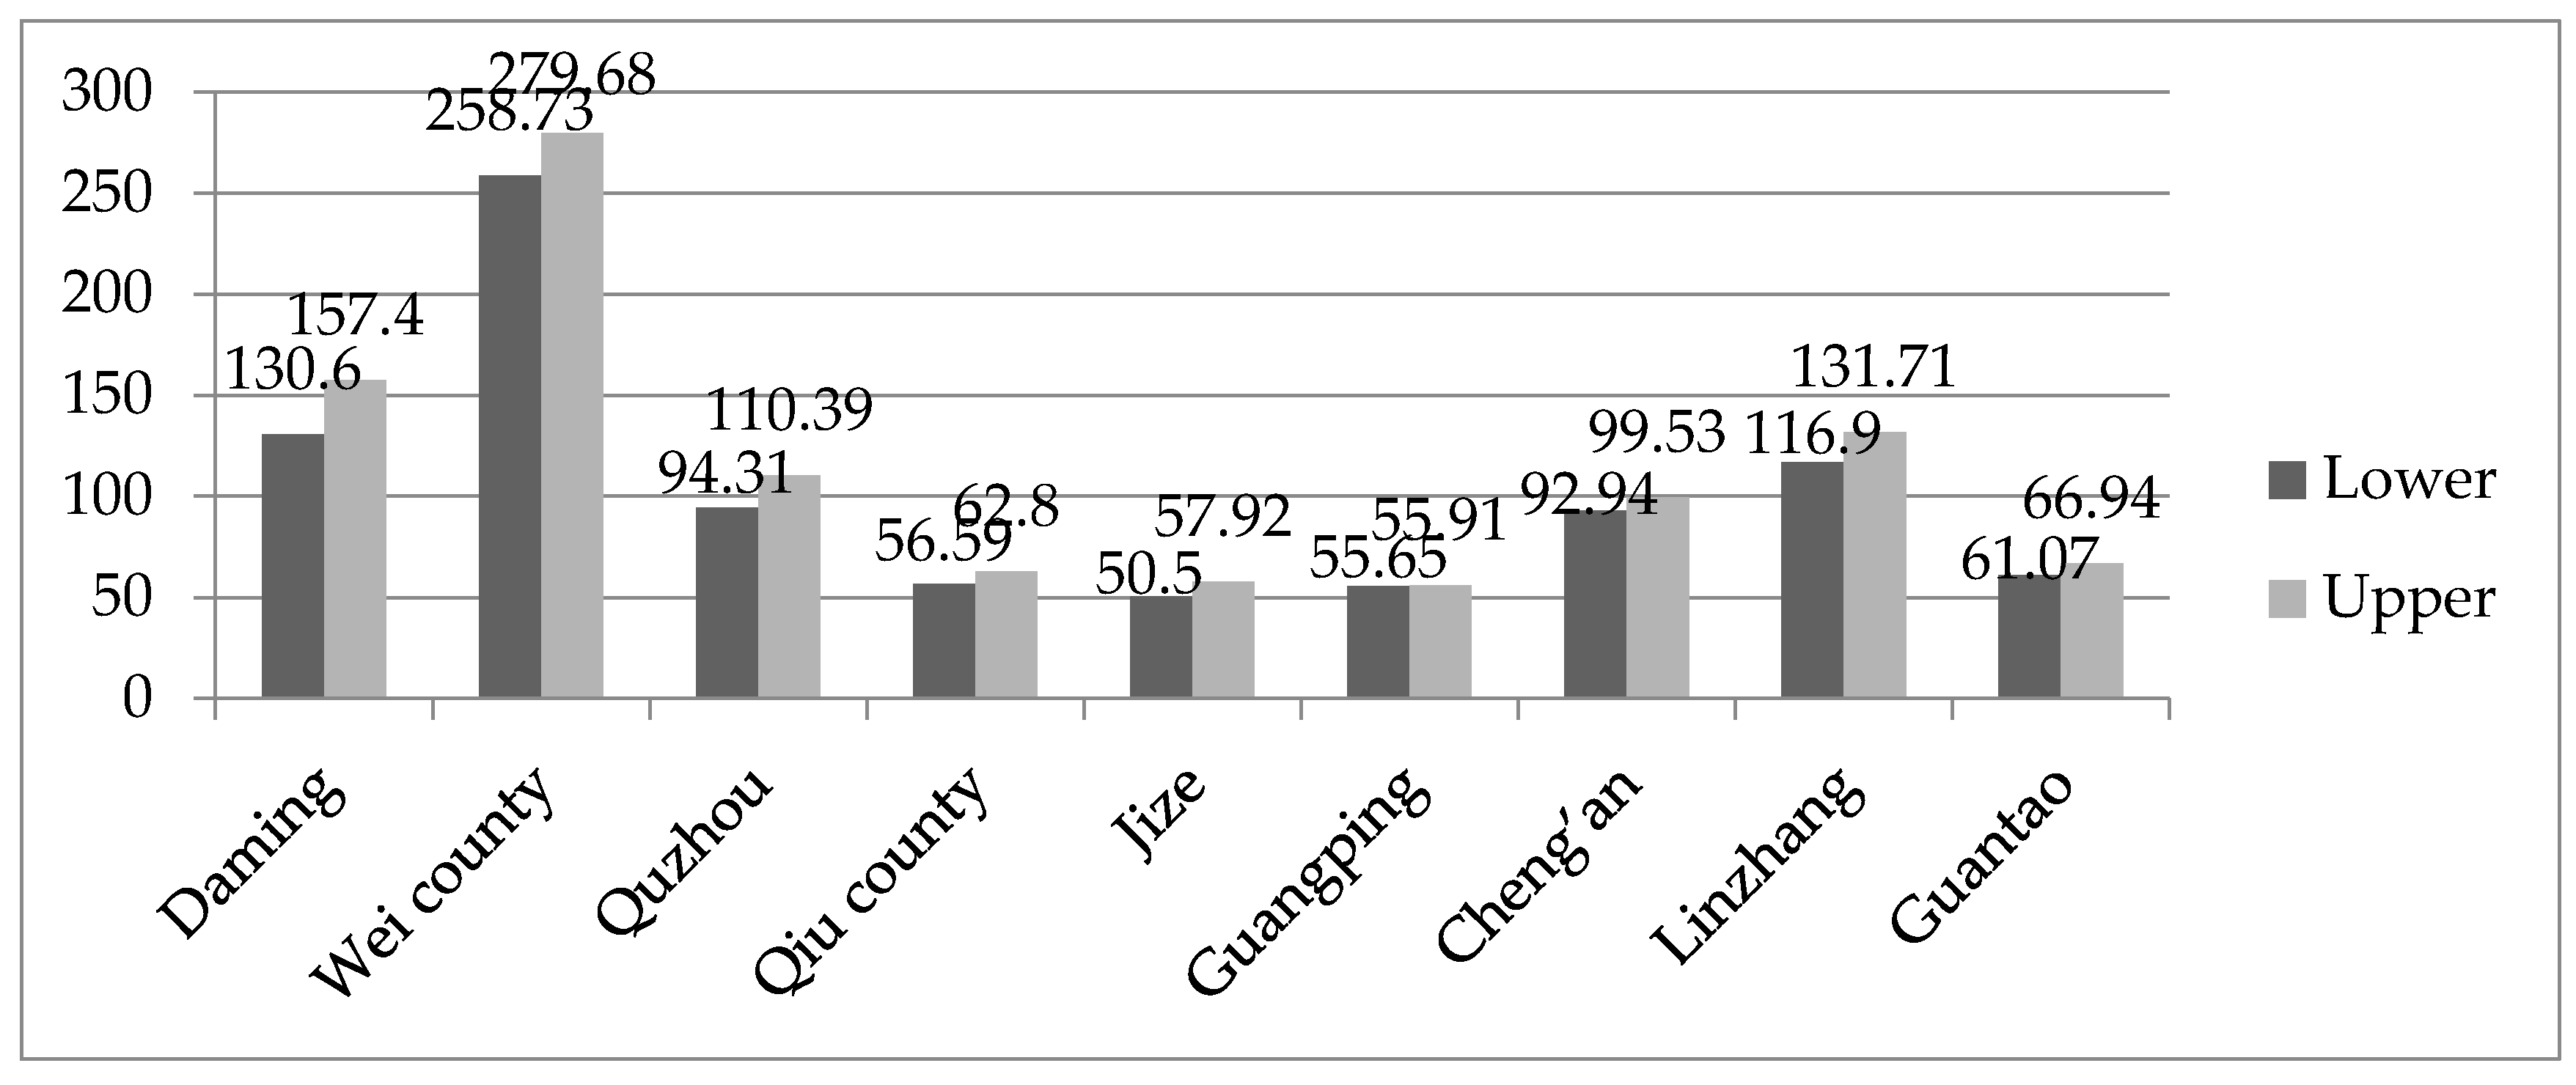
Figure 5 shows the total water quantity of allocating to agriculture in each region from different water resources. It is noted that the total amount of agricultural water demand is [859.63, 1375.17] × 106 m3, the amount of water allocated to agriculture is [917.19, 1022.28] × 106 m3. So there is a deficit of 352.89 × 10⁶m3 with the average deficiency rate being 25.6% under the upper water demand. Further, the top four water shortage counties of larger than the average water deficiency rate are Quzhou County, Guangping County, and Jize County with their deficient rate being 33%, 27%, and 28%, respectively. Based on the above results, it can be obtained that the water supply can fully meet requirement when the water demand equals to the lower bound. Conversely, when the water demand equals to the upper bound, the serious water shortage user is agriculture, while the serious water shortage counties are Quzhou County, Guangping County, and Jize County (whose average deficit rate are 33%, 27%, and 28%, individually).
Table 4 shows the result of surface water allocated to every user in each administrative region. It can be seen that the amount water allocated to the domestic user, ecological user, industrial user, and agricultural user from surface water are [50.10, 55.49] × 106 m3, 3.69 × 10⁶ m3, [34.66, 42.24] × 106 m3, [402.01, 438.61] × 106 m3, the total amount of surface water is [490.46, 540.03] × 106 m3, which is smaller than the surface water supply ([499.17, 550.19] × 106 m3). According to the results in Figure 2, Figure 3, Figure 4 and Figure 5, it can be obtained that the surface water accounts for [39%, 40%], 37%, [71%, 74%], and [43%, 44%] of the total water allocated to the domestic user, ecological user, industrial user, and agricultural user, respectively. Totally, all users would use surface water, and most of the surface water would supply to agriculture, the surface water supplied to ecology is the least. The reason for this situation is most of the surface water quality cannot satisfy municipality use, such as the Dongwushi reservoir water.
Table 5 represents the result of groundwater allocated to every user in each administrative region. It can be seen that the amount water allocated to the domestic water user, ecology water user, industry water user, and agriculture water user from groundwater are [36.54, 40.31] × 106 m3, 2.22 × 10⁶ m3, [9.01, 13.30] × 106 m3, and [389.64, 446.79] × 106 m3, the total amount of groundwater is [437.41, 502.62] × 106 m3. Combined with the results in Figure 2, Figure 3, Figure 4 and Figure 5, it can be calculated that the groundwater accounts for [28%, 29%], 23%, [19%, 22%], and [42%, 44%] of the total water allocated to the domestic user, ecological user, industrial user, and agricultural user, individually. By contrast, more than 88% of all groundwater is supplied to agriculture, groundwater is the main source of agricultural water.
Table 6 gives the result of recycled water allocated to every user in each administrative region. The amount water allocated to the domestic water user, ecology water user, industry water user, and agriculture water user from recycled water are 0 × 106 m3, 1.74 × 10⁶ m3, 0 × 106 m3, and [85.85, 91.91] × 106 m3, the total amount of recycled water is [87.59, 93.65] × 106 m3. Based on the results in Figure 2, Figure 3, Figure 4 and Figure 5, it can be known that the recycled water accounts for 0, 18%, 0, and 9% of the total water allocated to the domestic user, ecological user, industrial user, and agricultural user, individually. Therefore, only ecology water and agriculture water user use recycled water, and most of the recycled water is supplied to agriculture, it accounts for 98% of recycled water.
Table 7 is the result of transferred water allocated to every user in each administrative region. The amount water allocated to the domestic water user, ecology water user, industry water user, and agriculture water user from transferred water are [42.61, 44.45] × 106 m3, 2.20 × 10⁶ m3, [3.43, 4.27] × 106 m3, and [39.79, 44.97] × 106 m3, the amount of transferred water is [88.03, 95.89] × 106 m3. Totally, the transferred water would account for [32%, 33%], 22%, 7%, and 4% of the total water allocated to the domestic user, ecological user, industrial user, and agricultural user, respectively. According to the different water quality of transferred water, they would be allocated to various users. There are six counties in which all users would use transferred water: Daming County, Wei County, Quzhou County, Qiu County, Guantao County, and Jize County. Meanwhile, there are three counties in which domestic water and ecology water use transferred water: Guangping County, Cheng’an County, and Linzhang County. Therefore, the transferred water plays a great role in this water resources system, and should be organically combined with local water conservancy.
4.2. Comparison with Weighted Sum Method
In this study, the classical weighted sum method (WSM) is adopted to solve model (8) for comparison with the proposed method. According to Zhang et al. [53], three different weights are set to be 0.7, 0.2, and 0.1 for objectives (8a–c), respectively, and the obtained solution is shown in Table 8. For better comparison, the results based on other two weights ((0.2, 0.7, and 0.1) and (0.2, 0.1, and 0.7)) are also provided in Table 9 and Table 10. In addition, the results of objective function values under three different weight sets are given in Table 11.
By comparing, it can be known that the results obtained by WSM are very similar to the solutions of the proposed approach totally. However, both of the amounts of water resources allocated to every user in Table 8, Table 9 and Table 10 and objective function values in Table 11 fluctuate with the change of weight. When the weight of economic benefit target becomes smaller, the amount of water resources allocated to industry reduces, while the amount of water resources allocated to other users increases. As everyone knows, weights are generally determined by people, and thus have great subjectivity. Therefore, the results obtained by WSM would be subjective, which is less reasonable than the proposed approach in this study.
5. Conclusions
In this paper, an integrated method was presented to solve interval multi-objective planning by coupling fuzzy programming and ITSM. The proposed model can not only explicitly address system uncertainty with interval parameters but it can also effectively reflect different objectives with multiple water resources. Moreover, the presented model can provide a reliable multi-water resources joint scheduling measure under different fuzzy membership degrees to balance various contradictions among water users. The interval multi-objective planning model can be transferred into two deterministic single objective sub-models that correspond to the upper and lower bounds of the fuzzy membership degree. Therefore, interval solutions can be obtained by solving the two sub-models sequentially.
The multi-water resources problem in the eastern part of Handan, China has been studied to demonstrate applicability of the proposed model. The obtained solutions indicated that it could not only provide optimized benefits and water allocation schemes for every water user, but also relieve the water resources shortage situation by organically combining the transferred water and local water conservancy. Meanwhile, it also indicated that the water supply could fully meet requirements when the water demand equaled the lower bound. Conversely, when the water demand equaled the upper bound, industry and agriculture sectors would face serious water shortage, while Quzhou County, Guangping County, and Jize County would also confront serious water shortages. Compared with the results generated by the weighted sum approach, the final solutions of the proposed method are more reasonable. Therefore, the proposed approach can help generate desired policies for water resources management with maximized multiple benefits and reasonable water allocation to each user, and thus effectively promote the sustainable utilization of water resources and social development in the study area.
Acknowledgments
This research has been supported by National Natural Science Foundation of China (51409077), Natural Science Foundation of Hebei, in China (E2015402148) and the Open Research Fund of State Key Laboratory of Simulation and Regulation of Water Cycle in River Basin (China Institute of Water Resources and Hydropower Research, IWHR-SKL-201718). The authors are grateful to the editors and the anonymous reviewers for their insightful comments and suggestions.
Author Contributions
For research articles with several authors, a short paragraph specifying their individual contributions must be provided. The following statements should be used “M.S. conceived and designed the experiments; P.W. performed the experiments; M.S. and P.W. analyzed the data; B.Z. contributed reagents/materials/analysis tools; M.S. wrote the paper.” Authorship must be limited to those who have contributed substantially to the work reported.
Conflicts of Interest
The authors declare no conflict of interest.
References
- Li, Y.P.; Huang, G.H.; Nie, S.L. An interval-parameter multi-stage stochastic programming model for water resources management under uncertainty. Adv. Water Resour. 2006, 29, 776–789. [Google Scholar] [CrossRef]
- Cheng, J.F.; Guo, P.; Li, M. Application of dual interval programming in water resources optimal allocation for single crop. Water Sav. Irrig. 2014, 12, 48–53. [Google Scholar]
- Tian, J.; Liu, L.J. Study on multi-objective optimal allocation method for regional water resources and its application. Yellow River 2013, 35, 29–31. [Google Scholar]
- Huang, Y.M.; Zhang, S.H.; Jiang, Y.Z.; Guo, Y.X. Research on the model of real-time operation of the Danjiangkou reservoir and the solution method. J. China Inst. Water Resour. Hydropower Res. 2010, 8, 187–193. [Google Scholar]
- Shi, X.; Ma, N.; Su, F.K.; Guo, D.Z.; Pu, L.F. Study on main problem of water resources management system in Danjiangkou reservoir catchment. J. Univ. Shanghai Sci. Technol. 2010, 32, 493–498. [Google Scholar]
- Fu, H.S.; Cheng, J.L.; Fang, H.Y.; Lu, X.W. Optimal allocation of water resources for Jiangsu section of South–to-North water transfer east line project. Trans. Chin. Soc. Agric. Eng. 2012, 28, 76–81. [Google Scholar]
- Zhang, X.Y.; Dong, Z.C.; Wang, C.C. Optimal allocation of water resources in Hebei region of South–to-North water diversion project. Water Resour. Power 2012, 30, 36–39. [Google Scholar]
- Han, Y.; Huang, Y.F.; Wang, G.Q.; Maqsood, I. A multi-objective linear programming model with interval parameters for water resources allocation in Dalian city. Water Resour. Power 2011, 25, 449–463. [Google Scholar] [CrossRef]
- Suo, M.Q.; Li, Y.P.; Huang, G.H.; Fan, Y.R.; Li, Z. An inventory-theory-based inexact multi-stage stochastic programming model for water resources management. Math. Probl. Eng. 2013, 2013, 15. [Google Scholar] [CrossRef]
- Fan, Y.R.; Huang, G.H.; Huang, K.; Baetz, B.W. Planning water resources allocation under multiple uncertainties through a generalized fuzzy two-stage stochastic programming method. IEEE Trans. Fuzzy Syst. 2015, 23, 1488–1504. [Google Scholar] [CrossRef]
- Li, X.L.; Zhao, H.Z. Useful operation of Dongwushi reservoir. Water Resour. Hydropower Northeast China 2007, 25, 26–28. [Google Scholar]
- Yu, G.J. Taking about the existing the problems of water supply for industry and agriculture in Handan. Gansu Water Conserv. Hydropower Technol. 2010, 46, 50–51. [Google Scholar]
- Yang, Q.E.; Li, H.T.; Wang, X.L.; Peng, B. Study on joint optimal operation of multi-source water supply of South–to-North water transfer project in Handan. S. N. Water Transf. Water Sci. Technol. 2007, 5, 37–39. [Google Scholar]
- Zhang, P.F.; Guo, J. Analysis of the water resources shortage types of Handan city. Water Sci. Eng. Technol. 2008, S2, 41–43. [Google Scholar]
- Long, Q.B.; Yuan, G.; Wang, L.Z.; Wu, J.J. Study on present situation and exploitation and utilization of brackish water in Guantao County of Hebei province. J. Water Resour. Water Eng. 2010, 21, 126–129. [Google Scholar]
- Wu, S.M.; Huang, G.H.; Guo, H.C. An interactive inexact-fuzzy approach for multiobjective planning of water resource systems. Water Sci. Technol. 1997, 36, 235–242. [Google Scholar] [CrossRef]
- Matondo, J.I. A comparison between conventional and integrated water resources planning and management. Phys. Chem. Earth Parts A B C 2002, 27, 831–838. [Google Scholar] [CrossRef]
- Li, F.W.; Niu, J.; Zeng, H. Research on the influence of rainstorm duration distribution to the multi-water resources allocation of artificial lake. Energy Procedia 2012, 16, 397–402. [Google Scholar]
- Kurek, W.; Ostfeld, A. Multi-objective optimization of water quality, pumps operation, and storage sizing of water distribution systems. J. Environ. Manag. 2013, 115, 189–197. [Google Scholar] [CrossRef] [PubMed]
- Wang, X.J.; Yang, H.; Shi, M.J.; Zhou, D.Y.; Zhang, Z.Y. Managing stakeholders’ conflicts for water reallocation from agriculture to industry in the Heihe River Basin in Northwest China. Sci. Total Environ. 2015, 505, 823–832. [Google Scholar] [CrossRef] [PubMed]
- Monaco, F.; Sali, G.; Hassen, M.B.; Facchi, A.; Romani, M.; Vale, G. Water management options for rice cultivation in a temperate area: A multi-objective model to explore economic and water saving results. Water 2016, 8, 336. [Google Scholar] [CrossRef]
- Zhang, Y.Y.; Shao, Q.X.; Taylor, J.A. A balanced calibration of water quantity and quality by multi-objective optimization for integrated water system model. J. Hydrol. 2016, 538, 802–816. [Google Scholar] [CrossRef]
- Han, Y.; Xu, S.G.; Xu, X.Z. Modeling multisource multiuser water resources allocation. Water Resour. Manag. 2008, 22, 911–923. [Google Scholar] [CrossRef]
- Su, X.L.; Kang, S.Y. Multi-objectives allocation model of water resources and its application in the Shiyang River basin. Trans. CASE 2009, 25, 129–132. [Google Scholar]
- Yang, T.; Gao, X.; Sellars, S.L.; Sorooshian, S. Improving the multi-objective evolutionary optimization algorithm for hydropower reservoir operations in the California Oroville-Thermalito complex. Environ. Model. Softw. 2015, 69, 262–279. [Google Scholar] [CrossRef]
- Fan, Y.R.; Huang, W.W.; Li, Y.P.; Huang, G.H.; Huang, K. A coupled ensemble filtering and probabilistic collocation approach for uncertainty quantification of hydrological models. J. Hydrol. 2015, 530, 255–272. [Google Scholar] [CrossRef]
- Fan, Y.R.; Huang, W.; Li, Y.P.; Huang, G.H.; Huang, K.; Zhou, X. A PCM-based stochastic hydrological model for uncertainty quantification in watershed systems. Stoch. Environ. Res. Risk Assess. 2015, 29, 915–927. [Google Scholar] [CrossRef]
- Yang, T.; Tao, Y.; Li, J.; Zhu, Q.; Su, L. Multi-criterion model ensemble of CMIP5surface air temperature over China. Theor. Appl. Climatol. 2017, 6, 1–16. [Google Scholar] [CrossRef]
- Wu, S.M.; Huang, G.H. An interval-parameter fuzzy approach for multiobjective linear programming under uncertainty. J. Math. Model. Algorithms 2007, 6, 195–212. [Google Scholar] [CrossRef]
- Han, Y.; Huang, Y.F.; Wang, G.Q.; Wang, L.Z. Study on coordination evolvement of complex water resources system with interval uncertainty. J. Hydropower Eng. 2011, 8, 892–897. [Google Scholar]
- Ye, J.; Liu, H.B.; Yan, J.J. Application of inexact fuzzy multi-objective model on water resources allocation in an ecological city. Acta Sci. Circumst. 2012, 32, 1001–1006. [Google Scholar]
- Liu, N.L.; Jiang, H.Q.; Wu, W.J. Empirical research of optimal allocation model of water resources under uncertainties. China Environ. Sci. 2014, 34, 1607–1613. [Google Scholar]
- Hu, M.; Huang, G.H.; Sun, W.; Li, Y.P.; Ding, X.W.; An, C.J.; Zhang, X.F.; Li, T. Multi-objective ecological reservoir operation based on water quality response models and improved genetic algorithm: A case study in Three Gorges Reservoir, China. Eng. Appl. Artif. Intell. 2014, 36, 332–346. [Google Scholar] [CrossRef]
- Li, M.; Guo, P. Uncertain and multi-objective programming models for crop planting structure optimization. Front. Agric. Sci. Eng. 2016, 1, 34–45. [Google Scholar] [CrossRef]
- Sanita, D.; Claus, D.; Peter, B.G. Multi-objective optimization for analysis of changing trade-offs in the Nepalese water-energy-food nexus with hydropower development. Water 2017, 9, 162. [Google Scholar]
- Wang, Y.G. One solution of multi-objective linear programming model with fuzzy mathematics. J. QinZhou Univ. 2008, 03, 0014–0017. [Google Scholar]
- Ju, L.; Tan, Z.; Li, H.; Tan, Q.; Yu, X.; Song, X. Multi-objective operation optimization and evaluation model for CCHP and renewable energy based hybrid energy system driven by distributed energy resources in China. Energy 2016, 111, 322–340. [Google Scholar] [CrossRef]
- Geng, Z.; Cui, Y.; Xia, L.; Zhu, Q.; Gu, X. Compromising adjustment solution of primary reaction coefficients in ethylene cracking furnace modeling. Chem. Eng. Sci. 2012, 80, 16–29. [Google Scholar]
- Wang, F.; Rao, Y.; Tang, Q.; He, X.; Zhang, L. Fast construction method of Pareto non-dominated solution for multi-objective decision-making problem. Syst. Eng. Theor. Pract. 2015, 35, 1–10. [Google Scholar]
- Vallerio, M.; Hufkens, J.; Impe, J.V.; Logist, F. An interactive decision-support system for multi-objective optimization of nonlinear dynamic processes with uncertainty. Expert Syst. Appl. 2015, 42, 7710–7731. [Google Scholar] [CrossRef] [Green Version]
- Chin, K.S.; Fu, C. Integrated evidential reasoning approach in the presence of cardinal and ordinal preferences and its applications in software selection. Expert Syst. Appl. 2014, 41, 6718–6727. [Google Scholar] [CrossRef]
- Koduru, P.; Das, S.; Welch, S. Multi-objective hybrid PSO using m-fuzzy dominance. In Proceedings of the 9th annual conference on Genetic and evolutionary computation, London, UK, 7–11 July 2007; pp. 853–860. [Google Scholar]
- Kumar, S.S.; Prasad, Y.S. Modeling and optimization of multi objective non-linear programming problem in intuitionistic fuzzy environment. Appl. Math. Model. 2015, 39, 4617–4629. [Google Scholar]
- Gharavi, H.; Ardehali, M.M.; Ghanbari-Tichi, S. Imperial competitive algorithm optimization of fuzzy multi-objective design of a hybrid green power system with considerations for economics, reliability, and environmental emissions. Renew. Energy 2015, 78, 427–437. [Google Scholar] [CrossRef]
- Huang, G.H.; Baetz, B.W.; Patry, G.G. A grey linear programming approach for municipal solid waste management planning under uncertainty. Civ. Eng. Syst. 1992, 9, 319–335. [Google Scholar] [CrossRef]
- Huang, Y.F.; Baetz, B.W.; Huang, G.H.; Liu, L. Violation analysis for solid waste management systems: An interval fuzzy programming approach. J. Environ. Manag. 2002, 65, 431–446. [Google Scholar] [CrossRef]
- Zhou, F.; Guo, H.C.; Chen, G.X.; Huang, G.H. The interval linear programming: A revisit. J. Environ. Inf. 2008, 11, 1–10. [Google Scholar] [CrossRef]
- Cao, M.F.; Huang, G.H. Scenario-based methods for interval linear programming problems. J. Environ. Inf. 2011, 17, 65–74. [Google Scholar] [CrossRef]
- Fan, Y.R.; Huang, G.H. A robust two-step method for solving interval linear programming problems within an environmental management context. J. Environ. Inf. 2012, 19, 1–12. [Google Scholar] [CrossRef]
- Wang, X.Q.; Huang, G.H. Violation analysis on two-step method for interval linear programming. Inf. Sci. 2014, 281, 85–96. [Google Scholar] [CrossRef]
- Hu, X.S.; Qiao, G.J. Ecological Water Network Construction and Water Environment Remediation in Handan; China Water & Power Press: Beijing, China, 2013; pp. 67–303. [Google Scholar]
- Wang, S.Q.; Li, X.L.; Hao, B.Y. Study on countermeasure and present situation of water resources for Handan city. J. Hebei Inst. Archit. Sci. Technol. 2005, 21, 50–51. [Google Scholar]
- Zhang, H.J.; Zhao, J.; Luo, H.; Xie, X.P. Objective weight computation based on personal preference for multi-objective optimization problem. Control Decis. 2014, 29, 1471–1475. [Google Scholar]
Figure 1.
The administrative map of eastern Handan.
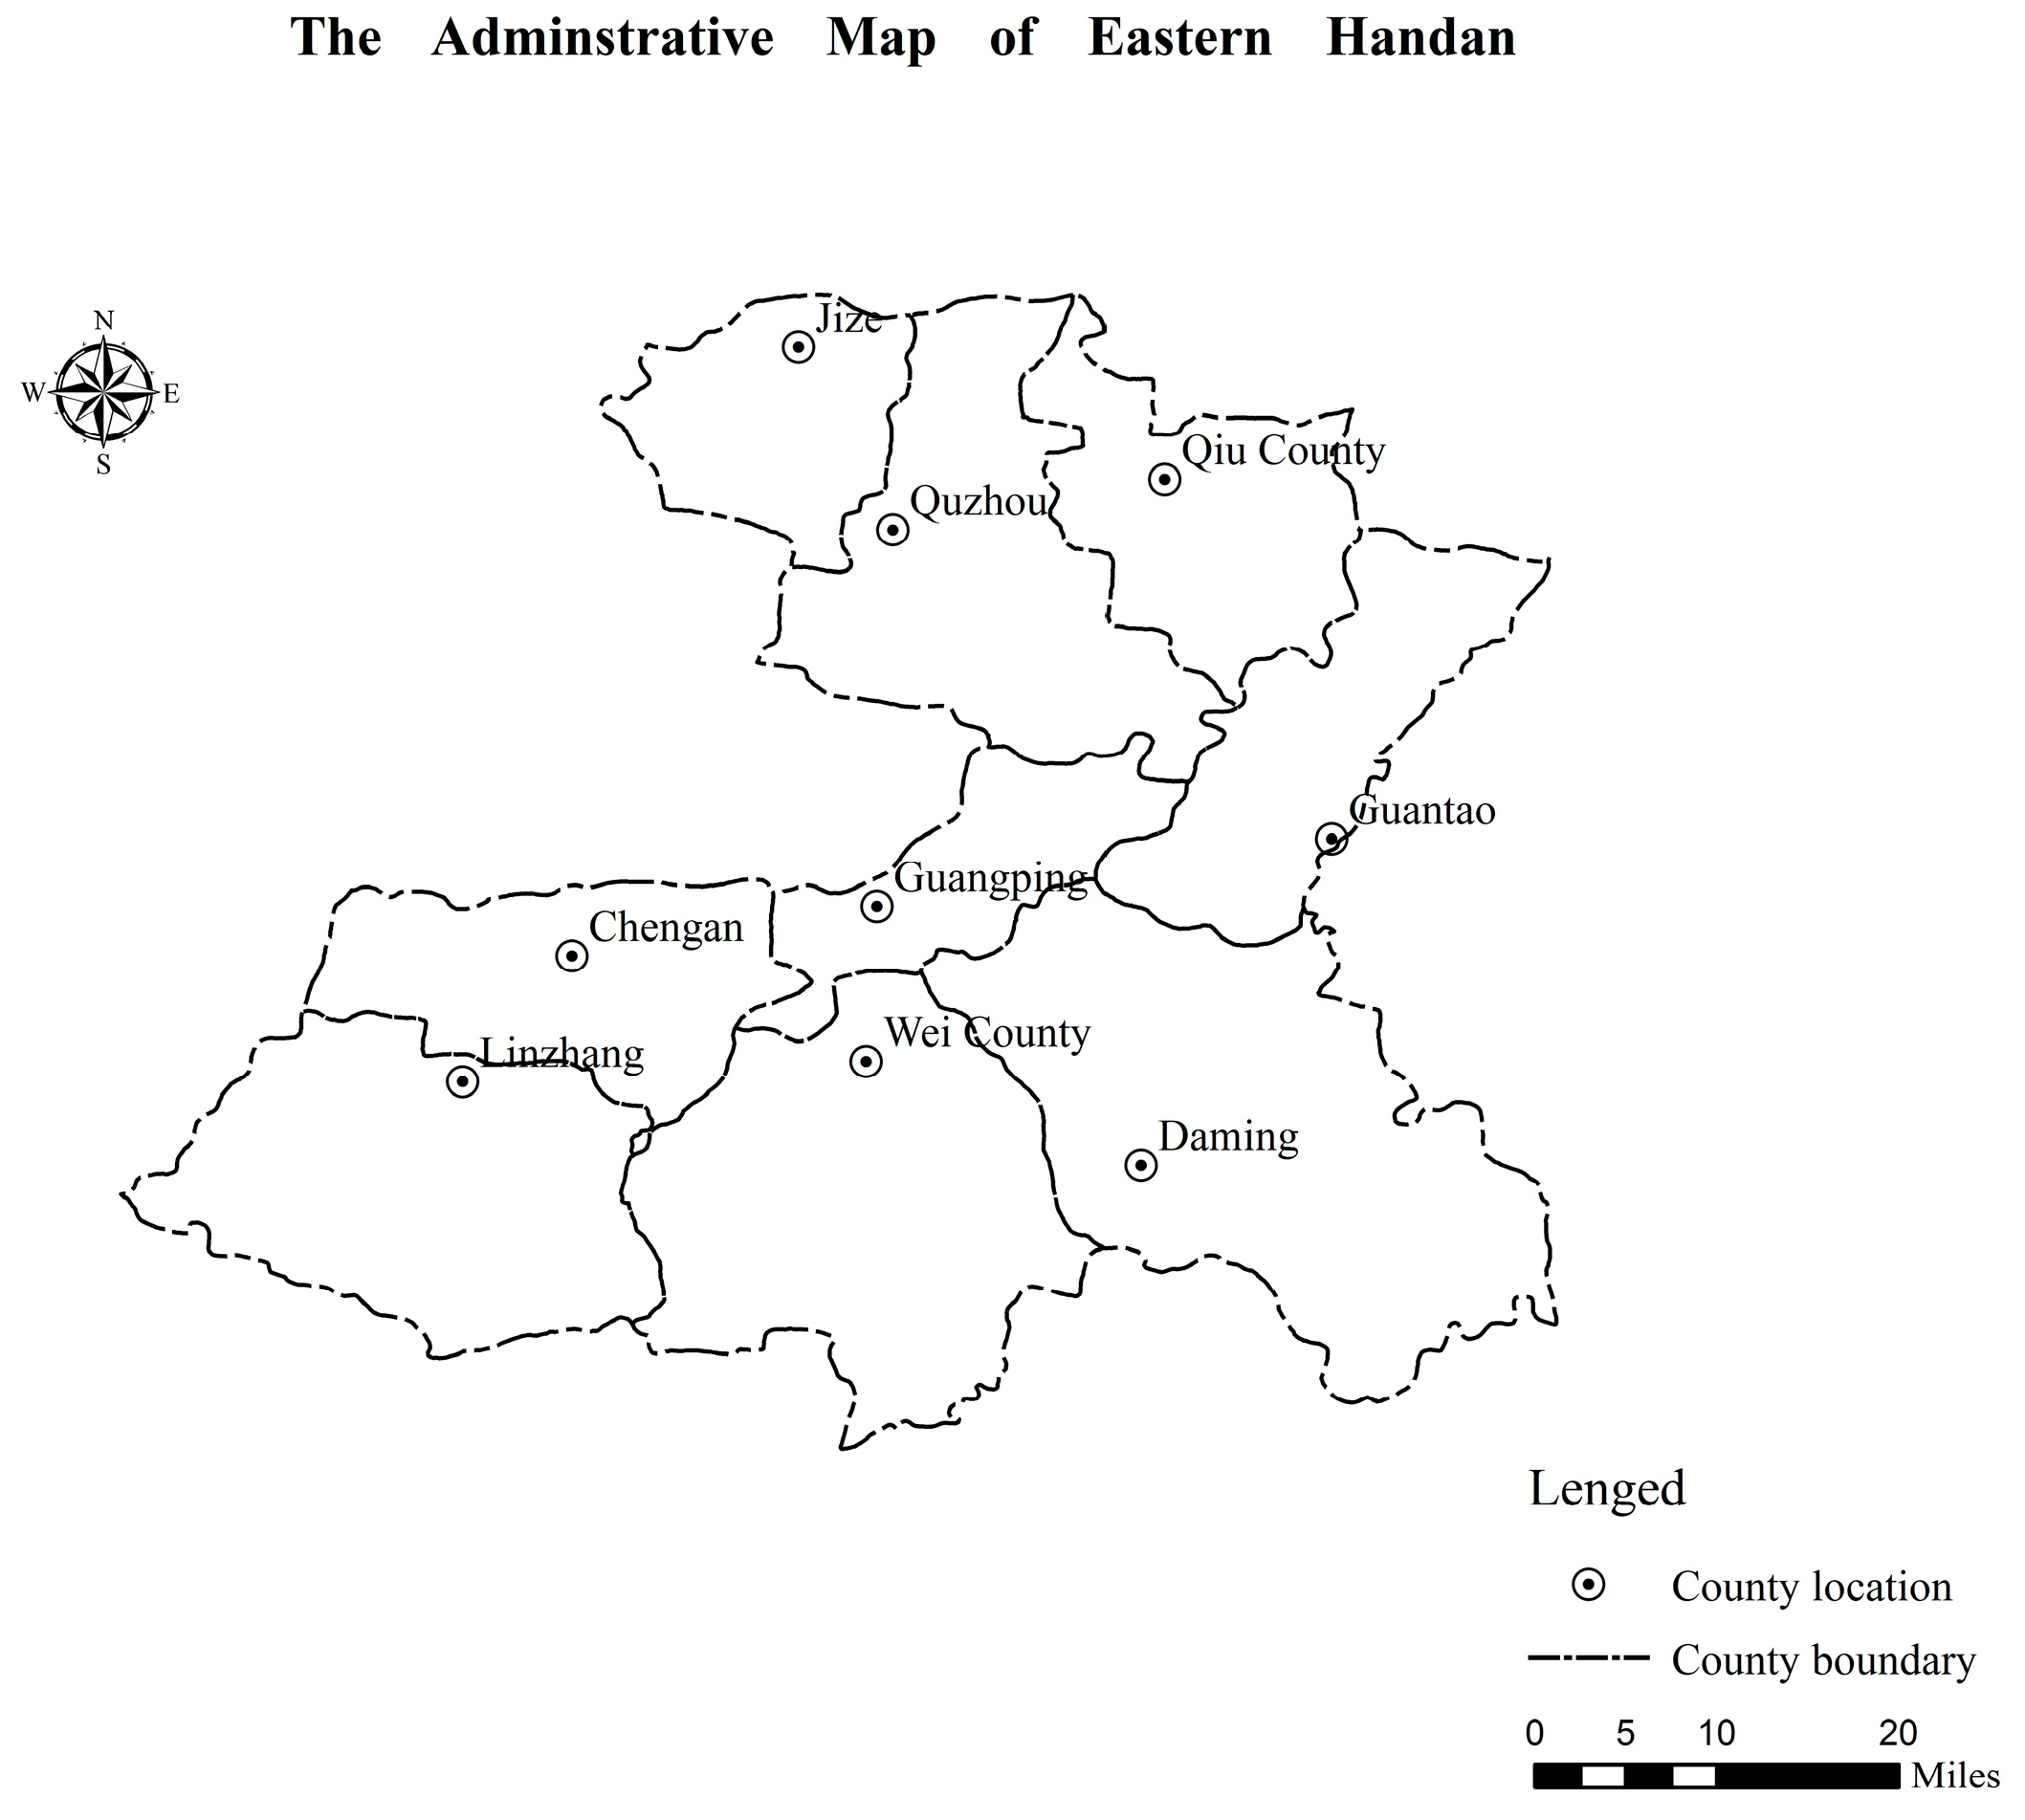
Figure 2.
Result of water resources allocation to municipality (106 m3).
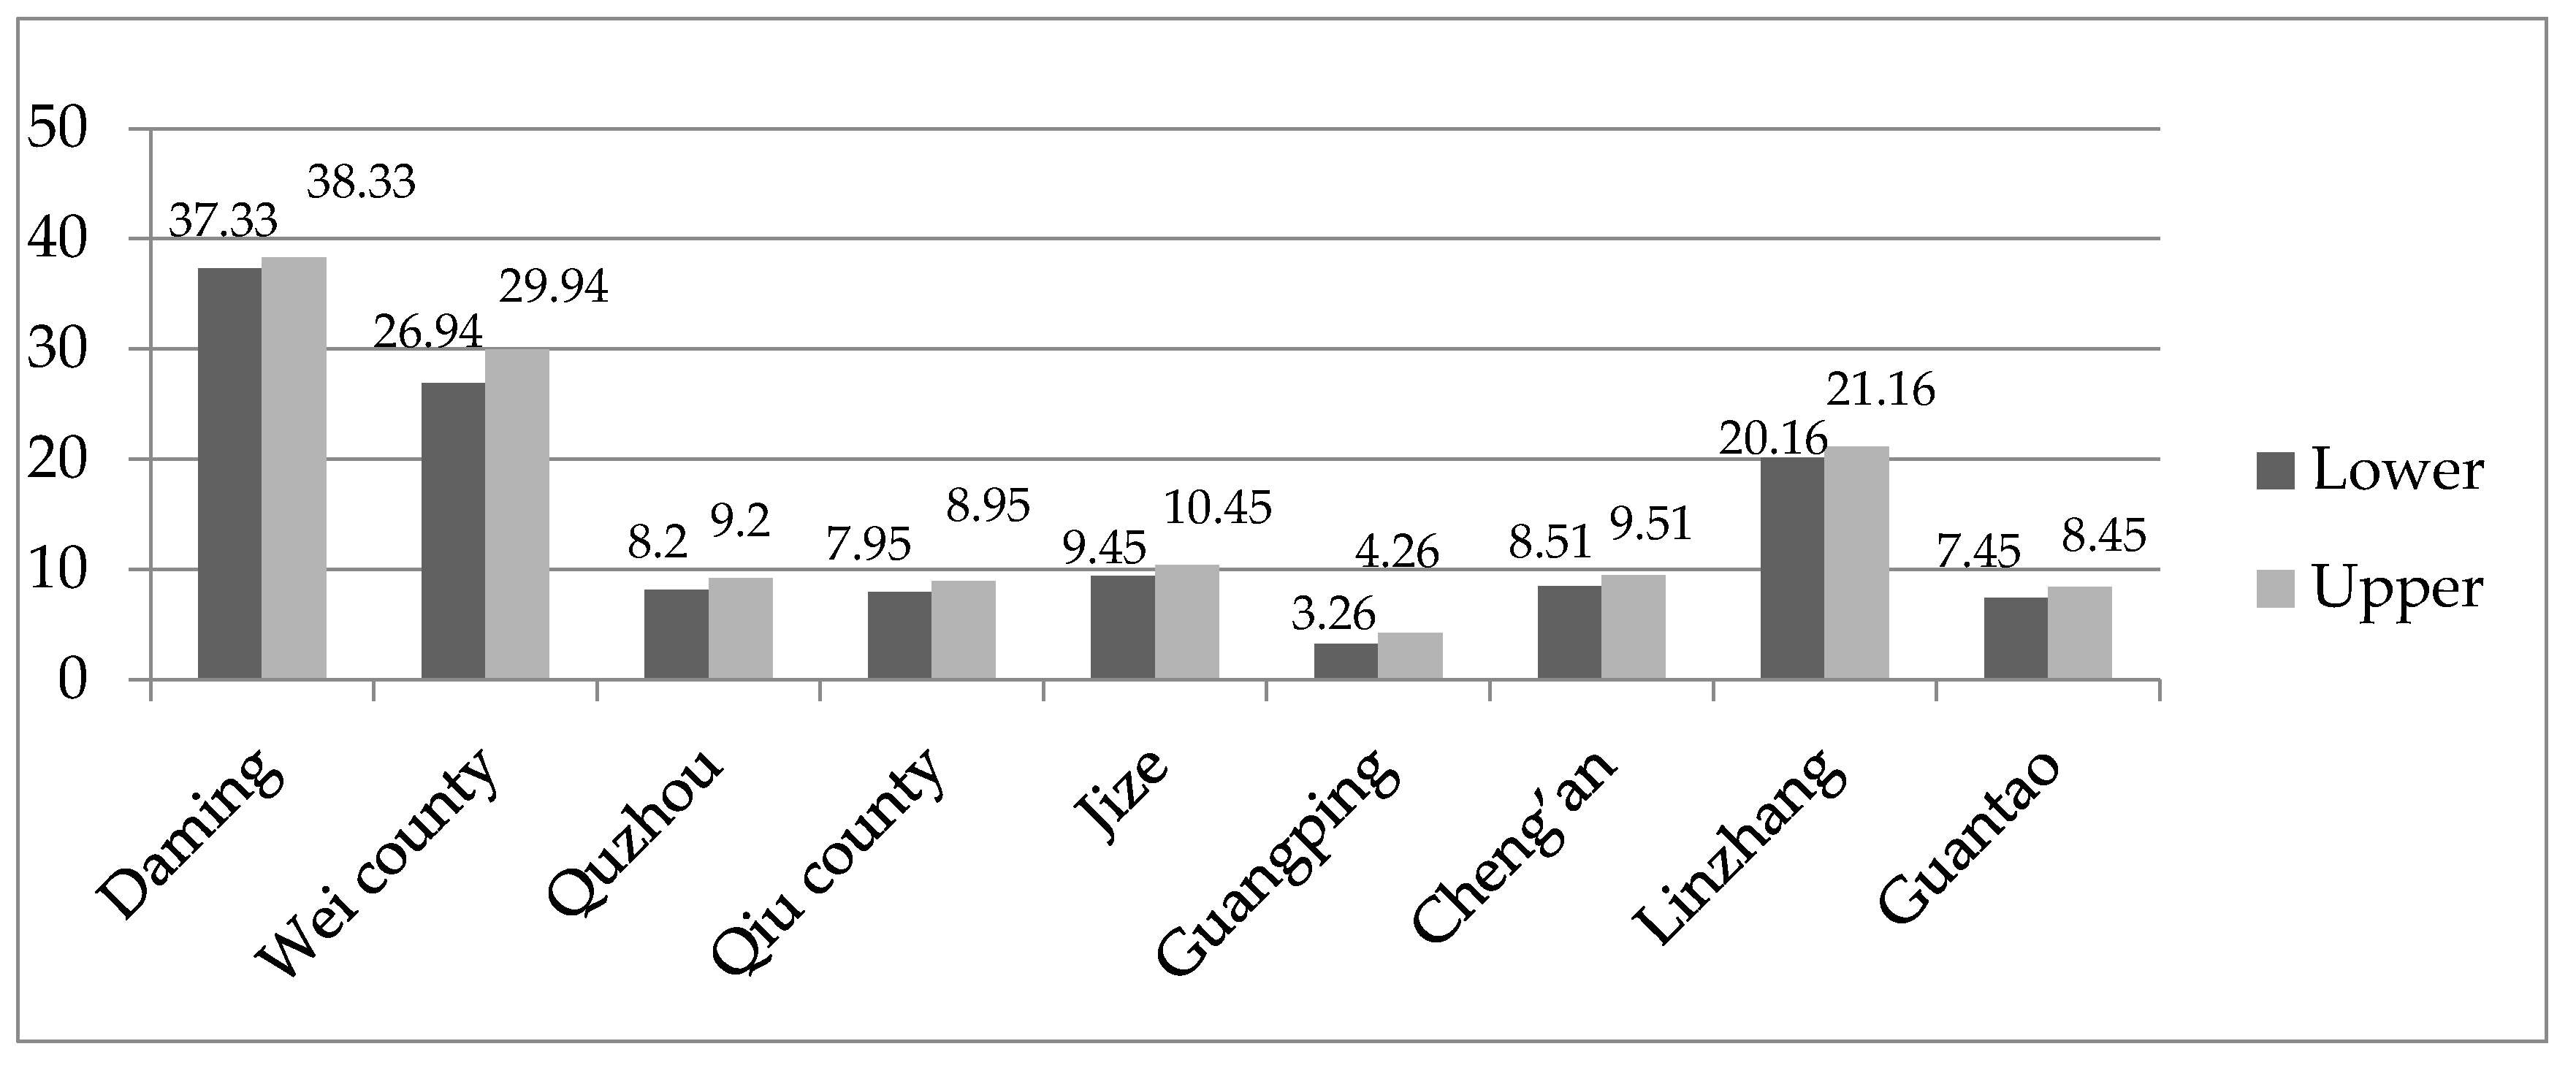
Figure 3.
Result of water resources allocation to ecology (106 m3).
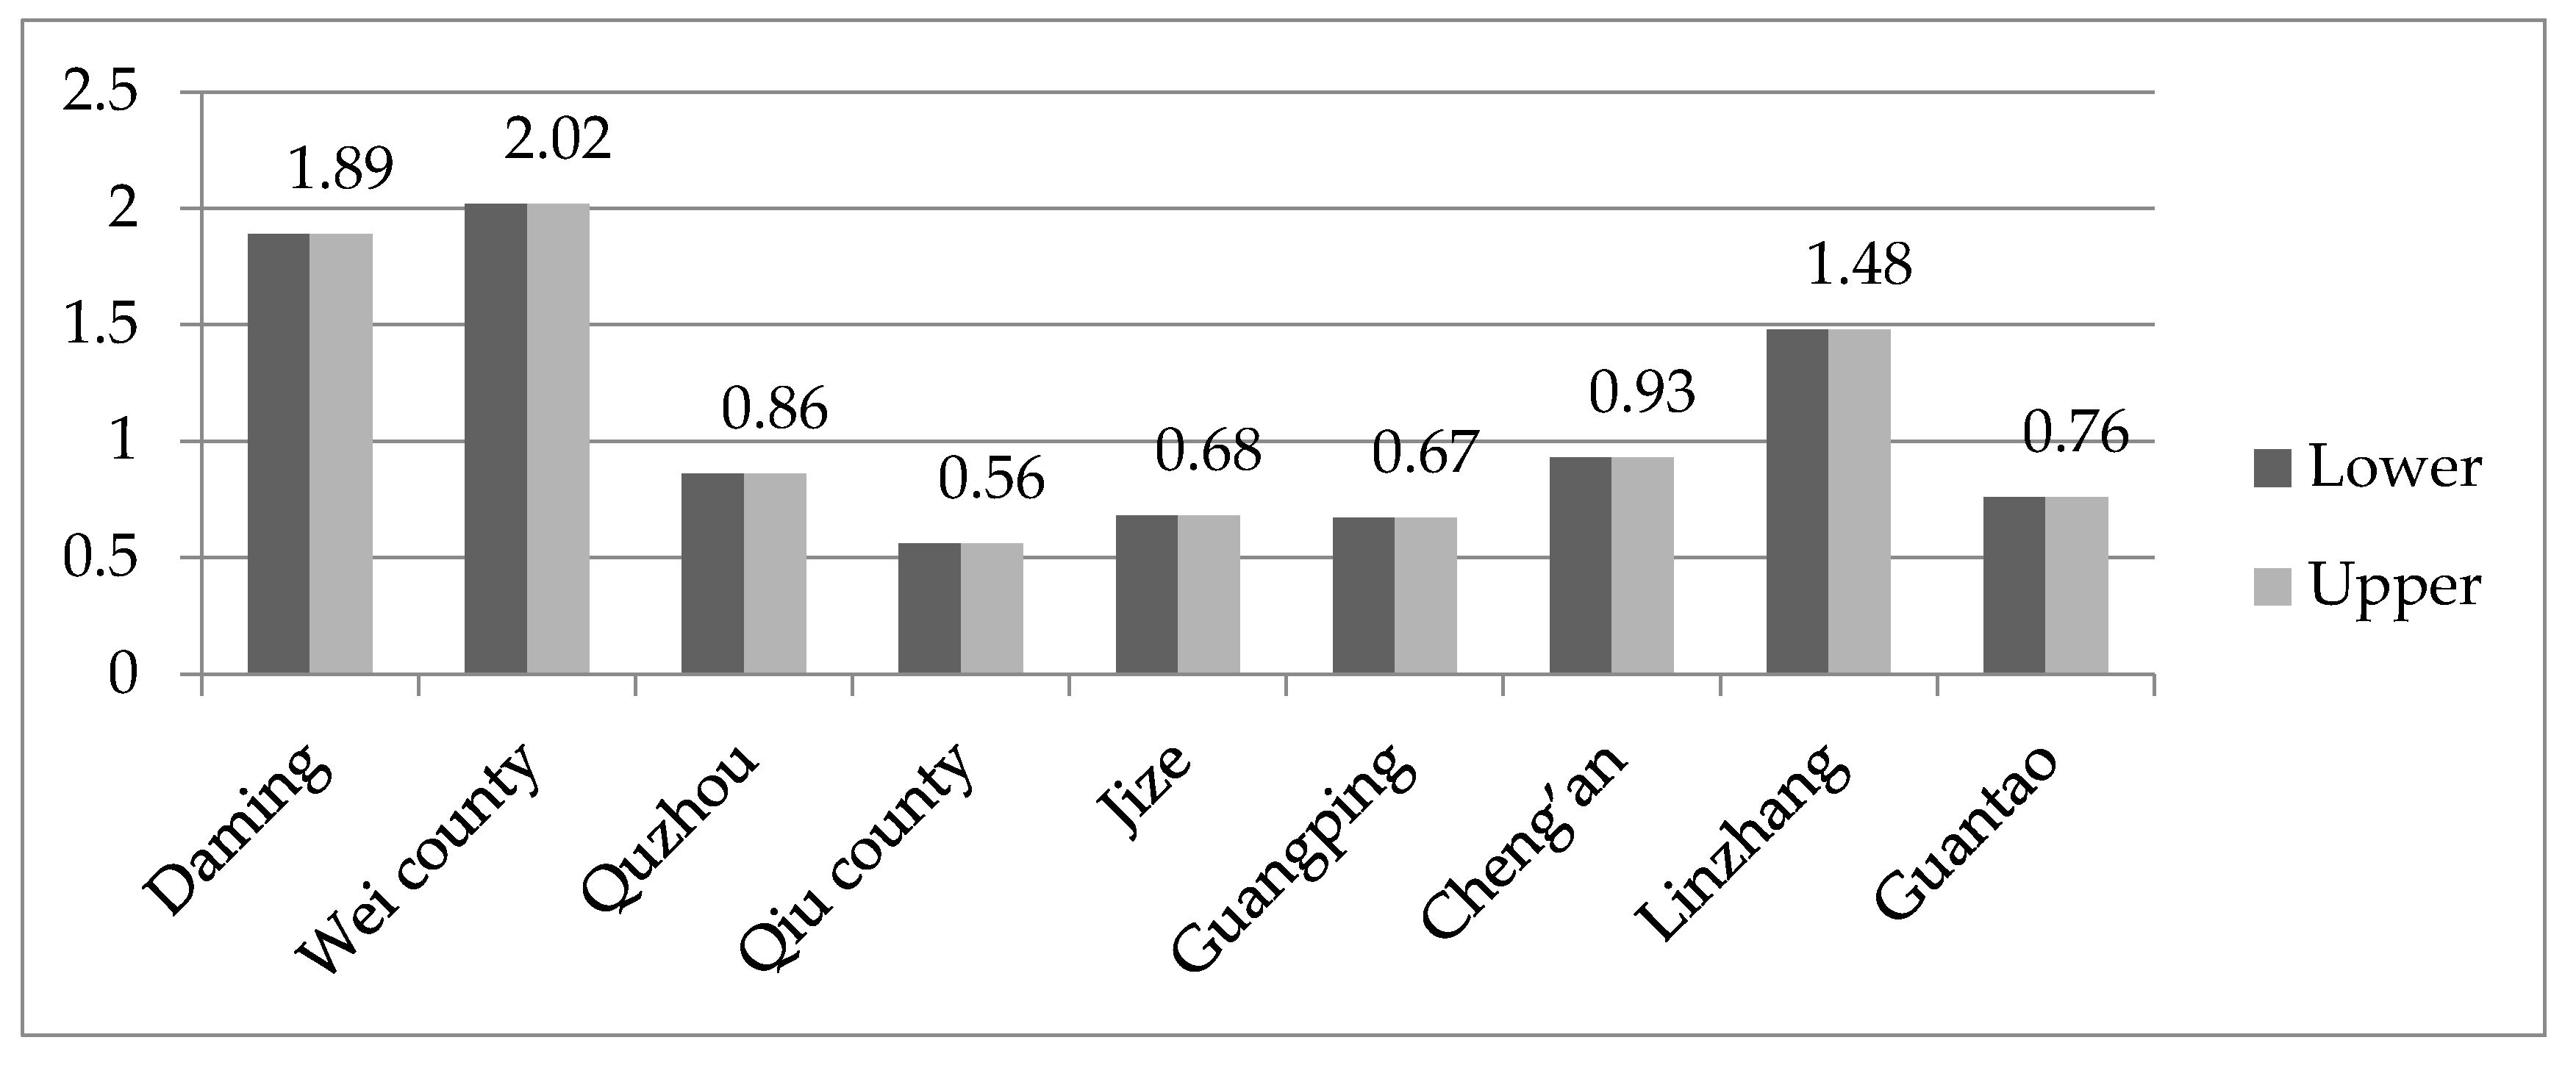
Figure 4.
Result of water resources allocation to industry (106 m3).

Figure 5.
Result of water resources allocation to agriculture (106 m3).

Table 1.
Upper and lower limit of water demand (106 m3).
| Administrative Division | Domestic Water | Ecological Water | Industrial Water | Agricultural Water | ||||
|---|---|---|---|---|---|---|---|---|
| Lower | Upper | Lower | upper | Lower | Upper | Lower | Upper | |
| Daming | [34.51, 38.15] | [39.78, 41.02] | [1.80, 1.98] | [1.80, 1.98] | [7.40, 8.18] | [11.10, 12.26] | [124.07, 137.13] | [174.33, 192.69] |
| Wei County | [25.59, 28.29] | [29.39, 32.49] | [1.92, 2.12] | [1.92, 2.12] | [6.27, 6.93] | [9.41, 10.40] | [247.19, 273.21] | [316.53, 349.85] |
| Quzhou | [7.79, 8.61] | [9.69, 10.71] | [0.82, 0.90] | [0.82, 0.90] | [7.62, 8.42] | [11.42, 12.62] | [77.36, 79.56] | [142.46, 157.46] |
| Qiu County | [7.55, 8.35] | [9.45, 10.45] | [0.53, 0.59] | [0.53, 0.59] | [1.72, 1.90] | [2.57, 2.85] | [53.76, 59.42] | [70.40, 77.81] |
| Jize | [8.98, 9.92] | [10.88, 12.02] | [0.65, 0.71] | [0.65, 0.71] | [5.37, 5.93] | [8.05, 8.89] | [51.07, 56.45] | [68.16, 75.34] |
| Guang Ping | [3.10, 3.42] | [5.00, 5.52] | [0.64, 0.70] | [0.64, 0.70] | [2.48, 2.74] | [3.71, 4.11] | [42.11, 44.70] | [66.57, 73.57] |
| Cheng’an | [8.08, 8.94] | [9.98, 11.04] | [0.88, 0.98] | [0.88, 0.98] | [7.93, 8.77] | [11.90, 13.16] | [88.29, 97.59] | [112.19, 123.99] |
| Linzhang | [18.20, 20.12] | [22.00, 24.32] | [1.41, 1.55] | [1.41, 1.55] | [2.13, 2.35] | [3.19, 3.53] | [111.06, 122.75] | [147.34, 162.84] |
| Guantao | [7.08, 7.82] | [8.98, 9.92] | [0.72, 0.80] | [0.72, 0.80] | [6.05, 6.69] | [9.08, 10.04] | [58.02, 64.12] | [75.17, 83.09] |
Table 2.
The amount of water supply (106 m3).
| Water Resources | Supply Water |
|---|---|
| Surface water | [499.17, 550.19] |
| Groundwater | [450.51, 505.30] |
| Recycled water | [89.10, 105.82] |
| Transferred water | [85.60, 96.17] |
Table 3.
Results of objective function values.
| = 0.986 | = 0.981 | ||||
|---|---|---|---|---|---|
| Economic Benefit (106 CNY) | Social Benefit ( m3) | Environmental Benefit (106 kg) | Economic Benefit (106 CNY) | Social Benefit ( m3) | Environmental Benefit (106 kg) |
| 434.01 | 79.57 | 0.045 | 410.23 | 70.21 | 0.039 |
Table 4.
Result of surface water allocated to every user (106 m3).
| Administrative Division | Domestic Water | Ecological Water | Industrial Water | Agricultural Water |
|---|---|---|---|---|
| Daming | [15.00, 15.50] | [1.34, 1.34] | [5.29, 6.78] | [40.00, 50.00] |
| Wei County | [8.49, 9.49] | [0.92, 0.92] | [4.60, 5.60] | [139.90,149.90] |
| Quzhou | [4.25, 5.25] | [0.33, 0.33] | [5.02, 5.51] | [33.65, 34.15] |
| Qiu County | [1.18, 1.56] | [0.08, 0.08] | [0.50, 0.52] | [14.00, 14.10] |
| Jize | [3.00, 3.01] | [0.13, 0.13] | [4.24, 5.64] | [17.27, 19.27] |
| Guangping | [1.75, 2.25] | [0.12, 0.12] | [1.84, 2.34] | [43.91, 45.91] |
| Cheng’an | [5.02, 5.52] | [0.23, 0.23] | [8.00, 9.49] | [39.94, 42.94] |
| Linzhang | [8.91, 9.91] | [0.40, 0.40] | [0.80, 1.00] | [37.34, 41.34] |
| Guantao | [2.50, 3.00] | [0.14, 0.14] | [4.37, 5.36] | [36.00, 41.00] |
Table 5.
Result of groundwater allocated to every user (106 m3).
| Administrative Division | Domestic Water | Ecological Water | Industrial Water | Agricultural Water |
|---|---|---|---|---|
| Daming | [4.00, 4.25] | [0.20, 0.20] | [1.02, 1.27] | [65.37, 75.57] |
| Wei County | [8.06, 8.66] | [0.34, 0.34] | [1.00, 1.50] | [75.80, 87.49] |
| Quzhou | [2.60, 2.61] | [0.24, 0.24] | [1.00, 1.50] | [41.34, 51.47] |
| Qiu County | [5.52, 6.02] | [0.31, 0.31] | [1.01, 1.30] | [36.82, 47.15] |
| Jize | [5.00, 6.00] | [0.15, 0.15] | [0.75, 1.24] | [31.23, 41.48] |
| Guangping | [0.95, 1.45] | [0.14, 0.14] | [0.45, 0.75] | [9.71, 12.66] |
| Cheng’an | [3.35, 3.74] | [0.19, 0.19] | [2.04, 2.96] | [49.93, 50.18] |
| Linzhang | [5.50, 5.71] | [0.38, 0.38] | [0.74, 1.20] | [64.79, 65.79] |
| Guantao | [1.56, 1.87] | [0.23, 0.23] | [1.00, 1.58] | [14.74, 15.00] |
Table 6.
Result of recycled water allocated to every user (106 m3).
| Administrative Division | Domestic Water | Ecological Water | Industrial Water | Agricultural Water |
|---|---|---|---|---|
| Daming | [0.00, 0.00] | [0.20, 0.20] | [0.00, 0.00] | [22.63, 22.67] |
| Wei County | [0.00, 0.00] | [0.18, 0.18] | [0.00, 0.00] | [16.03, 19.98] |
| Quzhou | [0.00, 0.00] | [0.15, 0.15] | [0.00, 0.00] | [6.29, 6.30] |
| Qiu County | [0.00, 0.00] | [0.12, 0.12] | [0.00, 0.00] | [6.15, 6.16] |
| Jize | [0.00, 0.00] | [0.15, 0.15] | [0.00, 0.00] | [7.00, 7.16] |
| Guangping | [0.00, 0.00] | [0.25, 0.25] | [0.00, 0.00] | [2.73, 2.74] |
| Cheng’an | [0.00, 0.00] | [0.25, 0.25] | [0.00, 0.00] | [5.83, 6.39] |
| Linzhang | [0.00, 0.00] | [0.23, 0.23] | [0.00, 0.00] | [13.27, 14.58] |
| Guantao | [0.00, 0.00] | [0.20, 0.20] | [0.00, 0.00] | [5.92, 5.93] |
Table 7.
Result of transferred water allocated to every user (106 m3).
| Administrative Division | Domestic Water | Ecological Water | Industrial Water | Agricultural Water |
|---|---|---|---|---|
| Daming | [18.32, 18.57] | [0.15, 0.15] | [1.08, 1.47] | [4.20, 5.00] |
| Wei County | [9.45, 10.45] | [0.36, 0.36] | [0.49, 0.63] | [8.00, 10.00] |
| Quzhou | [1.35, 1.36] | [0.14, 0.14] | [0.46, 0.54] | [10.98, 12.98] |
| Qiu County | [1.25, 1.26] | [0.23, 0.23] | [0.30, 0.43] | [4.59, 4.79] |
| Jize | [1.45, 1.49] | [0.25, 0.25] | [0.20, 0.23] | [7.00, 7.16] |
| Guangping | [0.56, 0.57] | [0.16, 0.16] | [0.00, 0.00] | [0.00, 0.00] |
| Cheng’an | [0.59, 0.60] | [0.26, 0.26] | [0.00, 0.00] | [0.00, 0.00] |
| Linzhang | [6.25, 6.26] | [0.46, 0.46] | [0.00, 0.00] | [0.00, 0.00] |
| Guantao | [3.39, 3.89] | [0.20, 0.20] | [0.90, 0.97] | [5.02, 5.04] |
Table 8.
Result of water resources allocation to every user (wi = (0.7, 0.2, 0.1)) (106 m3).
| Administrative Division | Domestic Water | Ecological Water | Industrial Water | Agricultural Water |
|---|---|---|---|---|
| Daming | [36.12, 37.12] | [1.82, 1.82] | [7.32, 9.43] | [126.50, 153.10] |
| Wei County | [25.83, 28.84] | [1.93, 1.93] | [6.13, 7.90] | [256.73, 276.68] |
| Quzhou | [8.00, 9.10] | [0.83, 0.83] | [7.03, 9.05] | [92.31, 106.39] |
| Qiu County | [8.65, 9.95] | [0.53, 0.53] | [1.74, 2.16] | [54.59, 60.80] |
| Jize | [9.35, 9.95] | [0.64, 0.64] | [4.89, 6.50] | [48.50, 53.92] |
| Guangping | [3.16, 4.06] | [0.65, 0.65] | [2.51, 3.06] | [52.65, 53.91] |
| Cheng’an | [8.31, 9.21] | [0.88, 0.88] | [8.15, 10.04] | [87.94, 94.53] |
| Linzhang | [19.26, 20.16] | [1.44, 1.44] | [2.14, 2.50] | [112.90, 126.71] |
| Guantao | [7.15, 8.05] | [0.74, 0.74] | [6.17, 7.37] | [59.07, 60.94] |
Table 9.
Result of surface water allocated to every user (wi = (0.2, 0.7, 0.1)) (106 m3).
| Administrative Division | Domestic Water | Ecological Water | Industrial Water | Agricultural Water |
|---|---|---|---|---|
| Daming | [35.63, 36.62] | [1.86, 1.86] | [7.42, 9.03] | [124.50, 150.10] |
| Wei County | [25.63, 28.54] | [2.02, 2.02] | [6.23, 7.60] | [253.73, 272.68] |
| Quzhou | [7.83, 9.00] | [0.87, 0.87] | [7.18, 9.01] | [90.31, 104.39] |
| Qiu County | [8.05, 9.35] | [0.57, 0.57] | [1.79, 2.01] | [53.59, 59.80] |
| Jize | [9.05, 9.15] | [0.68, 0.68] | [4.95, 6.55] | [47.50, 52.92] |
| Guangping | [3.12, 4.00] | [0.67, 0.67] | [2.57, 3.16] | [50.15, 51.01] |
| Cheng’an | [8.12, 9.01] | [0.94, 0.94] | [8.35, 10.34] | [84.74, 90.59] |
| Linzhang | [18.56, 29.06] | [1.47, 1.47] | [2.39, 2.70] | [106.98, 120.11] |
| Guantao | [7.10, 8.01] | [0.79, 0.79] | [6.32, 7.77] | [58.27, 58.74] |
Table 10.
Result of groundwater allocated to every user (wi = (0.2, 0.1, 0.7)) (106 m3).
| Administrative Division | Domestic Water | Ecological Water | Industrial Water | Agricultural Water |
|---|---|---|---|---|
| Daming | [34.82, 35.92] | [1.88, 1.88] | [7.44, 9.33] | [121.10, 148.14] |
| Wei County | [25.59, 28.04] | [2.10, 2.10] | [6.07, 7.40] | [248.73, 271.18] |
| Quzhou | [7.79, 8.80] | [0.89, 0.89] | [7.02, 8.71] | [87.37, 100.69] |
| Qiu County | [7.75, 8.95] | [0.61, 0.61] | [1.73, 1.91] | [51.59, 57.89] |
| Jize | [8.99, 9.01] | [0.72, 0.72] | [4.88, 6.05] | [45.70, 50.98] |
| Guangping | [3.10, 3.92] | [0.71, 0.71] | [2.48, 3.06] | [49.95, 50.01] |
| Cheng’an | [8.09, 8.81] | [0.97, 0.97] | [8.05, 10.24] | [81.04, 88.19] |
| Linzhang | [18.26, 28.76] | [1.51, 1.51] | [2.17, 2.50] | [102.18, 116.71] |
| Guantao | [7.09, 7.89] | [0.80, 0.80] | [6.10, 7.29] | [56.17, 57.24] |
Table 11.
Results of objective function values by the weighted sum method (WSM) .
| Weight | Objective Function Value | Economic Benefit (106 CNY) | Social Benefit (106 m3) | Environmental Benefit (106 kg) |
|---|---|---|---|---|
| = (0.7,0.2, 0.1) | = 309.32 × 10⁶ | 421.87 | 70.06 | 0.037 |
| = 297.64 × 10⁶ | 406.34 | 64.17 | 0.032 | |
| = (0.2, 0.7, 0.1) | = 131.37 × 10⁶ | 390.86 | 76.01 | 0.036 |
| = 123.70 × 10⁶ | 370.17 | 71.02 | 0.031 | |
| = (0.2, 0.1, 0.7) | = 84.99 × 10⁶ | 389.96 | 70.03 | 0.043 |
| = 80.28 × 10⁶ | 369.17 | 64.08 | 0.037 |
© 2017 by the authors. Licensee MDPI, Basel, Switzerland. This article is an open access article distributed under the terms and conditions of the Creative Commons Attribution (CC BY) license (http://creativecommons.org/licenses/by/4.0/).
Share and Cite
MDPI and ACS Style
Suo, M.; Wu, P.; Zhou, B. An Integrated Method for Interval Multi-Objective Planning of a Water Resource System in the Eastern Part of Handan. Water 2017, 9, 528. https://doi.org/10.3390/w9070528
AMA Style
Suo M, Wu P, Zhou B. An Integrated Method for Interval Multi-Objective Planning of a Water Resource System in the Eastern Part of Handan. Water. 2017; 9(7):528. https://doi.org/10.3390/w9070528
Chicago/Turabian StyleSuo, Meiqin, Pengfei Wu, and Bin Zhou. 2017. "An Integrated Method for Interval Multi-Objective Planning of a Water Resource System in the Eastern Part of Handan" Water 9, no. 7: 528. https://doi.org/10.3390/w9070528
Note that from the first issue of 2016, this journal uses article numbers instead of page numbers. See further details here.