Phosphorus Dynamics in Long-Term Flooded, Drained, and Reflooded Soils


1
Department of Environmental Science, Jiangsu Normal University, Xuzhou 221116, China
2
School of Resource and Earth Science, China University of Mining and Technology, Xuzhou 221116, China
3
Department of Biological and Agricultural Engineering, Texas U&M University, College Station, TX 77843, USA
4
Key Laboratory of Poyang Lake Wetland and Watershed Research, Ministry of Education, Jiangxi Normal University, Nanchang 330022, China
5
USDA-ARS Center for Agricultural Resources Research, Fort Collins, CO 80526, USA
*
Author to whom correspondence should be addressed.
Water 2017, 9(7), 531; https://doi.org/10.3390/w9070531
Submission received: 2 June 2017
/
Revised: 11 July 2017
/
Accepted: 12 July 2017
/
Published: 17 July 2017
Abstract
:In flooded areas, soils are often exposed to standing water and subsequent drainage, thus over fertilization can release excess phosphorus (P) into surface water and groundwater. To investigate P release and transformation processes in flooded alkaline soils, wheat-growing soil and vegetable-growing soil were selected. We flooded-drained-reflooded two soils for 35 d, then drained the soils, and 10 d later reflooded the soils for 17 d. Dissolved reactive phosphorus (DRP), soil inorganic P fractions, Olsen P, pH, and Eh in floodwater and pore water were analyzed. The wheat-growing soil had significantly higher floodwater DRP concentrations than vegetable-growing soil, and floodwater DRP in both soils decreased with the number of flooding days. During the reflooding period, DRP in overlying floodwater from both soils was less than 0.87 mg/L, which was 3–25 times less than that during the flooding period. Regardless of flooding or reflooding, pore water DRP decreased with flooding days. The highest concentration of pore water DRP observed at a 5-cm depth. Under the effect of fertilizing and flooding, the risk of vertical P movement in 10–50 cm was enhanced. P diffusion occurred from the top to the bottom of the soils. After flooding, Al-P increased in both soils, and Fe-P, O-P, Ca2-P decreased, while Fe-P, Al-P, and O-P increased after reflooding, When Olsen P in the vegetable-growing soil exceeded 180.7 mg/kg and Olsen P in the wheat-growing soil exceeded 40.8 mg/kg, the concentration of DRP in pore water increased significantly. Our results showed that changes in floodwater and pore water DRP concentrations, soil inorganic P fractions, and Olsen P are significantly affected by fertilizing and flooding; therefore, careful fertilizer management should be employed on flooded soils to avoid excess P loss.
1. Introduction
The loss of phosphorus (P) from agricultural soils to surface water and groundwater has been a worldwide concern for many years, but losses of P from agriculture still contribute to nonpoint pollution [1,2,3,4,5,6]. P is a major contributor to eutrophication [7,8], and its loss from agricultural nonpoint sources can contribute to this process.
Many studies have examined soil P adsorption and release, especially under flooded conditions [9,10,11,12,13,14,15,16,17,18]. Flooding and draining causes chemical changes in soils, which leads to the dynamic release or adsorption of soil P [19,20]. In flooding areas, soil P release mechanics and loss loads can be greatly affected by the flooding frequency and differences in water depth. During the rainy season, soils in some regions of China are often submerged under floodwaters. In these areas, the water–soil system experiences anaerobic conditions, and soil P can be readily released into surface and subsurface water or transported with the water deeper into the soil. After the floodwaters recede, P in the overlying water is carried into rivers and lakes along with runoff, thereby accelerating eutrophication. Meanwhile, the water–soil system becomes aerobic, and P availability decreases and P can be re-adsorbed by the soil [11].
Frequent flooding and drainage can alter pH and Eh in the water–soil system and thus affect soil P transformations and its availability in floodwater and pore water. Flooding can decrease Eh, which increases P release due to iron reduction [21,22]. However, a secondary reaction between Fe2+ (produced by the reduction of Fe3+) and soluble P can decrease soluble P [23]. When there are higher concentrations of Fe3+ in pore water or floodwater, Fe3+ and Fe2+ form mixed Fe2+-Fe3+ hydroxide with a larger specific surface area, which increases the adsorption of soluble P [24]. During flooding, the pH of acid soils increases, and the pH of alkaline soil decreases approaching neutral conditions [25]. Sah et al. reported that during flooding the Al-P fraction in soils decreased and the Fe-P fraction increased and that during draining Fe-P fraction decreased [9]. Olila et al. found that the amount of P released during flooding-draining periods was 2–4 times the amount released in continuously flooded conditions [26]. Twinch et al. reported that the biological availability of P decreased after draining [27]. During draining periods, some ferrous minerals were easily oxidized to amorphous iron oxide hydroxide, which has a higher adsorption capacity due to its larger specific surface area.
Previous research has reported transformations between inorganic and organic forms of P and changes in concentrations of soluble P in floodwater and subsurface water (0–20 cm) [10,15,18]. However, more studies need to focus on vertical P movement at depth in frequently flooded alkaline soils. The P transport in soil is closely related to the groundwater conditions. Phosphorus is readily accumulated deeper in the soil. Although its mobilization in soils is low due to high soil P adsorption capacity, more attention has been paid to the potential for P to pollute surface water and groundwater [28,29,30], especially in over-fertilized soils. Ding et al. used six different manure fertilizers to investigate P leaching risk and found that the risk of vertical P movement in the 20–40 cm soil depth increased when manure fertilization exceeded 7500 kg·ha−2 [30]. To address its contribution to eutrophication, agricultural non-point source P and its transport and transformation in rivers, lakes, wetlands, and agricultural soils have been studied [11,26]. However, little research has focused on P release and transformation in alkaline soils in flood zones. P release and transformations in flooded soils are considerably influenced by flood regimes. Therefore, we studied two types of fertilized soils, which were flooded, drained, and then reflooded, to investigate (i) the effects of long-term flooding, draining, and then reflooding on phosphorus release in different soil layers; (ii) the transformations of soil inorganic P fractions; and (iii) the relationships between Olsen P and DRP concentrations in pore water.
The objectives of our study were to determine how flood regimes affect transformations of P fractions and the potential relationships between pore water DRP and Olsen P in flooded alkaline soils. A second objective was to test the response of DRP concentration in floodwater and pore water to flood regimes.
2. Materials and Methods
2.1. Study Site
The soils used in this experiment were collected from Sanpu, in Xuzhou City, Jiangsu province, China (34°05′ N, 117°12′ E, altitude 28.81 m) in the river floodplain and are subject to periodic flooding. The region is in the Huaihe River Basin, and has an average annual temperature of 14 °C and precipitation of 860 mm. The soils are classified as Leptosols (fluvo-aquic soil) [31].
2.2. Soil Sampling and Preparation
Two types of soil were used in this experiment: a vegetable-growing soil and a wheat-growing soil. This experiment is for yearly soil fertilization when plants are not growing intensively. Soil samples were collected from six different depth intervals using core tubes: 0–5 cm, 5–15 cm, 15–25 cm, 25–35 cm, 35–45 cm, and 45–60 cm. Each sample consisted of six subsamples, which were mixed together and homogenized to obtain a single sample. A portion of each soil sample was air dried, passed through a 0.15-mm sieve. The remaining soil was used to fill the soil columns.
The soil columns were made of Perspex, with a height of 1 m and an internal diameter of 20 cm. They were filled with 45–60 cm, 35–45 cm, 25–35 cm, 15–25 cm, 5–15 cm, and 0–5 cm soils. To reduce the disturbance of the soil, the backfill soil was filled into the column according to the wet bulk density, which is 1.27–1.80 g/cm3. Below 45–60 cm, the soil was fine sandy, and its particle diameter was larger than that of the upper soils in the column. There was also a nylon wire netting between the 45–60 cm soil and fine sand. At the bottom of the sandy section, there was a water-tap to drain the column water.
2.3. Experimental Set-up
Two replicates of each soil were used and there were a total of four soil columns. Values are means of two replicates. Before flooding, the four columns were saturated with tap water from the bottom up to remove entrapped air. Next, fertilizer was added: 1.38 g KH2PO4 was dissolved in 4 L tap water, and this solution, in which the PO4-P concentration was 34.5 mg/L, was put into the soil column. Three days later, we added tap water into the soil column until the water in the column was 20 cm deep. The soil columns were covered with a plastic cover to minimize evaporation and kept at room temperature (26 ± 2 °C).
Flooding, drying, and reflooding treatments were used to all soil columns: (i) long-term flooding-draining, which involved flooding the soil columns to a depth of approximately 20 cm for 35 days and then draining the floodwater and drying the soils for 13 days and (ii) reflooding, which involved reflooding the soil columns to the same depth of 20 cm for 16 days. Because of evaporation and water-sampling, 250 mL tap water was added into soil columns every 3 days during the flooding period.
During flooding and reflooding, pore water in each soil layer were collected with Rhizon samplers (Rhizosphere Research Products, Wageningen, The Netherlands) placed horizontally at 5, 10, 20, 30, 40, 50, and 60 cm depth in the soil profile. Rhizon samplers extract small volumes of pore water from soil, in an easy, non-destructive way. They are made of inert polymer with no ion exchange properties. Other advantages of Rhizons are their small diameter and low dead volume. The pore size of the porous part is 0.12–0.18 µm, hence filtering the samples before analyzing is unnecessary. Pore water samples were collected using these samplers every two or three days, and analyzed for pH, Eh, and DRP. Grab samples of standing flood water were collected manually during the flooded periods.
On the first day of draining and redraining, soil samples were collected from each layer on one side of the soil column, opposite from the Rhizon samplers. Soil samples were air dried, sieved to 0.15 mm, and analyzed for TP, Olsen P, and inorganic phosphorus fractions.
2.4. Water and Soil Analysis
Soil samples were used to measure TP, Olsen P (soil available phosphorus), and inorganic P fractions. The analysis method of P forms in soil was given in Table 1. We used different extractant to analyze P forms and all extracted solutions were analyzed with molybdenum blue method [32]. The Olsen P was measured using the method described by Olsen [33]. The concentrations of inorganic P fractions were measured using methods described by Lu [34]. The soils were subjected to a sequential extraction: (i) Ca2-P (CaHPO4·2H2O); (ii) Ca8-P (Ca8H2 (PO4)6·5H2O); (iii) Al-P; (iv) Fe-P; (v) occluded P (O-P); and (vi) Ca10-P (Ca10 (PO4)6(OH)2).
The contents of sand, silt, and clay were measured with a Laser particle size analyzer (LS-POP (6)); OMEC, Zhuhai, Guangdong, China). Soil samples were extracted by potassium dichromate and H2SO4 and then analyzed colorimetrically for organic matter [34]. Soil pH was determined in solution (1:1 soil/water) using a PHS-3C pH meter (Leici, Shanghai, China).
Floodwater was extracted with a 25-mL syringe, and pore water was extracted with Rhizon samplers. Then, water samples were filtered (0.45-μm membrane filters) and measured for pH, Eh, and DRP.
2.5. Statistical Analysis
SPSS 17.0 was applied for statistical analysis. Pearson correlations were used to discuss the relationship between floodwater P and pore water P.
3. Results and Discussion
3.1. General Soil Properties
Both soil types were alkaline, with pH values ranging from 7.31 to 7.96 (Table 2). According to the international classification of soil texture, both soils were silt loams at the 0–45 cm depth, whereas the 45–60 cm depth interval was a loam in the vegetable-growing soil (VS) and a sandy loam in the wheat-growing soil (WS). The clay content varied from 34.6% to 59.2% in VS and from 17.23% to 60.7% in WS and was higher in VS. Therefore, the specific surface area of VS was larger, and its P adsorption should be higher. TP, organic matter (OM), and Olsen P in both soils decreased progressively with soil depth. TP and Olsen P were higher in VS than WS. Furthermore, Olsen P in VS was 106.9–274.2 mg/kg at 0–35 cm. The content of Olsen P in surface soil was 79.87–210.32 mg/kg, which was higher than that in the research of Amarawansha et al. [18]. This will lead to increased soil P leaching into flood water and pore water and increased the risk of eutrophication of rivers and lakes from agricultural non-point source pollution.
3.2. Standing Floodwater P Following Long-Term Flooding, Draining, and Reflooding
Previous studies in flooded soils found that the P content of standing floodwater was low in unfertilized soils. Tian et al. found that in fertilized acid soils, the P content of floodwater was higher than in unamended soils [15]. Amarawansha et al. also found that the P content of floodwater and pore water in manured alkaline soil was significantly higher than in unamended alkaline soil [18]. The effects of long-term flooding, draining, and reflooding on pH, Eh, and DRP in floodwater are shown in Figure 1 and Figure 2.
During the flooding period, floodwater pH increased significantly in both VS and WS, from 7.61 to 8.55 and from 7.48 to 8.35, respectively (Figure 1). Floodwater pH increased during the flooding and reflooding periods due to long-term exposure to the atmosphere [18]. After draining, the floodwater pH, which was initially higher than 8, decreased slightly during the reflooding period. Due to higher pH in floodwater, ion exchange occurred between OH- and phosphate in soils, which released P into floodwater. Floodwater Eh of both soils decreased over time during flooding, which led to the release of P banded by iron [21,23,35].
During the flooding period, the DRP concentrations in floodwater decreased significantly over time, likely due to the effect of soil adsorption. In the early period, the concentration of DRP was high: 11.88 mg/L and 21.92 mg/L in VS and WS, respectively. However, it was only 1.39 mg/L and 3.28 mg/L, respectively, on day 35. DRP decreased 88.3% in VS and 85.0% in WS. The result was consistent with those of Amarawansha et.al [18] but different from those of Tian [36]. Tian et al. found that DRP in floodwater decreased with time of flooding in amended acid soils. While, Amarawansha et al. found that DRP in surface floodwater increased within a few weeks of flooding, reached a peak, and then decreased slightly with time of flooding in most amended soils [18]. This could be a result of differences in fertilizing methods or maybe the soil texture and characteristics. In the experiment of Amarawansha, soils were amended first and then kept at room temperature for 4 weeks with field moisture before flooding. So, amended P was mostly adsorbed by soils in the early days and then released with the flooding days. In contrast, in our experiment the soils were amended by KH2PO4 solution for 3 days and then flooded to simulate the effect of flooding on soils. Within a few weeks of flooding, DRP in floodwater decreased. This could be the result of soil adsorption, and adsorption was likely the dominant process.
During the flooding period, DRP was higher in WS than in VS at the same fertilization rate. This meant that the P adsorption capacity was higher in VS than in WS, which could be due to the higher clay content of VS and thus larger specific surface area, or maybe because of metal ions, such as Fe, Al and Ca et al. [11,37]. During reflooding, DRP concentrations in standing floodwater on both soils were less than 0.87 mg/L, which was 3–25 times less than those during the flooding period (Figure 1). DRP increased slightly during reflooding. It was probably because of P being released into floodwater by soil. Furthermore, DRP concentrations were higher in VS than in WS during reflooding. That was to say that P content release from VS was more than that from WS. So, it could be noted that the ability of VS to release P was greater than that of WS.
3.3. Phosphorus Distribution in Pore Water
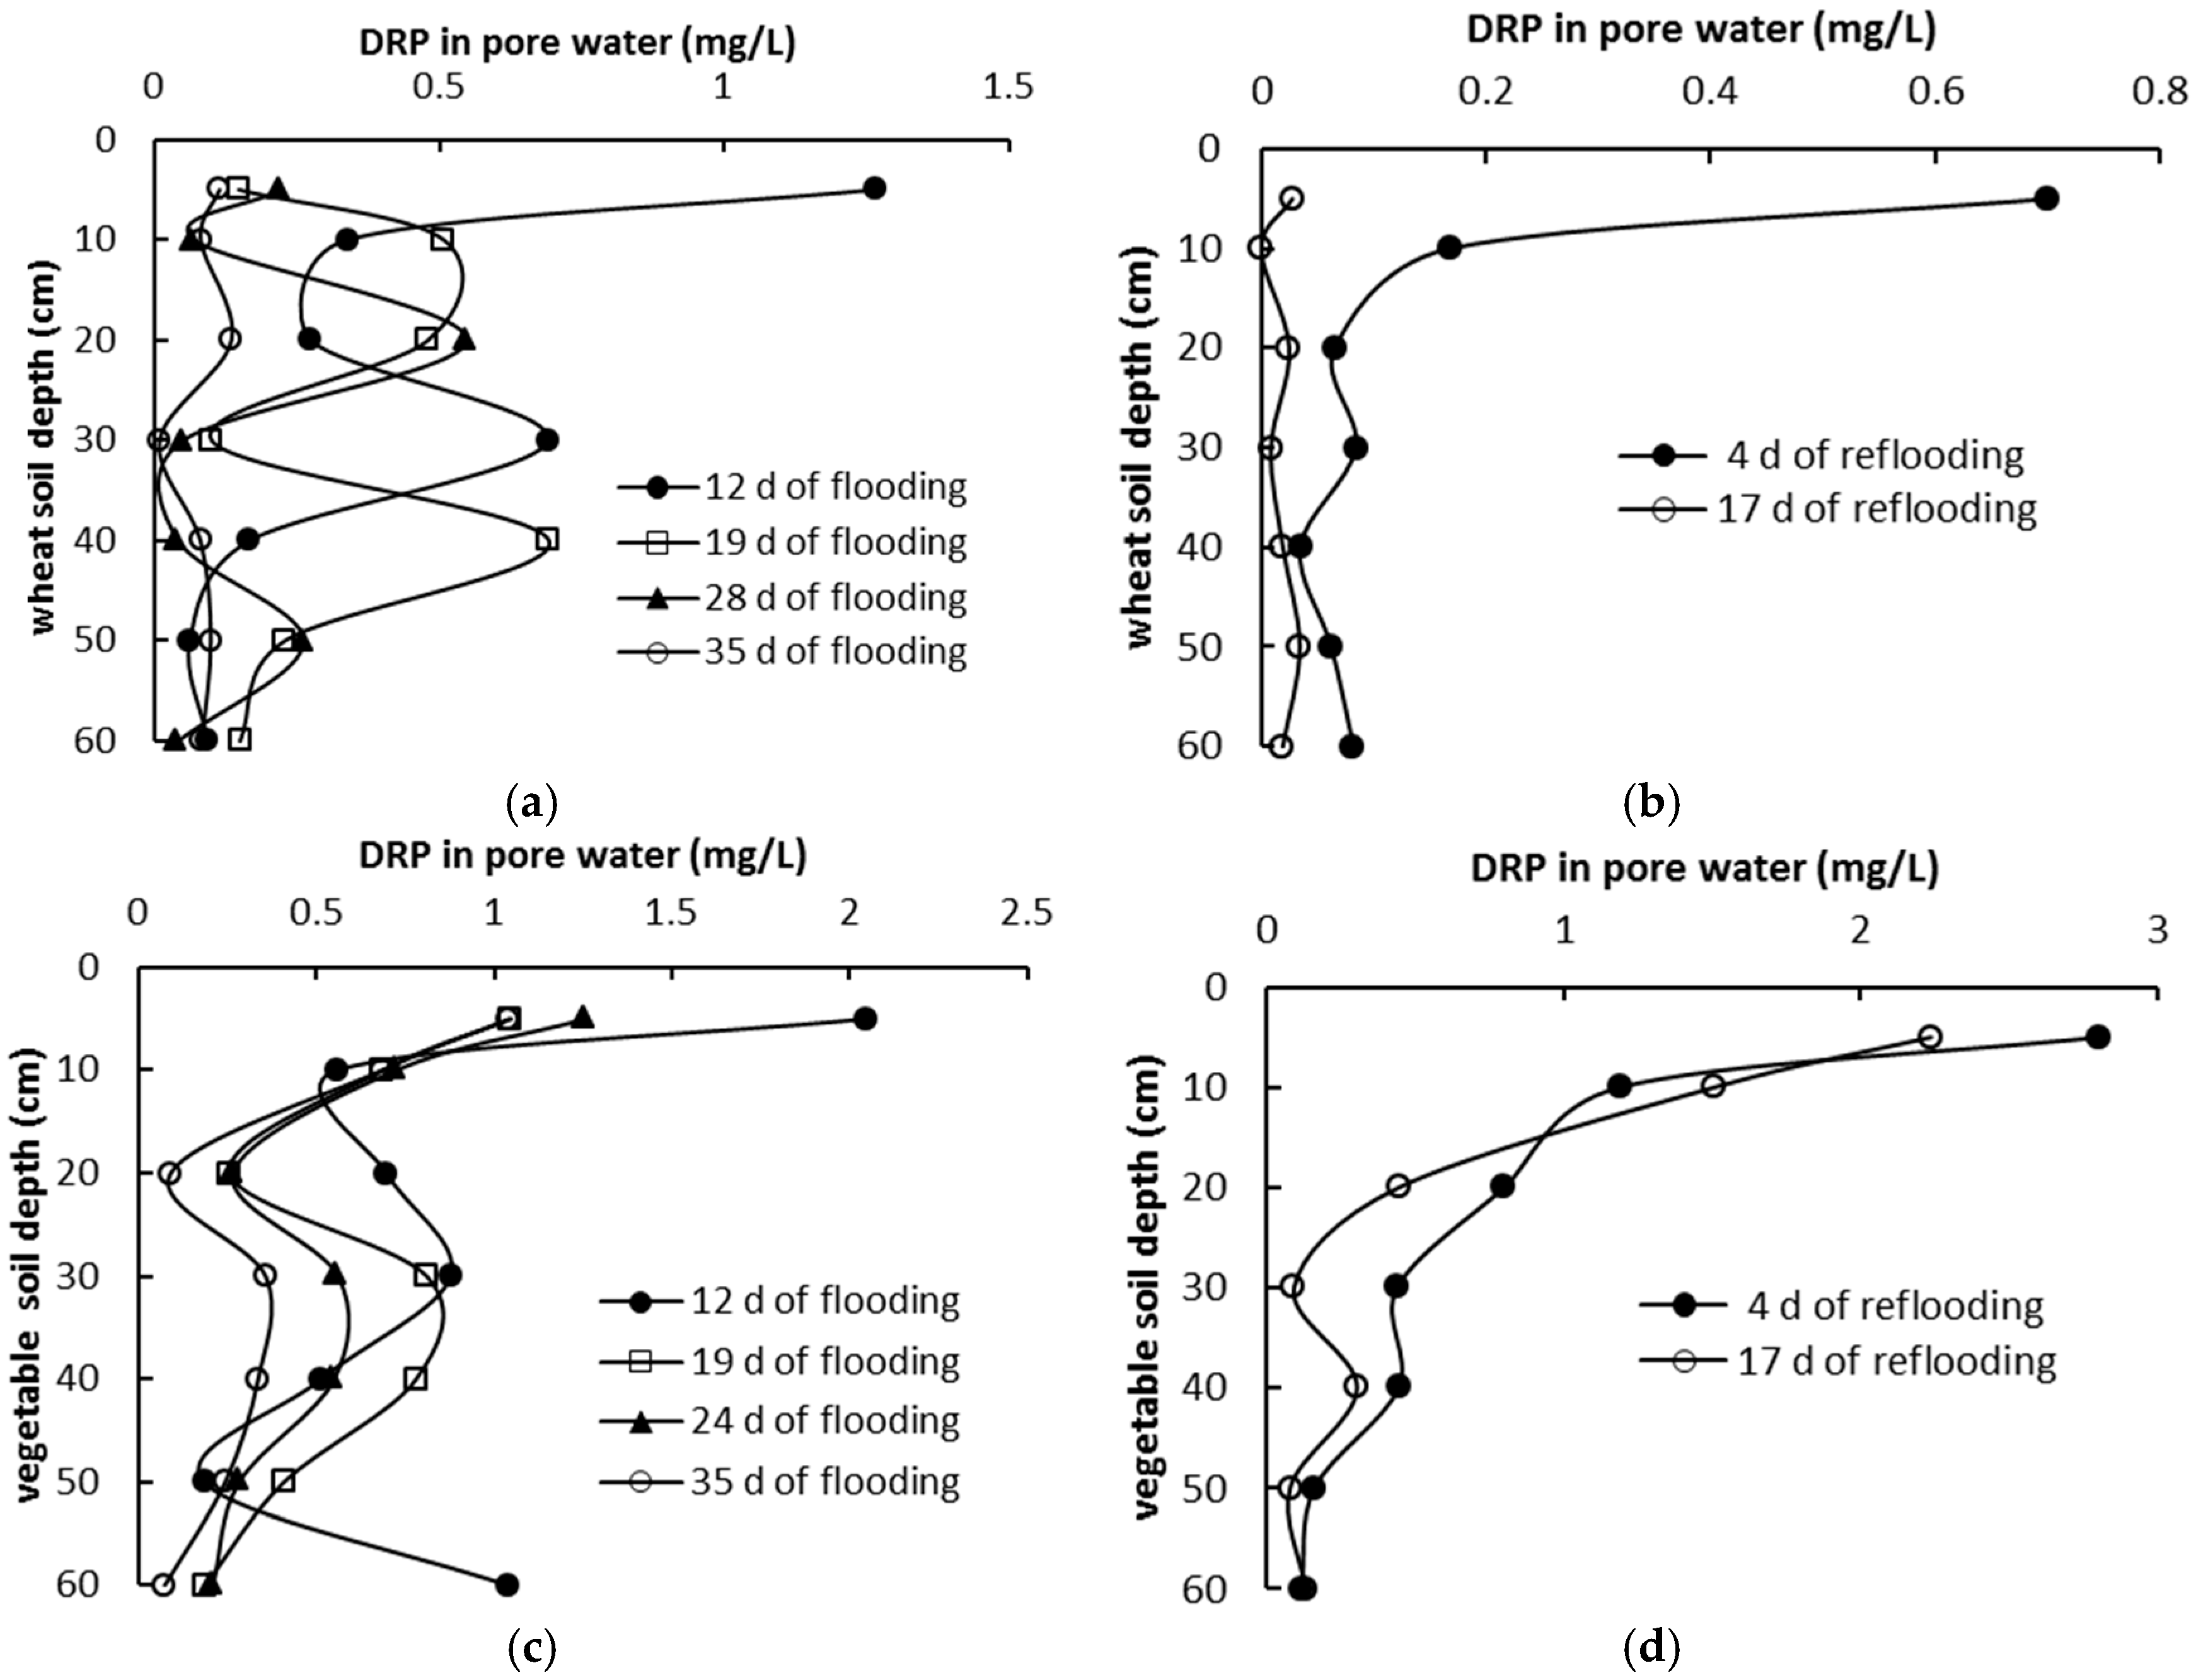
Regardless of WS or VS, DRP concentrations in floodwater and pore water were positively correlated (r = 0.41–0.81, p = 0.01) (Figure 3). During both flooding and reflooding periods in WS, floodwater DRP was higher than pore water DRP at 5 cm, which induced P diffusion from floodwater to pore water. In contrast, in VS, pore water DRP was higher than floodwater DRP after 28 d of flooding, including during reflooding. There was efficient P diffusion from pore water to floodwater as was also shown by Young et al. [10] and Amarawansha et al. [18]. Young and Ross found that pore water P increased with increasing Fe2+ concentration. This was because Fe-P in flooded soil dissolved under anaerobic conditions, which promoted P release into pore water [38,39,40].
During reflooding, DRP in pore water decreased over time. In both WS and VS, DRP in pore water decreased gradually along the soil profile. The effect of diffusion was less during the reflooding period than during the flooding period because of the lower DRP concentration in floodwater. Pore water DRP was lower during the reflooding period than during the flooding period. The observed pattern was very different in VS. Furthermore, pore water DRP was higher in VS than in WS. Those differences were probably due to differences in soil adsorption and desorption.
On day 12 of flooding, a higher DRP concentration was observed in pore water at 5 cm and 30 cm, both of which decreased on day 19. In contrast, DRP at 10 cm and 40 cm increased on day 19. There was an opposite trend of DRP between days 12 and 19. There was a higher DRP concentration on day 28 in 20-cm pore water, which was greater than that on days 12 and 19. In contrast, DRP in pore water at the 30–60 cm soil depth was very low and was the same on day 35. Regardless of the flooding treatment, DRP in pore water decreased at the end of flooding.
In VS, after 19 d of flooding, pore water DRP was highest at 5 cm (greater than 1 mg/L), and relatively lower at 20 cm and 60 cm (less than 0.5 mg/L; Figure 4). DRP decreased over time during flooding except at 10, 40, and 50 cm. The slow diffusion of P was also observed. For example, DRP at 5 cm decreased over time during flooding, whereas DRP at 10 cm increased. There was diffusion of P from 5 cm to 10 cm due to a concentration gradient. Under fertilized and flooded conditions, the risk of vertical P movement was increased.
Floodwater DRP was higher in WS than in VS during the flooding period. Due to its larger surface area, P adsorption and release capacities were greater in VS than WS (Table 1 and Table 2). During the reflooding period, pore water DRP in WS was relatively lower, which may be due to the effect of soil texture. Clay content was higher in VS than in WS. The porosity of VS was relatively uniform, which promoted P diffusion.
3.4. Soil P Following Long-Term Flooding, Draining, and Reflooding
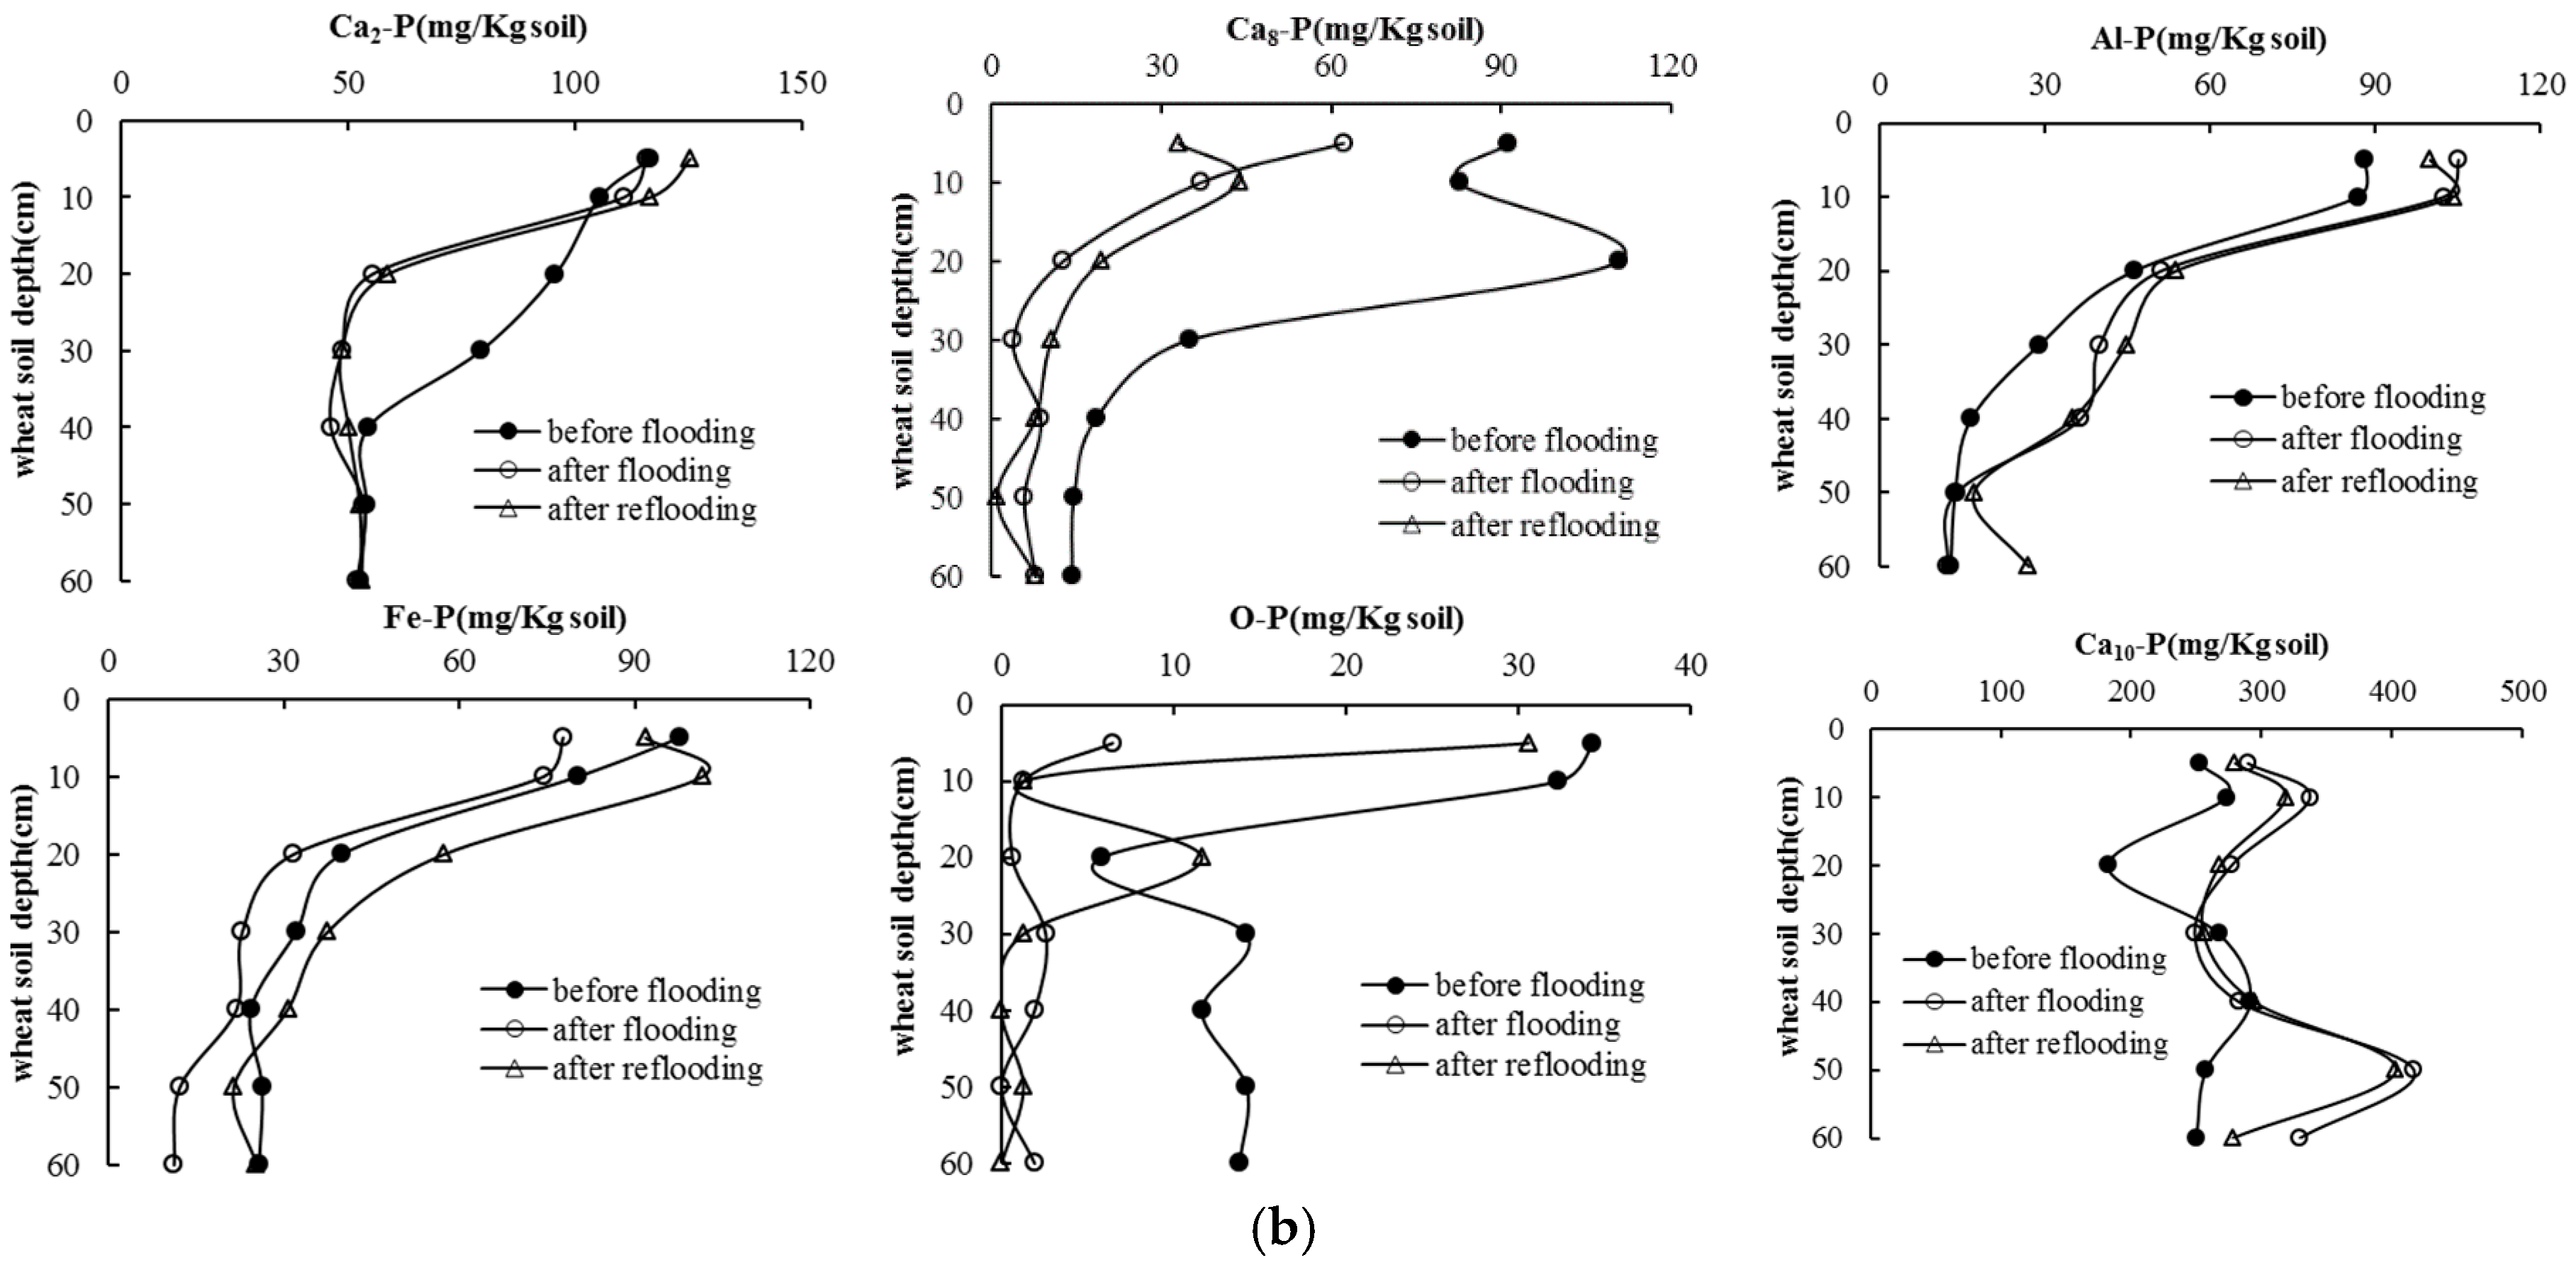
The soil O-P fraction was the smallest inorganic P fraction in both soils (less than 35 mg/kg), followed by Fe-P and Al-P, which accounted for 2.6–14.3% and 3.0–13.1% of total inorganic P, respectively (Figure 5). Total Ca-P ranged from 67.7% to 91.1%. Ca-P was the dominant fraction in alkaline soils, and Ca compounds in alkaline soils played an important role in P retention and most of inorganic P was bound to Ca compounds [41,42]. The highest concentration of the Ca10-P fraction (37.1–70.0% of total inorganic P) was observed in WS. The largest fraction in VS was Ca8-P (14.2–51.0%), followed by Ca2-P and Ca10-P. As a result of long-term fertilization and irrigation, total inorganic P content was significantly higher in VS than in WS (0.37–1.71 g/L and 0.38–0.68 g/L, respectively). In both WS and VS, inorganic P fractions decreased along the soil profile. The highest concentrations of inorganic P were observed at 0–10 cm.
After the KH2PO4 solution was added, the Al-P and Ca10-P fractions increased during the flooding period, but other soil P fractions decreased in WS (Figure 5). The Al-P content during the flooding and reflooding periods was 1.7–118.9% higher than before flooding. During both flooding and reflooding periods, Ca8-P was 31.9–88.9% and 45.6–93.5%, respectively, lower than before flooding. Except at 30 cm and 40 cm, Ca10-P was 14.6–61.9% and 10.8–56.5%, respectively, higher than before flooding.
A different pattern was observed in VS (Figure 5). The Al-P and Ca8-P fractions increased, while other P fractions decreased. The Al-P content during the flooding and reflooding periods was 18–97% more than that before flooding. During both flooding and reflooding periods, Ca8-P at 10–40 cm was 16–64% and 11–27% higher, respectively, than before flooding. Ca10-P at 20–40 cm was 7–17% lower than before flooding but increased at 5, 10, 50, and 60 cm.
The increased concentrations of Al-P, Ca8-P, and Ca10-P may be due to fertilizer inputs and transformations among these fractions. After fertilizing, DRP was tied up by Al and Ca, which increased the concentrations of Al-P and Ca-P. Flooding and draining changed conditions in the soil–water system, which greatly affected the transformations among inorganic phosphorus fractions, especially calcium phosphate. Ca2-P and Ca8-P were the effective P sources in alkaline soils and were readily soluble [43]. Leher et al. [44] and Lindsay et al. [45] reported that calcium phosphate occurred mainly as Ca2-P, Ca8-P, and Ca10-P. Ca2-P can transform into Ca8-P, and Ca8-P can transform into Ca10-P. The increase in Ca10-P in WS may be due to the transformation of Ca2-P and Ca8-P. However, total Ca-P at 0–30 cm in both soils decreased slightly after reflooding, compared to flooding.
In both soils, Fe-P decreased after flooding. When soil is subjected to reducing conditions, Fe3+ is reduced to Fe2+, and the associated phosphorus is released, so Fe-P decreases [21,23,36]. After 10 d of draining, the concentrations of Fe-P, Al-P, and O-P during the reflooding period were greater than those during the flooding period. Several studies have examined P transformations in flooded-drained soils [9,14,40,46,47]. Furthermore, Ca-P was different in the four soils and increased only in the soil with high initial Ca-P. The differences in these findings may be due to differences in soil management, fertilizer type, incubation length, and initial soil characteristics.
3.5. Relationships between Olsen P and Dissolved P in Pore Water
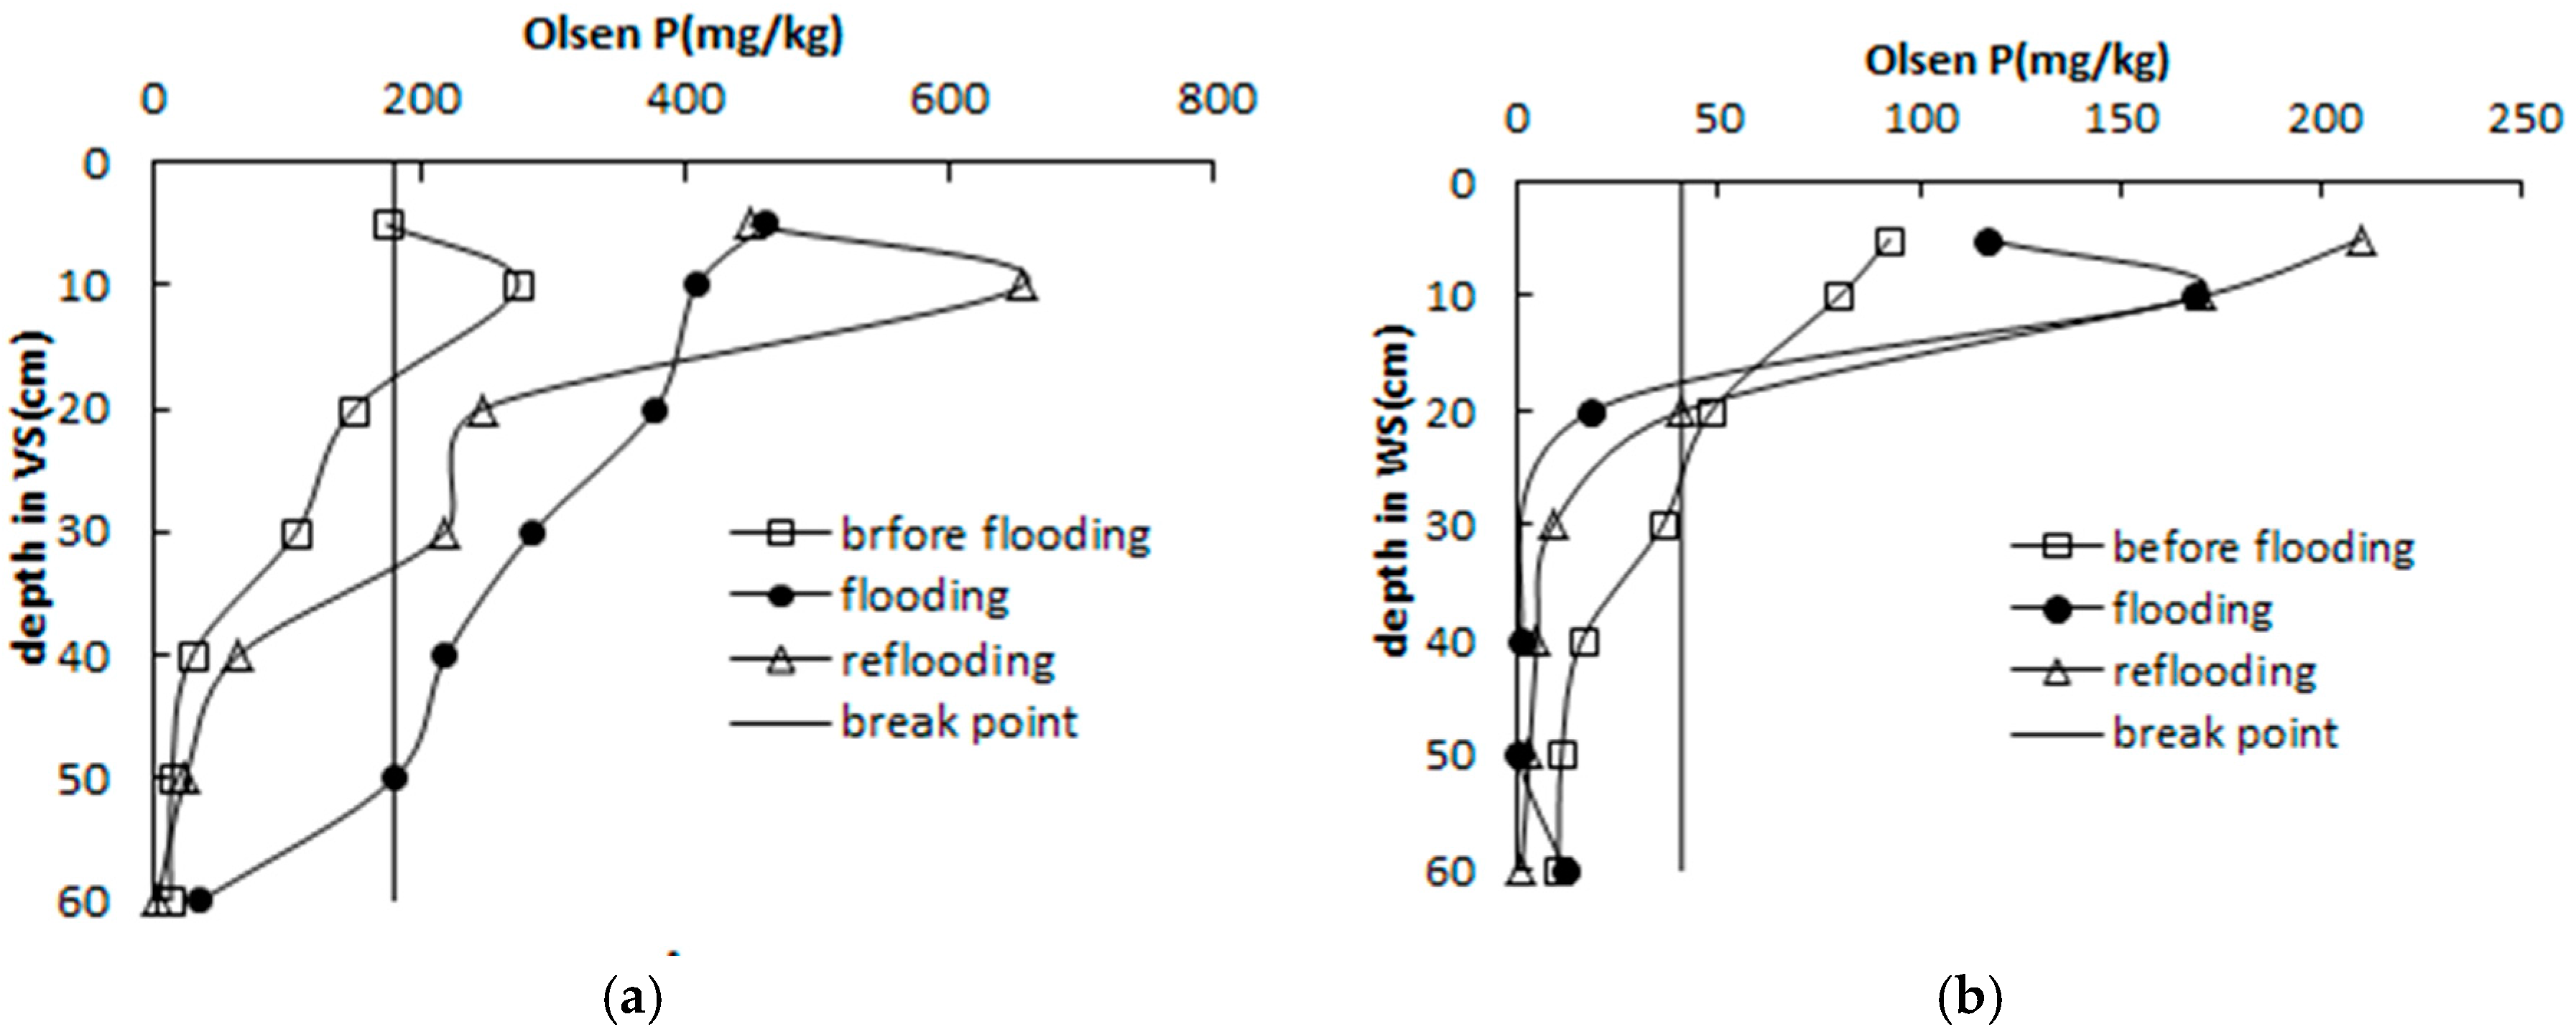
Olsen P is an important index for evaluating the capacity of a basic (high pH) soil to supply P, and it can predict P losses to surface water and groundwater [48,49]. Changes in Olsen P are shown in Figure 6. The initial Olsen P concentration was higher in VS than in WS: 12.0–274.2 mg/kg versus 10.1–92.5 mg/kg. In both soils, Olsen P was highest at 0–10 cm and decreased with depth. After flooding and reflooding, Olsen P increased in VS at all soil depths. Olsen P was lower after reflooding than after flooding, except at 0–20 cm. In WS, Olsen P increased after flooding and reflooding (relative to initial values) at 0–20 cm but decreased below 20 cm. Furthermore, Olsen P was higher after reflooding than after flooding.
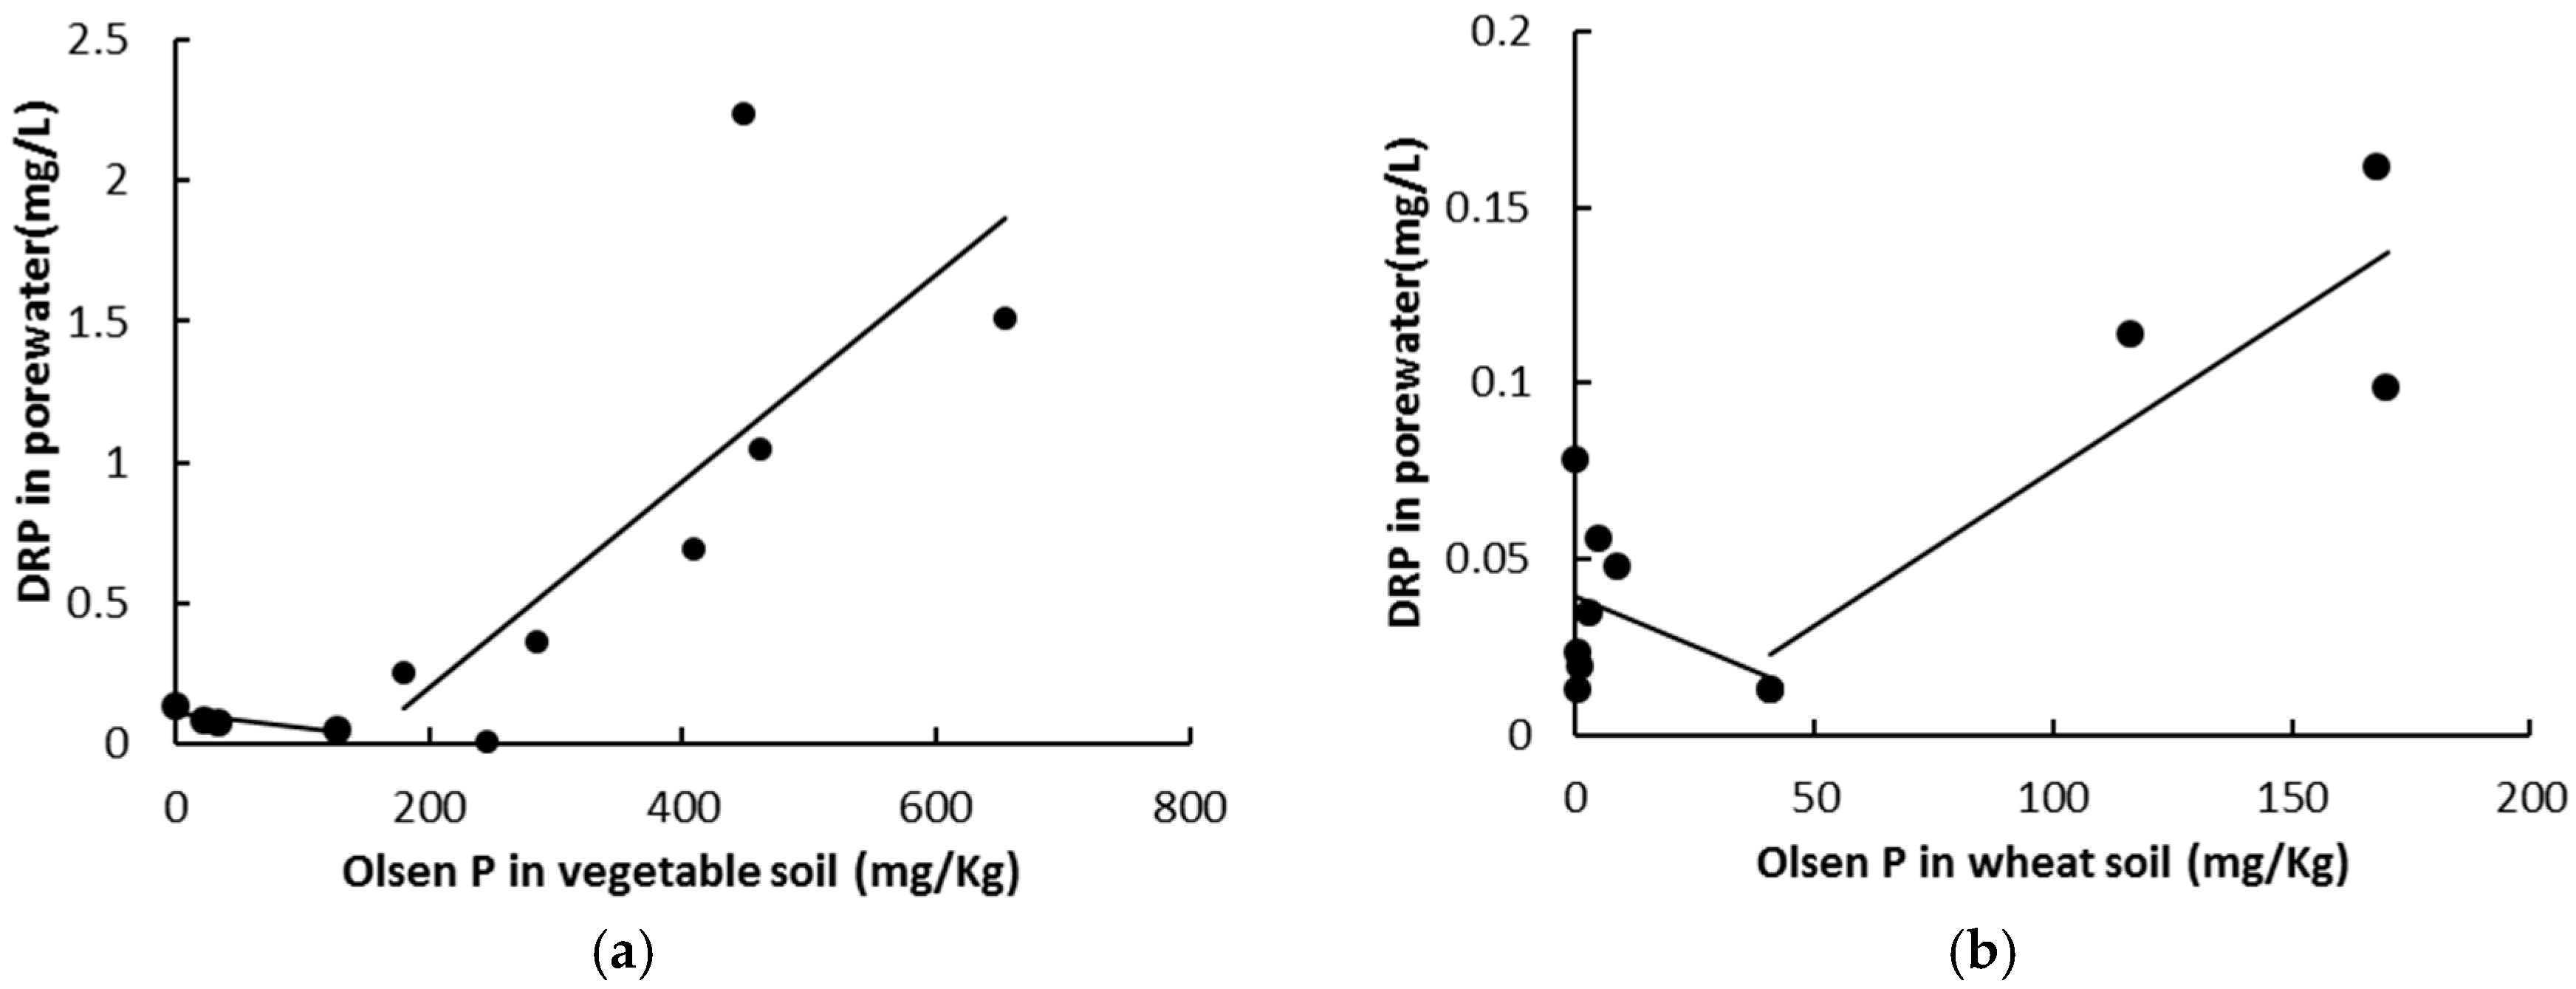
Olsen P is also a good index for representing soil nutrient status of high pH soils [47]. According to the UK Agricultural Development and Advisory Service (ADAS), Olsen P concentrations greater than 46 mg/kg indicate a high nutrient status [50]. Figure 6 shows that Olsen P at 0–20 cm in WS and 0–40 cm in VS was greater than 46 mg/kg, which indicated a high P status. Relationships between Olsen P and DRP in pore water can be seen in Figure 7. When Olsen P in VS exceeded 180.7 mg/kg, and when Olsen P in WS exceeded 40.8 mg/kg, the concentration of P in pore water increased significantly, which increased the risk of P leaching. When Olsen P was accumulated to a certain degree, the release of soil P into floodwater and pore water would reach a threshold value. Edwards et al. proposed the concept of the break point of soil P [51], which has been studied by many researchers from North America and Europe [52]. When Olsen-P exceeds this break point, the release of P into floodwater and pore water would increase significantly.
The critical depth in VS for the risk of soil P release was 50 cm during flooding and 28 cm during reflooding. The critical depth in WS was 18 cm during flooding and 20 cm during reflooding (Figure 7). The ability of VS to release P was greater than that of WS during flooding. In VS, the risk of P release may increase during flooding, whereas it may decrease during reflooding after draining. Wright et al. also found that P availability was significantly higher in flooded soils and decreased after draining [53]. Olsen P at 20–60 cm decreased during flooding and reflooding. This was due to P re-adsorption by amorphous Fe and Al minerals [54]. Below this critical depth, the risk of P release may increase significantly. This could accelerate the transport of pore water P to deeper soils and increase the likelihood of groundwater P pollution.
4. Conclusions
Based on the results of this study, we concluded that flood regimes strongly influence P release and transformations in flooded soils. Under flooded conditions, DRP in floodwater decreased significantly. During all periods, the concentration of DRP in pore water was highest at 5 cm soil depth. Under fertilized and flooded conditions, the risk of vertical P movement in 10–50 cm soil depth was increased. Flooding increased the concentration of Al-P and decreased the concentrations of Fe-P, O-P, and Ca2-P. Reflooding increased the concentrations of Fe-P, Al-P, and O-P. Olsen P was closely related to DRP in pore water. When Olsen P exceeded 180.7 mg/kg in VS and 40.8 mg/kg in WS, the release of soil P into floodwater and pore water increased significantly.
These findings have substantial implications in understanding how flooding and draining affect soil P release and transformations in flood zones. After fertilizing and then flooding, vertical P movement increased at deeper soil depths, which increased the potential for groundwater pollution. Further research is needed to better estimate the P loss potential, P vertical diffusion, and its contributions to eutrophication.
Acknowledgments
We thank our farm collaborators for providing the soils and assistance in this study. JT would like to acknowledge funding provided by the National Natural Science Foundation of China (51209109; 41202179; 51309126) and the Research Foundation of Jiangsu Normal University (09XLR22). The experimental work was conducted in Jiangsu Normal University and data analysis was done while JT was hosted as a visiting scientist in the Biological and Agricultural Engineering Department at Texas A&M University. The authors acknowledge three anonymous reviewers for providing constructive critique that improved the final quality of the manuscript.
Author Contributions
J.T. conducted the experiment, analyzed the data, and wrote the first draft of the manuscript; G.D. assisted in data analysis and edited the manuscript; R.K. edited the manuscript and provided critical evaluation of the work; L.L. edited the manuscript; R.D.H. edited the manuscript and provided valuable inputs to analysis.
Conflicts of Interest
The authors declare no conflict of interest.
Abbreviations
| P | phosphorus |
| TP | total phosphorus |
| DRP | dissolved reactive phosphorus |
| Al-P | aluminum-P, extracted with 0.5 M NH4F |
| Fe-P | iron-P, extracted with 0.1 M NaOH-0.1 M Na2CO3 |
| Ca2-P | CaHPO4·2H2O, extracted with 0.25 M NaHCO3 |
| Ca8-P | Ca8H2(PO4)6·5H2O, extracted with 0.5 M H3COONH4 |
| Ca10-P | Ca10(PO4)6(OH)2, extracted with 0.5 M H2SO4 |
| O-P | occluded P |
| Olsen-P | extracted with 0.5 M NaHCO3 |
| VS | vegetable-growing soil |
| WS | wheat-growing soil |
| OM | organic matter |
References
- Schindler, D.W. Evolution of phosphorus limitation in lakes. Science 1977, 195, 260–262. [Google Scholar] [CrossRef] [PubMed]
- Foy, R.H.; Withers, P.J.A. The Contribution of Agricultural Phosphorus to Eutrophication; Proceedings-Fertilizer Society No. 365; Greenhill House: Thorpe Wood, Petersborough, UK, 1995. [Google Scholar]
- Sims, J.T.; Simard, R.R.; Joern, B.C. Phosphorus loss in agricultural drainage: Historical perspective and current research. J. Environ. Qual. 1998, 27, 277–293. [Google Scholar] [CrossRef]
- Van der Molen, D.T.; Breeuwsma, A.; Boers, P.C.M. Agricultural nutrient losses to surface water in the Netherlands: Impact, strategies, and perspectives. J. Environ. Qual. 1998, 27, 4–11. [Google Scholar] [CrossRef]
- Yuan, Y.; Locke, M.A.; Bingner, R.L.; Rebich, R.A. Phosphorus losses from agricultural watersheds in the Mississippi Delta. J. Environ. Manag. 2013, 115, 14–20. [Google Scholar] [CrossRef] [PubMed]
- Withers, P.J.A.; Neal, C.; Jarvie, H.P.; Doody, D.G. Agriculture and Eutrophication: Where do we go from here? Sustainability 2014, 6, 5853–5878. [Google Scholar] [CrossRef] [Green Version]
- Logan, T.J. Soils and environmental quality. In Handbook of Soil Science; Sumner, M.E., Ed.; CRC Press: Boca Raton, FL, USA, 2000; pp. 155–169. [Google Scholar]
- Mulqueen, J.; Rodgers, M.; Scally, P. Phosphorus transfer from soil to surface waters. J. Agric. Water Manag. 2004, 68, 91–105. [Google Scholar] [CrossRef]
- Sah, R.N.; Mikkelsen, D.S. Sorption and bioavailability of phosphorus during the drainage period of flooded-drained soils. Plant Soil 1985, 92, 265–278. [Google Scholar] [CrossRef]
- Young, E.O.; Ross, D.S. Phosphate release from seasonally flooded soils: A laboratory microcosm study. J. Environ. Qual. 2001, 30, 91–101. [Google Scholar] [CrossRef] [PubMed]
- Elie, O.H.; Kirk, G.J.D.; Frossard, E. Phosphorus uptake by rice from soil that is flooded, drained or flooded then drained. Eur. J. Soil Sci. 2003, 54, 77–90. [Google Scholar] [CrossRef]
- Zhang, Y.; Lin, X.; Werner, W. Effect of aerobic conditions in the rhizosphere of rice on the dynamics and availability of phosphorus in a flooded soil—A model experiment. J. Plant Nutr. Soil Sci. 2004, 167, 66–71. [Google Scholar] [CrossRef]
- Yang, C.M.; Yang, L.Z.; Lee, J.H. Organic phosphorus fraction in organically amended paddy soils in continuously and intermittently flooded conditions. J. Environ. Qual. 2006, 35, 1142–1150. [Google Scholar] [CrossRef] [PubMed]
- Quintero, C.E.; Gutiérrez-Boem, F.H.; Befani, M.R.; Boschetti, N.G. Effect of soil flooding on P transformation in soils of the Mesopotamia region, Argentina. J. Plant Nutr. Soil Sci. 2007, 170, 500–505. [Google Scholar] [CrossRef]
- Tian, J.; Liu, L.; Ding, H.S.; Chen, T. Mobilization and transformation of phosphorus from water-soil interface of flooded soils. Environ. Sci. 2008, 29, 1818–1823. [Google Scholar]
- Wang, G.; Zhai, Z.; Liu, J.; Wang, J. Forms and profile distribution of soil phosphorus in four wetlands across gradients of sand desertification in Northeast China. Geoderma 2008, 145, 50–59. [Google Scholar] [CrossRef]
- Ma, L.; Rena, D.; Zhang, M.; Zhao, J. Phosphorus fractions and soil release in alternately waterlogged and drained environments at water-fluctuation-zone of the Three Gorges Reservoir. J. Food Agric. Environ. 2010, 8, 1329–1335. [Google Scholar]
- Amarawansha, E.A.G.; Kumaragamage, D.; Flater, D.; Zvomuya, F.; Tenuta, M. Phosphorus mobilization from manure-amended and unamended alkaline soils to overlying water during simulated flooding. J. Environ. Qual. 2015, 44, 1252–1262. [Google Scholar] [CrossRef] [PubMed]
- Beauchemin, S.; Simard, R.R.; Cluis, D. Forms and concentration of phosphorus in drainage water of twenty-seven tile-drained soils. J. Environ. Qual. 1998, 27, 721–728. [Google Scholar] [CrossRef]
- Environmental Protection Agency. Water Quality in Ireland (1995–1997); Environmental Protection Agency: Wexford, Ireland, 1999.
- Seng, V.; Bell, R.W.; Willett, I.R.; Nesbitt, H.J. Phosphorus nutrition of rice in relation to flooding and temporary loss of soil-water saturation in two lowland soils of Cambodia. Plant Soil 1999, 207, 121–132. [Google Scholar] [CrossRef]
- Vadas, P.A.; Sims, J.T. Phosphorus sorption in matured Atlantic coastal plain soils under flooded and drained conditions. J. Environ. Qual. 1999, 28, 1870–1877. [Google Scholar] [CrossRef]
- Chacon, N.; Flores, S.; Gonzalez, A. Implications of iron solubilization on soil phosphorus release in seasonally flooded forests of the lower Orinoco River, Venezuela. Soil Biol. Biochem. 2006, 38, 1494–1499. [Google Scholar] [CrossRef]
- Szilas, C.P.; Borggard, O.K.; Hansedn, H.C.B. Potential iron and phosphate mobilization during flooding of soil material. Water Air Soil Pollut. 1998, 106, 97–109. [Google Scholar] [CrossRef]
- Ponnamperuma, F.N. The chemistry of submerged soils. Adv. Agron. 1972, 24, 29–96. [Google Scholar]
- Olila, O.G.; Reddy, K.R.; Stites, D.L. Influence of draining on soil phosphorus forms and distribution in a constructed wetland. Ecol. Engn. 1997, 9, 157–169. [Google Scholar] [CrossRef]
- Twinch, A.J. Phosphate exchange characteristics of wet and dried sediment samples from a hypereutrophic reservoir: Implications for the measurements of sediment phosphorus status. J. Water Res. 1987, 21, 1225–1230. [Google Scholar] [CrossRef]
- Chen, M.; Chen, J.; Sun, F. Agricultural phosphorus flow and its environmental impacts in China. Sci. Total Environ. 2008, 405, 140–152. [Google Scholar] [CrossRef] [PubMed]
- Kolahchi, Z.; Jalali, M. Phosphorus movement and retention by two calcareous soils. Soil Sediment Contam. 2013, 22, 21–38. [Google Scholar] [CrossRef]
- Ding, X.; Wei, C.; Wang, R. Phosphorus leaching risk assessment with manure fertilizer application in South China. Bull. Environ. Contam. Toxicol. 2014, 93, 120–125. [Google Scholar] [CrossRef] [PubMed]
- Food and Agriculture Organization of the United Nations (FAO). World Reference Base for Soil Resource; World Soil Resources Report 89; FAO: Rome, Italy, 2014. [Google Scholar]
- Murphy, J.; Riley, J.P. A modified single solution method for the determination of phosphate in natural waters. Anal. Chim. Acta 1962, 27, 31–36. [Google Scholar] [CrossRef]
- Olsen, S.R.; Cole, C.; Watanabe, F.C.; Dean, L.A. Estimation of Available Phosphorus in Soils by Extraction with Sodium Bicarbonate; United States Department of Agriculture (USDA): Washington, DC, USA, 1954.
- Lu, R.K. Soil Agrochemistry Analysis; China Agriculture Scientech Press: Beijing, China, 2000. [Google Scholar]
- Pizzerghello, D.; Berti, A.; Nardi, S.; Morari, F. Phosphorus forms and P-sorption properties in three alkaline soils after long-term mineral and manure applications in north-eastern Italy. Agric. Ecosyst. Environ. 2011, 141, 58–66. [Google Scholar] [CrossRef]
- Tian, J. Study on Phosphorus Chemical Behavior and Release Mechanics in Submerged Soils. Ph.D. Thesis, Hohai University, Nanjing, China, 2009. [Google Scholar]
- Karjalainen, S.M.; Ronkanen, A.; Heikkinen, K.; Kløve, B. Long-term accumulation and retention of Al, Fe and P in peat soils of northern treatment wetlands. Ecol. Eng. 2016, 93, 91–103. [Google Scholar] [CrossRef]
- Moore, P.A.; Reddy, K.R. Role of Eh and pH on phosphorus geochemistry in sediments of Lake Okeechobee, Florida. J. Environ. Qual. 1994, 23, 955–964. [Google Scholar] [CrossRef]
- Sallade, Y.E.; Sims, J.T. Phosphorus transformation in the sediments of Delaware’s agricultural drainage ways: II Effect of reducing conditions on phosphorus release. J. Environ. Qual. 1997, 26, 1579–1588. [Google Scholar] [CrossRef]
- Bartlett, R.J.; James, B.R. System for categorizing redox status by chemical field testing. Geoderma 1995, 68, 211–218. [Google Scholar] [CrossRef]
- Hogan, D.M.; Jordan, T.E.; Walbridge, M.R. Phosphorus retention and soil organic carbon in restored and natural freshwater wetlands. Wetlands 2004, 24, 573–585. [Google Scholar] [CrossRef]
- Zhang, J.; Li, M.; Liu, S.; Liu, Y.J.; Zhang, L.Q.; Cao, Q.; Sun, D.Z. Seasonal variations and bioavailability of inorganic phosphorus in soils of Yeyahu Wetland in Beijing, China. Intl. J. Sediment Res. 2011, 26, 181–192. [Google Scholar] [CrossRef]
- Shen, R.; Jiang, B. Distribution and availability of various forms of inorganic-P in calcareous soils. Soil Sci. 1992, 29, 80–86. [Google Scholar]
- Leher, J.R.; Brown, W.E. Calcium phosphate fertilizers. II. A petrographie study of their alteration in soils. Soil Sci. Soc. Am. Proc. 1958, 22, 29–32. [Google Scholar] [CrossRef]
- Lindsay, W.L.; Frazier, A.W.; Stephenson, H.F. Identification of reaction products from phosphate fertilizers in soils. Soil Sci. Soc. Am. Proc. 1962, 26, 446–452. [Google Scholar] [CrossRef]
- Brandon, D.M. Phosphorus Transformation in Alternately Flooded Soils and Their Effects on Rice-Rotation Crops. Ph.D. Thesis, University of California, Davis, CA, USA, 1977. [Google Scholar]
- Dieter, D.; Herzog, C.; Hupfer, M. Effects of drying on phosphorus uptake in re-flooded lake sediments. Environ. Sci. Pollut. Res. 2015, 22, 17065–17081. [Google Scholar] [CrossRef] [PubMed]
- Heckrath, G.; Brookes, P.C.; Poulton, P.R.; Goulding, K.W.T. Phosphorus leaching from soils containing different phosphorus concentrations in the Broadbalk experiment. J. Environ. Qual. 1995, 24, 904–910. [Google Scholar] [CrossRef]
- Hesketh, N.; Brookes, P.C. Development of an indicator for risk of phosphorus leaching. J. Environ. Qual. 2000, 29, 105–110. [Google Scholar] [CrossRef]
- UK Ministry of Agriculture Fisheries and Food (MAFF). Fertilizer Recommendations for Agricultural and Horticultural Crops; Reference Book 209; His Majesty’s Stationery Office (HMSO): London, UK, 1991.
- Edwards, A.C.; Withers, P.J.A. Soil phosphorus management and water quality: A UK Perspective. Soil Use Manag. 1998, 14, 124–130. [Google Scholar] [CrossRef]
- Zhang, M.K.; Zhou, C.; Fang, L.P. Study on break point of environment in paddy soils. J. Agro-Environ. Sci. 2006, 2, 170–174. [Google Scholar]
- Wright, R.B.; Lockaby, B.G.; Walbridge, M.R. Phosphorus availability in an artificially flooded southeastern floodplain forest soil. Soil Sci. Soc. Am. J. 2001, 65, 1293–1302. [Google Scholar] [CrossRef]
- Sah, R.N.; Mikkelsen, D.S.; Hafez, A.A. Phosphorus behavior in flooded-drained soils: III. Phosphorus description and availability. Soil Sci. Soc. Am. J. 1989, 53, 1729–1732. [Google Scholar] [CrossRef]
Figure 1.
pH and Eh in floodwater ((a) pH changes; (b) Eh changes).
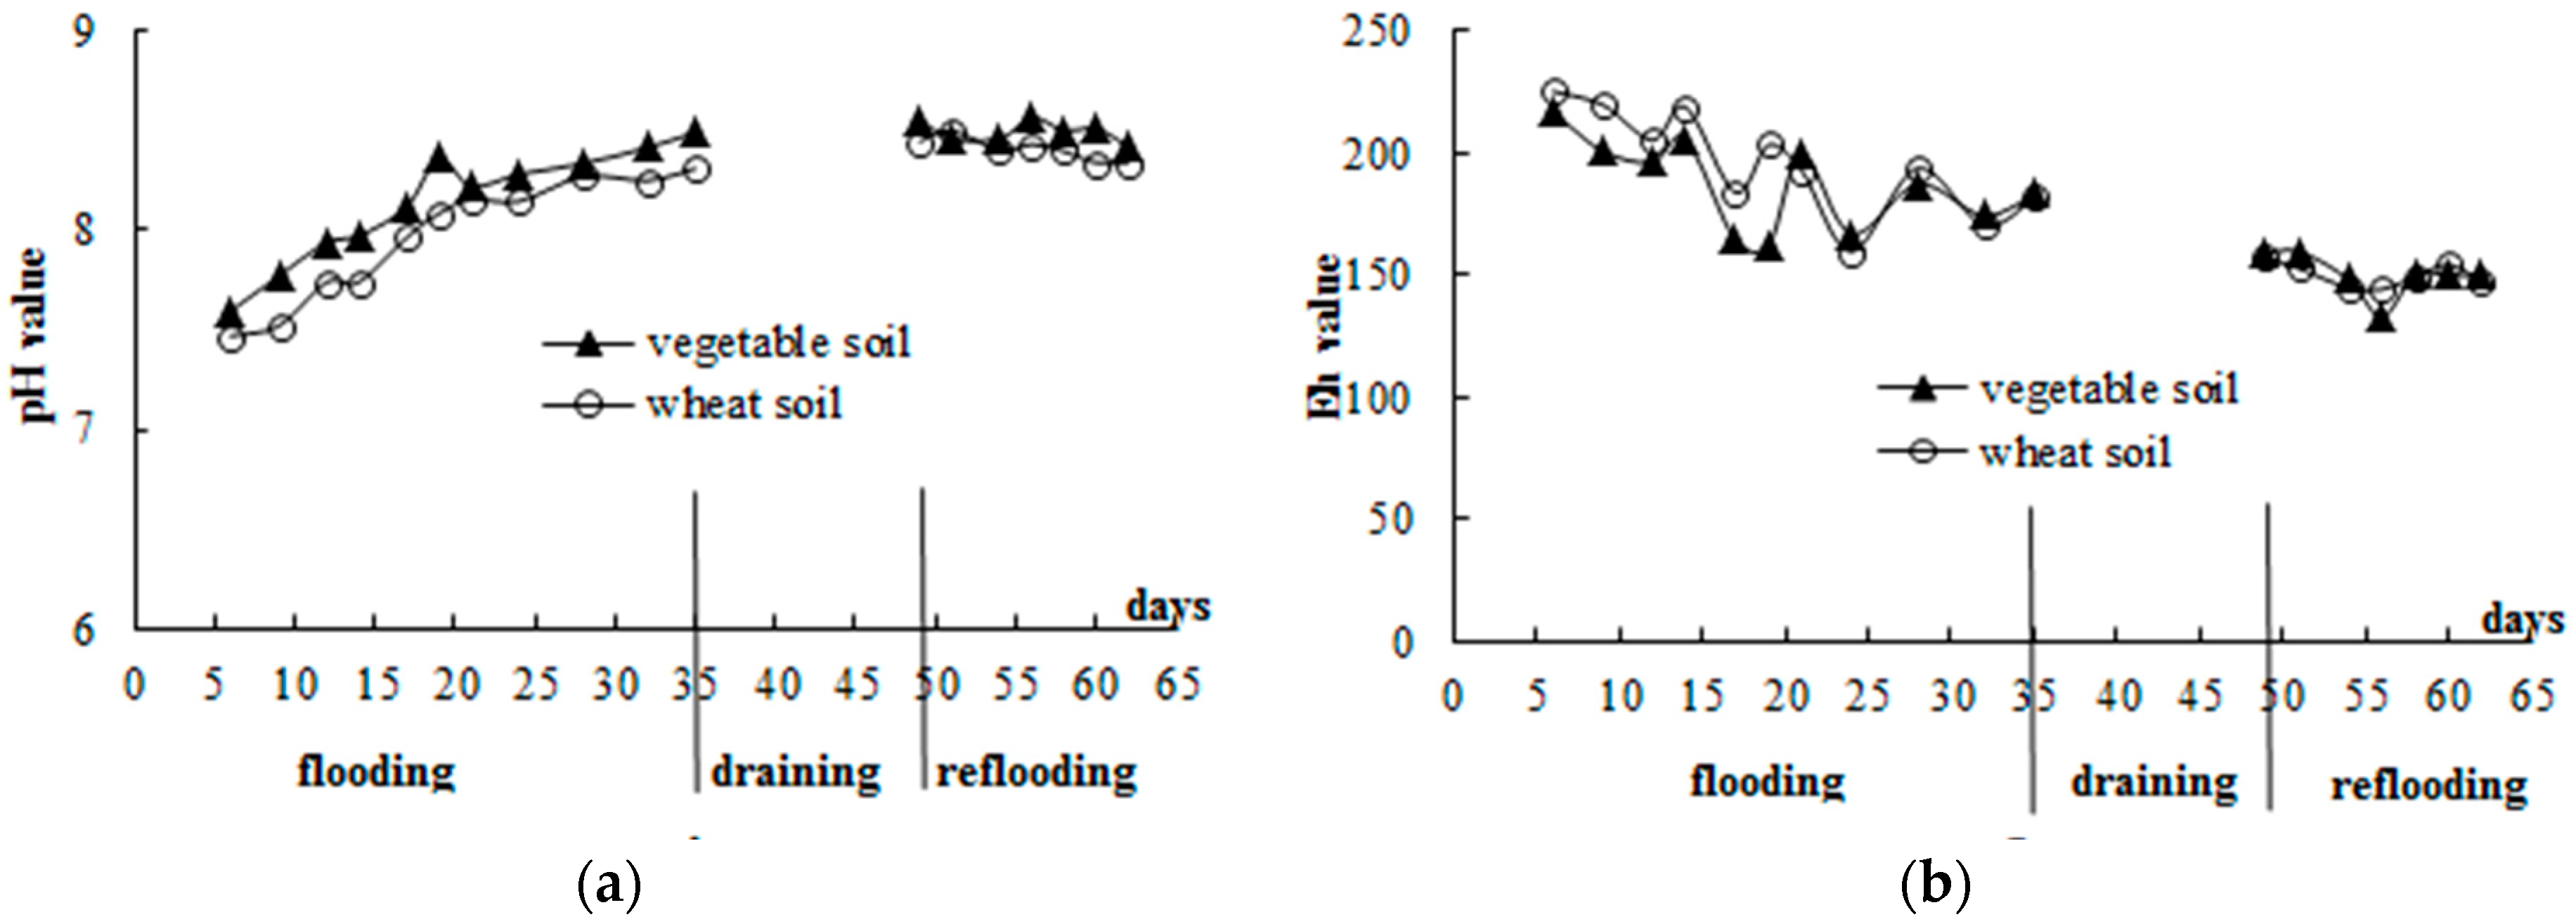
Figure 2.
Changes of floodwater DRP in VS and WS over time (flooding period: days 0–35; draining period: days 36–48; reflooding period: days 49–64).
Figure 2.
Changes of floodwater DRP in VS and WS over time (flooding period: days 0–35; draining period: days 36–48; reflooding period: days 49–64).
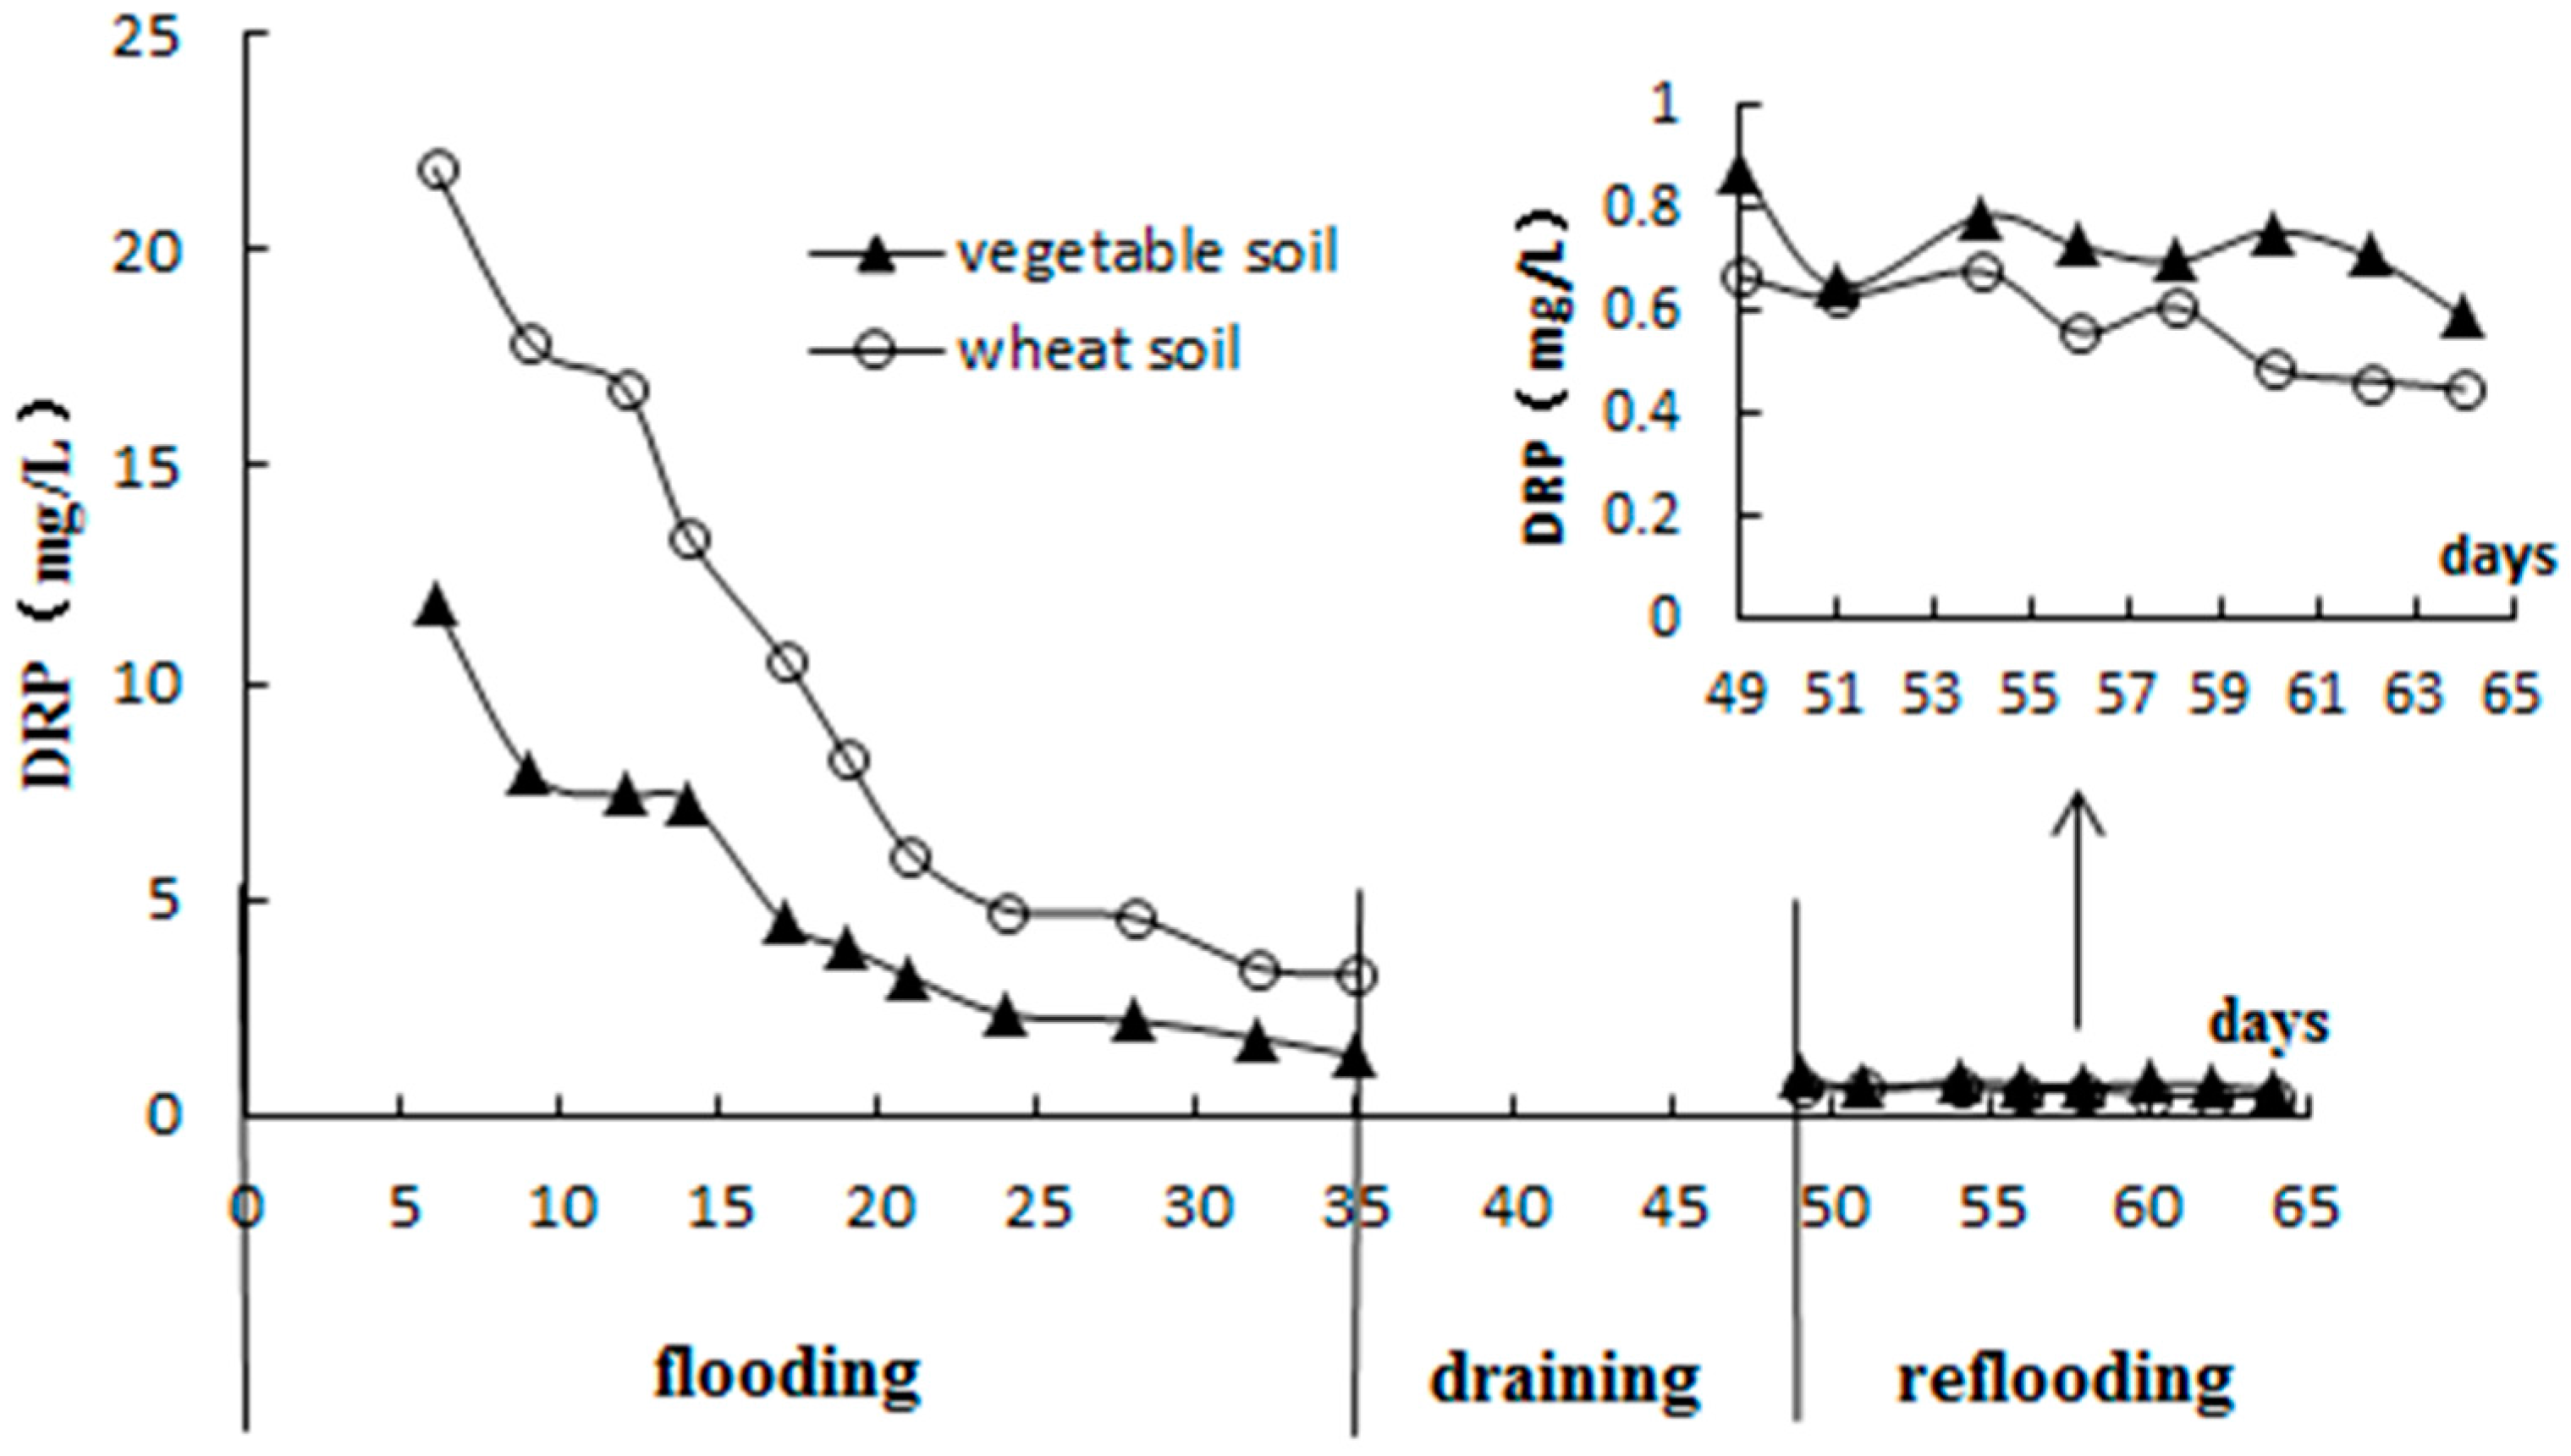
Figure 3.
Changes of DRP in floodwater and surface pore water over time ((a) VS; (b) WS; flooding period: days 0–35; draining period: days 36–48; reflooding period: days 49–64).
Figure 3.
Changes of DRP in floodwater and surface pore water over time ((a) VS; (b) WS; flooding period: days 0–35; draining period: days 36–48; reflooding period: days 49–64).
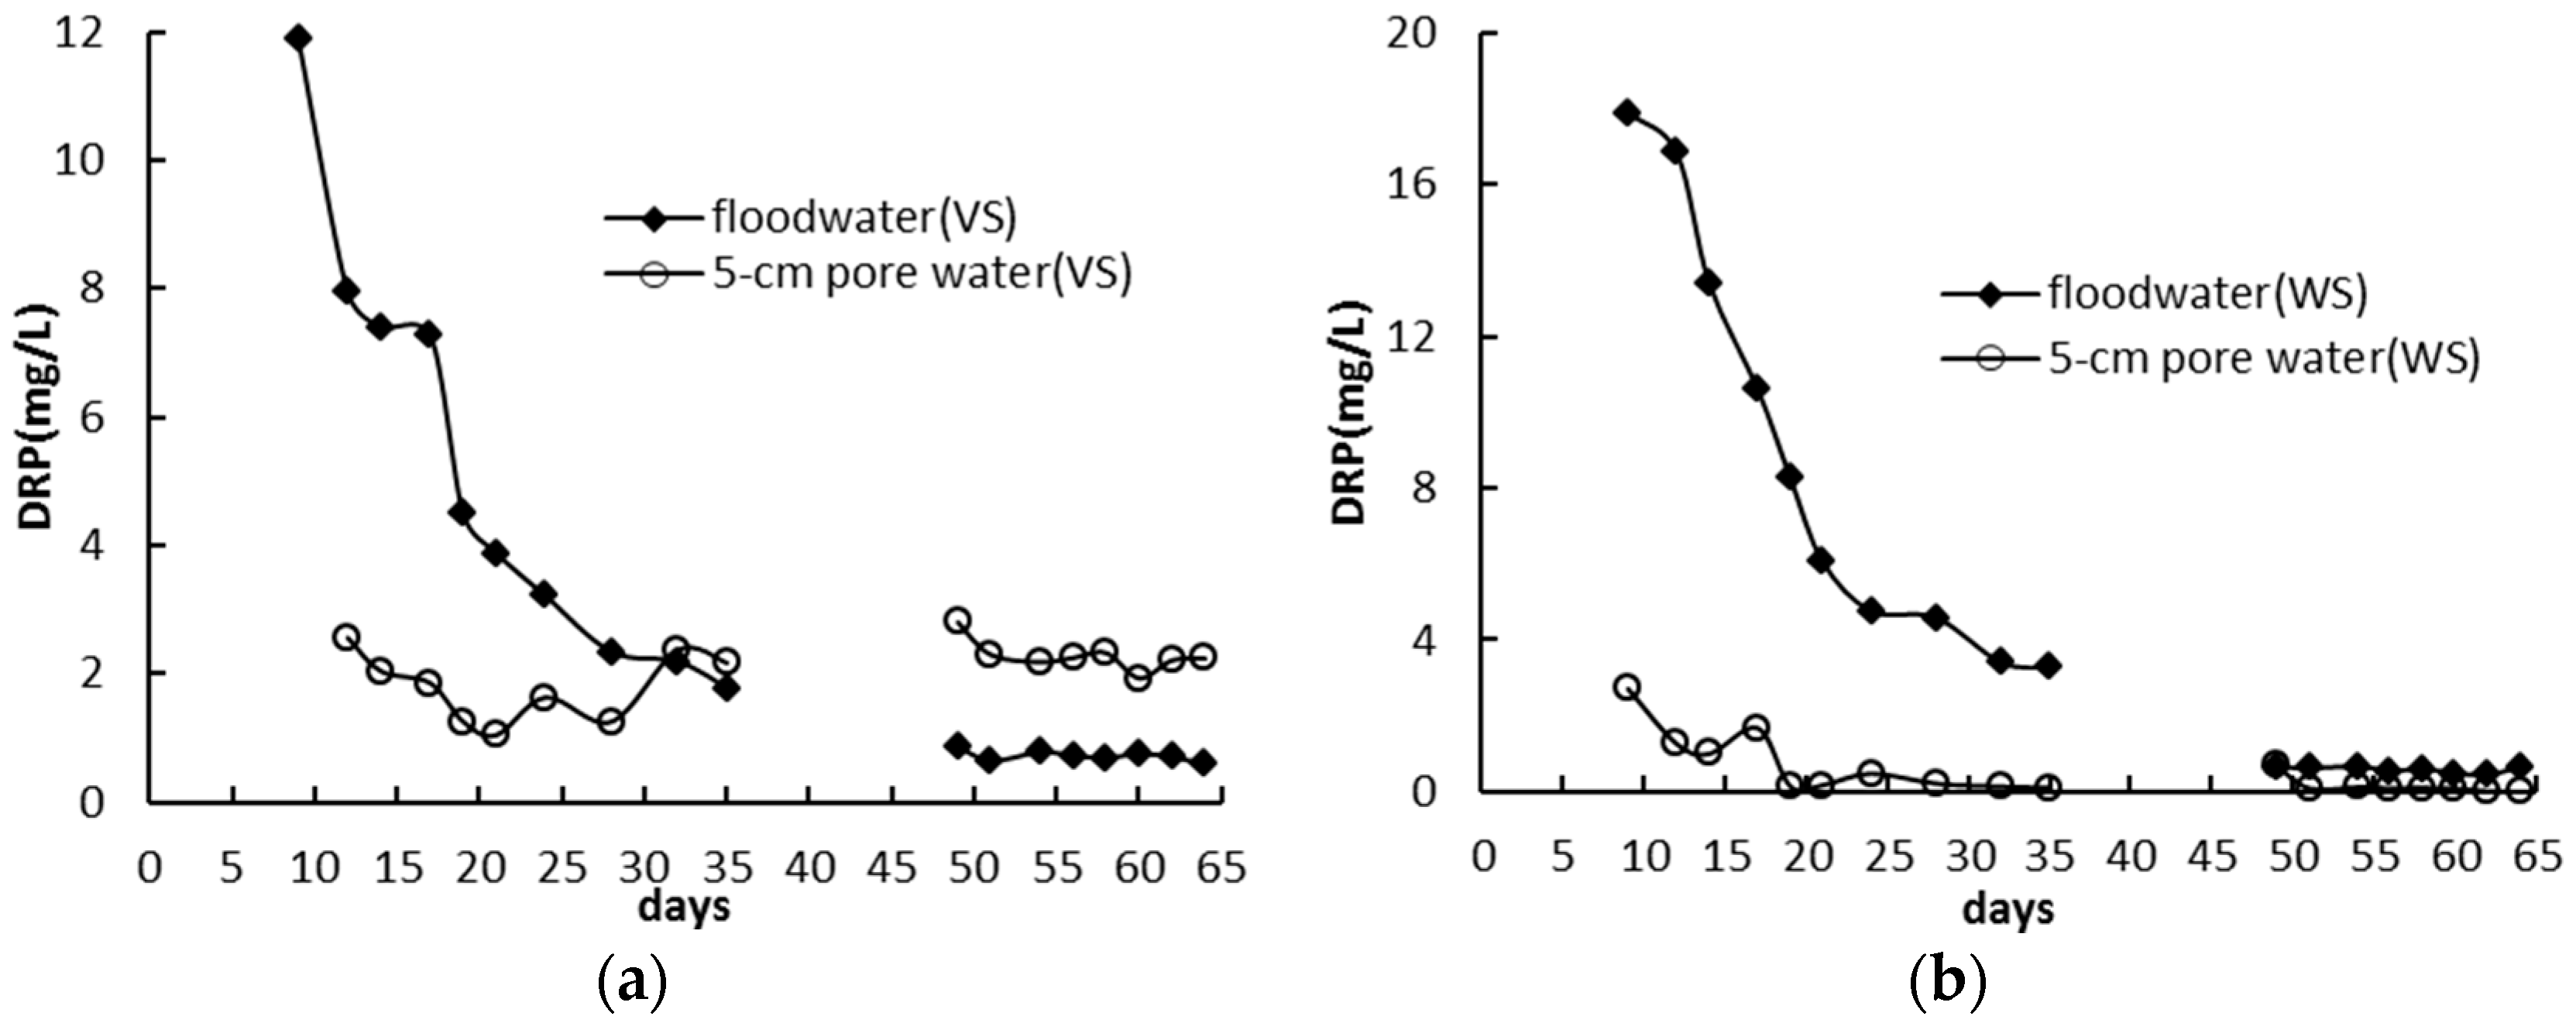
Figure 4.
Pore water DRP in different soil layers ((a) WS, flooding; (b) WS, reflooding; (c) VS, flooding; (d) VS, reflooding).
Figure 4.
Pore water DRP in different soil layers ((a) WS, flooding; (b) WS, reflooding; (c) VS, flooding; (d) VS, reflooding).

Figure 5.
Inorganic phosphorus fractions in different soil layers ((a) VS; (b) WS).
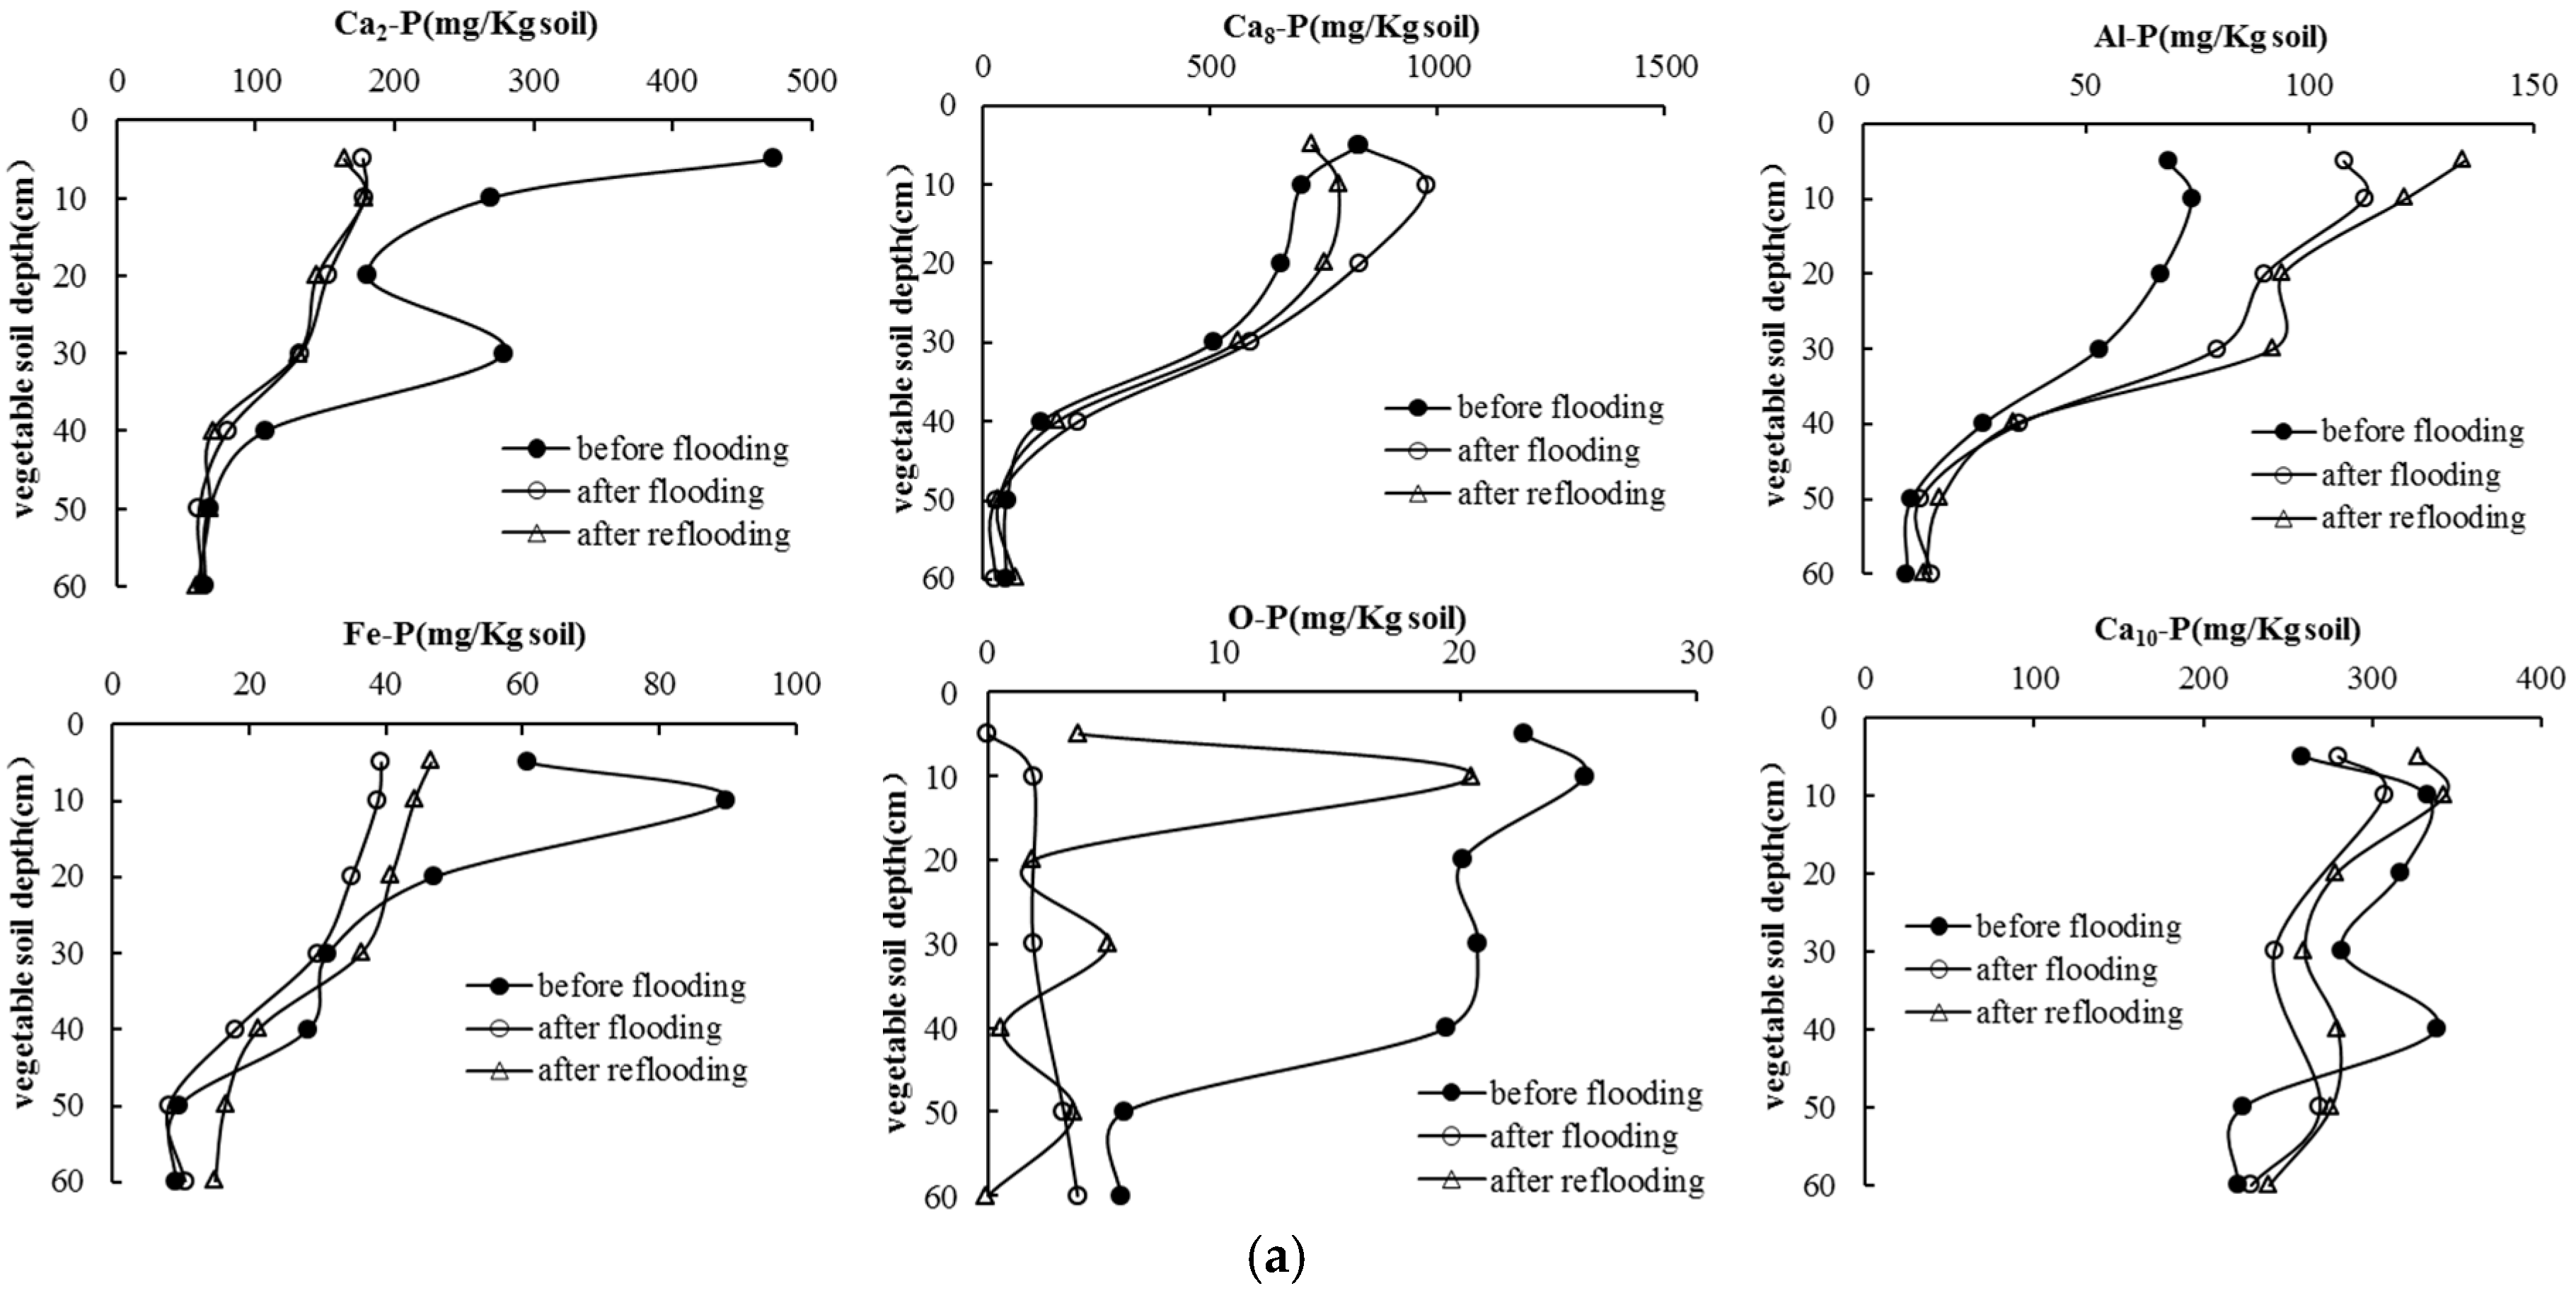

Figure 6.
Changes in Olsen P before and after flooding and reflooding ((a) Olsen P in VS; (b) Olsen P in WS).
Figure 6.
Changes in Olsen P before and after flooding and reflooding ((a) Olsen P in VS; (b) Olsen P in WS).

Figure 7.
Relationships between Olsen P and DRP in pore water ((a) VS; (b) WS).


Table 1.
Analysis methods of P forms in soil.
| P Forms in Soil | Extractant | Reference | |
|---|---|---|---|
| TP | HNO3, HClO4, and H2SO4 at a 3:1:1 ratio | [32] | |
| Olsen P (soil available phosphorus) | 0.5 M NaHCO3 | [33] | |
| inorganic P fractions | Ca2-P (CaHPO4·2H2O) | 0.25 M NaHCO3 (pH 7.5) | [34] |
| Ca8-P (Ca8H2(PO4)6·5H2O) | 0.5 M H3COONH4 (pH 4.2) | [34] | |
| Al-P | 0.5 M NH4F (pH 8.2) | [34] | |
| Fe-P | 0.1 M NaOH-0.1 M Na2CO3 | [34] | |
| O-P (occluded P) | 0.3 M Na2S2O4-0.5 M NaOH | [34] | |
| Ca10-P (Ca10(PO4)6(OH)2) | 0.5 M H2SO4 | [34] | |
Table 2.
Properties of soils used in the study.
| Soil Profile cm | pH | Total P g/kg | OM mg/kg | Olsen P mg/kg | Sand % | Silt % | Clay % |
|---|---|---|---|---|---|---|---|
| Vegetable-growing soil | |||||||
| 0–5 | 7.31 | 1.91 | 203.86 | 175.29 | 5.23 | 55.41 | 39.36 |
| 5–15 | 7.31 | 2.01 | 210.32 | 274.21 | 0.38 | 57.87 | 41.75 |
| 15–25 | 7.41 | 1.71 | 147.63 | 150.02 | 5.48 | 53.18 | 41.34 |
| 25–35 | 7.48 | 1.44 | 109.40 | 106.88 | 0.54 | 64.87 | 34.59 |
| 35–45 | 7.57 | 0.75 | 104.33 | 28.37 | 5.32 | 43.83 | 50.85 |
| 45–60 | 7.52 | 0.64 | 96.61 | 13.02 | 3.99 | 36.77 | 59.24 |
| Wheat-growing soil | |||||||
| 0–5 | 7.62 | 1.13 | 188.11 | 92.50 | 9.77 | 73.00 | 17.23 |
| 5–15 | 7.64 | 1.06 | 82.12 | 79.87 | 9.60 | 72.85 | 17.55 |
| 15–25 | 7.83 | 0.62 | 34.60 | 48.19 | 12.00 | 75.05 | 12.95 |
| 25–35 | 7.90 | 0.55 | 26.17 | 35.95 | 6.82 | 73.62 | 19.56 |
| 35–45 | 7.96 | 0.54 | 58.78 | 15.93 | 4.65 | 54.46 | 40.89 |
| 45–60 | 7.96 | 0.58 | 24.48 | 10.88 | 5.35 | 33.98 | 60.67 |
© 2017 by the authors. Licensee MDPI, Basel, Switzerland. This article is an open access article distributed under the terms and conditions of the Creative Commons Attribution (CC BY) license (http://creativecommons.org/licenses/by/4.0/).
Share and Cite
MDPI and ACS Style
Tian, J.; Dong, G.; Karthikeyan, R.; Li, L.; Harmel, R.D. Phosphorus Dynamics in Long-Term Flooded, Drained, and Reflooded Soils. Water 2017, 9, 531. https://doi.org/10.3390/w9070531
AMA Style
Tian J, Dong G, Karthikeyan R, Li L, Harmel RD. Phosphorus Dynamics in Long-Term Flooded, Drained, and Reflooded Soils. Water. 2017; 9(7):531. https://doi.org/10.3390/w9070531
Chicago/Turabian StyleTian, Juan, Guiming Dong, Raghupathy Karthikeyan, Lin Li, and R. Daren Harmel. 2017. "Phosphorus Dynamics in Long-Term Flooded, Drained, and Reflooded Soils" Water 9, no. 7: 531. https://doi.org/10.3390/w9070531
Note that from the first issue of 2016, this journal uses article numbers instead of page numbers. See further details here.