Long Term Trends and Dynamics of Dissolved Organic Carbon (DOC) in a Subtropical Reservoir Basin
by
 ,
,
Ming Fai Chow
1,2 ,
,
Chao-Chen Lai
2,
Hsiang-Yi Kuo
2,
Chih-Hsien Lin
3,
Tzong-Yueh Chen
4 and
Fuh-Kwo Shiah
2,* 1
Center for Sustainable Technology and Environment (CSTEN), Universiti Tenaga Nasional (UNITEN), 43000 Kajang, Selangor, Malaysia
2
Research Center for Environmental Changes, Academia Sinica, Taipei 115, Taiwan
3
Horn Point Laboratory, University of Maryland Center for Environmental Science, 2020 Horns Point Road, Cambridge, MD 21613, USA
4
Institute of Marine Environment and Ecology, National Taiwan Ocean University, Keelung 202, Taiwan
*
Author to whom correspondence should be addressed.
Water 2017, 9(7), 545; https://doi.org/10.3390/w9070545
Submission received: 24 April 2017
/
Revised: 30 June 2017
/
Accepted: 11 July 2017
/
Published: 20 July 2017
(This article belongs to the Special Issue Water Quality Monitoring and Modeling in Lakes)
Abstract
:This study evaluates the long term trends and seasonal patterns of dissolved organic carbon (DOC) concentration in the Fei-Tsui Reservoir basin in Northern Taiwan during the period of 2000 to 2015. The non-parametric seasonal Mann-Kendall test was conducted to identify the trends of DOC and its potential drivers (e.g., temperature, runoff, atmospheric acid deposition and stream water chemistry). The monthly tributaries and water surface DOC concentrations in Fei-Tsui Reservoir had showed strong temporal and seasonal variability. The sulfate (SO4) concentration had exhibited statistically significant decreasing trend over a period of 16 years. The decreasing trends of anions (SO4 and NO3) and base cations (Ca and Mg) as well as increasing trends of pH and acidification index (ACI) in Fei-Tsui Reservoir and streams indicated recovery from acidification. However, there was no significant annual trend in DOC concentration of Fei-Tsui Reservoir and streams. Significant positive correlation was obtained between DOC and trophic state index of Fei-Tsui Reservoir. The results suggested that DOC concentration at the water surface of Fei-Tsui Reservoir was mainly driven by the re-oligotrophication and temperature effects rather than a decrease in atmospheric sulfur deposition. Stream DOC concentration was largely determined by the temporal variability in temperature and rainfall. We concluded that climatic and hydrological factors are the dominant drivers for stream DOC dynamics in the study.
1. Introduction
Dissolved organic carbon (DOC) in aquatic ecosystem is playing an important role in (i) affecting the solubility, transport and toxicity of metals from soils to surface metals; (ii) influencing the transport of organic pollutants, particle surface and colloid chemistry , pH, photo-chemistry of natural waters and nutrient availability; (iii) affecting the distribution of ions between water and sediment phases; (iv) serving as an important source of microbial substrate; and (v) affecting the long term dynamics of terrestrial organic carbon pools [1,2]. These complex mechanisms make both aquatic ecosystems and the global carbon cycle sensitive to changes in DOC concentrations. The climate change in recent decades had motivated the study of trends in surface water DOC concentrations and identifying their potential drivers [3]. Understanding the trends in DOC concentrations in surface water is important because rising of DOC concentrations in aquatic system will bring the impacts such as: (i) reduce light penetration in water and thus affects aquatic productivity and lake stratification; (ii) increase leaching of metal ions and their transport into surface water; and (iii) increase cost of drinking water treatment [4].
There are now enough evidences that either positive, negative or stationary trends in DOC concentrations over decadal time scales have been reported in surface waters of different regions around the world [5,6,7]. Increasing trend of DOC concentration in freshwaters have been reported recently in the Nordic countries [8,9,10,11], the U.K. [5,12], and North America [6]. However, the controlling factors have been in much debate [13,14], and the suggested possible drivers for the rising trends in DOC are including global warming [5], changes in hydrological pathways [13], increase of summer drought frequency [5], CO2 enrichment [15], increases of nitrogen deposition [16], and decreased sulfur deposition [10,17,18]. Previous studies have stated that decreasing inputs of acidic atmospheric deposition would lead to a reduction in ionic strength of soil solution that subsequently increases the rate of DOC flux [17]. Other than that, several studies also demonstrated that stream flow, soil wetness and temperature can be an important driver in controlling the temporal changes of stream water DOC concentration [19,20,21,22].
Given the range of factors over different time scales, long-term trends investigation is needed in order to identify the certain common pattern and main drivers for the DOC dynamics. Long-term trends investigation provides a realistic means of understanding the DOC interactions and cycling in relation to aquatic ecosystem behavior. Many studies has been carried out to detect the long term patterns of DOC in North America and European countries but unfortunately, there are very limited studies have investigated the long term dynamic of DOC in subtropical region. This is important as regional differences, effects of scale and local processes may affect the dynamic of DOC in stream and reservoir. Thus, this study seeks to identify the long term trend of DOC concentration during the period from 2000 to 2015 in Fei-Tsui Reservoir, Taiwan. Other than that, this study also investigated the primary mechanism and main controlling factors on the changes of DOC concentration in the Fei-Tsui Reservoir basin. Here, we investigated if the significant increase of DOC is related to the decreasing trend in SO4 as suggested by many studies from North America and European countries.
2. Materials and Methods
2.1. Study Area
Fei-Tsui Reservoir (121° 34′ E, 24° 54′ N) is located in northern Taiwan at an altitude of 300 m and has a basin area around 300 km2 (Figure 1). This reservoir is well protected from human activities since it has been the main drinking water resource for Taipei City since the 1980s. Fei-Tsui Reservoir has a surface area of 10.24 km2 and a mean depth of 40 m (maximum depth: 113.5 m located at dam site). The average water residence time in the reservoir is approximately 150 days. Hydrological data including daily inflow, outflow and reservoir total water volume and monthly water quality data have been monitored by the Fei-Tsui Reservoir Administration Bureau since 1987. The annual mean precipitation is around 3835 mm during the periods from 1988 to 2015. Most of the area of Fei-Tsui Reservoir basin is covered by secondary subtropical forests. In addition, there are numerous tea plantations on the mountain slopes or terraces near the riverine regions. The land uses of Fei-Tsui Reservoir basin includes forest (88.43%), agricultural (3.86%), water body (3.53%), grassland (1.20%), bare soil (1.11%), building (0.98%), orchard (0.45%) and farmland (0.44%). The five major inflow tributaries of Fei-Tsui Reservoir are Bei-Shih, Dai-Yu, Jin-Gua, Hou-Keng-Tsz and Huo-Shao-Zhang streams. Bei-Shih stream is the main inflow tributary of Fei-Tsui Reservoir while the other three tributaries (Jin-Gua, Hou-Keng-Tsz and Huo-Shao-Zhang) only account for <25% of the total annual inflow volume. The detailed land use distributions of each tributary are summarized in Table 1. Water quality sampling was conducted at 5 tributary outlets, denoted as S2 (Huo-Shao-Zhang), S4 (Hou-Keng-Tsz), S10 (Jin-Gua), S12 (Dai-Yu) and S13 (Bei-Shih), and 7 stations in the water body of Fei-Tsui Reservoir, denoted as S1 (dam site), S3 (Huo-Shao-Zhang), S5 (Hou-Keng-Tsz), S6 (Yuan-Yang-Tan), S7 (Ma-Zhu-Lin), S8 (Yong-An), S9 (Wan-Tan) and S11 (Huang-Ju-Pi) as shown in Figure 1.
2.2. Sampling and Data Analysis
Water quality sampling was conducted at thirteen stations which included the inflow tributaries and the water body of reservoir, denoted as S1 to S13 in Figure 1. The data sets, which comprised of 11 water quality parameters monitored monthly, were obtained from the Taipei Fei-Tsui Reservoir Administration Office. The studied water quality parameters included water temperature (WT), pH, nitrate nitrogen (NO3-N), chemical oxygen demand (COD), chloride (Cl), calcium (Ca), magnesium (Mg), sulfate (SO4), total alkalinity (T-Alk), dissolved organic nitrogen (DON) and dissolved organic carbon (DOC). All the water quality parameters are expressed in mg/L, except pH and WT (°C). All of the sampling and analysing methods entailed following the standard methods for the examination of water and wastewater [23]. Nitrate nitrogen (NO3-N) was measured spectrophotometrically using the brucine sulfate method, while DOC was measured by using the persulfate-ultraviolet oxidation method [24].
2.3. Data Analysis
The historical datasets for streams and the dam site of Fei-Tsui Reservoir basin were examined in order to provide an overview of the long term dynamics in DOC concentrations during the period from 2000 to 2015. The non-parametric Seasonal Mann-Kendall Test (MKT) [25] was used since it is robust against non-normality, missing and censored data (i.e. data below the detection limit). Minimum eight years of dataset is needed to indicate the potential trend for particular parameter [10]. Briefly, this test computes the Mann-Kendall statistics Si (Equation (1)) and its variance VAR(Si) (Equation (2)) within monthly grouped data before summing for all k seasons to give the seasonal statistics S’ (Equation (3)).
where l > k, ni is the number of non-missing observations for month i, and
where m is the number of groups of tied (equal-valued) data in month i, and tj is the size of the jth tied group.
To test the null hypothesis (Ho) of no trend against either upward or downward trend (two-tailed test) at the σ level of significance, Ho is rejected if the absolute value of the standardized test statistics (MK stat) is greater than Z1-σ/2 ,derived from cumulative normal distribution. A positive (negative) value of MKstat indicates an upward (downward) trend. Sen’s slope comprising the period from 2000 to 2015 was calculated as the median concentration change between years for all seasonal blocks derived from the individual slope estimates Qi (Equation (5)) for each of the k seasons [26].
Correlation analysis was carried out to study the relationships between the trends of DOC with other variables such as temperature, runoff, SO4, NO3, DON, Ca, Mg, pH, T-Alk and acidification index (ACI). The ACI value was obtained by calculating the equivalent ratio of (Ca + Mg)/(NO3 + SO4) as a measure of the acidification status. The classification of ACI values is as follows: (ACI) > 1.5 indicates no acidification, values of 1.0 < ACI < 1.5 indicate sensitive water, and ACI < 1.0 is indicative of strong acidification [27]. Determination of the ACI value was preferred instead of acid neutralizing capacity (ANC) because of sparsely available data on Na and K concentrations in the data sets. The water quality status of Fei-Tsui Reservoir was determined by adopting the Trophic State Index (TSI) introduced by Carlson [28]. This TSI uses three variables (Chlorophyll a (Chl-a), secchi depth and total phosphorus (TP)) as the basis for trophic state classification. The TSI equations for secchi depth are TSI (SD) = 60 − 14.41 ln (SD); Chl-a is TSI (Chl) = 9.81 ln (Chl) + 30.6; and TP is TSI (TP) = 14.42 ln (TP) + 4.15. These TSI values are averaged and then used to classify the water quality level of reservoir as either oligotrophic (TSI < 40); mesotrophic (40 < TSI < 50) or eutrophic (50 < TSI < 60) status.
3. Results and Discussion
3.1. Long-Term Trends of Climate, DOC and Chemistry Parameters in Fei-Tsui Reservoir
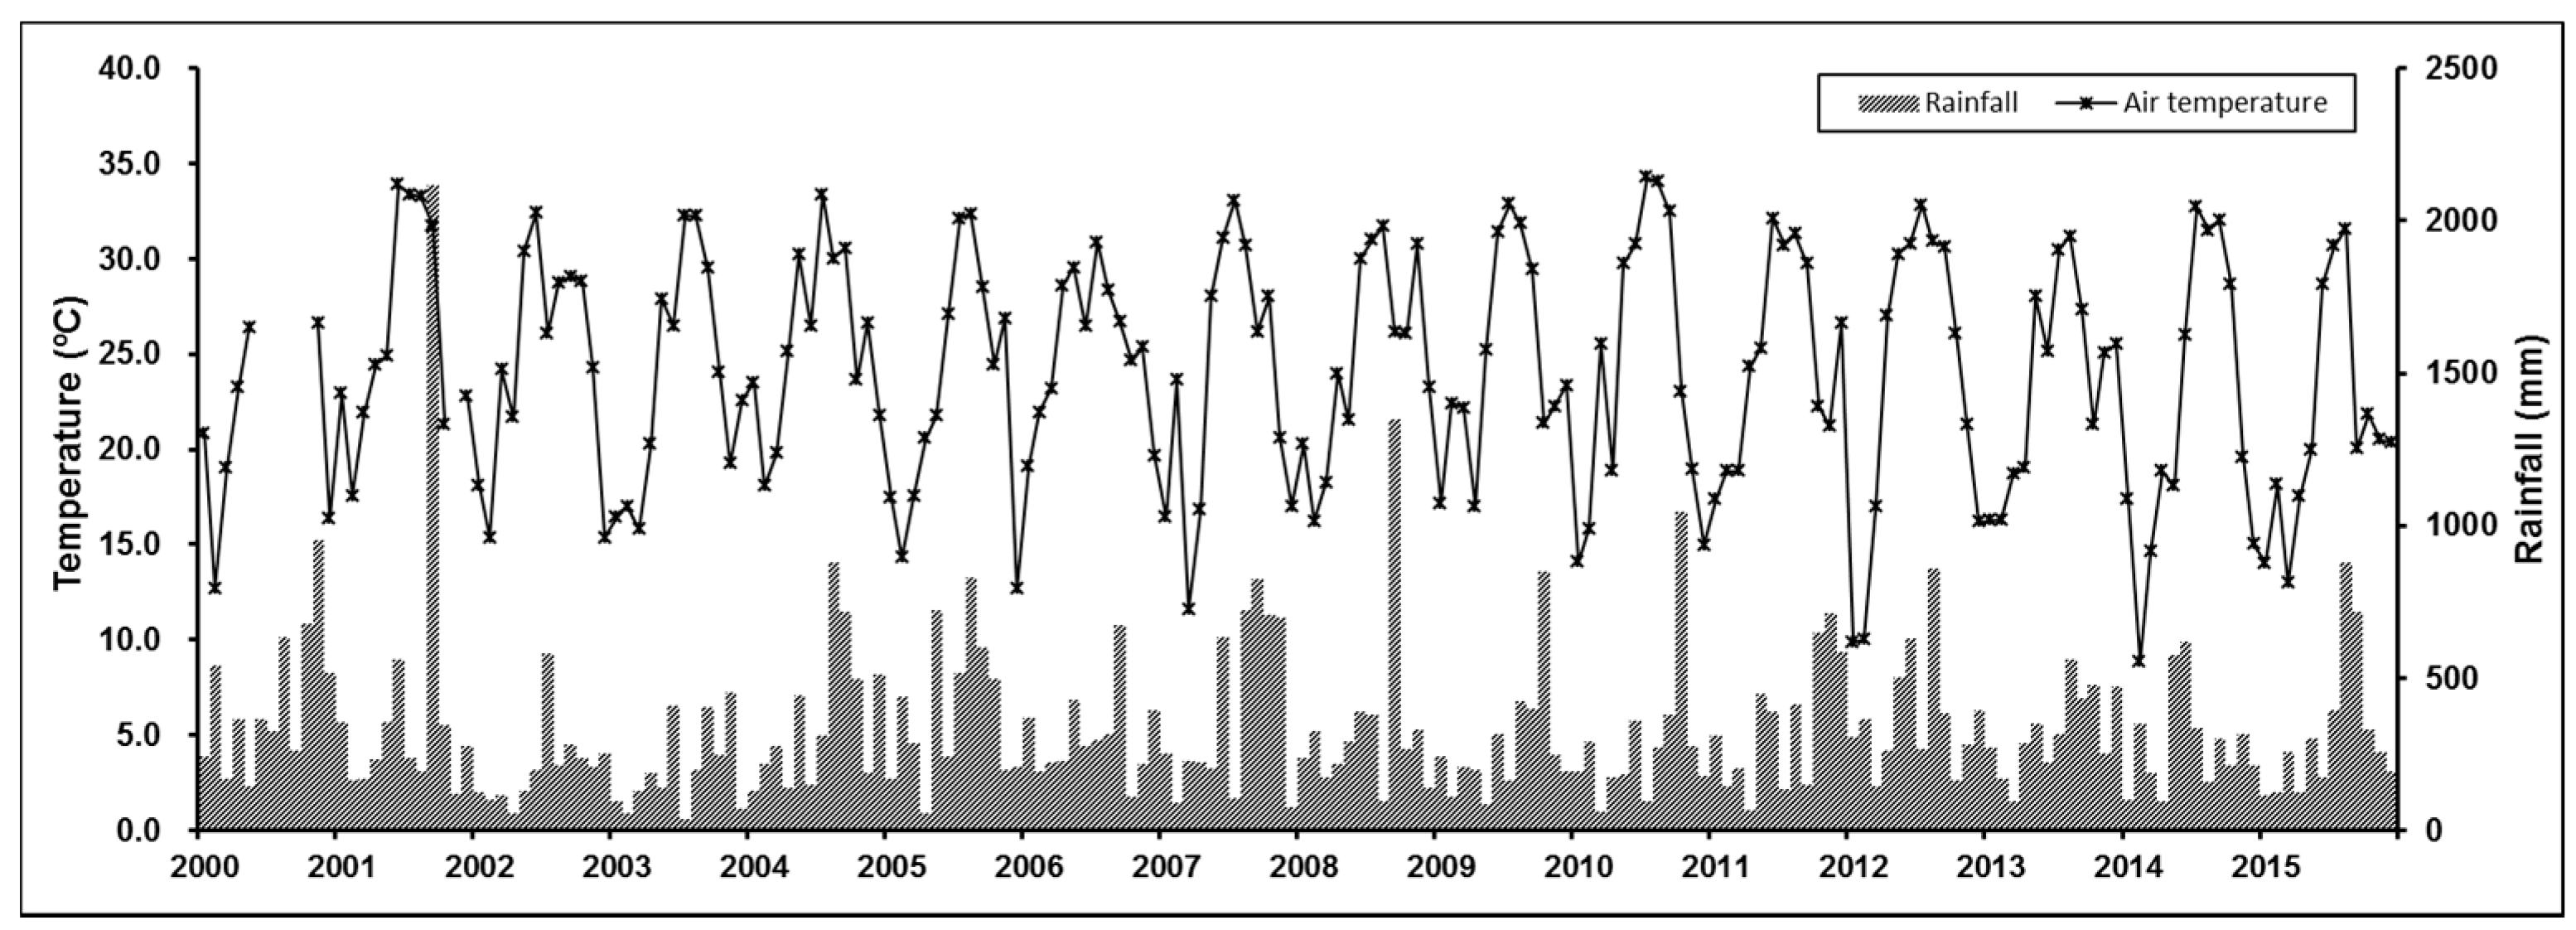
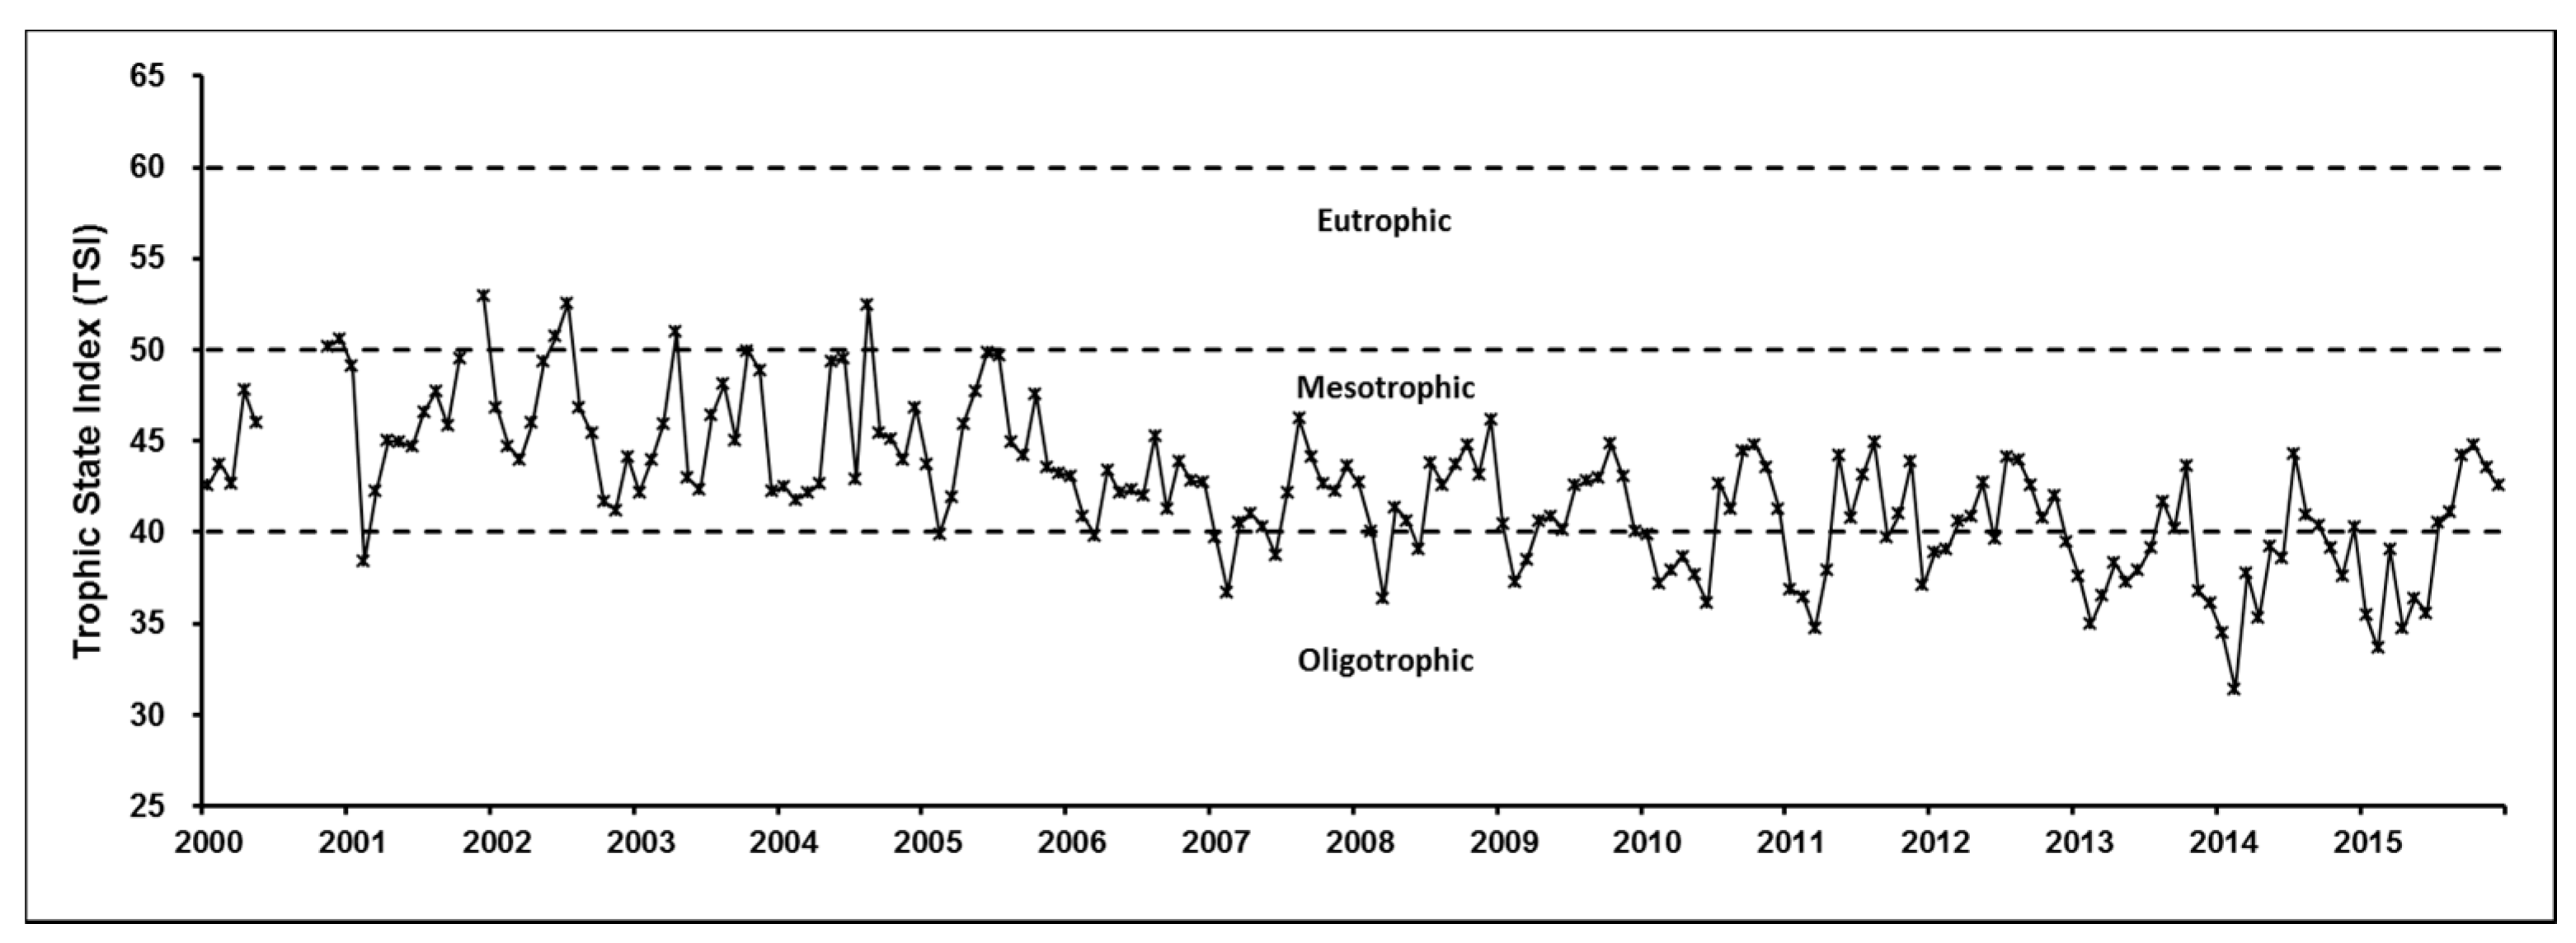
The trends of monthly temperature, rainfall and DOC concentration in Fei-Tsui Reservoir were analyzed using Mann-Kendall test, and the trend results are presented in Table 2. The long-term mean air temperature was 24.06 °C (2000 to 2015), with the lowest mean temperature of 8.87 °C in February and the highest mean temperature of 34.29 °C in July. The annual mean stream water temperature is 22.3 ± 0.7 °C (2000–2015), while the annual mean rainfall is 4018.62 mm yr−1 (2000–2015). No statistically significant overall trend could be detected in long-term air temperature. The annual mean temperature showed a decreasing trend of −0.006 °C yr-1. The negative trends can be observed in most of the monthly air temperature data for Fei-Tsui Reservoir basin, except for July, August, September and November. Significant negative and positive trends were observed for air temperature in April and July, respectively. The rainfall did not show significant trends when tested with the non-parametric seasonal Mann-Kendall test. The annual rainfall showed decreasing trend of −58.92 mm yr-1 in the Fei-Tsui Reservoir basin. Downward trends were detected in the months of March, April, September and December, whereas others months showed upward trends during the period of 2000 to 2015. The time series of air temperature and rainfall in the Fei-Tsui Reservoir from 2000 to 2015 are shown in Figure 2. Trophic State Index (TSI) was calculated for determining the annual and monthly water quality status in the Fei-Tsui Reservoir, and the results are presented in Table 2 and Figure 3. The annual mean TSI for Fei-Tsui Reservoir in year 2000 is 45.5, which is categorized as mesotrophic status; This value declined to nearly oligotrophic status (TSI = 39.3) in 2015. Statistically significant decreasing trends were detected for annual mean TSI in all months except for July. Both SO4 and NO3 showed significant annual decreasing trends, while significant annual increasing trends were observed in pH and ACI at the water surface layer of Fei-Tsui Reservoir. There were no significant annual trends detected in Mg and Ca, but a significant decreasing trend existed in DON. We found no clear trends in T-Alk, even though there was a significant declining SO4 concentration in the Fei-Tsui Reservoir from 2000 to 2015.
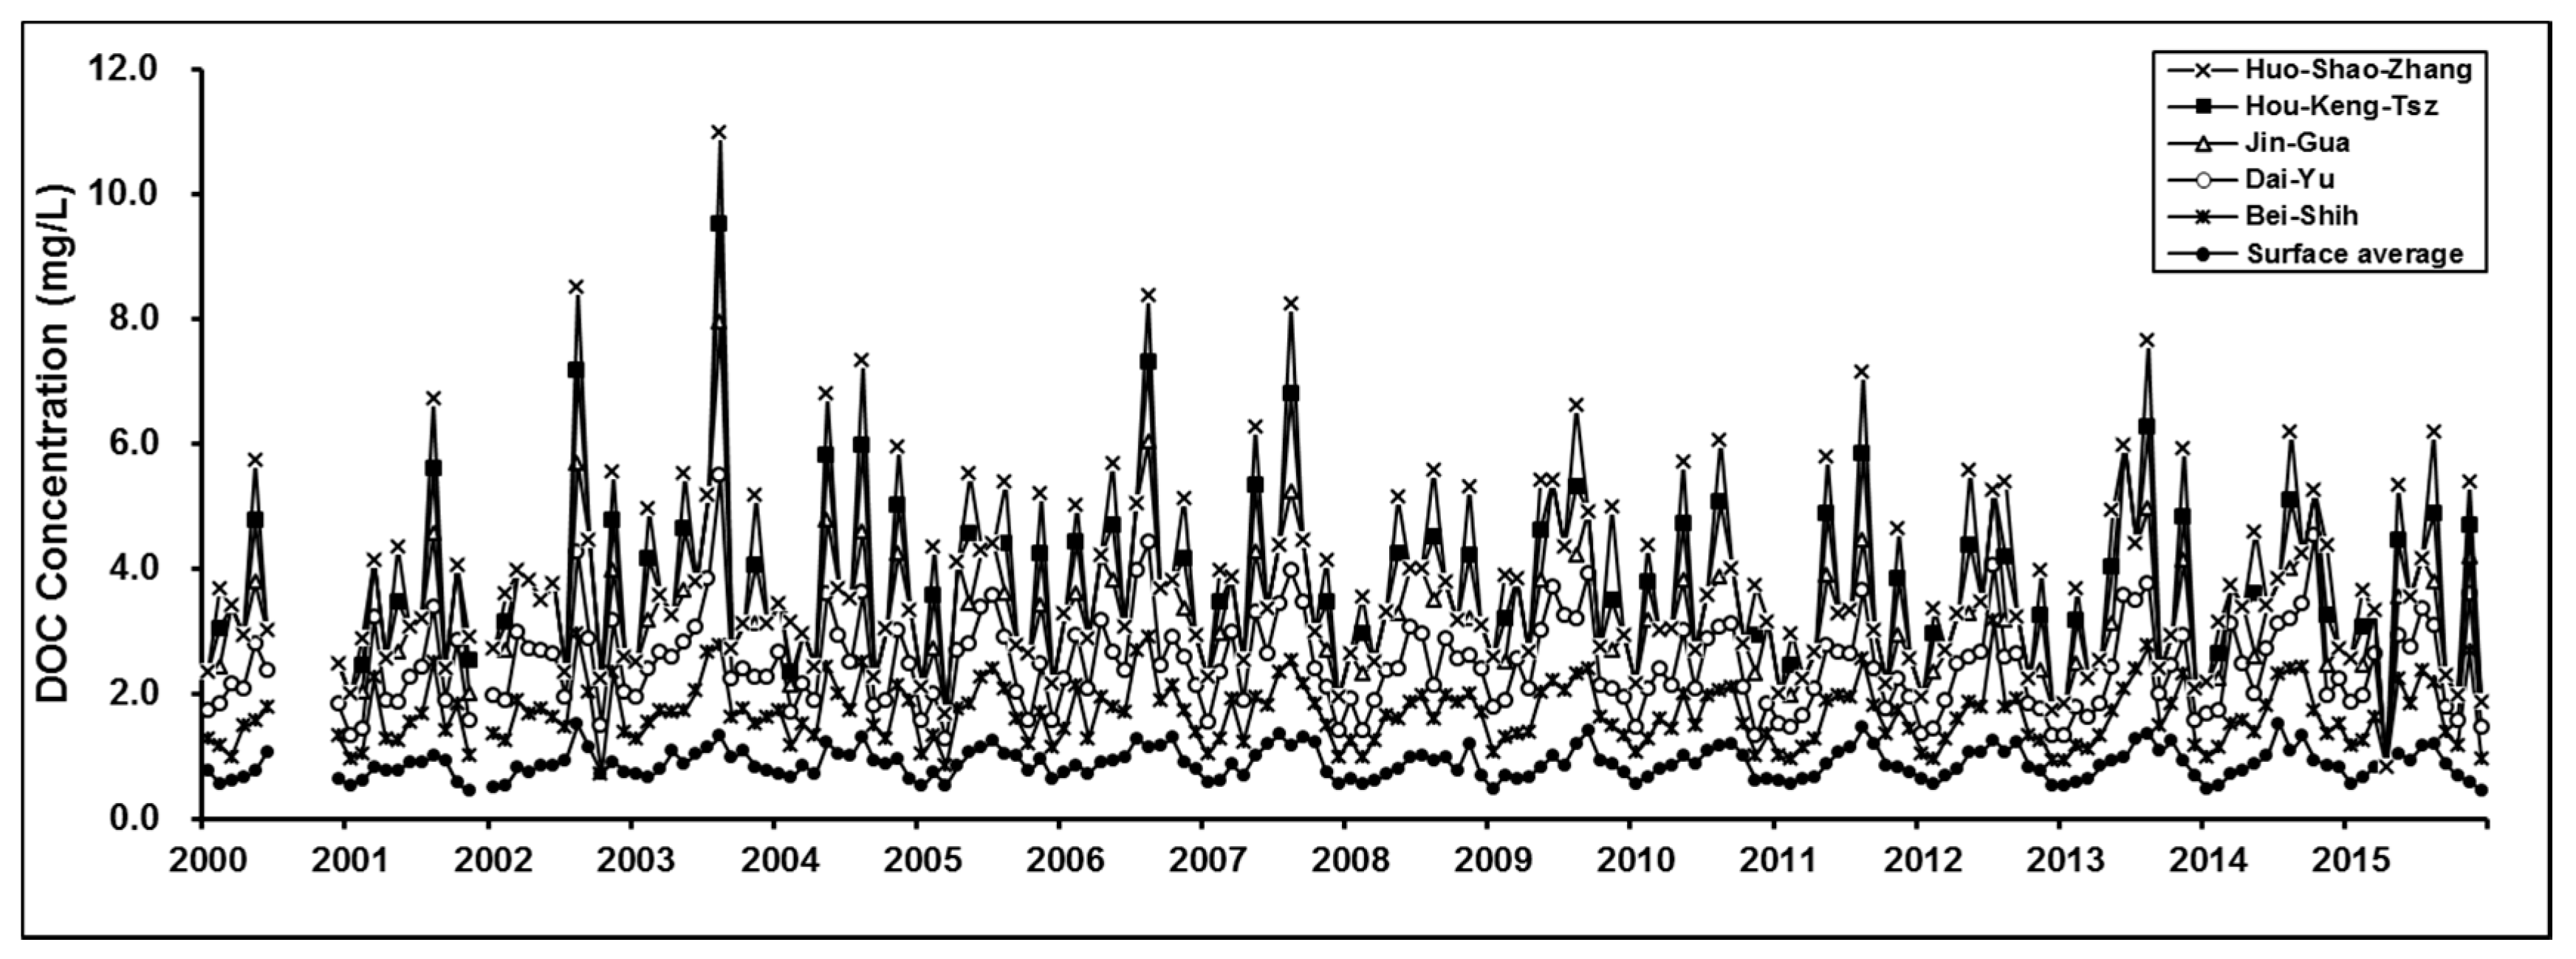
Over the 16 years period, the monthly tributaries and water surface DOC concentrations in the Fei-Tsui Reservoir did show strong temporal and seasonal variability as shown in Figure 4. The monthly mean DOC concentration in the water surface layer (0.5 m) of Fei-Tsui Reservoir is 0.87 mg/L. The highest concentration of 1.50 mg/L was recorded in August, while the lowest concentration of 0.44 mg/L was recorded in November. This showed a marked seasonal pattern of high summer/autumn and low winter/spring DOC concentrations. Monthly mean DOC concentrations in the tributaries of Fei-Tsui Reservoir also show strong seasonality, with a winter minimum, and an increase from early spring to late summer/early autumn. These results align well with findings presented by Dawson et al. [29] in Scotland, i.e., that increased DOC concentrations occurred between June and November with correspondingly lower DOC concentrations from December to May. All five tributaries showed distinct DOC concentrations and export levels during the period from 2000 to 2015. Huo-Shao-Zhang and Hou-Keng-Tsz streams had the highest DOC concentration with annual mean concentrations of 0.91 mg/L and 0.89 mg/L, respectively. Jin-Gua stream exhibited an annual mean DOC concentration of 0.81 mg/L, while both Bei-Shih and Dai-Yu streams had the lowest concentration (0.80 mg/L and 0.79 mg/L, respectively). There was no significant annual trend in DOC concentration at the water surface layer of Fei-Tsui Reservoir but a significant increasing trend was detected in July.
3.2. Long-Term Trends of DOC and Water Chemistry in Tributaries of Fei-Tsui Reservoir
There were insufficient data for a statistically reliable detection of trends in the DOC concentrations for all months at Hou-Keng-Tsz and Huo-Shao-Zhang streams. However, samples were taken during February, May, August and November enabling trends for these months to be determined and an assessment of the seasonal drivers of change in DOC concentrations to be made. The five main tributaries of Fei-Tsui Reservoir showed distinct DOC concentrations during the period from 2000 to 2015 (Figure 4). However, there were no significant overall trends of DOC for all tributaries but trends in monthly DOC concentrations do exist. In the inflowing streams at the upper catchment of Fei-Tsui Reservoir, decreasing gradients in monthly mean DOC concentrations were detected from late autumn (October and November) until early spring (March). The Mann-Kendall trend results showed that significant decreasing trends in monthly mean DOC concentrations were detected in May in Dai-Yu stream (trend = −0.030 mg L−1 yr−1, p < 0.05), in March (trend = −0.025 mg L−1 yr−1, p < 0.05) and October in Jin-Gua stream (trend = −0.039 mg L−1 yr−1, p < 0.01). For Hou-Keng-Tsz and Huo-Shao-Zhang streams, no significant trends of monthly DOC concentrations were detected (Table 2).
Water chemistry trends were calculated for each tributary and water surface of Fei-Tsui Reservoir over a 16-year period. The results showed that significant decreasing trends of SO4 concentration were observed in all streams and reservoir water surface (Table 2). This observation may be attributed to the intense reduction of industrial sulfur dioxide (SO2) and nitrogen oxide (NOx) emissions from formerly high levels in Taipei, Taiwan over the period 1994–2003 [30]. The decreasing trends of the annual mean concentrations are −2.05 μg L−1 yr−1 for NOx and −0.51 μg L−1 yr−1 for SO2. We had carried out correlation analysis to evaluate the relationship between atmospheric sulfur deposition and SO4 concentration in the Fei-Tsui Reservoir. The results showed that positive relationship (Pearson correlation coefficient, r = 0.33) was observed for atmospheric SO2 and SO4 concentrations in the surface water of Fei-Tsui Reservoir. However, rates of SO4 decline are greater in surface waters than in atmospheric deposition in Taiwan. Higher initial concentration may lead to larger rate of change for SO4 concentration in the Fei-Tsui Reservoir as suggested by Davies et al. [31]. In general, the Fei-Tsui Reservoir catchment received declining atmospheric deposition of sulfate and inorganic nitrogen since 1994. Declining concentrations of these anions will increase the solubility of organic matter by increasing pH and reducing ionic strength [31].
In this study, we used the sum of calcium and magnesium (Ca + Mg) as a surrogate for total base cations, because these cations play the most quantitatively important role at the majority of acid sensitive monitoring sites as they exert the most control over alkalinity. The cations (Ca + Mg) showed significant decreasing annual trends similar to anions (SO4 + NO3) in all streams and reservoir as shown in Table 3. However, the declining trajectories of stream base cation and SO4 concentrations were not accompanied by increases in T-Alk. Dominant trends in all streams were declining trends of SO4, NO3, Ca, DON, Mg and T-Alk concentrations with a relatively smaller compensating increase in pH. Some studies also produced a generally consistent picture of predominantly decreasing SO4, base cations, and base metal concentrations, and increasing pH and/or alkalinity [3,32]. The ACI status in the reservoir water surface, Bei-Shih and Huo-Shao-Zhang tributaries showed significant increasing trends during the period from 2000 to 2015. Positive trends in pH and ACI may indicate recovery from acidification in the Fei-Tsui Reservoir in recent years. Significant decreases in DON were observed in all streams and reservoir water surface during the period from 2000 to 2015. According to Mattsson et al. [33], the delivery of terrestrial DON to aquatic systems depends on production/decomposition rates, solubility and the availability of hydrological transport. Export of DON is also typically related to that of DOC within individual watersheds or across regions. Carbon and nitrogen losses were highly related (R2 = 0.95) to each other in boreal headwater catchments because of the dominance of organic N compounds in N cycling [34].
3.3. Effect of Re-Oligotrophication in the Fei-Tsui Reservoir
Although there have been widespread increases in DOC concentration in North American and northern and central European surface waters, Bertoni et al. [35] found decreasing trends of DOC in Lake Maggiore, Northern Italy during the period from 1980 to 2007. Arvola et al. [36] in Finland also found that the long term trend of DOC (1975–2000) had shown statistically significant (p < 0.05) decreasing trend in nine rivers at least once during March, May, August and October. In overall, we found no significant annual trend in DOC concentration of Fei Tsui Reservoir during the period from 2000 to 2015. However, there were borderline decline (p < 0.1) in DOC concentration at the water surface layer of Fei-Tsui Reservoir for individual months as shown in Table 2. It is suggested that the decline of DOC concentration is linked to the decreases of total phosphorus, organic loadings and in-lake productivity [37]. Cheng and Chi [38] and Aparicio et al. [39] also stated that eutrophication process will cause an increase in DOC concentration. Lai et al. [40] found that bacterial production, primary production and DOC were positively inter-correlated when the inorganic nutrient supplies were potentially abundant. Therefore, correlation analysis was carried out to determine the interaction between DOC and Trophic State Index (TSI) trends in the water surface layer of Fei-Tsui Reservoir. Significant positive correlation (Pearson’s r = 0.557, p < 0.01) was obtained between DOC and TSI trends over the study period of 16 years. This result could be attributed to the re-oligotrophication effect in the Fei-Tsui Reservoir. The TSI in Fei-Tsui reservoir declined from mesotrophic to oligotrophic status during the period from 2000 to 2015. Lower inorganic nutrients (N & P) input could cause a decline in primary productivity across the catchment, and therefore a decline in potential DOC concentration in streams and reservoir water bodies. The eutrophication process seem to play an important role in the long-term DOC pattern in the Fei-Tsui Reservoir.
3.4. Effects of Hydrological and Meteorological Factors
Hydrological and meteorological factors have been recognized as important controlling factors of DOC export in reservoirs and streams in some studies [41,42]. Therefore, we studied the influences of runoff and temperature changes in different seasons on the trends of DOC concentration in the Fei-Tsui Reservoir and streams in detail. DOC concentration, air temperature, water temperature and stream flow on the sampling day in the Fei-Tsui Reservoir basin were compared during the period from 2000 to 2015. The correlation results between hydrological and meteorological factors with monthly DOC concentration are presented in Table 4. Generally, air and water temperatures showed positive correlation with DOC concentrations at the reservoir water surface and in most of the streams, even though the annual DOC trend in the surface layer of reservoir did not correspond with the annual air temperature trend in Fei-Tsui Reservoir. A significant increasing trend of DOC concentration was observed in the water surface layer of the reservoir during July as presented in Table 2. The increasing DOC concentration corresponded well with the increas in air temperature at this time of year. Preston et al. [43] found that the increase in DOC over 29 years in a south-central Ontario catchment was attributed to hydrological and temperature changes. Dawson et al. [29] explained that the increased DOC in Scotland was not related to discharge but mainly depended on higher temperatures driving biological activity, increasing decomposition of available organic matter and solubility of DOC. All inflow streams at the upper Fei-Tsui Reservoir catchment also showed increasing trends in July. This could be attributed to conversion of humified organic matter to leachable organic matter as a result of microbial enzymatic activities under warmer conditions as suggested by Berggren et al. [44]. Kohler et al [45] suggested that the increasing trend in autumn DOC might result from little loss to degradation either microbially or photolytically in the streams. The results also support the findings by Oni et al. [46], i.e., that DOC production depends mainly on runoff and antecedent soil temperature. They explained that significant increases in DOC in an upland forest site were attributed to higher permeable soils and evapotranspiration rates in the forest catchment.
Negative correlations were detected between runoff and DOC concentrations for all streams, with significant correlations for the Dai-Yu and Jin-Gua streams. The drop in the DOC concentration in August and October could be attributed to the dilution mechanism induced by the increasing runoff volume during typhoon-induced storm events. An overall increase in runoff volume entering the stream network and reservoir can be hypothesized to decrease the DOC concentrations due to dilution. Preston et al. [43] also observed that stream (DOC) was negatively correlated with autumn runoff and precipitation. The correlation results between runoff and DOC concentration suggest that prolonged periods of low flow tend to concentrate DOC, whereas high-flow periods lead to dilution of DOC concentration. A small increment in rainfall trends was related positively with DOC concentration in Huo-Shao-Zhang streams in May. This could indicate that short spells of rain flush the DOC from the humus-rich topsoil into the stream. Increased DOC in upland catchments under high-flow events of short duration has been shown in numerous watersheds and is commonly attributed to changes in hydrological pathways [29,44].
3.5. Effect of Declining Atmospheric Acid Deposition
With the significant decrease in SO4 concentration, the DOC concentration was not significantly increased in all streams and the water surface layer of Fei-Tsui Reservoir. This result is consistent with the finding of Clair et al. [47] in Nova Scotia, Canada. Their results also showed that reduction in sulfur acidification did not lead to increases in catchment organic carbon mobilization to streams. In this study, correlation analysis was carried out to determine the interaction between DOC trends and trends in SO4, Cl, COD, pH, T-Alk, NO3, Ca, DON and Mg. As shown in Table 5, we can observe that trends in SO4, COD, T-Alk, NO3, Ca, DON and Mg were positively correlated with the DOC trend, with significant positive correlation observed for SO4 and Ca. This observation is not aligned with the findings from literature where DOC increases with declining SO4 deposition [5,10]. The trends of Ca and Mg concentrations in Fei-Tsui Reservoir declined simultaneously with the SO4 trend during the period from 2000 to 2015. A similar finding was found that as SO4 decreased, base cation and acid neutralizing capacity (ANC) also decreased in lakes in Europe, Canada and North America [6,8,48,49,50]. This result is consistent with the classic inorganic model of acidification [51] where the decline in anionic deposition leads to a reduction in co-transport of base cations. General declining trajectories of stream base cation concentrations in the Fei-Tsui Reservoir suggest a recovery from the effects of acidification. The combination of declining SO4 and base cations means that the lakes are probably becoming more diluted. This appears to currently limit the rate of recovery in many surface water systems around the world.
The decreasing trends of T-Alk in all streams and the water surface of Fei-Tsui Reservoir from 2000 to 2015 were not surprising, as this parameter would be expected to behave similarly to cations (Ca + Mg). Declining base cations had compensated for part or all of the declining SO4 concentrations instead of increasing pH and/or alkalinity. When rates of Ca + Mg decline are equal or nearly equal to rates of SO4 and NO3 decline, then chemical improvement (increased alkalinity) is negligible. In addition, impairment of internal alkalinity generation was found that related to several factors, such as depletion of the iron needed to form insoluble sulfide compounds; SO4 reduction; denitrification, ion exchange at the water-sediment interface, DOC degradation and severity of the acidification [49]. Alkalinity is also a conservative parameter that is not influenced by temperature [46]. ACI also showed increasing trends during the period from 2000 to 2015 in all streams and reservoir. The main reason for the ACI increases is that acid anions were decreasing more rapidly than base cations and not because of increasing base cations from renewed soil and geological weathering, which would suggest ecosystem recovery. According to Kirchner and Lydersen [52], acidic mobile ions tend to accelerate leaching of easily exchanged base cations contained in drainage basin soils to runoff more than they accelerates base cation release by mineral weathering. The significant long-term trend of ACI suggests that since SO4 concentrations have somewhat stabilized, there now needs to be an increase in cations from natural weathering.
The consistent decreasing trends of SO4, NO3, Ca, Mg as well as increasing trends of pH and ACI in Fei-Tsui Reservoir and streams indicated recovery from acidification. Since there are significant decreasing trends of Ca and Mg, we suggest that the Fei-Tsui Reservoir basins has now been depleted of most soil-exchangeable cations and is in the last stage of the acidification process. However, increases in reservoir base cation concentrations via primary weathering under low acid deposition conditions will be a slow process [53]. This may imply that further reduction in acid deposition is needed in order to allow long-term increases in acid neutralizing capacity (ANC) associated with the recovery process. In general, the declining atmospheric deposition of SO4 and NO3 did not significantly contribute to the increase in DOC concentration over the study period in Fei-Tsui Reservoir. A similar finding was found by Sarkkola et al. [54] in Finland, i.e., that stream water DOC concentrations and exports are mainly driven by catchment characteristics and hydro-meteorological factors rather than trends in atmospheric acid deposition.
4. Conclusions
This study was carried out to determine the long-term trends and seasonal patterns of DOC and its interactions with atmospheric deposition chemistry, climate variability, hydrological changes and stream water chemistry in the Fei-Tsui Reservoir basin in northern Taiwan. The monthly tributaries and water surface DOC concentrations in Fei-Tsui Reservoir did show strong temporal and seasonal variability. The DOC seasonal variations were significantly influenced by climatic and hydrologic drivers, especially in streams. There were no significant overall trends observed in stream DOC but significant decreasing trends existed for individual months with declined temperature and increased rainfall. This suggested that climatic and hydrological factors were the dominant drivers for stream DOC dynamics in the study. Both SO4 and Ca concentrations showed statistically significant decreasing trends, and this indicated recovery from acidification in Fei-Tsui Reservoir. The annual DOC concentration did not exhibit significant trend in the water surface of Fei-Tsui Reservoir but significant increasing trend is observed in July. Significant positive correlation (Pearson’s r = 0.557, p < 0.01) was obtained between DOC and TSI trends over the 16-year study period. We conclude that the DOC concentration in the water surface of Fei-Tsui Reservoir is mainly driven by the re-oligotrophication and temperature effects rather than a decrease in atmospheric sulfur deposition. These findings are not only important for predicting the DOC concentration in the coming decades but also provide new insights to further understand the processes controlling DOC in this subtropical region.
Acknowledgments
The authors would like to thank the Taipei Fei-Tsui Reservoir Administration Office for providing the valuable water quality data sets. We sincerely thank the anonymous reviewers for providing comments and suggestions, which improved this manuscript.
Author Contributions
M.F.C. and F.K.S. conceived and designed the experiments; M.F.C., C.-C.L., H.-Y.K., C.-H.L., and T.-Y.C. performed the experiments; M.F.C. and H.-Y.K. analyzed the data; F.-K.S. contributed reagents/materials/analysis tools; M.F.C. wrote the paper.
Conflicts of Interest
The authors declare no conflict of interest.
References
- Hope, D.; Billett, M.F.; Milne, R.; Brown, T.A.W. Exports of organic carbon in British rivers. Hydrol. Proc. 1997, 11, 325–344. [Google Scholar] [CrossRef]
- Battin, T.J.; Luyssaert, S.; Kaplan, L.A.; Aufdenkampe, A.K.; Richter, A.; Tranvik, L.J. The boundless carbon cycle. Nat. Geosci. 2009, 2, 598–600. [Google Scholar] [CrossRef]
- Pagano, T.; Bida, M.; Kenny, J.E. Trends in Levels of Allochthonous Dissolved Organic Carbon in Natural Water: A Review of Potential Mechanisms under a Changing Climate. Water 2014, 6, 2862–2897. [Google Scholar] [CrossRef]
- Chow, A.T.; Tanji, K.K.; Gao, S.D. Production of dissolved organic carbon (DOC) and trihalomethane (THM) precursor from peat soils. Water Res. 2003, 37, 4475–4485. [Google Scholar] [CrossRef]
- Evans, C.D.; Monteith, D.T.; Cooper, D.M. Long-term increases in surface water dissolved organic carbon: Observations, possible causes and environmental impacts. Environ. Pollut. 2005, 137, 55–71. [Google Scholar] [CrossRef] [PubMed]
- Skjelkvale, B.L.; Stoddard, J.L.; Jeffries, D.S.; Torseth, K.; Hogasen, T.; Bowman, J.; Mannio, J.; Monteith, D.T.; Mosello, R.; Rogora, M.; et al. Regional scale evidence for improvements in surface water chemistry 1990–2001. Environ. Pollut. 2005, 137, 165–176. [Google Scholar] [CrossRef] [PubMed]
- Burns, D.A.; McHale, M.R.; Driscoll, C.T.; Roy, K.M. Response of surface water chemistry to reduced levels of acid precipitation: Comparison of trends in two regions of New York, U.S.A. Hydrol. Process. 2006, 20, 1611–1627. [Google Scholar] [CrossRef]
- Skjelkvåle, B.L.; Stoddard, J.L.; Andersen, T. Trends in surface water acidification in Europe and North America (1989–1998). Water Air Soil Pollut. 2001, 130, 787–792. [Google Scholar] [CrossRef]
- Skjelkvåle, B.L.; Mannio, J.; Wilander, A.; Andersen, T. Recovery from acidification of lakes in Finland, Norway and Sweden. Hydrol. Earth Syst. Sci. 2001, 5, 327–337. [Google Scholar] [CrossRef]
- Vuorenmaa, J.; Forsius, M.; Mannio, J. Increasing trends of total organic carbon concentrations in small forest lakes in Finland from 1987 to 2003. Sci. Total Environ. 2006, 365, 47–65. [Google Scholar] [CrossRef] [PubMed]
- Hongve, D.; Riise, G.; Kristiansen, J.F. Increased colour and organic acid concentrations in Norwegian forest lakes and drinking waters: A result of increased precipitation? Aquat. Sci. 2004, 66, 231–238. [Google Scholar] [CrossRef]
- Worrall, F.; Harriman, R.; Evans, C.D.; Watts, C.D.; Adamson, J.; Neal, C.; Tipping, E.; Burt, T.; Grieve, I.; Monteith, D.; et al. Trends in dissolved organic carbon in UK rivers and lakes. Biogeochemistry 2004, 70, 369–402. [Google Scholar] [CrossRef]
- Tranvik, L.J.; Jansson, M. Terrestrial export of organic carbon. Nature 2002, 415, 861–862. [Google Scholar] [CrossRef]
- Filella, M.; Rodríguez-Murillo, J.C. Long-term Trends of Organic Carbon Concentrations in Freshwaters: Strengths and Weaknesses of Existing Evidence. Water 2014, 6, 1360–1418. [Google Scholar] [CrossRef]
- Freeman, C.; Fenner, N.; Ostle, N.J.; Kang, H.; Dowrick, D.J.; Reynolds, B.; Lock, M.A.; Sleep, D.; Hughes, S.; Hudson, J. Export of dissolved organic carbon from peatlands under elevated carbon dioxide levels. Nature 2004, 430, 195–198. [Google Scholar] [CrossRef] [PubMed]
- Findlay, S.E.G. Increased carbon transport in the Hudson River: Unexpected consequence of nitrogen deposition? Front. Ecol. Environ. 2005, 3, 133–137. [Google Scholar] [CrossRef]
- Monteith, D.T.; Stoddard, J.L.; Evans, C.D.; de Wit, H.A.; Forsius, M.; Høgasen, T.; Wilander, A.; Skjelkvale, B.L.; Jeffries, D.S.; Vuorenmaa, J.; et al. Dissolved organic carbon trends resulting from changes in atmospheric deposition chemistry. Nature 2007, 450, 537–540. [Google Scholar] [CrossRef] [PubMed]
- Evans, C.D.; Chapman, P.J.; Clark, J.M.; Monteith, D.T.; Cresser, M.S. Alternative explanations for rising dissolved organic carbon export from organic soils. Glob. Chang. Biol. 2006, 12, 2044–2053. [Google Scholar] [CrossRef]
- Hinton, M.J.; Schiff, S.L.; English, M.C. The significance of storms for the concentration and export of dissolved organic carbon from two Precambrian Shield catchments. Biogeochemistry 1997, 36, 67–88. [Google Scholar] [CrossRef]
- Köhler, S.J.; Buffam, I.; Laudon, H.; Bishop, K. Climate’s control of intra-annual and interannual variability of total organic carbon concentration and flux in two contrasting boreal landscape elements. J. Geophys. Res. 2008, 113, G03012. [Google Scholar] [CrossRef]
- Worrall, F.; Burt, T.P. Flux of dissolved organic carbon from UK rivers. Glob. Biogeochem. Cycles 2007, 21, GB1013. [Google Scholar] [CrossRef]
- Erlandsson, M.; Buffam, I.; Fölster, J.; Laudon, H.; Temnerud, J.; Weyhenmeyer, G.A.; Bishop, K. Thirty-five years of synchrony in the organic matter concentrations of Swedish rivers explained by variation in flow and sulphate. Glob. Chang. Biol. 2008, 14, 1–8. [Google Scholar] [CrossRef]
- APHA. Standard Methods for the Examination of Water and Wastewater; American Public Health Association: Washington, DC, USA, 1985; p. 1268. [Google Scholar]
- Chow, M.F.; Shiah, F.K.; Lai, C.C.; Kuo, H.Y.; Wang, K.W.; Lin, C.H.; Chen, T.Y.; Kobayashi, Y.; Ko, C.Y. Evaluation of surface water quality using multivariate statistical techniques: A case study of Fei-Tsui Reservoir basin, Taiwan. Environ. Earth Sci. 2016, 75, 1–15. [Google Scholar] [CrossRef]
- Hirsch, R.M.; Slack, J.R.; Smith, R.A. Techniques of trend analysis for monthly water quality data. Water Resour Res. 1982, 20, 107–121. [Google Scholar] [CrossRef]
- Sen, P.K. Estimates of the regression coefficient based on Kendall’s Tau. J. Am. Stat. Assoc. 1968, 63, 1379–1389. [Google Scholar] [CrossRef]
- Schoen, R.; Köhler, A. Gewässerversauerung in kleinen Fließgewässern des Nordschwarzwaldes während der Schneeschmelze 1982. In Gewässerversauerung in der Bundesrepublik Deutschland; Umweltbundesamt, Ed.; Erich Schmidt: Berlin, Germany, 1984; pp. 58–69. [Google Scholar]
- Carlson, R.E. A trophic state index for lakes. Limnol. Oceanogr. 1977, 22, 361–369. [Google Scholar] [CrossRef]
- Dawson, J.J.C.; Soulsby, C.; Tetzlaff, D.; Hrachowitz, M.; Dunn, S.M.; Malcolm, I.A. Influence of hydrology and seasonality on DOC exports from three contrasting upland catchments. Biogeochemistry 2008, 90, 93–113. [Google Scholar] [CrossRef]
- Chang, S.C.; Lee, S.T. Evaluation of the trend of air quality in Taipei, Taiwan from 1994 to 2003. Environ. Monit. Assess. 2007, 127, 87–96. [Google Scholar] [CrossRef] [PubMed]
- Davies, J.J.L.; Jenkins, A.; Monteith, D.T.; Evans, C.D.; Cooper, D.M. Trends in surface water chemistry of acidified UK freshwaters, 1988–2002. Environ. Pollut. 2005, 137, 27–39. [Google Scholar] [CrossRef] [PubMed]
- Mallory, M.L.; McNicol, D.K.; Cluis, D.A.; Laberge, C. Chemical status and trends of small lakes near Sudbury, Ontario, 1983–1995: Evidence of continued chemical recovery. Can. J. Fish. Aquat. Sci. 1998, 55, 63–75. [Google Scholar] [CrossRef]
- Mattsson, T.; Kortelainen, P.; Räike, A. Export of DOM from Boreal catchments: Impacts of land use cover and climate. Biogeochemistry 2005, 76, 373–394. [Google Scholar] [CrossRef]
- Kortelainen, P.; Mattson, T.; Finer, L.; Ahtiainen, M.; Saukkonen, S.; Sallantaus, T. Controls on the export of C, N, P and Fe from undistributed boreal catchments, Finland. Aquat. Sci. 2006, 68, 453–468. [Google Scholar] [CrossRef]
- Bertoni, R.; Callieri, C.; Corno, G.; Rasconi, S.; Caravati, E.; Contesini, M. Long term trends of epilimnetic and hypolimnetic bacteria and organic carbon in a deep holo-oligomictic lake. Hydrobiologia 2010, 644, 279–287. [Google Scholar] [CrossRef]
- Arvola, L.; Raike, A.; Kortelainen, P.; Jarvinen, M. The effect of climate and land use on TOC concentrations and loads in Finnish rivers. Boreal Environ. Res. 2004, 9, 381–387. [Google Scholar]
- Bertoni, R.; Callieri, C.; Morabito, G.; Pinolini, M.L.; Pugnetti, A. Quali-quantitative changes in organic carbon production during the oligotrophication of Lake Maggiore, Italy. Verh. Int. Ver. Limnol. 1998, 26, 300–304. [Google Scholar]
- Cheng, W.P.; Chi, F.H. Influence of eutrophication on the coagulation efficiency in reservoir water. Chemosphere 2003, 53, 773–778. [Google Scholar] [CrossRef]
- Aparicio, F.L.; Nieto-Cid, M.; Borrull, E.; Calvo, E.; Pelejero, C.; Sala, M.M.; Pinhassi, J.; Gasol, J.M.; Marrase, C. Eutrophication and acidification: Do they induce changes in the dissolved organic matter dynamics in the coastal Mediterranean Sea? Sci. Total Environ. 2016, 563–564, 179–189. [Google Scholar] [CrossRef] [PubMed]
- Lai, C.C.; Fu, Y.W.; Liu, H.B.; Kuo, H.Y.; Wang, K.W.; Lin, C.H.; Tai, J.H.; Wong, G.T.F.; Lee, K.Y.; Chen, T.Y.; et al. Distinct bacterial-production-DOC-primary-production relationships and implications for biogenic C cycling in the South China Sea shelf. Biogeosciences 2014, 11, 147–156. [Google Scholar] [CrossRef] [Green Version]
- Eimers, M.C.; Watmough, S.A.; Buttle, J.M. Long term trends in dissolved organic carbon concentration: A cautionary note. Biogeochemistry 2008, 87, 71–81. [Google Scholar] [CrossRef]
- Köhler, S.J.; Buffam, I.; Seibert, J.; Bishop, K.H.; Laudon, H. Dynamics of stream water TOC concentrations in a boreal headwater catchment: Controlling factors and implications for climate scenarios. J. Hydrol. 2009, 373, 44–56. [Google Scholar] [CrossRef]
- Preston, M.D.; Eimers, M.C.; Watmough, S.A. Effect of moisture and temperature variation on DOC release from a peatland: Conflicting results from laboratory, field and historical data analysis. Sci. Total Environ. 2011, 409, 1235–1242. [Google Scholar] [CrossRef] [PubMed]
- Berggren, M.; Laudon, H.; Jansson, M. Hydrological control of organic carbon support for bacterial growth in boreal headwater streams. Microb. Ecol. 2009, 57, 170–178. [Google Scholar] [CrossRef] [PubMed]
- Köhler, S.; Buffam, I.; Jonsson, A.; Bishop, K. Photochemical and microbial processing of stream and soil water dissolved organic matter in a boreal forested catchment in northern Sweden. Aquat. Sci. 2002, 64, 269–281. [Google Scholar] [CrossRef]
- Oni, S.K.; Futter, M.N.; Bishop, K.; Kohler, S.J.; Ottosson-Lofvenius, M.; Laudon, H. Long term patterns in dissolved organic carbon, major elements and trace metals in boreal headwater catchments: Trends, mechanisms and heterogeneity. Biogeosciences 2013, 10, 2315–2330. [Google Scholar] [CrossRef]
- Clair, T.A.; Dennis, I.F.; Vet, R.; Laudon, H. Long-term trends in catchment organic carbon and nitrogen exports from three acidifed catchments in Nova Scotia, Canada. Biogeochemistry 2008, 87, 83–97. [Google Scholar] [CrossRef]
- Stoddard, J.L.; Jeffries, D.S.; Lükewille, A.; Clair, T.A.; Dillon, P.J.; Driscoll, C.T.; Forsius, M.; Johannessen, M.; Kahl, J.S.; Kellogg, J.H.; et al. Regional trends in aquatic recovery from acidification in North America and Europe. Nature 1999, 401, 575–578. [Google Scholar] [CrossRef]
- Whitfield, C.J.; Aherne, J.; Watmough, S.A.; Dillon, P.J.; Clair, T.A. Recovery from acidification in Nova Scotia: Temporal trends and critical loads for 20 headwater lakes. Can. J. Fish. Aquat. Sci. 2006, 63, 1504–1514. [Google Scholar] [CrossRef]
- De Wit, H.A.; Mulder, J.; Hindar, A.; Hole, L. Long-term increase in dissolved organic carbon in streamwaters in Norway is response to reduced acid deposition. Environ. Sci. Technol. 2007, 41, 7706–7713. [Google Scholar] [CrossRef] [PubMed]
- Galloway, J.N.; Norton, S.A.; Church, M.R. Freshwater acidification from atmospheric deposition of sulfuric acid: A conceptual model. Environ. Sci. Technol. 1983, 17, 541A–545A. [Google Scholar] [CrossRef] [PubMed]
- Kirchner, J.W.; Lydersen, E. Base cation depletion and potential long term acidification of Norwegian catchments. Environ. Sci. Technol. 1995, 29, 1953–1960. [Google Scholar] [CrossRef] [PubMed]
- Likens, G.E.; Driscoll, C.T.; Buso, D.C. Long-term effects of acid rain: Response and recovery of a forest ecosystem. Science 1996, 272, 244–246. [Google Scholar] [CrossRef]
- Sarkkola, S.; Koivusalo, H.; Lauren, A.; Kortelainen, P.; Mattsson, T.; Palviaainen, M.; Piirainen, S.; Starr, M.; Finer, L. Trends in hydrometeorological conditions and stream water organic carbon in boreal forested catchments. Sci. Total Environ. 2009, 408, 92–101. [Google Scholar] [CrossRef] [PubMed]
Figure 1.
Study area location map of the Fei-Tsui Reservoir catchment in northern Taiwan. Water quality monitoring locations and rainfall stations used in this study are provided.
Figure 1.
Study area location map of the Fei-Tsui Reservoir catchment in northern Taiwan. Water quality monitoring locations and rainfall stations used in this study are provided.
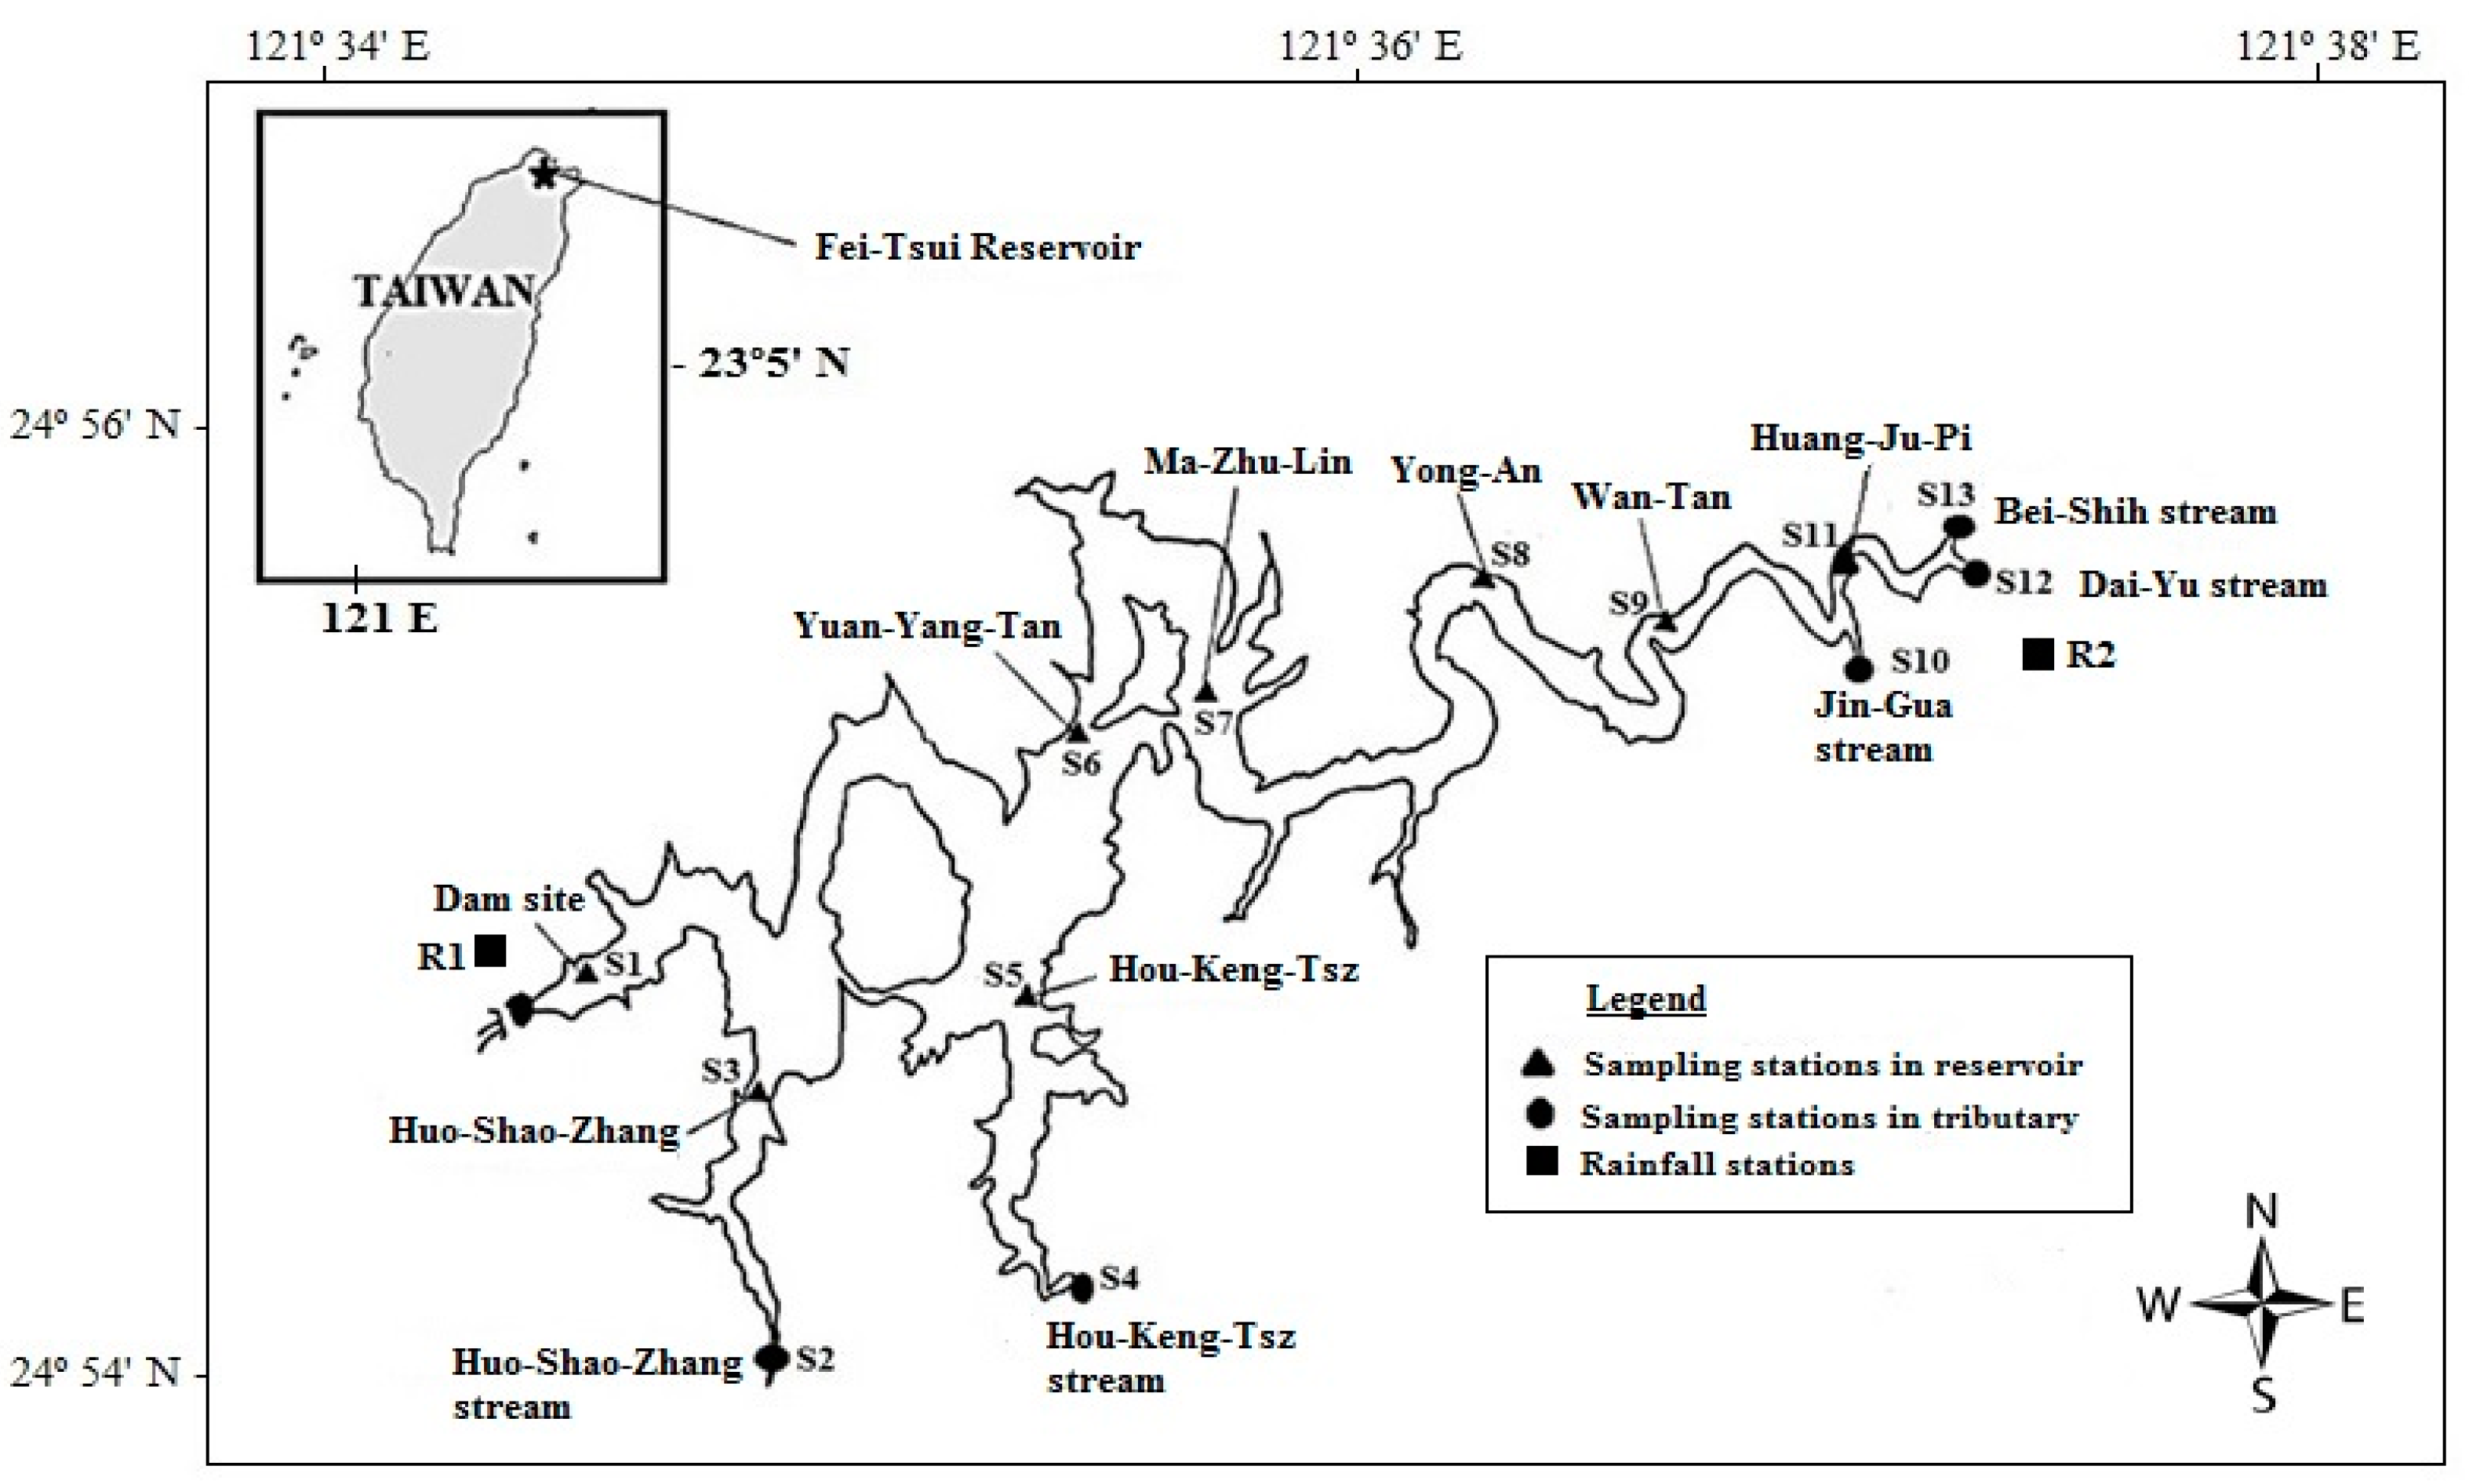
Figure 2.
Time series of air temperature and rainfall in the Fei-Tsui Reservoir from 2000 to 2015.

Figure 3.
Time series of TSI in the water surface of Fei-Tsui Reservoir from 2000 to 2015.

Figure 4.
Time series of DOC concentrations in the water surface and tributaries of Fei-Tsui Reservoir from 2000 to 2015.
Figure 4.
Time series of DOC concentrations in the water surface and tributaries of Fei-Tsui Reservoir from 2000 to 2015.


Table 1.
Details of land use distribution for each tributary of Fei-Tsui Reservoir.
| Station | Tributary | Catchment Area (ha) | Percentage of Land Use (%) | ||||
|---|---|---|---|---|---|---|---|
| Agriculture | Forest | Residential | Water | Others | |||
| S2 | Huo-Shao-Zhang | 1138 | 4.00 | 91.54 | 0.06 | 3.22 | 1.16 |
| S4 | Hou-Keng-Tsz | 2068 | 4.82 | 90.93 | 0.03 | 3.26 | 0.96 |
| S10 | Jin-Gua | 2418 | 7.55 | 89.49 | 0.81 | 0.44 | 1.70 |
| S12 | Dai-Yu | 7864 | 3.44 | 93.79 | 0.69 | 0.85 | 1.24 |
| S13 | Bei-Shih | 13658 | 9.65 | 77.89 | 1.88 | 6.58 | 4.00 |
| - | Total | 30051 | 6.6 | 85.9 | 1.1 | 3.7 | 2.6 |
Table 2.
Annual and monthly trends for climate, DOC and chemistry parameters in Fei-Tsui Reservoir and tributaries from 2000 to 2015.
Table 2.
Annual and monthly trends for climate, DOC and chemistry parameters in Fei-Tsui Reservoir and tributaries from 2000 to 2015.
| Site | Parameter | Mean/Std. Dev | Monthly Trend (mg L−1 Month−1) | ||||||||||||
|---|---|---|---|---|---|---|---|---|---|---|---|---|---|---|---|
| Year | January | February | March | April | May | June | July | August | September | October | November | December | |||
| Reservoir | Rainfall (mm) | 4018 ± 821 | −58.92 | 0.40 | 1.70 | −0.47 | −4.18 | 12.76 | 2.22 | 3.24 | 19.7 | −19.65 | 6.95 | 9.23 | −2.19 |
| Air Temp. (°C) | 24.1 ± 1.2 | −0.006 | −0.002 | −0.028 | −0.139 | −0.214 ** | −0.081 | −0.005 | 0.152 * | 0.139 | 0.089 | −0.027 | 0.122 | −0.001 | |
| Water Temp. (°C) | 24.1 ± 0.5 | −0.007 | −0.084 | −0.007 | −0.063 | −0.076 | −0.124 | −0.066 | 0.073 | 0.048 | 0.115 | −0.012 | 0.009 | −0.090 | |
| DOC (mg/L) | 0.87 ± 0.2 | 0.004 | −0.011 + | −0.003 | 0.000 | 0.001 | 0.012 | 0.000 | 0.03 * | −0.003 + | 0.014 | 0.009 | −0.006 + | −0.003 | |
| TSI | 42.4 ± 4.0 | −0.556 *** | −0.778 *** | −0.723 *** | −0.477 ** | −0.801 *** | −0.644 ** | −0.586 ** | −0.334 | −0.463 ** | −0.308 ** | −0.437 * | −0.528 * | −0.695 ** | |
| SO4 (mg/L) | 8.21 ± 1.7 | −0.082 *** | - | −0.105 * | - | - | −0.127 * | - | - | −0.198 *** | - | - | −0.035 | - | |
| NO3 (mg/L) | 0.49 ± 0.1 | −0.017 *** | - | −0.008 * | - | - | −0.012 * | - | - | −0.024 *** | - | - | −0.014 ** | - | |
| pH | 7.50 ± 0.3 | 0.029 * | 0.002 | 0.012 | 0.024 | 0.022 | 0.029 | 0.065 * | 0.045 | 0.076 * | 0.060 * | 0.011 | 0.004 | 0.005 | |
| T-Alk (mg/L) | 18.21 ± 1.8 | −0.080 | - | −0.130 | - | - | −0.045 | - | - | −0.295 | - | - | 0.103 | - | |
| Cl (mg/L) | 4.55 ± 0.3 | −0.018 | - | −0.014 | - | - | −0.009 | - | - | −0.048 | - | - | 0.009 | - | |
| DON (mg/L) | 0.16 ± 0.04 | −0.006 *** | - | −0.003 | - | - | −0.007 ** | - | - | −0.009 *** | - | - | −0.005 ** | - | |
| Ca (mg/L) | 6.01 ± 1.0 | −0.036 | - | −0.007 | - | - | −0.083 * | - | - | −0.169 | - | - | 0.044 | - | |
| Mg (mg/L) | 2.87 ± 0.4 | −0.036 | - | 0.023 | - | - | −0.080 * | - | - | −0.112 | - | - | 0.029 | - | |
| ACI | 1.04 ± 0.1 | 0.012 ** | - | 0.021 ** | - | - | 0.008 | - | - | 0.019 * | - | - | 0.019 * | - | |
| Bei-Shih | DOC | 0.80 ± 0.3 | −0.002 | −0.009 | −0.001 | −0.011 | −0.001 | 0.005 | 0.009 | 0.013 | −0.035 | 0.011 | −0.007 | 0.000 | −0.013 |
| SO4 | 9.02 ± 3.7 | −0.451 *** | - | −0.329 ** | - | - | −0.379 *** | - | - | −0.460 ** | - | - | −0.244 * | - | |
| pH | 7.41 ± 0.3 | 0.025 | 0.004 | 0.008 | 0.000 | 0.013 | −0.020 | 0.067 * | 0.032 | 0.024 | 0.015 | 0.037 * | 0.029 | 0.025 | |
| Dai-Yu | DOC | 0.79 ± 0.3 | −0.003 | 0.000 | −0.001 | −0.015 | 0.007 | −0.030 * | 0.014 | 0.000 | −0.032 | 0.008 | −0.020 | −0.017 | −0.007 |
| SO4 | 10.31 ± 2.9 | −0.359 *** | - | −0.243 * | - | - | −0.613 ** | - | - | −0.338 * | - | - | −0.212 * | - | |
| pH | 7.62 ± 0.3 | 0.030 | 0.019 | −0.015 | 0.024 | 0.043 | 0.010 | 0.072 | 0.025 | 0.029 | 0.060 | 0.039 | 0.000 | 0.031 | |
| Jin-Gua | DOC | 0.81 ± 0.3 | −0.013 | −0.007 | −0.006 | −0.025 * | −0.007 | −0.018 | 0.003 | −0.005 | −0.051 | −0.023 | −0.039 ** | −0.012 | −0.017 |
| SO4 | 9.77 ± 1.9 | −0.267 *** | - | −0.072 | - | - | −0.270 * | - | −0.368 ** | - | - | −0.306 * | - | ||
| pH | 7.53 ± 0.2 | 0.008 | −0.012 | −0.025 | −0.014 | 0.000 | −0.018 | 0.040 | 0.013 | 0.032 | 0.030 | 0.048 | −0.009 | 0.020 | |
| Hou-Keng-Tsz | DOC | 0.89 ± 0.3 | −0.002 | - | −0.002 | - | - | 0.000 | - | - | −0.020 | - | - | −0.004 | - |
| SO4 | 8.01 ± 1.5 | −0.100 ** | - | −0.084 | - | - | −0.130 *** | - | - | −0.144 ** | - | - | −0.044 | - | |
| pH | 7.53 ± 0.3 | 0.008 | - | 0.010 | - | - | 0.000 | - | - | 0.048 | - | - | 0.000 | - | |
| Huo-Shao-Zhang | DOC | 0.91 ± 0.3 | 0.002 | - | −0.007 | - | - | 0.001 | - | - | −0.002 | - | - | 0.004 | - |
| SO4 | 8.06 ± 1.5 | −0.093 *** | - | −0.104 ** | - | - | −0.123 *** | - | - | −0.136 ** | - | - | −0.026 | - | |
| pH | 7.51 ± 0.3 | 0.012 | - | 0.000 | - | - | 0.000 | - | - | 0.059 | - | - | 0.000 | - | |
Notes: TSI—Trophic State Index. For the annual and monthly trends (mg L-1 yr−1 and mg L−1 month−1), a statistically significant trend (seasonal Mann-Kendall test) is denoted with asterisks (p < 0.001 ***, p < 0.01 **, p < 0.05 *). Borderline trend is denoted with symbol ‘+’ (p < 0.1+). Std. Dev—standard deviation.
Table 3.
Annual trends of DOC and other constituents in surface water and tributaries of Fei-Tsui Reservoir.
Table 3.
Annual trends of DOC and other constituents in surface water and tributaries of Fei-Tsui Reservoir.
| Parameter | Yearly Trend (mg L−1 yr−1) | |||||
|---|---|---|---|---|---|---|
| Surface Water | Bei-Shih | Dai-Yu | Jin-Gua | Hou-Keng-Tsz | Huo-Shao-Zhang | |
| DOC | 0.004 | −0.002 | −0.003 | −0.013 | −0.022 | 0.002 |
| DON | −0.006 *** | −0.009 ** | −0.003 | −0.007 ** | −0.005 *** | −0.006 *** |
| COD | −0.044 | 0.132 | 0.018 | −0.077 | −0.025 | −0.002 |
| SO4 | −0.082 *** | −0.225 | −0.359 *** | −0.267 *** | −0.100 ** | −0.093 *** |
| NO3 | −0.017 *** | −0.005 | −0.005 | −0.010 * | −0.014 *** | −0.015 *** |
| Cl | −0.018 | 0.050 | 0.001 | −0.039 | −0.007 | 0.005 |
| pH | 0.029 * | 0.050 | 0.030 | 0.008 | 0.008 | 0.012 |
| T-Alk | −0.080 | 0.030 | −0.601 ** | −0.594 ** | −0.077 | −0.116 |
| Ca | −0.036 | -0.550 ** | −0.427 *** | −0.192 * | −0.211 ** | −0.029 |
| Mg | −0.036 | −0.108 * | −0.056 | −0.049 | −0.029 | −0.024 |
| ∑Cation | −0.045 | −0.422 *** | −0.459 *** | −0.222 * | −0.181 ** | −0.039 |
| ∑Anion | −0.094 *** | −0.448 *** | −0.353 *** | −0.271 *** | −0.090 *** | −0.100 *** |
| ACI | 0.012 ** | 0.013 * | 0.000 | 0.009 | −0.006 | 0.013 * |
Note: For the annual trend (mg L−1 yr−1), a statistically significant trend (seasonal Kendall-test) (boldface) is denoted with asterisks (p < 0.001 ***, p < 0.01 **, p < 0.05 *).
Table 4.
Correlations between hydrological and meteorological factors with stream DOC concentrations.
Table 4.
Correlations between hydrological and meteorological factors with stream DOC concentrations.
| Parameter | Sites | Air Temperature | Water Temperature | Runoff |
|---|---|---|---|---|
| DOC concentration (mg/L) | Bei-Shih | 0.115 | 0.375 | −0.554 |
| Dai-Yu | 0.050 | 0.503 | −0.696 * | |
| Jin-Gua | 0.068 | 0.320 | −0.607 * | |
| Hou-Keng-Tsz | 0.382 | 0.252 | −0.846 | |
| Huo-Shao-Zhang | 0.605 | 0.973 | −0.063 |
Note: * Correlation is significant at the 0.05 level (2-tailed).
Table 5.
Correlations between DOC and other constituents in Fei-Tsui Reservoir and tributaries.
| Parameter | DOC | SO4 | Cl | COD | pH | T-Alk | NO3 | Ca | DON |
|---|---|---|---|---|---|---|---|---|---|
| SO4 | 0.599 ** | ||||||||
| Cl | −0.241 | −0.122 | |||||||
| COD | 0.003 | −0.027 | −0.146 | ||||||
| pH | −0.020 | −0.147 | 0.184 | −0.011 | |||||
| T-Alk | 0.265 | 0.395 * | 0.079 | −0.122 | 0.380 * | ||||
| NO3 | 0.335 | 0.384 * | 0.355 | 0.024 | −0.212 | 0.518 ** | |||
| Ca | 0.529 ** | 0.756 ** | −0.164 | −0.137 | 0.032 | 0.431 * | −0.476 * | ||
| DON | 0.205 | 0.145 | 0.046 | 0.310 | −0.090 | −0.208 | 0.239 | 0.126 | |
| Mg | 0.235 | 0.436 * | 0.131 | 0.007 | −0.041 | 0.296 | 0.172 | 0.372 | 0.318 |
Note: Statistically significant correlation is denoted with asterisks (p < 0.01 **, p < 0.05 *).
© 2017 by the authors. Licensee MDPI, Basel, Switzerland. This article is an open access article distributed under the terms and conditions of the Creative Commons Attribution (CC BY) license (http://creativecommons.org/licenses/by/4.0/).
Share and Cite
MDPI and ACS Style
Chow, M.F.; Lai, C.-C.; Kuo, H.-Y.; Lin, C.-H.; Chen, T.-Y.; Shiah, F.-K. Long Term Trends and Dynamics of Dissolved Organic Carbon (DOC) in a Subtropical Reservoir Basin. Water 2017, 9, 545. https://doi.org/10.3390/w9070545
AMA Style
Chow MF, Lai C-C, Kuo H-Y, Lin C-H, Chen T-Y, Shiah F-K. Long Term Trends and Dynamics of Dissolved Organic Carbon (DOC) in a Subtropical Reservoir Basin. Water. 2017; 9(7):545. https://doi.org/10.3390/w9070545
Chicago/Turabian StyleChow, Ming Fai, Chao-Chen Lai, Hsiang-Yi Kuo, Chih-Hsien Lin, Tzong-Yueh Chen, and Fuh-Kwo Shiah. 2017. "Long Term Trends and Dynamics of Dissolved Organic Carbon (DOC) in a Subtropical Reservoir Basin" Water 9, no. 7: 545. https://doi.org/10.3390/w9070545
Note that from the first issue of 2016, this journal uses article numbers instead of page numbers. See further details here.