Article

Hydrological Design of Two Low-Impact Development Techniques in a Semi-Arid Climate Zone of Central Mexico

by
Liliana Lizárraga-Mendiola
1,
Gabriela A. Vázquez-Rodríguez
2,*,
Carlos Alexander Lucho-Constantino
2,
Carlos Alfredo Bigurra-Alzati
3,
Rosa Icela Beltrán-Hernández
2,
Joyce Edith Ortiz-Hernández
2 and
Luis D. López-León
1
1
Cuerpo Académico de Ingeniería Civil Sustentable y Tecnología de Materiales, Universidad Autónoma del Estado de Hidalgo, Carr. Pachuca-Tulancingo km 4.5 Col. Carboneras, Mineral de la Reforma 42184, Mexico
2
Área Académica de Química, Universidad Autónoma del Estado de Hidalgo, Carr. Pachuca-Tulancingo km 4.5 Col. Carboneras, Mineral de la Reforma 42184, Mexico
3
Grupo de Investigación Arquitectura, Tecnología y Habitabilidad, Universidad Autónoma del Estado de Hidalgo, Carr. Pachuca-Tulancingo km 4.5 Col. Carboneras, Mineral de la Reforma 42184, Mexico
*
Author to whom correspondence should be addressed.
Water 2017, 9(8), 561; https://doi.org/10.3390/w9080561
Submission received: 25 June 2017 / Revised: 20 July 2017 / Accepted: 21 July 2017 / Published: 26 July 2017

Abstract

:
This paper deals with the design of a bioretention cell and an infiltration trench in a semi- arid micro watershed. The study area was analyzed by characteristics such as slope changes (S), direction and maximum length of the urban runoff (L), and soil use (runoff coefficient, Rc). The bioretention cell was designed by the calculation of variables such as drainage area (A), concentration time (Tc), rainfall intensity (i), maximum peak drained (Qmax), inlet and outlet runoff (Qa and Qout, respectively), temperature (T), evaporation (Ev), potential evapotranspiration (PEm), consumptive use (U) for tolerant plants to semi-arid climates, and soil infiltration capacity (Inf). To design the infiltration trench, only Tc, Qmax, and i were taken into account. The results showed that the designed bioretention cell could retain between 5.37% and 2.25% of runoff volume. As the efficiency of the bioretention cell can be defined by the need for additional irrigation, our results showed that the cell is inefficient in some of the dry months (November and December), even in years characterized by abundant rainfall. Besides, it was shown that the designed infiltration trench could store or infiltrate the water from typical rain events. Based on these results, it is the implementation of more Low-Impact Development (LID) for runoff management in the study area is recommended.

1. Introduction

Urbanization is a key human-induced alteration of local hydrological cycles. Land cover changes due to urban sprawl raise imperviousness, thereby increasing runoff velocity and quantity and reducing the infiltration of stormwater [1]. The larger volume of runoff and the higher efficiency in water conveyance through artificially straightened channels lead to wider stream channels, as well as to increasingly frequent and severe floods [2]. The reduction of flooding in urbanized areas traditionally relies on the upgrading of the existing drainage capacity. Usual engineered responses comprise channelization, damming, and piping, which further increase impervious coverage and have shown to be expensive, impractical, and unsustainable [3]. On the contrary, Low-Impact Development (LID) is a philosophy focused on the rehabilitation of local urban hydrological cycles. LID techniques are aimed at designing decentralized infrastructure to manage urban runoff by altering the hydrologic conditions existing prior to the urbanization of the site as little as possible [4]. These techniques are based on the augmentation of pervious surfaces where stormwater infiltration into the ground can occur [5]. By retaining and favoring the infiltration and reuse of urban runoff near its source, LID can be viewed as a prevention-based approach for water conservation goals [4]. LID practices include bioretention cells, infiltration trenches, green roofs, stormwater wetlands, permeable pavements, and rainfall harvest systems. The incorporation of these systems into built environments promotes evapotranspiration, infiltration, and aquifer recharge, as well as processes improving the runoff quality through pollutant removals such as adsorption, filtration, biodegradation, and phytoremediation.
In LID practices vegetation plays a major role, enhancing water infiltration while runoff and peak flows are minimized. Also, by improving site aesthetics, reducing noise and air pollution and delivering shade and wind cover, plants provide additional ecological services [6]. The artificially-irrigated lawn is abandoned in favor of self-sustained native vegetation such as wild grass, shrubs, or trees, which results in actual ecological engineering systems. These are defined as sustainable ecosystems designed to integrate society with its natural environment and to solve human-induced problems [7]. Ecologically-engineered systems, (and LID practices such as stormwater wetlands, bioretention cells or green roofs), are characterized by their self-organization, which implies that only the initial structure of the system is human responsibility and that, once functioning, nature takes control of the system and defines its further composition. Besides, both ecological processes and the LID above-mentioned techniques are essentially powered by solar energy; consequently, they do not rely on off-site sources of energy (i.e., fossil fuels or electricity) nor in the input of matter to maintain a particular state [7]. While some authors have designed runoff models oriented to be used by stormwater managers [8], other authors modeled LID systems to assess flood reduction in urbanized zones [9].
Among LID practices, wetlands have shown extensively to mitigate the impact of urban runoff in temperate climates [10]. Yet, the efficiency of these systems can be hindered if the seasonal stormwater flow is not enough to maintain the high soil moisture required by wetland plants [11]. In contrast, the vegetation cover of bioretention cells (grasses as Phragmites australis, Carex praegracilis, or C. microptera, or flowering plants as Asteraceae spp., among others) is usually tolerant to changing hydrological conditions [11,12,13], and this feature has increased the interest in such systems. Besides, in a review [14], it was reported that bioretention facilities could lead to runoff volume and peak flow reductions of 52–100% and 44–97%, respectively. In semi-arid zones, succulent plants are prominent elements due to their ability to store water and to withstand extended periods of drought [15], and therefore, in these kind of climatic zones, could constitute the vegetation cover of bioretention cells. Even though bioretention cells might be constructed in a wide variety of climatic regions by selecting well-suited vegetation, their implementation in semi-arid zones is still scarce [12,16].
Other alternatives for stormwater management are infiltration trenches, which are shallow excavations filled with filter material where storm runoff is temporarily stored for its subsequent percolation into the underlying soil. They can be used alone or combined with other LID techniques, such as bioretention cells, permeable pavements, and wetlands, among others.
This paper deals with the design of a bioretention cell and an infiltration trench in a micro watershed located in a semi-arid climate. The chosen study area is the Hidalgo State University Campus, where floods occur commonly during the rainy season. After an analysis of the local hydrological variables, we proposed a design based on the characterization of the site hydrology and on the consumptive water use of plants able to tolerate the water stress characterizing these climatic regions, namely succulents and grasses. Also, we analyzed the efficiency of the proposed LID techniques through monthly water balances calculated for extreme conditions of rain and drought.

2. Materials and Methods

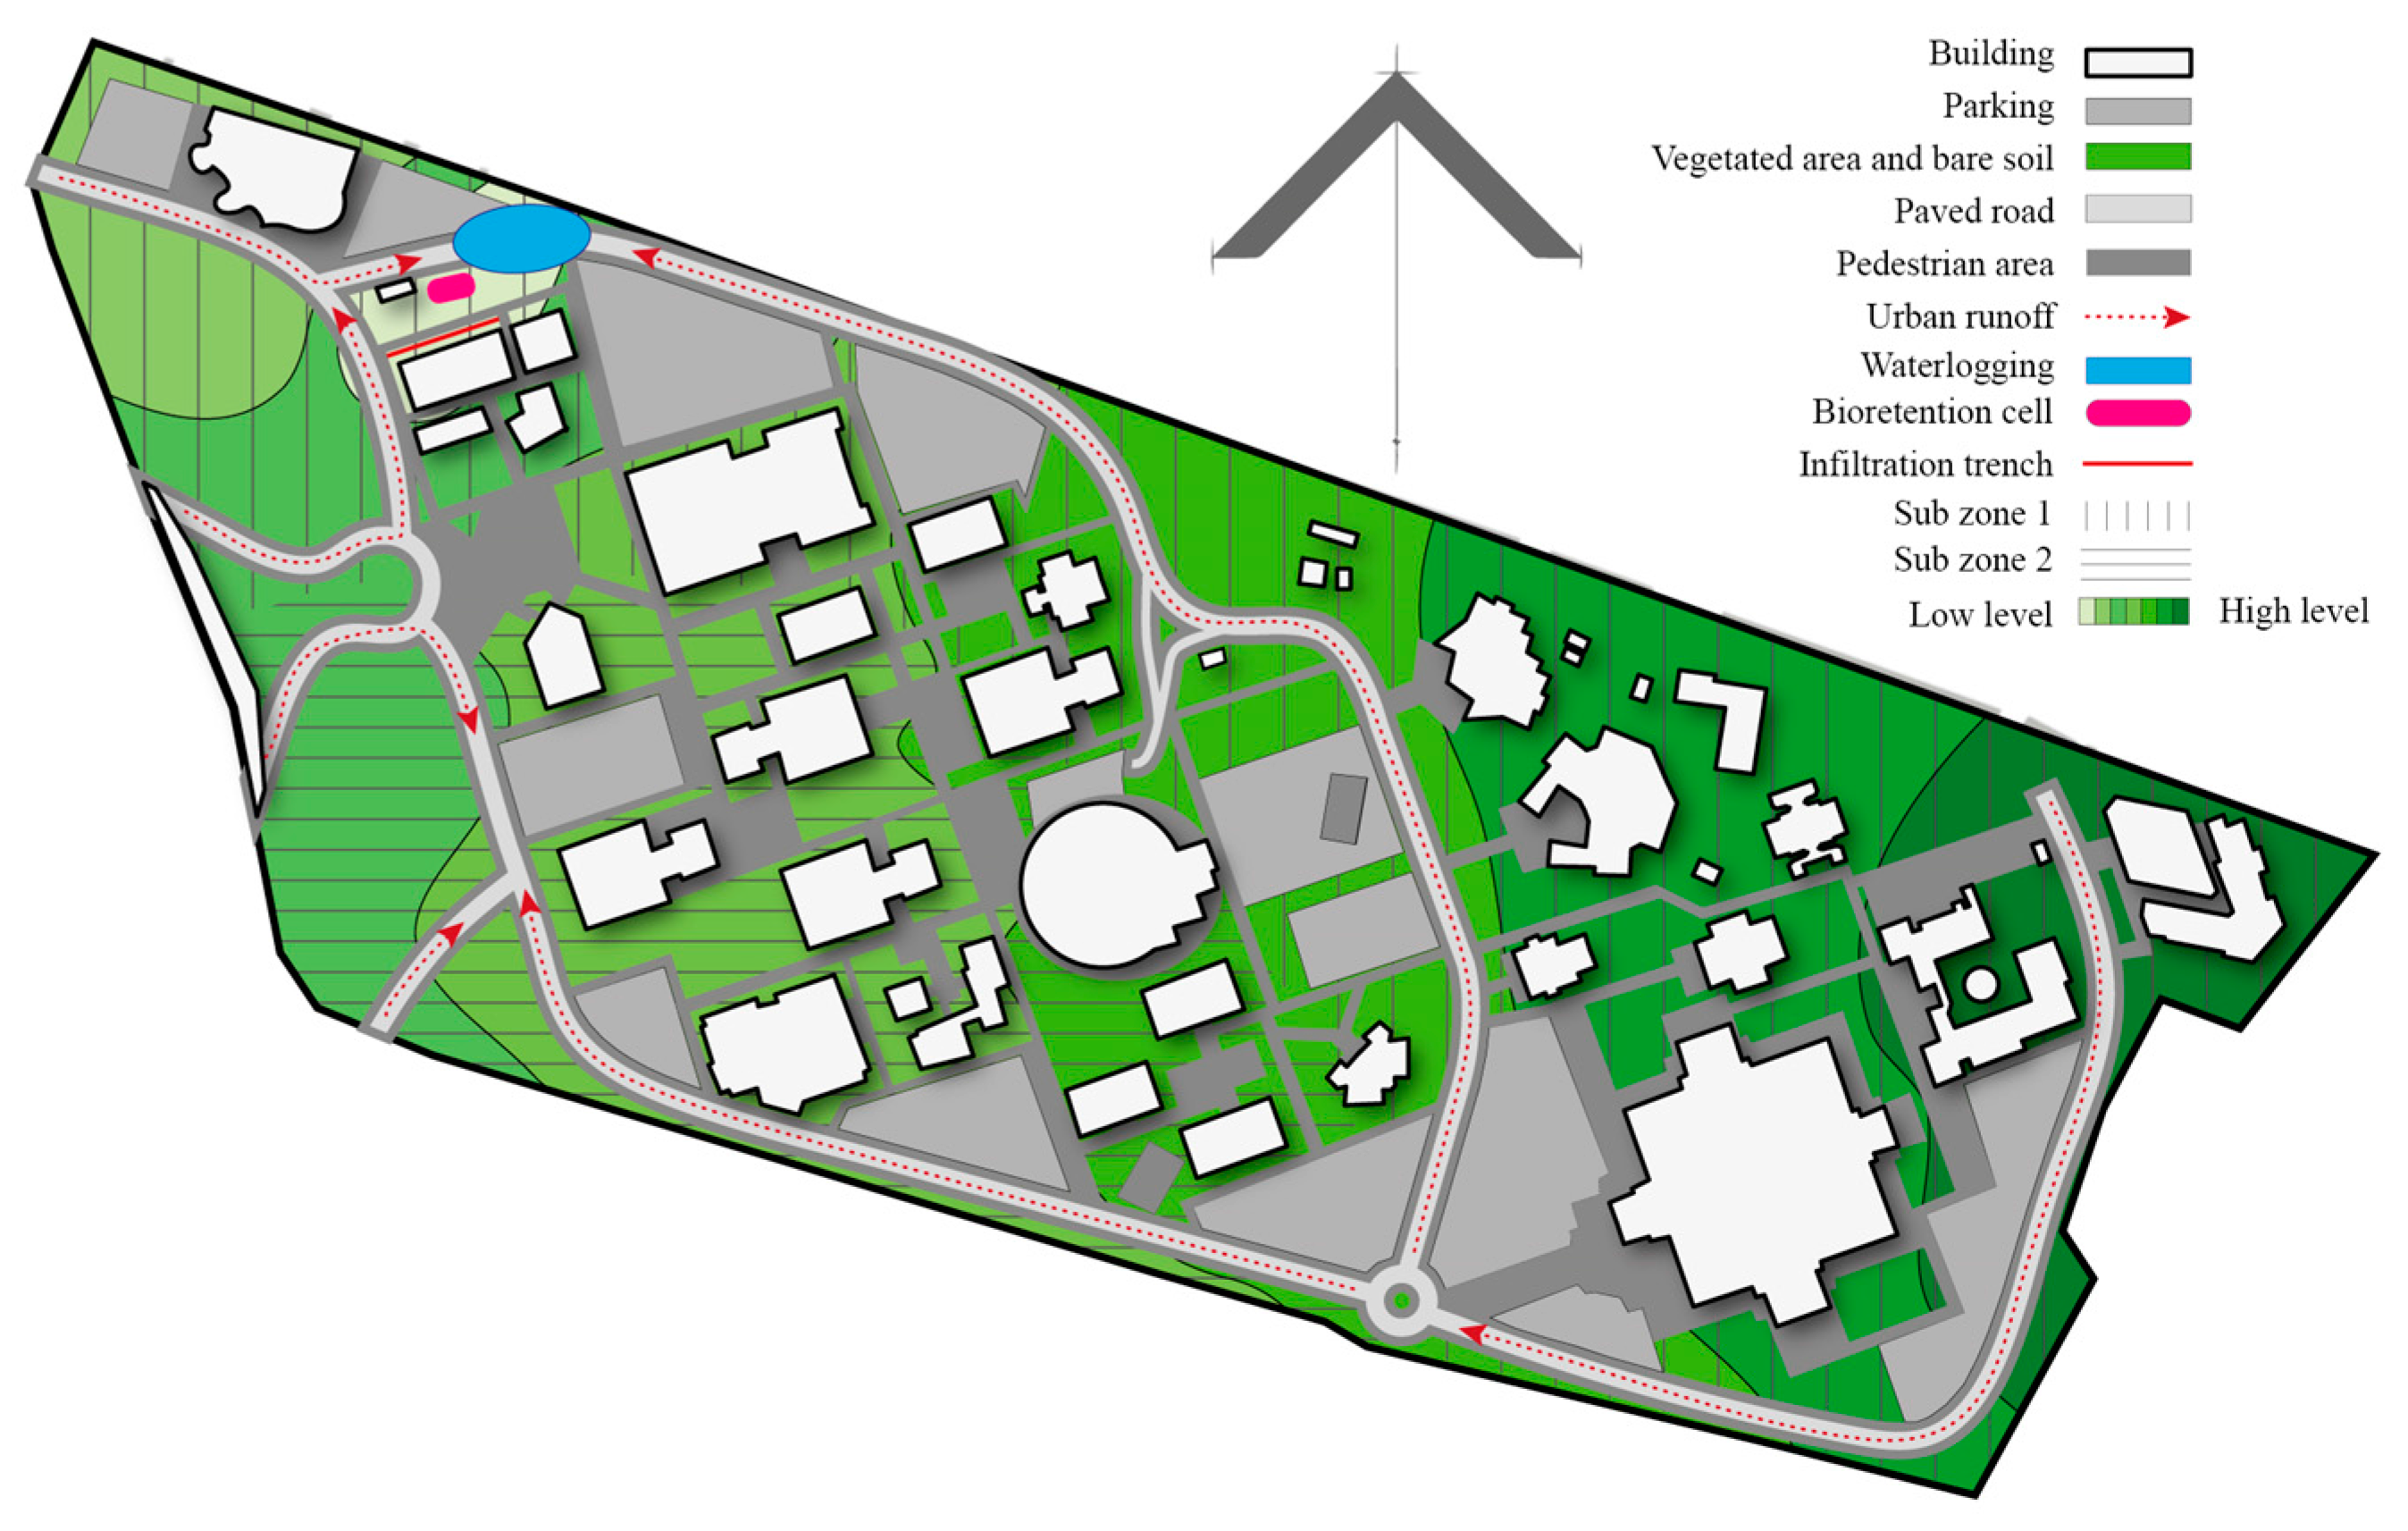
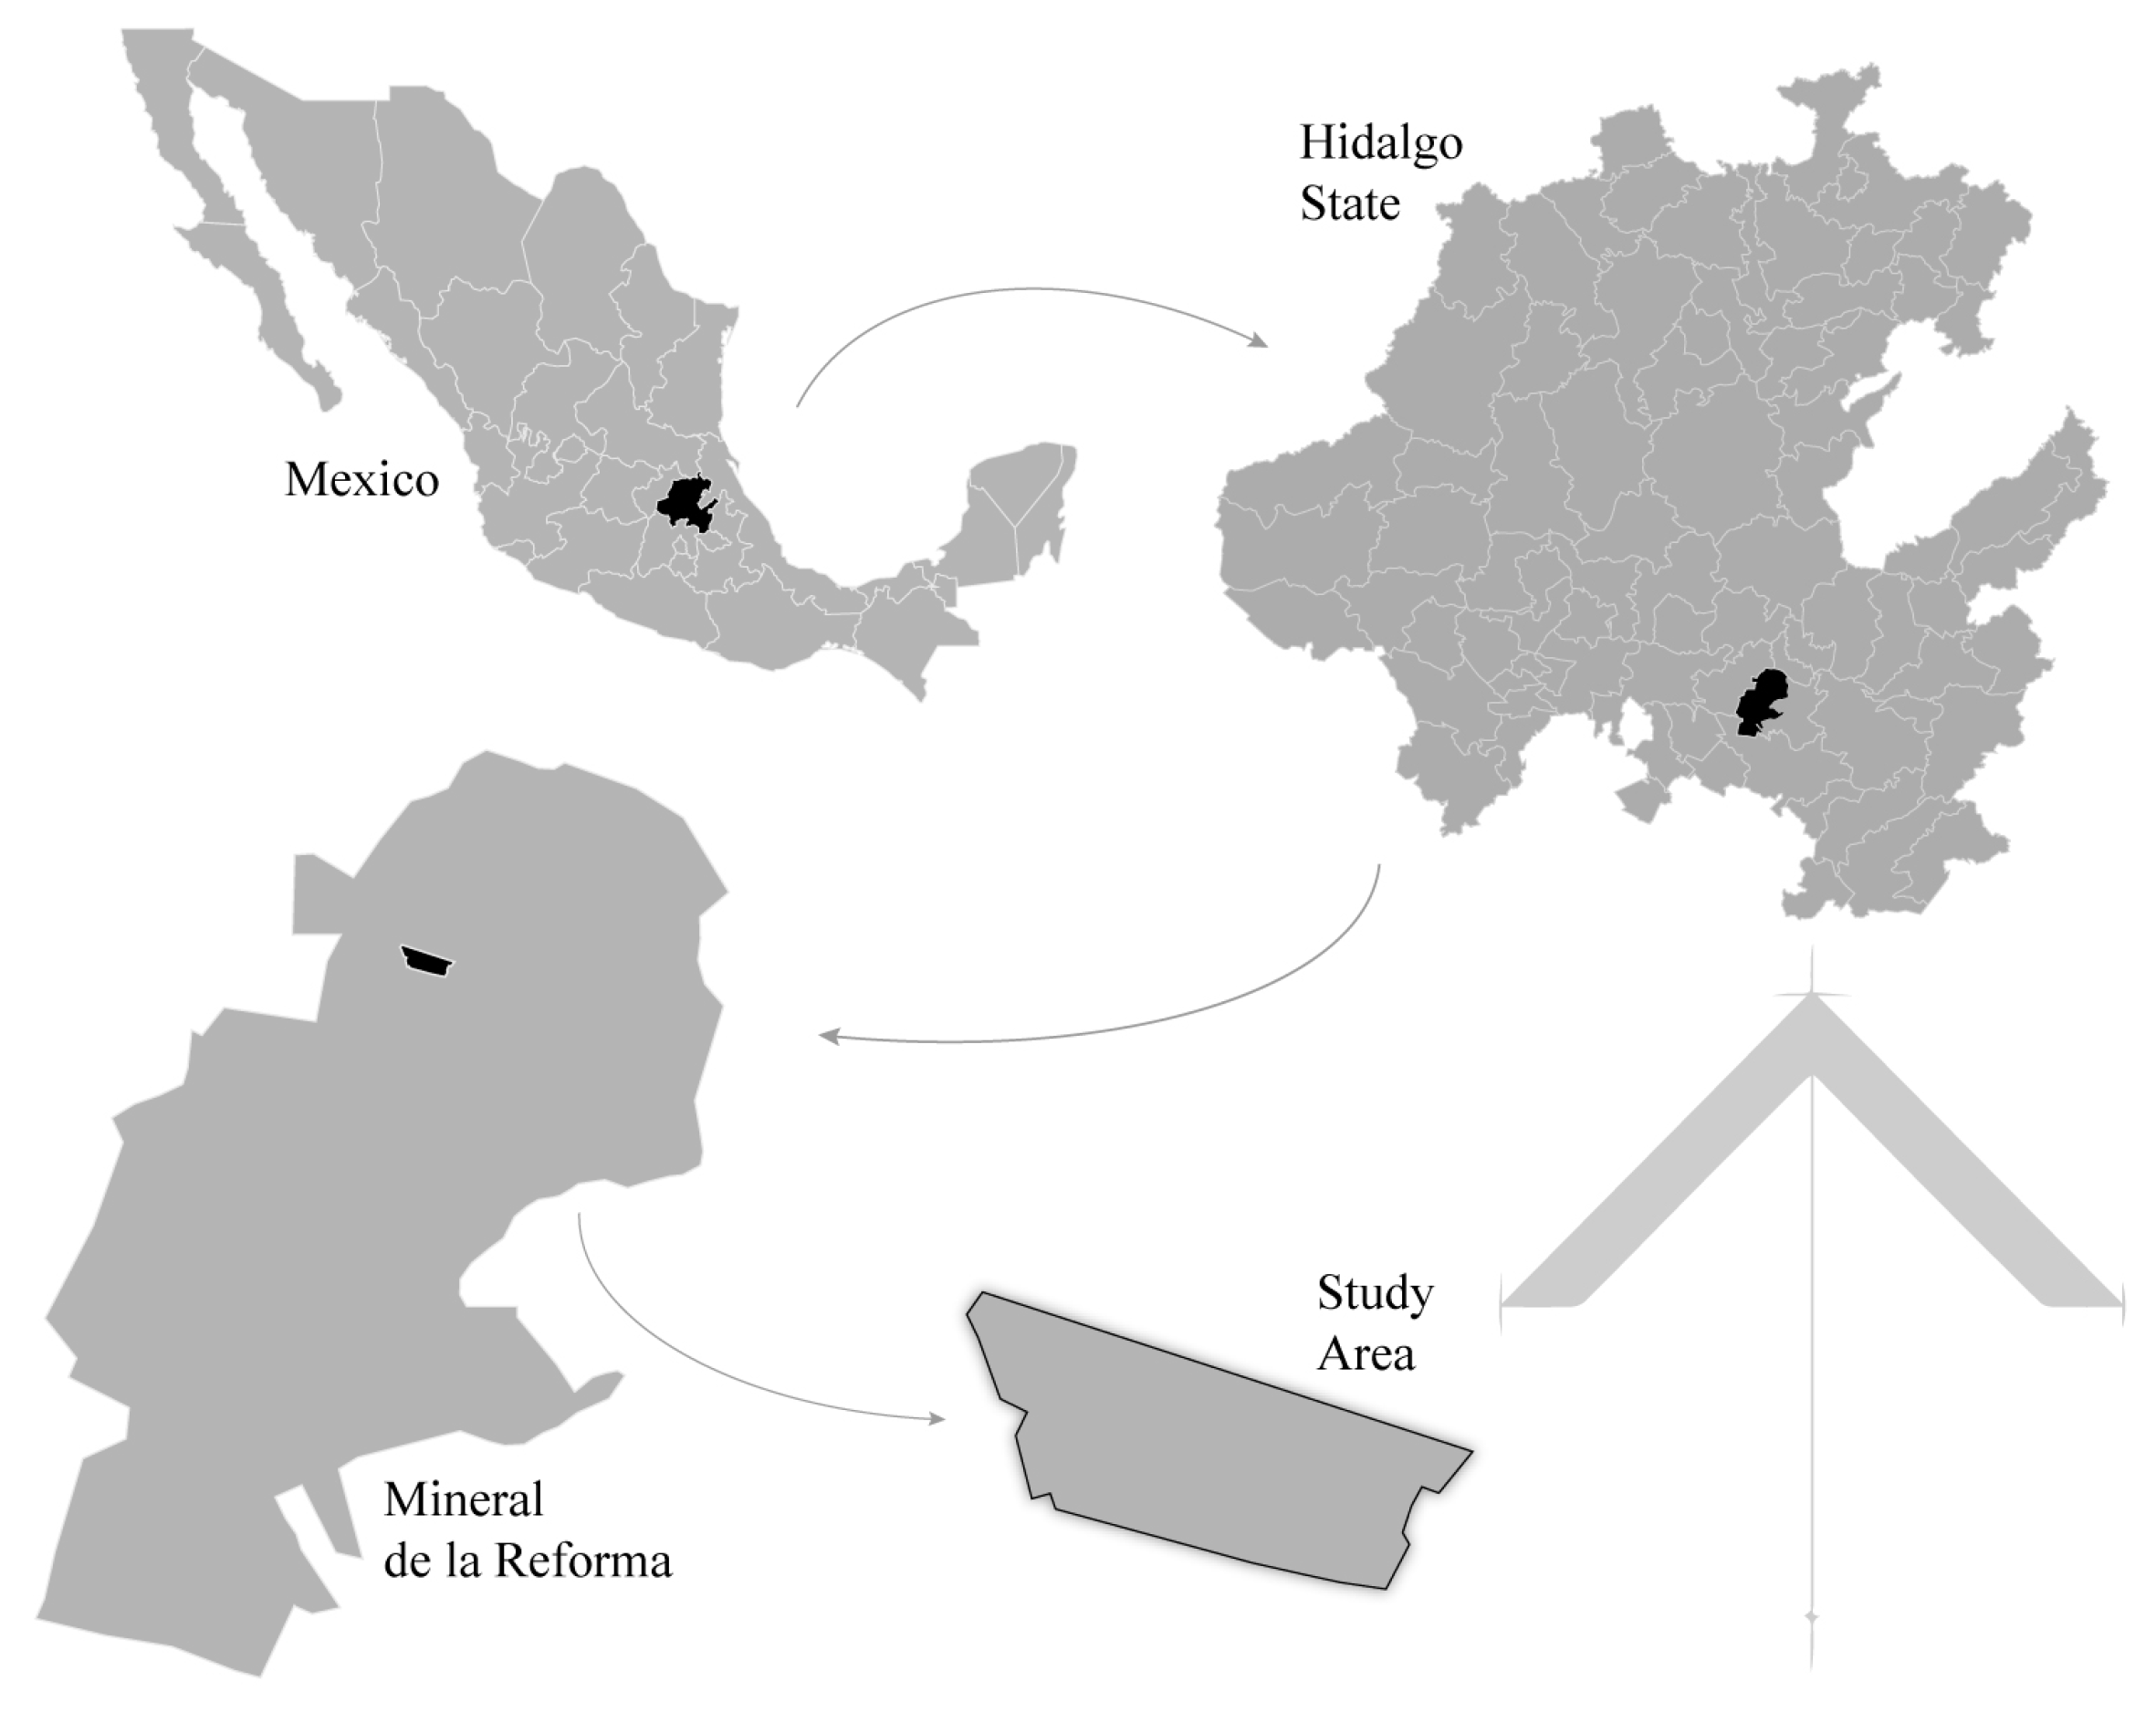
2.1. Zone Location and Climate

The study area comprises the Hidalgo State University campus, which is located between the coordinates 20°05′47′′ north latitude and 98°42′37′′ west longitude, at 2426 masl (Figure 1). The campus belongs to the municipality of Mineral de la Reforma, in the south-central region of the State of Hidalgo, Mexico, approximately 80 km to the north of the Mexico City metropolitan area.
The meteorological station adopted here is located 5 km from the study area and operated by the Meteorological National Service. The climatological data include temperature (T), rainfall (R), and evaporation (Ev). On an annual mean basis, the air temperature is 14.6 °C, rainfall is 376.96 mm, and evaporation is 863.6 mm. The rainy season occurs mainly from May to September [17].
For this study, monthly rainfall, temperature, and evaporation from the 1980–2013 historical period were considered. From a previous rainfall variability analysis, 1982 and 2010 were identified as the driest and the rainiest years (181.1 mm/year and 585.6 mm/year, respectively) and selected for this hydrological design [18].

2.2. Description of General Characteristics of the Studied Area

First, slope changes and main runoff directions were identified in the study area. It was noticed that the runoff splits into two main directions and, consequently, the area was partitioned into two sub-zones (S1 and S2). Among them, the main sub-zone (S1) that covers the major runoff length and water volume accumulation was chosen to situate the bioretention cell (Figure 2).
The main characteristics of the selected sub-zone (S1) are described in Table 1. These characteristics were employed to calculate parameters necessary to the hydrological design of the bioretention cell.

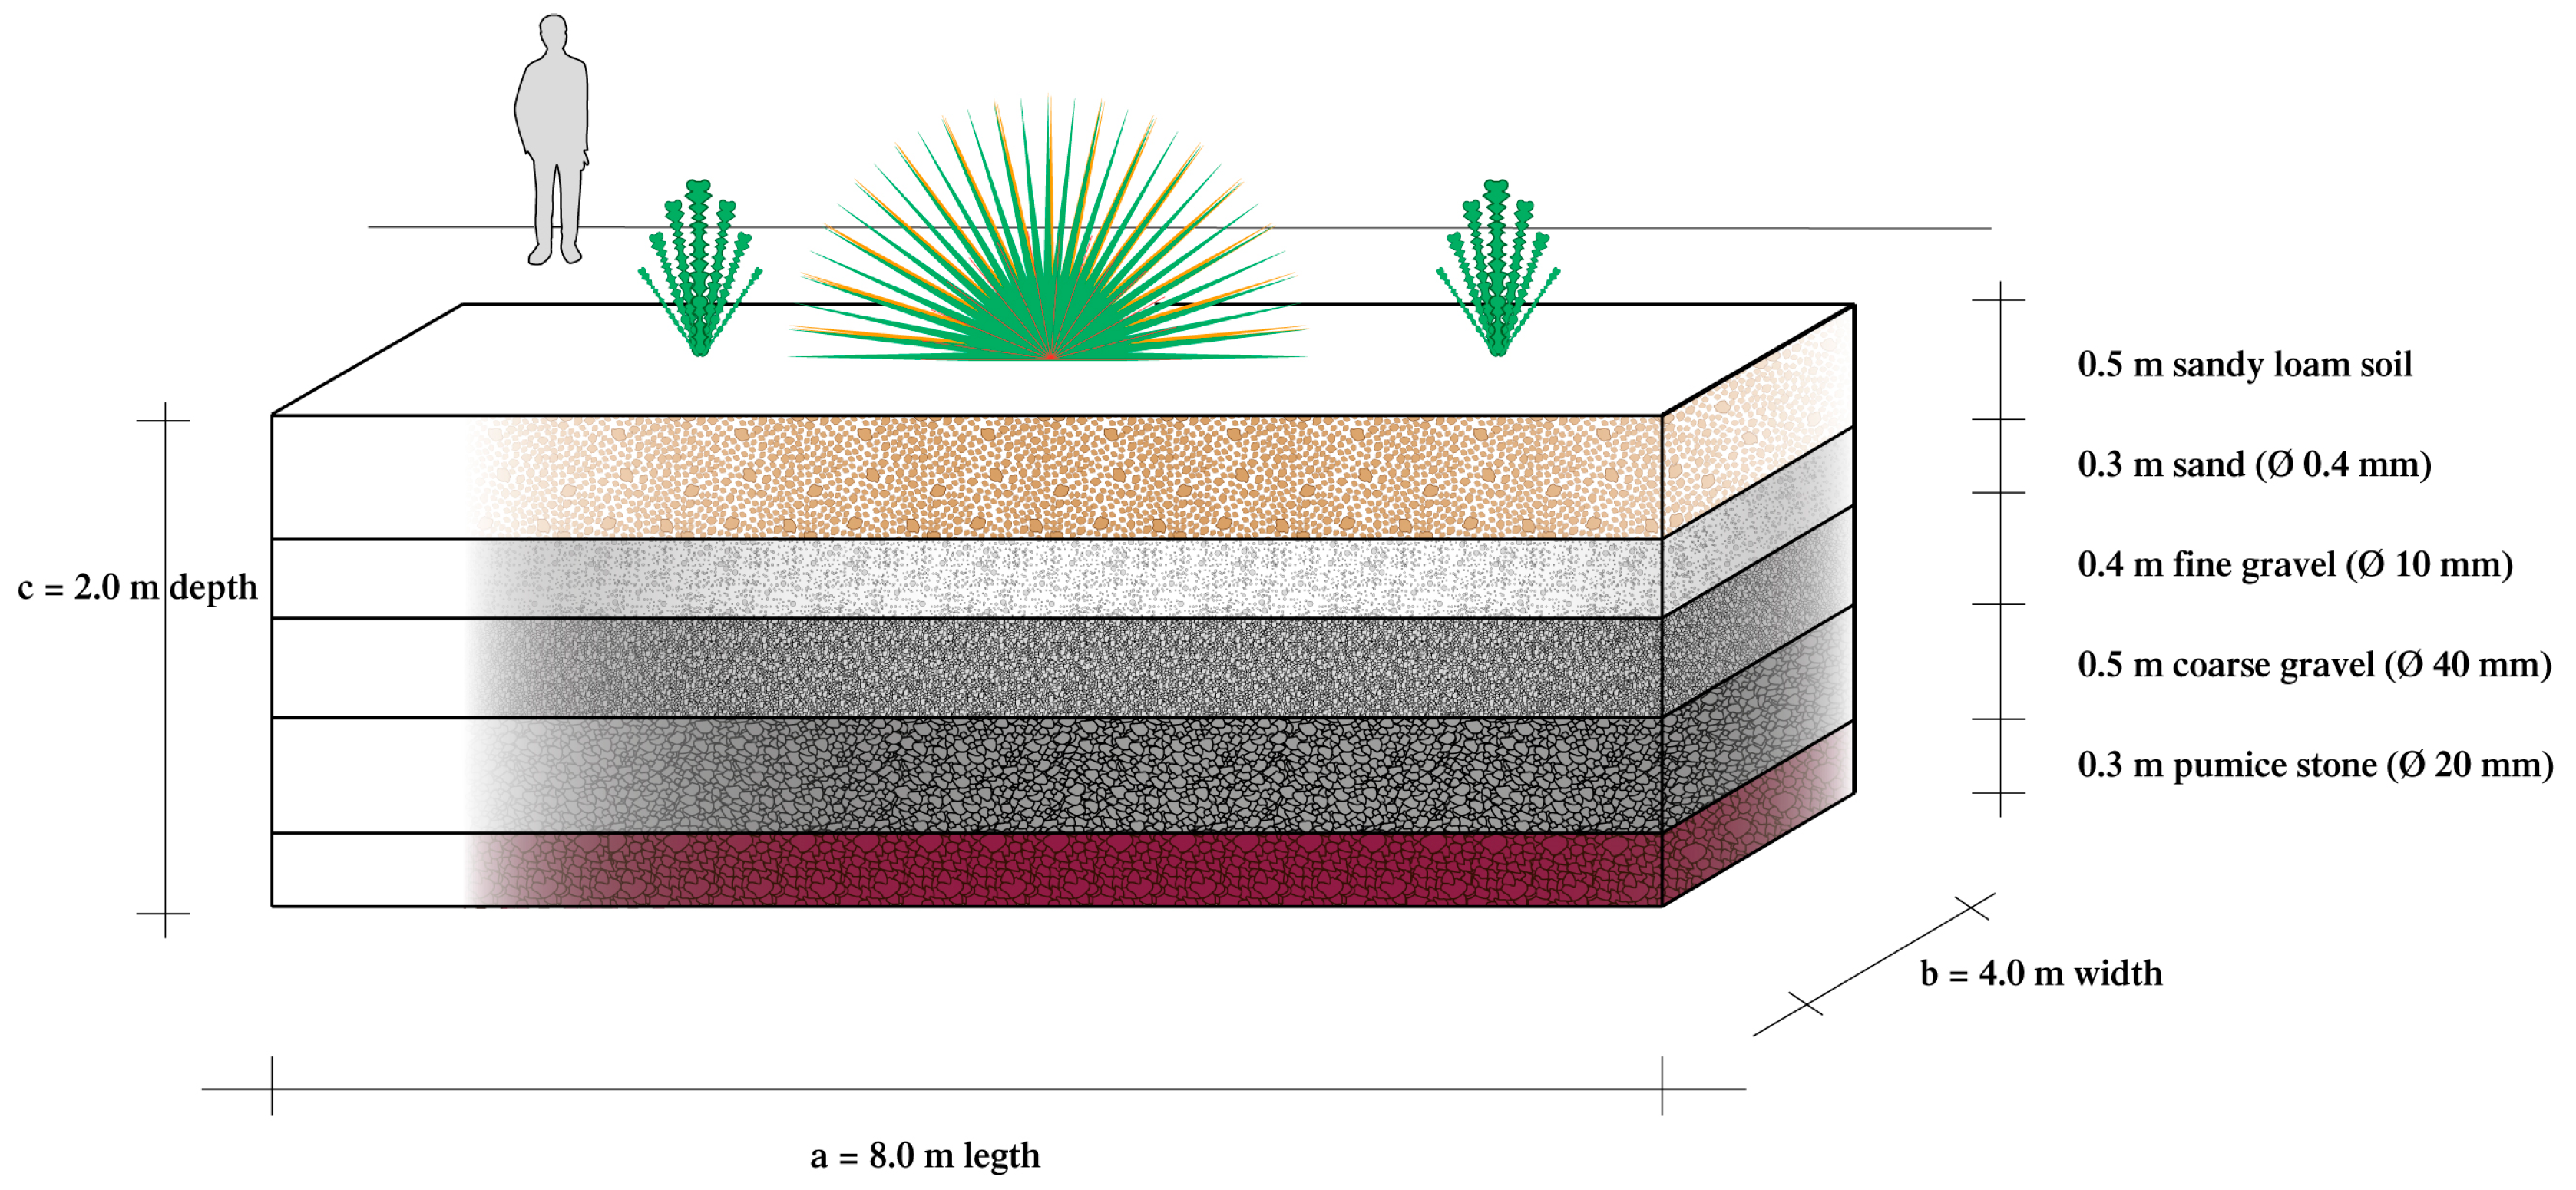
2.3. Bioretention Cell Characteristics

In a previous study [19], the authors designed a laboratory-scale bioretention cell. The authors measured its ability to remove contaminants of runoff generated from the university campus [19]. The same design was used to propose the dimensions of the real-scale site suggested in this work. This site receives the greatest accumulation of runoff during the rainy seasons. For this, a pervious surface available in S1 was considered, where the proposed dimensions and material distribution for the bioretention cell are as follows (Figure 3).
The infiltration was tested employing a single-ring infiltrometer in a sandy-loam soil sample. It has been suggested this method is reliable when time available for the test is limited and flow rates can be monitored at short time intervals [20]. Also, herbaceous grasses and succulent plants (such as Opuntia spp. and Agave spp.) were proposed due to their tolerance to semi-arid climates [12,15].

2.4. Estimation of Hydrologic Variables (Tc, i, Qmax, Qa)

The Kirpich equation [3] was employed to calculate the concentration time (Tc), which is the time required for runoff to flow from its inception (L0 = 0 m), to the outlet of the sub-zone, S1 (L = 3039.55 m). For this, the Equation (1) was used.
T c = 0.0663 [ L S ] 0.77
where:
  • Tc = Concentration time (h).
  • L = Maximum length of the runoff path (m).
  • S = Slope (no units).
Rainfall intensity (i, mm/h) was calculated from Tc and Equation (2), where R is the rainfall amount selected for the rainiest month (July) of the rainiest year, 2010 (250 mm).
i = R T c
The maximum peak runoff (Qmax, m3/s, Equation (3)) was quantified on the impervious surface (asphalt) from the calculated rainfall intensity (i, m/s) (Equation (2)) using the Rational Method [21].
Q max = R c × i × A
where:
  • Rc = Runoff coefficient (no units), 0.8 for asphalt.
  • i = Rainfall intensity (m/s).
  • A = Drainage surface of the sub-zone S1 (m2).
The inlet runoff (Qa, m3/s) to the bioretention cell was estimated (Equation (4)) considering the total length of the channel (L, m), a unitary width (m), and the maximum rainfall for the driest and the rainiest years (R in m/s, corresponding to years 1982 and 2010, respectively).
Q a = R × L × 1

2.5. Potential Evapotranspiration (PEm) and Consumptive Use of the Vegetal Cover (U)

To calculate the monthly potential evapotranspiration (PEm) of the selected plants, the Thornwaite formula was used [22]. This formula is based mainly on mean temperature, with an adjustment being made for the number of daylight hours (Equation (5)). The potential evapotranspiration was calculated on a monthly basis for both years (1982 and 2010).
P E m = 16 N m ( 10 T m ¯ I ) a
where:
  • PEm = Potential evapotranspiration (mm/month).
  • m = Month (i.e., 1, 2, 3...12).
  • Nm = Monthly adjustment factor related to hours of daylight (no units).
  • Tm = Monthly mean temperature (°C).
  • a = Constant (Equation (6)).
  • I = Heat efficiency index for m = 1…12 (Equation (7)).
a = 6.7 × 10 7 I 3 7.7 × 10 5 I 2 + 1.8 × 10 2 I + 0.49
I = m i = ( T m ¯ 5 ) 1.5
Water consumptive use (U) over the plant-growing season was estimated through the Blaney-Criddle equation [23] (Equation (8)).
U = K j × F
where:
  • U = Consumptive use of water by the plant (mm/month).
  • Kj = Garden coefficient (no units, Equation (9)).
  • F = Growing season consumptive use factor per month (Equation (10)).
The array of species proposed herein for the bioretention cell comprises succulents and grass, such as Festuca ovina glauca. The characteristic way these plants use water makes it necessary to consider factors such as planting density and hydrozones that may affect evapotranspiration [24]. To this end, the garden coefficient (Kj) was calculated by considering the species of plants, the density of vegetation, and the microclimate [24,25] (Equation (9)).
K j = K e × K d × K m
where:
  • Ke = Constant depending on the species planted (for grasses as Festuca ovina glauca it is 0.4; for succulents is 0.2. The value used for calculations was 0.4).
  • Kd = Constant depending on the plant density (0.6 for a mixed planting of low-to-mean density).
  • Km = Constant depending on the mean microclimatic conditions (if the buildings contiguous to the planting do not influence the planting microclimate, the value is 1).
Equation (8) also incorporates a climatic parameter called the consumptive use factor, F. This coefficient depends on the type of plant (crop or garden plant) and the zone localization [24]. The growing season consumptive use factor, F, was calculated as the sum of monthly and part-month consumptive use factors (Equation (10)):
F = i n f i
where:
  • fi = Monthly consumptive factor (mm, Equation (11)).
    f i = ( T × p ) / 100
where:
  • T = Monthly mean temperature (°C).
  • p = Monthly daylight percentage with respect to the annual value.

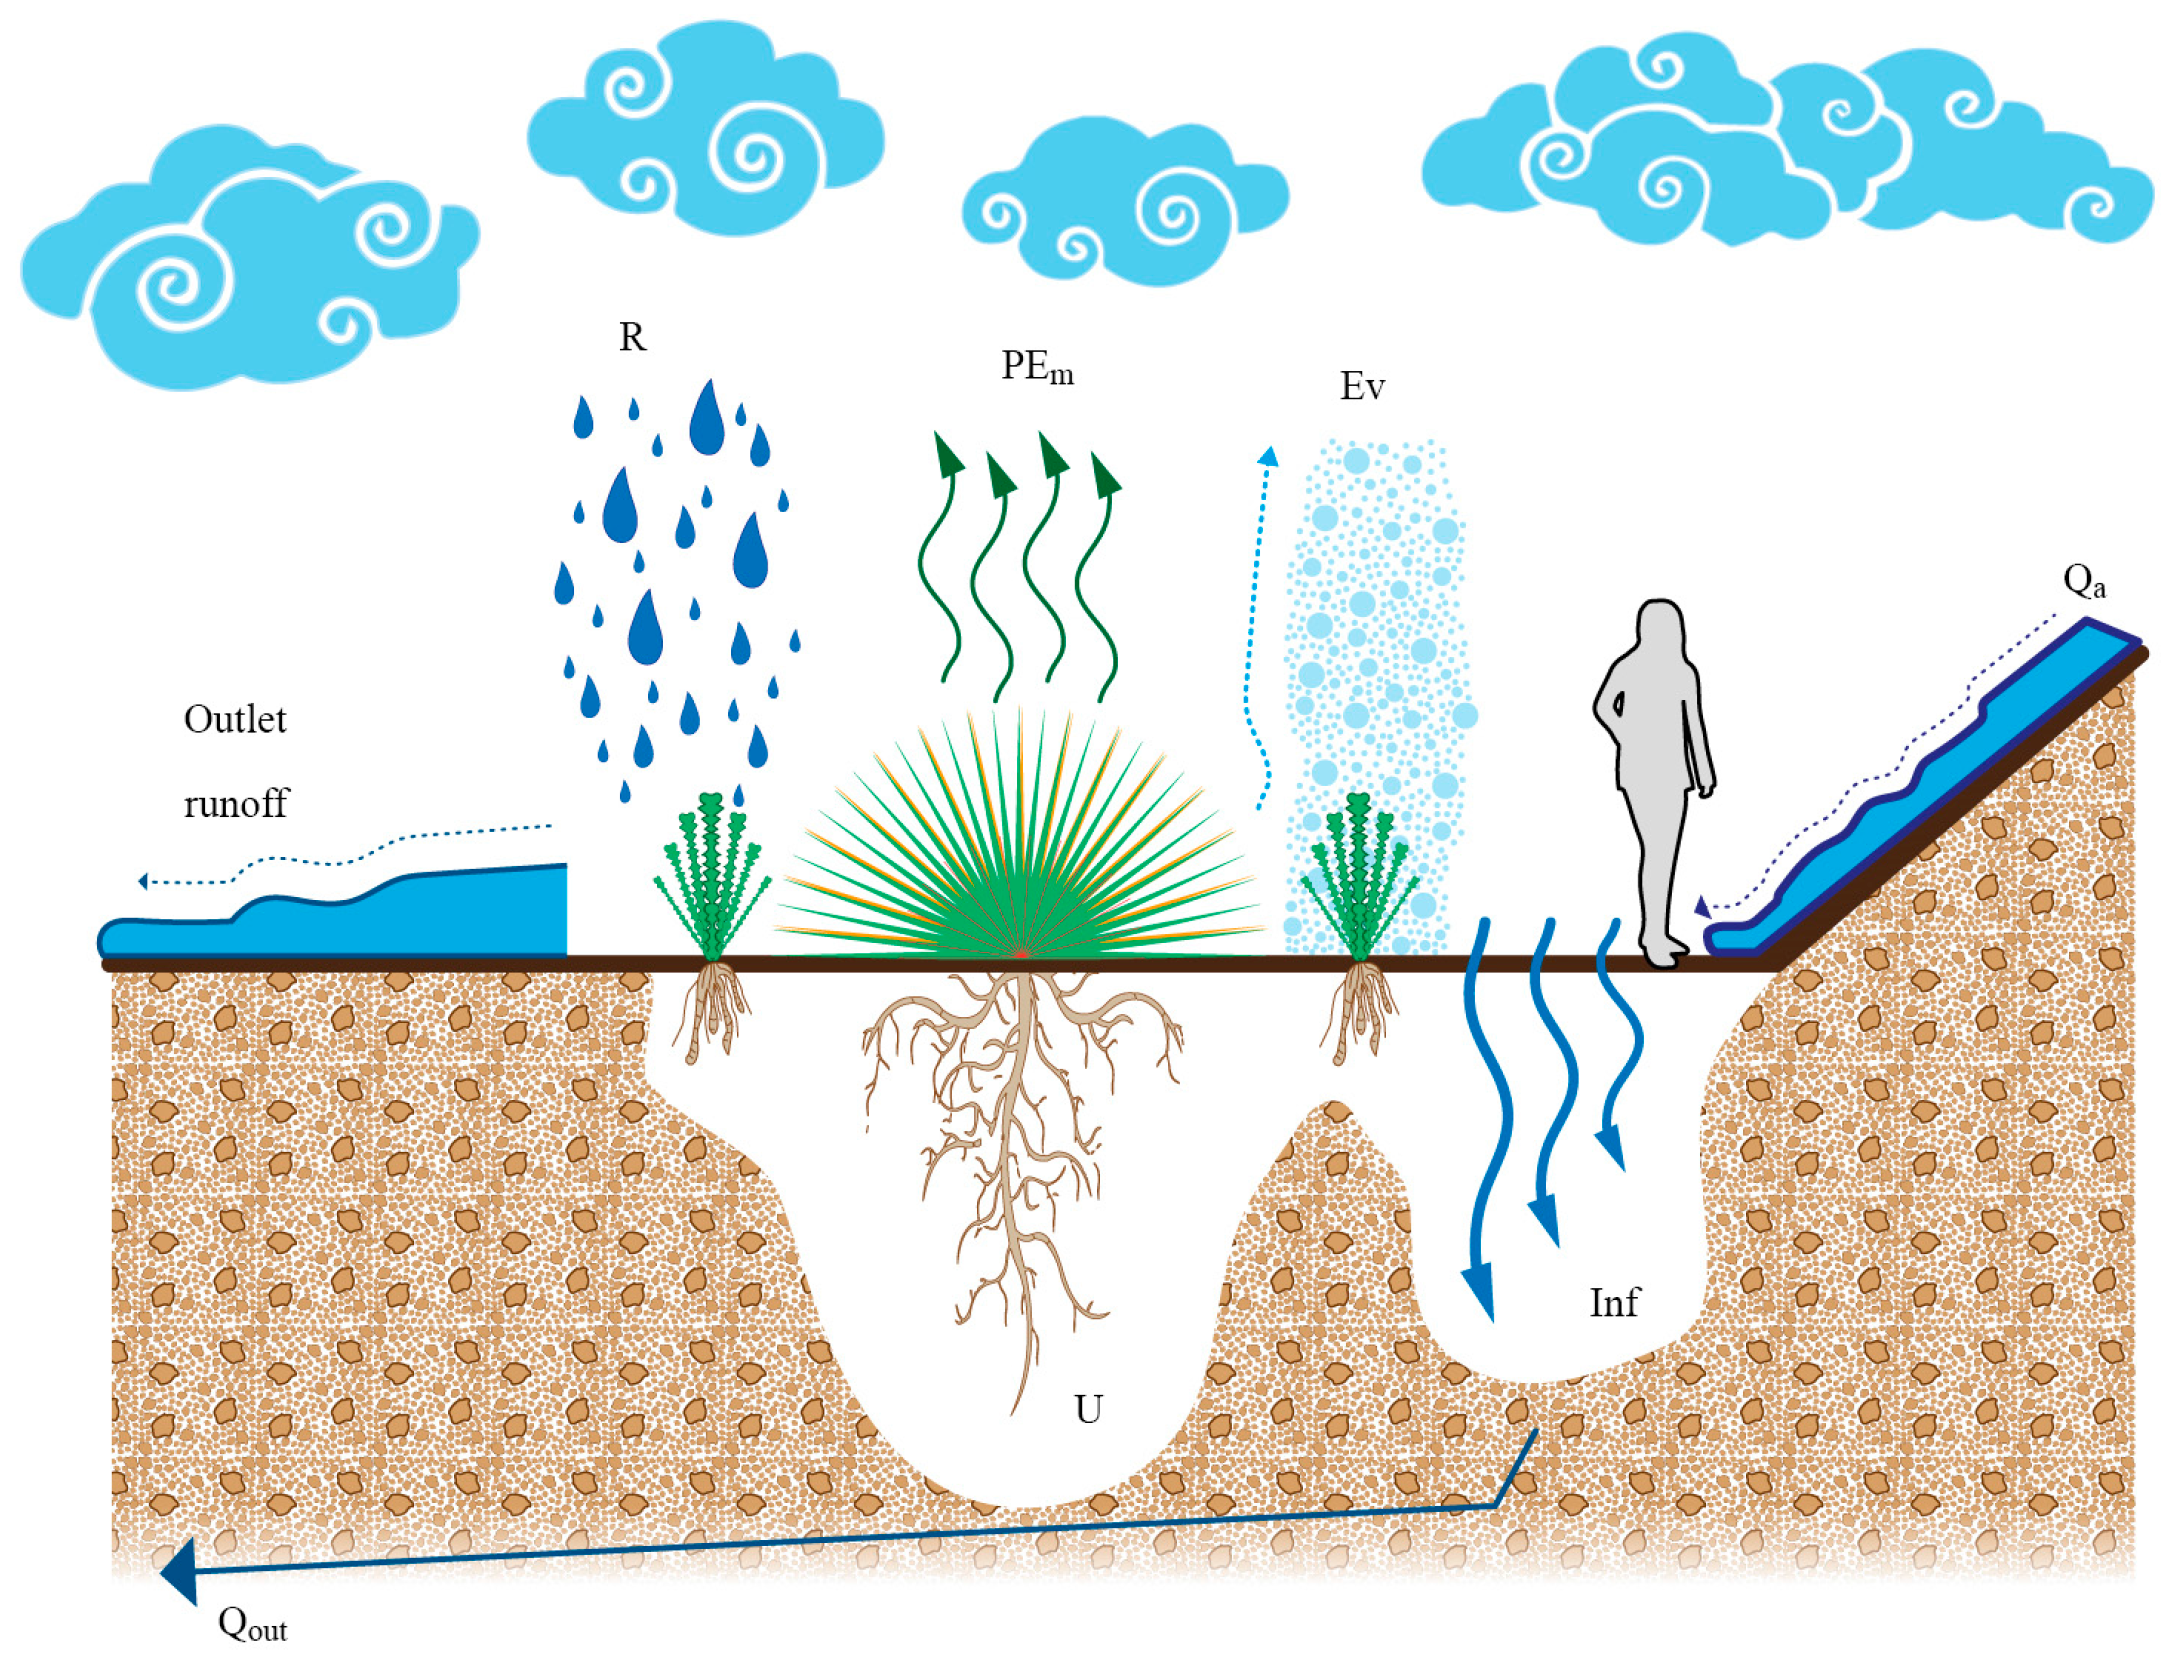
2.6. Outlet Runoff of the Bioretention Cell (Qout)

The outlet runoff exceeding the absorption capacity of the system (Qout, m3/s) was calculated from Equation (12):
Q o u t = ( R + Q a ) ( E v + P E m + U + I n f )
where:
  • R = Rainfall.
  • Qa = Inlet runoff.
  • Ev = Evaporation.
  • PEm = Potential evapotranspiration.
  • U = Consumptive use.
  • Inf = Infiltration.

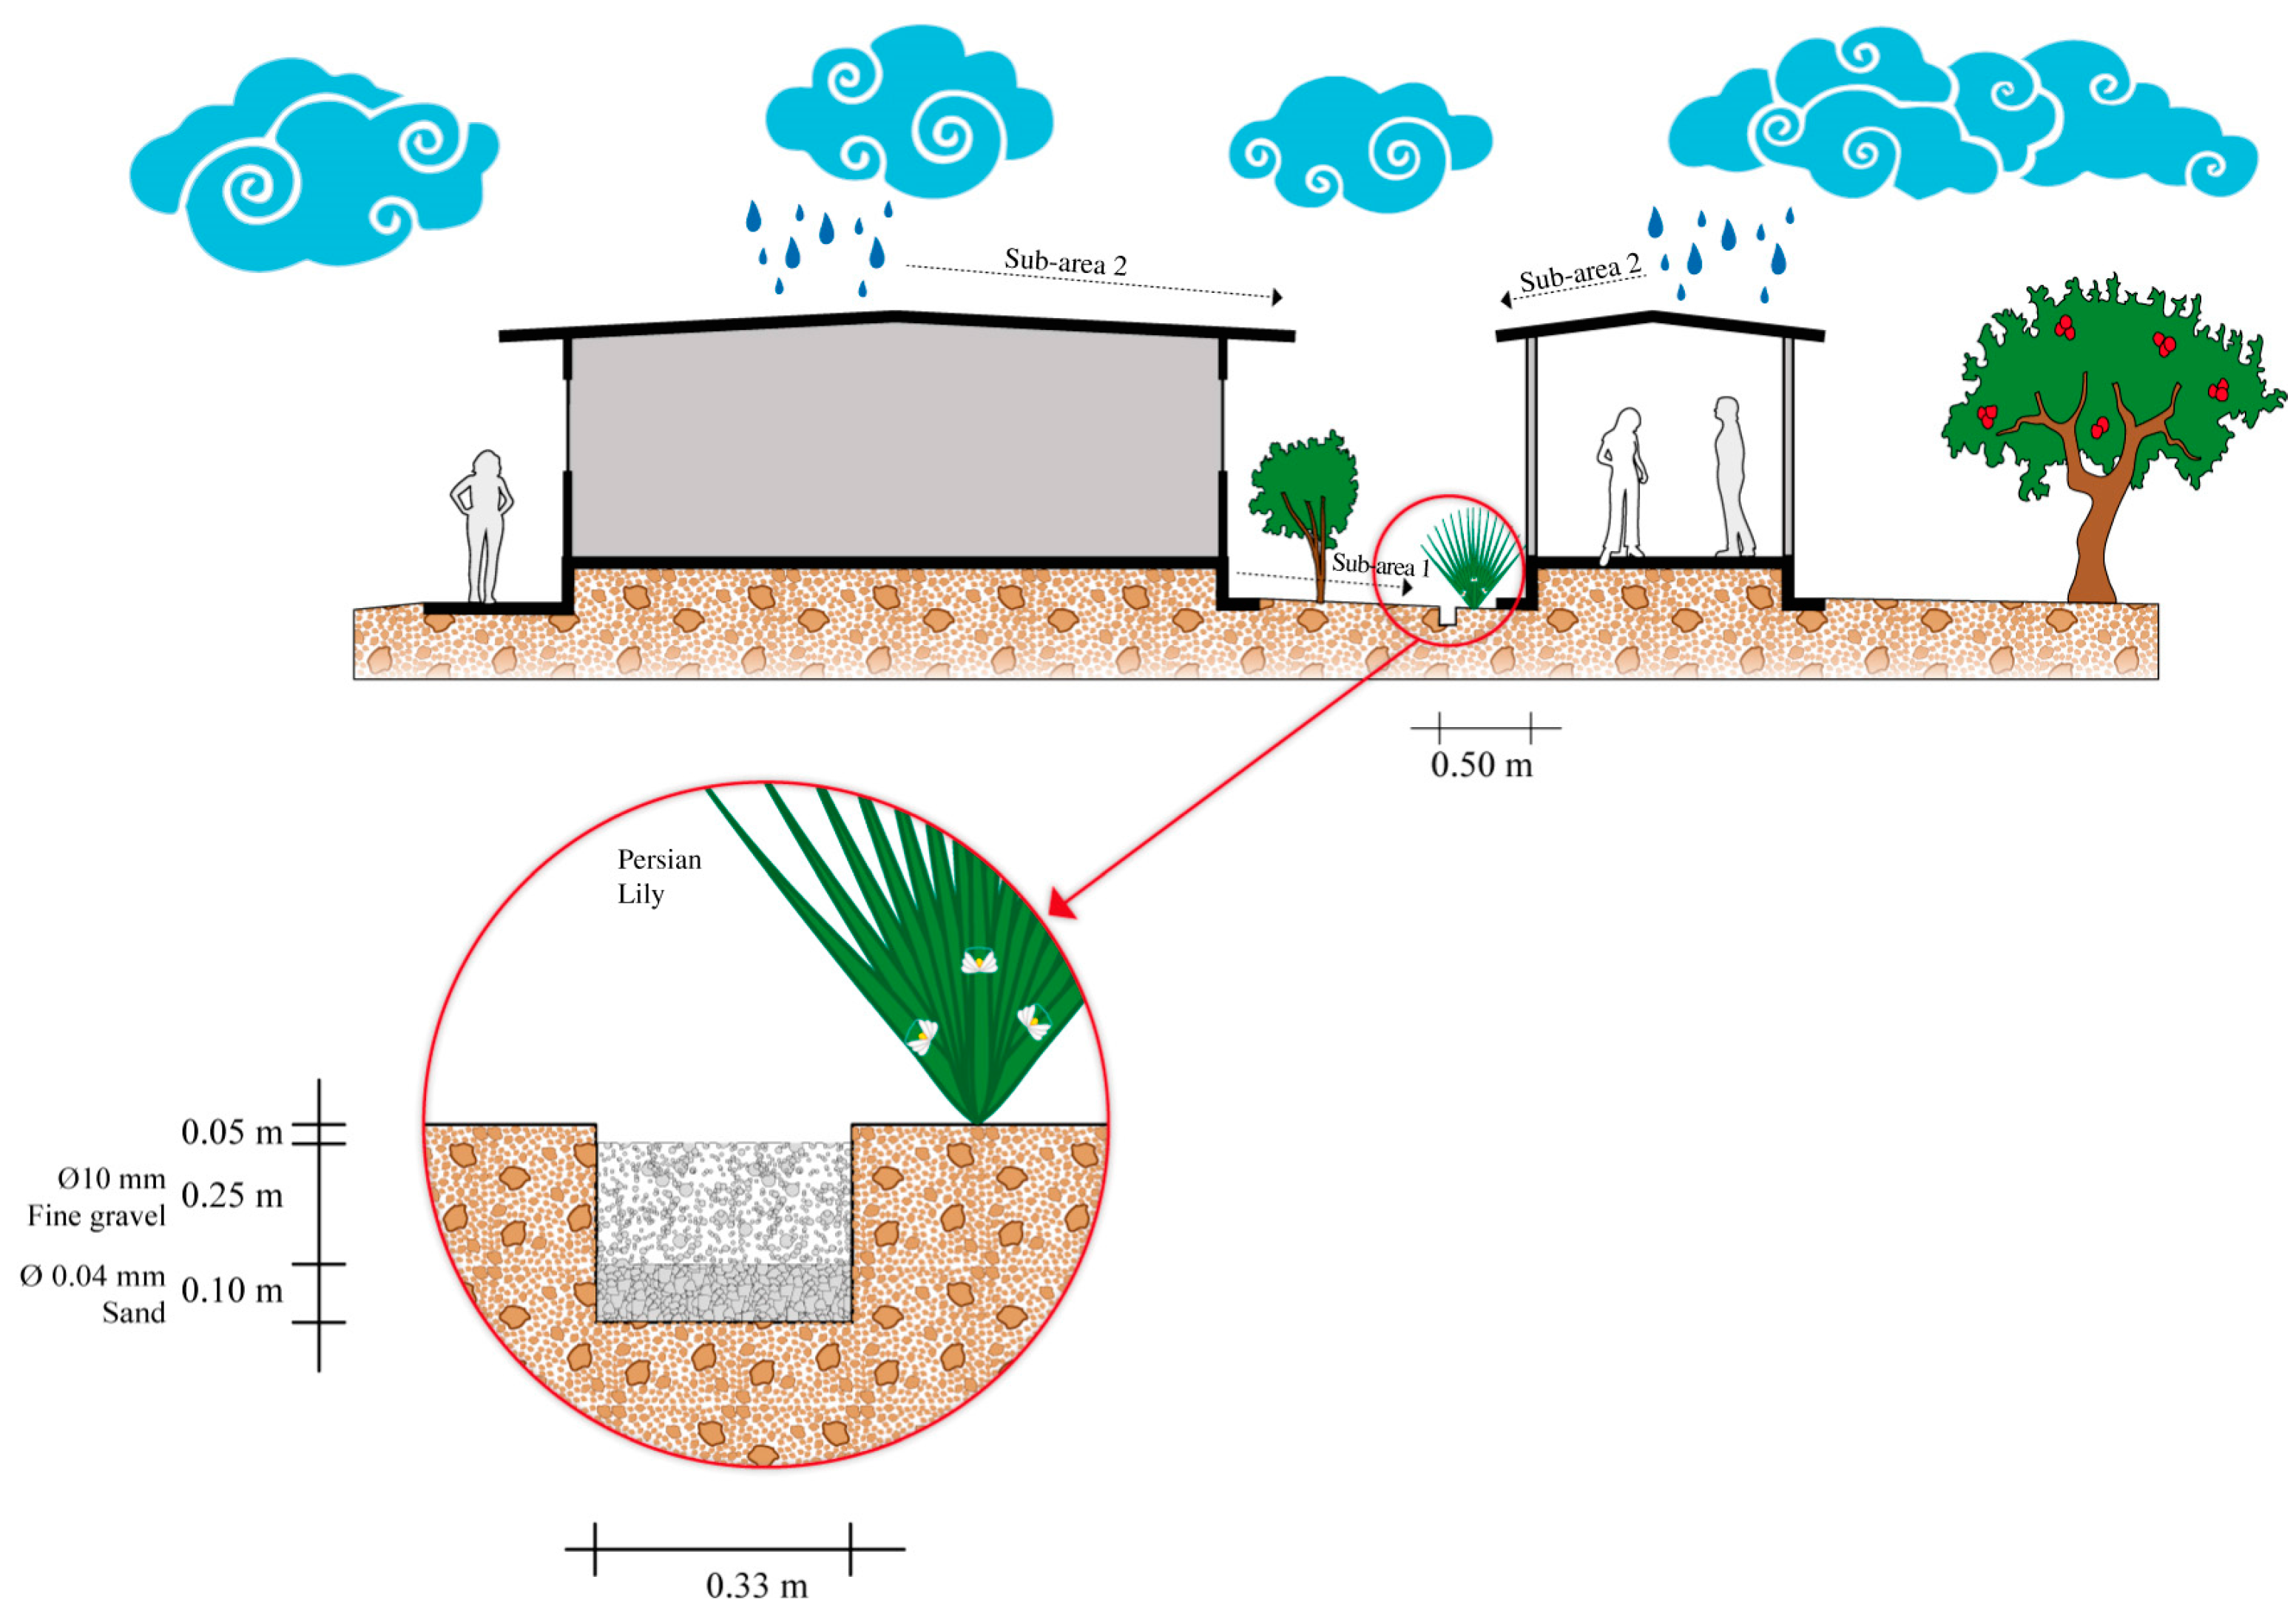
2.7. Design of the Infiltration Trench

The infiltration trench was planned to collect the runoff from a small area upstream to the bioretention cell (Figure 4). In this way, the volume of stormwater received by the bioretention cell would be reduced, and the current problem of flooding of the pedestrian walkway downstream the trench mitigated.
For its practicality, a rectangular design was chosen for the infiltration trench (Figure 4). To determine its dimensions, we proceeded similarly, as with the bioretention cell: Tc was calculated by applying Equation (1), with L = 6.3 m and S = 0.032. Next, the intensity of the design storm was determined using Equation (2), where R was the same that for the bioretention cell (0.25 m), which corresponds to the maximum rainfall in the rainiest month (July) of the rainiest year (2010). After, a maximum runoff flow (Qmax) was calculated using Equation (3). Because of its characteristics, the runoff area for the trench was divided for calculations of Qmax as follows: the sub-area 1 was a small garden with very scarce vegetation (397 m2, with Rc = 0.1) and sub-area 2, corresponding to the roofs of a building and a pedestrian walkway (1011 m2, with Rc = 0.95). Finally, the Qmax obtained from two subareas was summed. Knowing the total Qmax, the cross-sectional area of the trench (A, m2) was calculated clearing it from Equation (13); the velocity value (v) used was taken from [26].
Q max = A t × v
where:
  • Qmax = Maximum runoff flow (m3/s).
  • At = Cross-sectional area (m2).
  • v = Maximum permissible velocity in channels without vegetation (0.45 m/s for easily erodible soils).
The water flow depth (d) of the trench was established as 0.35 m, due to the presence of roots of a tree fence located downstream. In this way, the width (b) was calculated by clearing it from Equation (14).
A t = b × d
where:
  • b = width of the trench (m).
  • d = water flow depth (m).
The wetted perimeter (Wp) and hydraulic radius (r) were calculated applying Equations (15) and (16).
W p = b + 2 d
r = b × d b + 2 d = A W p
where:
  • Wp = wetted perimeter (m).
  • r = hydraulic radius (m).
According to the previous calculations, the dimensions for the infiltration trench were:
  • A = 0.114 m2
  • b = 0.33 m
  • d = 0.35 m
  • Wp = 1.026 m
  • r = 0.072 m
With the above dimensions, the infiltration trench will be dug along the pedestrian passageway (63 m), at 0.5 m from this, to avoid damaging the fence of trees. At the bottom of the trench a 0.1 m layer of sand will be placed (size 0.4 mm), and above this, a 0.25 m layer of fine gravel (10 mm). Between the trees, Persian lilies will be planted so as to reduce the loss of soil. The infiltration rates of the trench and the subjacent soil will be measured following the procedure outlined by [27].

2.8. Statistical Analysis

All the variables were treated previously according to [28]. The normal distribution of data was verified by the Kolmogorov-Smirnov and Shapiro-Wilk tests. A descriptive statistical analysis (mean, standard deviation, maximum and minimum values) was performed separately for the hydrological variables registered in 1982 and 2010 in the municipality of Mineral de la Reforma. The hydrological variables considered were temperature (T), rainfall (R), infiltration (Inf), inlet runoff (Qa), consumptive use (U), potential evapotranspiration (PEm), evaporation (Ev), and the output runoff of the bioretention cell (Qout). Also, the hydrological variables of both years were analyzed with a t-student test (two paired simple test, n = 12, p < 0.05) to evaluate the mean difference between both years. Finally, we carried out a Pearson correlation test to determine the relationship between the temporary hydrological distribution of the 1982 and 2010 years. Statistical analyses were made by using procedures available in the SPSS v. 21 (SPSS Inc., Chicago, IL, USA) statistical package.

3. Results and Discussion

Most of the studies on the low-impact development techniques emphasize the importance that these systems are built taking into account the type of granular material used, the analysis of hydrological variables and the continuous measurement of the infiltration, and the runoff volume and its adequate sizing [3,21,29,30]. In some research, authors rely on statistical analyses of hydrological variables (Qa, Tc, Inf) to predict the volume of water that can be absorbed by these type of systems [31]. Others claim that bioretention cells—when are properly designed—can reduce urban runoff volumes by up to 80% [3]. On the other hand, other studies are focused on predicting their efficiency through the use of mathematical models [32]. However, it is uncommon to measure the efficiency of LID techniques in the function of the water requirements of the plants used and their analysis through a water balance. This study presents the following results for two scenarios: (1) the driest year, 1982; and (2) the rainiest year, 2010.

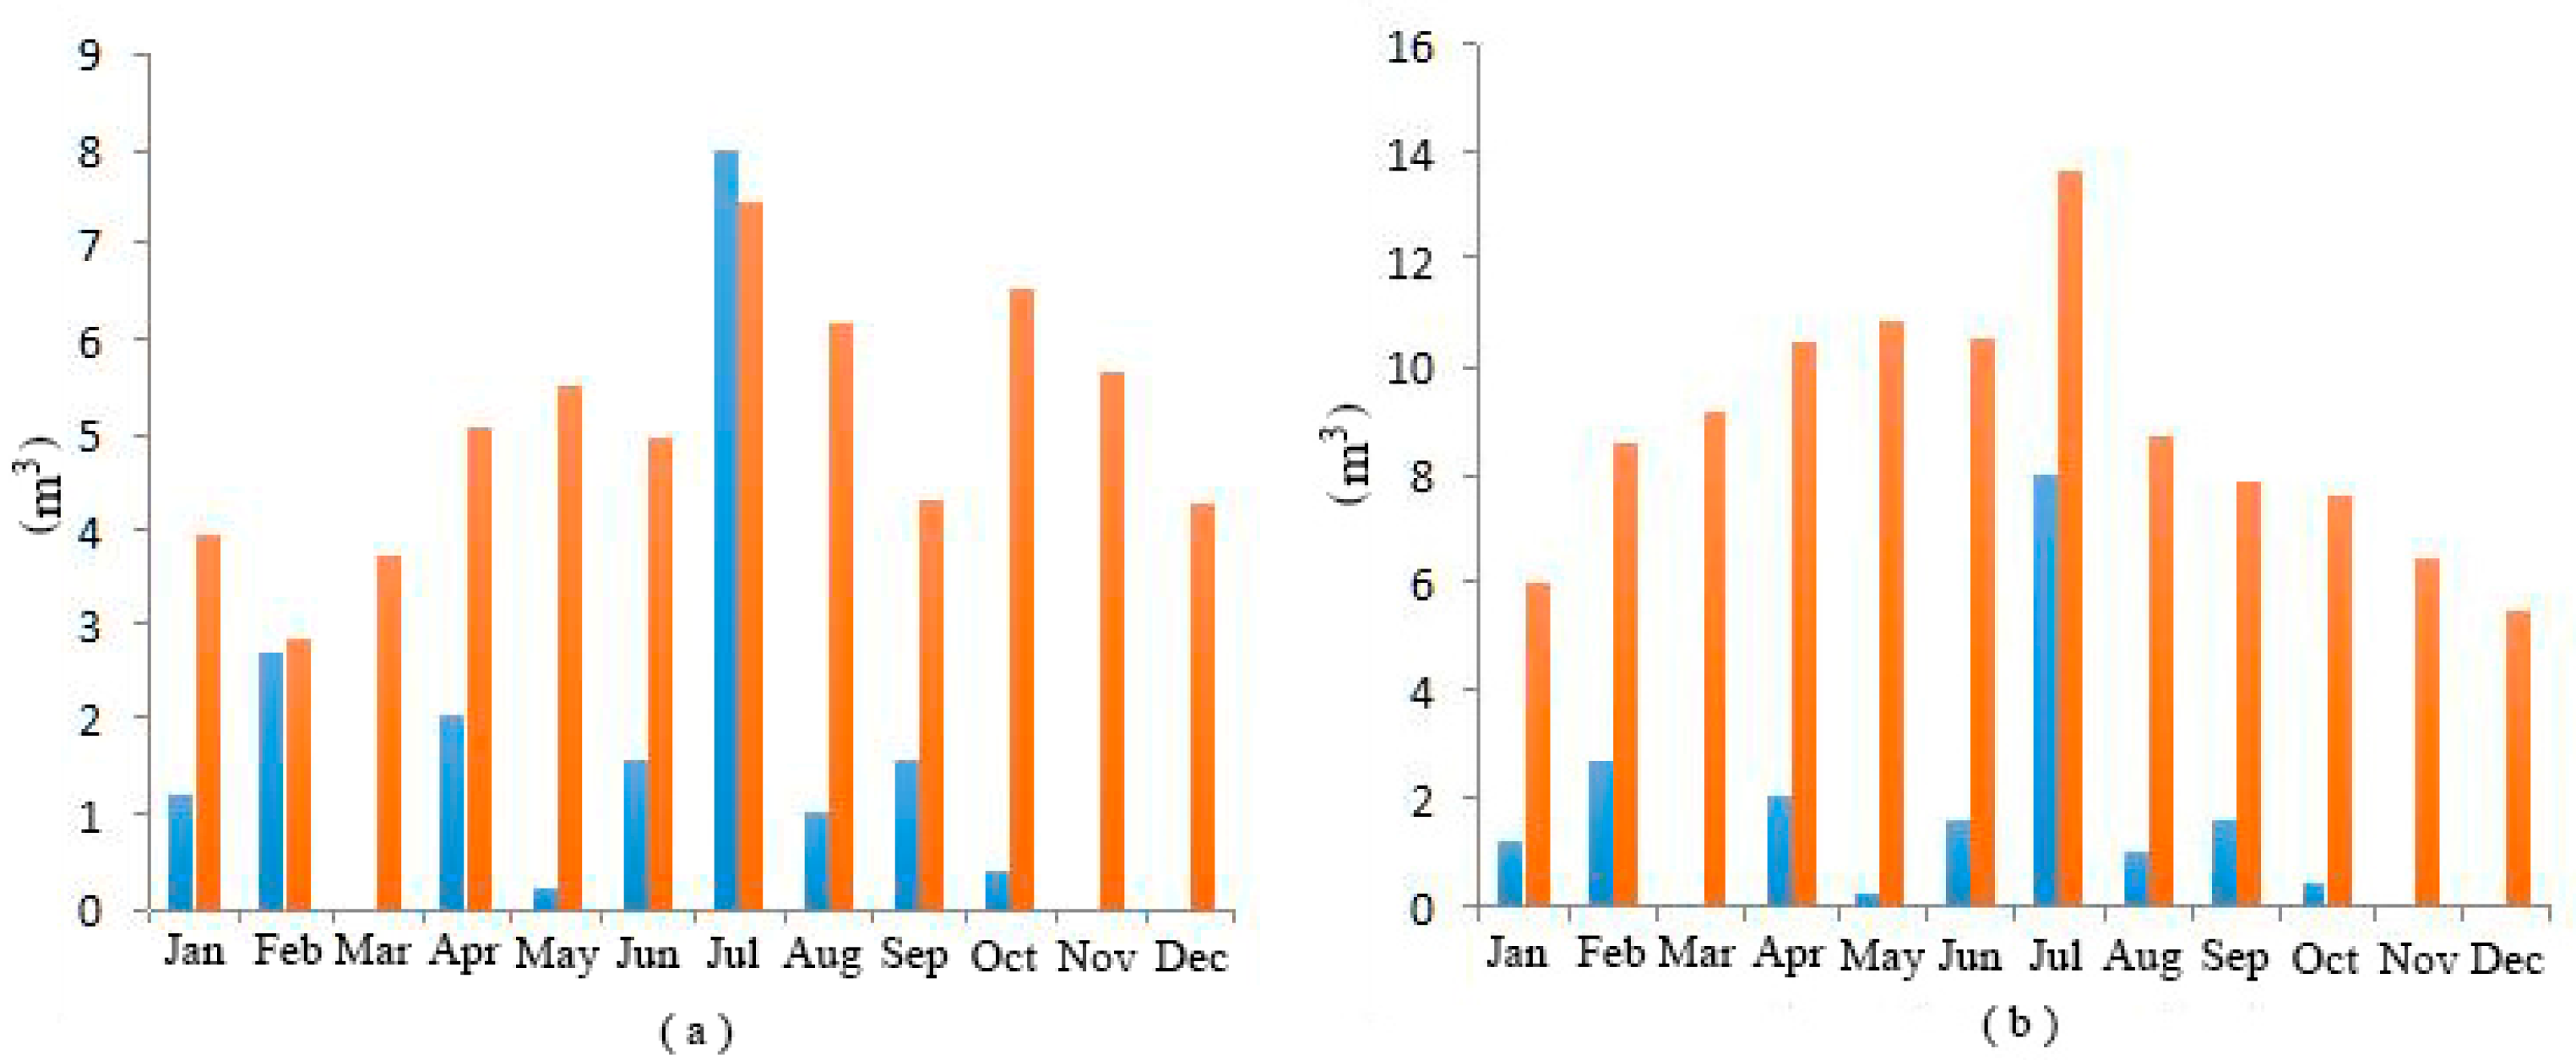
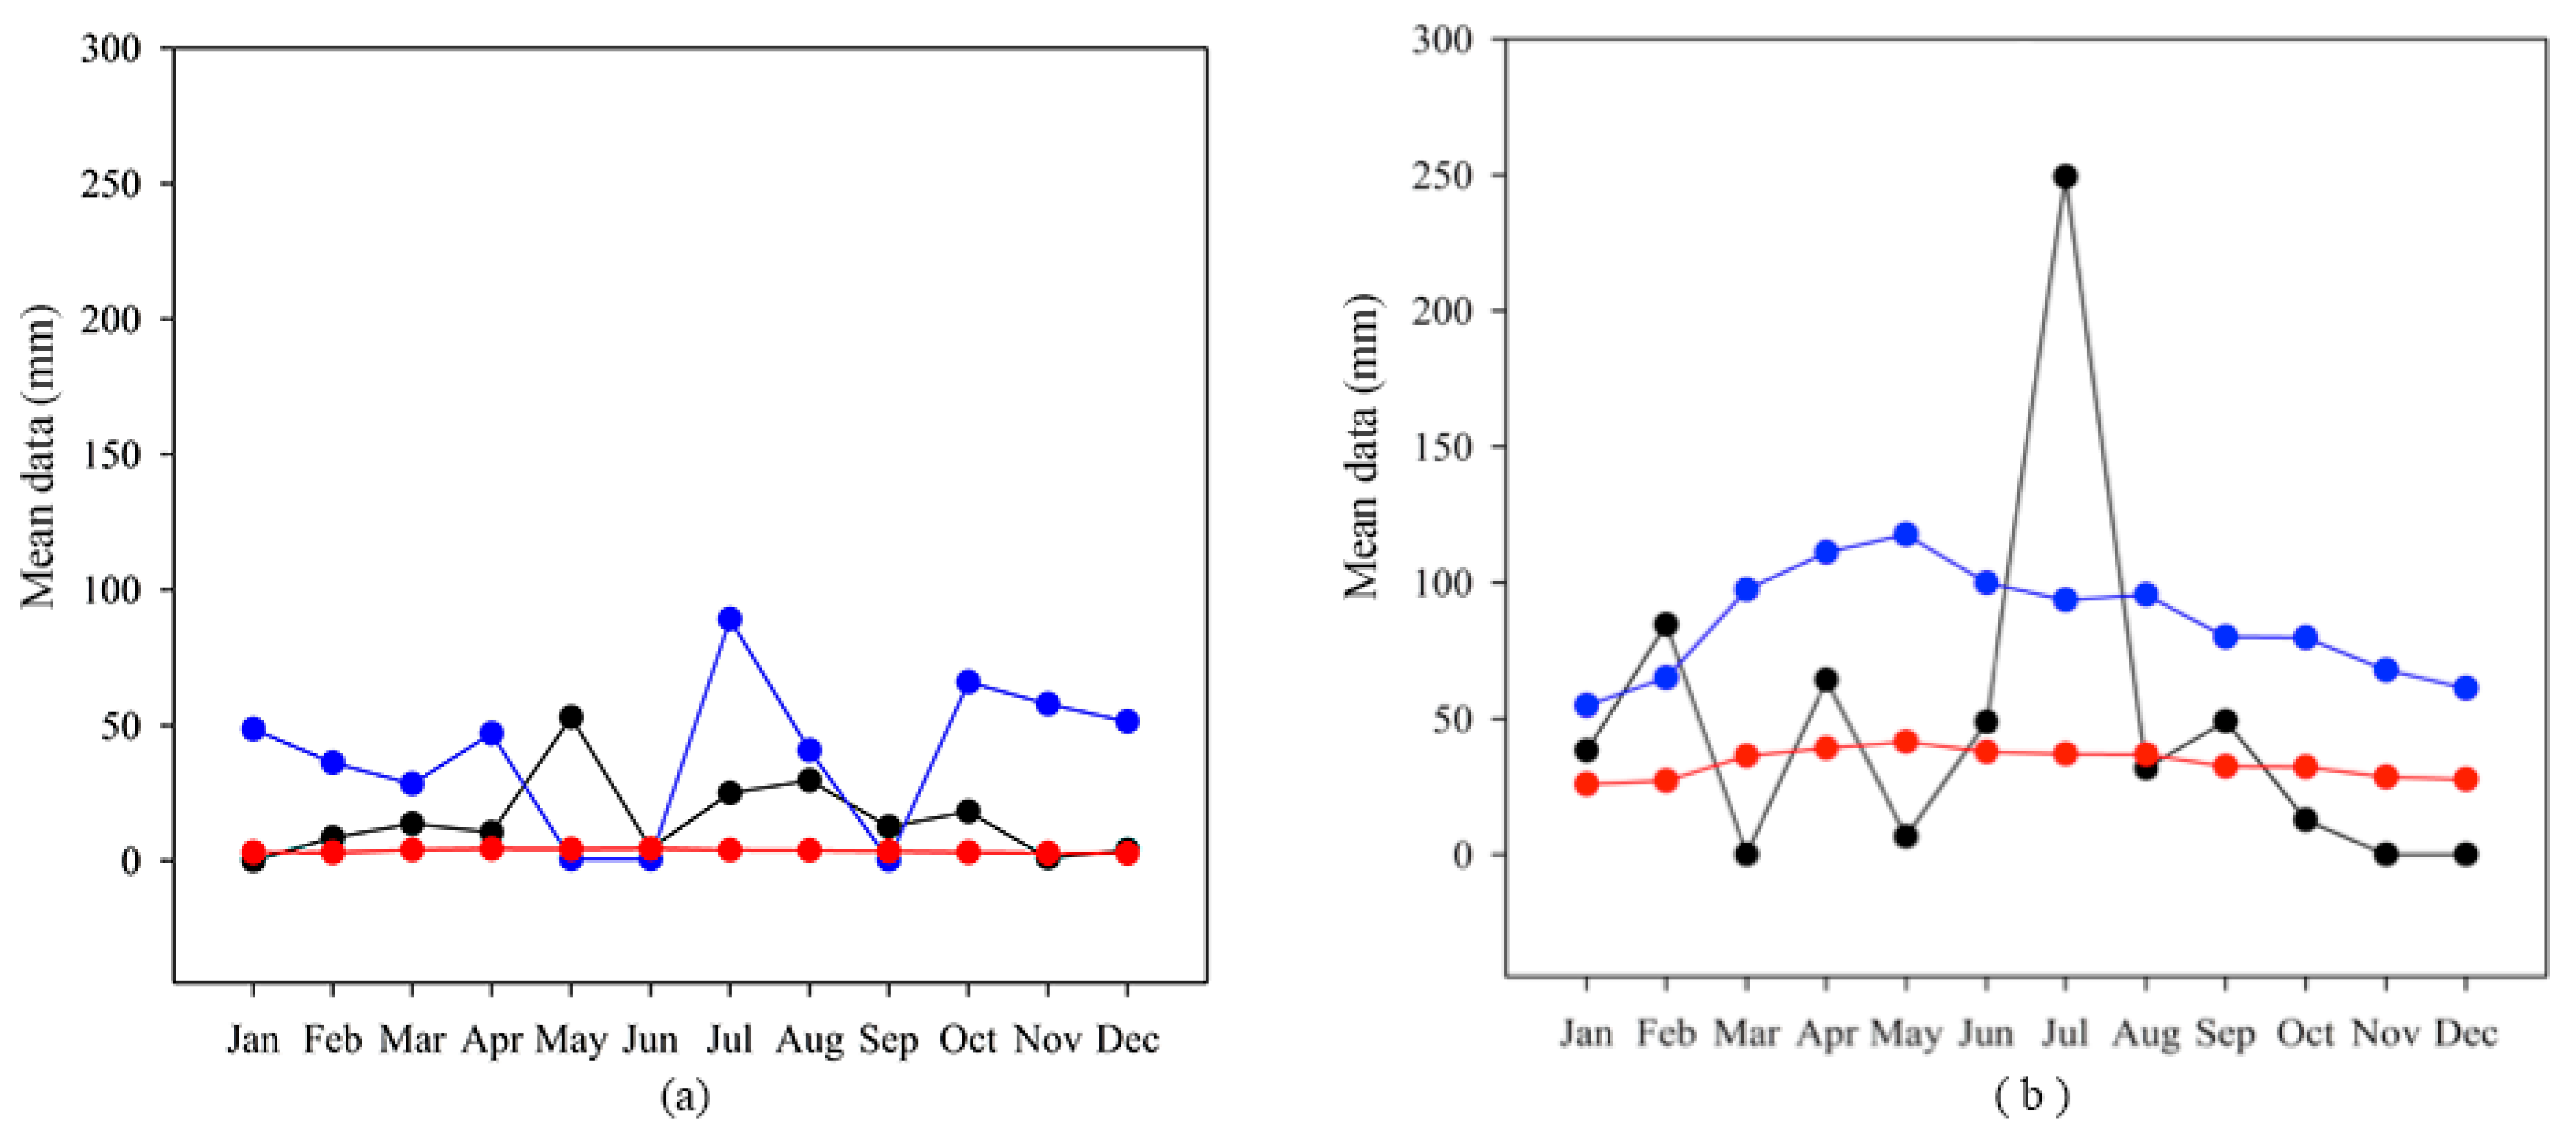
3.1. Temporary Progression of the Plant-Related Variables (PEm and U)

Owing to the difficulty of obtaining accurate field measurements, PEm was computed from monthly weather data (Figure 5a,b) taken from scenario 1 and scenario 2. We found the results depicted below.
In scenario 1, R and U showed inversely proportional trends, where higher rainfall (R) reduced the water consumption (U) by plants (Figure 5a). It was also noted that during the months of June, September, and November (after a rainy month) there was less consumptive use (U). From this, it could be derived that plants contain a large enough water reserve not to need additional irrigation. PEm has a uniform behavior over the months, regardless of changes in the plant water consumption [33]. This factor is important, as it contributes to the storage of water necessary during the dry months [34].
The analysis of scenario 2 revealed the following trends. The increase and decrease in R are presented every two months, except the months of June and July, during which R increased. In fall (during October, November, and December) a decrease of R (Figure 5b) was observed. It is noteworthy that the water consumption of plants (U) tends to increase as the drought period extends and to reduce once again during the rainy season. The PEm behavior is relatively constant; however, there is a slight increase as the value of U increases, and it tends to decrease after the summer (rainy period). The impact of urbanization on the hydrological cycle is reflected in a diminution of the values of its PEm, which may vary between 40% (at sites with a high infiltration capacity) and 30% (on sites with impermeable or paved surfaces [35]). It has been shown that LID techniques can increase PEm in 18% and 19% under conditions of drought and rainfall, respectively [36].

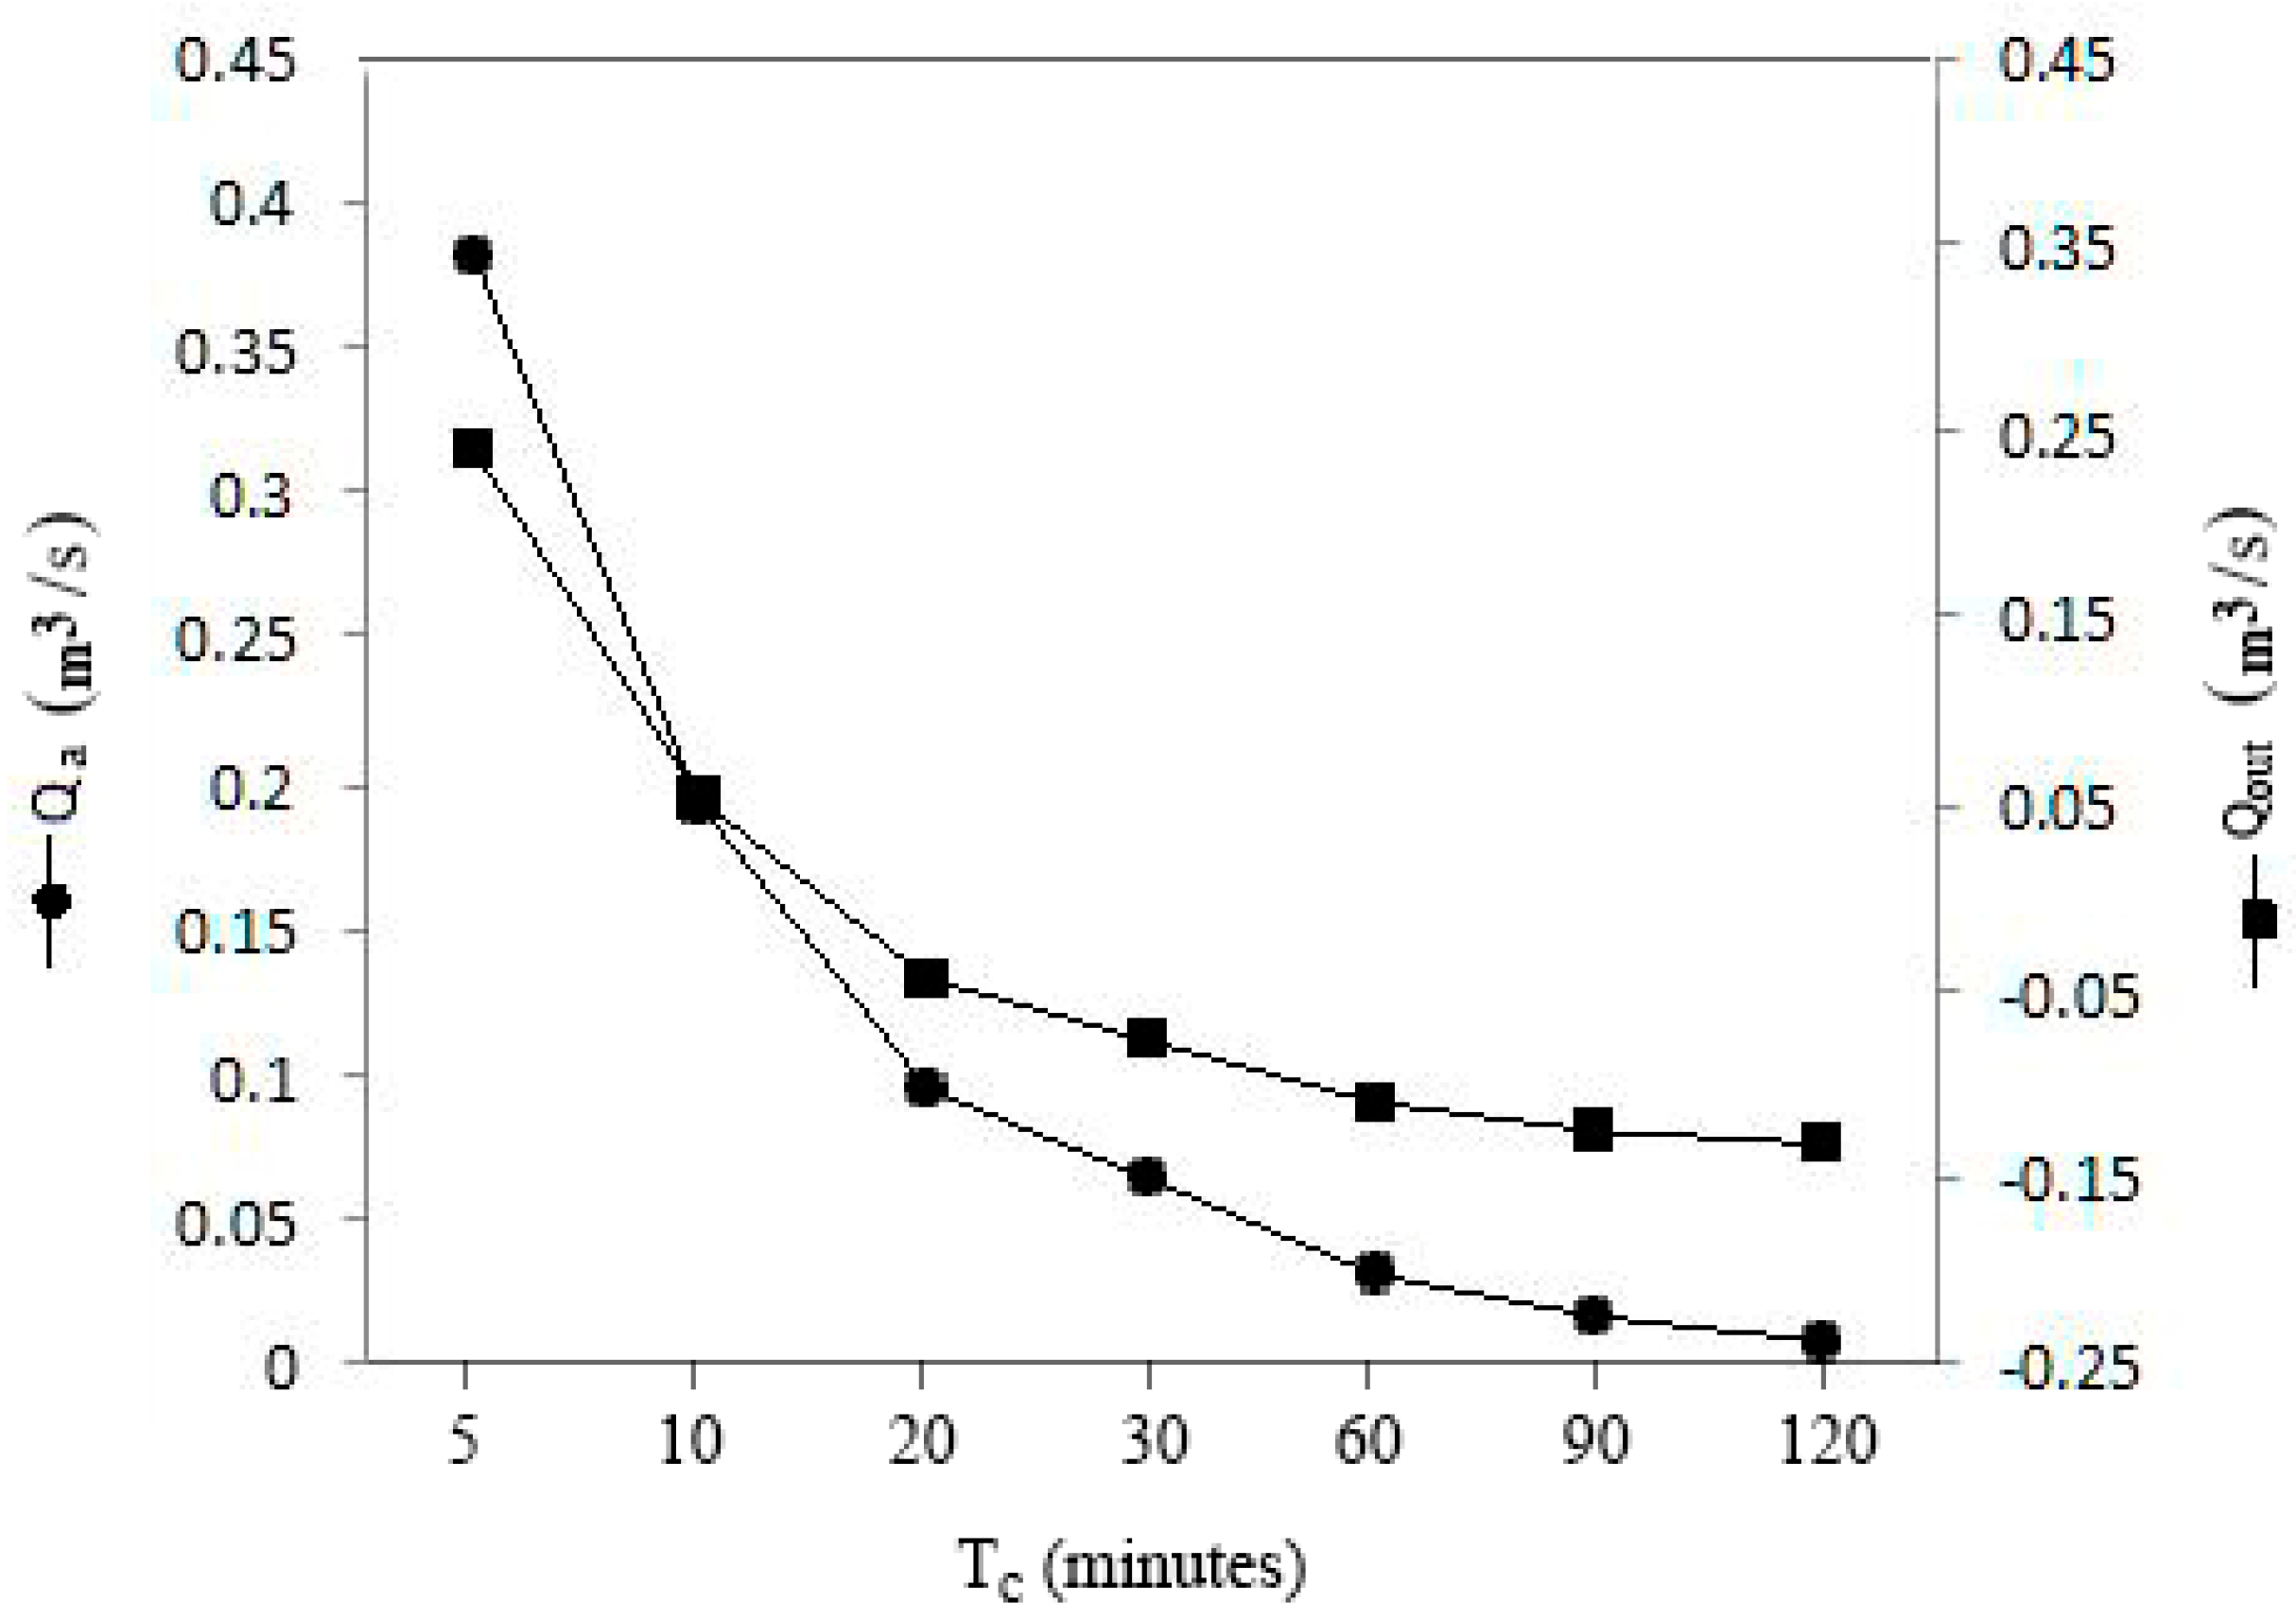
3.2. Bioretention Cell Efficiency

Lizárraga-Mendiola et al. [18] mentioned over in a period of 33 years (1980 to 2013), the highest annual R was registered in this site in 2010 (585.6 mm/year), with a tendency for further increases. In the same work, the hydrological variables were calculated from the annual R for the year 1982, since it is the driest year (181.10 mm/year). This comparison is useful because, as other studies refer, periods of prolonged drought could cause water stress on plants within a bioretention cell [37]. To this respect, some authors [38,39] emphasise that the R and T variations affect the hydrological cycle, as well as the efficiency of urban drainage systems [40].
In this study, the monthly maximum values of R registered for both years were considered to study the efficiency of the proposed bioretention cell under extreme conditions of drought and rain that occurred in recent years (1982–2010, respectively). The results were as follows.
The surface selected for this analysis has drained water since its inception (L0 = 0 m) to the proposed site for the location of the bioretention cell (L = 3039.55 m) (Table 1). The surface is impervious (asphalt, Rc = 0.8). Under rain conditions, whose time of concentration (Tc) of surface runoff is 5 min, the rainfall intensity is equal to 0.8 mm/h. Water balance through the bioretention cell can be represented by the schema shown in Figure 6.
For the rainiest month (August) of scenario 1 (the year 1982), the volume drained by the impervious surface (comprising 32% of the total area) is 5066.17 m3. Of this, 161.09 m3 reaches the bioretention cell as inlet runoff (Qa), while roofs, vegetated areas, and bare soil intercept the remaining volume. The hydrologic balance indicated that 162.04 m3 enter the system as inputs (R + Qa) and that 8.66 m3 is out of the system as Qout (in the form of Ev + PEm + U + Inf). This result indicates that, from the total volume of water reaching the bioretention cell, 5.37% is absorbed, while the remaining volume continues as outlet runoff (94.63%) (Figure 6).
Once the volume of water enters the bioretention cell, is observed that input volumes (R + Qa) are lower than Qout (Ev + PEm + Inf + U) almost throughout the driest year, except in July (Figure 7a). This variation explains the need for an additional irrigation under very dry conditions (even during the rainy season, except in July).
For the rainiest month (July) of scenario 2 (the year 2010), the volume drained from the paved surface is 23,839.71 m3 (21.25% more than in scenario 1). From this quantity, 758.06 m3 reach the bioretention cell as inlet runoff (Qa). The hydrologic balance indicated that 766.04 m3 corresponds to inputs (R + Qa), while the Qout corresponds to 17.06 m3 (Ev + PEm + U + Inf) (Figure 6). This indicates that, of the total volume of water reaching the bioretention cell, 2.25% is absorbed, while the rest continues as runoff (97.75%).
Figure 7b shows that input (R + Qa) volumes are lower than Qout (Ev + PEm + U + Inf) during every month of the year, indicating the need for the implementation of more LID techniques to control this excedent runoff.
The plants selected for the bioretention cell (succulents and grass) are in good agreement with the ecological engineering principles establishing little or null watering. The hydrological balance of the bioretention cell indicates that, even under dry conditions (scenario 1), its capacity for self-irrigation is good.

3.3. Infiltration Trench Efficiency

Usually, infiltration trenches are designed taking a small and frequent storm as a design storm, with a one year return period. But, in this case, as the study area has the lowest topographic level of the basin, where runoff water accumulates, the biggest rainfall (R = 250 mm) was selected to calculate the design rain intensity. Although the design criterion was the same as for the bioretention cell, in the case of the trench the calculated design intensity was considerably greater because the maximum length of the runoff path is very short (6.3 m). Likewise, the design intensity (i = 240 mm/h) was greater than bigger intensities registered in the study area [41]: 120, 140, 144, 166, and 185 mm/h with return periods of 10, 20, 25, 50, and 100 years, respectively. Nevertheless, the maximum duration of the design storm that could receive the trench without undergoing flood would be 0.52 min (Figure 8). The above limitation is due to the procedure used to determine the dimensions of the infiltration trench: in none of the Equations employed ((1) to (3) and (13)) the duration of the storm or its volume was taken into account. This led to the undersizing of the infiltration trench. This design criterion was taken since a storm with an intensity equal to that of the design storm is an unlikely event, according to the historical climatic data for the study area [41].
Furthermore, according to its dimensions, the infiltration trench should be efficient to control common rainfall events in the study area with intensities from 2.50 to 14.58 mm/h for maximum times, shown in Figure 8. The above events would not exceed the storage capacity of the infiltration trench, which is 2.91 m3. On the other hand, a storm with i = 0.8 mm/h (design intensity for the bioretention cell) could have a duration of up to 155 min without leading to problems of flooding in the zone of the infiltration trench.
The infiltration trench is a suitable option to manage the runoff in the small selected area, because it is part of a university campus without the presence of toxic pollutants, with sandy loam soils and a slope less than 5%. On the campus, there are several sites that meet the above characteristics, so building more infiltration trenches is an appropriate option to mitigate current flood problems and to support a better functioning of the bioretention cell.

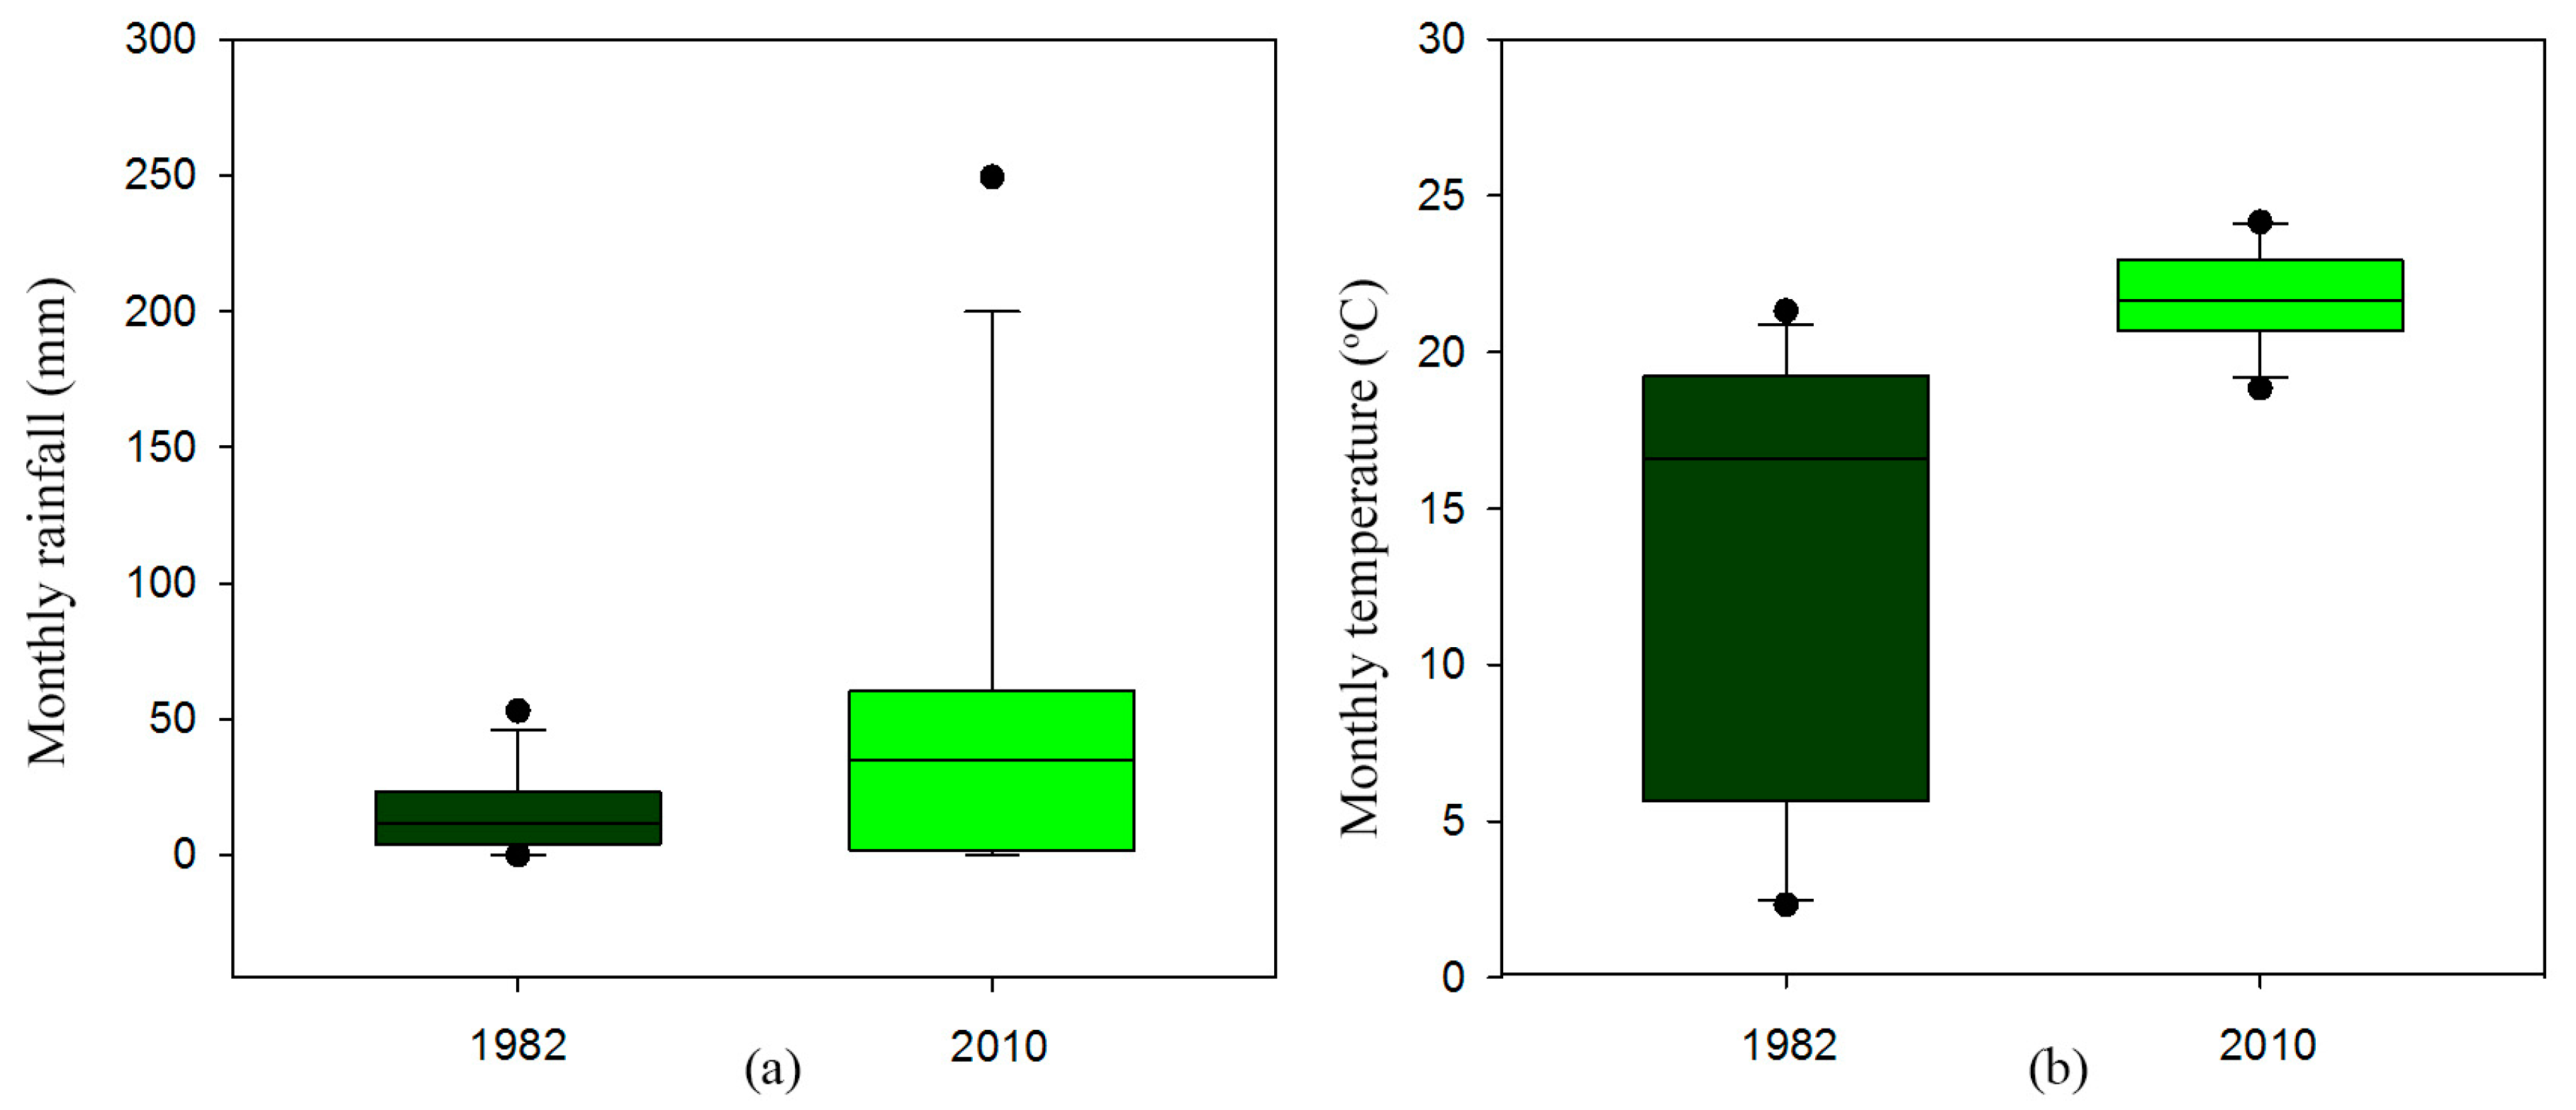
3.4. Analysis of Hydrological Variables (1982, 2010)

The main monthly hydrological variables for 1982 (driest year) and 2010 (rainiest year) are summarized in Table 2.
Although the mean monthly rainfall for 1982 (15.09 mm/month) appeared to be very low compared to the mean rainfall (R) registered in 2010 (48.80 mm/month), the statistical analysis showed that the difference in both years was not significative (p < 0.05; Figure 9a). The same conclusion was drawn for infiltration (Inf). By contrast, mean temperatures registered monthly for these years were significantly different (p < 0.05; Figure 9b). It is worth noting that in 1982 the monthly temperatures were lower than in 2010, but also more variable. Other variables significantly different in both years were Ev (evaporation), U (consumptive use), and PEm (potential evapotranspiration).
The results of the correlation analysis carried out for the hydrological variables of 1982 and 2010 are presented in Table 3 and Table 4, respectively. The low mean temperature registered during 1982 (Table 3) showed only a positive and significant correlation with the consumptive use of water (U; r = 0.945). Also, and probably due to its high variability, the mean temperature of 1982 presented a low and negative, but significative, correlation to Ev (r = −0.651). As said before, 2010 was characterized by a constantly high temperature (Table 4), which was significantly correlated to the evaporated water (Ev; r = 0.831), as well as to the water that can be consumptively used (U; r = 0.945) and evapotranspired (PEm; r = 0.933) by the plants of the proposed bioretention cell.
Of particular importance is the amount of water that the proposed bioretention cell cannot intercept (Qout). On the one hand, this variable indicates the potential inefficiency of the system for mitigating floods and peak flows. On the other hand, it can be viewed as a resource that can be eventually stored and further reused. In both years considered, the estimated Qout was correlated positively to the rainfall (R; r = 0.890) and the infiltration (Inf; r = 0.993) rather to the components of the water cycle related to the plant water-use (namely U and PEm). The conclusions are slightly different if Qout is expressed as a fraction of the total intercepted water (i.e., %Qout), because U and PEm showed a low correlation to %Qout (r equivalent to 0.654 and 0.645, respectively) if a high temperature prevailed as it occurred in 2010 (Table 4).

3.5. Outlet Runoff Behavior

Both scenarios analyzed (years 1982–2010) used the same rainfall intensity (i) and concentration time (Tc). Qout indicates that only during the first 5–10 min of a storm can the bioretention cell intercept a volume of 0.24 and 0.05 m3/s of water, respectively. On the other hand, up to 20 min, the Qout is a negative value, which indicates that the bioretention cell is saturated and the runoff flows over this (Figure 10).
This analysis suggests that the interception capacity of the bioretention cell increases along with the input runoff rate; conversely, for prolonged storms (with durations higher than 10 min), the water interception is likely to be reduced. However, this can be seen as a possibility to reduce the volume of surface runoff that causes flooding problems [42]. This also represents an opportunity to upgrade the design and modeling of other LID techniques. It must be supported by the knowledge of the physical and hydrological characteristics of the site, but it should allow the continuous simulation of the system. To this end, the use of software such as MUSIC and PURRS has been proposed [43].
On the other hand, infiltration (Inf) is a very important factor, which can allow a greater input of water into the subsoil. For this analysis, the infiltration value used, in accordance with other studies, is considered as well-suited for the conditions of the study area [44]. Some authors claim that the infiltration capacity of the granular materials used in these systems affects their retention capacity. This capacity is visibly reduced due to the accumulation of fine particles (clay) in empty spaces. Then, it is necessary to perform continuous maintenance actions to ensure a proper efficiency [31].
Negative Qout values suggest that it is convenient to install additional works that will help to reduce the rate of inlet runoff (Qa). This would facilitate greater infiltration of the water collection in the storage system and would reduce the transport of soil and waste that could affect the efficiency of the bioretention cell [14].
Khan et al. [31] mentioned that a minimum ratio between the collector area and the bioretention cell (1:20) is necessary for its good efficiency. For this case study, the ratio is 1:0.6, since the area available to be transformed into a bioretention cell is small. However, efficiency can also be defined according to the time of concentration and the runoff volume, which provides the opportunity to store a volume of water for self-watering, as defined above.
In areas such as this one, where the increase in impervious surfaces causes flooding—despite the existence of the hydraulic infrastructure to channel surface runoff—bioretention cells can be an adequate alternative to mitigate this problem. As mentioned by some authors [9,45], sometimes the hydraulic infrastructure that drives surface runoff is inefficient to channel the volume of water produced during a rainfall event, so LID techniques are an alternative to help infiltrate that surplus volume, mainly in urbanized areas [5]. Among the advantages of using LID techniques, there is their ability to reduce the quantity of surface runoff, their small footprint, their low price, their scarce maintenance requirements, their potential for removing contaminants, and the fact that they are aesthetically adapted to urbanized areas [46]. Even in areas with semi-arid climates this type of technology is promising, not only for the reduction of runoff but also for possible vegetable gardens [47].

4. Conclusions

The design of bioretention cells in conditions with semi-arid climates has been little investigated. Typically, these systems are designed for areas with an average rainfall of 1000 mm/year or higher. In this study, we proposed the design of a bioretention cell for which tolerant plants (grasses and succulents) were selected for low precipitation and high evaporation conditions.
It was found that regardless of the presence of very dry periods (less than 200 mm/year) or rainier periods (between 500 and 600 mm/year), U increases as T increases and R decreases. The PEm is relatively constant throughout the year; however, after a rainy month, U diminished (in a wet year). It was also determined that the selected plants require additional irrigation during a dry period, although they tend to recover after a rainy month, confirming that they are capable of tolerating water stress. On the other hand, it was determined that under conditions of higher humidity, the bioretention cell could store sufficient volumes of water that would favor its self-watering throughout the year. This confirms that the hydrological efficiency of the bioretention cell according to the U requirements of the plants selected in this study (grass-Festuca ovina glauca- and succulents) is good.
Concerning the capacity of the bioretention cell to absorb surface runoff, it is adequate under short-term storm conditions. As the duration of the storm increases, its interception capacity decreases. This provokes the need to install complementary works that intercept the drained volume, not only on the main channel, but throughout the study area, which could facilitate its infiltration at elevated zones of the study area. In addition, these works could also consider the storage of partial volumes, in order to reuse the water for non-potable purposes (such as the irrigation of green areas) and thus avoid transporting soil and solid wastes that may affect the efficiency of the bioretention cell.
Therefore, it can be concluded that these types of LID techniques could function adequately in places with semi-arid climates. They must be provided with tolerant plants selected under low humidity conditions, filter materials with good permeability, and complementary works selected appropriately to contribute to extending its useful life.

Acknowledgments

This research was supported by the Hidalgo State University (Universidad Autónoma del Estado de Hidalgo, Programa Anual de Investigación, PAI). The funds covering the costs to publish in open access were provided by PRODEP (SEP, Mexico).

Author Contributions

Liliana Lizárraga-Mendiola and Gabriela A. Vázquez-Rodríguez conceived the study and made the hydrological design of the bioretention cell. Carlos Alexander Lucho-Constantino carried out the statistical analysis of the hydrological variables. Carlos Alfredo Bigurra-Alzati made the architectural design of the proposed LID. Rosa Icela Beltrán-Hernández designed the infiltration trench. Joyce Edith Ortiz-Hernández proposed the conceptual design of the bioretention cell. Luis D. López-León provided substantive input on the manuscript.

Conflicts of Interest

The authors declare no conflict of interest. The founding sponsors had no role in the design of the study; in the collection, analyses, or interpretation of data; in the writing of the manuscript; or in the decision to publish the results.

References

  1. Mentens, J.; Raes, D.; Hermy, M. Green roofs as a tool for solving the rainwater runoff problem in the urbanized 21st century? Landsc. Urban Plan. 2006, 77, 217–226. [Google Scholar] [CrossRef]
  2. Arnold, C.L.; Gibbons, C.J. Impervious surface coverage: The emergence of a key environmental indicator. J. Am. Plan. Assoc. 1996, 62, 243–258. [Google Scholar] [CrossRef]
  3. Qin, H.; Li, Z.; Fu, G. The effects of low-impact development on urban flooding under different rainfall characteristics. J. Environ. Manag. 2013, 129, 577–585. [Google Scholar] [CrossRef] [PubMed] [Green Version]
  4. Davis, A.P. Field performance of bioretention: Hydrology impacts. J. Hydrol. Eng. 2008, 13, 90–95. [Google Scholar] [CrossRef]
  5. Locatelli, L.; Mark, O.; Mikkelsen, P.S.; Arnbjerg-Nielsen, K.; Delectic, A.; Roldin, M.; Binning, P.J. Hydrologic impact of urbanization with extensive stormwater infiltration. J. Hydrol. 2017, 544, 524–537. [Google Scholar] [CrossRef]
  6. Czemiel-Berndtsson, J. Green roof performance towards management of runoff water quantity and quality: A review. Ecol. Eng. 2010, 36, 351–360. [Google Scholar] [CrossRef]
  7. Mitsch, W.J. Engineering within Ecological Constraints; National Academy Press: Washington, DC, USA, 1996. [Google Scholar]
  8. Beck, N.G.; Conley, G.; Kanner, L.; Mathias, M. An urban runoff model designed to inform stormwater management decisions. J. Environ. Manag. 2017, 193, 257–269. [Google Scholar] [CrossRef] [PubMed]
  9. Ahiablame, L.; Shakya, R. Modeling flood reduction effects of low-impact development at a watershed scale. J. Environ. Manag. 2016, 171, 81–91. [Google Scholar] [CrossRef] [PubMed]
  10. Lenhart, H.A.; Hunt, W.F. Evaluating four storm-water performance metrics with a North Carolina coastal plain storm-water wetland. J. Environ. Eng. 2010, 137, 155–162. [Google Scholar] [CrossRef]
  11. Roy-Poirier, A.; Champagne, P.; Filion, Y. Review of bioretention system research and design: Past, present, and future. J. Environ. Eng. 2010, 136, 878–889. [Google Scholar] [CrossRef]
  12. Houdeschel, C.D.; Hultine, K.R.; Johnson, N.C.; Pomeroy, C.A. Evaluation of three vegetation treatments in bioretention gardens in a semi-arid climate. Landsc. Urban Plan. 2015, 135, 62–72. [Google Scholar] [CrossRef]
  13. Rycewicz-Borecki, M.; McLean, J.E.; Dupont, R.R. Nitrogen and phosphorus mass balance, retention and uptake in six plant species grown in stormwater bioretention microcosms. J. Ecol. Eng. 2017, 99, 409–416. [Google Scholar] [CrossRef]
  14. Liu, J.; Sample, D.J.; Bell, C.; Guan, Y. Review and research needs of bioretention used for the treatment of urban stormwater. Water 2014, 6, 1069–1099. [Google Scholar] [CrossRef]
  15. Ortiz-Hernández, J.; Lucho-Constantino, C.; Lizárraga-Mendiola, L.; Beltrán-Hernández, R.I.; Coronel-Olivares, C.; Vázquez-Rodríguez, G. Quality of urban runoff in wet and dry seasons: A case study in a semi-arid zone. Environ. Sci. Pollut. Res. 2016, 23, 25156–25168. [Google Scholar] [CrossRef] [PubMed]
  16. Houdeshel, C.D.; Pomeroy, C.A.; Hultine, K.R. Bioretention design for xeric climates based on ecological principles. JAWRA J. Am. Water Resour. Assoc. 2012, 48, 1178–1190. [Google Scholar] [CrossRef]
  17. Meteorological National Service. Pronóstico del Tiempo por Municipios. Available online: http://smn.cna.gob.mx/es/pronostico-del-tiempo-por-municipios (accessed on 8 April 2016). (In Spanish).
  18. Lizárraga-Mendiola, L.; Vázquez-Rodríguez, G.; Blanco-Piñón, A.; Rangel-Martínez, Y.; González-Sandoval, M. Estimating the rainwater potential per household in an urban area: Case study in Central Mexico. Water 2015, 7, 4622–4637. [Google Scholar] [CrossRef]
  19. Ortiz-Hernández, J. Biorretención de Agua de Escorrentía Urbana Para su Tratamiento y Reúso. Ph.D. Thesis, Universidad Autónoma del Estado de Hidalgo, Pachuca, Mexico, 2016. (In Spanish). [Google Scholar]
  20. Bagarello, V.; Sferlazza, S.; Sgroi, A. Comparing two methods of analysis of single-ring infiltrometer data for a sandy–loam soil. Geoderma 2009, 149, 415–420. [Google Scholar] [CrossRef]
  21. Coffman, L.S.; Goo, R.; Frederick, R. Low-Impact Development: An Innovative Alternative Approach to Stormwater Management. In WRPMD’99: Preparing for the 21st Century, Proceedings of the 29th Annual Water Resources Planning and Management Conference, Tempe, AZ, USA, 6–9 June 1999; pp. 1–10. [Google Scholar]
  22. Samuel, J.; Coulibaly, P.; Dumedah, G.; Moradkhani, H. Assessing model state and forecasts variation in hydrologic data assimilation. J. Hydrol. 2014, 513, 127–141. [Google Scholar] [CrossRef]
  23. Food and Agriculture Organization of the United Nations. Guidelines for Predicting Crop Water Requirements; Food and Agriculture Organization of the United Nations: Rome, Italy, 1977. [Google Scholar]
  24. Martín-Rodríguez, A.; Ávila-Alabarces, R.; Yruela-Morillo, M.C.; Plaza-Zarza, R.; Navas-Quesada, A.; Fernández-Gómez, R. Manual de Riego de Jardines; Junta de Andalucía, Consejería de Agricultura y Pesca: Sevilla, Spain, 2010. [Google Scholar]
  25. Bascuñán-Fuentes, E.E. Eficiencia Hídrica Aplicada a la Plaza de Armas de Quilicura: Propuesta de Rediseño Mediante Principios de Xerojardinería y Recolección de Aguas Pluviales. Bachelor’s Thesis, Universidad Andrés Bello, Santiago, Chile, 2013. (In Spanish). [Google Scholar]
  26. United States Department of Agriculture. Threshold Channel Design. In Part 654 Stream Restoration Design National Engineering Handbook; National Resources Conservation Service, United States Department of Agriculture: Washington, DC, USA, 2007. [Google Scholar]
  27. United States Department of Agriculture. Soil Quality Test Kit Guide; Soil Quality Institute, United States Department of Agriculture: Washington, DC, USA, 1999.
  28. Lucho-Constantino, C.A.; Álvarez-Suárez, M.; Beltrán-Hernández, R.I.; Prieto-García, F.; Poggi-Varaldo, H.M. A multivariate analysis of the accumulation and fractionation of major and trace elements in agricultural soils in Hidalgo State, Mexico irrigated with raw wastewater. Environ. Int. 2005, 31, 313–323. [Google Scholar] [CrossRef] [PubMed]
  29. Asleson, B.C.; Nestingen, R.S.; Gulliver, J.S.; Hozalski, R.M.; Nieber, J.L. Performance Assessment of Rain Gardens. JAWRA J. Am. Water Resour. Assoc. 2009, 45, 1019–1031. [Google Scholar] [CrossRef]
  30. Endreny, T.; Collins, V. Implications of bioretention basin spatial arrangements on stormwater recharge and groundwater mounding. Ecol. Eng. 2009, 35, 670–677. [Google Scholar] [CrossRef]
  31. Khan, U.T.; Valeo, C.; Chu, A.; He, J. A Data Driven Approach to Bioretention Cell Performance—Prediction and Design. Water 2013, 5, 13–28. [Google Scholar] [CrossRef]
  32. Liu, Y.; Bralts, V.F.; Engel, B.A. Evaluating the effectiveness of management practices on hydrology and water quality at watershed scale with a rainfall-runoff model. Sci. Total Environ. 2015, 511, 298–309. [Google Scholar] [CrossRef] [PubMed]
  33. Cotillas, M.; Sabaté, S.; Gracia, C.; Espelta, J.M. Growth response of mixed Mediterranean oak coppices to rainfall reduction. For. Ecol. Manag. 2009, 258, 1677–1683. [Google Scholar] [CrossRef]
  34. Stewart, B.A.; Liang, W.-L. Strategies for increasing the capture, storage, and utilization of precipitation in semi-arid regions. J. Integr. Agric. 2015, 14, 1500–1510. [Google Scholar] [CrossRef]
  35. Saraswat, C.; Kumar, P.; Mishra, B.K. Assessment of stormwater runoff management practices and governance under climate change and urbanization. Environ. Sci. Policy 2016, 64, 101–117. [Google Scholar] [CrossRef]
  36. Feng, Y.; Burian, S.; Pomeroy, C. Potential of green infrastructure to restore predevelopment water budget of a semi-arid urban catchment. J. Hydrol. 2016, 542, 744–755. [Google Scholar] [CrossRef]
  37. Hathaway, J.M.; Brown, R.A.; Fu, J.S.; Hunt, W.F. Bioretention function under climate change scenarios in North Carolina, USA. J. Hydrol. 2014, 519, 503–511. [Google Scholar] [CrossRef]
  38. Willems, P.; Arnbjerg-Nielsen, K.; Olsson, J.; Nguyen, V.T.V. Climate change impact assessment on urban rainfall extremes and urban drainage: Methods and shortcomings. Rainfall Urban Context Forecast. Risk Clim. Chang. 2012, 103, 106–118. [Google Scholar] [CrossRef]
  39. Berggren, K.; Olofsson, M.; Viklander, M.; Svensson, G.; Gustafsson, A.-M. Hydraulic Impacts on Urban Drainage Systems due to Changes in Rainfall Caused by Climatic Change. J. Hydrol. Eng. 2012, 17, 92–98. [Google Scholar] [CrossRef]
  40. Wang, J.; Zhang, P.; Yang, L.; Huang, T. Cadmium removal from urban stormwater runoff via bioretention technology and effluent risk assessment for discharge to surface water. J. Contam. Hydrol. 2016, 185, 42–50. [Google Scholar] [CrossRef] [PubMed]
  41. Secretaría de Comunicaciones y Transporte. Isohyets of Intensity, Duration, Period of Return for the Mexican Republic. 2015. Available online: http://www.sct.gob.mx/fileadmin/DireccionesGrales/DGST/Isoyetas/hidalgo.pdf (accessed on 21 May 2017).
  42. Lucke, T.; Nichols, P.W.B. The pollution removal and stormwater reduction performance of street-side bioretention basins after ten years in operation. Sci. Total Environ. 2015, 536, 784–792. [Google Scholar] [CrossRef] [PubMed]
  43. Lucas, S.A.; Coombes, P.J.; Hardy, M.J.; Geary, P.M. Rainwater harvesting: Revealing the detail. J. Aust. Water Assoc. 2006, 33, 50–55. [Google Scholar]
  44. Le Costumer, S.; Fletcher, T.D.; Deletic, A.; Barraud, S.; Lewis, J.F. Hydraulic performance of biofilter systems for stormwater management—Influences of design and operation. J. Hydrol. 2009, 376, 16–23. [Google Scholar] [CrossRef]
  45. Bell, C.D.; McMillan, S.K.; Clinton, S.M.; Jefferson, A.J. Hydrologic response to stormwater control measures in urban watersheds. J. Hydrol. 2016, 541, 1488–1500. [Google Scholar] [CrossRef]
  46. Gogate, N.G.; Kalvar, P.P.; Raval, P.M. Assessment of stormwater management options in urban contexts using Multiple Attribute Decision-Making. J. Clean. Prod. 2017, 142, 2046–2059. [Google Scholar] [CrossRef]
  47. Richards, P.J.; Williams, N.S.G.; Fletcher, T.D.; Farrell, C. Can rain gardens produce food and retain stormwater effects of substrates and stormwater application method on plant water use, stormwater retention and yield. Ecol. Eng. 2017, 100, 165–174. [Google Scholar] [CrossRef]
Figure 1. Location of the study area.
Water 09 00561 g001
Figure 2. Delimitation of the university campus. It divides into two sub-zones (S1 and S2). S1 was chosen for the hydrologic design of the bioretention cell due to its lowest topographic level.
Water 09 00561 g002
Figure 3. Conceptual model of the bioretention cell.
Water 09 00561 g003
Figure 4. Design of the infiltration trench.
Water 09 00561 g004
Figure 5. (a) Temporary progression of the rainfall (R) (●), consumptive use (U) (), and potential evapotranspiration (PEm) () in 1982 and (b) in 2010.
Water 09 00561 g005
Figure 6. Water balance scheme.
Water 09 00561 g006
Figure 7. Temporary progression of input (blue) and outlet runoff (orange) in the bioretention cell (a) in 1982 and (b) in 2010.
Water 09 00561 g007
Figure 8. Rainfall events for which the infiltration trench is efficient.
Water 09 00561 g008
Figure 9. (a) Monthly rainfall and (b) temperature registered for 1982 and 2010.
Water 09 00561 g009
Figure 10. Comparison between input runoff (Qa, left) and output runoff (Qout, right) in m3/s.
Water 09 00561 g010
Table 1. General characteristics of the university campus and the sub-zone 1 (S1).
Total Surface of the University Campus298,713.29 m2100%
Surface of the sub-zone (S1)213,580 m271.5%
From this:--
Impermeable area (buildings)34,172.80 m216.0%
Impermeable area (asphalt)68,345.60 m232.0%
Permeable area (vegetated and bare soil)111,061.60 m252.0%
Length of the surface runoff (L)3039.55 m-
Slope of the surface runoff (S)0.051 (no units)-
Runoff coefficient (Rc, asphalt)0.8 (no units)-
Table 2. Descriptive analysis of the monthly hydrological variables corresponding to 1982 and 2010.
Variable19822010
Min.Max.MeanStandard DeviationMin.Max.MeanStandard Deviation
Temperature (T) [°C]2.3321.3214.00 *7.1118.8524.1621.74 *1.57
Rainfall (R) [mm]0.0053.0015.0915.050.00249.4048.8069.00
Evaporation (Ev) [mm]25.60143.7085.54 *34.2976.75174.93116.41 *30.16
Infiltration (Inf) [mm]0.0042.4012.0712.040.00199.5239.0455.20
Consumptive use (U) [mm]0.3689.1538.94 *27.7454.93117.8685.40 *20.31
Potential evapotranspiration (PEm) [mm]2.764.513.64 *0.6325.8041.5633.47 *5.28
Note: * Means significantly different in a t-Student test (p < 0.05).
Table 3. Diagonal matrix of Pearson correlations (r) of the hydrological variables of 1982.
VariableTemperature (T)Rainfall (R)Infiltration (Inf)Consumptive Use (U)Potential Evapotranspiration (PEm)Evaporation (E)Output Runoff (Qout)%Qout
Temperature (T)1.000−0.322−0.3220.945 **−0.505−0.651 *−0.376−0.339
Rainfall (R)-1.0001.000 **−0.1960.4810.3960.890 **0.942 **
Infiltration (Inf)--1.000−0.1960.4810.3960.890 **0.942 **
Consumptive use (U)---1.000−0.398−0.454−0.368−0.278
Potential evapotranspiration (PEm)----1.0000.5450.3680.456
Evaporation (Ev)-----1.0000.0860.218
Output runoff (Qout)------1.0000.951 **
%Qout-------1.000
Notes: * significant at the 0.05 level of probability; ** significant at the 0.01 level of probability.
Table 4. Diagonal matrix of Pearson correlations (r) of the hydrological variables of 2010.
VariableTemperature (T)Rainfall (R)Infiltration (Inf)Consumptive Use (U)Potential Evapotranspiration (PEm)Evaporation (Ev)Output Runoff (Qout)%Qout
Temperature (T)1.0000.0040.0040.969 **0.933 **0.831 **−0.1080.626 *
Rainfall (R)-1.0001.000 **0.1140.171−0.2490.993 **0.070
Infiltration (Inf)--1.0000.1140.171−0.2490.993 **0.070
Consumptive use (U)---1.0000.991 **0.808 **−0.0010.654 *
Potential evapotranspi-ration (PEm)----1.0000.768 **0.0590.645 *
Evaporation (Ev)-----1.000−0.359−0.601 *
Output runoff (Qout)------1.000−0.009
%Qout-------1.000
Note: * significant at the 0.05 level of probability; ** significant at the 0.01 level of probability.

