Article

Ecological and Public Health Implications of the Discharge of Multidrug-Resistant Bacteria and Physicochemical Contaminants from Treated Wastewater Effluents in the Eastern Cape, South Africa

by
Martins Ajibade Adefisoye
1,2,* and
Anthony Ifeanyin Okoh
1,2
1
SAMRC Microbial Water Quality Monitoring Centre, University of Fort Hare, Alice 5700, South Africa
2
Applied and Environmental Microbiology Research Group (AEMREG), University of Fort Hare, Alice 5700, South Africa
*
Author to whom correspondence should be addressed.
Water 2017, 9(8), 562; https://doi.org/10.3390/w9080562
Submission received: 23 March 2017 / Revised: 22 July 2017 / Accepted: 23 July 2017 / Published: 1 August 2017
(This article belongs to the Special Issue New Advances in Disinfection of Wastewater)

Abstract

:
This study assessed the prevalence of fecal indicator bacteria (FIB) and Vibrio species, as well as the physicochemical qualities of the discharged effluents of two wastewater treatment facilities, in the Eastern Cape, South Africa over a one-year sampling period using standard methods. Bacteriological assessment revealed presumptive E. coli counts ranging from 3 to 1.2 × 10⁵ CFU/100 mL, while counts of Vibrio spp. ranged from 11 to 1.4 × 10⁴ CFU/100 mL. Molecular identification of the isolates by polymerase chain reactions (PCR) yielded positive reaction rates of 76.2% (381/500) and 69.8% (279/400) for E. coli and Vibrio species, respectively. The antibiotic susceptibility profiles of 205 randomly selected PCR-confirmed Vibrio isolates against 18 antibiotics revealed resistance frequencies ranging from 0.5% (imipenem) to 96.1% (penicillin G), based on recommended breakpoint concentrations. About 81% (166/205) of the Vibrio isolates exhibited multidrug resistance (resistance to three or more classes of antibiotics), while nine different antibiotic resistance genes were detected by PCR. The physicochemical qualities of the effluents also ranged as follows: pH (6.5–7.6), temperature (12–27 °C), turbidity (1.5–65.7 mg/L), total dissolved solids (95–171 mg/L), dissolved oxygen (2.1–9.8), electrical conductivity (134–267 µS/cm), free chlorine (0.08–0.72 mg/L), biochemical oxygen demand (0.12–9.81 mg/L), nitrate (1.04–21.5 mg/L), nitrite (0.11–0.76 mg/L), phosphate (1.03–18.3 mg/L) and chemical oxygen demand (27–680 mg/L). The discharged effluents fell short of the regulatory guidelines for some of the parameters assessed. We conclude that the discharged effluents are potential sources of environmental pollution and can contribute to drug resistant bacteria load in the receiving watershed, with the associated ecological and human health risks.

1. Introduction

Lack of access to clean and safe water and adequate sanitation continues to pose a major threat to human health. On a global scale, diarrhoea is estimated to be responsible for one in nine child death cases; making diarrhoea the second leading cause of child mortality [1,2]. The fatality rate has been reported to be about 11 times higher among children living with human immunodeficiency virus (HIV), mostly in developing countries [2]. An estimated 88% of diarrhoea disease burden is directly linked to unsafe water, sanitation and hygiene [3].
Human and animal fecal matters from wastewater are major sources of enteropathogenic microbes in freshwater environments [4]. Numerous species of enteric pathogens capable of causing viral, bacterial and parasitic infections may be present in environmental water, including discharged wastewater effluents, and at least one novel enteric pathogen has been discovered each year over the past decades [5]. The array and number of pathogens that may be present in municipal wastewater differ with the levels of prevalent diseases in the community, commercial and industrial discharges, and seasonal factors [6]. Concerns about health risks associated with the discharge of inadequately treated wastewater effluents that may harbor antimicrobial resistant pathogens and other biological and chemical contaminants into the environment have renewed awareness in the effects of treatments on microbial pathogens [6,7].
The discovery of penicillin, and subsequently other classes of antibiotics, remains one of the hallmarks of breakthrough in medicine and disease control of the twentieth century, and has helped revolutionised biomedical care in many respects. Antibiotics have been administered for prophylactic, therapeutic and metaphylactic purposes. Some diseases that were previously considered dreadful for centuries have been successfully treated or controlled by means of antibiotics [8]. In addition, antibiotics have also been used extensively at subtherapeutic levels as growth promoter/feed enhancer in livestock farming, most especially in the industrialised nations, including many European countries and the United States of America [9,10,11,12]. However, the spontaneous emergence and spread of antibiotic resistance, coupled with diminished numbers of novel antibiotics, has threatened the feat of antibiotics in modern medicine, and induced the fear of a possible post-antibiotic era [13]. The extraordinary genetic capabilities of many pathogenic microorganisms have benefited from the overuse of antibiotics in clinical, agricultural and community settings [14]. The evolution and proliferation of resistance in microorganisms has been on the rise in recent years, largely because of increased selective pressure. This presents a serious challenge worldwide, with severe implications for morbidity and mortality both in clinical and community settings. Wastewater treatment facilities are significant “hotspots” for the emergence and spread of clinically important antibiotic resistant genes [15,16]. Antibiotics and other pharmaceuticals residues have been detected in municipal effluents worldwide. Contemporary wastewater treatment facilities are not designed to remove them from treated effluents. Thus, they are released into the environment [17,18], adding to the selective pressure for the evolution of antibiotic resistance among environmental microorganisms. The potential of bacteria to acquire and transfer antibiotic resistance via exchange of genetic materials either by vertical or horizontal gene transfer presents a significant threat to human health.
Fecal indicator bacteria (FIB) are still largely used for water quality monitoring purposes [19]. However, their abundance may be a feeble indicator of pathogens in environmental waters. Efficient treatment processes, coupled with tertiary treatment steps such as disinfection, can reduce the pathogen loads and other physicochemical contaminants such as biochemical oxygen-demanding substances and nutrient contents, in order to protect human health and the freshwater ecosystems from pollution [20]. E. coli, Shigella, Salmonella and Vibrio spp. have been the predominant pathogens linked to waterborne outbreaks in Africa [21,22], whereas certain clonal strains of these pathogens have been reported to survive conventional wastewater treatment processes [23,24,25,26].
Poor management and maintenance (i.e., inefficient operational, poor design, lack of expertise, inefficient monitoring and poor documentation of compliance, among others) of many existing wastewater treatment facilities remains a concern and often leads to the discharge of poorly treated effluents into the aquatic environments in most developing countries, such as South Africa, with its attendant ecological and public health risks [27,28]. This study is therefore designed to assess the physicochemical qualities and the prevalence of FIB (E. coli) and Vibrio species in the discharged effluents of two wastewater treatment plants in Eastern Cape, South Africa, with particular interest in the release of multidrug-resistant Vibrios species into the aquatic environment, and their associated ecological and public health implications.

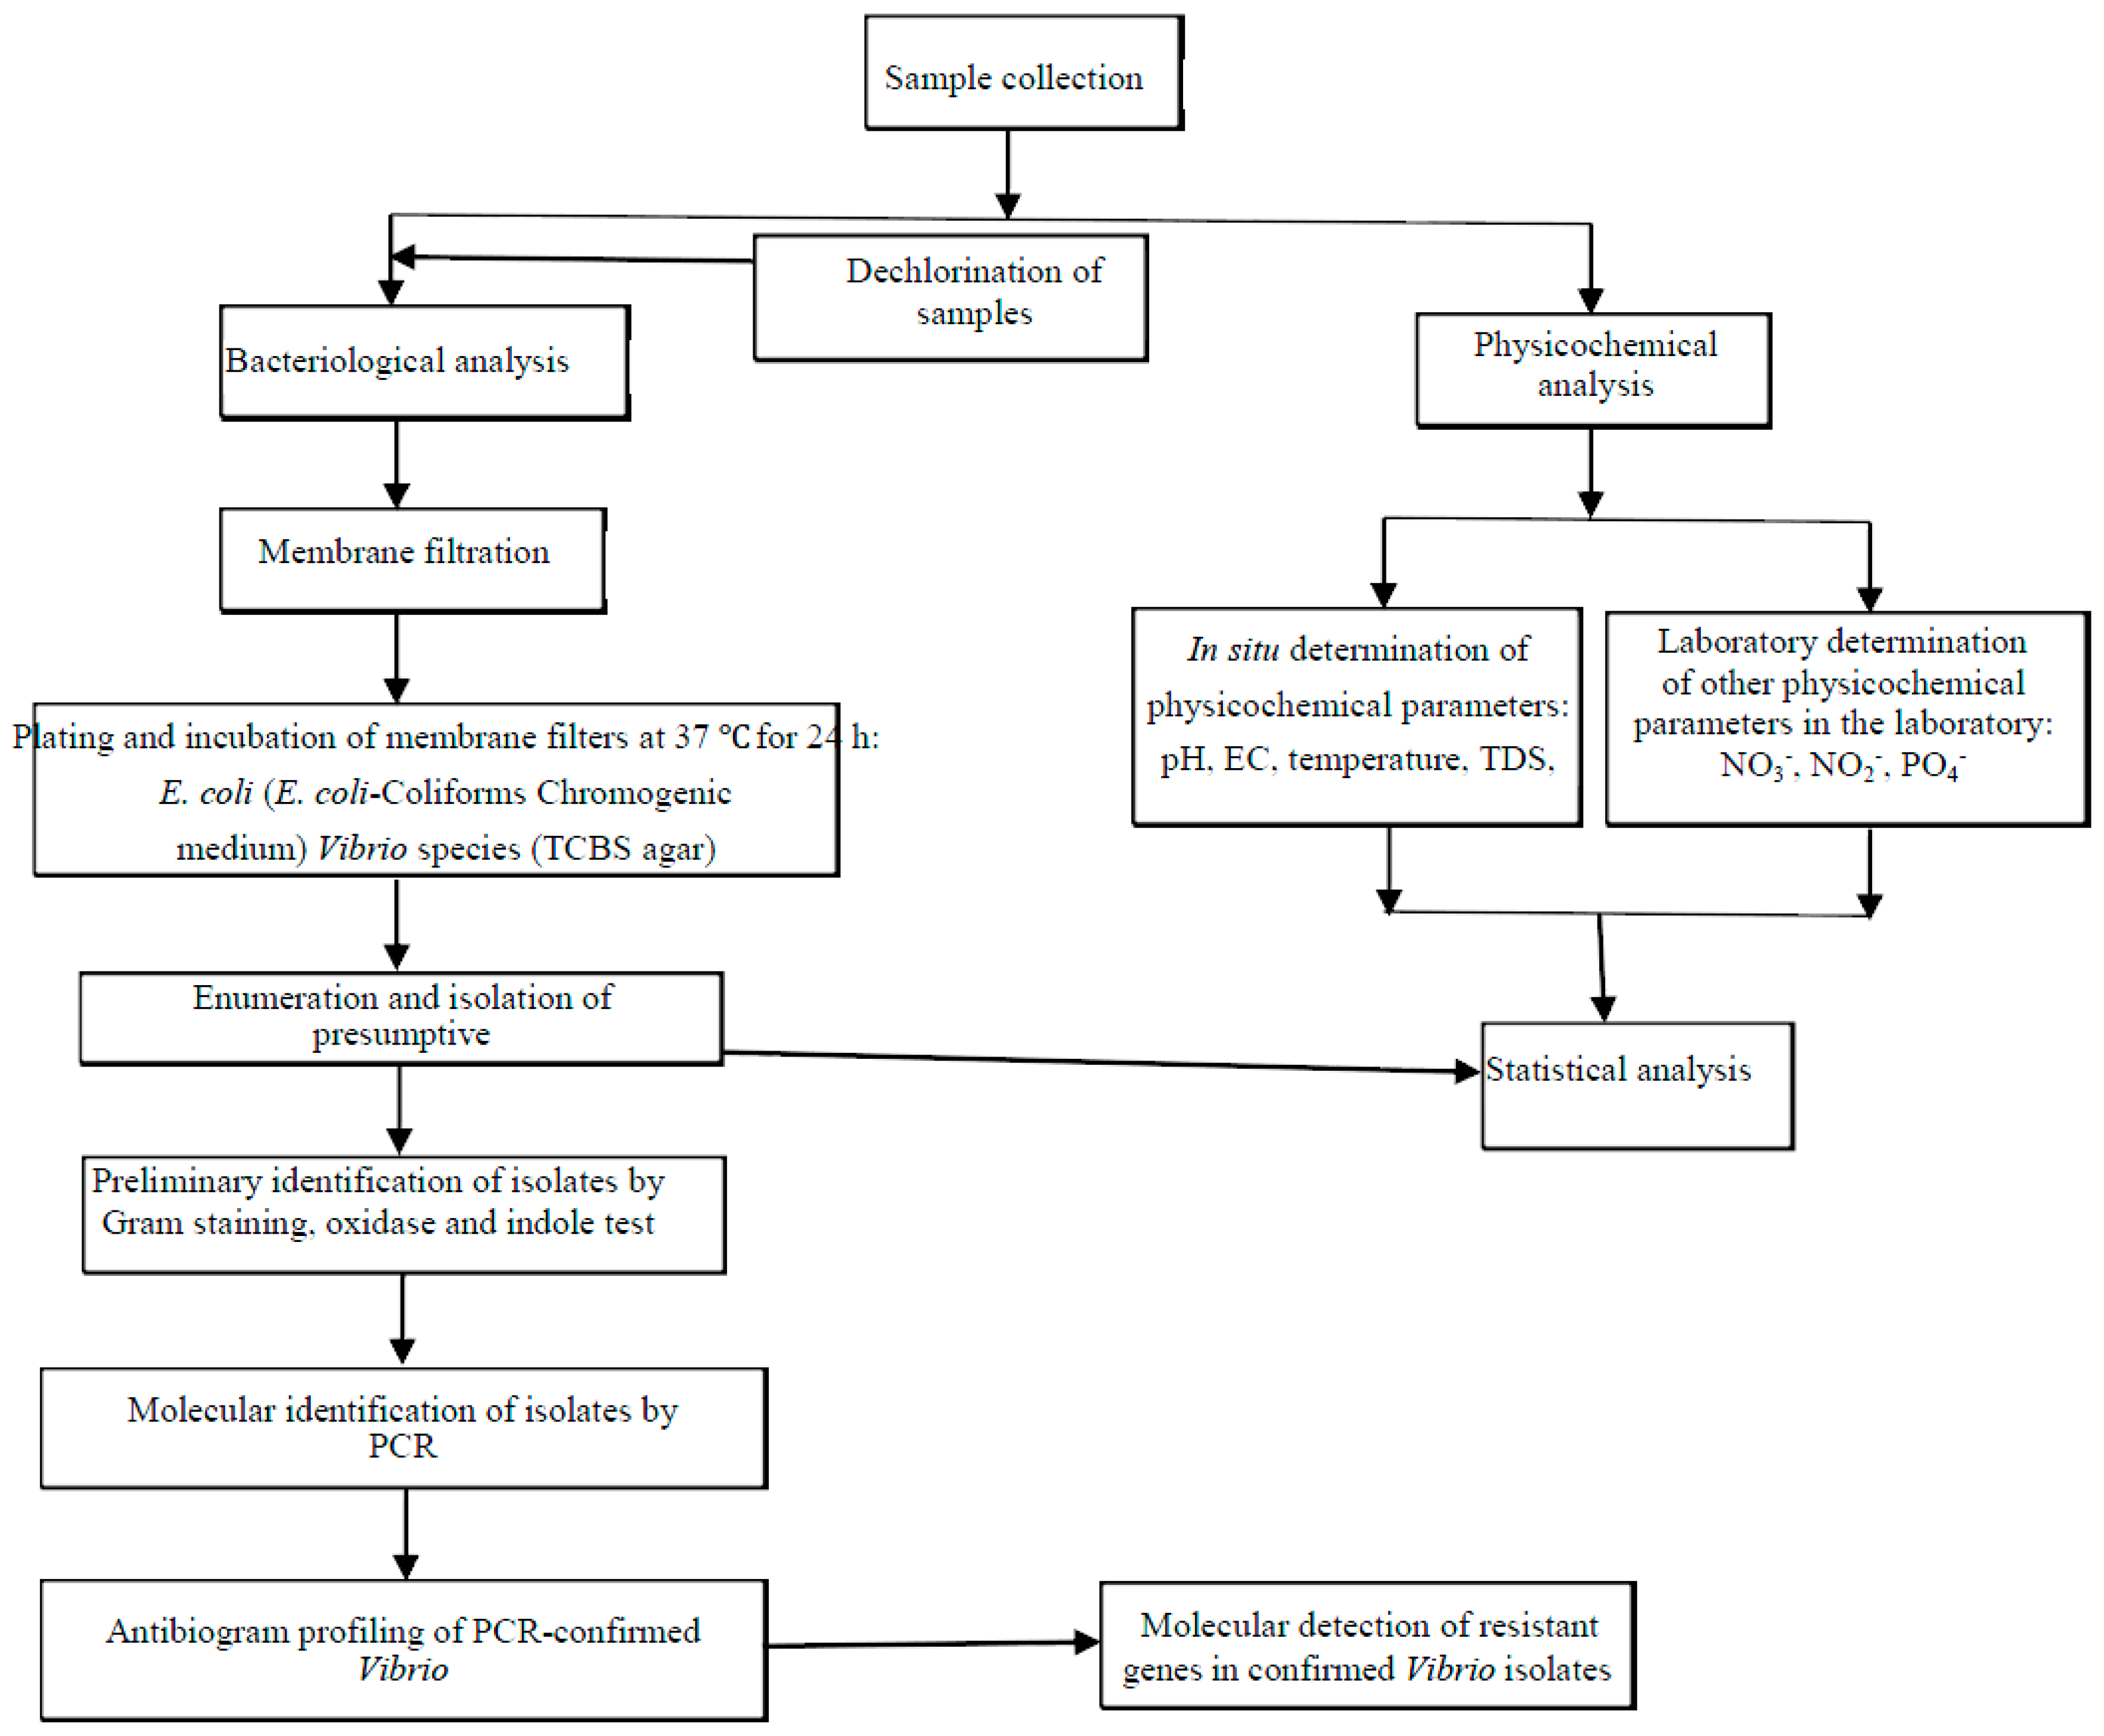
2. Materials and Methods
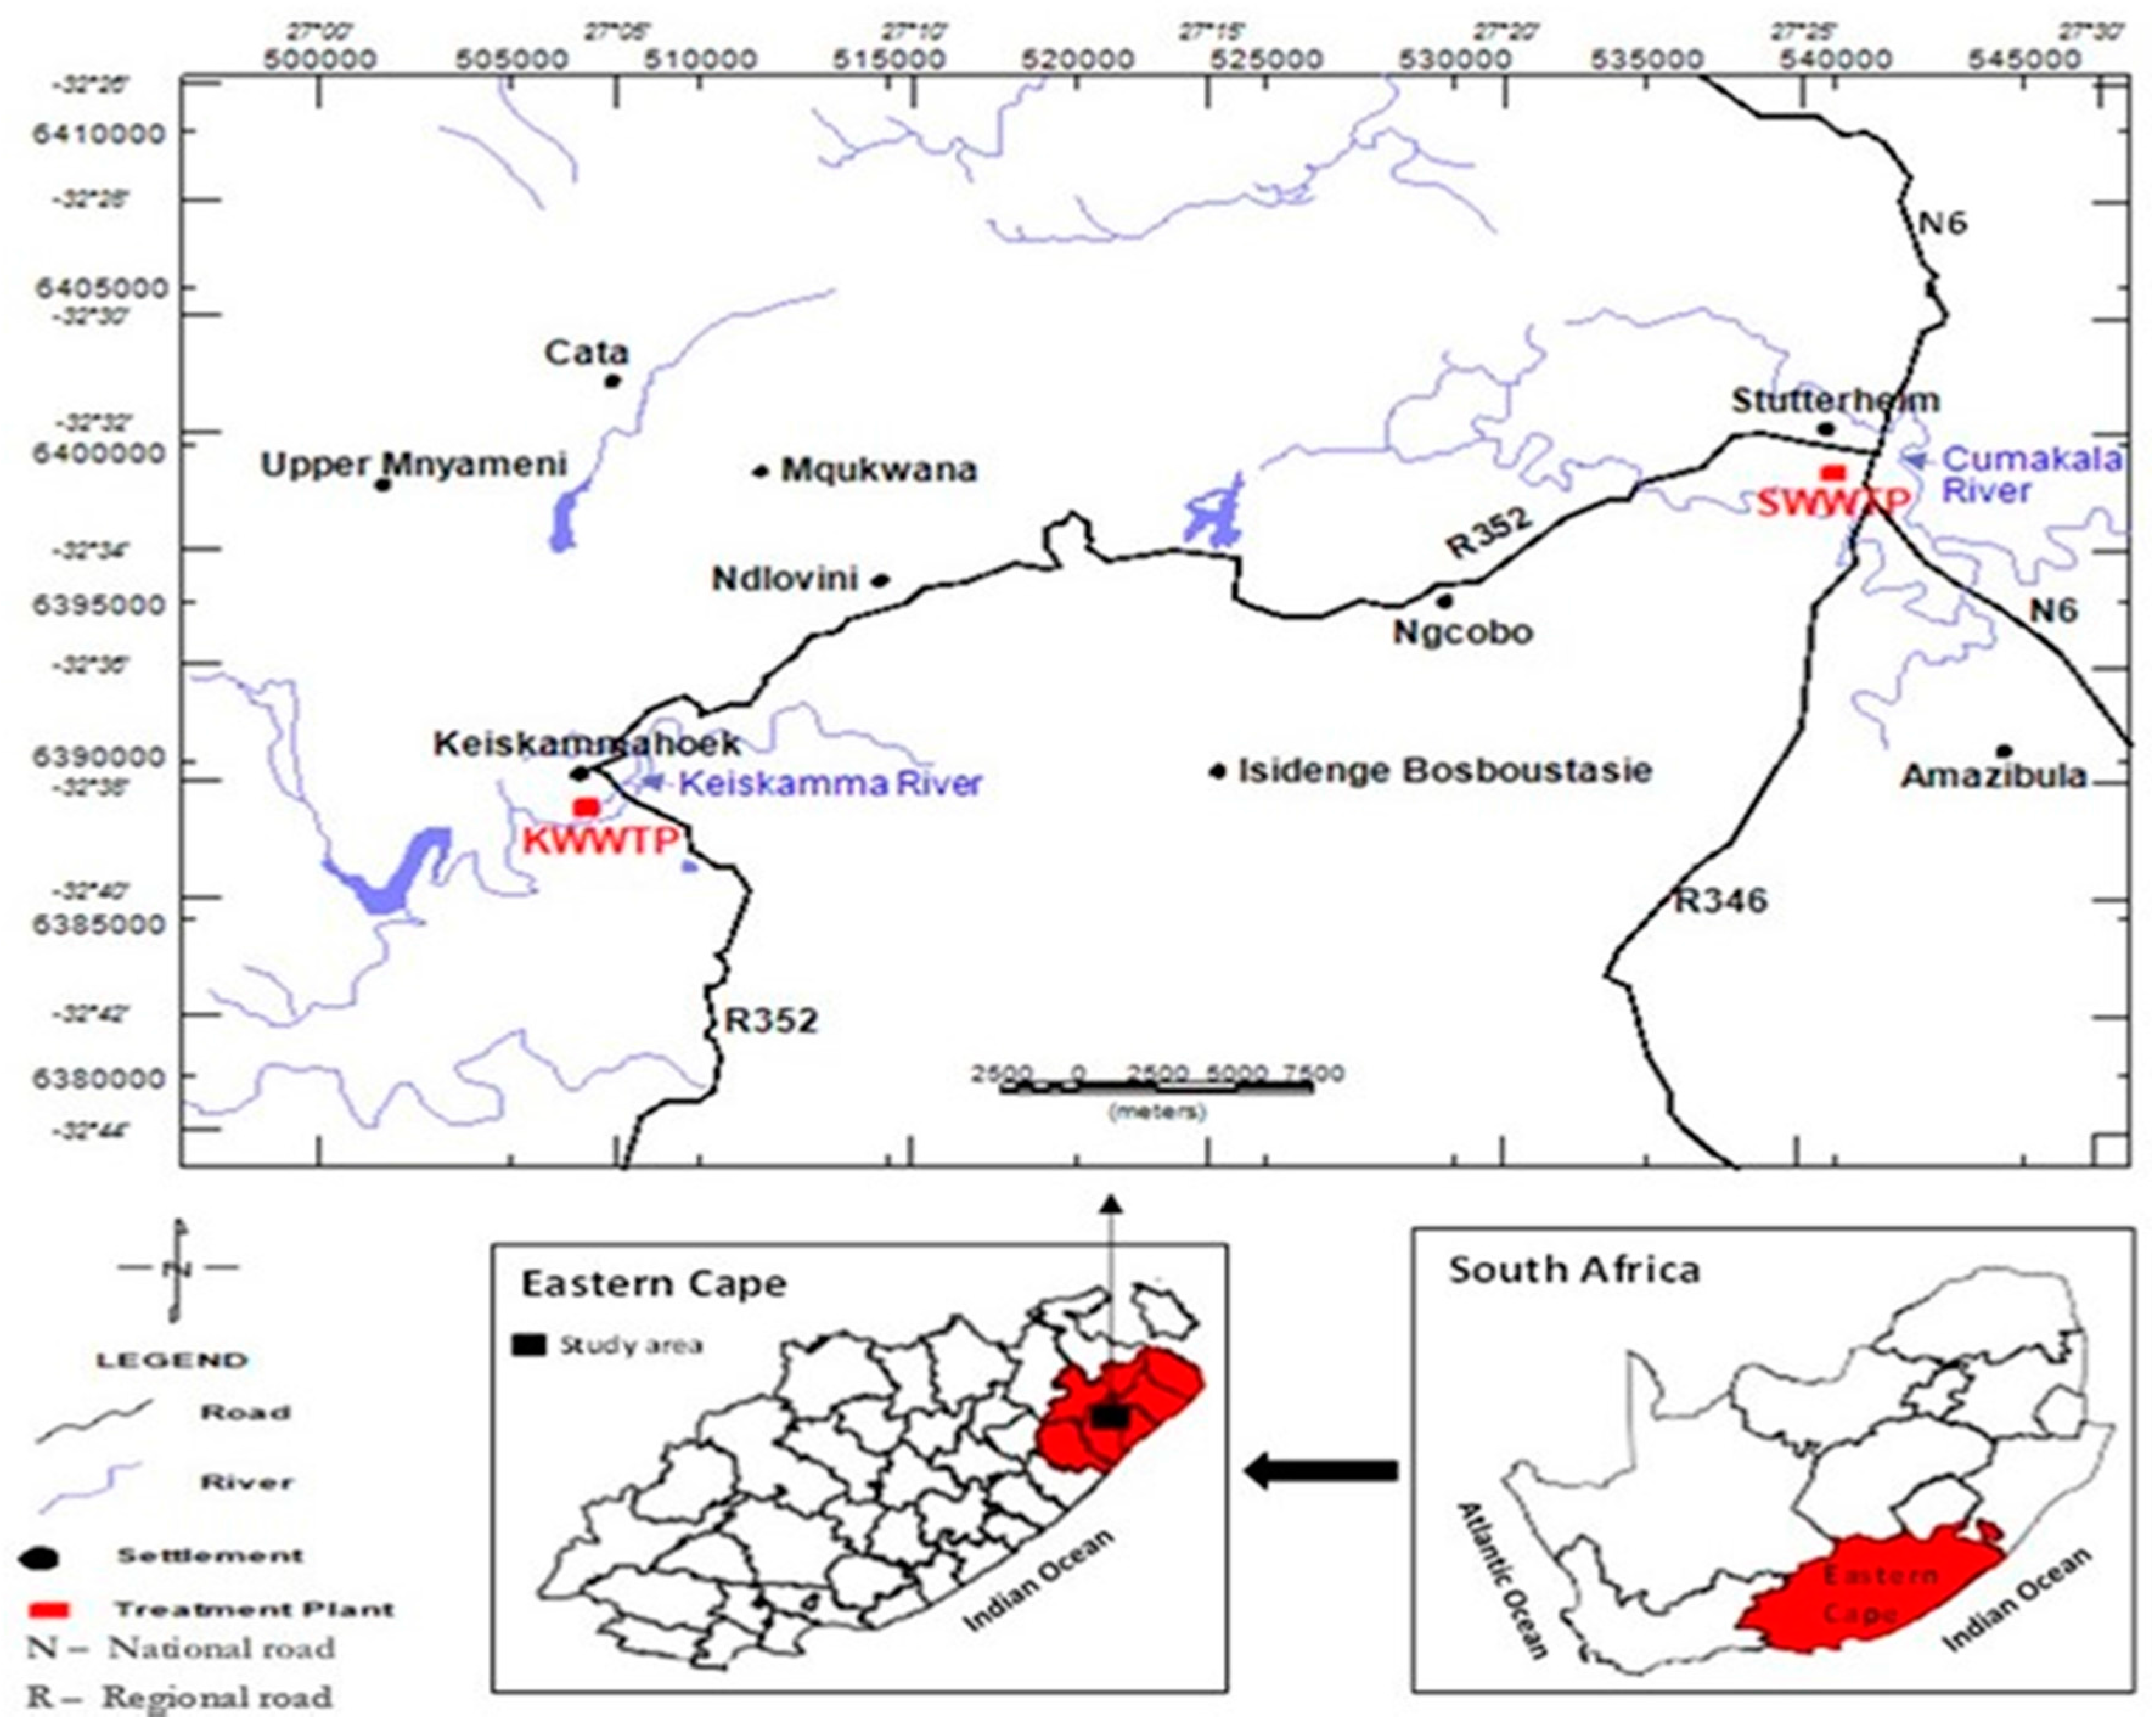
2.1. Study Area

South Africa is a relatively dry country due to its very low average rainfall per annum [29]. Other factors, such as climatic change and water pollution, exacerbate the problem of water scarcity in the country. The relatively little amount of water available [30] causes many communities to rely on untreated surface and ground water sources for their immediate water needs. The treatment plants selected for the study are located within the geographical coordinates 32°34′17″ S, 27°26′95″ E (designated as S-wastewater treatment plant; SWWTP for confidential reasons) and 32°41′31″ S, 27°08′36″ E (designated as K-wastewater treatment plant; KWWTP) (Figure 1). SWWTP is a medium-scale plant that receives sewage from Stutterheim town and the environs. There are some medium-scale commercial and industrial activities around the location of the treatment plant, while KWWTP receives predominantly domestic wastewater as well as effluents from commercial farming activities. The two plants are located in the Amahlathi Local Municipality within the Eastern Cape Province, with an estimated population of about 122,778 according to the 2011 South African nation census.

2.2. Study Design and Sample Sources

Forty eight wastewater final effluent samples were collected in replicates over a 12-month sampling period (September 2012–August 2013) from two wastewater treatment plants located in the Eastern Cape, South Africa. Both plants use the activated sludge and drying beds technology and disinfect their final effluents by chlorination before discharging into the receiving rivers, respectively. Some physicochemical parameters including pH, electrical conductivity (EC), temperature and total dissolved solids (TDS) were measured in situ using a Crison Multimeter MM40. Dissolved oxygen (DO), turbidity and free chlorine were also determined in situ using an HQ40d BOD meter (HACH Company, Loveland, CO, USA), a microprocessor turbidity (HACH Company, model 2100P) and a free and total ion specific meter (model HI 93711, Hanna instrument, Woonsocket, RI, USA ), respectively, while orthophosphate (PO4), nitrate (NO3), nitrite (NO2) and chemical oxygen demand (COD) were determined by standard photometric methods, using a UV/Vis spectrophotometer (Spectroquant Pharo 100, Merck Pty Ltd., Darmstadt, Germany). Biochemical oxygen demand (BOD) was determined using the HACH BOD meter (HACH Company, model 2943900) and following BOD5 description of [31]. Samples for bacteriological analysis were collected aseptically using sterile 1.7 L screw-capped Naglene bottles in replicates. The samples were de-chlorinated by adding 1 mL of 10% sodium thiosulphate and then transported in cooler boxes to the Applied Environmental Microbiology Research Group (AEMREG) laboratory at the University of Fort Hare, South Africa for analysis within 6 h of collection. Figure 2 below shows the summary of workflow for the study.

2.3. Bacteriological Analysis

Enumeration of E. coli and Vibrio spp. was done by membrane filtration techniques according to APHA-AWWA-WEA [31]. Presumptive E. coli densities were detected on E. coli-Coliforms Chromogenic medium (Laboratorios CONDA, Madrid, Spain) incubated at 37 °C for 24 h, while total presumptive Vibrios were enumerated on thiosulfate-citrate–bile salt-sucrose (TCBS) agar (Laboratorios CONDA, Madrid, Spain) and incubated at 37 °C for 24 h. All analyses were carried out in triplicate and reported as mean CFU/100 mL. Purified colonies of the presumptive bacteria isolates were picked randomly and subjected to preliminary identification (gram staining, oxidase and indole test). For E. coli, gram-negative, oxidase-negative and indole-positive isolates were selected while gram-negative, oxidase and indole-positive Vibrio isolates were selected and preserved in 20% glycerol stock at −80 °C for further analysis.

2.4. Molecular Identification of Presumptive E. coli and Vibrio spp.

The identities of the presumptive isolates were confirmed by polymerase chain reactions (PCR) using specific oligonucleotide primers. Bacterial DNA was extracted following the description of Queipo-Ortuno et al. [32] with modifications. Briefly, two to three discrete colonies from 18 h growth cultures were picked and suspended in 200 µL of nuclease-free water in 1.5 mL microcentrifuge tubes, and boiled for 10 min. The tubes were cooled on ice, and centrifuged at 13,500 rpm for 10 min. 5 µL of the supernatants were used directly as template for PCR assays. E. coli isolates were identified by amplifying the housekeeping uidA (β-D glucuronidase) gene [33], while the presumptive Vibrio isolates were identified to the genus level by targeting the variable regions between position 700 and 1325 of the 16SrRNA gene [34]. The PCR assays were carried out using a MyCycler™ thermal cycler, in final reaction volumes of 25 µL, containing 5.0 µL of bacterial DNA template and 20.0 µL reaction ‘cocktail’ (12.5 µL of 2X PCR Master Mix (Thermo Scientific Inc., Waltham, MA, USA), 1.0 µL each of forward and reverse primers (10 picomole), and 5.5 µL of nuclease-free water). Reference strains ATCC 29522 and DSM 19283 were included in the assays for E. coli and Vibrio identification, respectively. Table S1 in the supplemental information shows the primer sequences and PCR conditions used in the study.

2.5. Antibiotic Resistance Profiling of the PCR-Confirmed Vibrio spp. Isolates

Antibiotic susceptibility profiling of the PCR-confirmed Vibrio isolates was done by standard disc diffusion method, following the description of the Clinical and Laboratory Standards Institute (CLSI) [35]. The susceptibility/resistance of the isolates was evaluated against 18 commercial antibiotic discs (Mast Diagnostics, Merseyside, United Kingdom). The antibiotic selection was based on some drugs used in the treatment of Vibriosis and other Vibrio-related diseases, as well as some used in veterinary medicine. These include ampicillin (AP) 25 µg, amikacin (AK) 30 µg, imipenem (IMI) 10 µg, meropenem (MEM) 10 µg, streptomycin (S) 10 µg, chloramphenicol (C) 10 µg, ciprofloxacin (CIP) 5 µg, nalidixic (NA) 30 µg, tetracycline (T) 30 µg, trimethoprim (TM) 5 µg, norfloxacin (NOR) 10 µg, sulfamethoxazole (SMX) 25 µg, gentamycin (GM) 120 µg, neomycin (NE) 10 µg, penicillin G (PG) 10 units, nitrofurantoin (NI) 300 µg, polymyxin B (PB) 300 units and cefuroxime (CFX) 30 µg. The CLSI interpretative chart was used to determine the susceptibility/resistance of the test isolates by comparing the diameter of the zones of inhibition of the isolates against the test antibiotics [32]. Multiple antibiotic resistance phenotypes (MARP) profiles were generated for the isolates exhibiting resistance to three or more test antibiotics, while the estimation of multiple antibiotic resistance indices (MARI) for the multidrug-resistant isolates were estimated for the two sampling sites by the formula previously described by Krumperman [36] to assess the health risk of such isolates to the environment. The formula is given as: MAR index (MARI) = a/(b × c); where, a = the aggregate antibiotic resistance score of isolates, b = number of antibiotics, and c = number of isolates.

2.6. Molecular Detection of Antibiotic Resistance Genes in PCR-Confirmed Vibrio spp. Isolates

The occurrence of resistance genes in the Vibrio isolates showing resistance to the different classes of test antibiotics were profiled using PCR with specific oligonucleotide primers. Ten resistance genes, including blaTEM, blaSHV, blaZ, blaCTX-M, aadA, strA, tetA, tetB, tetK and tetM, were assayed by means of singleplex PCR. The sequences of the oligonucleotide primers, the cycling protocols and the product sizes are given in Table 1. Five microliter (5 µL) of the PCR products were resolved using electrophoresis on 1.5% agarose gel stained with 0.5 mg/L ethidium bromide with 0.5X TBE (Tris-borate-EDTA) buffer and visualized under the BioDoc-It ultraviolet transilluminatore (UVP Upland, CA, USA).

2.7. Statistical Analysis

Data analysis was done using descriptive and inferential statistical tools. The calculation of means and standard deviations were performed using one-way ANOVA (IBM SPSS 22.0 version for Windows program, Armonk, NY, USA). The paired-samples t-test and the ANOVA F-test were used for tests of significance, while the coefficients of correlation among the physicochemical parameters and the bacteria densities were determined using the Pearson correlations procedure. All statistical significance was set at p values < 0.05.

3. Results

3.1. Physicochemical Characteristics

The results of the physicochemical qualities evaluated are shown in Table 1 and Table 2 for SWWPT and KWWTP, respectively. The monthly variations in physicochemical qualities assessed over the sampling period are shown for both treatment plants. The parameters were generally compared to the regulatory guidelines for treated effluents discharged into surface water in South Africa (Table S2, supplemental information), while international regulatory standards were adopted where such standards do not exist in the current South African regulatory documents.
At SWWTP, the pH of the effluent samples ranged 6.7–7.6, while it ranged 6.5–7.4 at KWWTP. The pH values from both treatment plants were statistically significant at p < 0.05, and these values were within the recommended limits for discharged effluents throughout the sampling period. The temperature regime for the samples at both study sites ranged 12–27 °C. The temperature profiles were also within the recommended limits, and were statistically significant at p < 0.05 or p < 0.01. Higher temperature values were generally recorded during the summer months, contrary to the low values in winter.
Similarly, TDS and EC levels at both plants complied with the regulatory limits for discharged effluents, and ranged as 95–171 mg/L and 134–267 µS/cm, respectively. The TDS concentrations at SWWTP were insignificant at p < 0.05, whereas values were statistically significant at KWWTP.
The turbidity profile varied significantly (p < 0.05) at both study sites, and range from 1.5 to 24.70 NTU at SWWTP, and from 6.13 to 65.70 NTU at KWWTP. There is no limit specified for turbidity in discharged effluents in South Africa. However, when compared to the World Health Organisation limit of <5 NTU, about 50% of the discharged effluent at SWWTP did not comply, while all effluents (100%) were above this limit at KWWTP.
The dissolved oxygen in the discharged effluents range was 4.2 to 8.6 mg/L at SWWTP, and 2.1–9.8 mg/L at KWWTP. The statistical significance of the DO levels in the effluents was not tested, because the DO concentrations of the influents were not determined. The determination of BOD5 showed ranges from 0.13 to 8.43 mg/L and from 0.19 to 9.81 at SWWTP and KWWTP, respectively. The BOD5 measurements at both treatment plants did not vary significantly (p < 0.05). The chemical oxygen demand values at SWWTP ranged 27–680 mg/L, with the highest COD levels in September, and the lowest in April. About 66.7% of the sample analyzed at the site exceeded the recommended limit for discharged effluents, while the COD level was insignificant at p < 0.05. At KWWTP, the COD concentrations ranged 32–650 mg/L. Approximately 91.7% of the effluent samples analysed at the site had COD concentrations above the general recommended limit of 75 mg/L for effluent discharged into surface water. The highest COD concentration at the site was recorded in November, while the lowest concentration was in December. Statistically, the COD level at the site was significant at 95% confidence limit (p = 0.000).
The free chlorine concentrations of the effluents varied widely, and ranged 0.08–0.72 mg/L over the sampling period at both treatment plants. At SWWTP, the concentration of free chlorine ranged from 0.10 to 0.49 mg/L, while the concentrations ranged from 0.08 to 0.72 mg/L at KWWTP. At p > 0.05, the chlorine concentrations at both treatment plants were statistically significant, with 66.7% of the samples from SWWTP having free chlorine concentrations below the DWA recommended limit of 0.25 mg/L, while 50% of samples from KWWTP had concentrations below the limit. Higher levels of free chlorine concentrations above the recommended limit were mostly observed in the discharged effluents from KWWTP (Table 3).
At SWWTP, the concentrations of nitrate, nitrite and orthophosphate in the discharged effluents ranged as 1.04–8.10 mg/L, 0.11–0.76 mg/L and 1.03–16.10 mg/L, respectively. The values were statistically significant at p < 0.05. The concentrations of nitrate and nitrite at the site were within the general permissible limits of 15 mg/L throughout the sampling period, while 25% of the samples had orthophosphate concentrations above the 10 mg/L for discharge effluents. Also at KWWTP, the nitrite concentrations complied with the recommended general limit, while 33.3% of the samples had nitrate concentrations above the general permissible limit. Similarly, 33.3% of the samples from this site had orthophosphate levels above the recommended limit of 10 mg/L for discharged effluents.
Seasonally, statistical analysis (p > 0.05) showed no significant variations in pH of the effluents across the four seasons (spring: September, October, November; summer: December, January, February; autumn: March, April, May; winter: June, July, August) at both treatment plants. Similarly, other physiochemical parameters, such as total dissolved solids and electrical conductivity, did not vary significantly at both study sites during the study period. On the other hand, effluent temperature varied significantly among the seasons at both treatment plants. As expected, the lowest temperatures were recorded during the winter months, while the highest temperatures were recorded during summer months at both study sites. Both the turbidity and dissolved oxygen concentrations of the effluents exhibited similar trends seasonally and did not vary significantly (p > 0.05) among the seasons at KWWTP, while they did vary among the seasons at SWWTP. Chemical oxygen demand showed a contrasting trend with high seasonal variation at KWWTP, while they did not vary significantly at SWWTP.

3.2. Prevalence of E. coli and Vibrio Species

The prevalence and distribution of E. coli and Vibrio species varied widely, and both bacterial groups were detected at both treatment plants over the sampling period, as shown in Table 3. Presumptive E. coli and Vibrio species were detected in all the samples analyzed, with counts generally ranging from 3 to 1.2 × 10⁵ CFU/100 mL and from 11 to 1.4 × 10⁴ CFU/100 mL, respectively. At SWWTP, the presumptive E. coli counts ranged 23 and 1.2 × 10⁵ CFU/100 mL, with 41.7% of the samples having counts above the permissible general limit of 103 CFU/100 mL of fecal coliforms for discharged effluent into surface water. The presumptive Vibrio counts at this site ranged between 11 and 2.1 × 10³ CFU/100 mL, while 16.7% of the sample had counts above the 103 CFU/100 mL limit. Similar at KWWTP, the counts of presumptive E. coli ranged between 3 and 7.1 × 10³ CFU/100 mL, while presumptive Vibrio species had counts ranging from 14 to 1.4 × 10⁴ CFU/100 mL. About 33.3% of the samples at KWWTP had E. coli counts above the recommended limit of 103 CFU/100 mL, while 25% of the samples had Vibrio counts above this limit. The E. coli and Vibrio species densities at the two treatment plants were statistically significant at p < 0.05 for the set limit of 103 CFU/100 mL for fecal coliforms in discharged effluents.
The seasonal distribution of the target bacteria varied significantly (p < 0.05). The highest seasonal means of presumptive Vibrio counts were observed in spring (September, October and November), with average counts of 9.8 × 10² CFU/100 mL and 5.0 × 10³ CFU/100 mL at SWWTP and KWWTP, respectively. The seasonal mean of E. coli count was also highest in spring at KWWTP (3.6 × 10³ CFU/100 mL), while it was highest in winter (June, July and August) at SWWTP, with a mean value of 4.2 × 10⁴ CFU/100 mL. Conversely, the lowest seasonal mean of presumptive E. coli (2.2 × 10² CFU/100 mL) and Vibrio spp. (1.3 × 10² CFU/100 mL) were observed in summer (December, January and February) at KWWTP, while at SWWTP, the lowest seasonal mean of E. coli (9.9 × 10³ CFU/100 mL) and Vibrio spp. (4.2 × 10² CFU/100 mL) were observed in autumn (March, April and May) and summer, respectively. There appears to be a slight seasonal trend in the distribution of the two bacterial groups assessed at KWWTP, with the highest counts generally occurring in spring. However, at SWWTP, no consistent seasonal trend exists. ANOVA F-test showed no significant difference (p < 0.05) in the seasonal mean of bacterial counts at SWWTP, while there was slight variation in the seasonal means at KWWTP.
The statistical relationships among physicochemical and microbiological parameters revealed a positive significant correlation between pH and each of nitrate (r = 0.313; p < 0.01) and DO (r = 0.537; p < 0.01) while TDS (r = −0.359; p < 0.01), EC (r = −0.360; p < 0.01), temperature (r = −0.180; p < 0.05), turbidity (r = −0.215; p < 0.01), free chlorine (r = −0.206; p < 0.05) and COD (r = −0.258; p < 0.01) were inversely correlated to pH. TDS showed a positive linear relationship with EC (r = 1.000; p < 0.01). TDS also showed a positive correlation with turbidity (r = 0.417; p < 0.01), nitrite (r = 0.170; p < 0.05) and COD (r = 0.261; p < 0.01), while it was inversely correlated with DO (r = −0.332; p < 0.01). The temperature of the samples positively correlated with turbidity (r = 0.220; p < 0.01), BOD5 (r = 0.212; p < 0.05) and PO4 (r = 0.344; p < 0.01) while it showed an inverse correlation with dissolved oxygen DO (r = −0.392; p < 0.01), nitrate (r = −0.329; p < 0.01) and COD (r = −0.283; p < 0.01). Turbidity of samples in the study exhibited positive correlation with BOD (r = 0.285; p < 0.01), nitrate (r = 0.353; p < 0.01), nitrite (r = 0.189; p < 0.05) and COD (r = 0.416; p < 0.01), while it exhibited an inverse correlation with DO (r = −0.021; p < 0.05). The statistical analysis showed a weak linear relationship between pH and E. coli (r = 0.175; p < 0.01) and Vibrio (r = 0.253; p < 0.05) densities, while turbidity showed a moderately linear relationship with Vibrio (r = 0.431; p < 0.05) density. Dissolved oxygen also showed a weak inverse relationship with Vibrio density (r = −0.327; p < 0.05), while DO concentration did not show any significant relationship with the density of E. coli at p < 0.05.

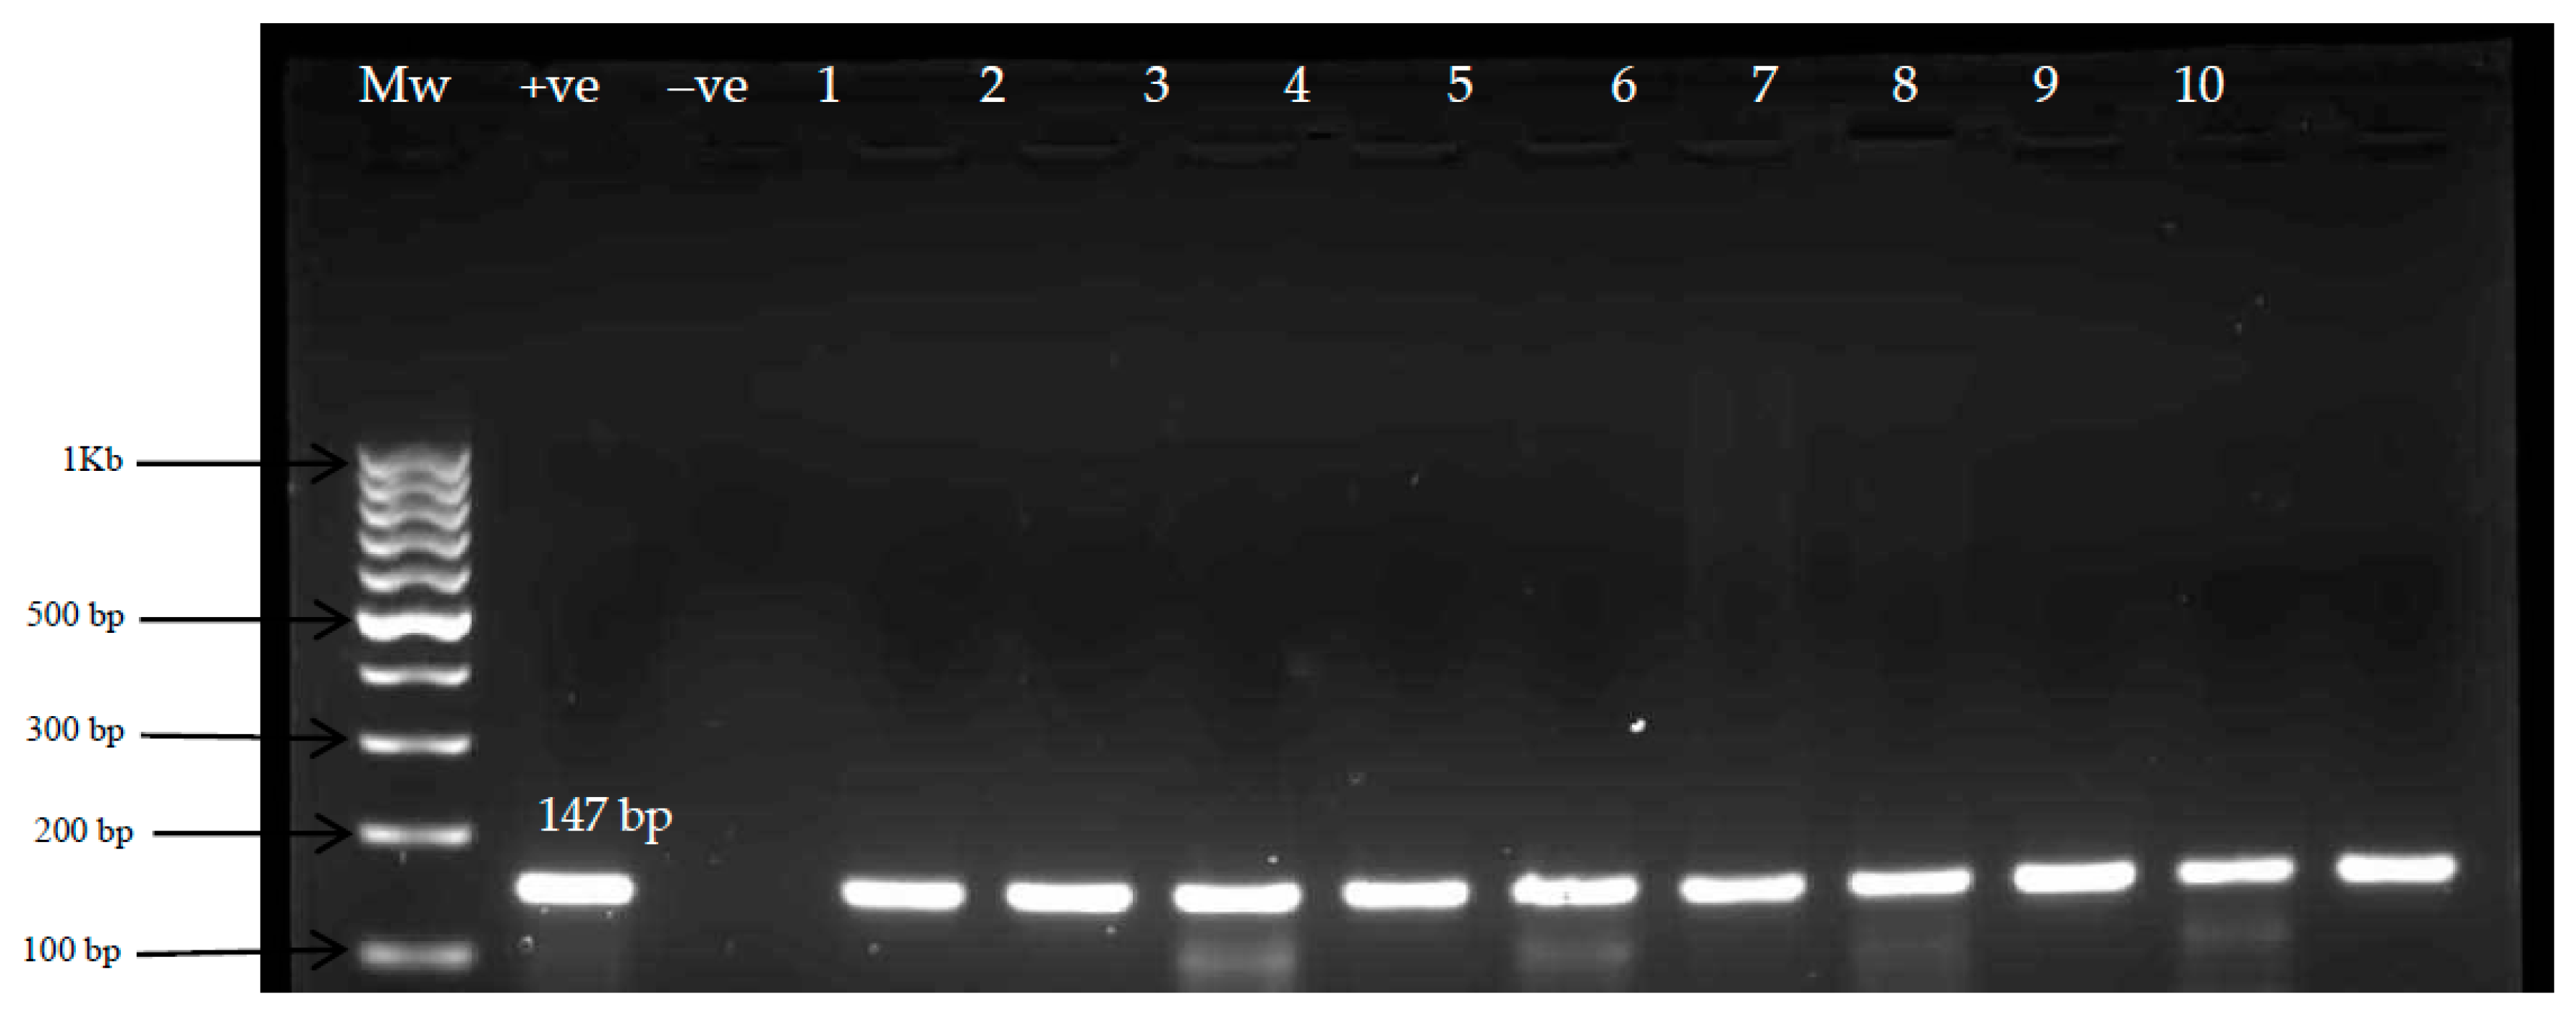
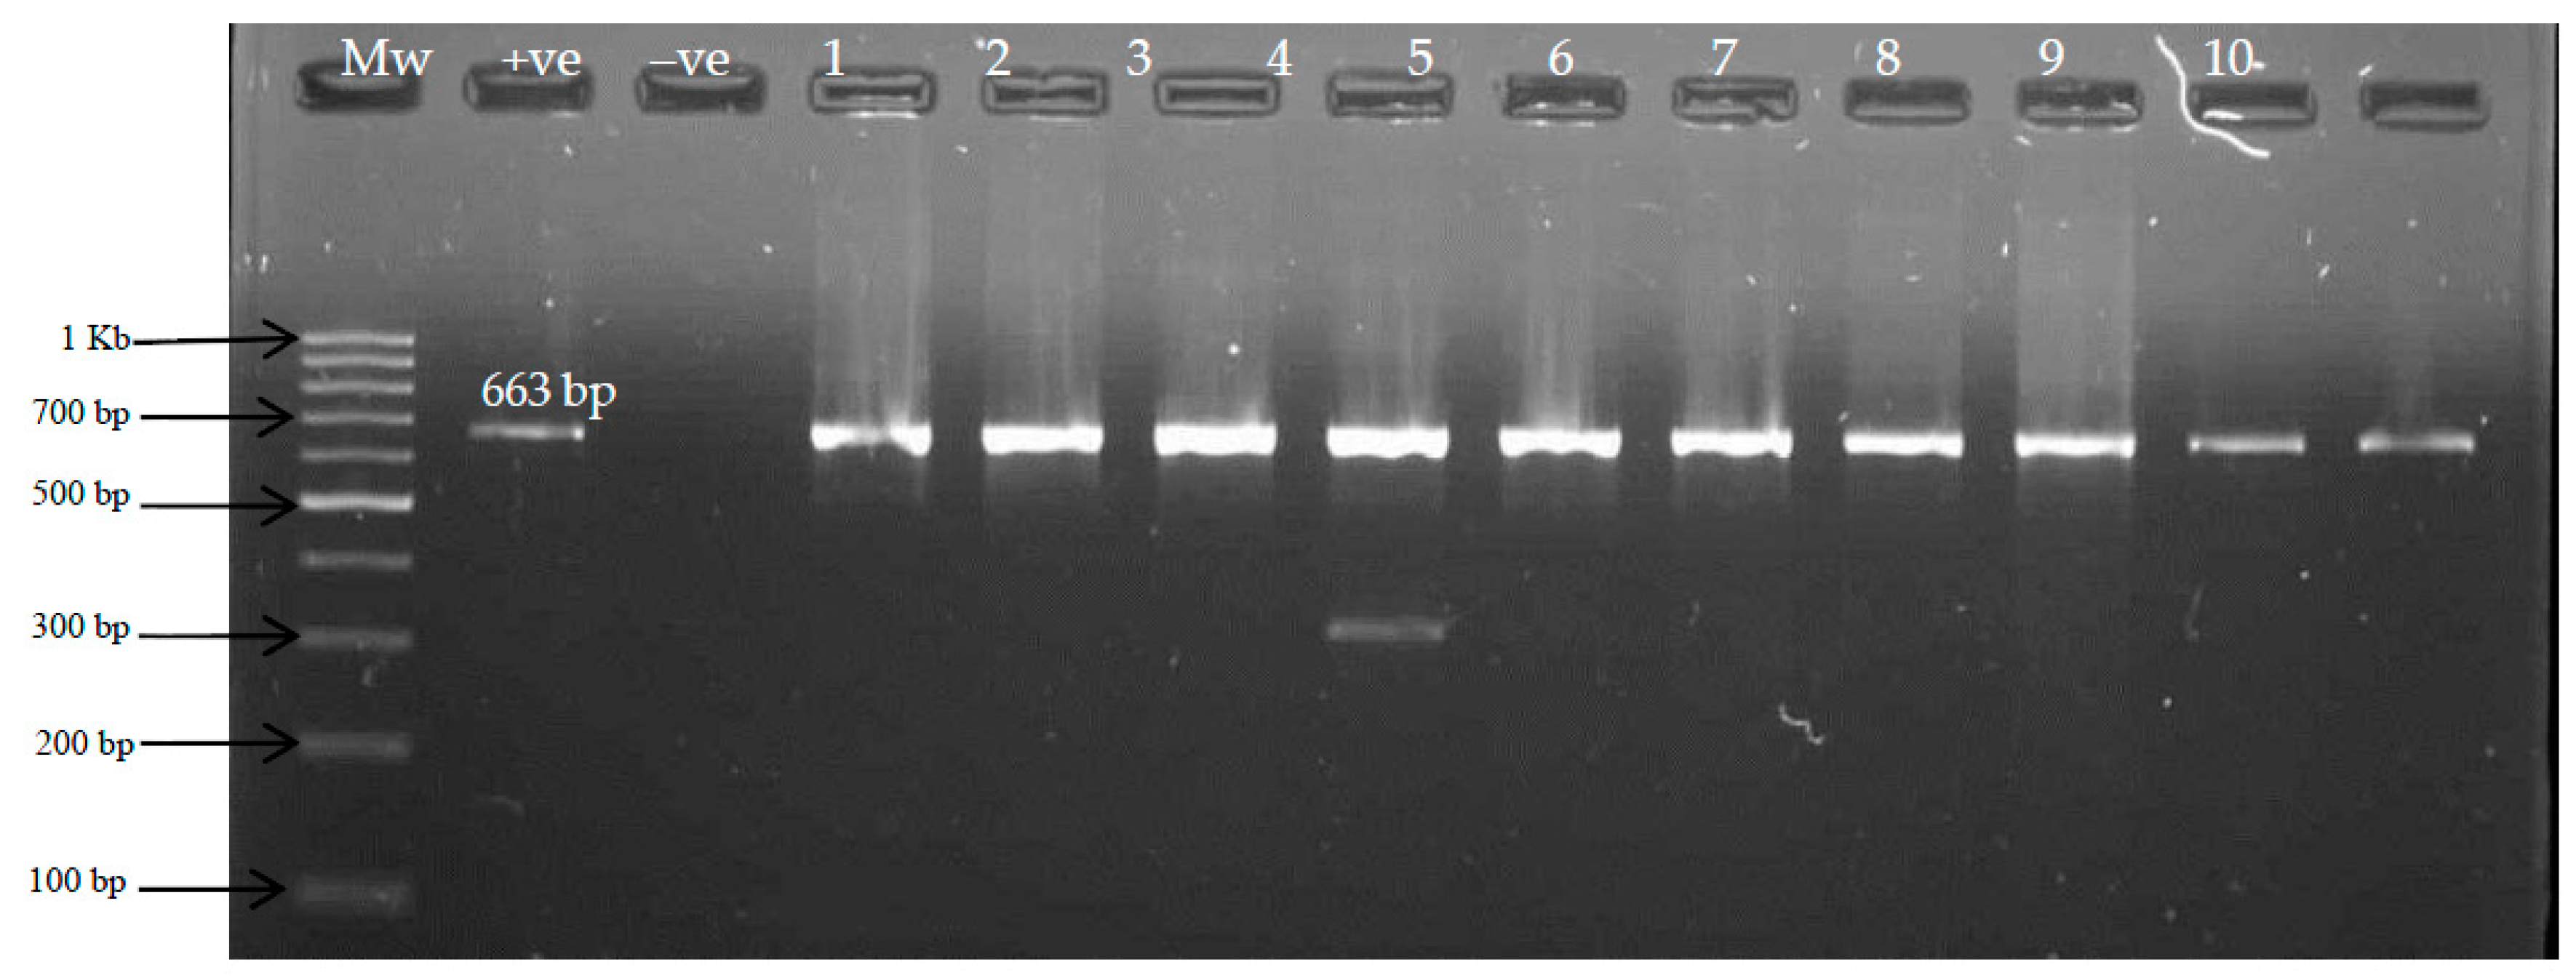
3.3. Molecular Identification of E. coli and Vibrio Isolates

The molecular confirmation of the isolates by PCR amplification revealed 76.2% (381/500) of the preliminary identified E. coli isolates recovered from both study sites to be positive for the uidA gene, identifying the isolates as E. coli, while 69.8% (279/400) of the preliminary identified Vibrio isolates from the two sites were positive for the presence of the targeted variable regions around position 700 and 1325 within 16SrRNA segment used for the identification of Vibrio spp. up to the genus level. Of the total isolates positive for uidA gene, 77.6% (194/250) were from SWWTP, while 74.8% (187/250) of the isolates were recovered from KWWTP. Likewise, 66.3% (157/237) of the tested isolates were positive for the 16SrRNA gene at SWWTP, while 74.9% (122/163) of the isolates tested positive from KWWTP. Figure 3 and Figure 4 below are representative gel electrophoretic images of some of the PCR-confirmed isolates.

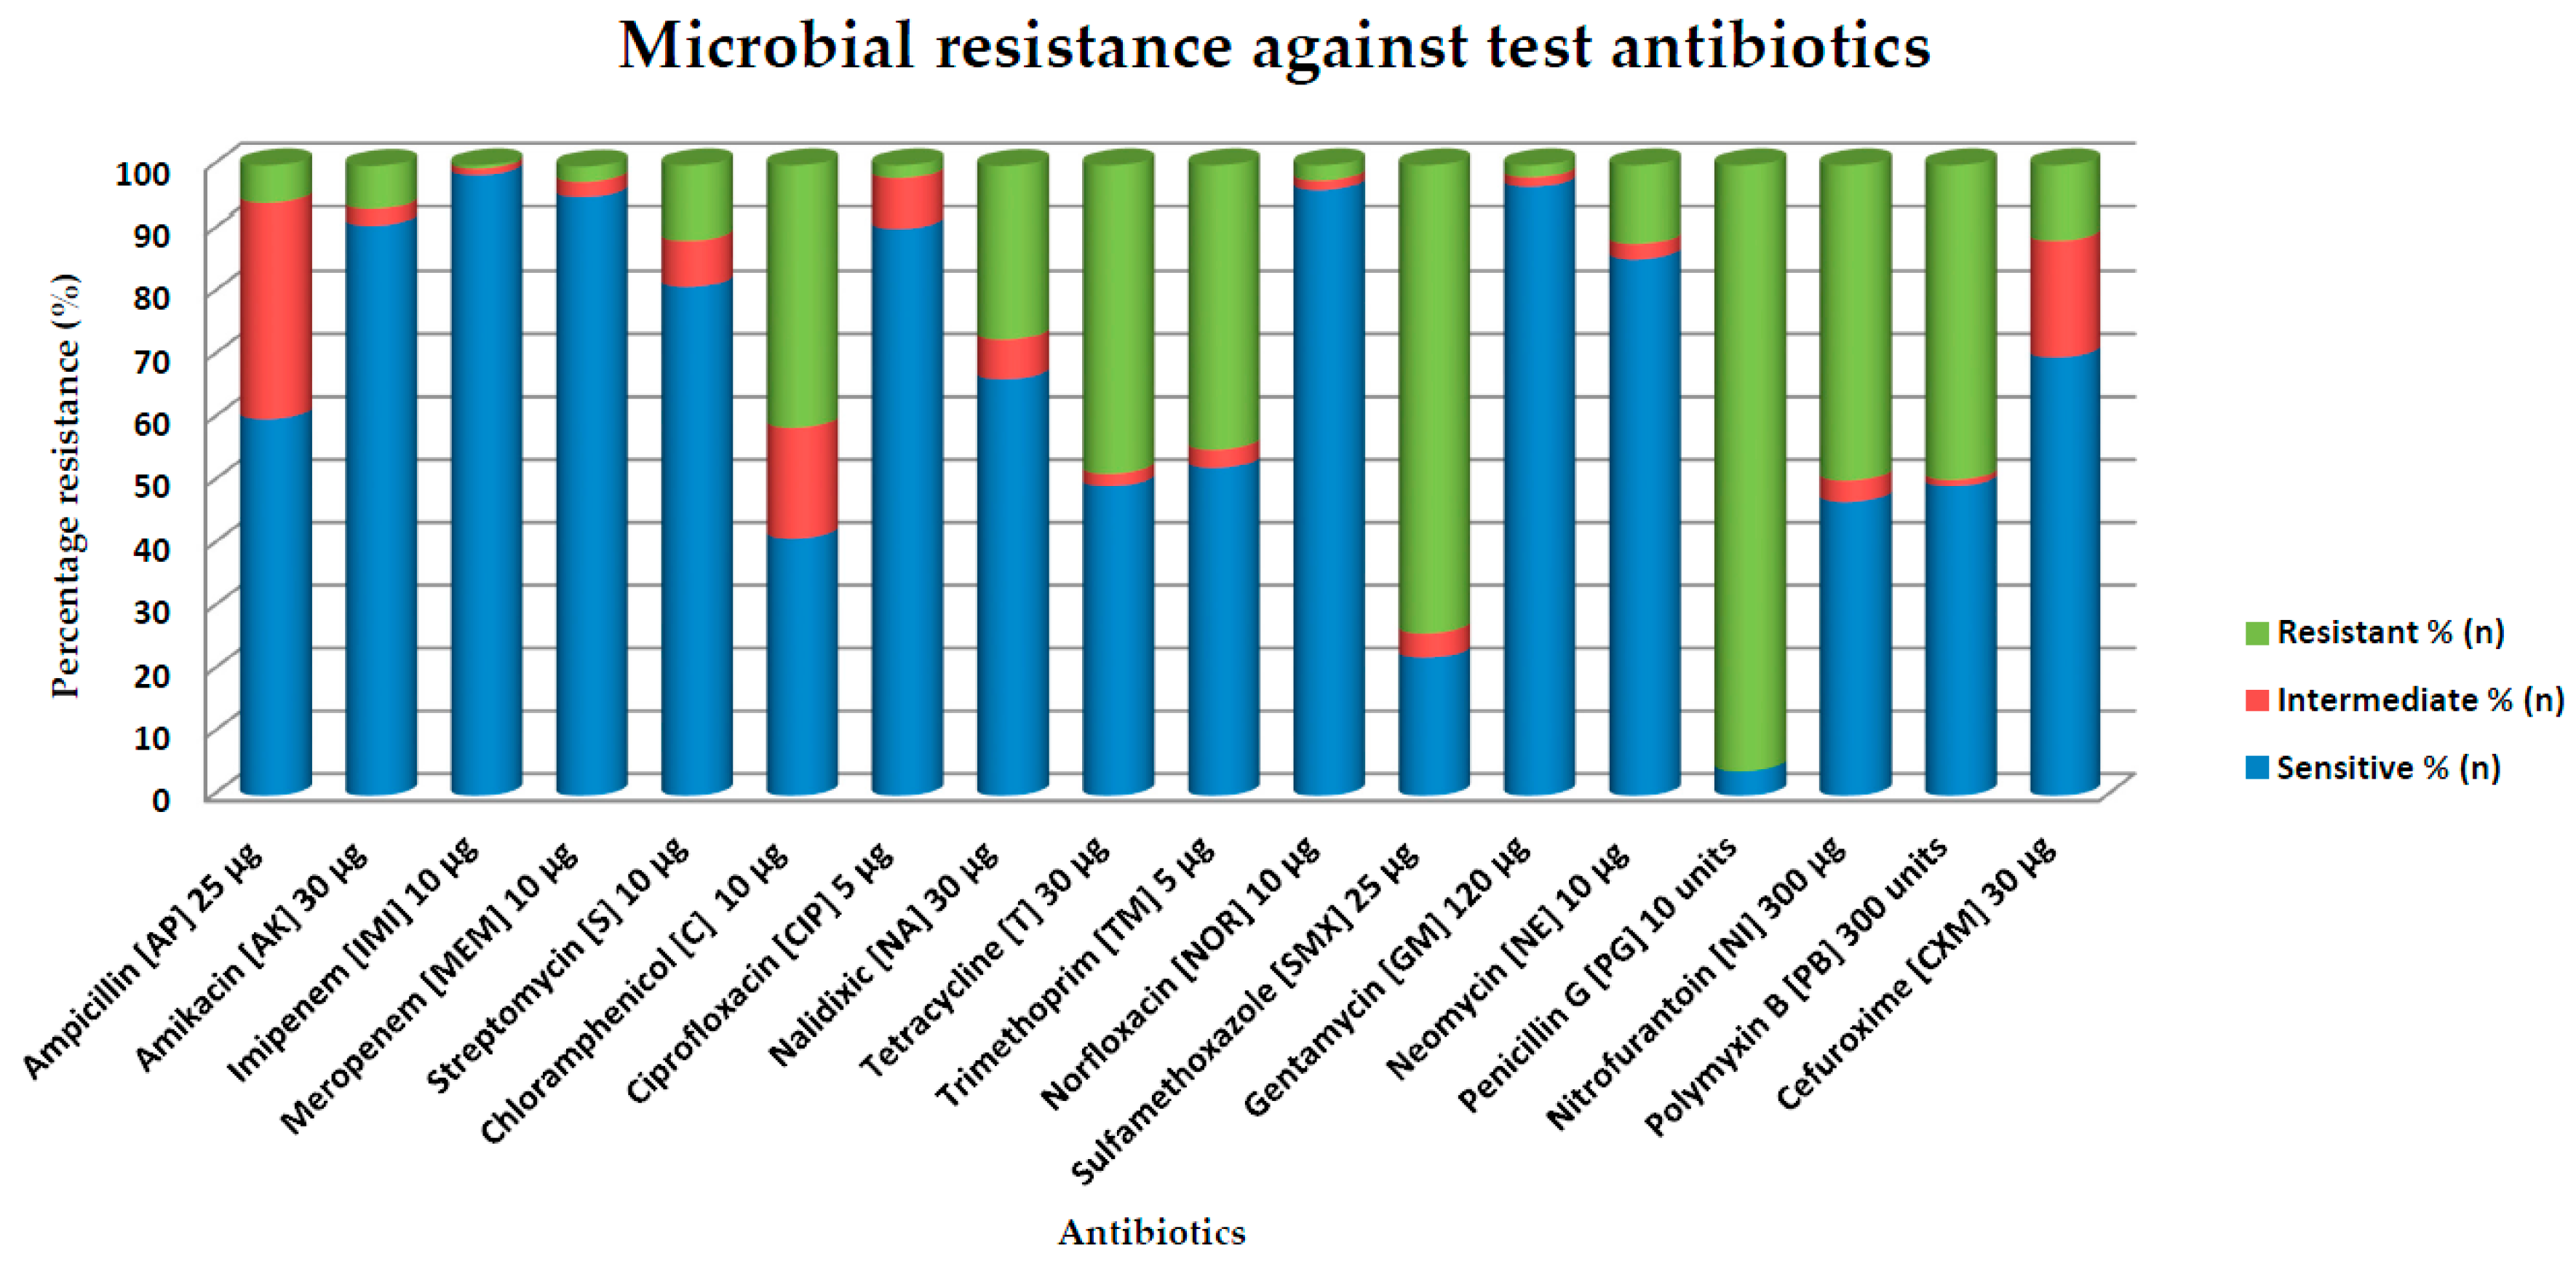
3.4. Antibiotic Susceptibility Profile of Vibrio spp. Isolates

The antibiotic susceptibility profiles of 205 randomly selected PCR-confirmed Vibrio species isolates against 18 different antibiotics showed marked susceptibility (≥95) to four of the antibiotics. These include imipenem, meropenem, trimethoprim and sulfamethoxazole. The isolates also exhibited susceptibility greater than >90 to amikacin and ciprofloxacin (Figure 4). None of the test antibiotics were completely potent against all the isolates, with the expression of resistance ranging between 0.5% (imipenem) to 96.1% (penicillin G). Approximately 81% (166/205) of the tested isolates showed multiple antibiotic resistance phenotypes (MARP) against three or more antibiotics. The most common MARP was AP-T-TM-SMX-PG-NI-PB, which occurred in eight isolates. The highest number of MARP observed in a single isolate was 11 (that is, MARP 11), with three isolates found in this category. MARP 10 was also observed in six of the test isolates. The multiple resistance antibiotic indices (MARI) estimated for both sites are 0.35 (SWWTP) and 0.33 (KWWTP).

3.5. Profiling of the Antibiotic Resistance Gene in Drug-Resistant Vibrio Isolates

Nine of the ten antibiotic resistance genes/determinants assayed were detected by PCR in the Vibrio isolates that exhibited resistance to the test antibiotics. The frequencies of the detection of the resistance gene are shown in Table 4. Tetracycline was the drug to which the highest number of isolates was insensitive, as revealed by the antibiotic susceptibility results. This also coincided with the frequency of detection of the resistance genes conferring resistance to this class of drug. The detection rates of resistance genes in the isolates ranged from 0% (blaZ) to 47% (tetM). Some of the gel electrophoretic pictures showing the resistance genes detected in the Vibrio isolates are attached as supplemental materials.

4. Discussion

Considering the high incidences of deaths and debilitating diseases caused by contact with contaminated water, it is important to understand factors associated with the spread of waterborne pathogens, and their respective indicators. The water characteristics assessed in this study have been reported to have interdependent impacts on each other, and in turn impact water quality and usability [37,38,39]. Although the effluents analyzed in this study showed compliance with recommended guidelines for pH, TDS, temperature, nitrite and DO, they fell short of the recommended limits in terms of the turbidity, BOD5, nitrate, phosphate, COD and free chlorine concentrations, thus suggesting impairment of the water quality and the alteration of the ecological dynamics of the receiving waterbodies.
BOD measures the amount of oxygen required by microbes to break down organic matter, while COD is a measure of the amount of oxygen required for the chemical decomposition of organic and inorganic contaminants dissolved or suspended in water [40]. BOD reduction is a general yardstick for evaluating the performance of a municipal wastewater treatment plant (measured as five-day, 20 °C BOD), and the performance efficiency of treatment plants depends not only on proper design and construction, but also on good operation and maintenance [41]. The determination of BOD and COD is useful in evaluating the compliance of effluents with water quality requirements standards, and also the estimation of the potential of organics present in effluent to deplete oxygen [42]. Although South Africa does not have a set limit for BOD in discharged effluents, using the European Union limit of 3–6 mg/L meant that some of the effluent samples did not comply with the set limit in some of the sampling months. The continuous discharge of effluent with low-dissolved oxygen and high BOD into freshwater systems suggest increased organic loading, and in turn potential negative impacts on such receiving water systems, which may cause harm to aquatic life [38,43]. Also, low oxygen content may cause increased toxicity of certain substances, and this may induce stress responses in the aquatic ecosystem. Increased COD levels also have a similar effect on surface water [44]). Although no limit exists for BOD5 levels in South African guidelines, about 75% of the effluent samples complied with the European Union BOD5 limit of 3–6 mg/L (Table S2). The BOD and COD levels recorded in this study were similar to those reported elsewhere [38,43].
One important characteristic of discharged wastewater effluents that often impacts receiving waters is its nutrient content. Excessive nutrient loading, especially in regards to nitrogen and phosphorus, is a major ongoing threat to freshwater quality worldwide, particularly in water-scarce countries such as South Africa [45]. Many aquatic systems have very low ambient nutrient concentrations, and small shifts in the nutrient load can result in dramatic changes in the aquatic community structure [46]. High concentrations of nitrates above the 15 mg/L limit were recorded in some months at KWWTP, particularly in winter. Likewise, high concentrations of orthophosphate above the recommended limit of 10 mg/L were recorded at both study sites. Nitrate has been reported to be toxic to humans and animals. Since 1945, methemoglobinemia (blue baby syndrome) has been linked to drinking nitrate-contaminated well water on farms from the midwestern United States of America [47]. Methemoglobinemia is formed during the nitrate-induced oxidation of haemoglobin, which prevents normal oxygen binding and leads to hypoxia. Methemoglobinemia, as well as additional concerns, continue today with increasing nitrate contamination of water bodies. Ammonium ions have also been reported to have toxic effects on fish [47,48]. Increased nitrate and phosphorus levels in discharged effluents will promote excessive growths of aquatic plants and algae, thus contributing to eutrophication and resulting in undesirable ecological effects within the receiving water bodies [38].
Chlorination remains the most widely used disinfectant in water and wastewater treatment. The disinfection of effluents prior to discharge helps inactive bacteria and other potentially harmful organisms that may have escaped the initial treatment stages. Both treatment facilities utilize automated chlorination systems for dosing their final effluents before discharging into the receiving watershed. The concentrations of free chlorine in the discharged effluents at SWWTP were for most of the sampling period in line with the limit of 0.25 mg/L for discharged final effluents, while 50% of the samples had turbidity above the <5 NTU recommended limit. Excessive free chlorine and turbidity levels were mostly recorded at KWWTP for most of the study, with 100% of the samples from this site having turbidity above the guideline. The high chlorine levels observed at this site may be partly due to the incessant breakdown of the automated chlorination system, which leads to manual dosing on several occasion during the study period. There was notably excessive turbidity in the discharged effluents at this site during five of the sampling months (Table 3), which correlates with the high bacterial count at this site. This observation might have resulted from malfunctioning of the aerators at the time of sampling. One major implication of the discharge of excessive turbid effluents into the receiving water resources is a reduction in light penetration, which may result in the decline of the rate of photosynthesis by the aquatic plants. This may in turn lead to less food being available for the aquatic animals [49]). Excessive turbidity affects the effectiveness of chlorination during disinfection in wastewater treatment, resulting in the failure of removal of microorganisms [50,51]. High turbidity has been shown to hinder the effectiveness of disinfection in water, and often correlates with microbial load within water resources [50]. Furthermore, inefficient chlorination increases the chances of trihalomethane (THM) precursors forming in the wastewater effluent [51]. THM are carcinogenic compounds that are formed as a by-product from chlorine and organic matter reaction, which may result in serious health implications for aquatic life and humans exposed to it [52]. However, there was an improvement in the turbidity and bacterial counts after the aerators were fixed.
The noncompliance of some of the physicochemical parameters assessed including BOD, COD, nutrient concentration (nitrate, orthophosphate), turbidity, and free chlorine concentration suggests a high concentration of organic matter in the discharged effluents. Incessant discharge of the inadequately treated effluent will contribute to eutrophication in the receiving watershed and consequently alter the ecosystem balance of these water resources. There is also the chance of formation of carcinogens resulting from the chlorination of highly turbid effluents, which constitute a public health threat.
Microorganisms of enteric origin are one of the most common pathogens encountered in the aquatic environments, including discharged municipal wastewater effluents. In this study, FIB (E. coli) and Vibrio species were detected in all samples analyzed over the sampling period. Even though FIB may not be pathogenic, their presence in the water system is universally accepted to indicate fecal contamination, and possible presence of other pathogenic organisms [53]. E. coli is a subgroup of fecal coliforms used as an indicator of fecal contamination. Although vast majority of E. coli are completely harmless, some strains of the bacteria have acquired genetic capabilities which enable them to encode virulence factors [54]. Pathogenic E. coli strains cause diverse forms of bacterial induced illnesses with symptoms ranging from mild diarrhoea to severe complication and even death [55]. As observed in the study, the counts of the FIB complied with 103 CFU/100 mL limit during some of the sampling months, whereas, counts far above this limit were recorded in other months. Similar findings to this have been reported by other studies [29,56].
Even though there is no specific guideline for Vibrio density in discharged effluent in South Africa, however, using the fecal coliform as the base limit for the evaluation of Vibrios, we observed that about 77.1% of the samples analyzed for presumptive Vibrio spp. complied with the general limit permissible for discharged final effluent in South Africa. Similarly, other studies have reported the detection of Vibrio in discharged effluents in South Africa and have emphasized the possibility of their survival in the environment [57,58,59,60]. The lack of statistical correlation between the abundance of FIB and potentially pathogenic Vibrio species points at the feeble attempt to use indicator organisms as surrogates for pathogens in water systems [61,62,63], while more reliable pathogen detection technology such as molecular-based and next-generation sequencing techniques will give more accurate results.
In this study, all PCR-confirmed Vibrio isolates tested exhibited resistance to at least one of the 18 test antibiotics. The highest frequency of resistance was recorded against penicillin G (96.1%), followed by sulfamethoxazole with a frequency of 74.1%. The resistance frequencies displayed by the isolates against other antibiotics were <50%, as shown in Figure 5, while only one isolate showed resistance against imipenem. Our finding was similar to that of Wright [64], who reported a susceptibility of 98% for imipenem against Vibrio parahaemolyticus isolated from retail shrimps in Malaysia. However, contrary to their record of ≥82% susceptibility rates for chloramphenicol, trimethoprim and tetracycline, our test isolates exhibited susceptibility rates of 41%, 52.2% and 49.3% to these antibiotics, respectively. Several MARP combinations were exhibited against the PCR-confirmed Vibrio spp. Isolates, indicating the ineffectiveness or lack of sensitivity of the isolates to the antibiotics. The multiple antibiotic resistance indices (MARI) estimates for both study sites (SWWTP, 0.35, and KWWTP, 0.33) suggest that the isolates might have originated from sources with a high contamination of antibiotics.
Although antibiotic resistance was initially thought to have evolved in the clinical setting, much more attention is now being directed towards understanding the ecological and environmental factors contributing to resistance gene acquisition among microorganisms. While some studies have attempted to highlight the dissemination of resistance genes between environmental and pathogenic bacteria [65,66], the complexity of the processes and the relative scarcity of information on this subject indicate a dearth of adequate knowledge in this field. This study revealed the presence of nine out of the 10 genes assayed conferring resistance against the various classes of drugs used in treating Vibriosis and other infections caused by Vibrio species. The long-term use of tetracycline in the clinical setting, and also in animal production, has been suggested as a factor that contributes to the high resistance often exhibited against this class of drugs. This coincides with our finding, with 47% (47/100) of the resistant isolates carrying the tetM gene, which is followed by tetB (23%) and tetA (19%). The production of β-lactamase inactivates the β-lactam class of antibiotic through hydrolysis by breaking open the β-lactam ring. Three genes responsible for β-lactamase were detected in some of the test isolates at frequencies ranging between 27.8% (blaCTX-M) and 44.4% (blaTEM) (Table 4) while two different genes (aadA and strA) conferring resistance against aminoglycoside were detected at rates of 24% and 40%, respectively. Some of the isolates tested were found to carry genes conferring resistance to more than one class of antibiotic. Other studies [59,60] have reported similar findings in environmental isolates. Even though most conventional wastewater treatment designs incorporate primary and secondary treatment processes to remove biological and chemical contaminates from treated effluents, an inclusion of a tertiary treatment stage (such as filtration, biological nutrient removal etc.) will be an important step in mitigating the negative impact of inadequately treated effluents on receiving watersheds.

5. Conclusions

Even though the impact of poor quality effluents on surface water has received consideration in recent years, the production of effluents of high quality still remains a huge challenge. There have been increasing detrimental impacts on freshwater ecosystems, including the notable eutrophication and pollution of many rivers. Potential pathogens present in discharged effluents can cause diarrhoea, abdominal cramps and other clinical symptoms, and present a major health risk particularly to infants, the elderly and persons with severely compromised immunity. The findings of this study revealed inadequacies in the current treatment procedures, and the resultant discharge of potentially photogenic drug-resistant bacteria into the aquatic environment, which may be directly or indirectly transferred to human and animal populations via the food chain. Human infection by drug resistance pathogens results in longer hospital stays and an extremely high cost of medical care, especially in developing countries such as South Africa. The detection of genes conferring resistance to the different classes of antibiotics represents a significant public health threat. Some of these pathogens can exchange resistance and other virulence genetic materials with other environmental isolates and human/animal microflora, thus compounding the problem of drug resistance. There is a need for effective management and improvement of existing treatment facilities, as well as continuous monitoring of discharged effluents for factors that may promote the evolution and spread of resistance determinants, and other emerging pollutants of public health interest. Therefore, more effort should be invested in curbing the indiscriminate discharge of poor-quality effluent into the aquatic milieu of the Eastern Cape, in the interest of public health and freshwater ecosystem conservation.

Supplementary Materials

The following are available online at www.mdpi.com/2073-4441/9/8/562/s1. Figure S1(a–i): Gel electrophoretic pictures showing the resistance genes detected in the vibrio isolates.

Acknowledgments

We are grateful to the South African Water Research Commission (WRC), the South Africa Medical Research Council and the National Research Foundation (NRF) of South Africa (Grant UID: 89040) for financial supports.

Author Contributions

A.I. Okoh and M.A. Adefisoye conceived and designed the experiments; M.A. Adefisoye performed the experiments; M.A. Adefisoye analyzed the data; A.I. Okoh supervised the study and funded the research from his grant; M.A. Adefisoye wrote the paper. A.I. Okoh corrected and approved the manuscript.

Conflicts of Interest

The authors declare no conflict of interest. The founding sponsors had no role in the design of the study; in the collection, analyses, or interpretation of data; in the writing of the manuscript, and in the decision to publish the results.

References

  1. World Health Organisation. Global Health Risks: Mortality and Burden of Disease Attributed to Selected Major Risks. 2009. Available online: http://www.who.int/healthinfo/global_burden_disease/GlobalHealthRisks_report_full.pdf (accessed on 11 July 2016).
  2. Centers for Disease Control and Prevention. Diarrhoea: Common Illness, Global Killer. 2015. Available online: http://www.cdc.gov/healthywater/global/diarrhea-burden.html (accessed on 11 July 2016).
  3. Rochelle-Newall, E.; Nguyen, T.M.H.; Le, T.P.Q.; Sengtaheuanghoung, O.; Ribolzi, O. A short review of fecal indicator bacteria in tropical aquatic ecosystems: Knowledge gaps and future directions. Front. Microbiol. 2015, 6. [Google Scholar] [CrossRef] [PubMed]
  4. Frigon, D.; Biswal, B.K.; Mazza, A.; Masson, L.; Gehr, R. Biological and physicochemical wastewater treatment processes reduced the prevalence of virulent Escherichia coli. Appl. Environ. Microbiol. 2012, 79, 835–844. [Google Scholar] [CrossRef] [PubMed]
  5. Gerba, C.P.; Smith, J.E. Sources of pathogenic microorganisms and their fate during land application of wastes. J. Environ. Qual. 2005, 34, 42–48. [Google Scholar] [CrossRef] [PubMed]
  6. Godfree, A.; Farrell, J. Process for managing pathogens. J. Environ. Qual. 2005, 34, 105–113. [Google Scholar] [CrossRef] [PubMed]
  7. Keil, A.; Wing, S.; Lowman, A. Suitability of public records for evaluating health effects of treated sewage sludge in North Carolina. N. C. Med. J. 2011, 72, 98–104, PMCID:PMC3136883. [Google Scholar] [PubMed]
  8. Nigam, A.; Gupta, D.; Sharma, A. Treatment of infectious diseases: Beyond antibiotic. Microbiol. Res. 2014, 169, 643–651. [Google Scholar] [CrossRef] [PubMed]
  9. Cogliani, C.; Goossens, H.; Greko, C. Restricting antimicrobial use in food animals: Lessons from Europe. Microbe 2011, 6, 274–279. [Google Scholar] [CrossRef]
  10. Marshall, B.M.; Levy, S.B. Food animals and antimicrobials: Impacts on human health. Clin. Microbiol. Rev. 2011, 24, 718–733. [Google Scholar] [CrossRef] [PubMed]
  11. Economou, V.; Gousia, P. Agriculture and food animals as a source of antimicrobial-resistant bacteria. Infect. Drug Resist. 2015, 8, 49–61. [Google Scholar] [CrossRef] [PubMed]
  12. Woolhouse, M.; Ward, M.; Bunnik, B.; Farrar, J. Antimicrobial resistance in humans, livestock and the wider environment. Philos. Trans. R. Soc. B 2015, 370, 20140083. [Google Scholar] [CrossRef] [PubMed]
  13. Fair, R.J.; Tor, Y. Antibiotics and bacterial resistance in the 21st century. Perspect. Med. Chem. 2014, 6, 25–64. [Google Scholar] [CrossRef]
  14. Davies, J.; Davies, D. Origins and Evolution of Antibiotic Resistance. Microbiol. Mol. Biol. Rev. 2010, 74, 417–433. [Google Scholar] [CrossRef] [PubMed]
  15. Rizzo, L.; Manaia, C.; Merlin, C.; Schwartz, T.; Dagot, C.; Ploy, M.C.; Fatta-Kassinos, D. Urban wastewater treatment plants as hotspots for antibiotic resistant bacteria and genes spread into the environment: A review. Sci. Total Environ. 2013, 447, 345–360. [Google Scholar] [CrossRef] [PubMed]
  16. Berglund, B. Environmental dissemination of antibiotic resistance genes and correlation to anthropogenic contamination with antibiotics. Infect. Ecol. Epidemiol. 2015, 5. [Google Scholar] [CrossRef] [PubMed]
  17. Deziel, N. Pharmaceuticals in Wastewater Treatment Plant Effluent Waters. Sch. Horiz. Univ. Minn. Morris Undergrad. J. 2014, 1, 12. Available online: http://digitalcommons.morris.umn.edu/horizons/vol1/iss2/12 (accessed on 14 January 2017).
  18. Bouki, C.; Venieri, D.; Diamadopoulos, E. Detection and fate of antibiotic resistant bacteria in wastewater treatment plants: A review. Ecotoxicol. Environ. Saf. 2013, 91, 1–9. [Google Scholar] [CrossRef] [PubMed]
  19. Naidoo, S.; Olaniran, A.O. Treated Wastewater Effluent as a Source of Microbial Pollution of Surface Water Resources. Int. J. Environ. Res. Public Health 2014, 11, 249–270. [Google Scholar] [CrossRef] [PubMed]
  20. Drury, B.; Rosi-Marshall, E.; Kelly, J.J. Wastewater treatment effluent reduces the abundance and diversity of benthic bacterial communities in urban and suburban rivers. Appl. Environ. Microbiol. 2013, 79, 1897–1905. [Google Scholar] [CrossRef] [PubMed]
  21. Bessong, P.O.; Odiyo, J.O.; Musekene, J.N.; Tessema, A. Spatial distribution and microbial quality of domestic water during an outbreak of diarrhoea in the Tshikuwi community in Venda, South Africa. J. Health Popul. Nutr. 2009, 27, 652–659, PMCID:PMC2928092. [Google Scholar] [CrossRef] [PubMed]
  22. Olaniran, A.O.; Naicker, K.; Pillay, B. Toxigenic Escherichia coli and Vibrio cholera: Classification, pathogenesis and virulence determinants. Biotechnol. Mol. Biol. Rev. 2011, 6, 94–100. Available online: www.academicjournals.org/BMBR (accessed on 14 January 2017).
  23. Igbinosa, E.O.; Obi, L.C.; Okoh, A.I. Occurrence of potentially pathogenic vibrios in final effluents of a wastewater treatment facility in a rural community of the Eastern Cape Province of South Africa. Res. Microbiol. 2009, 160, 531–537. [Google Scholar] [CrossRef] [PubMed]
  24. Cañigral, I.; Moreno, Y.; Alonso, J.L.; González, A.; Ferrús, M.A.; Ferrús, M. Detection of Vibrio vulnificus in seafood, seawater and wastewater samples from a Mediterranean coastal area. Microbiol. Res. 2010, 165, 657–664. [Google Scholar] [CrossRef] [PubMed]
  25. Anastasi, E.M.; Matthews, B.; Stratton, H.M.; Katouli, M. Pathogenic Escherichia coli found in sewage treatment plants and environmental waters. Appl. Environ. Microbiol. 2012, 78, 5536–5541. [Google Scholar] [CrossRef] [PubMed]
  26. Adefisoye, M.A.; Okoh, A.I. Identification and antimicrobial resistance prevalence of pathogenic Escherichia coli strains from treated wastewater effluents in Eastern Cape, South Africa. MicrobiologyOpen 2016, 5, 143–151. [Google Scholar] [CrossRef] [PubMed]
  27. Mema, V. Impact of poorly maintained waste water and sewage treatment plants: Lessons from South Africa. ReSource 2010, 12, 60–65. Available online: https://pdfs.semanticscholar.org/afa6/d6ff3a25061a5c9b8f2194680f1b5c682fbc.pdf (accessed on 7 November 2016).
  28. Edokpayi, J.N.; Odiyo, J.O.; Durowoju, O.S. Impact of Wastewater on Surface Water Quality in Developing Countries: A Case Study of South Africa; Water Quality; InTech: Rijeka, Croatia, 2017; ISBN 978-953-51-2882-3. Available online: https://www.intechopen.com/books/water-quality/impact-of-wastewater-on-surface-water-quality-in-developing-countries-a-case-study-of-south-africa (accessed on 19 July 2017).
  29. Rohr, H.E.; Fourie, W. Securing water sustainability through innovative spatial planning. WIT Trans. Ecol. Environ. 2014, 191, 283–293. [Google Scholar] [CrossRef]
  30. Council of Scientific and Industrial Research. A CSIR Perspective on Water in South Africa, 2010; CSIR Report No. CSIR/NRE/PW/IR/2011/0012/A; CSIR: New Delhi, India, 2010. [Google Scholar]
  31. American Public Health Association, American Water Works Association, Water Environment Federation. Standard Methods for the Examination of Water and Wastewater, 20th ed.; American Public Health Association: Washington, DC, USA, 1998. [Google Scholar]
  32. Queipo-Ortuno, M.I.; Colmenero, J.D.D.; Macias, M.; Bravo, M.J.; Morata, P. Preparation of bacterial DNA template by boiling and effect of immunoglobulin G as an inhibitor in real-time PCR for serum samples from patients with brucellosis. Clin. Vaccine Immunol. 2008, 15, 293–296. [Google Scholar] [CrossRef] [PubMed]
  33. Janezic, K.J.; Ferry, B.; Hendricks, E.W.; Janiga, B.A.; Johnson, T.; Murphy, S. Phenotypic and genotypic characterisation of Escherichia coli isolated from untreated surface waters. Open Microbiol. J. 2013, 7, 9–19. [Google Scholar] [CrossRef] [PubMed]
  34. Kwok, A.Y.; Wilson, J.T.; Coulthart, M.; Ng, L.K.; Mutharia, L.; Chow, A.W. Phylogenetic study and identification of human pathogenic Vibrio species based on partial hsp60 gene sequences. Can. J. Micriobiol. 2002, 48, 903–910. [Google Scholar] [CrossRef]
  35. Clinical and Laboratory Standards Institute. Performance Standards for Antimicrobial Susceptibility Testing; 21st Informational Supplement, M100-S21, CLSI: Wayne, PA, USA, 2011; Volume 31, p. 1. [Google Scholar]
  36. Krumperman, P.H. Multiple antibiotic resistance indexing of Escherichia coli to identify high-risk of sources of faecal contamination of foods. Appl. Environ. Microbiol. 1983, 46, 165–170. [Google Scholar] [PubMed]
  37. Chapman, D. Water Quality Assessment. In Chapman D on Behalf of UNESCO, WHO and UNEP; Chapman & Hall: London, UK, 1992. [Google Scholar]
  38. Morrison, G.; Fatoki, O.S.; Persson, L.; Ekberg, A. Assessment of the impact of point source pollution from the Keiskammahoek Sewage Treatment Plant on the Keiskamma River-pH, electrical conductivity, oxygen-demanding substrate (COD) and nutrients. Water SA 2001, 27, 475–480. [Google Scholar] [CrossRef]
  39. Akpor, O.B. Wastewater effluent discharge: Effects and treatment processes. In Proceedings of the 3rd International Conference on Chemical, Biological and Environmental Engineering, Chengdu, China, 23–25 September 2011; pp. 85–91. [Google Scholar]
  40. Salem, I.B.; Ouardani, I.; Hassine, M.; Aouni, M. Bacteriological and physicochemical assessment of wastewater in different region of Tunisia: Impact on human health. BMC Res. Notes 2011, 4, 144. [Google Scholar] [CrossRef] [PubMed]
  41. Kumar, K.S.; Kumar, P.S.; Babu, M.J.R. Performance evaluation of Waste water treatment plant. IJEST 2010, 2, 7785–7796. [Google Scholar]
  42. Department of Water Affairs and Forestry Republic of South Africa. South African Water Quality Guidelines: Aquatic Ecosystems, 1st ed.; Department of Water Affairs and Forestry: Pretoria, South Africa, 1996; Volume 7.
  43. Akinlua, A.; Asubiojo, O.I. Physicochemical and trace metal characterization of battery factory wastewater. J. Appl. Sci. 2006, 6, 1456–1462. [Google Scholar]
  44. World Health Organisation. Guidelines for Drinking Water Quality, 3rd ed.; Recommendations; World Health Organization: Geneva, Switzerland, 2017; Volume 1, Available online: http://www.who.int/ (accessed on 17 July 2017).
  45. Muller, M.; Schreiner, B.; Smith, L.; Koppen, B.; Sally, H.; Aliber, M.; Cousins, B.; Tapela, B.; Merwe-Botha, M.; Karar, E.; et al. (Eds.) Water security in South Africa. In Development Planning; Working paper Series No.12; DBSA: Midrand, South Africa, 2009. [Google Scholar]
  46. Rabalais, N.N. Nitrogen in aquatic ecosystems. Ambio 2002, 31, 102–112. [Google Scholar] [CrossRef] [PubMed]
  47. Guillette, L.J.; Edwards, T.M. Is nitrate an ecologically relevant endocrine disruptor in vertebrates? Integr. Comp. Biol. 2005, 45, 19–27. [Google Scholar] [CrossRef] [PubMed]
  48. Avery, A.A. Infantile methemoglobinemia: Reexamining the role of drinking water nitrates. Environ. Health Perspect. 1999, 107, 583–586, PMCID:PMC1566680. [Google Scholar] [CrossRef] [PubMed]
  49. Palmer, C.G.; Berold, R.S.; Muller, W.J. Environmental Water Quality in Water Resources Management; WRC Report No TT 221/04; Water Research Commission: Pretoria, South Africa, 2004. [Google Scholar]
  50. Obi, C.L.; Momba, M.N.B.; Samie, A.; Igumbor, J.O.; Green, E.; Musie, E. Microbiological, physicochemical and management parameters impinging on the efficiency of small water treatment plants in Limpopo and Mpumalanga Provinces of South Africa. Water SA 2007, 33, 229–237. [Google Scholar]
  51. Fatoki, O.S.; Muyima, N.Y.O.; Lujiza, N. Situation analysis of water quality in the Umtata River catchment. Water SA 2001, 27, 467–473. [Google Scholar] [CrossRef]
  52. Odjadjare, E.E.; Okoh, A.I. Physicochemical quality of an urban municipal wastewater effluent and its impact on the receiving environment. Environ. Monit. Assess. 2010, 17, 393–394. [Google Scholar] [CrossRef] [PubMed]
  53. Reynolds, K.A. Coliforms Bacteria: A Failed Indicator of Water Quality? Available online: http://archive.wcponline.com/colum.cfm?T=T&ID=2349&AT=T (accessed on 18 June 2016).
  54. Ingraham, J.L. March of the Microbes: Sighting the Unseen; England The Belknap Press of Harvard University Press: London, UK, 2010. [Google Scholar]
  55. Rocourt, J. Foodborne diseases and vulnerable groups. In Encyclopedia of Food Safety; Motarjemi, Y., Moy, G., Todd, E., Eds.; Academic Press: Cambridge, MA, USA, 2013. [Google Scholar]
  56. Sheludchenko, M.; Padovan, A.; Katouli, M.; Stratton, H. Removal of Fecal Indicators, Pathogenic Bacteria, Adenovirus, Cryptosporidium and Giardia (oo)cysts in Waste Stabilization Ponds in Northern and Eastern Australia. Int. J. Environ. Res. Public Health 2016, 13, 96. [Google Scholar] [CrossRef] [PubMed]
  57. Igbinosa, E.O.; Okoh, A.I. Impact of discharge wastewater effluents on the physico-chemical qualities of a receiving watershed in a typical rural community. Int. J. Environ. Sci. Technol. 2009, 6, 175–182. [Google Scholar] [CrossRef]
  58. Dungeni, M.; van der Merwe, R.R.; Momba, M.N.B. Abundance of pathogenic bacteria and viral indicators in chlorinated effluents produced by four wastewater treatment plants in the Gauteng Province, South Africa. Water SA 2010, 36, 607–614. [Google Scholar] [CrossRef]
  59. Wennberg, A.C.; Tryland, I.; Østensvik, Ø.; Secic, I.; Monshaugen, M.; Liltved, H. Effect of water treatment on the growth potential of Vibrio cholerae and Vibrio parahaemolyticus in seawater. Mar. Environ. Res. 2013, 83, 10–15. [Google Scholar] [CrossRef] [PubMed]
  60. Okoh, A.I.; Sibanda, T.; Nongogo, V.; Adefisoye, M.A.; Olayemi, O.O.; Nontongana, N. Prevalence and characterisation of non-cholerae Vibrio spp. in the final effluents of wastewater treatment facilities in two districts of the Eastern Cape Province of South Africa: Implications for public health. Environ. Sci. Pollut. Res. Int. 2015, 22, 2008–2017. [Google Scholar] [CrossRef] [PubMed]
  61. Payment, P.; Locas, A. Pathogens in water: Value and limits of correlation with microbial indicators. Ground Water 2011, 49, 4–11. [Google Scholar] [CrossRef] [PubMed]
  62. Jindal, A.K.; Pandya, K.; Khan, I.D. Antimicrobial resistance: A public health challenge. Med. J. Armed Forces India 2015, 71, 178–181, PMCID:PMC4388962. [Google Scholar] [CrossRef] [PubMed]
  63. Letchumanan, V.; Yin, W.; Lee, L.; Chan, K. Prevalence and antimicrobial susceptibility of Vibrio parahaemolyticus isolated from retail shrimps in Malaysia. Front. Microbiol. 2015, 6, 1–11. [Google Scholar] [CrossRef] [PubMed]
  64. Wright, G.D. Antibiotic resistance in the environment: A link to the clinic? Curr. Opin. Microbiol. 2010, 13, 589–594. [Google Scholar] [CrossRef] [PubMed]
  65. Hocquet, D.; Muller, A.; Bertrand, X. What happens in hospital does not stay in hospital: Antibiotic-resistant bacteria in hospital wastewater systems. J. Hosp. Infect. 2016, 93, 395–402. [Google Scholar] [CrossRef] [PubMed]
  66. Kyselková, M.; Chron̂áková, A.; Volná, L.; Nĕmec, J.; Ulmann, V.; Scharfen, J.; Elhottová, D. Tetracycline Resistance and Presence of Tetracycline Resistance Determinants tet(V) and tap in Rapidly Growing Mycobacteria from Agricultural Soils and Clinical Isolates. Microbes Environ. 2012, 27, 413–422. [Google Scholar] [CrossRef] [PubMed]
Figure 1. A map showing the location of the two wastewater treatment plants selected for the study.
Water 09 00562 g001
Figure 2. Schematic representation of the work flow, from sample collection to data analysis.
Water 09 00562 g002
Figure 3. Molecular identification of E. coli isolates. Legend, Lane 1: 100 bp Molecular weight marker; Lane 2: Positive control (E. coli ATCC 25922 strain); Lane 3: Negative control; Lanes 4 to 13 E. coli isolates.
Water 09 00562 g003
Figure 4. Molecular identification of Vibrio spp. isolates. Legend, Lane 1: 100 bp Molecular weight marker; Lane 2: Positive control (DSM 11058 strain); Lane 3: Negative control; Lanes 4 to 13 Vibrio spp. isolates.
Water 09 00562 g004
Figure 5. Antibiotic profiles of some of the randomly selected polymerase chain reaction (PCR)-confirmed Vibrio isolates recovered in the study, showing percentage resistance against the test antibiotic in the study (N = 205).
Water 09 00562 g005
Table 1. The average mean of the physicochemical parameters assessed at the S-wastewater treatment plant (SWWTP).
ParametersSept. ’12Oct. ’12Nov. ’12Dec. ’12Jan. ’13Feb. ’13Mar. ’13Apr. ’13May ’13June ’13July ’13Aug. ’13
pH6.7 ± 0.17.6 ± 07.0± 06.9 ± 07.3 ± 07.3 ± 07.2 ± 07.3 ± 07.3 ± 07.4 ± 07.1 ± 07.3 ± 0
TDS (mg/L)95 ± 7143 ± 3155 ± 1129 ± 3107 ± 3145 ± 2148 ± 17104 ± 1100 ± 1165 ± 6105 ± 5123 ± 11
EC (mS/cm)148 ± 23224 ± 5242 ± 1201 ± 5167 ± 4226 ± 3231 ± 26163 ± 1134 ± 1257 ± 9164 ± 7192 ± 18
Temp (°C)15 ± 121 ± 125 ± 027 ± 121 ± 123 ± 026 ± 118 ± 016 ± 114 ± 114 ± 017 ± 1
Turbidity (NTU)2.9 ± 0.34.0 ± 0.210.6 ± 0.73.5 ± 0.33.2 ± 0.114.3 ± 0.624.7 ± 2.09.2 ± 2.71.5 ± 0.49.1 ± 0.73.1 ± 0.66.3 ± 2.3
Free Cl (mg/L)0.23 ± 0.100.11 ± 0.030.49 ± 0.030.28 ± 0.030.15 ± 0.030.21 ± 0.010.38 ±0.040.10 ± 0.040.23 ± 0.010.39 ± 0.010.10 ± 0.020.14 ± 0.02
DO (mg/L)8.6 ± 0.44.8 ± 0.15.2 ± 0.17.9 ± 0.35.4 ± 0.14.5 ± 0.14.2 ± 0.15.3 ± 08.1 ± 0.38.6 ± 0.15.3 ± 0.15.1 ± 0.1
BOD5 (mg/L)0.13 ± 0.777.14 ± 0.233.6 ± 0.416.88 ± 0.103.42 ± 0.050.60 ± 0.023.88 ± 0.086.47 ± 0.110.13 ± 0.150.30 ± 0.720.24 ± 0.058.43 ± 0.21
NO3 (mg/L)1.04 ± 0.093.10 ± 0.174.30 ± 0.235.03 ± 0.213.18 ± 0.537.91 ± 0.355.03 ± 0.768.10 ± 1.323.50 ± 0.614.43 ± 0.935.50 ± 0.43.30 ± 1.0
NO2 (mg/L)0.22 ± 0.090.14 ± 0.010.11 ± 0.010.24 ± 0.040.16 ± 0.050.21 ± 0.000.20 ±0.010.36 ± 0.070.15 ± 0.010.20 ± 0.030.33 ± 0.060.17 ± 0.02
PO4 (mg/L)1.03 ± 0.031.58 ± 0.0216.10 ± 0.252.72 ± 0.061.63 ± 0.1510.20 ± 0.215.40 ± 1.561.09 ± 0.069.80 ± 0.32.41 ± 0.131.03 ± 0.021.07 ± 0.17
COD (mg/L)680 ± 4176 ± 16140 ± 2989 ± 1332 ± 13222 ± 40266 ± 4427 ± 17153 ± 15103 ± 33195 ± 3161 ± 2
Table 2. The average mean of the physicochemical parameters assessed at K-wastewater treatment plant (KWWTP).
ParametersSept. ’12Oct. ’12Nov. ’12Dec. ’12Jan. ’13Feb. ’13Mar. ’13Apr. ’13May ’13June ’13July ’13Aug. ’13
pH6.9 ± 0.16.5 ± 0.27.1 ± 06.9 ± 07.2 ± 07.3 ± 07.2 ± 07.3 ± 07.2 ± 07.4 ± 07.2 ± 07.3 ± 0
TDS (mg/L)157 ± 1146 ± 1171 ± 0146 ± 3129 ± 2107 ± 10111 ± 3142 ± 5138 ± 3161 ± 10124 ± 7113 ± 6
EC (mS/cm)246 ± 3228 ± 1267 ± 0228 ± 4201 ± 3167 ± 15176 ± 5196 ± 7222 ± 5249 ± 15177 ± 11184 ± 9
Temp (°C)15 ± 218 ± 123 ± 122 ± 120 ± 023 ± 125 ±118 ± 115 ± 012 ± 014 ± 113 ± 1
Turbidity (NTU)21.8 ± 1.751.3 ± 1.958.8 ± 0.222.3 ± 1.813.7 ± 1.89.8 ± 0.111.7 ± 0.66.1 ± 1.165.7 ± 5.621.4 ± 2.250.7 ± 9.759.0 ± 3.0
Free Cl (mg/L)0.12 ± 0.030.53 ± 0.030.21 ± 0.10.37 ± 0.050.72 ± 0.040.13 ± 0.020.68 ± 0.100.08 ± 0.010.16 ± 0.040.39 ± 0.030.29 ± 0.010.15 ± 0.02
DO (mg/L)2.4 ± 0.32.6 ± 02.1 ± 0.12.5 ± 0.12.6 ± 0.28.2 ± 07.3 ± 0.17.1 ± 0.29.2 ± 08.9 ± 0.29.8 ± 0.19.5 ± 0.1
BOD5 (mg/L)5.03 ± 0.250.88 ± 0.161.71 ± 0.152.43 ± 0.141.17 ± 0.084.77 ± 0.350.19 ± 0.088.14 ± 0.444.05 ± 1.379.81 ± 0.900.38 ± 0.015.06 ± 0.28
NO3 (mg/L)7.40 ± 0.725.33 ± 1.274.30 ± 0.405.50 ± 0.176.70 ± 0.5019.60 ± 0.207.40 ± 0.5321.50 ± 0.4013.40 ± 2.9014.90 ± 1.0019.70 ± 0.8017.60 ± 1.80
NO2 (mg/L)0.45 ± 0.030.34 ± 0.010.22 ± 0.010.16 ± 0.010.76 ± 0.010.19 ± 0.030.19 ± 0.010.23 ± 0.020.31 ± 0.030.29 ± 0.020.19 ± 0.010.23 ± 0.02
PO4 (mg/L)3.04 ± 0.132.19 ± 0.044.52 ± 0.022.86 ± 0.012.32 ± 0.1414.70 ± 0.6013.30 ± 1.5011.60 ± 0.5018.30 ± 1.703.26 ± 0.163.83 ± 0.032.89 ± 0.16
COD (mg/L)482 ± 17148 ± 12650 ± 3232 ± 12176 ± 40121 ± 16118 ± 1692 ± 10318 ± 26143 ± 11215 ± 13277 ± 2
Table 3. The average mean of the bacteria counts at the two study sites.
Sampling SiteTarget BacteriaMean Bacteria Count per Sampling Month
Sept. ’12Oct. ’12Nov. ’12Dec. ’12Jan. ’13Feb. ’13Mar. ’13Apr. ’13May ’13June ’13July ’13Aug. ’13
SWWTPE. coli522.9 × 104231.3 × 1021.0 × 1039.1 × 1036.9 × 1031.0 × 103566.5 × 1021.2 × 1054.1 × 103
Vibrio spp.3.9 × 1022.1 × 1034.5 × 1023.1 × 102249.3 × 1024.4 × 1024.0 × 10211411.6 × 1031.4 × 102
KWWTPE. coli1.4 × 1032.3 × 1037.1 × 1034.9 × 1021.4 × 1021936.4 × 103304.8 × 10258.4 × 102
Vibrio spp.2.7 × 1027.7 × 1021.4 × 104563.1 × 10237141.1 × 103481.3 × 103201.6 × 102
Table 4. Detection of resistance genes in antibiotic-resistant Vibrio isolates.
Antibiotic to which Resistance was DetectedAntibiotic Resistance ProbeNumber of Isolates TestedNumber (%) of Positive Isolates
Β-Lactam (Ampicilin, Imipenem, Meropenem)blaTEM188 (44.4)
blaSHV187 (38.9)
blaZ180
blaCTX-M185 (27.8)
Aminoglycosides (Amikacin, Streptomycin, Gentamycin, Neomycin)aadA256 (24)
strA2510 (40)
Tetracycline (Tetracycline)tetA10019 (19)
tetB10023 (23)
tetK1002 (2)
tetM10047 (47)

