Study on Effects of Electron Donors on Phosphine Production from Anaerobic Activated Sludge
by
 ,
,
Jianping Cao
1,2, 
Chaosheng Zhang
1,*,
Hongwei Rong
1,
Meihua Zhao
1,*,
Wei Wei
1 and
Limin Zhao
1 1
Key Laboratory for Water Quality Security and Protection in Pearl River Delta (Ministry of Education and Guangdong Province), Guangzhou University, Guangzhou 510006, China
2
College of Water Resource and Environmental Engineering, East China Institute of Technology, Nanchang 330013, China
*
Authors to whom correspondence should be addressed.
Water 2017, 9(8), 563; https://doi.org/10.3390/w9080563
Submission received: 12 June 2017
/
Revised: 13 July 2017
/
Accepted: 24 July 2017
/
Published: 30 July 2017
(This article belongs to the Special Issue Biological Treatment of Wastewater)
Abstract
:The effects of different types and concentrations of electron donors (glucose, starch, methanol and sodium acetate) on the formation of phosphine from anaerobic activated sludge that has been domesticated for a prolonged period were studied in small batch experiments. The results show that types and concentrations of electron donor have significant effects on the production of phosphine from anaerobic activated sludge. Among them, glucose was the most favourable electron donor, whereas sodium acetate was the least favourable electron donor for the removal of phosphorus and the production of phosphine. Higher concentrations of electron donors were more favourable for the reduction of phosphate into phosphine, and supplying more than nine times the amount of electron donor as theoretically required for the reduction of phosphate into phosphine was favourable for the production of phosphine.
1. Introduction
Devai et al. discovered phosphine in the volatiles of sewage treatment plants for the first time in 1988 [1]. Since then, numerous studies have shown that phosphine is widely present in natural and artificial environments, including soil [2,3] and sludge [4,5], indicating that phosphine is a trace gas with some possible relevance to global biogeochemical phosphorus cycling. Phosphine exists in two different forms: free phosphine (PH3) and matrix-bound phosphine (MBP) [6]. In previous studies, the range of detected phosphine concentrations in natural environments was relatively low, at 0–600.2 ng/m3 [7,8,9]. Therefore, improving the concentration of phosphine generated through acclimation is very important research work. Previous studies suggested that phosphine is generated through the hydrolysis of inorganic phosphides and by oxidation of organics during the metabolism processes of anaerobic microorganisms [10,11,12,13], and that methane and phosphine are produced by different microorganisms within the same environment [14,15]. At pH = 7.0, the reduction of phosphate into phosphine is an endergonic reaction and that an adequate amount of electron donors is a prerequisite for the oxidation-reduction (redox) reaction [16]. Recent studies on the removal of phosphorus from sewage in the form of phosphine have mainly focused on the selection of the initial sludge for phosphine production [17,18], phosphorus removal outcomes [19,20], and influencing factors [21,22,23], among others. On the other hand, studies on the reduction of phosphate in terms of the competitive relationship between phosphate-reducing bacteria and methanogenic bacteria for electron donors are relatively rare. Therefore, we carried out small batch experiments to study the effects of different electron donor types (glucose, starch, methanol and sodium acetate) and concentrations on the generation of phosphine using natural anaerobic activated sludge as the sludge source after a long period of acclimation, in order to provide a reference for studying the mechanism of phosphine formation.
2. Materials and Methods
2.1. Experimental Materials
The sludge for acclimation was collected from the sediment of a natural domestic sewage drainage system in the Beiting Village of the Guangzhou Higher Education Mega Centre (HEMC), which exhibits severe eutrophication and relatively high phosphorus content.
Composition of the culture medium: ammonium chloride (500 mg/L) was used as a nitrogen source, potassium dihydrogen phosphate (40 mg/L of total phosphorus, TP) and trace element solutions were added according to Table 1. The medium was adjusted to a pH of approximately 7.0 using a sodium bicarbonate buffer.
Electron donors used in this study included glucose, starch, methanol and sodium acetate, which were added at concentrations of 1.10 mmol/L (starch was added at 0.9 times the mass of glucose). In addition, a blank control-check (CK) sample without the addition of any electron donor was prepared.
2.2. Instruments and Reagents
Instruments: An Agilent 7890A gas chromatograph (GC) equipped with a nitrogen-phosphorus detector (NPD) (Agilent Technologies, Inc., Santa Clara, CA, USA), an HP-5 capillary column (30 m × 0.53 mm × 1.5 µm, Agilent Technologies, Inc.) and an AutoTDS-IV secondary thermal desorption system (Beijing Touch Science MS Co., Ltd., Beijing, China); and a GC7900 gas chromatograph (Techcomp China Co., Ltd., Beijing, China) equipped with a thermal conductivity detector (TCD) and a TDX-1-column (2.0 m × 0.53 mm) (Agilent Technologies, Inc.). All culture medium components and reagents were of analytical grade and purchased from Shanghai Aladdin Bio-Chem Technology Co., Ltd., Shanghai, China.
2.3. Apparatus and Methods
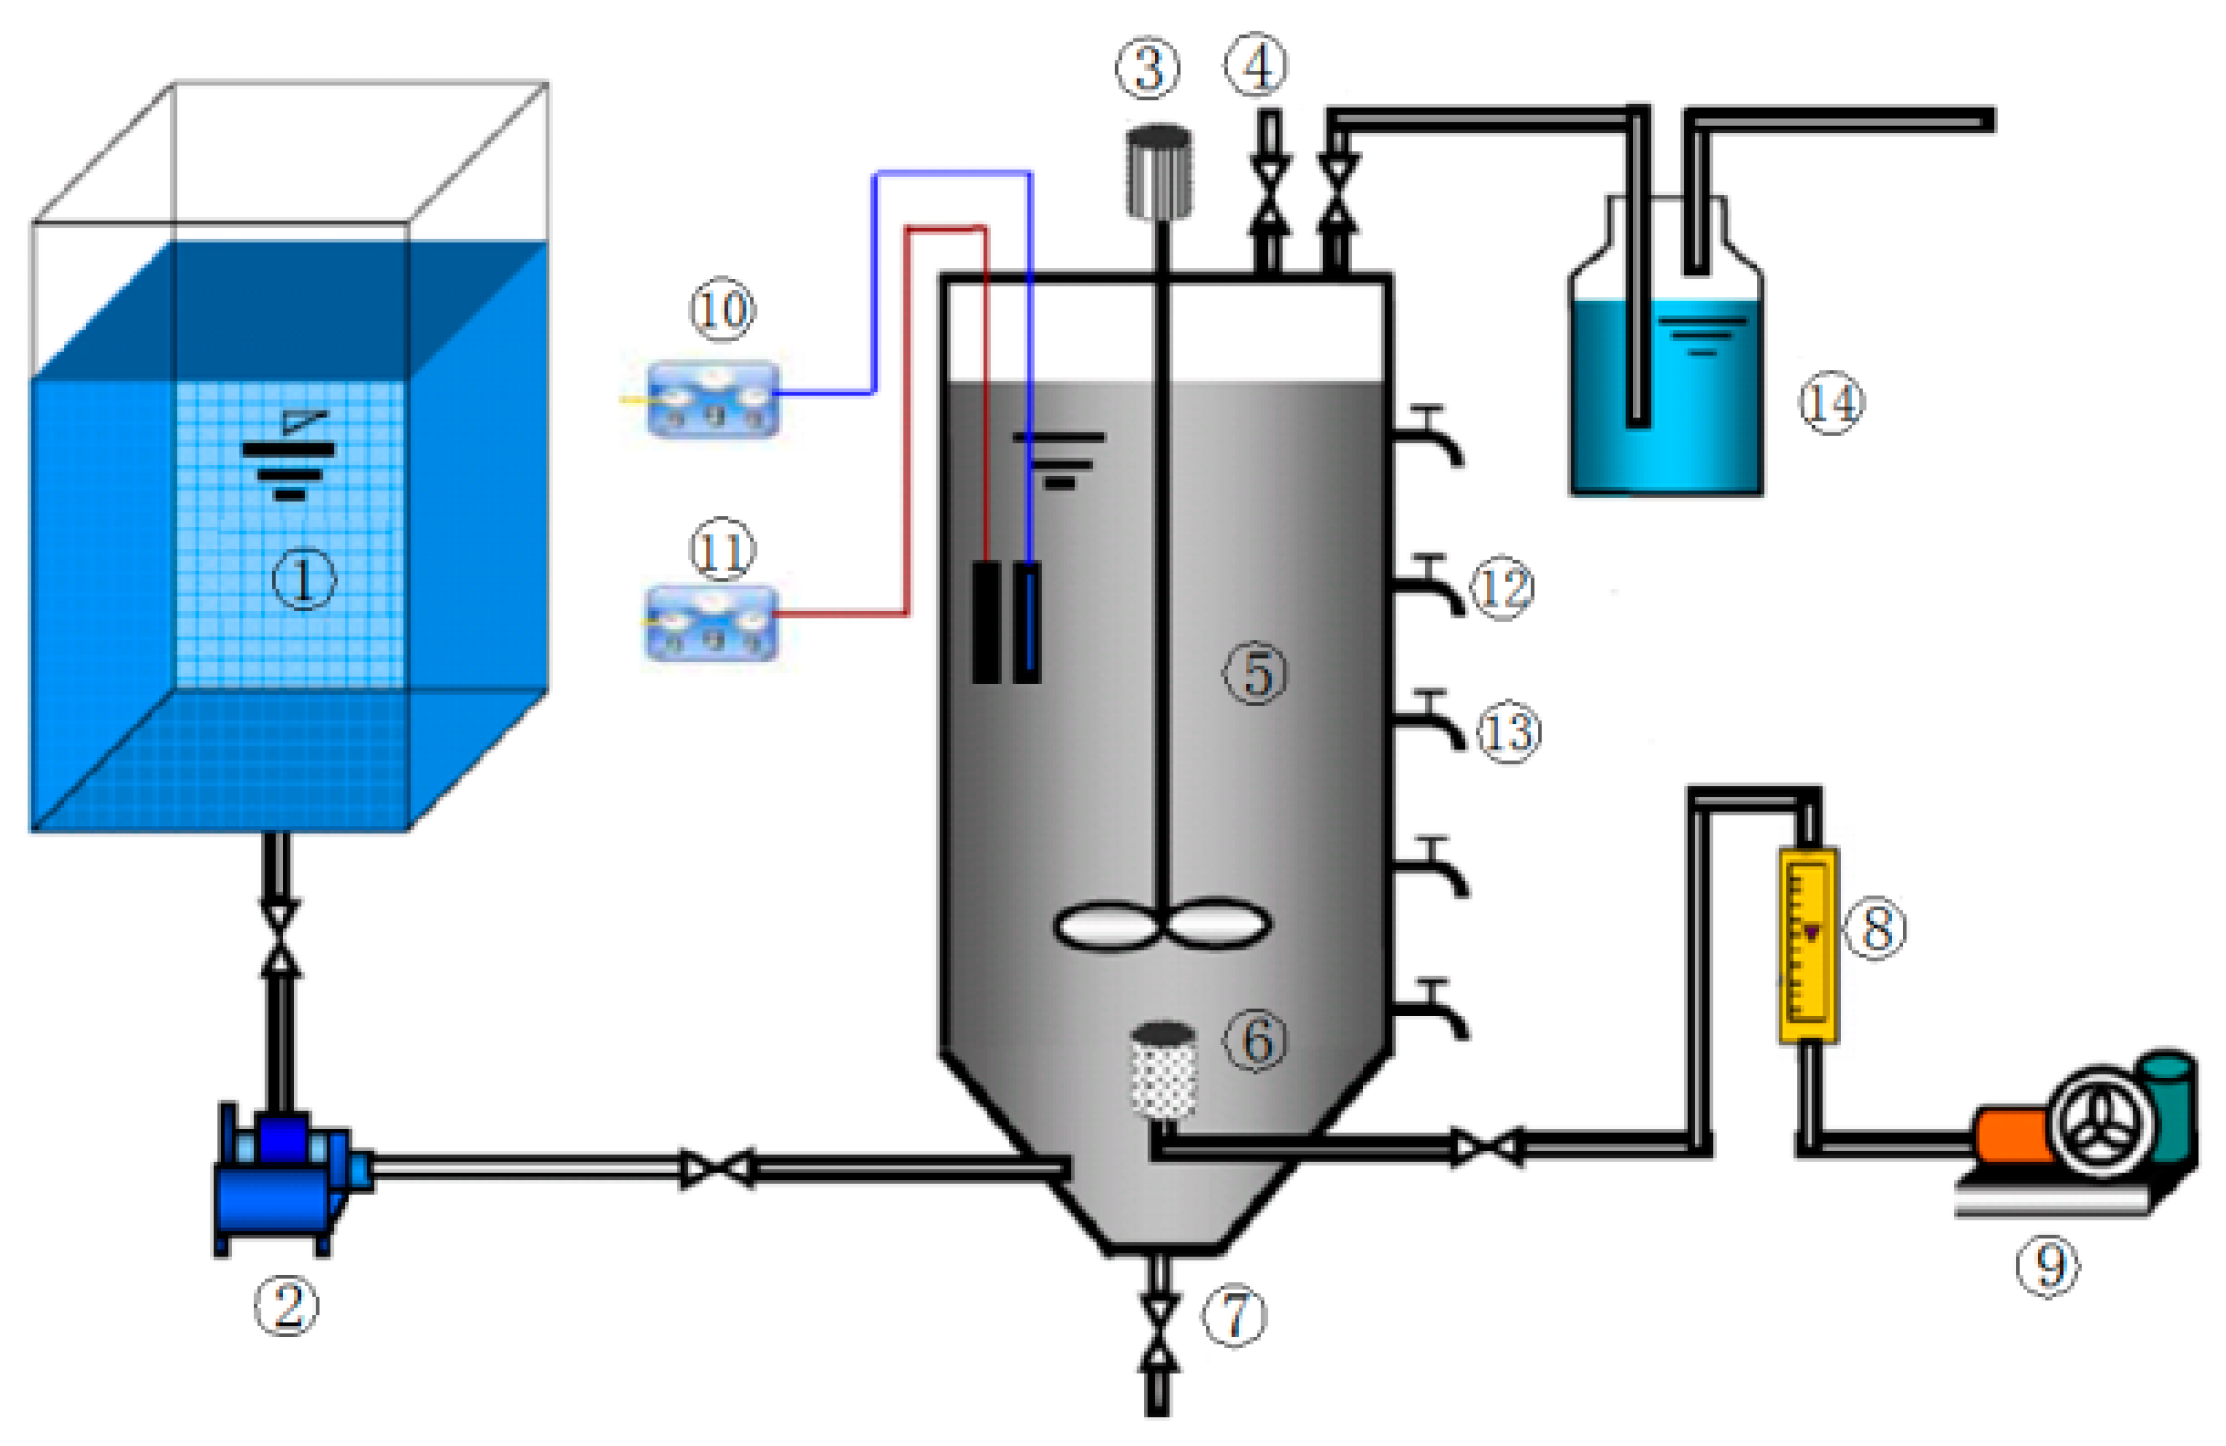
Apparatus and methods for the acclimation of sludge: An anaerobic sequencing batch reactor (ASBR) with an effective volume of 20 L, as shown in Figure 1, was used for sludge acclimation, which was carried out for 6 months under the conditions: ORP (Oxidation-reduction potential) ≤−300 mV, pH = 6.8–7.5, temperature = 35 °C, with intermittent mixing in the dark. After every 4 days of incubation, 8 L of culture medium containing glucose as the carbon source (deoxygenated by purging with high-purity nitrogen for 5 min) was added until stable phosphate removal and PH3 formation was achieved, after which the acclimated sludge was subjected to further testing.
The effects of total phosphorus removal and phosphine production were studied in a small batch experiments by varying one factor at a time (different electron donors or C/P). The methods used are described below: A 100 mL sample of evenly mixed sludge was added to 300 mL of culture medium (the final sludge concentration was about 25 g/L) in a 500 mL medical-grade serum bottle, which was then sealed with phosphine-inert Viton stoppers and deoxygenated by purging with high-purity nitrogen for 5 min. After this, the serum bottle was connected to a gas-sampling bag and incubated at 35 °C in a water bath. A blank control-check was also prepared using an electron-donor-free culture medium. The culture was shaken every 12 h and sampled every 24 h for further analysis.
2.4. Analyses and Methods
(1) PH3: The headspace gas was collected in a black Tedlar gas-sampling bag from which 50 mL of the gas was withdrawn and passed through a glass tube filled with solid sodium hydroxide. After removing the hydrogen sulfide and other acidic gases, the gas was enriched using a secondary thermal desorption system prior to measurement using a gas chromatograph (GC) system equipped with an NPD with Blos beads and an HP-5 capillary column (5% phenyl + 95% poly dimethyl siloxane, 30 m × 0.53 mm × 1.5 µm). The column and detector temperatures were 40 °C and 300 °C, respectively. The enrichment column was a two-segment (column lengths were 0.8 and 0.3 m) HP-PLOT-Q capillary column (30 m × 0.53 mm × 40 µm). The flow rates of the carrier gas (nitrogen) and air were 5.5 and 120 mL/min, respectively, with a split ratio of 2:1. On the other hand, the flow rates of hydrogen and the make-up flow of nitrogen were 3 and 4.5 mL/min, respectively. The detection voltage was approximately 1.08 V while the control signal output was approximately 10 pA.
(2) MBP: 1 mL of sludge mixture was digested with 0.5 mol/L of sulfuric acid [24], and the resulting 50 mL of gas mixture was replaced with nitrogen gas and analysed according to the method described in (1).
(3) Methane: 1 mL of the biogas was withdrawn from the gas-sampling bag using a 1 mL SGE micro-syringe, and was analysed isothermally at 150 °C using the GC7900 gas chromatograph equipped with a TCD and the TDX-1-column (2.0 m × 0.53 mm). The injector and detector temperatures were 120 and 220 °C, respectively.
(4) Total phosphorus (TP): The supernatant was filtered through a 0.45 µm filter membrane and the filtrate digested with potassium persulfate prior to ammonium molybdate spectrophotometric measurements.
(5) Chemical oxygen demand (COD): This test was carried out using the potassium dichromate titration method in an XJ-I COD Digestion System.
2.5. Sampling Procedures
Each sample was subjected to gas, water and sludge sampling every 24 h. The headspace gas was sampled by closing the valve to the gas-sampling bag, which was then unplugged from the stopper of the serum bottle. Subsequently, 50 mL of the gas sample was withdrawn using a 60 mL airtight plastic syringe to facilitate GC analysis and quantification of biogas production. Meanwhile, the supernatant was withdrawn from the serum bottle for COD and TP measurements, using a 10 mL plastic syringe. The supernatant was also filtered through a 0.45 µm filter membrane for the determination of TP. Finally, the serum bottle was shaken well and 1 mL of the evenly mixed slurry was withdrawn using a pipette gun for the measurement of MBP.
3. Results and Discussion
3.1. TP Removal and Phosphine Concentration During the Sludge Acclimation Process
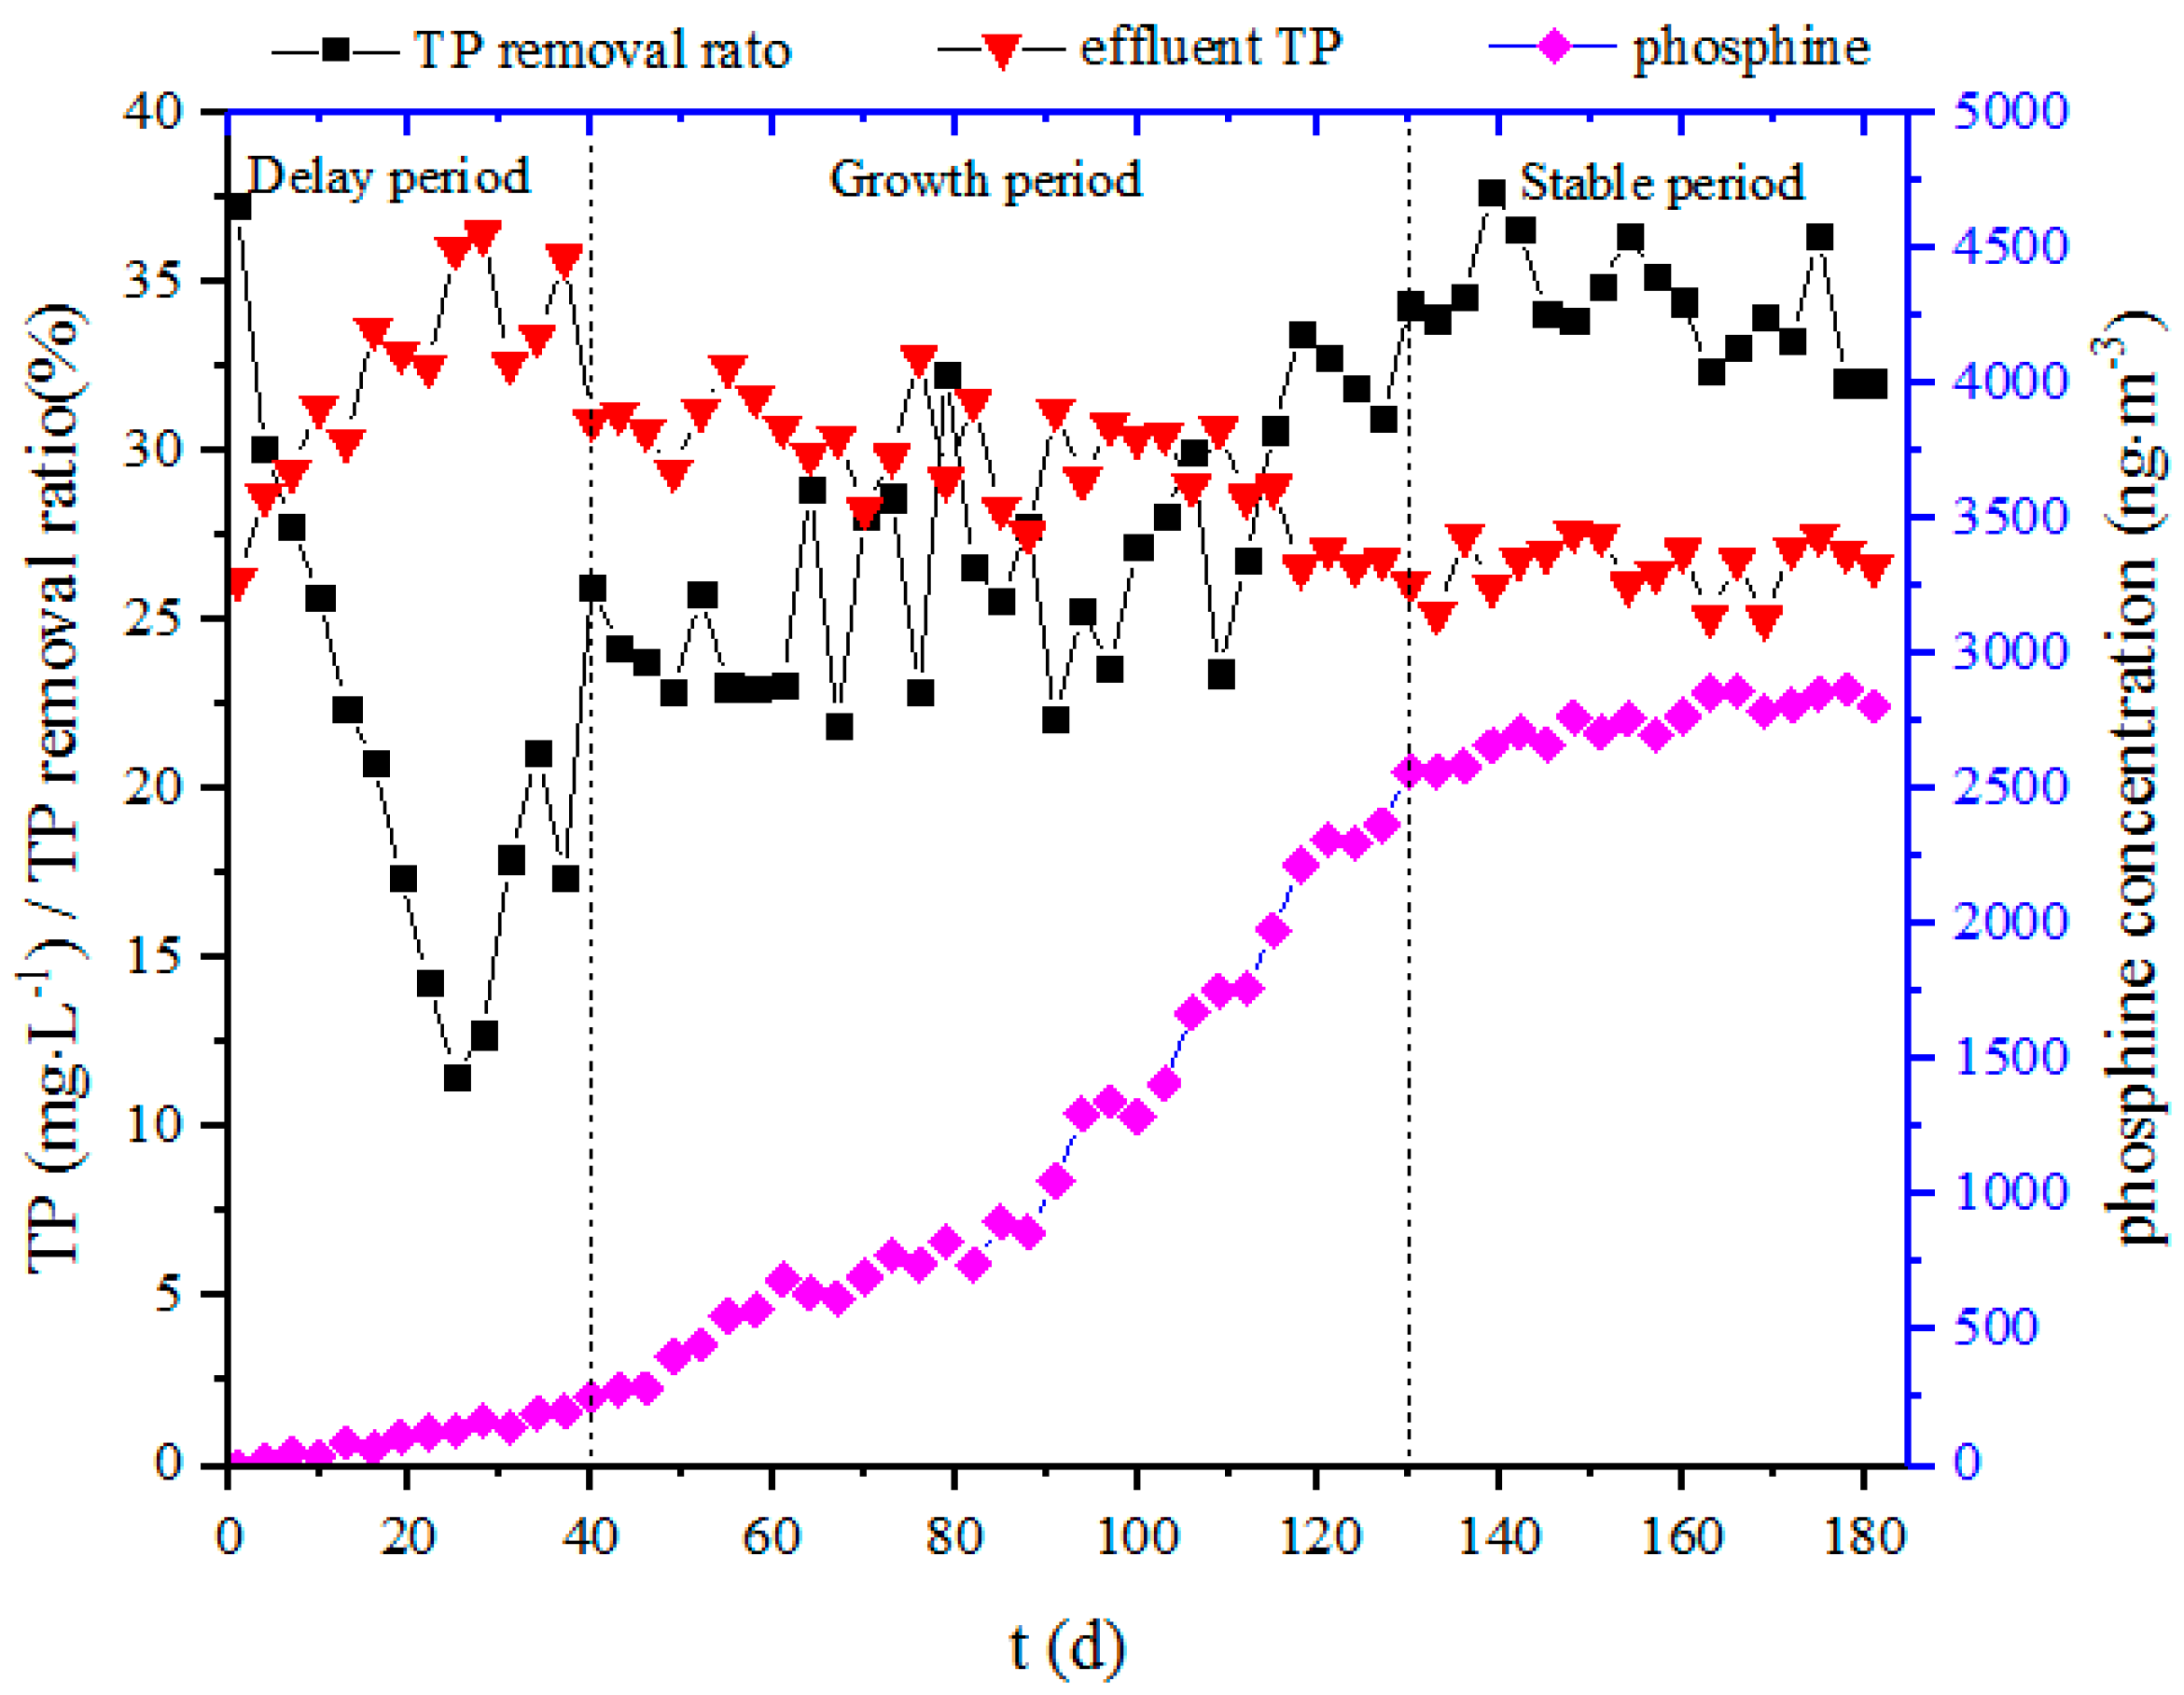
The sludge was acclimated for a long period time (181 days, Figure 2). Due to the abating dilution effect, the TP concentration of the effluent increased from 26.2 to 36.4 mg/L over the first 25 days, and the corresponding TP removal rate gradually decreased from 37.2% to 12.7%. Subsequently, the TP removal rate rose gradually, and a stable TP removal rate of about 36% was finally obtained. The phosphine concentration in the biogas indicated that the microorganisms for phosphine production had undergone three stages of proliferation (a delay period, a growth period and a stable period). After 91 days of acclimation, the phosphine concentration in the biogas reached 1 µg/m3, and stabilized at about 2.8 µg/m3 at the end of the acclimation. This showed that the sludge had acclimated successfully, and that a microbial system of anaerobic phosphine production was achieved. The stable production of phosphine created very good conditions for subsequent experiments. However, the system loses about 80 mg of TP per day during the stabilization phase of the acclimation process; the mass of detected phosphine is only about 50 µg per day (2.8 µg/m3 × 0.018 m3 biogas volume ≈ 50.4 µg), which accounts for only 1/1600 of the TP loss of the system. We assume that the lost TP is mainly transferred to the solid phase. The transfer mechanism and pathway need to be further studied.
3.2. Effects of Electron Donor Types on the Removal of TP
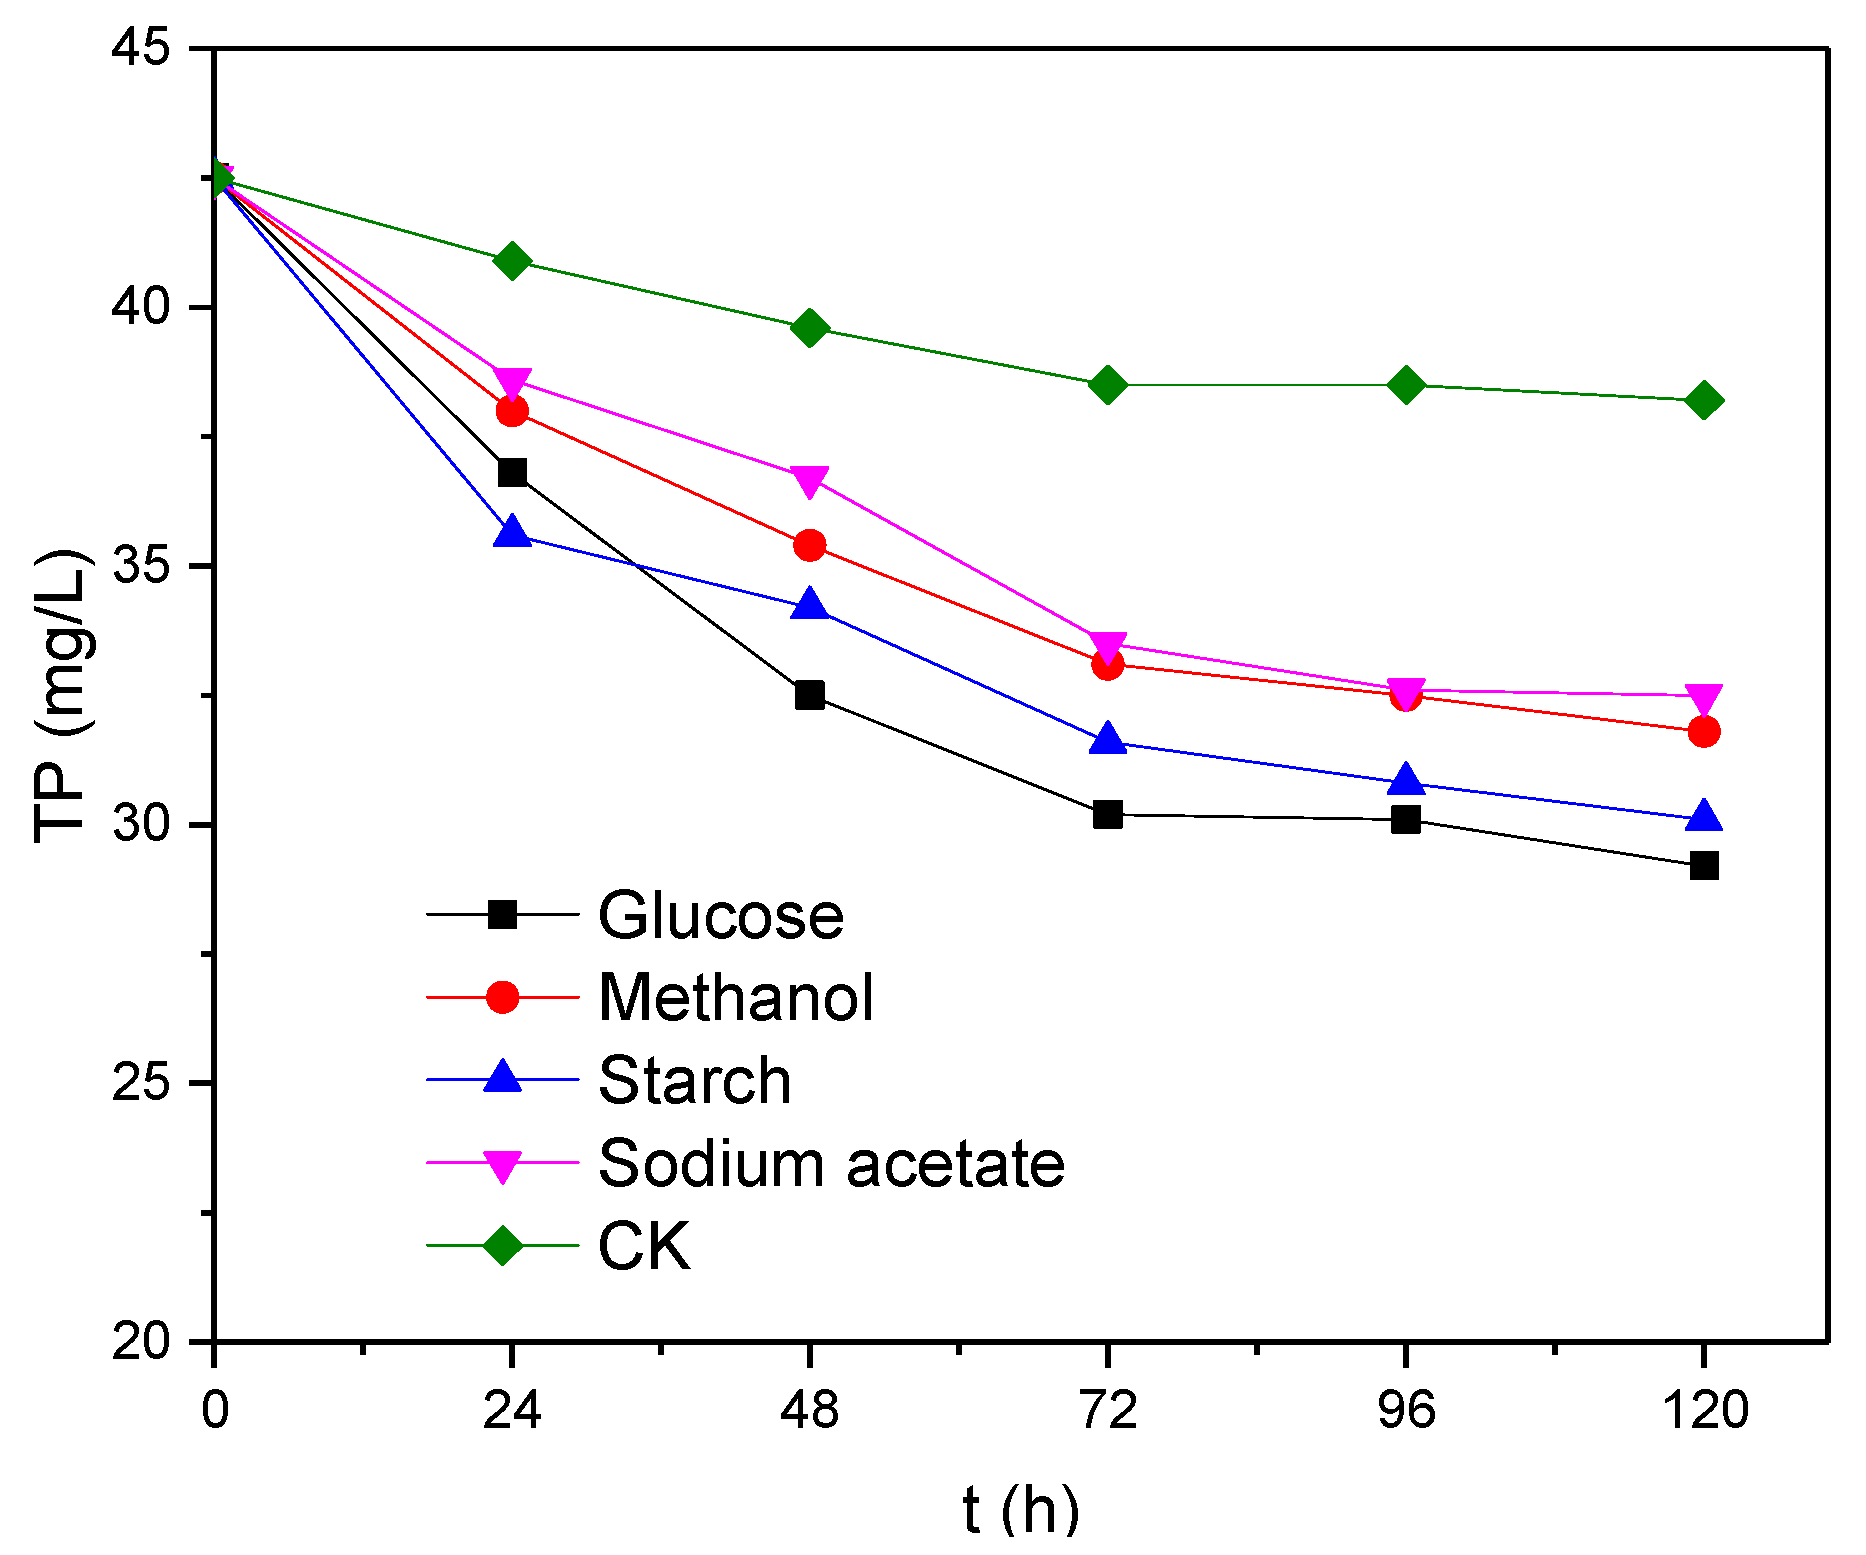
It can be seen from Figure 3 that the level of TP decreased over time in the presence of different electron donors. After 120 h of reaction with glucose, methanol, starch and sodium acetate as electron donors, 13.3, 12.4, 10.7 and 10.0 mg/L of TP have been removed, respectively. Of these, glucose was the most favourable electron donor for the removal of TP, whereas sodium acetate was the least favourable. Only 4.3 mg/L of TP was removed from the electron-donor-free blank (CK) sample, which is equivalent to ~1/3 of the value observed when glucose was used as the electron donor. This indicates that the electron donor has a significant effect on the removal of phosphate from anaerobic activated sludge.
3.3. Effect of Electron Donor Types on Phosphine Production
This study found that the concentration range of PH3 in the biogas was 920–1250 ng/m3 in the small batch experiments (Table 2), and the concentration of PH3 had no significant correlation with the corresponding TP removal in the presence of different electron donors. The use of glucose as an electron donor resulted in the greatest TP removal, but the concentration of PH3 in the corresponding biogas was relatively low, which might be due to dilution of the desorbed phosphine by the larger amount of biogas generated. After calculating the total amount of PH3, we found that there was no significant difference in the total amount of PH3 in the biogas generated in the presence of the different electron donors (0.22–0.25 ng, Table 2). We also found that the sludge strongly adsorbed phosphine and that most of the produced phosphine existed in the form of MBP in the sludge, with quantities of phosphine in the MBP being 169 to 241 times higher than those of the biogas. Therefore, the analysis of phosphine production in this study focussed on the concentrations and quantities of MBP.
It can be seen from Figure 4 that MBP concentration tended to increase gradually with increasing reaction time in the presence of the different electron donors. Again, the use of glucose as an electron donor resulted in the highest MBP concentration, reaching 5763 ng/kg (dry weight) after 120 h of reaction, followed by starch (5056 ng/kg, dry weight), methanol (3789 ng/kg, dry weight) and sodium acetate (3508 ng/kg, dry weight), indicating that glucose is the most favourable electron donor for the production of phosphine from anaerobic sludge. The production of MBP increased but its productivity decreased gradually with increasing reaction time. The highest productivity was achieved between 0 and 24 h, with the highest electron donor and electron acceptor concentrations. Comparison with the CK sample shows that the addition of an electron donor elevated the concentration of MBP by a factor of 7–10, indicating that electron donors exhibit a significant promoting effect on the reduction of phosphate into phosphine.
The reductions of sulfate and nitrate are two common respiratory reactions in the anaerobic environment that are capable of using non-fermentable carbon sources as electron donors [14]. Phosphine can also be produced by anaerobic cultures using non-fermentable carbon sources as electron donors, indicating that the production of phosphine may occur through a phosphate respiratory mechanism similar to those of sulfate and nitrate. To investigate this, sodium acetate was selected as a non-fermentable carbon source for cultivation, and the experimental results showed that significant amounts of phosphine were produced, but that the amount of MBP produced was less than observed using fermentable carbon sources such as glucose and starch. If phosphine production indeed occurs via a respiratory mechanism, the system has a relatively higher redox potential with a weaker reducing power, as the sodium acetate provides fewer electrons to the respiratory chain at the same molar concentration, thereby leading to a lower amount of phosphine production from the reduction of phosphate. One mole of glucose can be fully oxidized to produce 24 mol of electrons that can reduce 3 mol of phosphate to phosphine, but 1 mol of sodium acetate can only provide 8 mol of electrons that can reduce 1 mol of phosphate to phosphine.
3.4. Effects of Electron Donor Concentration on Phosphine Production
If phosphine is generated by phosphate-reducing bacteria in the presence of glucose as an electron donor and potassium dihydrogen phosphate as an electron acceptor, it probably occurs via the following reaction: C6H12O6 + 3HPO42− + 6H+ → 6CO2 + 6H2O + 3PH3. In order to study the effects of electron donor concentration on the reduction of phosphate, changes in MBP production at glucose-to-potassium dihydrogen phosphate molar (C/P) ratios of 1:3, 1:1, 3:1 and 6:1 were examined using potassium dihydrogen phosphate as an electron acceptor with a TP level of approximately 40 mg/L; the results are shown in Figure 5. It can be seen that MBP production was much higher at high C/P (C:P = 3:1 and 6:1) than at low C/P (C:P = 1:3 and 1:1). We infer that when C:P = 1:3, the available electron donors were theoretically adequate for the reduction of phosphate, but in reality there were other reactions that consumed electron donors, such as the production of methane and the reduction of sulfate, leading to a severe electron donor deficiency. This shortage was not significantly improved when the concentration of electron donors was increased three-fold (C:P = 1:1), with the highest MBP concentration being 2409–2879 ng/kg (dry weight), which is about half the concentration observed when C:P=3:1 or 6:1. The concentration of MBP produced increased to a greater extent when the concentration of electron donors was increased to more than nine times the theoretical amount required for the reduction of phosphate (i.e., to greater than C:P = 3:1), and there was still a significant increase after a reaction time of 24 h. A comparison of the results for C:P = 3:1 and 6:1 reveals that in the presence of an adequate supply of electron donors, production was limited by the abundance and reducing capability of the phosphate-reducing bacteria, hence it was difficult to enhance MBP production further by increasing the supply of electron donors. When electron donors were in inadequate supply, the phosphate-reducing bacteria were at a relative disadvantage when competing for electron donors with other bacteria such as methanogenic bacteria, resulting in relatively lower MBP productivity and production. Thus, an adequate supply of electron donors is a prerequisite for the reduction of phosphate [16]. In practice, the reduction of phosphate requires at least nine times the amount of electron donor supply as theoretically demanded, i.e., a glucose-to-potassium dihydrogen phosphate molar ratio of in excess of 3:1.
3.5. Relationship between Methane Production and Phosphine Production
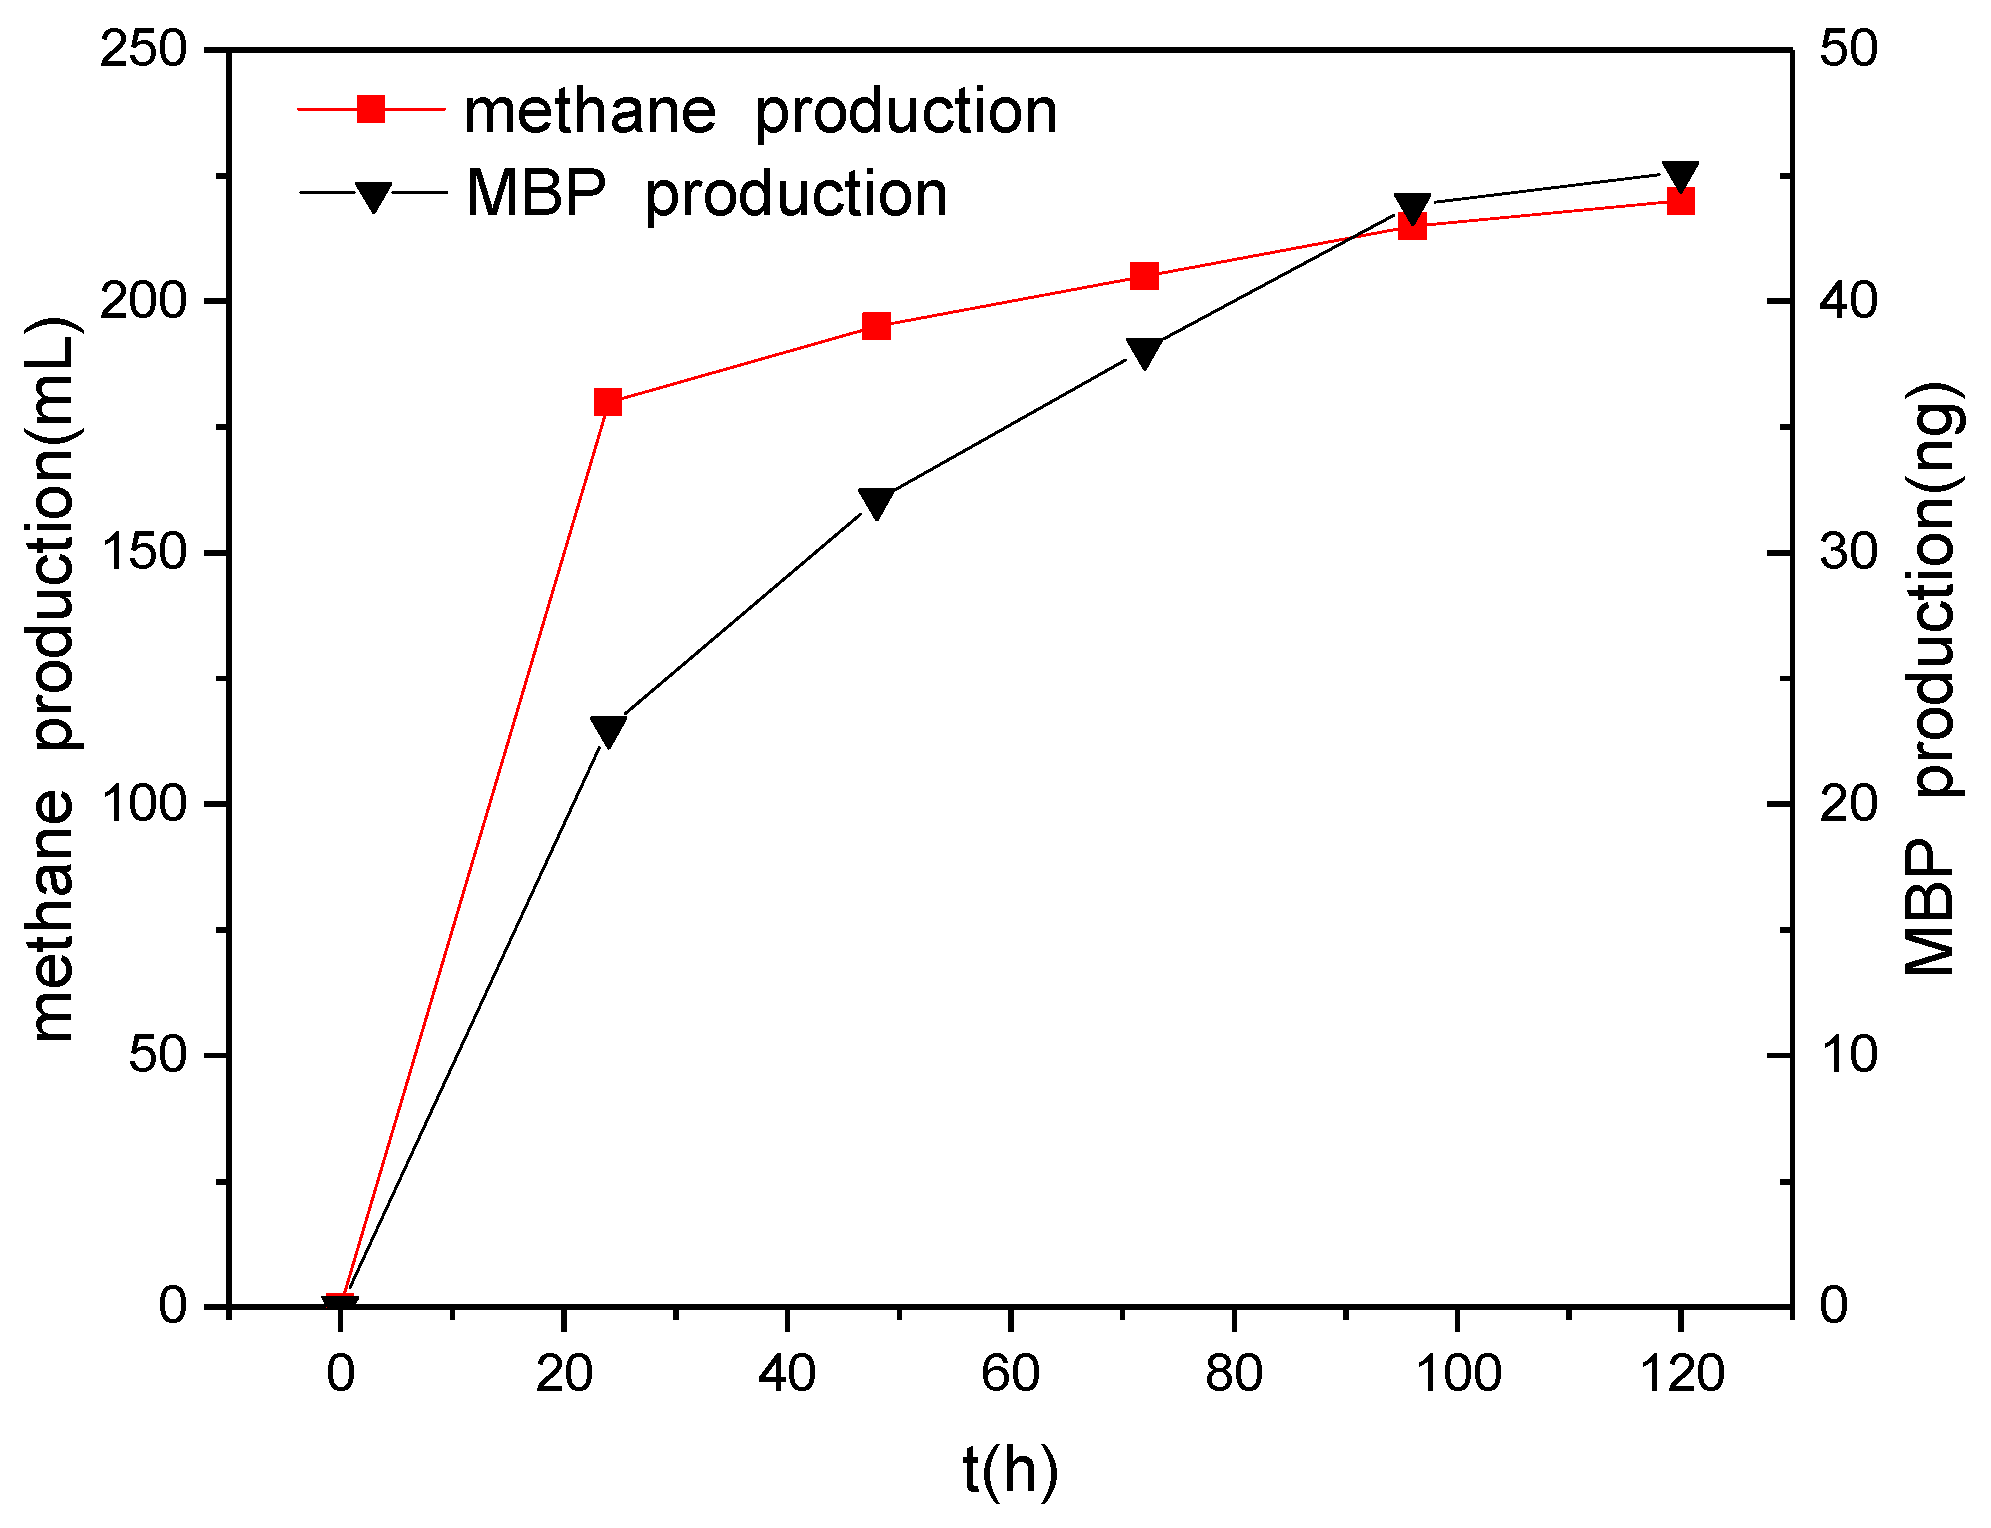
PH3 often coexists with methane in anaerobic environments. Eismann et al. studied the relationship between the formation of methane and PH3 and found that there was a linear correlation between the production of methane and the production of PH3 [25], suggesting that methanogenic bacteria can simultaneously produce both methane and PH3. However, Rutishauser et al. [14] and Jenkins et al. [15] demonstrated that methanogenic bacteria are incapable of producing PH3. In this study, we found that the first 24 h of methane production accounted for more than 80% of the total production in the presence of different electron donors. However, production of MBP over the first 24 h accounted for only about 50% (data not shown) of the total production, with MBP productivity remaining relatively high beyond this. Figure 6 shows how the productions of methane and MBP change over time when glucose is used as an electron donor. It can be seen that the production of MBP and methane trend similarly with time, but that the changes were not entirely synchronized, especially after 24 h, when the production of MBP accounted for a much higher percentage of the total production compared with methane. Hence, we speculate that methane and phosphine are produced under anaerobic conditions via two different biochemical reactions by methanogenic bacteria and phosphate-reducing bacteria. The methanogenic bacteria exhibited a significant competitive advantage over the phosphate-reducing bacteria in the presence of high concentrations of electron donors. The decrease in the concentration of electron donors had a greater effect on the production of methane by methanogenic bacteria than on the production of phosphine by phosphate-reducing bacteria. The decrease in the concentration of electron donors reduced the advantage of the methanogenic bacteria over the phosphate-reducing bacteria in the competition for electron donors.
3.6. Discussion of the Origin and Fate of Phosphine
Much is still unknown about the origin and fate of phosphine. There are two major viewpoints about the source of phosphine; non-living pathways and microbial pathways. Glindemann et al. [26] argued that phosphate, an impurity in iron–containing minerals, is reduced abiotically to iron phosphide. When iron is exposed to the environment and corrodes, the iron phosphide present in the iron hydrolyses to phosphine. Glindemann et al. [27] also found that organic compounds, including methane or the secondary hydrogen thereof, reduces phosphate to phosphine under simulated lightning in the laboratory. These two sources of phosphine could explain why there is a widespread presence of phosphine gas on Earth. However, other researchers believe that the production of phosphine and microbial activity are closely related. Rutishauser et al. [14] confirmed that inoculation with sterilized sewage sludge or sewage sludge added to a medium supplemented with formaldehyde or mercuric chloride exhibited the complete absence of phosphine after several days of incubation when phosphate was used as the source of phosphorus. Cao et al. [28] showed that the release of phosphine from a system that was not sterilized and had added lecithin, was significantly higher than that of the corresponding sterilized system. This indicates that phosphine originated from inorganic or organic phosphorus compounds by microbial activity. Pasek et al. [29] argued that phosphite and hypophosphite are produced as by-products of microbial phosphonate biosynthesis, and phosphite and hypophosphite then generate phosphine and phosphate through disproportionation reactions. From the viewpoint, it can be predicted that the rate and total amount of phosphine formed in cultures grown on hypophosphite exceeded those grown on phosphate. On the other hand, Rutishauser et al. [14] reported contradictory research findings. Furthermore, the hypophosphite-to-phosphine disproportionation requires heat; however, high-temperature conditions are not readily available in nature. The fact that the metabolic activity of microorganisms is a prerequisite for the production of phosphine from anaerobic activated sludge was confirmed by our team in early work. In this paper, we found that phosphine is also produced by anaerobic cultures using non-fermentable carbon sources as electron donors, and that electron-donor supply greatly influences the production of phosphine. As a consequence, we argue that the production of phosphine occurs through a phosphate respiratory mechanism involving microbes that is similar to that involved in the reduction of sulfate or nitrate.
Once phosphine is generated, most is absorbed by the sludge or other substrates, becoming MBP; only a small amount of phosphine liberated as free phosphine (PH3) by desorption [28,30,31]. This is an important reason for the very low concentration of phosphine in the atmosphere. PH3 in the atmosphere is oxidized by O2 and UVB radiation to produce P2H4, which is finally oxidized to phosphate [7,28,32]. The fate of MBP is still unknown; it may accumulate in the substrates [18], or it may disappear when the pH of the reactor drops to 4.0–5.0 [33].
4. Conclusions
(1) A microbial system for anaerobic phosphine production can be obtained by acclimating sludge from a natural domestic sewage system under anaerobic conditions; the concentration of phosphine in biogas can exceed 2.8 µg/m3.
(2) All types of electron donors affect the removal of TP and the formation of phosphine. Among them, glucose is the best electron donor, followed by starch, methanol and sodium acetate.
(3) High concentrations of electron donors are favourable for the reduction of phosphate into phosphine. An electron donor supply of greater than nine times the theoretical demand required for the reduction of phosphate is favourable for the production of phosphine.
(4) Methane and phosphine may be produced under anaerobic conditions via two different biochemical reactions involving different microorganisms, with the decrease in the concentration of electron donors exhibiting a greater effect on the production of methane by methanogenic bacteria than on the production of phosphine by phosphate-reducing bacteria.
Acknowledgments
The authors are grateful for the financial support from the National Natural Science Foundation of China (contract Nos. 21477027, 51278133), Science and Technology Projects of Guangdong province, China (contract No. 2014A020216048). Science and Technology Projects of the Education Department of Jiangxi Province, China (contract No. GJJ14482).
Author Contributions
Jianping Cao, Chaosheng Zhang, Meihua Zhao and Hongwei Rong conceived and designed the experiments; Jianping Cao and Limin Zhao performed the experiments; Jianping Cao and Wei Wei analysed the data; Jianping Cao, Wei Wei and Meihua Zhao wrote the paper.
Conflicts of Interest
The authors declare no conflict of interest.
References
- Devai, I.; Felfoldy, L.; Wittner, I.; Plosz, S. Detection of phosphine: New aspects of the phosphorus cycle in the hydrosphere. Nature 1988, 6171, 343–345. [Google Scholar] [CrossRef]
- Devai, I.; Delaune, R.D. Evidence for phosphine production and emission from Louisiana and Florida marsh soils. Org. Geochem. 1995, 3, 277–279. [Google Scholar] [CrossRef]
- Liang, J.; Feng, C.T.; Zeng, G.M. Spatial distribution and source identification of heavy metals in surface soils in a typical coal mine city, Lianyuan, China. Environ. Pollut. 2017, 225, 681–690. [Google Scholar] [CrossRef] [PubMed]
- Roels, J.; Van, L.H.; Verstraete, W. Determination of phosphine in biogas and sludge at ppt-levels with gas chromatography-thermionic specific detection. J. Chromatogr. 2002, 1, 229–237. [Google Scholar] [CrossRef]
- Roels, J.; Verstraete, W. Occurrence and origin of phosphine in landfill gas. Sci. Total Environ. 2004, 1, 185–196. [Google Scholar] [CrossRef] [PubMed]
- Gassmann, G. Phosphine in the fluvial and marine hydrosphere. Mar. Chem. 1994, 3, 197–205. [Google Scholar] [CrossRef]
- Glindemann, D.; Bergmann, A.; Stottmeister, U.; Gassmann, G. Phosphine in the lower terrestrial troposphere. Sci. Nat. 1996, 83, 131–133. [Google Scholar] [CrossRef]
- Liu, J.A.; Kuschk, P.; Eismann, F.; Glindemann, D. Phosphine in the urban air of Beijing and its possible sources. Water Air Soil Pollut. 1999, 3–4, 597–604. [Google Scholar]
- Zhang, R.; Wu, M.; Wang, Q.; Geng, J.; Yang, X. The determination of atmospheric phosphine in Ny-Alesund. Chin. Sci. Bull. 2010, 55, 1662–1666. [Google Scholar] [CrossRef]
- Schink, B.; Friedrich, M. Bacterial metabolism: Phosphite oxidation by sulphate reduction. Nature 2000, 6791, 37. [Google Scholar] [CrossRef] [PubMed]
- Roels, J.; Verstraete, W. Biological formation of volatile phosphorus compounds. Bioresour. Technol. 2001, 3, 243–250. [Google Scholar] [CrossRef]
- Hanrahan, G.; Salmassi, T.M.; Khachikian, C.S.; Foster, K.L. Reduced inorganic phosphorus in the natural environment: Significance, speciation and determination. Talanta 2005, 2, 435–444. [Google Scholar] [CrossRef] [PubMed]
- Roels, J.; Huyghe, G.; Verstraete, W. Microbially mediated phosphine emission. Sci. Total Environ. 2005, 3, 253–265. [Google Scholar] [CrossRef] [PubMed]
- Rutishauser, B.V.; Bachofen, R. Phosphine formation from sewage sludge cultures. Anaerobe 1999, 5, 525–531. [Google Scholar] [CrossRef]
- Jenkins, R.O.; Morris, T.A.; Craig, P.J.; Ritchie, A.W.; Ostah, N. Phosphine generation by mixed- and monoseptic-cultures of anaerobic bacteria. Sci. Total Environ. 2000, 1–3, 73–81. [Google Scholar] [CrossRef]
- Prezhdo, O.V.; Gawdzik, B.; Zubkova, V.V.; Prezhdo, V.V. Molecular structure and electrical properties of some phosphonates, phosphine-oxides and phosphates. J. Mol. Struct. 2009, 1–3, 146–153. [Google Scholar] [CrossRef]
- Zhang, P.L.; Rong, H.W.; Zhang, K.F.; Liu, T.; Cao, Y.F. Effect of Diverse Mud and Phosphorus Sources on Total Phosphorus Removal Efficiencies. Guangdong Chem. Ind. 2011, 38, 118–124. (In Chinese) [Google Scholar]
- Yang, Z.; Zhou, J.; Li, J.; Han, Y.; He, O. Pre-processing of raw wastewater in a septic tank leads to phosphorus removal by phosphine production in a sequencing batch biofilm reactor (SBBR). Desalin. Water Treat. 2016, 2, 810–818. [Google Scholar] [CrossRef]
- Luo, Y.; Bao, J.G.; Li, S.M.; Hu, X.Y.; Li, N.; Zeng, W.D. Experimental Study on the Release of Phosphine to Improve the Removal Effect of Phosphorus from Sewage. Saf. Environ. Eng. 2014, 5, 94–103. (In Chinese) [Google Scholar]
- Wang, J.F.; Niu, X.J.; Ma, J.L.; Lu, M.Q. Conversion of phosphorus to phosphine by microbial deoxidization under anaerobic conditions. Microbiol. China 2015, 1, 34–41. [Google Scholar]
- Chen, Y.; Zhou, J.; Gan, C.J.; Li, J.J. Effects of DO and aeration mode on the process ofphosphorus removal by phosphate reduction. Ind. Water Treat. 2011, 10, 31–34. (In Chinese) [Google Scholar]
- Chen, Y.; Zhou, J.; Gan, C.J.; Li, J.J. Effect of initial pH value on phosphorus removal of phosphate reduction. Chin. Environ. Eng. 2011, 5, 2428–2431. (In Chinese) [Google Scholar]
- Wan, J.B.; Deng, M.; He, H.Y.; Tang, A.P. Factors Influencing Release of Phosphine in Piggery Wastewater. China Water Wastewater 2013, 23, 117–120. (In Chinese) [Google Scholar]
- Niu, X.J.; Wei, A.S.; Li, Y.D.; Mi, L.N.; Yang, Z.Q.; Song, X.F. Phosphine in paddy fields and the effects of environmental factors. Chemosphere 2013, 9, 1942–1947. [Google Scholar] [CrossRef] [PubMed]
- Eismann, F.; Glindemann, D.; Bergmann, A.; Kuschk, P. Balancing phosphine in manure fermentation. J. Environ. Sci. Health Part B 1997, 6, 955–968. [Google Scholar] [CrossRef] [PubMed]
- Glindemann, D.; Eismann, F.; Bergmann, A. Phosphine by bio-corrosion of phosphide-rich iron. Environ. Sci. Pollut. Res. 1998, 5, 71–76. [Google Scholar] [CrossRef] [PubMed]
- Glindemann, D.; Edwards, M.; Schrems, O. Phosphine and methylphosphine production by simulated lightning—A study for the volatile phosphorus cycle and cloud formation in the earth atmosphere. Atmos. Environ. 2004, 38, 6867–6874. [Google Scholar] [CrossRef]
- Cao, H.; Liu, J.A.; Zhuang, Y. Emission sources of atmospheric phosphine and simulation of phosphine formation. Sci. China Ser. B: Chem. 2000, 43, 162–168. [Google Scholar] [CrossRef]
- Pasek, M.A.; Sampson, J.M.; Atlas, Z. Redox chemistry in the phosphorus biogeochemical cycle. Proc. Nat. Acad. Sci. USA 2014, 111, 15468–15473. [Google Scholar] [CrossRef] [PubMed]
- Han, S.H.; Zhuang, Y.H.; Liu, J.A. Phosphorus cycling through phosphine in paddy fields. Sci. Total Environ. 2000, 258, 195–203. [Google Scholar] [CrossRef]
- Eismann, F.; Glindemann, D.; Bergmannt, A. Soils as source and sink of phosphine. Chemosphere 1997, 35, 523–533. [Google Scholar] [CrossRef]
- Renbin, Z.; Deming, K.; Liguang, S. Tropospheric Phosphine and Its Sources in Coastal Antarctica. Environ. Sci. Technol. 2006, 40, 7656. [Google Scholar]
- Zhu, Y.; Ding, L.; Ren, H. Fate of matrix-bound phosphine during acidification with anaerobic bacteria. Environ. Sci. 2005, 26, 139–142. (In Chinese) [Google Scholar]
Figure 1.
Apparatus for sludge acclimation. (1) Sewage tank, (2) pump, (3) rabbler, (4) gas sampling port, (5) ASBR reactor, (6) aeration device, (7) sludge outlet, (8) rotameter, (9) air-blower, (10) pH and digital thermometer, (11) ORP meter, (12) sample point, (13) discharge port and (14) absorption bottle for acidic gases.

Figure 2.
Total phosphorus removal and phosphine production over time.

Figure 3.
Changes in TP levels over time.
Figure 4.
Changes in MBP concentration over time.
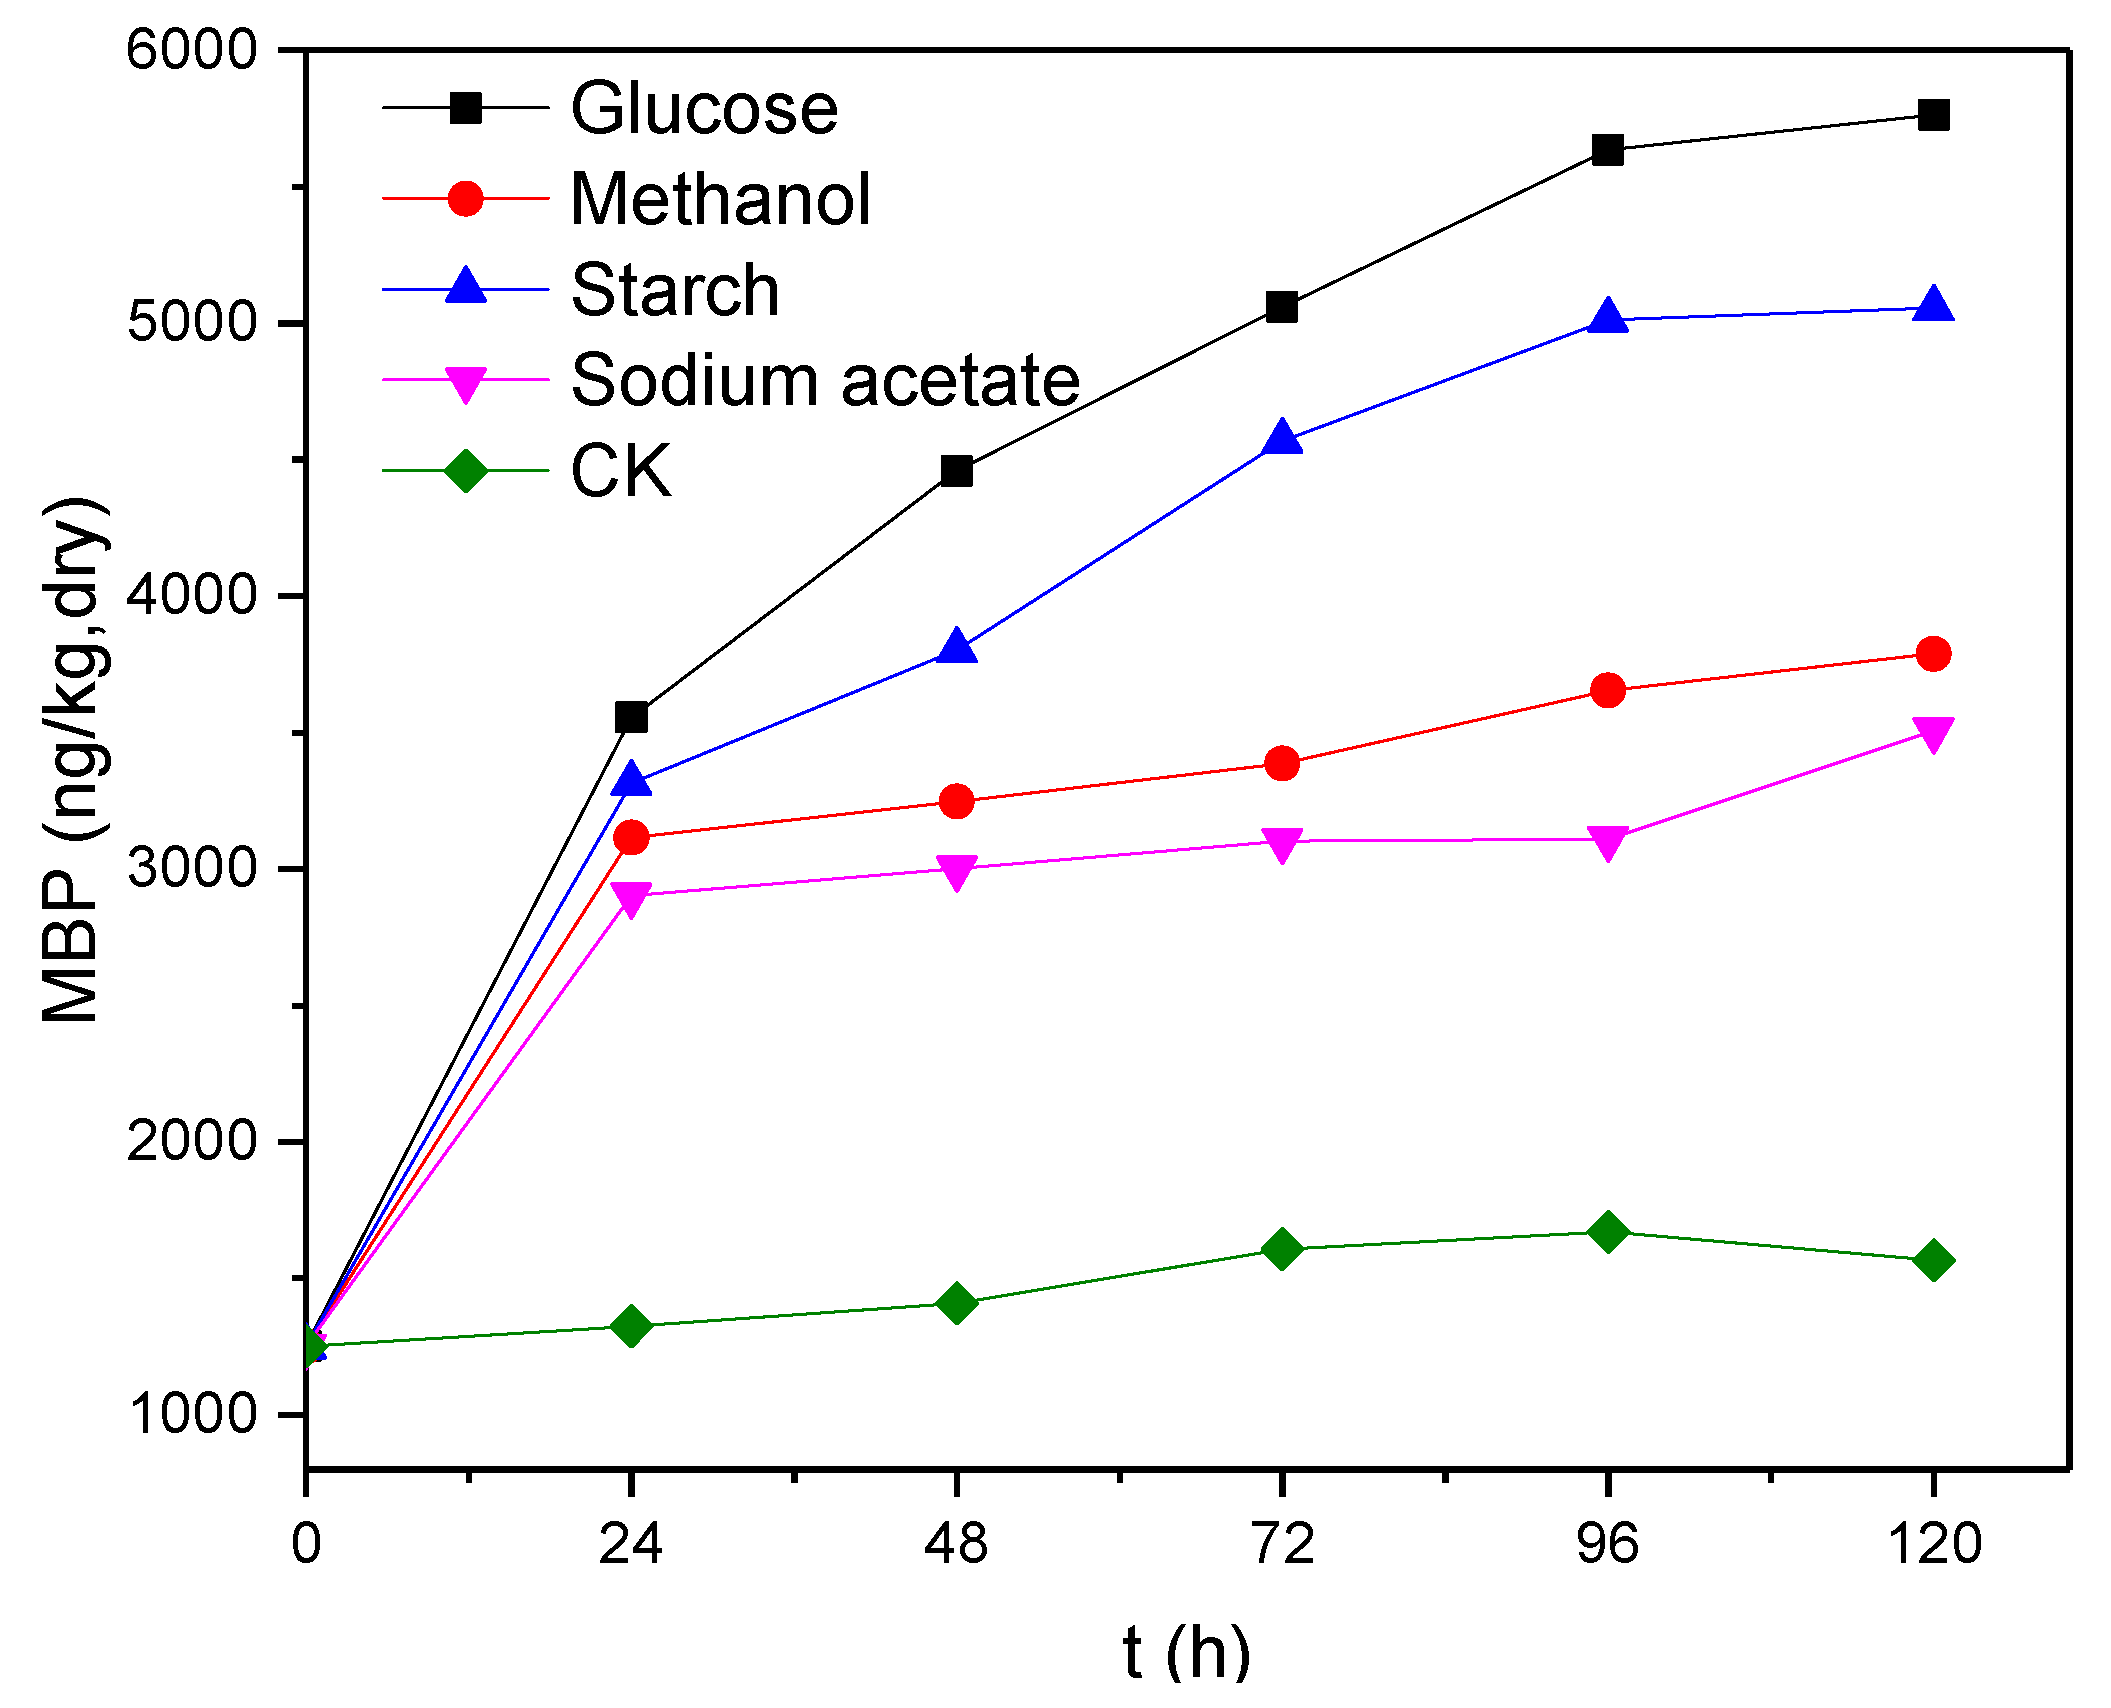
Figure 5.
Changes in MBP concentration over time at different C/P ratios.
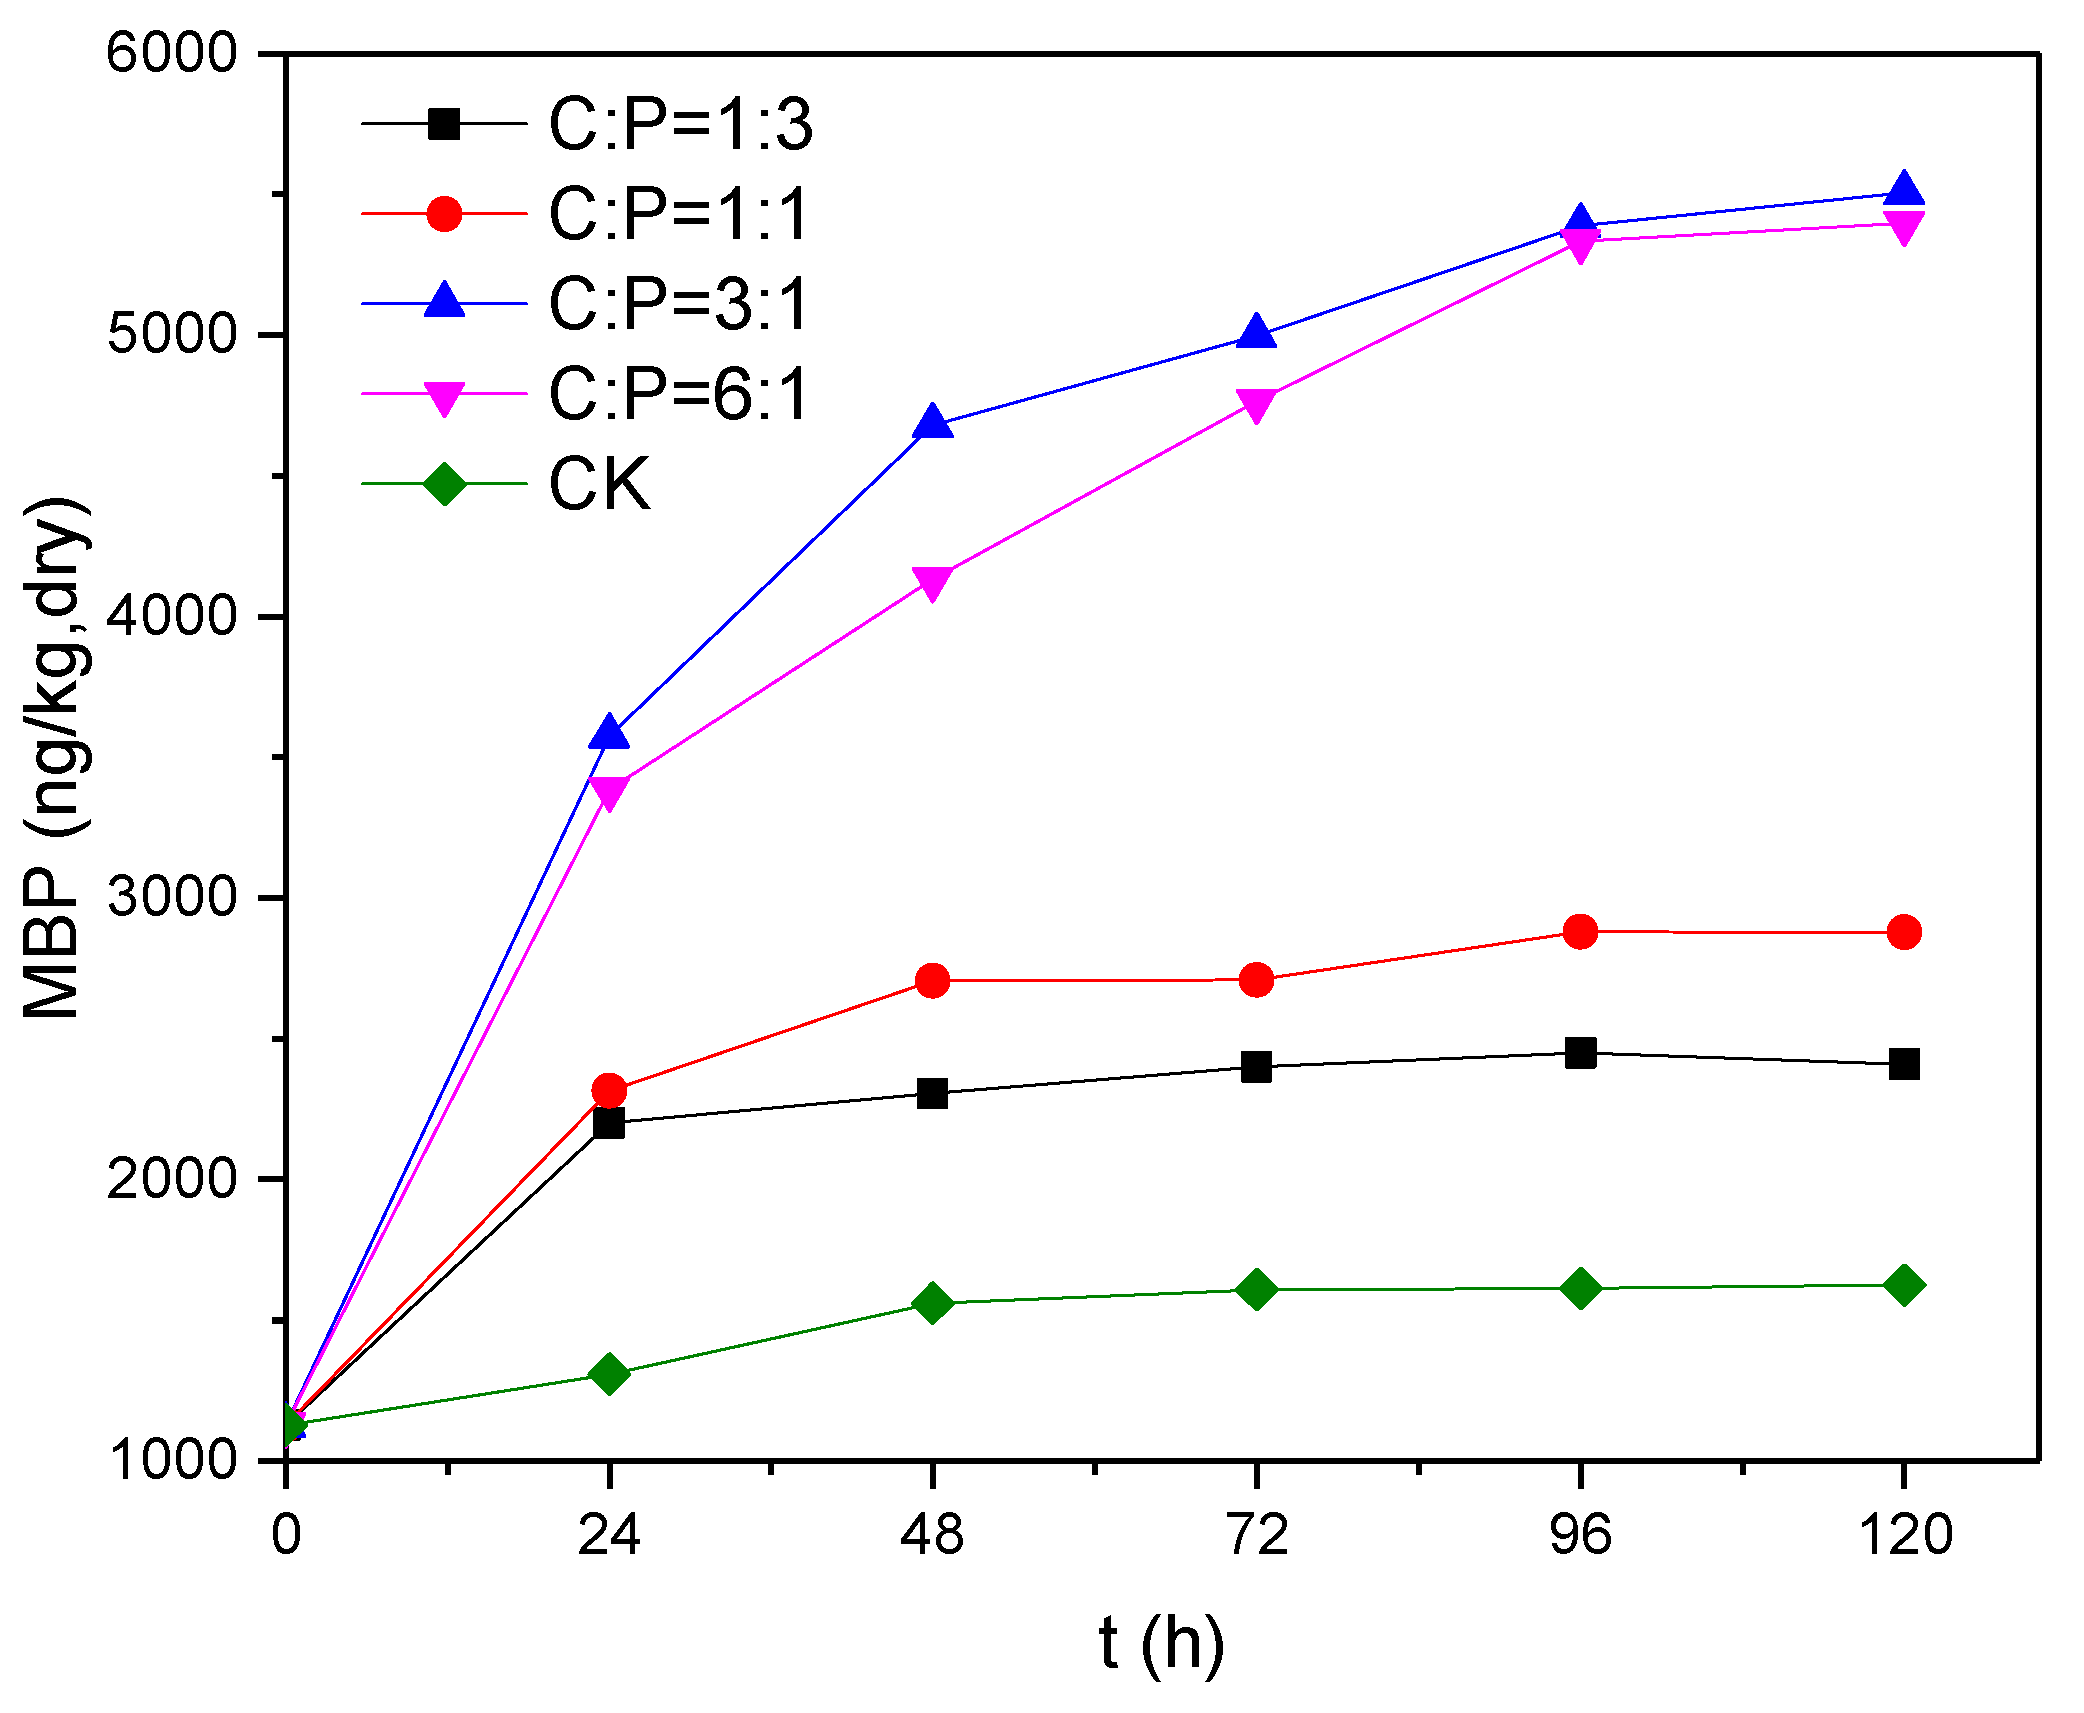
Figure 6.
Changes in the production of biogas and MBP over time.

Table 1.
Dosage of trace elements.
| Element | Dosage (mg/L) | Compound Form | Dosage of Compound (mg/L) |
|---|---|---|---|
| Mg | 12.0 | MgCl2·6H2O | 101.5 |
| Ca | 20.2 | CaCl2 | 55.5 |
| Fe | 4.0 | FeCl2·4H2O | 14.22 |
| Co | 0.1 | CoCl2·6H2O | 0.4 |
| Ni | 0.2 | NiCl2·6H2O | 0.8 |
| Mo | 0.1 | MoCl2·4H2O | 0.23 |
| Zn | 0.1 | ZnCl2 | 0.32 |
| Mn | 0.1 | MnCl2·4H2O | 0.36 |
Table 2.
The production of PH3 and MBP.
| Electron Donors | PH3 Concentration in Biogas (ng/m3) | Volume of Biogas (mL) | Quantity of PH3 (ng) | MBP Concentration (ng/kg) (Dry Weight) | Quantity of MBP (ng) | MBP/PH3 |
|---|---|---|---|---|---|---|
| glucose | 920 | 275 | 0.25 | 5763 | 61.09 | 241 |
| starch | 1250 | 201 | 0.25 | 5056 | 53.59 | 213 |
| methanol | 955 | 239 | 0.23 | 3789 | 40.16 | 176 |
| sodium acetate | 950 | 231 | 0.22 | 3508 | 37.18 | 169 |
© 2017 by the authors. Licensee MDPI, Basel, Switzerland. This article is an open access article distributed under the terms and conditions of the Creative Commons Attribution (CC BY) license (http://creativecommons.org/licenses/by/4.0/).
Share and Cite
MDPI and ACS Style
Cao, J.; Zhang, C.; Rong, H.; Zhao, M.; Wei, W.; Zhao, L. Study on Effects of Electron Donors on Phosphine Production from Anaerobic Activated Sludge. Water 2017, 9, 563. https://doi.org/10.3390/w9080563
AMA Style
Cao J, Zhang C, Rong H, Zhao M, Wei W, Zhao L. Study on Effects of Electron Donors on Phosphine Production from Anaerobic Activated Sludge. Water. 2017; 9(8):563. https://doi.org/10.3390/w9080563
Chicago/Turabian StyleCao, Jianping, Chaosheng Zhang, Hongwei Rong, Meihua Zhao, Wei Wei, and Limin Zhao. 2017. "Study on Effects of Electron Donors on Phosphine Production from Anaerobic Activated Sludge" Water 9, no. 8: 563. https://doi.org/10.3390/w9080563
Note that from the first issue of 2016, this journal uses article numbers instead of page numbers. See further details here.