Valuation of Hidden Water Ecosystem Services: The Replacement Cost of the Aquifer System in Central Mexico


1
Centro de Estudios Demográficos, Urbanos y Ambientales, El Colegio de México, Carretera Picacho Ajusco 20, Col. Ampliación Fuentes del Pedregal, C.P. 14110 Tlalpan, Mexico City 14110, Mexico
2
El Colegio de la Frontera Sur, Carretera a Reforma km 15.5 s/n, Ra Guineo 2a Seccion, Villahermosa, Tabasco 86027, Mexico
*
Author to whom correspondence should be addressed.
Water 2017, 9(8), 571; https://doi.org/10.3390/w9080571
Submission received: 29 April 2017
/
Revised: 7 July 2017
/
Accepted: 21 July 2017
/
Published: 31 July 2017
(This article belongs to the Special Issue Water Economics and Policy)
Abstract
:This paper reports research estimating the costs of replacing the groundwater that the metropolitan areas of Mexico City, Toluca, and Cuernavaca, in Central Mexico, pump from 10 over-exploited aquifers with 6 supply alternatives of surface water. These aquifers provide about 70% of the water required by more than 28 million people, and their recharge zones in forested areas are increasingly threatened by economic activities. By designing a constrained optimization program that minimizes investment and operation costs, we found that replacing groundwater extraction involves the construction of all six alternatives at an estimated cost of US$25 billion at present values (US$0.6 m−3 over a 26-year period). We designed and analyzed a scenario to combine measures to reduce water leaks in Mexico City; a positive balance was found: every dollar invested in leak control reduces replacement costs by between US$1.9 and US$8.4. Therefore, our results suggest the prioritization of leak control measures in order to reduce extraction from over-exploited aquifers. Local authorities should be warned about the economics of losing ecosystem services that are crucial to sustaining the population and the economic activities in the region of study.
1. Introduction
Water and sanitation are unanimously recognized as being at the core of sustainable development [1]. However, four billion people—two-thirds of the planet’s population—still face severe water scarcity during at least one month of the year, including regions in both developed and developing countries [2]. This situation is not expected to improve in the near future as by 2050 the world population will likely reach nine billion people, implying a projected increase of water demand of 55% relative to the year 2000 [3]. Available surface freshwater resources needed to meet this increasing demand are increasingly endangered by biophysical and human pressures, including climate change, land degradation, over-extraction, pollution, deforestation, and urbanization [4,5,6]. Therefore, food provision and water security will rely more on groundwater, as aquifers constitute the largest available storage of freshwater (except for frozen water in ice and glaciers) [7,8]. However, 1.7 billion people are already living in regions where groundwater resources or groundwater-dependent ecosystems are threatened [9] and current rates of aquifer depletion will be worsened in the near future, jeopardizing the sustainability of the water supply [10]. As a result, addressing both the increasing demand of freshwater for human use and the protection of ecosystems is one of the most important challenges of the 21st century. In light of the critical situation of water resources and ecosystem degradation, a holistic and broad-based integrated view to water management ensuring the incorporation of an ecosystem services approach is considered urgent to adopt [11,12,13,14].
In Mexico, about 90 million people, representing 75% of its total population, face severe water scarcity for at least one month every year [2]. Water scarcity, together with high deforestation rates and biodiversity loss, constitutes one of the most important environmental challenges that Mexico has to address in order to secure economic development both in the present and the future [15,16,17]. In particular, Mexico’s central region, where the economic and political heart of the country is located, is heavily compromised by critical conditions in water provision and management [18,19]. Water demands of nearly 28 million people living in the municipalities depending on the aquifer system of the region, including the metropolitan areas of Toluca, Cuernavaca, and Mexico City, is being met by the exploitation of regional and extra-regional sources at higher than renewable rates [20,21]. According to official statistics of the National Water Commission (CONAGUA, for its Spanish acronym) [22], up to 1.8 times the volume of renewable water (surface and underground) is used annually in Central Mexico, generating the highest indicators of regional water stress in the country, 139% in 2015, versus the national average of 46%. The annual extraction of regional groundwater, while providing for 70% of regional water demand, represents twice the recharge volume of the region’s aquifer system, resulting in a number of problems—including subsidence, decrease of the water table, loss of quality, or increases in the cost of extraction [19,23].
The present and future supply of groundwater in the region is not only threatened by the overexploitation of aquifers, but also by the impact of land use changes in the aquifers’ recharge zones [24], especially in the forested region called “Bosque de Agua” (Water Forest) [25]. Diverse studies on the relation between the regional hydrology and its land cover conclude that the mountains containing the Water Forest are the most important recharge zones of the aquifers supplying water to the cities of Toluca, Cuernavaca, and Mexico City [26,27,28,29]. Despite the Water Forest representing only 0.1% of Mexico’s land area, it provides water to nearly 24% of the total country’s population. However, because of policy failures to recognize forests’ water services, the region lacks measures for effective conservation, and economic pressures continue to claim forested areas for agricultural activities, for real estate development, and for the extension of communication routes, further affecting the local hydrological balance [30,31]. While policy integration of water management, conservation activities, urban planning, and land-use is an essential condition to ensure sustainable water management, the respective strategies in most of the cases are not aligned [20].
With the objective of highlighting the economic relevance of Central Mexico’s aquifer system—mainly recharging in the Water Forest—this study aims at estimating the economic costs of replacing groundwater extraction with several measures of built infrastructure, including for five inter-basin transfers and one project of aquifer recharge through injection of treated water. In order to highlight the role of water policy in Mexico City, we constructed a scenario analysis to assess the impact on the volume to be replaced, and on the associated replacement costs, of several measures to control leaks in Mexico City’s water distribution system. The next section reviews the usefulness of an economic valuation of water ecosystem services and its role water policy in the context of sustainable development. Section 3 outlines the case study description, followed by the presentation of the method used and the characterization of scenario analysis. Then, Section 5 and Section 6 show our results and a discussion of them, highlighting main concluding remarks in Section 7.
2. Valuing Water Resources and Ecosystem Services in Decision-Making: A Tool for Sustainable Development
Numerous efforts have been made in the last 40 years to emphasize the vital importance of water for human beings and for the environment and to draw attention on the urgency of addressing water related issues [32,33,34,35,36]. These efforts have paved the way for the emergence of new approaches to water resource management and protection. The explicit recognition by the UN in 2010 that access to water and sanitation constitutes a human right by its own merit, serving as a key to the fulfilment of all other human rights, is indeed an important milestone [35,36]. Later, the resulting document of Rio+20, “The Future We Want”, supposed a strong voice to convey the sentiment about considering “water at the core of sustainable development” and launched the process to build a set of goals for sustainable development to be targeted after the conclusion of the Millennium Development Goals’ (MGDs) era [37,38]. The current 2030 Agenda for Sustainable Development embedded the general consensus on the main water concerns reached over the last 40 years through the sixth Global Goal: “ensure availability and sustainable management of water and sanitation for all” [37,38]. Despite all these efforts, the global trends of environmental degradation associated to the sheer scale of economic and population growth continue to go unchecked, and are now very likely to be alarmingly exacerbated by climate change impacts [3].
In contrast to traditional supply-driven approach in water management systems, supported by high investment in large-scale infrastructure and single-sector perspective [11], an Integrated Water Resources Management (IWRM) approach combines sustainable water and land management based on comprehensive stakeholder participation with the recognition of water as the key integrating element between human development and nature [14]. This highlights the critical importance of natural ecosystems to support and provide resources and services to humanity. However, in some cases, these are downgraded to simple services supplied to satisfy human needs [39]. Thus, ecosystems are either not included, or are underestimated, in the decision-making process of water allocation and management. On these grounds, adopting the ecosystem services-based approach as a “particular way of looking at socio-ecological issues” [40], combined with the IWRM framework, can help enhance the importance of considering multiple values of services provided by nature and their inclusion in water policy decision-making.
Along similar lines, the IWRM and ecosystem services-based approaches argues that undervaluation, or in most cases unawareness of resources and services provided by nature to humanity, led to their over-exploitation and widespread environmental degradation [39,41]. Notwithstanding the limitations and criticism of economic valuation [42,43,44,45,46], to factor in the economic value of natural capital and services provided by ecosystems is broadly considered in the literature as fundamental to better informing decision-making and policy instruments designed towards the sustainable management and conservation of natural resources [41,47,48,49], to facilitate communication of the biophysical underpinning of ecosystems for services provision in a commonly comprehensible language (monetary units) [50], and to enable an environmental awareness-improvement in support of conservation and protection of ecosystems through showing hidden benefits of ecosystems for society [51,52], among others.
Despite the crucial importance of groundwater resources as a reliable and readily-available water source upon which billions of people around the world depend [53,54], its feature as a “hidden” resource, out of sight below ground, worsens the aforementioned undervaluation [55,56]. This hidden characteristic further complicates the understanding of the complex interactions between multiple drivers (for instance, deforestation, over-extraction, and land use changes). Groundwater recharge depends highly on local hydrological cycles, in turn influenced by land use changes, inter alia climate, topography, and substrate type. Land use changes (deforestation, conversion of forests into cropland or grazing pastures, or urbanization) can alter water balances by increasing runoff and decreasing infiltration to aquifers, ultimately reducing groundwater production and availability [29,57,58].
This study features an economic valuation for the provision of groundwater in aquifers recharged in a threatened forest ecosystem in Central Mexico known as the Water Forest. The results could help in promoting conservation efforts by means of supporting well-designed economic policy instruments; as Payment for Hydrological Environmental Services (PHES) already in operation in some areas of the region shows, by improving land use planning and contributing to a better operationalization of the IWRM framework. There is a vast literature on economic valuation methods for natural resources and ecosystem services. For a detailed discussion of reviews and guidelines of methods we recommend Barbier [59], Barbier et al. [60], Mendelsohn et al. [61], Bateman et al. [62], or Pascual et al. [48]. Among the various valuation methods available in the economists’ toolbox, replacement cost is one of the most frequently used for environmental problems. The estimation of replacement costs belongs to the category of methods of indirect valuation based on the revealed preference. Unlike declared preference methods (such as contingent valuation), these methods seek, for observable economic information, indicators correlated with the variables of interest to be measured, which are non-observable. The replacement cost method, in particular, seeks prices and quantities of goods traded in the market that can operate as substitutes for the extra-market goods that are sought to value.
Relevant literature includes two well-known study cases that adequately illustrate the characteristics of the replacement cost method for hydrological services, particularly filtration. The first one refers to New York City and the basin representing its main source for drinking water. This case study has been described, among others, by Chichilnisky and Heal [63], Heal [64], and Postel et al. [65]. During the 1990s, the intensification of economic activities produced a disruption in the functioning of its source watershed, translating into a quality decline of the water supplied to the city. New York authorities faced a dilemma: they had to decide whether to replace the watershed’s filtration services with potabilization plants, or to carry out conservation actions in the region where the water is generated, in order to restore and secure the watershed’s hydrological services. The estimation of replacement costs led to the implementation of conservation measures of a forested area that, in addition to the hydrological services that mattered to New York City, provided additional environmental services.
The other case study summarizes the purification costs of 27 potable water supply systems in the United States and relates them to the percentage of forest cover in the associated basin [65]. In basins with at least 60% of forested land cover, the unit purification costs were found to be a third of those of basins with only 10% of forested cover, with the additional purification activity serving as a replacement technology for the lost filtration services associated to decreases in forested area. Furthermore, the purification costs were found to increase non-linearly relative to decreases in forested area: a water supply system located in a basin with only 10% of forested area incurred unit purification costs that were three times higher than those incurred by systems in basins with at least 60% of forested area.
3. Case Study: Central Mexico’s Aquifers
3.1. The Aquifer System of Central Mexico
In this paper, we estimate the costs of the investments that would be required to substitute the volume extracted from 10 aquifers in Central Mexico. These aquifers are not arbitrary: they were selected by the Water Forest Initiative (Iniciativa Bosque de Agua, in Spanish) at Conservation International-Mexico for being overexploited and for having the forested area known as the Water Forest as their main recharge zone, shown in Figure 1. The latest Census of Population and Housing indicates that 28 million people live in the municipalities above these aquifers as of 2012 [66]. In particular, 14.5 million people depend on water extracted from the Aquifer of the Valley of Mexico, and 5.5 million more depend on the Cuautitlán-Pachuca Aquifer.
According to the National Registry of Water Permits (REPDA, for its Spanish acronym) [67], there are 5359 extraction wells in these aquifers allowed to pump 46.7 m3·s−1 each year. Following the population distribution, 28% of groundwater extraction comes from the Aquifer of the Valley of Mexico, and 22% comes from the Cuautitlán-Pachuca Aquifer. About 62% of the extracted water is meant for public and domestic use, 18% is extracted for industrial uses, and the remaining 20% to irrigate agricultural fields (See Table 1).
Aquifer recharge is a complex environmental process that depends on a combination of factors, including precipitation and temperature patterns, the infiltration capacity and transport of different rock types, soil retention capacity, and vegetation cover [27]. Several studies on the Valley of Mexico Basin conclude that, given the particular occurring combination of these factors, the forested area known as the Water Forest is an important source of recharge flows for these aquifers [24,30,31,68]. In particular, within the Valley of Mexico, there are differentiated recharge capacities. Burns et al. [69] conclude that the Mexico City Metropolitan Area (MCMA) is located over a practically impermeable clay layer with depths between 5 to 40 m, and that below that layer there are alluvial deposits with high recharge capacities constituting the main stocks from which groundwater is extracted. The alluvial layers surface following the borders of the extinct lakes and neighboring the piedmont zones of the Sierra de Las Cruces and Sierra Nevada, both exhibit high recharge rates [69].
The southern border of the Mexico Valley Basin contains volcanic rock formations with very high recharge capacities, including the Sierra del Chichinautzin, Sierra Nevada, and Sierra de Santa Catarina. Consistent with Burns et al. [69], Carrera-Hernández and Gaskin [27] find that the major portion of the basin’s recharge flow occurs in the Sierra Nevada, Chichinautzin and Sierra de Guadalupe. Similar conclusions are found in the studies by Ortega and Farvolden [70] and in Angeles-Serrano [26]. These conditions, favorable to high recharge rates, are met with the highest concentration of yearly precipitation in the Valley of Mexico Basin, which can be 70% higher than elsewhere in the basin: 1200 mm for the Sierra de Las Cruces, 900 mm in the Sierra del Ajusco, 800 mm in the Sierra Nevada and the Sierra del Chichinautzin [71], and 700 mm in the lower altitudes of the basin [27]. The study by Ortega and Farvolden [70] reports regional water balances in which aquifer recharge represents 42% of the precipitation volume in the Sierra del Chichinautzin, between 30% and 40% in the Sierra de Las Cruces, and between 40% and 50% of the Sierra Nevada.
The pattern of land use indicates that the zones exhibiting large recharge capacities are usually covered with vegetation, including grasslands and forests. Bojórquez et al. [71] report water balances in which there is enough water to produce surface runoff and aquifer recharge in at least 50% of the territory catalogued as Land for Ecological Conservation [72], located to the south of Mexico City, and that about 65% of that territory is covered by fir, oak, and pine forests and xerophytic shrubs. They conclude that the remaining portions of the forest that are covered by fir trees, alpine vegetation, and riparian vegetation exhibit higher water production for runoff and aquifer recharge than the average figures.
Table 2 shows the different recharge volume estimates obtained from various studies in the region. In the best case, recharge is about 25 m3·s−1 and in the worst case it is 10.9 m3·s−1. A comparison of extraction rates shown above indicate that, in the best case, extraction is 1.8 times higher than recharge and, in the worst case, it could be 4.3 times as high. Adding to this uncertainty, the mountain ranges are, in fact, the drainage divide of three major hydrologic regions of Mexico (the Valley of Mexico Basin, the Lerma Basin, and the Balsas Basin), such that recharge flows are distributed among the aquifers pertaining to those regions. In a study by Ortega and Farvolden [70], the division of groundwater flows was estimated for the Chichinautzin Sierra and the Sierra de Las Cruces: 40% of recharge from the Chichinautzin flows to the Mexico Valley Basin and 60% to the Balsas basin, whereas 70% of the Sierra de Las Cruces recharge volume flows to the Mexico Valley Basin and 30% to the Lerma Basin.
Carrera-Hernández and Gaskin [27] suggest that the basin’s geology has protected the aquifer system from pollution (due to the impermeable clay layer below Mexico City, a conclusion also reached by Edmunds et al. [73] and by Bojórquez et al. [71]), and as shown by urbanization (due to the differentiated slopes of the mountain range). However, these conclusions are to be taken cautiously: Carrera-Hernández and Gaskin calibrated their data for the period between 1971 and 1981, when the urban sprawl still did not invade the forested areas, as it has done afterwards. Currently, there is evidence of pollution in aquifers [74,75] coming from either leaks in the draining system caused by unequal sinking or by horizontal flows. In addition, Tortajada [19] reports that 75% of new homes between 1980 and 2000 are located in regions formally catalogued as land for ecological conservation. A recent study by Zabala et al. [29] finds that good water quality has remained unchanged for decades in forested areas in the Sierras del Ajusco and Chichinautzin, a fact interpreted by the authors as a positive outcome from conservation practices associated to programs of payments for hydrological services.
3.2. The Situation of the Water Forest as a Recharge Zone
As stated earlier, the Water Forest is located between the metropolitan areas of Cuernavaca, Toluca, and Mexico City. According to a study by the National Institute for Ecology and Climate Change (INECC, for its Spanish acronym) [25,78] the forest has an extension of 235,000 hectares comprising the Sierras de Ajusco-Chichinautzin and the Sierra de Las Cruces (see Figure 1) which, in turn, represents the higher altitudes of the three main Mexican hydrologic basins, the Valley of Mexico, the Balsas, and the Lerma-Chapala. The Water Forest also exhibits important biological diversity: 10% of its species are endemic, representing 2% of global biodiversity. Some portions are under conservation plans: the Mexican Commission for Biodiversity catalogued the region as a priority land region for conservation [79], while the National Water Commission catalogued it as a hydrological priority region [80]. At least formally, 70% of its extension is catalogued under 21 federal, state, or municipal natural protected areas, but only a third of such areas had a management plan in place [25,78].
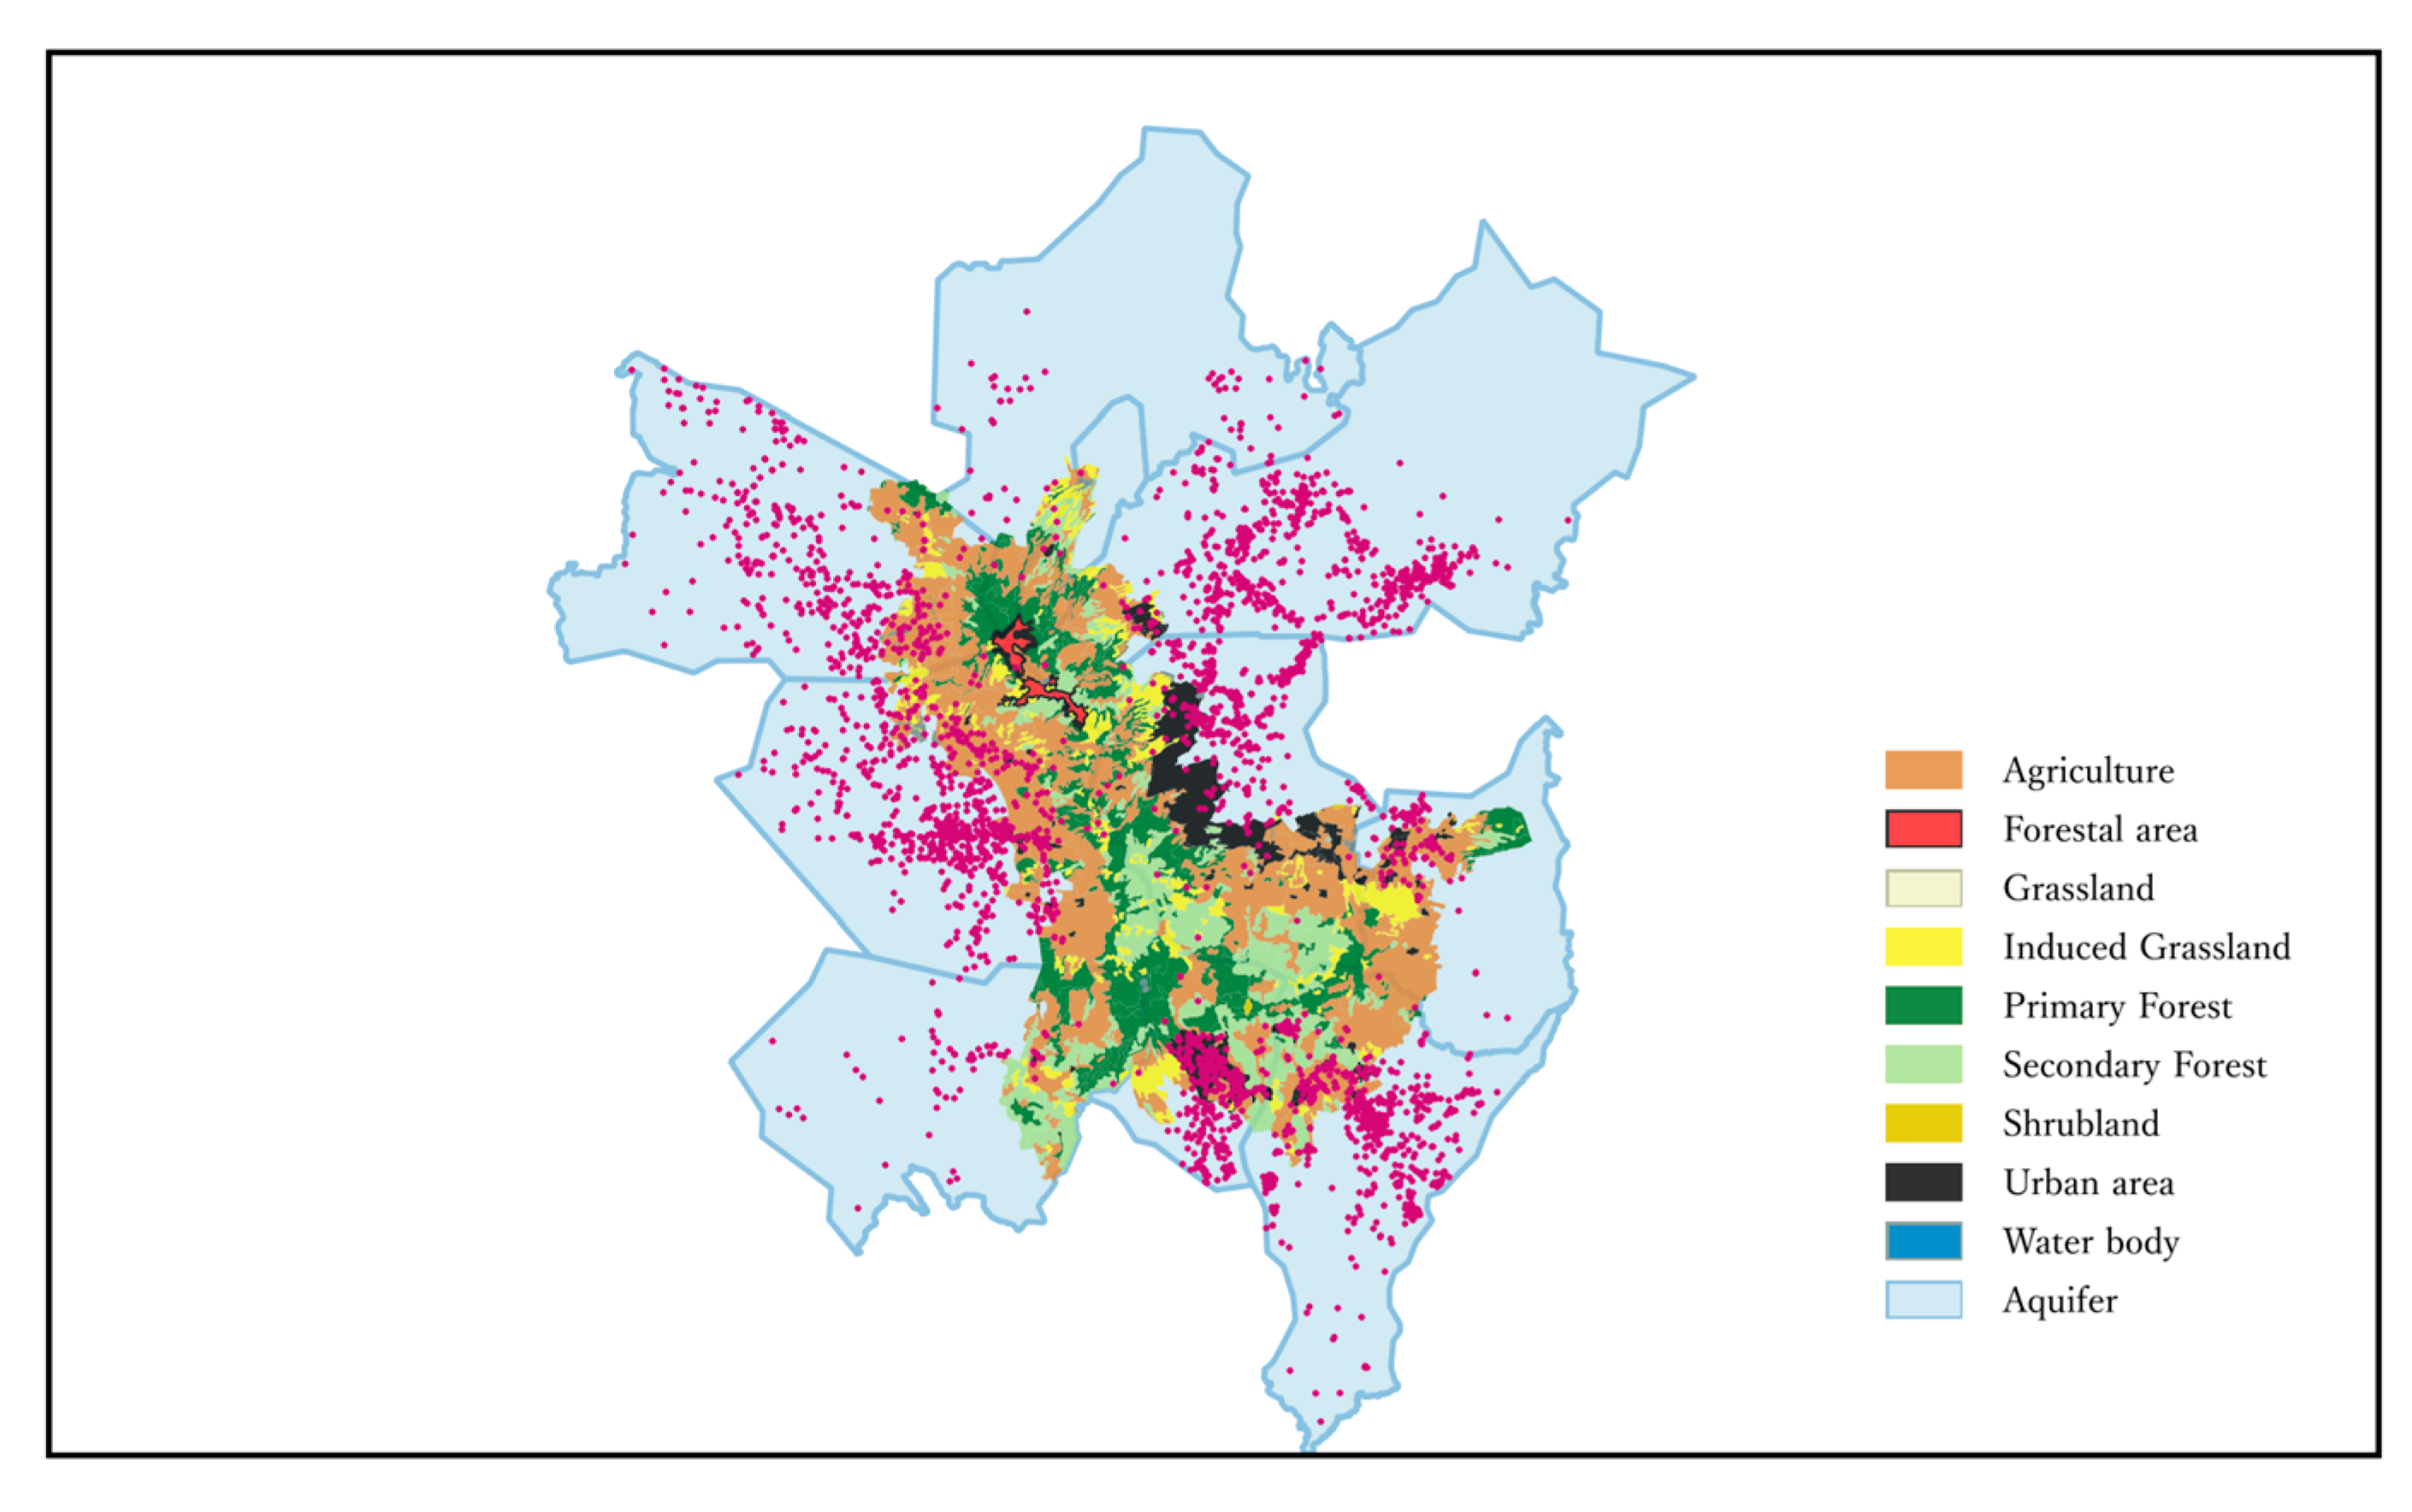
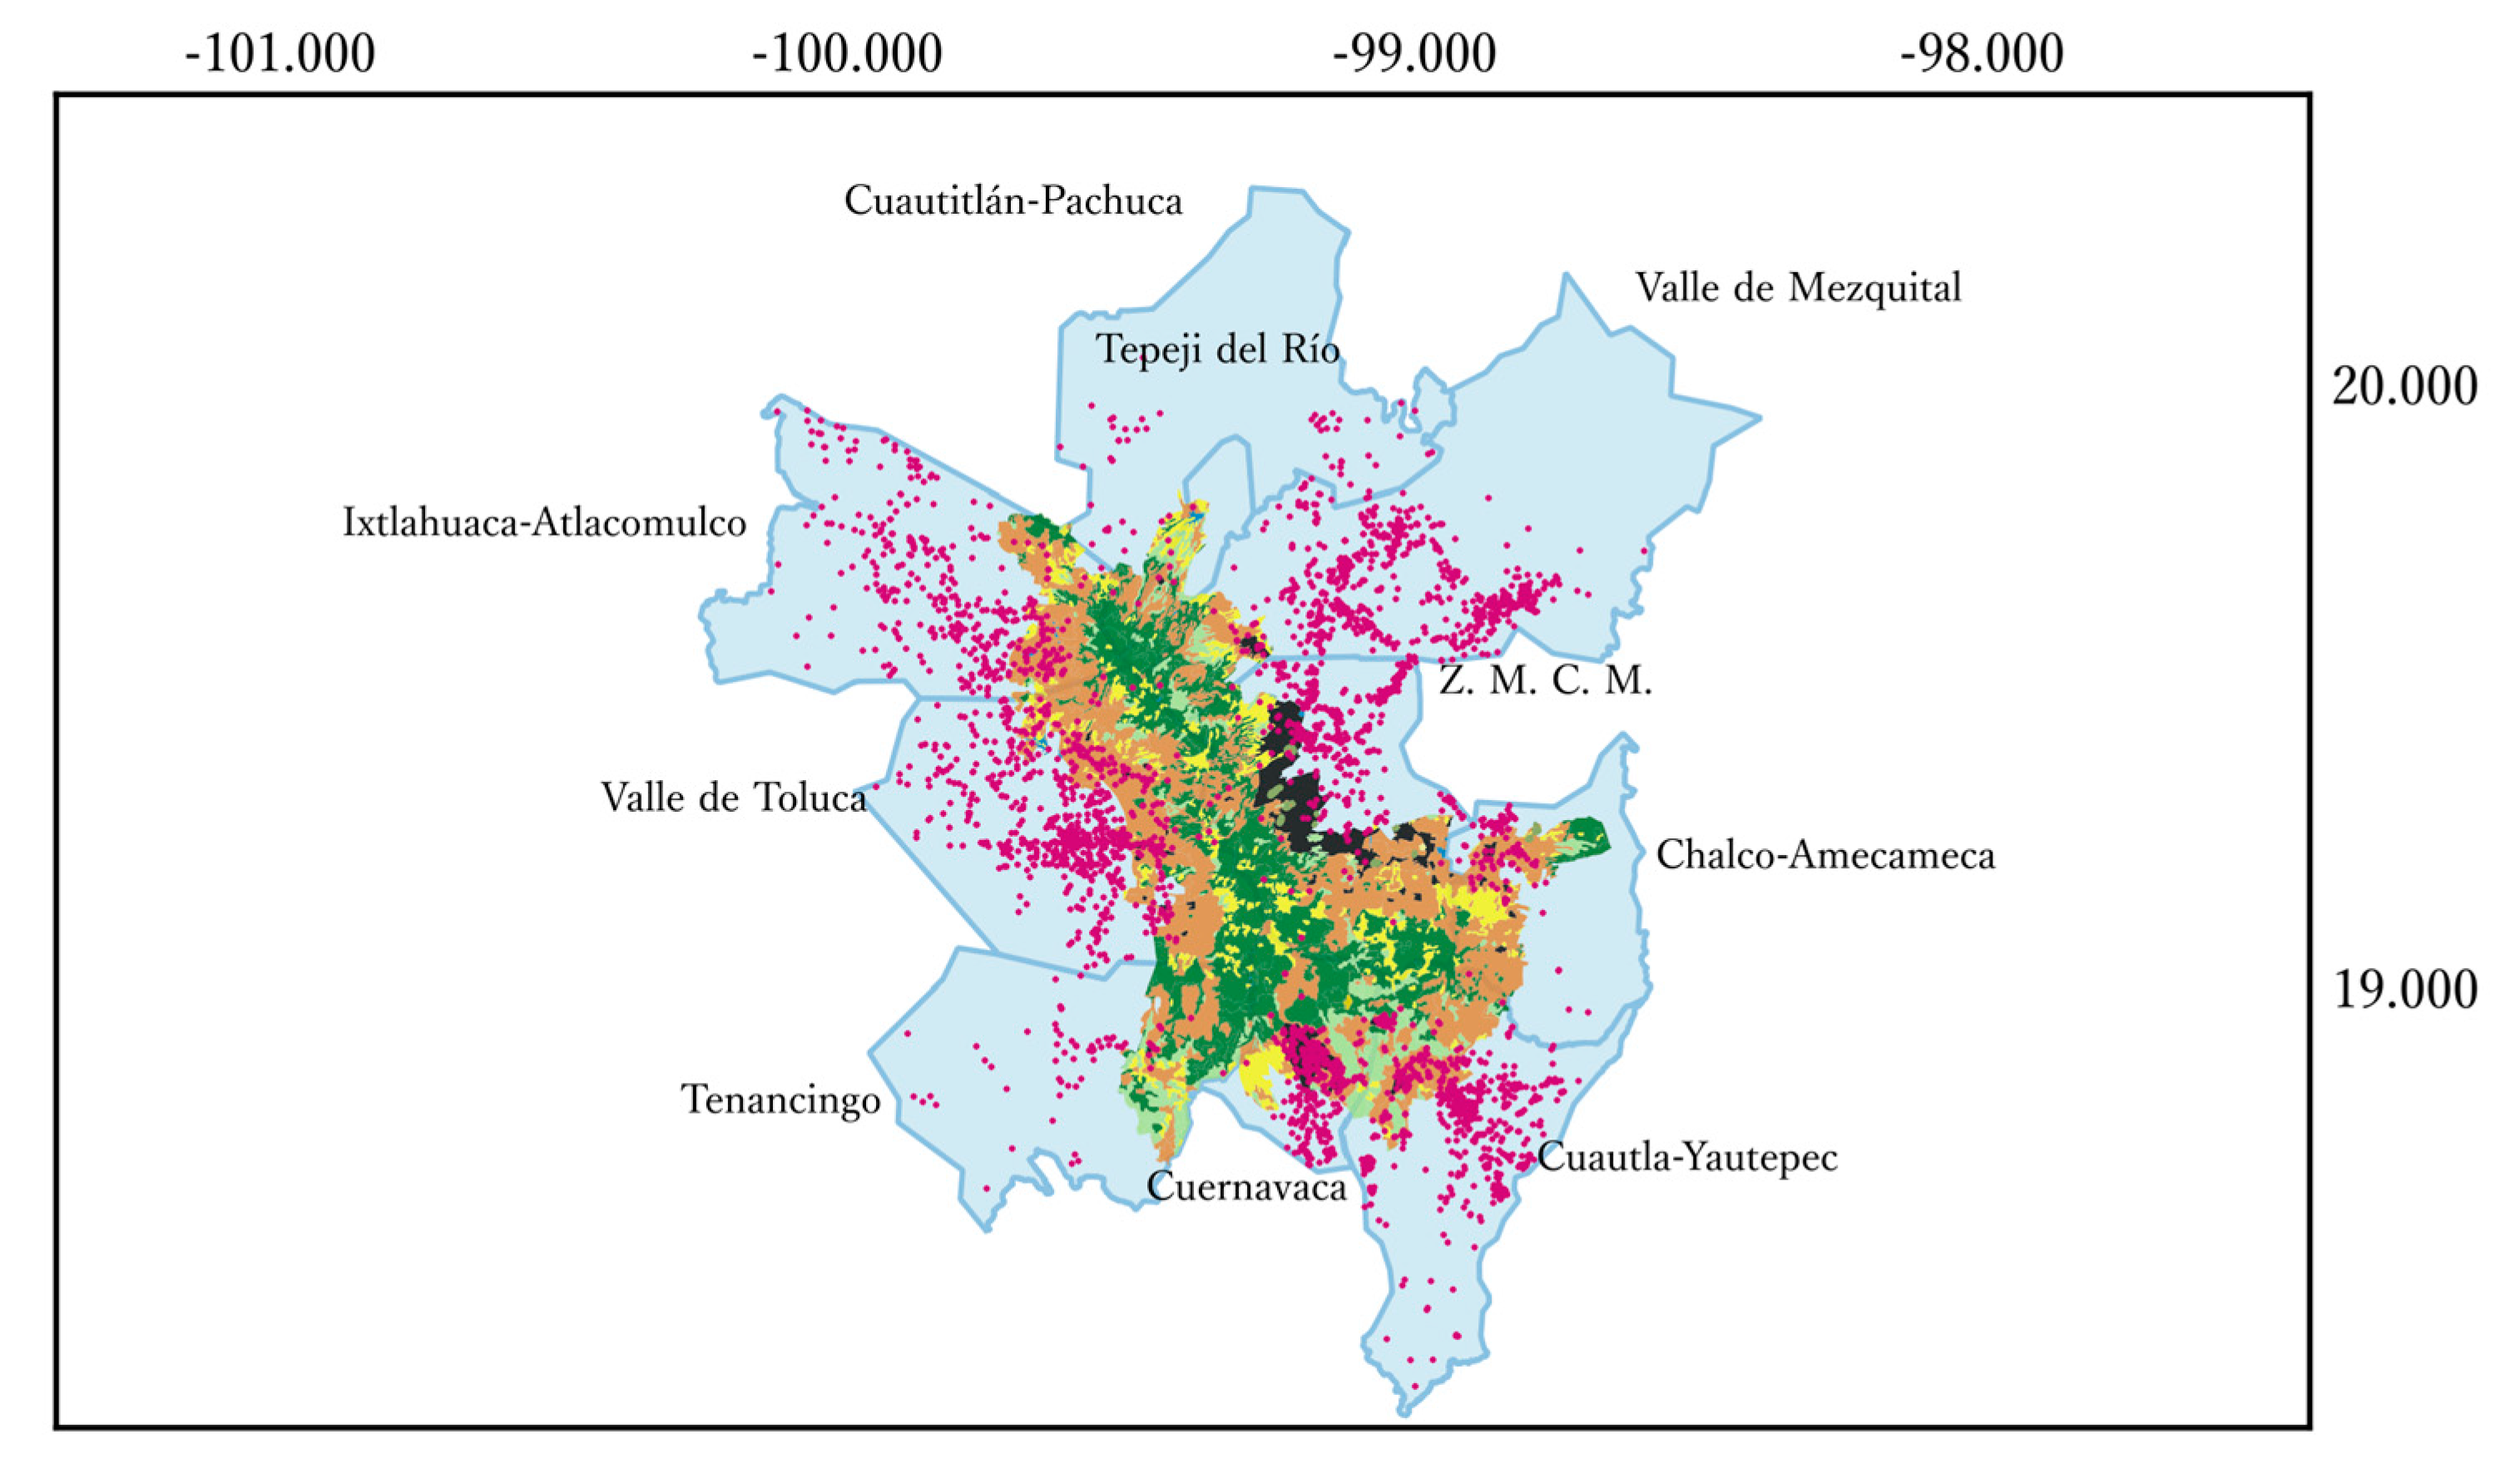
Due to its location, the forest is under pressure from economic activities carried out in surrounding metropolitan areas. According to INECC, the forested cover has been fragmented and reduced in about 20% of its extension between 1976 and 2008, representing about 53 km2 of its extension. The growth of secondary forests, responsible for 85% of land cover transitions, is the main cause of degradation, whereas urbanization in that period claimed about 18.5 km2 (13 km2 from agriculture, 2.9 km2 from grasslands, and 2.4 km2 from secondary deciduous dry forest). To complement INECC’s findings, we compare, in Table 3 and in Figure 2, the extensions of seven categories of land use in two periods, 1985–1996 and 2008–2012, corresponding to INEGI’s Series II [81] and V [82] of land use cover data, respectively. We find that the primary forest lost about 30% of its extension over the described period, mainly in the Sierra del Ajusco and Chichinautzin, while the secondary forest increased its extension in more than 70%. The extension of cultivated forest increased dramatically over that period, but it only represents 1.5% of the Water Forest total area. Table 3 and Figure 2 show the prevalence of agricultural areas, the increase in urban areas, and the dramatic decrease and fragmentation of the remaining primary forest, with the corresponding increase of secondary forest.
4. Methods and Materials
According to the relevant literature, case studies must fulfil three main characteristics for the replacement cost method to be valid ([83,84,85,86], all cited in Sundberg [87]):
- The manufactured system must replace the environmental service under study with characteristics of similar quality and magnitude.
- The manufactured system, whose cost of production is interpreted as the replacement cost of the environmental service under study, should be the least cost alternative.
- There must be a real need to build the manufactured system in the absence of the environmental service under study.
The first feature requires that the alternative to the service in question (i.e., water provision by inter-basin transfer infrastructure) be provided in comparable magnitude and quality to the service or environmental good it is replacing (i.e., water extracted from the aquifer). The second feature prevents over-estimation of the replacement cost with alternatives whose cost exceeds that of the cheapest available option. The third one requires that, if the environmental good or service in question is missing, there is an urgent need to build the manufactured option.
The case of Central Mexico’s aquifer system meets these three conditions. First, the manufactured replacement system (i.e., alternative supply options) can provide the water availability service in comparable magnitude. Given the absence of additional information, it is assumed that the quality of the water source to be replaced and that of the alternative sources are also comparable. If water quality from the new sources is not adequate, the costs of replacement investments would be affected to the extent to which potabilization operations are needed. Secondly, it would be possible to find the minimum cost combination to substitute a particular extraction volume. For this purpose, a mathematical model taking the form of a linear program is designed in this study. Linear programming is an optimization technique developed in the 20th century that allows for the choice among different feasible alternatives under a unique criterion [88] and, therefore, has been widely applied to solve for a diversity of economic problems. In our implementation, the linear program will solve for the minimum cost of investment in several inter-basin transfer systems subject to the requirement of them providing for a volume of water not less than the current extraction from Central Mexico’s aquifer system. Thirdly, if Mexico’s central aquifer system collapsed, the demand for water would require the construction of the said alternative system since the other sources (regional surface water and the Lerma-Cutzamala system) are not sufficient.
This study computes the minimum costs based on data by Carrera-Hernández [68], and by Carrera-Hernández and Gaskin [27], updated to represent prices of 2016 utilizing linear programming techniques. We also complement it with a financial analysis based on the methodology utilized by CONAGUA to assess investments on water infrastructure. In particular, monetary costs are updated by inflation to represent prices of 2016, and the financial assumptions utilized are those actually used by CONAGUA. The costs for each of the six supply alternatives are comprised by four elements: capital costs, energy costs, opportunity costs of energy otherwise generated, and maintenance. Construction costs are capitalized through an installation calendar of five years, as described in Equation (1) below. Given the length of the construction period, it is necessary to compute the financial opportunity costs of construction expenditures, and we use the 6% discount rate usually included in CONAGUA’s financial plans.
Equation (1) describes the computation of total construction costs of the i-th alternative inclusive for financial opportunity costs computed at the interest rate r. Ii represents the investment needed for its construction distributed in four years (20% in the first year, 35% in the second and third years, and the remaining 10% in the fourth year). Since financial opportunity costs are computed for when construction has ended in year five, each portion of investment in year t is expressed in future value using (1 + r)5−t
Total costs Ci are then covered by annuities Ait, observing that the present values of the annuities—plus their financial opportunity costs—are equal to the construction costs determined above. Table 3 and Table 4 in the Supplementary File include the particular numbers for both Ait and Ci. Formally
Then, the computation of the present value of total costs for each option is
where cit represents unitary operation and maintenance (O and M) costs of the i-th option and xit represents the volume of water transferred by option i in period t. Table 1 and Table 2 in the Supplementary file show the particular numbers for cit utilized in this model. The minimum cost solution is obtained by solving the following linear program
subject to
The first set of constraints (Equation (5)) requires that the volume of water transferred in the solution must be at least the particular volume that needs to be replaced in every period, . The second set of constraints (Equation (6)) requires transferred volumes to be not greater than the relevant capacity constraint for each option, . The model for this study was solved using the R GLPK package for linear programming [89] in the mathematical language R [90].
4.1. Scenario Analysis
To test the behavior of the replacement cost estimated with the model presented in the previous section, we formulate four scenarios regarding the implementation of policies controlling water leaks in the system (see Table 4):
- Scenario 1: No leak control. The full volume of extraction of the aquifer system is to be substituted with the minimum cost combination of the six supply alternatives.
- Scenario 2: Centralized control of leaks by acting on the secondary network of water distribution. These measures are able to reduce 3 m3·s−1 of total leaks and, therefore, it is assumed that this policy allows for an equivalent decrease of aquifer extraction.
- Scenario 3: Scenario 2 + decentralized control of half of domestic leaks. These actions represent a combined decrease of 7.5 m3·s−1 of total leaks and, therefore, an equivalent decrease in aquifer extraction.
- Scenario 4: Scenario 2 + decentralized control of the totality of domestic leaks. These actions decrease total leaks by 12.5 m3·s−1 and allow for an equivalent decrease in aquifer extraction.
4.2. Data
Table 5 relates the variables used in the model described above to data sources. Additional data found in the Supplementary Materials Tables S1–S4 contain a more explicit description of the data utilized in the model described in the previous section.
4.3. Measures for Leak Control
We base our analysis of leak controls on an official document produced by Mexico City’s agency for water management (SACM, for its Spanish acronym). The agency describes three sets of measures for leak control in the primary and secondary distribution systems for domestic deliveries. The first set of measures, here described as “sectorization”, comprises a program to segment the primary distribution network via valve management to control for water’s differential pressure, which is accounted for as one of the most important reasons for leak occurrence. The second set, here described as “rehabilitation”, consists of the substitution of over 2000 km of secondary pipelines with polyethylene pipes. Both sets of measures are thought by the SACM to be able to recover 2.5 m3·s−1 otherwise lost in leaks. The third set of measures, here described as “detection and suppression”, consists of a program to eliminate leaks in 10,000 km of the primary distribution network, with a capacity to recover 0.5 m3·s−1.
The combination of measures described above is able to recover a flow equivalent to a third, or 3 m3·s−1, of the estimated leak flow in the primary and secondary distribution network (10 m3·s−1). They do not contemplate, however, controlling for domestic leak flows, which represents the higher percentage of leaks in the system (15% or 9 m3·s−1). Reduction of domestic leak flows does not require interventions on primary or secondary distribution networks, but rather the decentralized implementation of a simpler set of measures inside households, including the maintenance of plumbing and storage systems. We assume, in Scenario 3, that such measures take place so that 50% of the domestic leak flow is reduced; and in Scenario 4, that they occur and 100% of the domestic leaks flow is reduced.
4.4. Costs of Leak Control
Scenario 2 assumes that the combination of the three sets of centralized measures takes place. Mexico City’s Water Agency (SACM for its Spanish acronym), describes that the investments required to implement the combination of the two first sets of measures, “sectorization and rehabilitation”, is about US$163.3 million. SACM also explains that the pipeline substitution and rehabilitation project would only need one activity to happen in the 26-year period considered in this study. We assume that the combined cost of these two measures represents the capitalized value (i.e., including financial opportunity costs) to be amortized by respective annuities over a 26-year period (see Table 6).
SACM also suggests the duration of the program for detection and leak suppression to be approximately 10 years, at the cost of US$12 million. In order to be comparable with the time-span of the projects in this study, we assume that two of such projects do occur in the 26-year period, at the combined cost of US$25.9 million. The following Table 7 summarizes assumptions and costs for these measures. If successful, these measures would be able to recover 3 m3·s−1, or about a third of the estimated leaks happening in pipelines of the primary distribution network, at a cost of about US$189 million.
The correction of the domestic leak flow does not require the type of infrastructure development involved in the measures described in Table 6, but rather the decentralized implementation of actions that are relatively simple in millions of homes. In order to illustrate the potential impacts of consumers reducing the leaks that they can control, we show two additional scenarios regarding the efficiency of these measures. In Scenario 3, these simple actions inside homes are able to reduce 50% of the domestic leak flow; in Scenario 4, the measures are good enough to reduce 100% of it.
To provide for some cost information of domestic leak control, we assume an annual investment of US$35 dollars per household, which is approximately the market price as of 2016 of the plumbing works required to maintain domestic water infrastructure. Since there are 2.6 million homes in Mexico City [71], the annual cost of these measures is about US$91 million per year. In order for these costs to be comparable to the time-span considered in the model of the previous section, we assume that households incur such costs in 26 repetitions, one per year, and that market prices adjust to the inflation rate targeted by Mexico’s Central Bank. The present value of these measures is, then, US$2.3 billion, as shown in Table 6. Table 6 and Table 7 indicate that the centralized measures for leak control exhibit the least total and unitary costs, US$189 million at US$0.07·m−3, but have the least capacity to reduce leaks (3 m3·s−1). The set of decentralized measures carried on by Mexico City’s households exhibit much larger costs, US$2.4 billion at unitary costs between US$0.29·m−3 and US$0.58·m−3, but have a much greater capacity to reduce leak flows (between 4.5 and 9 m3·s−1).
5. Results of the Scenario Analysis
Table 8 shows the main results of the four scenarios described above. In Scenario 1, no measures for leak control are implemented and the replacement of the 46.7 m3·s−1 requires all six supply options to be combined and active with all of them operating at maximum capacity; except for the inter-basin transfer from the Tecolutla river, which operates at 96% of maximum capacity. The table shows that the most cost-effective option is to bring water from the Taxhimay dam, at US$0.30 m−3, but it can only transfer 4 m3·s−1. The most expensive option is the Tecolutla basin, priced at US$1.14 m−3 and able to transfer 11.5 m3·s−1. The unitary cost of the whole operation of substituting for the 46.7 m3·s−1 is estimated at US$0.82 m−3, while the total investment amounts to a present value of US$25.2 billion over a period of 26 years.
The implementation of the centralized measures for leak control in Scenario 2 reduces the transfer volume to 43.7 m3·s−1, but still requires the combined construction of the six supply alternatives. All options but the transfer from Tecolutla basin, which operates at 70% of maximum capacity, are operating at full capacity. This behavior causes the unitary cost from the Tecolutla River to rise to US$1 m−3. The replacement of the 43.7 m3·s−1 requires an investment of US$23.6 billion at a unitary cost of US$0.65 m−3. Saving 3 m3·s−1 reduced leaks from measures of Scenario 1 generates a reduction of US$1.6 billion in the total replacement cost.
Scenario 3 combines centralized and decentralized measures for leak control, assuming the latter reduces domestic leaks to 50% of the observed values. These measures reduce the volume to be substituted to 39.2 m3·s−1, but would still require the construction of all six alternatives. Unitary costs are now US$0.66 m−3 and the present value of the whole investment is US$21.2 billion. Therefore, saving 7.5 m3·s−1 through leak control reduces the total replacement cost by US$4 billion relative to Scenario 1, in which no leak control measures are put in place. Finally, Scenario 4 assumes that the decentralized measures for control of domestic leaks are able to reduce 100% of the observed leak flow, such that the volume to be replaced is now reduced to 34.7 m3·s−1. Five out of the six supply options are required to be active, and now the construction of the transfer system from the Tecolutla River is no longer necessary. The resulting unitary cost is still US$0.66 m−3 and the present value of the total replacement cost is US$18.9 billion. The reduction of 12 m3·s−1 in the volume to be substituted produces a savings of US$6.3 billion in the total replacement cost. We now analyze the economics of leak control to make the case for the implementation of measures reducing groundwater demand and extraction.
Table 9 compares the reductions in total replacement costs presented in Table 8 with the costs of implementing the measures for leak control included in the four scenarios analyzed. In all scenarios, the ratio between the savings in reduced replacement costs versus the costs of leak control measures is greater than one, meaning that every dollar invested in measures for leak control reduces the replacement cost in quantities greater than one. Furthermore, centralized measures for leak control in Scenario 2 are the most effective in reducing the replacement costs per each dollar invested: the ratio of the former to the latter is 8.4.
6. Discussion
In this section, we offer topics for discussion including the recognition of some analytical characteristics and limitations of the model, and the potential role of our results in informing policy-making. We organize these topics under three main categories.
6.1. The Replacement Cost of Groundwater Extraction and the Economic Value of the Water Forest
The estimation of the replacement cost refers to the economic value of water contained in the system of 10 aquifers located in Central Mexico that share the same recharge zone in the so-called “Water Forest”; therefore, this economic value is not to be interpreted as the economic value of the forest itself. Such an estimation would need to include the economic value of the provision of other ecosystem services, which is beyond the scope and objective of the present study. Furthermore, this study estimates the replacement cost of the volume of groundwater extracted from the aquifers, and not that of the recharge volume associated with the forest. Further physical and hydrologic analysis is required to assess the actual impact of land use changes on aquifer recharge, and such an analysis also lies beyond the scope of the present paper. In all cases, if forest degradation leads to diminished recharge flows, current rates of aquifer depletion would be accelerated, and the need for inter-basin replacement of groundwater extracted from the aquifer would be required in an earlier stage.
6.2. Dealing with Population Growth
The scenario analysis included in this paper took the extraction of groundwater as given, at 46.7 m3·s−1. While this volume is representative of current conditions, we do not assess the likelihood of increases in the near future due to population growth or urbanization for three main reasons. First, the region shows a diverse behavior in population growth: while Mexico City exhibits negative growth rates for the next 20 years (−0.3% year−1 in average), the states of Mexico and Hidalgo exhibit rather low rates (1.2% year−1 and 1% year−1 in average, respectively) for the next 20 years. Mexico’s CONAGUA expects an average growth rate of just 0.5% year−1 for the extended hydrological region of the Valley of Mexico, which is in fact larger than the region represented in Table 1 and Figure 2. A better understanding of population dynamics therefore requires close examination at the municipal level, and official statistics include projections only at the state level. Second, even after recognizing the likelihood of population increase in the region, the response of water demand and supply in urban environments to population growth is not necessarily proportional: cases exist in which public supply for urban areas does not respond to the same extent to population increase, and even total withdrawals can in fact decrease even in the presence of population growth (see, for one such case [93]. Third, Mexico’s CONAGUA has established a closure to prevent the expansion of groundwater withdrawals in all the municipalities of Mexico City and the State of Mexico that are relevant for this study: even in the case in which water supply needs to increase in the future to accommodate for population growth, the additional water cannot come from the aquifer system itself [94].
6.3. Relevance for Policy-Making
The role that our results can play in informing policy-making can be described in two ways. The estimations for the replacement cost of groundwater extraction from the aquifer system in Central Mexico gives a monetary figure for its economic contribution, otherwise hidden for policy makers. The particular monetary figure to which we arrive establishes a benchmark for the order of magnitude of the investments required if such a system continues to be depleted, and if the forest serving as a recharge zone continues to be subject to deforestation. In that sense, our results can be utilized in wider discussions promoting both demand control and forest conservation as they indicate the economic dimension of the water provision service of the aquifer system and, ultimately, of the forest providing for recharge flows. We also aim to clarify the economics of measures for leak control, such that they can be promoted and implemented: every dollar invested in such measures saves more than $1 in replacement costs.
6.4. Methodological Aspects
A more complete analysis would need to include the external effects associated with the investments analyzed. For instance, inter-basin transfer systems frequently produce costs in the basins of origin. While the estimations for this paper account for costs associated with the lost value of electricity no longer generated, it is likely that there are other significant costs that we do not include in our computations. Furthermore, the reduction of water extraction of the aquifer system will also reduce the discharge of wastewater that is utilized on irrigation districts in the State of Hidalgo. These costs should also be included for a more complete picture, and they can be the subjects of subsequent research.
Finally, the choice of the six inter-basin transfer options included the designed flow capacity exposed in Carrera-Hernández and Gaskin [28]. A more complete approach would solve a two-step optimization program: first selecting for maximum capacities and then choosing for idle capacity. Such a program grows in complexity and is also beyond the reach of the present paper, but it can be explored in subsequent research. Carrera-Hernández and Gaskin [28] are, in turn, based on an internal SACM document dating back to the 1980s. It is likely that the technical characteristics have changed thanks to improved engineering, but we could not operate otherwise due to a lack of updated technical information.
7. Concluding Remarks
Water provision and management constitute a major challenge for the region that is home to 28.8 million people living in the metropolitan areas of Toluca, Cuernavaca, and Mexico City. Currently, water demand is satisfied with the appropriation of local and external sources at rates that are no longer sustainable. According to data from the country’s water commission, the Central Mexico region uses up to 1.8 times the renewable flow of water, both from underground and superficial sources. As a result, the region is compromised by water unsustainability and already exhibits the most extreme values of water stress in the country.
The exercise presented in this paper estimates the replacement cost for groundwater extraction of 10 aquifers in Central Mexico with the construction of six supply alternatives including for inter-basin transfer systems and aquifer injection of treated water. These aquifers were selected due to the importance of economic activities in these metropolitan areas for the country, and boosting because they share the same recharge zone in a forested area known as the “Water Forest” which, in turn, faces pressures from economic activities boosting its deforestation. Relevant literature suggests that estimating for replacement costs is an adequate methodology for highlighting the economic value of hydrological services provided by the water-producing forest and the aquifers that constitute a major source for water extraction. We conclude that the case studied herein complies with the three requirements of the cost replacement methodology discussed in previous sections.
We find that the replacement cost of extracting 46.7 m3·s−1 from the aquifer system amounts to a present value of US$25.2 billion (in prices for 2016) at a unitary cost of US$0.65 m−3. This figure turns out to be equivalent to 30 years of the current annual budget of the water system of Mexico City. We report on a scenario analysis involving several measures to reduce leak flows in Mexico City. These measures consist of a set of centralized measures by the local water agency to reduce leaks from the primary and secondary distribution systems, in Scenario 2, and a set of decentralized measures carried out by urban households to reduce leaks from domestic infrastructure in about 2.4 million homes, in Scenarios 3 and 4. The scenario analysis estimates the reduction of water extracted from the aquifer system due to savings from leak control, and the associated replacement costs with the six systems of inter-basin transfer.
The results from the scenario analysis indicate that the investments in leak control are cost-effective with regards to reducing the replacement costs of groundwater extraction. In particular, the best result is obtained in Scenario 2, in which an investment of US$189 million in leak control produces a cost reduction of US$1.6 billion, that is: every dollar spent in reducing leaks reduces the replacement cost in 8.4 dollars; whereas the worst result is obtained in Scenario 3, in which an investment of US$2.1 billion produces a reduction in replacement costs of US$4 billion: every dollar invested in such a combination of leak control measures reduces the replacement cost by $1.90.
Our exercise exhibits some limitations that constitute grounds for further research. First, our results should not be interpreted as computations on the economic value of the forest serving as recharge zone for the aquifers selected: given that the forest produces a wider portfolio of environmental services, they constitute—at most—only a portion of such value. Second, the estimated replacement costs are based only on the financial information of the construction and management of supply alternatives: they do not include other costs arising from environmental, economic, or social impacts in regions affected by the inter-basin infrastructure. Third, our estimation provides for present values for a time horizon of 26 years, which is assumed to include the life cycle of the built infrastructure before requiring major revisions, but we take the extraction volume as given throughout the whole period. This is a restrictive assumption provided the recent trends of urbanization observed in several areas of Central Mexico: if groundwater extraction continues to rise, its replacement cost can only grow accordingly. Finally, we omit the economic value of external impacts of leak reduction as reduced discharges to the irrigation districts in Hidalgo State that utilize wastewater as irrigation water. This research, and its potential derivatives, are aimed at supporting a better understanding of the hydrologic and socio-economic complexities of Central Mexico to promote more informed decision-making in the present and near future.
Supplementary Materials
The following are available online at www.mdpi.com/2073-4441/9/8/571/s1, Table S1: Unitary O&M costs, Table S2: Unitary O&M costs 26 years, Table S3: Construction costs, Table S4: Annuities 26 years.
Acknowledgments
Carlos A. López-Morales is grateful to Mexico’s Instituto Nacional de Ecología y Cambio Climático, in particular to the staff of the Directorate General of Hydrographical Basin Management that motivated the design of the exercise estimating the aquifers’ replacement cost. The work on this manuscript was partly funded by the project “Hacia una gestion integral del agua por cuenca hidrologica: un analisis de la disponibilidad y usos”, supported by CONACYT through the 2014 call “Proyectos de Desarrollo Cientifico para atender Problemas Nacionales PDCPN-248719” which M. Azahara Mesa-Jurado is part of. The authors acknowledge the financial support from the Spanish Ministry of Economics and Competitiveness (MINECO) and the European Regional Development Fund (ERDF) through the research project EVAMODRE (AGL2014-53417-R). The authors are grateful to Mariana Munguía for helping with geographic information systems to produce the maps contained in Figure 2 and to María Fernanda Ornelas López for allowing us to use the map contained in Figure 1. Finally, we thank the anonymous reviewers for their very useful comments.
Author Contributions
Carlos A. López-Morales designed the experiment, the mathematical model, obtained the numerical results, and provided their interpretation. Maria Azahara Mesa-Jurado provided with the analysis of relevance for water policy, performed the literature review, and contributed substantially to the writing of the paper.
Conflicts of Interest
The authors declare no conflict of interest.
References
- World Water Assessment Programme (WWAP). The United Nations World Water Development Report 2015: Water for a Sustainable World, United Nations World Water Assessment Programme; UNESCO: Paris, France, 2015. [Google Scholar]
- Mekonnen, M.M.; Hoekstra, A.Y. Four billion people facing severe water scarcity. Sci. Adv. 2016, 2. [Google Scholar] [CrossRef] [PubMed]
- Organisation for Economic Co-Operation and Development (OECD). Environmental Outlook to 2050; OECD Publishing: Paris, France, 2012. [Google Scholar]
- Tang, Q.; Lettenmaier, D.P. 21st Century runoff sensitivities of major global river basins. Geophys. Res. Lett. 2012, 39, 92–104. [Google Scholar] [CrossRef]
- Dodds, W.K.; Perkin, J.S.; Gerken, J.E. Human Impact on Freshwater Ecosystem Services: A Global Perspective. Environ. Sci. Technol. 2013, 47, 9061–9068. [Google Scholar] [CrossRef] [PubMed]
- Tang, Z.; Shi, C.B.; Bi, K.X. Impacts of land cover change and socioeconomic development on ecosystem service values. Environ. Eng. Manag. J. 2014, 13, 2697–2705. [Google Scholar]
- Taylor, R.G.; Scanlon, B.; Doll, P.; Rodell, M.; van Beek, R.; Wada, Y.; Longuevergne, L.; Leblanc, M.; Famiglietti, J.S.; Edmunds, M.; et al. Ground water and climate change. Nat. Clim. Chang. 2013, 3, 322–329. [Google Scholar] [CrossRef] [Green Version]
- Gain, A.K.; Giupponi, C.; Wada, Y. Measuring global water security towards sustainable development goals. Environ. Res. Lett. 2016, 11, 124015. [Google Scholar] [CrossRef]
- Gleeson, T.; Wada, Y.; Bierkens, M.F.P.; van Beek, L.P.H. Water balance of global aquifers revealed by groundwater footprint. Nature 2012, 488, 197–200. [Google Scholar] [CrossRef] [PubMed]
- Konikow, L.F.; Kendy, E. Groundwater depletion: A global problem. Hydrogeol. J. 2005, 13, 317–320. [Google Scholar] [CrossRef]
- Gleick, P.H. A Look at Twenty-first Century Water Resources Development. Water Int. 2000, 25, 127–138. [Google Scholar] [CrossRef]
- Liu, S.; Crossman, N.D.; Nolan, M.; Ghirmay, H. Bringing ecosystem services into integrated water resources management. J. Environ. Manag. 2013, 129, 92–102. [Google Scholar]
- Pahl-Wostl, C.; Jeffrey, P.; Isendahl, N.; Brugnach, M. Maturing the New Water Management Paradigm: Progressing from Aspiration to Practice. Water Resour. Manag. 2011, 25, 837–856. [Google Scholar] [CrossRef]
- Setegn, S.G.; Donoso, M.C. Sustainability of Integrated Water Resources Management, 1st ed.; Springer International Publishing: Cham, Switzerland, 2015. [Google Scholar]
- Munoz-Pina, C.; Guevara, A.; Torres, J.M.; Brana, J. Paying for the hydrological services of Mexico’s forests: Analysis, negotiations and results. Ecol. Econ. 2008, 65, 725–736. [Google Scholar] [CrossRef]
- Val-Segura, R.; Arriaga-Medina, J. Water Resources Management and Sustainability in Mexico. In Sustainability of Integrated Water Resources Management. Water Governance, Climate and Ecohydrology; Setegn, S.G., Donoso, M.C., Eds.; Springer International Publishing: Cham, Switzerland, 2015; p. 620. [Google Scholar]
- Perez-Verdin, G.; Sanjurjo-Rivera, E.; Galicia, L.; Hernandez-Diaz, J.C.; Hernandez-Trejo, V.; Marquez-Linares, M.A. Economic valuation of ecosystem services in Mexico: Current status and trends. Ecosyst. Serv. 2016, 21, 6–19. [Google Scholar] [CrossRef]
- Adler, I. Domestic water demand management: Implications for Mexico City. Int. J. Urban Sustain. Dev. 2011, 3, 93–105. [Google Scholar] [CrossRef]
- Tortajada, C. Water management in Mexico City Metropolitan Area. Int. J. Water Resour. Dev. 2006, 22, 353–376. [Google Scholar] [CrossRef]
- Sosa-Rodriguez, F. Impacts of Water-management Decisions on the Survival of a City: From Ancient Tenochtitlan to Modern Mexico City. Water Resour. Manag. 2010, 26, 675–687. [Google Scholar] [CrossRef]
- Kimmelman, M. Mexico City, Parched and Sinking, Faces a Water Crisis. The New York Times, 17 February 2017. [Google Scholar]
- Comisión Nacional del Agua (CONAGUA); Secretaría de Medio Ambiente y Recursos Naturales (SEMARNAT). Estadisticas del Agua en Mexico Edicion 2016; Comisión Nacional del Agua: Mexico, DF, Mexcio, 2016. (In Spanish) [Google Scholar]
- Sosa-Rodriguez, F. Exploring the risks of ineffective water supply and sewage disposal: A case study of Mexico City. Environ. Hazards 2010, 9, 135–146. [Google Scholar] [CrossRef]
- Caro-Borrero, A.; Corbera, E.; Neitzel, K.C.; Almeida-Lenero, L. “We are the city lungs”: Payments for ecosystem services in the outskirts of Mexico City. Land Use Policy 2015, 43, 138–148. [Google Scholar] [CrossRef]
- Estrategia Regional Para la Conservación del Bosque de Agua (ECOBA); Hoth, J. (Ed.) Fundación Gonzalo Río Arronte, I.A.P., Fundación Biosfera del Anáhuac, A.C., y Pronatura México, A.C: Mexico City, Mexico, 2012. (In Spanish) [Google Scholar]
- Angeles-Serrano, G.; Carrillo-Rivera, J.; Hernández, G. Groundwater recharge processes in the Central Region of Mexico. RMZ-Mater. Geoenviron. 2003, 50, 5–8. [Google Scholar]
- Carrera-Hernandez, J.J.; Gaskin, S.J. Spatio-temporal analysis of potential aquifer recharge: Application to the Basin of Mexico. J. Hydrol. 2008, 353, 228–246. [Google Scholar] [CrossRef]
- Lopez Ornelas, M.F. The Mexican Water Forest: Benefits of Using Remote Sensing Techniques to Assess Changes in Land Use and Land Cover. Master’s Thesis, University of San Francisco, San Francisco, CA, USA, 2016. [Google Scholar]
- Zabala, M.; Martínez, S.; Perevochtchikova, M.; Sandoval-Romero, G.; Aponte, N. Hydrochemical Assessment of Hydrological Environmental Services in the Recharge Area in the Southwest of Mexico City. Environ. Earth Sci. 2017, 76. [Google Scholar] [CrossRef]
- Perevochtchikova, M.; Vazquez Beltran, A. The Federal Program of Payment for Hydrological Environmental Services as an Alternative Instrument for Integrated Water Resources Management in Mexico City. Open Geogr. J. 2012, 5, 26–37. [Google Scholar] [CrossRef]
- Pérez-Campuzano, E.; Avila-Foucat, V.S.; Perevochtchikova, M. Environmental policies in the peri-urban area of Mexico City: The perceived effects of three environmental programs. Cities 2016, 50, 129–136. [Google Scholar] [CrossRef]
- ICWE. The Dublin Statement on Water and Sustainable Development. In Proceedings of the International Conference on Water and the Environment, Dublin, Ireland, 26–31 January 1992. [Google Scholar]
- Dodds, F.; Bartram, J. History of the Nexus at the Intergovernmental Level. In The Water, Food, Energy and Climate Nexus. Challenges and an Agenda for Action; Dodds, F., Bartram, J., Eds.; Taylor and Francis Inc.: Abingdon, UK, 2016; p. 265. [Google Scholar]
- UN General Assembly. United Nations Millennium Declaration, Resolution Adopted by the General Assembly; 55th Sess.: 2000–2001; UN General Assembly: New York, NY, USA, 2000. [Google Scholar]
- UN General Assembly. United Nations General Assembly Resolution on Human Right to Water and Sanitation; United Nations General Assembly Resolution; A/64/292; United Nations: New York, NY, USA, 2010. [Google Scholar]
- Meier, B.M.; Kayser, G.L.; Amjad, U.Q.; Bartram, J. Implementing an evolving human right through water and sanitation policy. Water Policy 2013, 15, 116–133. [Google Scholar] [CrossRef]
- UNEP. Global Environment Outlook GEO 5: Environment for The Future We Want; United Nations Environment Program: Nairobi, Kenya, 2012. [Google Scholar]
- UN-Water. A Compilation of Aspects on the Means of Implementation: Water and Sanitation. A Look at Goal 6 and Goal 17; United Nations: New York, NY, USA, 2015. [Google Scholar]
- Niasse, M.; Cherlet, J. Using ecosystem services-based approaches in integrated water resources management: Perspectives from the developing world. In Water Ecosystem Services: A Global Perspective; Martin-Ortega, J., Ferrier, R.C., Gordon, I.J., Khan, S., Eds.; International Hydrology Series; Cambridge University Press: Cambridge, UK, 2015; pp. 49–56. [Google Scholar]
- Martin-Ortega, J.; Jorda-Capdevila, D.; Glenk, K.; Holstead, K.L. What defines ecosystem services-based approaches? In Water Ecosystem Services: A Global Perspective; Martin-Ortega, J., Ferrier, R.C., Gordon, I.J., Khan, S., Eds.; International Hydrology Series; Cambridge University Press: Cambridge, UK, 2015; pp. 3–9. [Google Scholar]
- De Groot, R.; Brander, L.; van der Ploeg, S.; Costanza, R.; Bernard, F.; Braat, L.; Christie, M.; Crossman, N.; Ghermandi, A.; Hein, L.; et al. Global estimates of the value of ecosystems and their services in monetary units. Ecosyst. Serv. 2012, 1, 50–61. [Google Scholar] [CrossRef]
- Kosoy, N.; Corbera, E. Payments for ecosystem services as commodity fetishism. Ecol. Econ. 2010, 69, 1228–1236. [Google Scholar] [CrossRef]
- Jax, K.; Barton, D.N.; Chan, K.M.A.; de Groot, R.; Doyle, U.; Eser, U.; Görg, C.; Gómez-Baggethun, E.; Griewald, Y.; Haber, W.; et al. Ecosystem services and ethics. Ecol. Econ. 2013, 93, 260–268. [Google Scholar] [CrossRef]
- Gómez-Baggethun, E.; de Groot, R.; Lomas, P.L.; Montes, C. The history of ecosystem services in economic theory and practice: From early notions to markets and payment schemes. Ecol. Econ. 2010, 69, 1209–1218. [Google Scholar] [CrossRef]
- Gómez-Baggethun, E.; Muradian, R. In markets we trust? Setting the boundaries of Market-Based Instruments in ecosystem services governance. Ecol. Econ. 2015, 117, 217–224. [Google Scholar]
- Silvertown, J. Have Ecosystem Services Been Oversold? Trends Ecol. Evol. 2015, 30, 641–648. [Google Scholar] [CrossRef] [PubMed]
- De Groot, R.S.; Alkemade, R.; Braat, L.; Hein, L.; Willemen, L. Challenges in integrating the concept of ecosystem services and values in landscape planning, management and decision making. Ecol. Complex. 2010, 7, 260–272. [Google Scholar] [CrossRef]
- Pascual, U.; Muradian, R.; Brander, L.; Gómez-Baggethun, E.; Martín-López, B.; Verma, M.; Armsworth, P.; Christie, M.; Cornelissen, H.; Eppink, F.; et al. The economics of valuing ecosystem services and biodiversity. In The Economics of Ecosystems and Biodiversity: Ecological and Economic Foundations; Kumar, P., Ed.; Taylor and Francis: London, UK, 2012; pp. 183–256. [Google Scholar]
- Rode, J.; Wittmer, H.; Emerton, L.; Schroter-Schlaack, C. “Ecosystem service opportunities”: A practice-oriented framework for identifying economic instruments to enhance biodiversity and human livelihoods. J. Nat. Conserv. 2016, 33, 35–47. [Google Scholar] [CrossRef] [PubMed]
- Costanza, R.; de Groot, R.; Sutton, P.; van der Ploeg, S.; Anderson, S.J.; Kubiszewski, I.; Farber, S.; Turner, R.K. Changes in the global value of ecosystem services. Glob. Environ. Chang. Policy Dimens. 2014, 26, 152–158. [Google Scholar] [CrossRef]
- Kumar, P.; Brondizio, E.; Gatzweiler, F.; Gowdy, J.; de Groot, D.; Pascual, U.; Reyers, B.; Sukhdev, P. The economics of ecosystem services: From local analysis to national policies. Curr. Opin. Environ. Sustain. 2013, 5, 78–86. [Google Scholar] [CrossRef]
- Grizzetti, B.; Lanzanova, D.; Liquete, C.; Reynaud, A.; Cardoso, A.C. Assessing water ecosystem services for water resource management. Environ. Sci. Policy 2016, 61, 194–203. [Google Scholar] [CrossRef]
- Wada, Y.; van Beek, L.P.H.; van Kempen, C.M.; Reckman, J.W.T.M.; Vasak, S.; Bierkens, M.F.P. Global depletion of groundwater resources. Geophys. Res. Lett. 2010, 37. [Google Scholar] [CrossRef]
- Griebler, C.; Avramov, M. Groundwater ecosystem services: A review. Freshw. Sci. 2015, 34, 355–367. [Google Scholar] [CrossRef]
- Grönwall, J.T.; Mulenga, M.; McGranahan, G. Groundwater, Self-Supply and Poor Urban Dwellers A Review with Case Studies of Bangalore and Lusaka; IIED: London, UK, 2010. [Google Scholar]
- Kløve, B.; Ala-Aho, P.; Bertrand, G.; Gurdak, J.J.; Kupfersberger, H.; Kværner, J.; Muotka, T.; Mykrä, H.; Preda, E.; Rossi, P.; et al. Climate change impacts on groundwater and dependent ecosystems. J. Hydrol. 2014, 518 Pt B, 250–266. [Google Scholar] [CrossRef]
- Chaves, H.; Camelo, A.P.; Mendes, R. Groundwater discharge as affected by land use change in small catchments: A hydrologic and economic case study in Central Brazil. In Climate Change Effects on Groundwater Resources: A Global Synthesis of Findings and Recommendations; Treidel, H., Martin-Bordes, J.L., Gurdak, J.J., Eds.; International Contributions to Hydrogeology (IAH); CRC Press: Boca Raton, FL, USA, 2011; pp. 49–62. [Google Scholar]
- Jujnovsky, J.; Ramos, A.; Caro-Borrero, Á.; Mazari-Hiriart, M.; Maass, M.; Almeida-Leñero, L. Water assessment in a peri-urban watershed in Mexico City: A focus on an ecosystem services approach. Ecosyst. Serv. 2017, 24, 91–100. [Google Scholar] [CrossRef]
- Barbier, E.B. Valuing ecosystem services as productive inputs. Econ. Policy 2007, 22, 178–229. [Google Scholar] [CrossRef]
- Barbier, E.B.; Baumgärtner, S.; Chopra, K.; Costello, C.; Duraiappah, A.; Hassan, R.; Kinzig, A.P.; Lehman, M.; Pascual, U.; Polasky, S.; et al. The valuation of ecosystem services. In Biodiversity, Ecosystem Functioning, and Human Wellbeing: An Ecological and Economic Perspective; Naeem, S., Ed.; Oxford University Press: Oxford, UK, 2009. [Google Scholar]
- Mendelsohn, R.; Olmstead, S. The Economic Valuation of Environmental Amenities and Disamenities: Methods and Applications. Annu. Rev. Environ. Resour. 2009, 34, 325–347. [Google Scholar] [CrossRef]
- Bateman, I.J.; Mace, G.M.; Fezzi, C.; Atkinson, G.; Turner, K. Economic Analysis for Ecosystem Service Assessments. Environ. Resour. Econ. 2011, 48, 177–218. [Google Scholar] [CrossRef]
- Chichilnkisky, G.; Heal, G. Economic returns from the biosphere. Nature 1998, 391, 629–630. [Google Scholar] [CrossRef]
- Heal, G. Valuing ecosystem services. Ecosystems 2000, 3, 24–30. [Google Scholar] [CrossRef]
- Postel, S.L.; Thompson, B.H. Watershed protection: Capturing the benefits of nature’s water supply services. Nat. Resour. Forum 2005, 29, 98–108. [Google Scholar] [CrossRef]
- Instituto Nacional de Estadística y Geografía (INEGI). Census of Population and Housing 2010; Instituto Nacional de Estadística y Geografía: Mexcio City, Mexcio, 2012. [Google Scholar]
- Registro Público de Derechos de Agua (REPDA). Localizador de Aguas Nacionales, Zonas Federales y Descargas de Aguas Residuales; Registro Público de Derechos de Agua: Mexcio City, Mexcio, 2015. (In Spanish) [Google Scholar]
- Carrera-Hernández, J.J.; Gaskin, S.J. The Basin of Mexico aquifer system: Regional groundwater level dynamics and database development. Hydrogeol. J. 2007, 15, 1577–1590. [Google Scholar] [CrossRef]
- Burns, E. (Ed.) Repensar la Cuenca: La Gestión de los Ciclos del agua en el Valle de México; UAM-Unidad Xochimilco and USAID: Mexico City, Mexico, 2009. (In Spanish) [Google Scholar]
- Ortega, G.; Farvolden, R. Computer analysis of regional groundwater flow and boundary conditions in the basin of mexico. J. Hydrol. 1989, 110, 271–294. [Google Scholar]
- Bojorquez Tapia, L.A.; Ezcurra, E.; Mazari-Hiriart, M.; Diaz, S.; Gomez, P.; Alcantar, G.; Megarejo, D. Basin of Mexico: A History of Watershed Mismanagement. Land Stewardship in the 21st Century: The Contributions of Watershed Management. Available online: https://www.fs.fed.us/rm/pubs/rmrs_p013.pdf (accessed on 31 July 2017).
- Saavedra, Z.; Ojeda Revah, L.; López Barrera, F. Identification of threatened areas of environmental value in the Conservation Area of Mexico City, and setting priorities for their protection. Investig. Geogr. 2011, 74, 19–34. [Google Scholar]
- Edmunds, W.M.; Carrillo-Rivera, J.J.; Cardona, A. Geochemical evolution of groundwater beneath Mexico City. J. Hydrol. 2002, 258, 1–24. [Google Scholar] [CrossRef]
- Mazari-Hiriart, M.; López-Vidal, Y.; Calva, J.J. Helicobacter pylori in water systems for human use in Mexico City. Water Sci. Technol. 2001, 43, 93–98. [Google Scholar] [PubMed]
- Mazari-Hiriart, M.; Cruz-bello, G.; Bojórquez-tapia, L.A.; Juárez-Marusich, L.; Alcantar-lópez, G.; Marín, L.E.; Soto-Galera, E. Groundwater Vulnerability Assessment for Organic Compounds: Fuzzy Multicriteria Approach for Mexico City. Environ. Manag. 2006, 37, 410–421. [Google Scholar] [CrossRef] [PubMed]
- CENTRE. Water Management in the Mexico City Metropolitan Area: The Hard Way to Learn; Third World Centre for Water Management: Mexico City, Mexico, 2002. [Google Scholar]
- Herrera-Parrilla, I.; Medina-Bañuelos, R.; Camillo-Rivera, J.; Vazquez-Sánchez, E. Diagnostico del Estado Presente de las Aguas Subterraneas de la Ciudad de Mexico y Determinacion de sus Condiciones Futuras (Diagnosis of the Present State of Ground-Water in Mexico City and its Future Condition); Direccion General de Construcción y Operación Hidráulica de México DF (DGCOH,DF): Mexico City, Mexico, 1994. (In Spanish) [Google Scholar]
- National Institute of Ecology. Propuesta Para la Gestión del BOSQUE de Agua Como Región Prioritaria de Conservación (Proposal for the Management of Water Forest as priority Conservation Region); National Institute of Ecology: Mexico City, Mexico, 2010. (In Spanish) [Google Scholar]
- Comisión Nacional para el Conocimiento y Uso de la Biodiversidad (CONABIO). Regiones Terrestres Prioritarias de México. Region 108: Ajusco Chichinautzin. Regiones Terrestres Prioritarias de México; Arriaga, L., Espinoza, J.M., Aguilar, C., Martínez, E., Gómez y E. Loa, L., Eds.; CONABIO: Mexico City, Mexico, 2000. (In Spanish) [Google Scholar]
- Comisión Nacional para el Conocimiento y Uso de la Biodiversidad (CONABIO). Regiones Hidrológicas Prioritarias: Aguas Continentales y Diversidad Biológica de México. Comisión Nacional Para el Conocimiento y Uso de la Biodiversidad. México; Arriaga, L., Aguilar, V., Alcocer, J., Eds.; CONABIO: Mexico, DF, Mexico, 2002. (In Spanish) [Google Scholar]
- Instituto Nacional de Estadística y Geografía (INEGI). Conjunto de Datos Vectoriales de la Carta de uso de Suelo y Vegetación. Escala 1:250,000. Serie II (Conjunto Nacional); Instituto Nacional de Estadística y Geografía: Aguascalientes, Mexico, 1997. (In Spanish) [Google Scholar]
- Instituto Nacional de Estadística y Geografía (INEGI). Conjunto de Datos Vectoriales de la Carta de uso de Suelo y Vegetación. Escala 1:250,000. Serie V (Conjunto Nacional); Instituto Nacional de Estadística y Geografía: Aguascalientes, Mexico, 2013. (In Spanish) [Google Scholar]
- Batie, L.A.S.; Batie, S.S. Economic value of natural Coastal wetlands: A critique. Coast. Zone Manag. J. 1978, 4, 231–247. [Google Scholar]
- Leschine, T.M.; Wellman, K.F.; Green, T.H. The Economic Value of Wetlands: Wetlands’ Role in Flood Protection in Western Washington; Washington State Department of Ecology: Lacey, WA, USA, 1997; 68p.
- Bockstael, N.E.; Freeman, A.M.; Kopp, R.J.; Portney, P.R.; Smith, V.K. On measuring economic values for nature. Environ. Sci. Technol. 2000, 34, 1384–1389. [Google Scholar] [CrossRef]
- Freeman, A.M. The Measurement of Environmental and Resource Values: Theory and Methods; An RFF Press Book; Resources for the Future: Washington, DC, USA, 2003. [Google Scholar]
- Sundberg, S. Replacement costs as economic values of environmental change: A review and an application to Swedish sea trout habitats. Beijer Int. Inst. Ecol. Econ. R. Swedish Acad. Sci. 2004, 1–72. [Google Scholar]
- Dorfman, R.; Samuelson, P.A.; Solow, R.M. Linear Programming and Economic Analysis; Courier Corporation: North Chelmsford, MA, USA, 1958. [Google Scholar]
- Theussl, S.; Hornik, K. R GLPK: R/GNU Linear Programming Kit Interface; Department for Applied Informatics, Moscow Aviation Institute: Moscow, Russia, 2016. [Google Scholar]
- R Core Team. A Language and Environment for Statistical Computing; R Foundation for Statistical Computing: Vienna, Austria, 2014. [Google Scholar]
- Carrera-Hernández, J.J.; Gaskin, S.J. Water management in the Basin of Mexico: Current state and alternative scenarios. Hydrogeol. J. 2009, 17, 1483–1494. [Google Scholar] [CrossRef]
- Ramirez-Sama, C. El agua en la cuenca de mexico (Water in the basin of Mexico). In Problemas de la Cuenca del Valle de Mexico (Problems in the Basin of Mexico); Colegio de Mexico: Mexico City, Mexico, 1990; pp. 61–80. [Google Scholar]
- Maupin, M.; Kenny, J.; Huston, S.; Lovelace, J.; Barber, N.; Linsey, K. Estimated Use of Water in the United States in 2010; Circular 1405; U.S. Department of the Interior, U.S. Geological Survey: Reston, VA, USA, 2014.
- Comision Nacional del Agua (CONAGUA). Estadísticas del Agua de la Región Hidrológico-Administrativa XIII; Organismo de Cuenca Aguas del Valle de México: Mexico City, Mexico, 2014. (In Spanish) [Google Scholar]
Figure 1.
Water Forest extension and location of the main cities map. Source: Extracted from Ornelas-Lopez [28].
Figure 1.
Water Forest extension and location of the main cities map. Source: Extracted from Ornelas-Lopez [28].
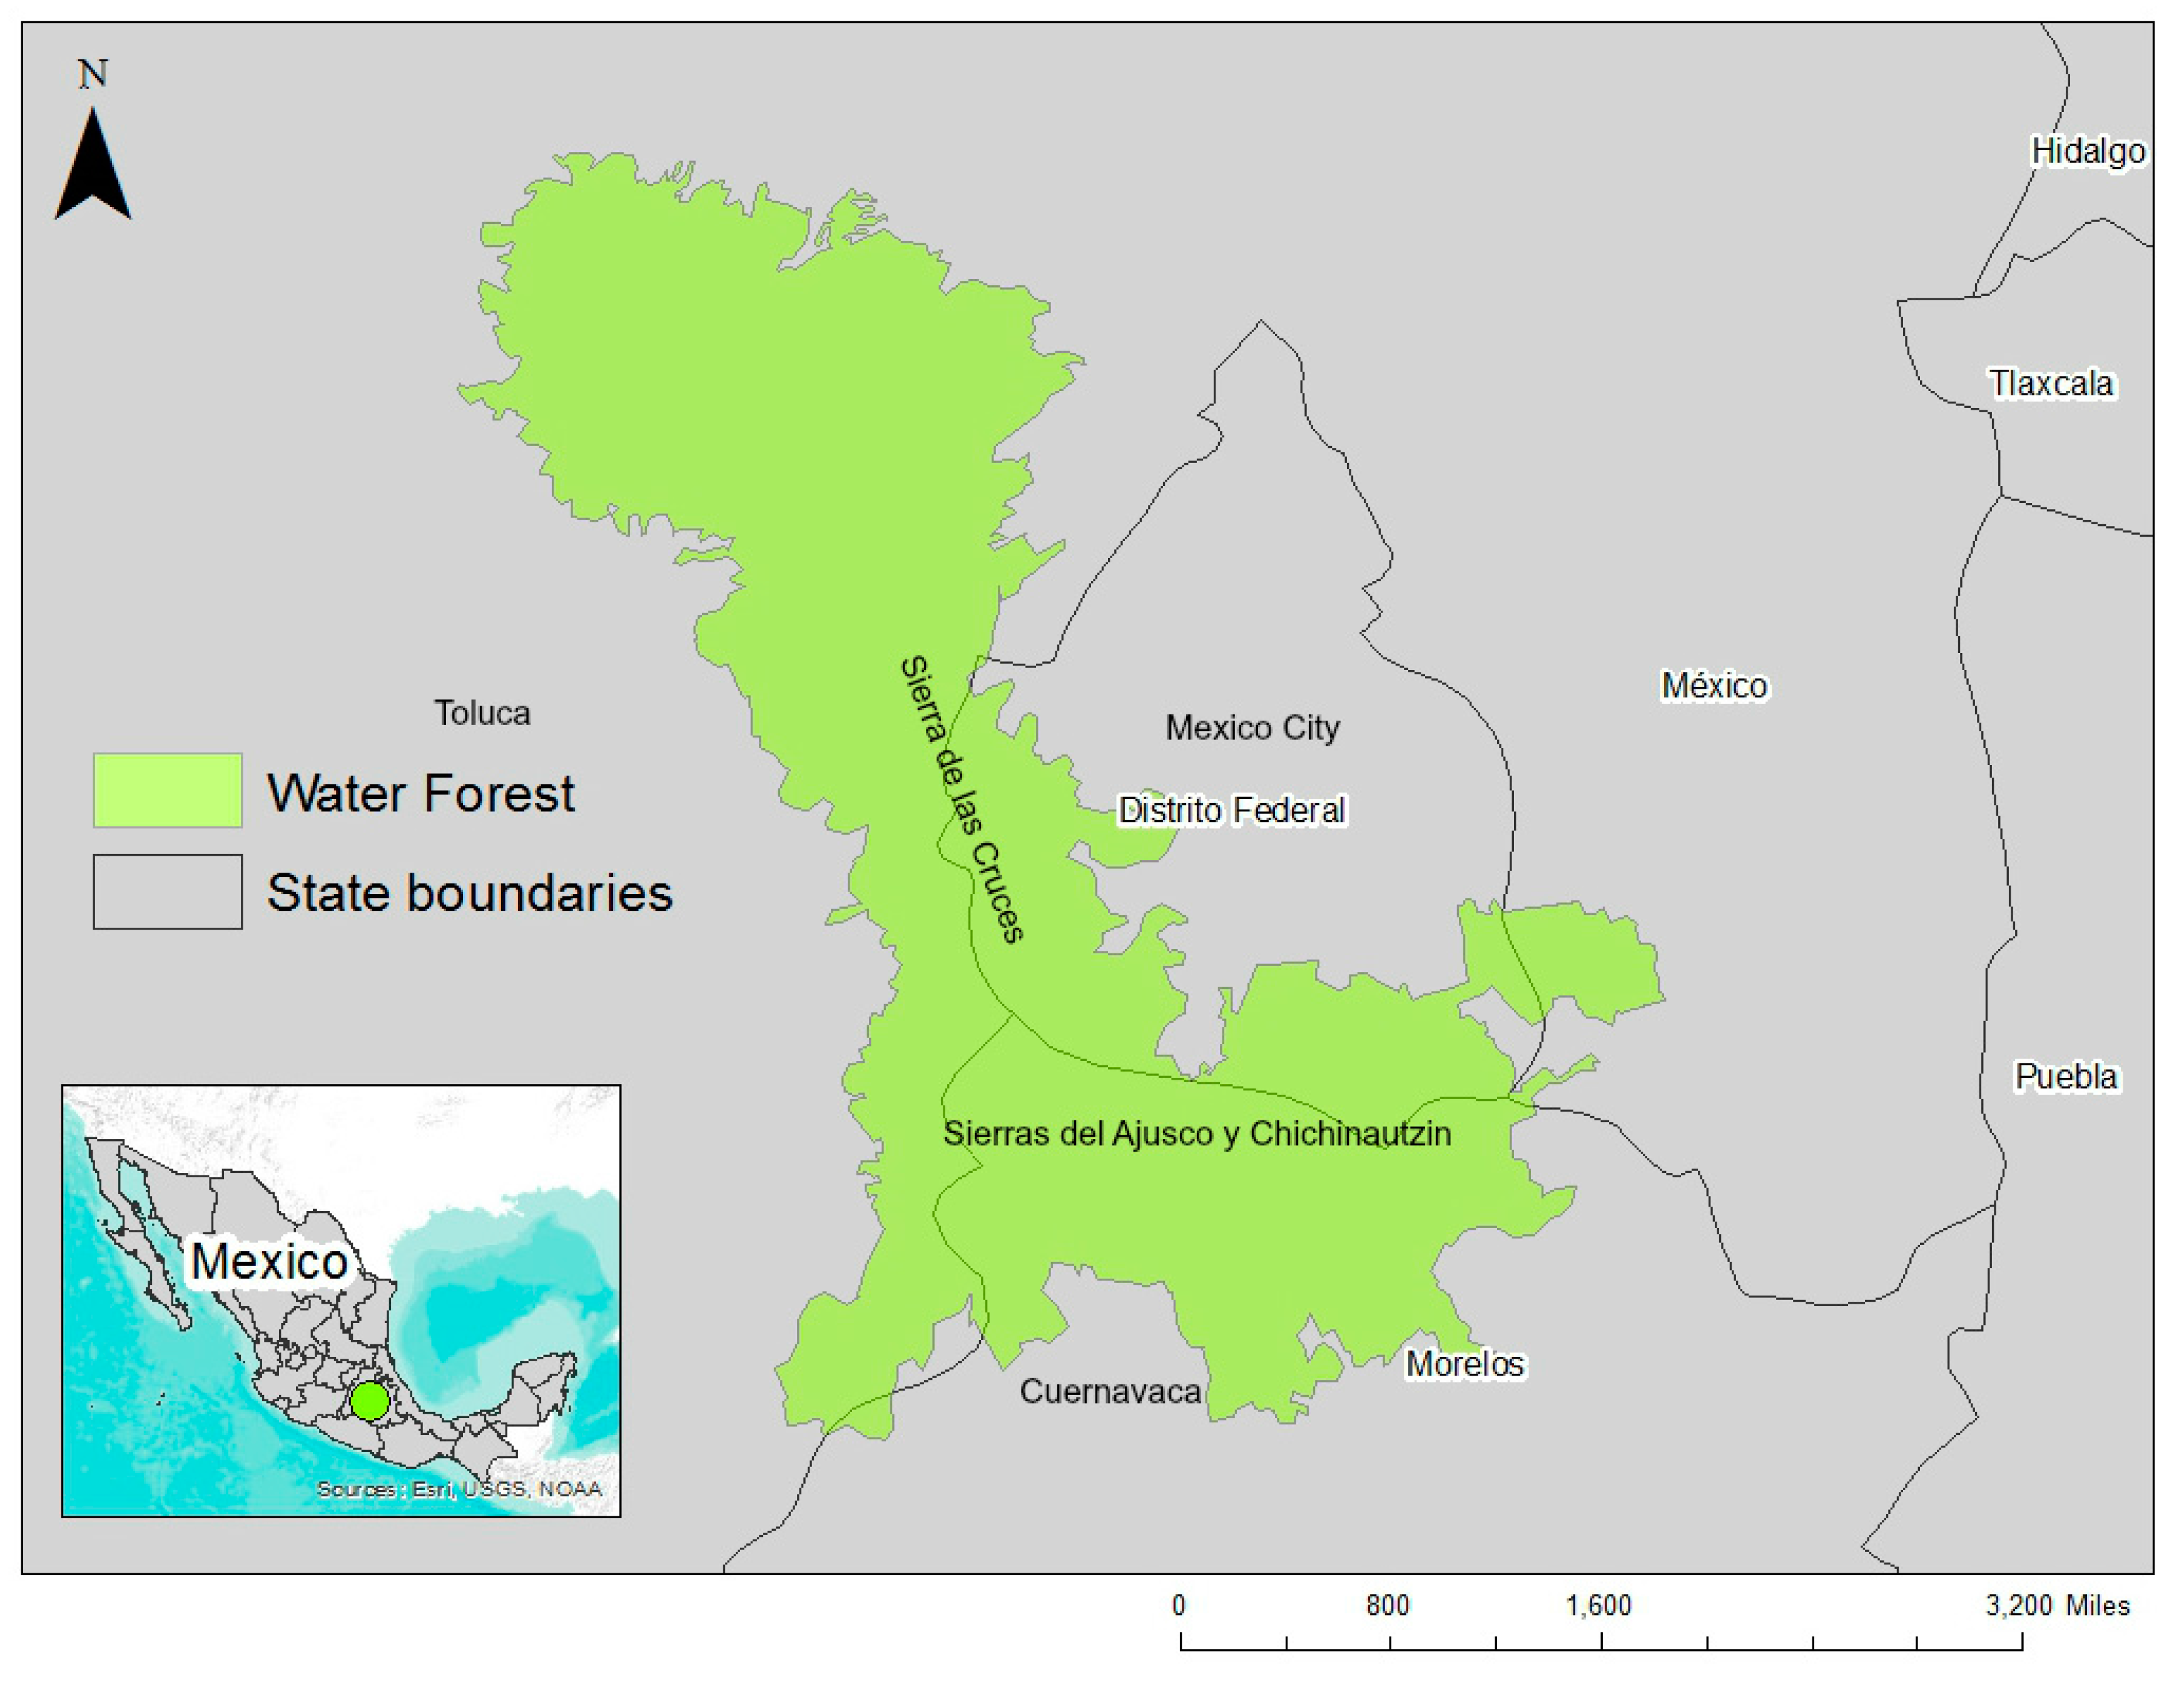
Figure 2.
Land cover for the Water Forest region in the periods 1985–1996 (top), and 2008–2012 (bottom). Dots in the maps indicate the location of extraction wells. Source: own elaboration with data from INEGI (Series II) [81] and INEGI (Series V) [82].


Table 1.
Population, extraction, and economic uses of 10 aquifers in Central Mexico.
| Population | Exploitation | Main Use (Fraction) | ||||||||
|---|---|---|---|---|---|---|---|---|---|---|
| Aquifers 1 | Million | % | % Urban | Wells | % | m3·s−1 | % | Agricultural/LiveStock | Industry | Public Urban |
| Chalco-Amecameca | 1.50 | 5.2 | 94 | 120 | 2 | 3.6 | 8 | 0.14 | 0.01 | 0.85 |
| Cuautitlan-Pachuca | 5.50 | 19.1 | 96 | 818 | 15 | 10.3 | 22 | 0.40 | 0.10 | 0.50 |
| Cuautla-Yautepec | 0.70 | 2.4 | 74 | 984 | 18 | 2.5 | 5 | 0.42 | 0.10 | 0.48 |
| Cuernavaca | 0.90 | 3.1 | 91 | 324 | 6 | 6.0 | 13 | 0.02 | 0.07 | 0.91 |
| Ixtlahuaca-Atlacomulco | 0.70 | 2.4 | 74 | 511 | 10 | 2.2 | 5 | 0.57 | 0.05 | 0.38 |
| Tenancingo | 1.40 | 4.9 | 75 | 90 | 2 | 0.4 | 1 | 0.43 | 0.07 | 0.50 |
| Tepeji del Rio | 0.60 | 2.1 | 85 | 63 | 1 | 0.2 | 0 | 0.23 | 0.44 | 0.33 |
| Valle de Toluca | 2.40 | 8.3 | 79 | 928 | 17 | 4.1 | 9 | 0.35 | 0.25 | 0.40 |
| Valle del Mezquital | 0.60 | 2.1 | 63 | 364 | 7 | 4.4 | 9 | 0.06 | 0.67 | 0.27 |
| ZMCM | 14.50 | 50.4 | 99 | 1157 | 22 | 13.0 | 28 | 0.01 | 0.18 | 0.81 |
| Total | 28.80 | 100 | 92 | 5359 | 100 | 46.7 | 100 | 0.20 | 0.18 | 0.62 |
Table 2.
Recharge flows estimation in the region.
| Study | Recharge Flow m3 s−1 | Comments |
|---|---|---|
| Carrera-Hernández and Gaskin [27] | 10.9–23.8 | Recharge for the Valley of Mexico Basin. Originated in the region of Water Forest |
| Angeles-Serrano [26] | 15–25 | Sierra Chichinautzin and Sierra de las Cruces |
| CENTRE [76] | 20 | |
| 1 Herrera-Parrilla et al. [77] | 15.6 | Recharge in the Aquifer of the Metropolitan Area of Mexico City |
| Capella (2006) | 17 | Sierras Chichinautzin and Sierra de las Cruces |
Note: 1 Cited in Carrera-Hernández and Gaskin [27].
Table 3.
Relative distribution of area of the Water Forest in the period 2008-2012 and % change relative to 1985–1996.
Table 3.
Relative distribution of area of the Water Forest in the period 2008-2012 and % change relative to 1985–1996.
| Land Cover | % Area in 2008–2012 1 | % Change Relative to 1985–1996 1 |
|---|---|---|
| Agriculture | 43 | 1.3 |
| Scrublands | 0.2 | 63 |
| Grasslands | 0.04 | 0 |
| Induced grasslands | 9.5 | −15 |
| Primary forest | 20.5 | −29.7 |
| Secondary forest | 16 | 71.9 |
| Cultivated forest | 1.5 | 1186 |
| Urban area | 8.9 | 22.3 |
| Water bodies | 0.3 | 7.3 |
| Total | 100 |
Table 4.
Design of scenarios.
| Scenario | Saved Volume (m3·s−1) | Volume to Replace (m3·s−1) |
|---|---|---|
| 1. No leak control | 0 | 46.7 |
| 2. Controlling leaks in the secondary distribution system | 3 | 43.7 |
| 3. Scenario 2 + 50% of domestic leaks | 7.5 | 39.2 |
| 4. Scenario 2 + 100% of domestic leaks | 12 | 34.7 |
Source: Authors’ elaboration.
Table 5.
Costs, volume capacity, and characteristics of six alternative options for water supply for Central Mexico.
Table 5.
Costs, volume capacity, and characteristics of six alternative options for water supply for Central Mexico.
| Project | Characteristics | Maximum Capacity () /m3·s−1 | Construction Costs (Ci) /US$ Million | Annuity (Ai) /US$ Million | O and M Costs (cit) /US$·m−3 |
|---|---|---|---|---|---|
| 1. Temascaltepec | Connects with the existing Cutzamala System. Designed capacity 7 m3·s−1 | 5.6 | 1056 | 89.5 | 0.72 |
| 2. Tecolutla | In the State of Veracruz, it uses the Necaxa dam. 15 m3·s−1 | 12 | 2140 | 181.5 | 0.86 |
| 3. Amacuzac | Utilizes the infrastructure of El Caracol, El Infiernillo, and La Villita dams. Cap. 15 m3·s−1 | 12 | 2161 | 183.3 | 0.66 |
| 4. Oriental-Libres | Extracts groundwater. 7 m3·s−1 | 5 | 1005 | 85.23 | 0.22 |
| 5. Taxhimay | Dam, usually for irrigation, conversion to public/domestic. 5 m3·s−1 | 4 | 639 | 54.2 | 0.11 |
| 6. Aquifer recharge | Treatment of wastewater and injection in Chichinautzin Sierra. 10 m3·s−1 | 8 | 710 | 60.2 | 0.34 |
Table 6.
Financial assumptions for centralized measures of leak control in Mexico City.
| Measures | Volume (m3·s−1) | Duration (Years) | Number of Projects | Investment (Million $) | Period of Amortization (Years) | Annuity | Unitary Cost (US$/m3) |
|---|---|---|---|---|---|---|---|
| Sectorization and rehabilitation | 2.5 | +26 | 1 | 163.3 | 26 | 11.3 | 0.08 |
| Detection and suppression | 0.5 | 13 | 2 | 25.9 | 26 | 1.9 | 0.06 |
| Total | 3 | 189.3 | 13.7 | 0.07 |
Source: Based on data by SACM (2007).
Table 7.
Financial assumptions for decentralized measures of leak control in Mexico City.
| Measure | Volume (m3·s−1) | Duration (Years) | Number of Projects | Cost Per Household (US$) | Households in Mexico City | Total Cost (US$) | Unitary Cost (US$·m−3) |
|---|---|---|---|---|---|---|---|
| Control of 50% of domestic leaks | 4.5 | 26 | 26 | 34.2 | 2.4 million | 2132 | 0.58 |
| Control of 100% of domestic leaks | 9 | 0.29 |
Source: The authors.
Table 8.
Total and unitary costs for replacing groundwater extraction from the aquifer system of Central Mexico in four scenarios for leak controls.
Table 8.
Total and unitary costs for replacing groundwater extraction from the aquifer system of Central Mexico in four scenarios for leak controls.
| Supply Alternative | Max Cap. m3 s−1 | Scenario 1 | Scenario 2 | Scenario 3 | Scenario 4 | ||||
|---|---|---|---|---|---|---|---|---|---|
| No Leak Control | Leak Reduction in Primary and Secondary Networks | Scenario 2 + 50% Reduction of Domestic Leaks | Scenario 2 + 100% Reduction of Domestic Leaks | ||||||
| Supply (m3 s−1) | Unitary Cost (US$·m−3) | Supply (m3 s−1) | Unitary Cost (US$·m−3) | Supply (m3 s−1) | Unitary Cost (US$·m−3) | Supply (m3 s−1) | Unitary Cost (US$·m−3) | ||
| Aquifer injection | 8 | 8 | 0.38 | 8 | 0.38 | 8 | 0.38 | 8 | 0.38 |
| Taxhimay | 4 | 4 | 0.30 | 4 | 0.30 | 4 | 0.30 | 4 | 0.30 |
| Oriental-Libres | 5.6 | 5.6 | 0.42 | 5.6 | 0.42 | 5.6 | 0.42 | 5.6 | 0.42 |
| Amacuzac | 12 | 12 | 0.75 | 12 | 0.75 | 12 | 0.75 | 12 | 0.75 |
| Tecolutla | 12 | 11.5 | 0.91 | 8.5 | 1.0 | 4.04 | 1.40 | 0 | 0 |
| Temascaltepec | 5.6 | 5.6 | 0.81 | 5.6 | 0.81 | 5.6 | 0.81 | 5.1 | 0.83 |
| Project | 47.2 | 46.7 | 0.65 | 43.7 | 0.65 | 39.2 | 0.66 | 34.7 | 0.66 |
| Total cost | US $ billion | 25.2 | 23.6 | 21.2 | 18.9 | ||||
Source: Model computations.
Table 9.
The economics of leak control: comparison of investing in leak control vs. savings in replacement costs for the aquifers in Central Mexico.
Table 9.
The economics of leak control: comparison of investing in leak control vs. savings in replacement costs for the aquifers in Central Mexico.
| Scenario | Description | Replaced Volume (m3 s−1) | Savings (m3 s−1) | Replacement Cost (US$ Billion) | Savings (US$ Billion) | Cost of Leak Control (US$ Billion) | Ratio |
|---|---|---|---|---|---|---|---|
| 1 | No leak control | 46.7 | 0 | 25.2 | 0 | _ | _ |
| 2 | Centralized measures on primary and secondary networks | 43.7 | 3 | 23.6 | 1.6 | 0.19 | 8.4 |
| 3 | Scenario 2 + 50% reduction of domestic leak | 39.2 | 7.5 | 21.2 | 4 | 2.1 | 1.9 |
| 4 | Scenario 2 + 100% reduction of domestic leaks | 34.7 | 12 | 18.9 | 6.3 | 2.1 | 3.1 1 |
© 2017 by the authors. Licensee MDPI, Basel, Switzerland. This article is an open access article distributed under the terms and conditions of the Creative Commons Attribution (CC BY) license (http://creativecommons.org/licenses/by/4.0/).
Share and Cite
MDPI and ACS Style
López-Morales, C.A.; Mesa-Jurado, M.A. Valuation of Hidden Water Ecosystem Services: The Replacement Cost of the Aquifer System in Central Mexico. Water 2017, 9, 571. https://doi.org/10.3390/w9080571
AMA Style
López-Morales CA, Mesa-Jurado MA. Valuation of Hidden Water Ecosystem Services: The Replacement Cost of the Aquifer System in Central Mexico. Water. 2017; 9(8):571. https://doi.org/10.3390/w9080571
Chicago/Turabian StyleLópez-Morales, Carlos A., and Maria Azahara Mesa-Jurado. 2017. "Valuation of Hidden Water Ecosystem Services: The Replacement Cost of the Aquifer System in Central Mexico" Water 9, no. 8: 571. https://doi.org/10.3390/w9080571
Note that from the first issue of 2016, this journal uses article numbers instead of page numbers. See further details here.